 Deutsch
 English
 Español
 Français
 Italiano
 Nederlands
 Polski
 Português
 Русский
 Türkçe
 Svenska
 Chinese
 Magyar
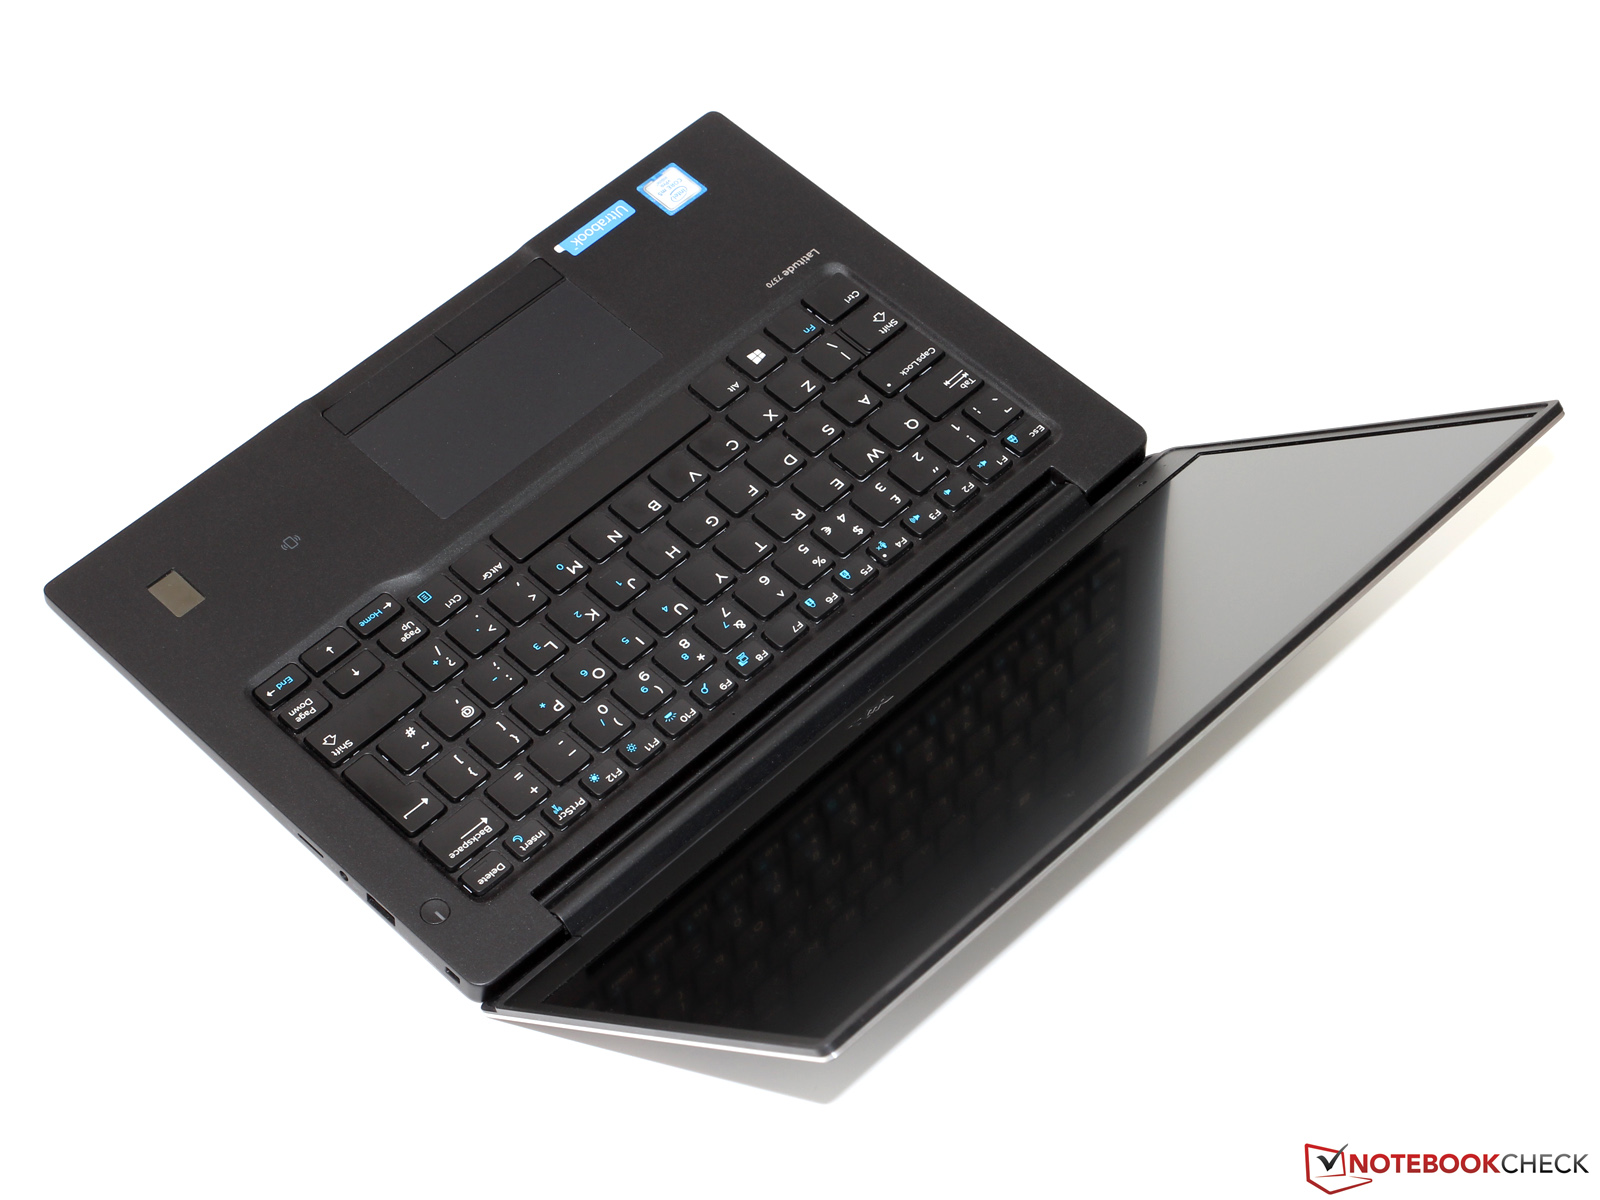
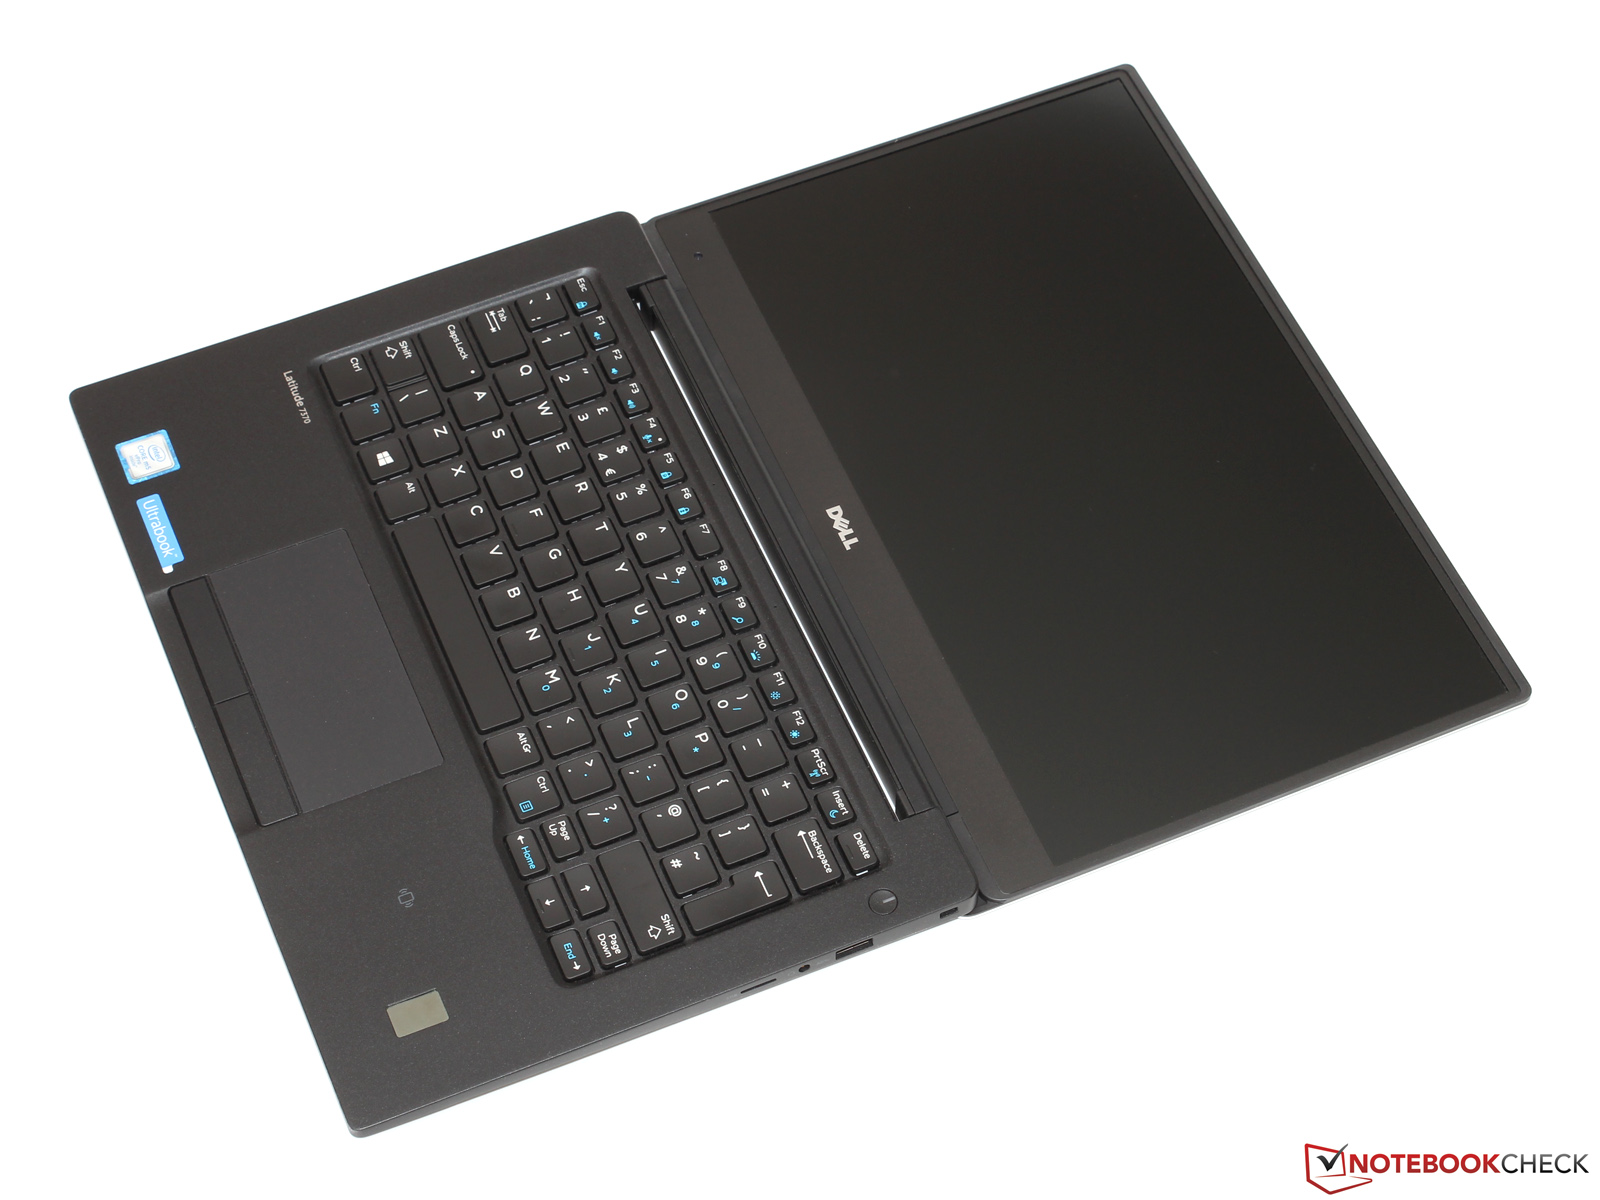
Courte critique de l'Ultrabook Dell Latitude 13 7370
Scintillement / MLI (Modulation de largeur d'impulsion)
| Scintillement / MLI (Modulation de largeur d'impulsion) non décelé | ||
En comparaison, 53 % des appareils testés n'emploient pas MDI pour assombrir leur écran. Nous avons relevé une moyenne à 17900 (minimum : 5 - maximum : 3846000) Hz dans le cas où une MDI était active. | ||
| |||||||||||||||||||||||||
Homogénéité de la luminosité: 85 %
Valeur mesurée au centre, sur batterie: 261 cd/m²
Contraste: 1004:1 (Valeurs des noirs: 0.26 cd/m²)
ΔE Color 4.3 | 0.5-29.43 Ø5
ΔE Greyscale 5.82 | 0.57-98 Ø5.3
77.84% sRGB (Argyll 1.6.3 3D)
49.18% AdobeRGB 1998 (Argyll 1.6.3 3D)
53.9% AdobeRGB 1998 (Argyll 2.2.0 3D)
78.3% sRGB (Argyll 2.2.0 3D)
52.2% Display P3 (Argyll 2.2.0 3D)
Gamma: 2.44
| Dell Latitude 13 7370 1920x1080, IPS | Lenovo ThinkPad X1 Carbon 20FB003RGE 2560x1440, IPS | HP EliteBook Folio 1040 G3 2560x1440, IPS | Toshiba Portege Z30-C-138 1920x1080, IPS | Apple MacBook 12 (Early 2016) 1.1 GHz 2304x1440, IPS | |
|---|---|---|---|---|---|
| Display | 25% | 28% | 28% | 25% | |
| Display P3 Coverage | 52.2 | 66.7 28% | 67.9 30% | 67.9 30% | 66.8 28% |
| sRGB Coverage | 78.3 | 94.7 21% | 96.8 24% | 98 25% | 95.4 22% |
| AdobeRGB 1998 Coverage | 53.9 | 68.4 27% | 70 30% | 69.8 29% | 68 26% |
| Response Times | 21% | 15% | 17% | 14% | |
| Response Time Grey 50% / Grey 80% * | 50.4 ? | 44 ? 13% | 46.4 ? 8% | 42 ? 17% | 41.2 ? 18% |
| Response Time Black / White * | 33.6 ? | 24 ? 29% | 26.4 ? 21% | 28 ? 17% | 30.4 ? 10% |
| PWM Frequency | 220 ? | 217 ? | |||
| Screen | 15% | 10% | 3% | 23% | |
| Brightness middle | 261 | 272 4% | 327 25% | 300 15% | 387 48% |
| Brightness | 241 | 268 11% | 316 31% | 280 16% | 358 49% |
| Brightness Distribution | 85 | 95 12% | 87 2% | 87 2% | 88 4% |
| Black Level * | 0.26 | 0.32 -23% | 0.35 -35% | 0.31 -19% | 0.47 -81% |
| Contrast | 1004 | 850 -15% | 934 -7% | 968 -4% | 823 -18% |
| Colorchecker dE 2000 * | 4.3 | 2.61 39% | 4.39 -2% | 4.9 -14% | 1.6 63% |
| Colorchecker dE 2000 max. * | 8.66 | 6.43 26% | 7.27 16% | 8.91 -3% | 4 54% |
| Greyscale dE 2000 * | 5.82 | 3.31 43% | 4.69 19% | 6.69 -15% | 1 83% |
| Gamma | 2.44 90% | 2.35 94% | 2.15 102% | 2.33 94% | 2.26 97% |
| CCT | 6771 96% | 6360 102% | 7101 92% | 6487 100% | 6680 97% |
| Color Space (Percent of AdobeRGB 1998) | 49.18 | 63 28% | 62.52 27% | 63 28% | 61.6 25% |
| Color Space (Percent of sRGB) | 77.84 | 95 22% | 96.71 24% | 98 26% | 82.2 6% |
| Moyenne finale (programmes/paramètres) | 20% /
18% | 18% /
14% | 16% /
10% | 21% /
22% |
* ... Moindre est la valeur, meilleures sont les performances
Temps de réponse de l'écran
| ↔ Temps de réponse noir à blanc | ||
|---|---|---|
| 33.6 ms ... hausse ↗ et chute ↘ combinées | ↗ 13.2 ms hausse | |
| ↘ 20.4 ms chute | ||
| L'écran souffre de latences très élevées, à éviter pour le jeu. En comparaison, tous les appareils testés affichent entre 0.1 (minimum) et 240 (maximum) ms. » 89 % des appareils testés affichent de meilleures performances. Cela signifie que les latences relevées sont moins bonnes que la moyenne (21.5 ms) de tous les appareils testés. | ||
| ↔ Temps de réponse gris 50% à gris 80% | ||
| 50.4 ms ... hausse ↗ et chute ↘ combinées | ↗ 20.4 ms hausse | |
| ↘ 30 ms chute | ||
| L'écran souffre de latences très élevées, à éviter pour le jeu. En comparaison, tous les appareils testés affichent entre 0.2 (minimum) et 636 (maximum) ms. » 85 % des appareils testés affichent de meilleures performances. Cela signifie que les latences relevées sont moins bonnes que la moyenne (33.7 ms) de tous les appareils testés. | ||
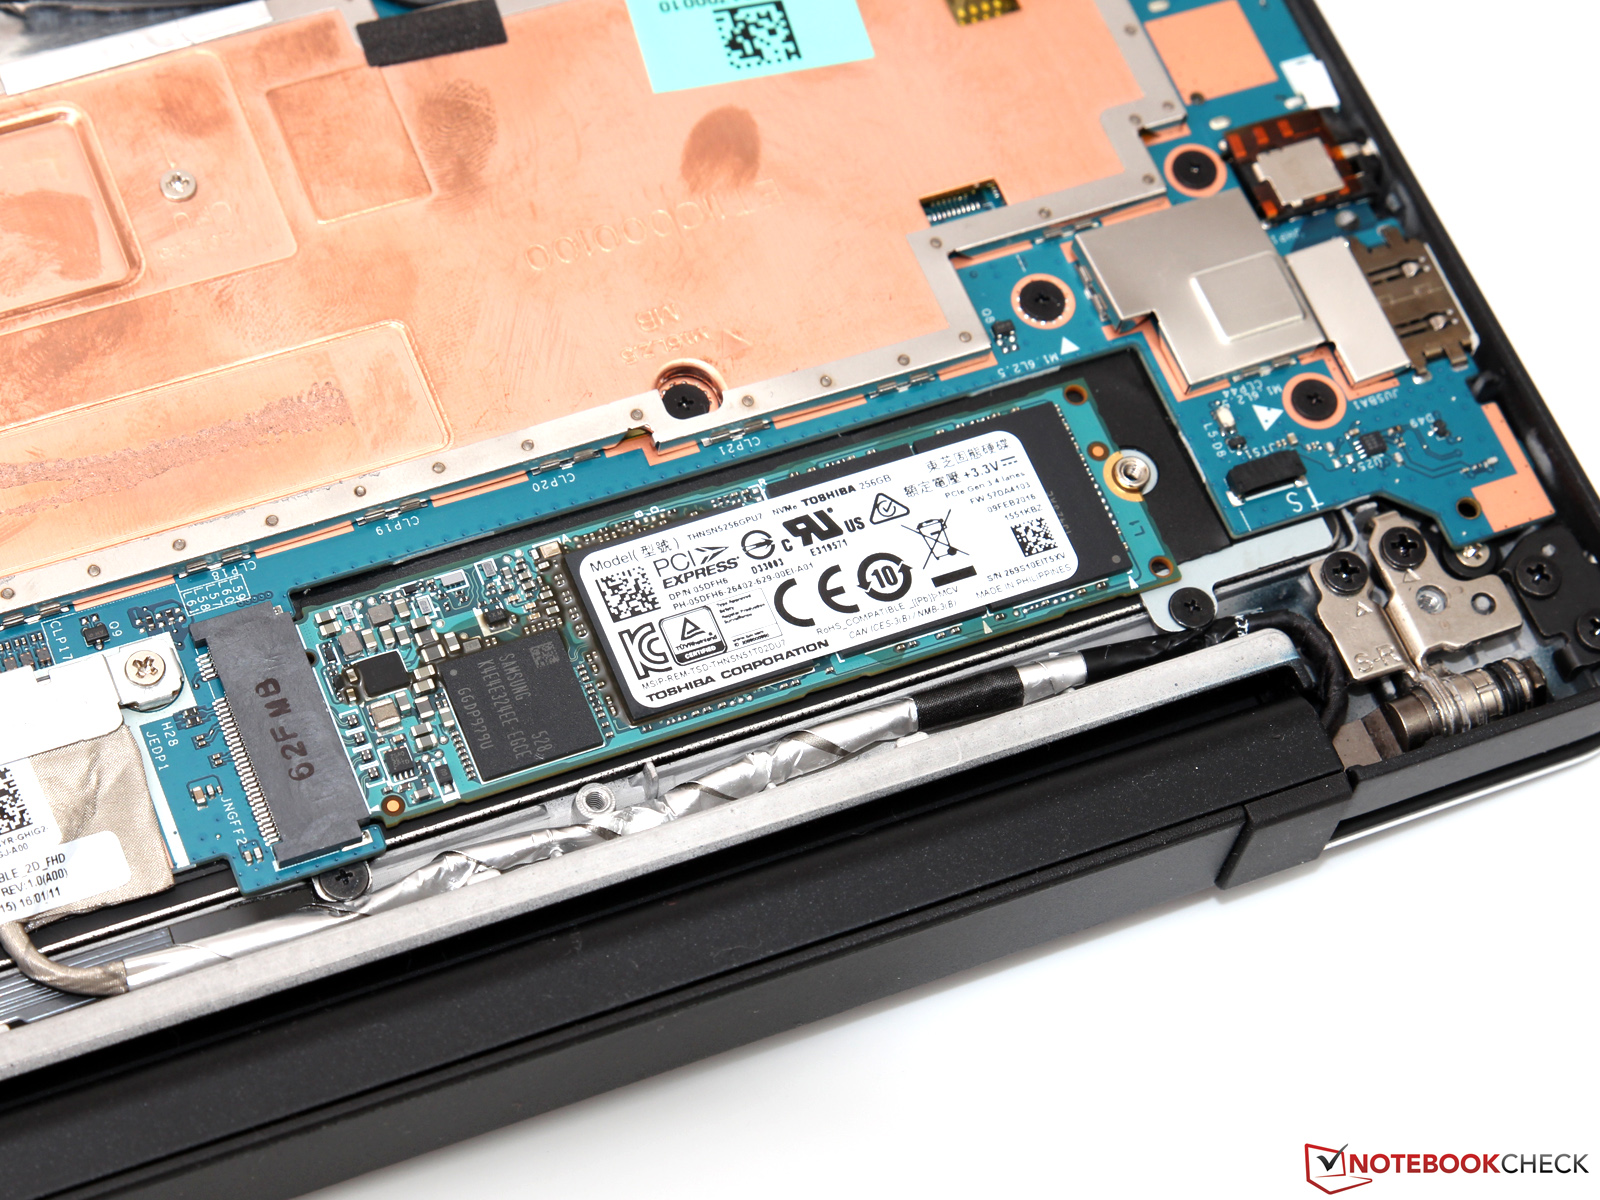
| Dell Latitude 13 7370 Toshiba NVMe THNSN5256GPU7 | Lenovo ThinkPad X1 Carbon 20FB003RGE Samsung SSD PM871 MZNLN256HCHP | HP EliteBook Folio 1040 G3 Samsung SM951 MZVPV256HDGL m.2 PCI-e | Toshiba Portege Z30-C-138 Toshiba HG6 THNSNJ512G8NY | Apple MacBook 12 (Early 2016) 1.1 GHz Apple SSD AP0256 | |
|---|---|---|---|---|---|
| AS SSD | -40% | 75% | -52% | -30% | |
| Seq Read | 1425 | 499.1 -65% | 1839 29% | 494.9 -65% | 1056 -26% |
| Seq Write | 889 | 294 -67% | 1190 34% | 431.9 -51% | 651 -27% |
| 4K Read | 35.72 | 30.43 -15% | 47.72 34% | 16.97 -52% | 16.4 -54% |
| 4K Write | 97.9 | 74.6 -24% | 126.6 29% | 65.6 -33% | 22.1 -77% |
| 4K-64 Read | 450.6 | 370.4 -18% | 1858 312% | 217.9 -52% | 509 13% |
| 4K-64 Write | 347.2 | 253.4 -27% | 344.3 -1% | 147.9 -57% | 283 -18% |
| Copy ISO MB/s | 704 | 236.2 -66% | 1313 87% | 545 -23% |

| PCMark 7 - Score | |
| Lenovo ThinkPad X1 Carbon 20FB003RGE | |
| Microsoft Surface Pro 4, Core m3 | |
| Dell Latitude 13 7370 | |
| PCMark 7 Score | 4165 points | |
| PCMark 8 Home Score Accelerated v2 | 3048 points | |
| PCMark 8 Creative Score Accelerated v2 | 3528 points | |
| PCMark 8 Work Score Accelerated v2 | 4238 points | |
Aide | ||
| 3DMark 06 Standard Score | 6244 points | |
| 3DMark 11 Performance | 1094 points | |
| 3DMark Ice Storm Standard Score | 38931 points | |
| 3DMark Cloud Gate Standard Score | 3481 points | |
| 3DMark Fire Strike Score | 509 points | |
Aide | ||
| Bas | Moyen | Élevé | Ultra | |
| BioShock Infinite (2013) | 38 | 20.3 | 17.6 | 5.3 |
| Metro: Last Light (2013) | 16.4 | 13.5 | 8.7 | |
| Battlefield 4 (2013) | 24.6 | 18.2 | 12.8 |
(±) La température maximale du côté supérieur est de 43.2 °C / 110 F, par rapport à la moyenne de 35.9 °C / 97 F, allant de 21.4 à 59 °C pour la classe Subnotebook.
(-) Le fond chauffe jusqu'à un maximum de 50.8 °C / 123 F, contre une moyenne de 39.4 °C / 103 F
(+) En utilisation inactive, la température moyenne du côté supérieur est de 28.3 °C / 83 F, par rapport à la moyenne du dispositif de 30.7 °C / 87 F.
(+) Les repose-poignets et le pavé tactile sont plus froids que la température de la peau avec un maximum de 29.8 °C / 85.6 F et sont donc froids au toucher.
(±) La température moyenne de la zone de l'appui-paume de dispositifs similaires était de 28.3 °C / 82.9 F (-1.5 °C / #-2.7 F).
| Éteint/en veille | |
| Au repos | |
| Fortement sollicité |
|
| Dell Latitude 13 7370 34 Wh | Lenovo ThinkPad X1 Carbon 20FB003RGE 52 Wh | HP EliteBook Folio 1040 G3 45.6 Wh | Toshiba Portege Z30-C-138 52 Wh | Apple MacBook 12 (Early 2016) 1.1 GHz 41.4 Wh | |
|---|---|---|---|---|---|
| Autonomie de la batterie | 18% | -16% | -6% | 33% | |
| Reader / Idle | 588 | 942 60% | 530 -10% | ||
| H.264 | 391 | 510 30% | 339 -13% | 512 31% | |
| WiFi v1.3 | 367 | 429 17% | 309 -16% | 345 -6% | 501 37% |
| Load | 176 | 115 -35% | 131 -26% | 231 31% |
Points positifs
Points négatifs
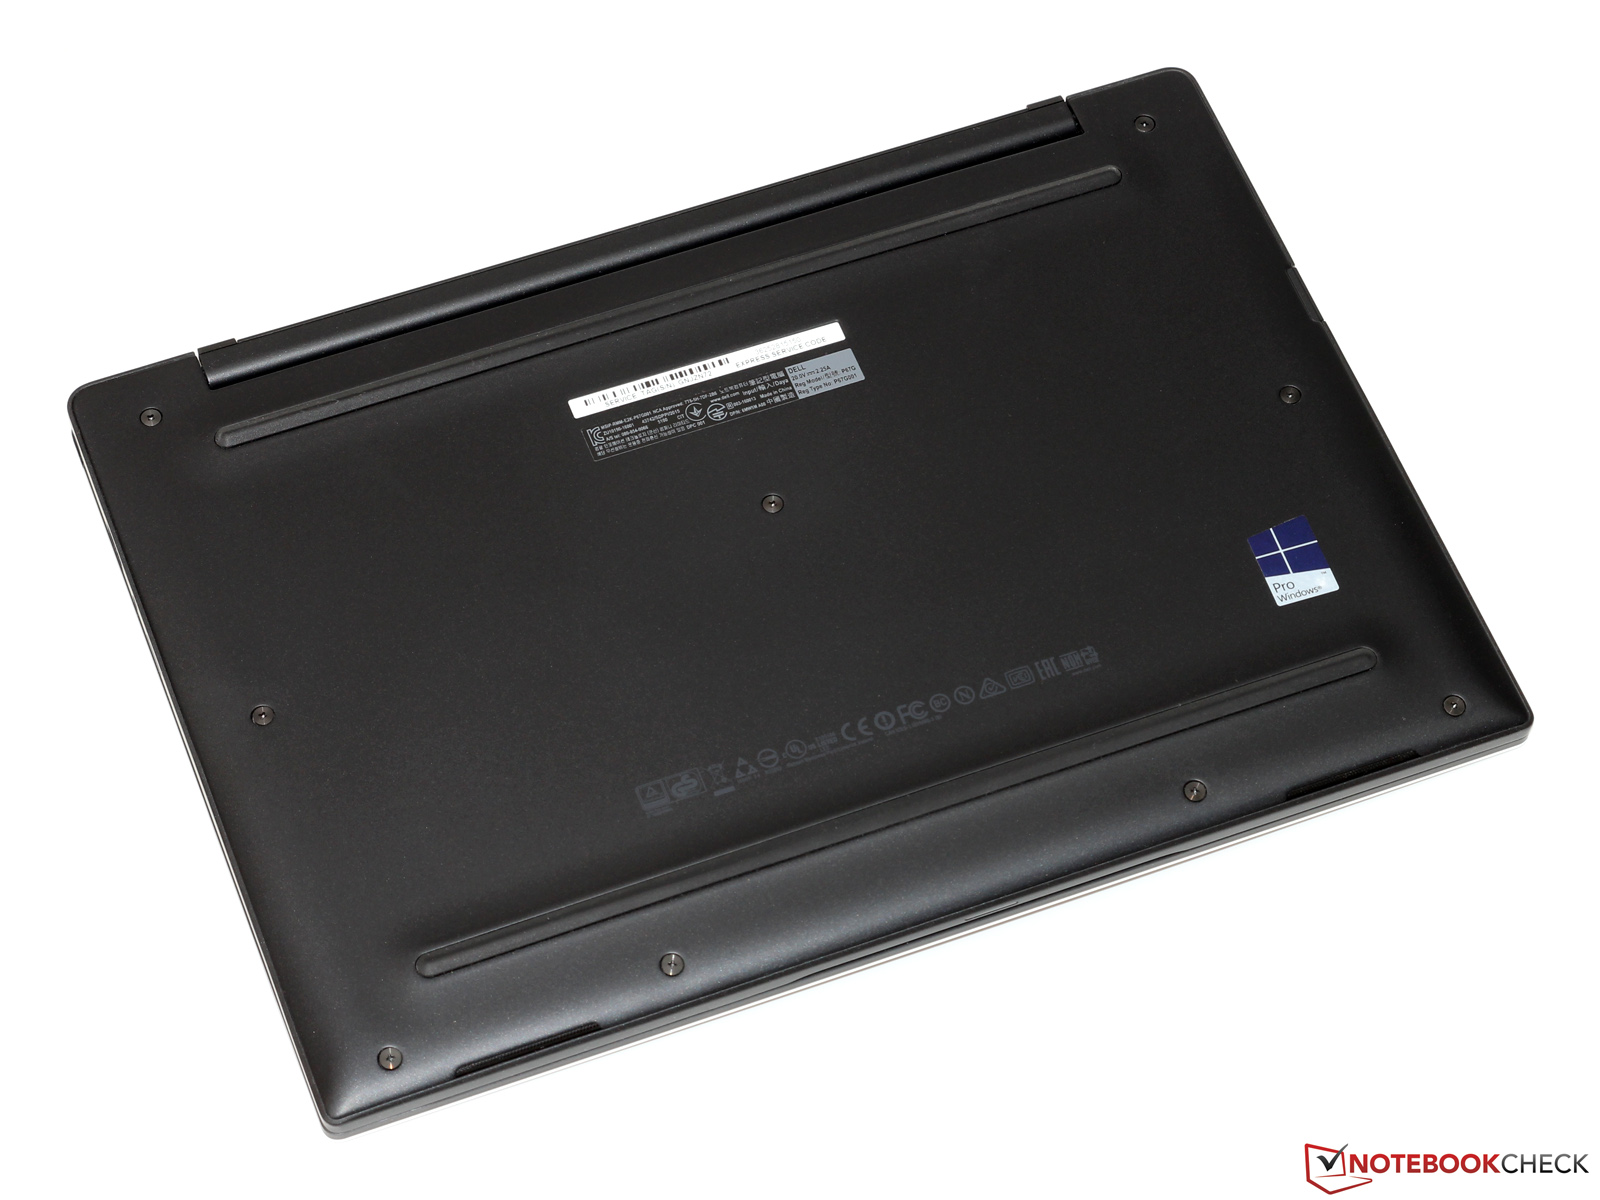
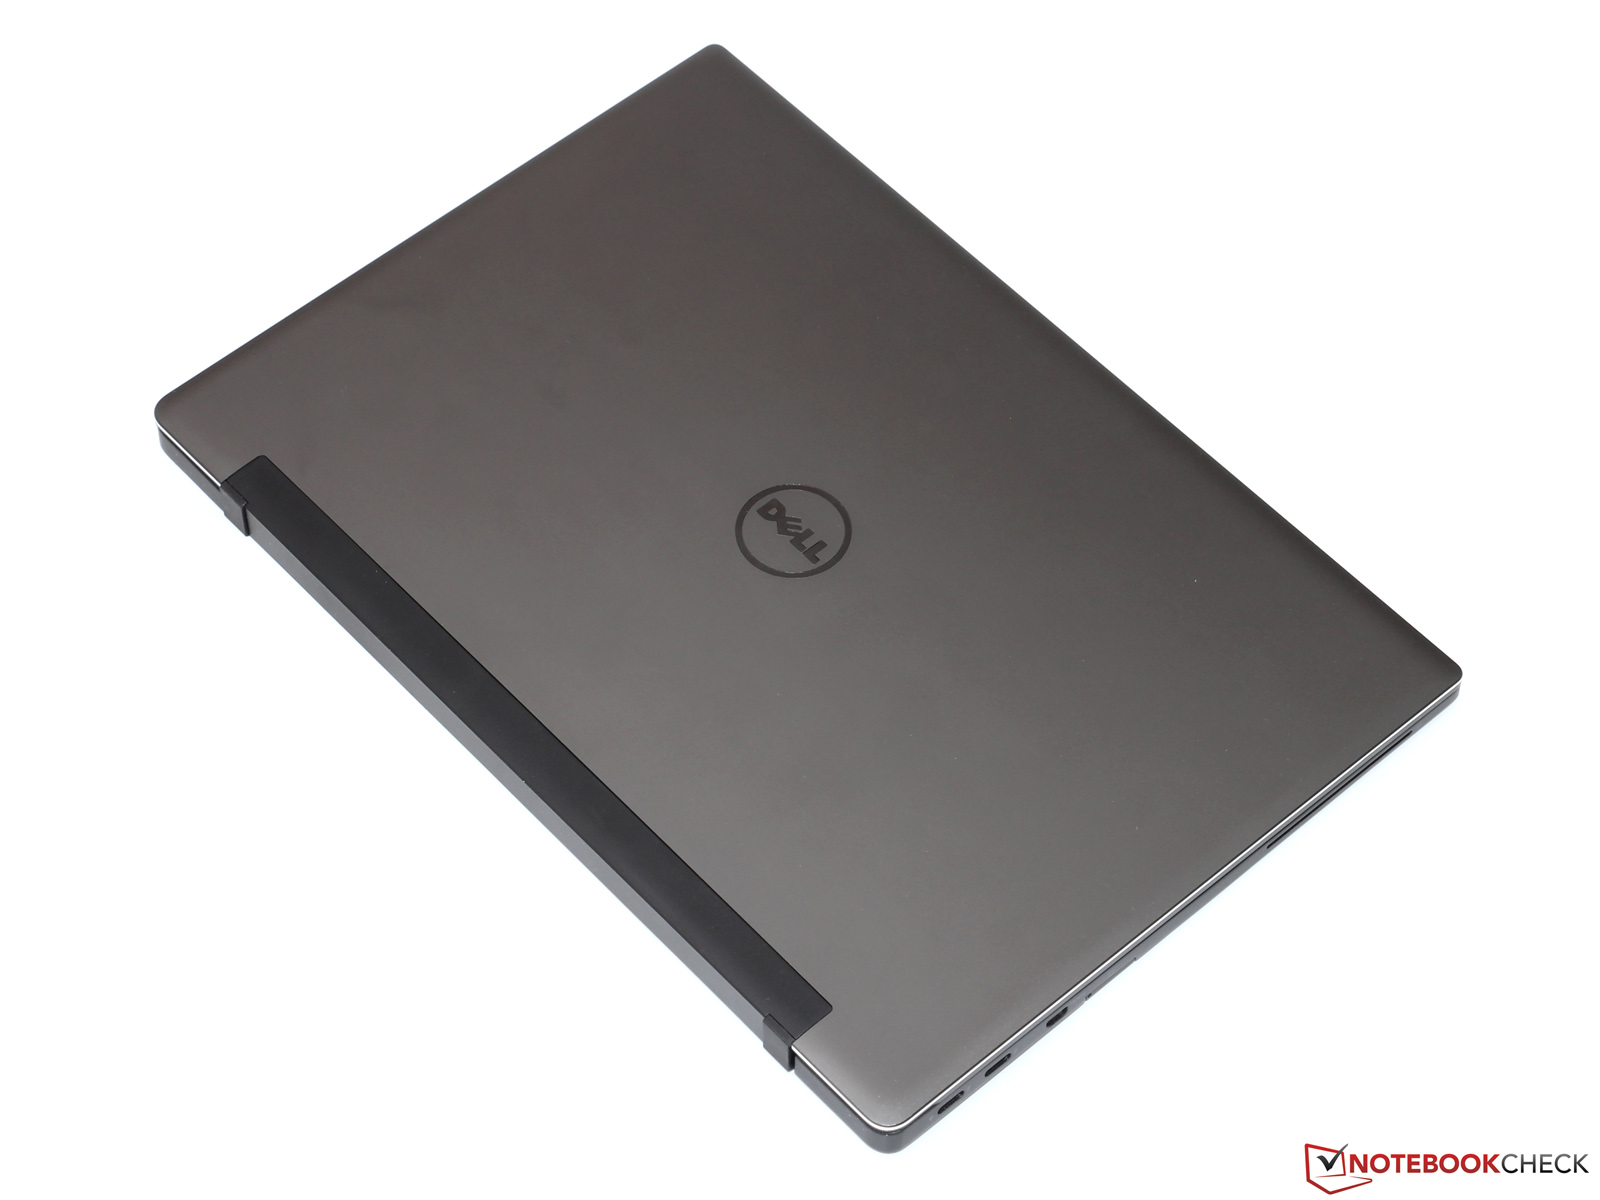
Un écran quasiment dépourvu de bordure, un refroidissement passif et du Thunderbolt 3 : le Dell Latitude 13 7370 est sort des sentiers battus habituellement empruntés par les ordinateurs portables professionnels traditionnels. L'Ultrabook n'a pas à craindre de la concurrence pour ce qui est de la mobilité et la finition est irréprochable. La stabilité est excellente et les périphériques d'entrée donnent un retour ferme. La plate-forme Core m donne de bonnes performances, avec la technologie Turbo Boost sur de courtes durées (après mise à jour du BIOS) aussi bien maitrisée que sur ses rivaux à refroidissement actif. En charge soutenue sur la durée, les performances en prennent un coup mais cela ne devrait pas être un problème fréquent en tâches bureautiques.
Le 7370 titille la très bonne note mais l'écran ne nous permet pas de la lui accorder. Dell a intégré un écran très correct avec une forte luminosité mais les ajustements automatiques de luminosité et de contrastes sont une vraie plaie. Nous espérons qu'une autre mise à jour du BIOS résoudra ce problème. Si tel est le cas, seul le prix extrêmement élevé nous empêcherait de vous recommander cet achat : à un prix de 2200 euros actuellement, le Latitude 13 n'est pas vraiment ce que l'on pourra qualifier d'abordable. Même un Apple MacBook 12 (certes grand public) est moins onéreux.
Pour plus de détails, vous trouverez la version complète (en anglais) de ce test ici.
Dell Latitude 13 7370
-
05/12/2016 v5.1(old)
Till Schönborn
Pricecompare
