 Deutsch
 English
 Español
 Français
 Italiano
 Nederlands
 Polski
 Português
 Русский
 Türkçe
 Svenska
 Chinese
 Magyar
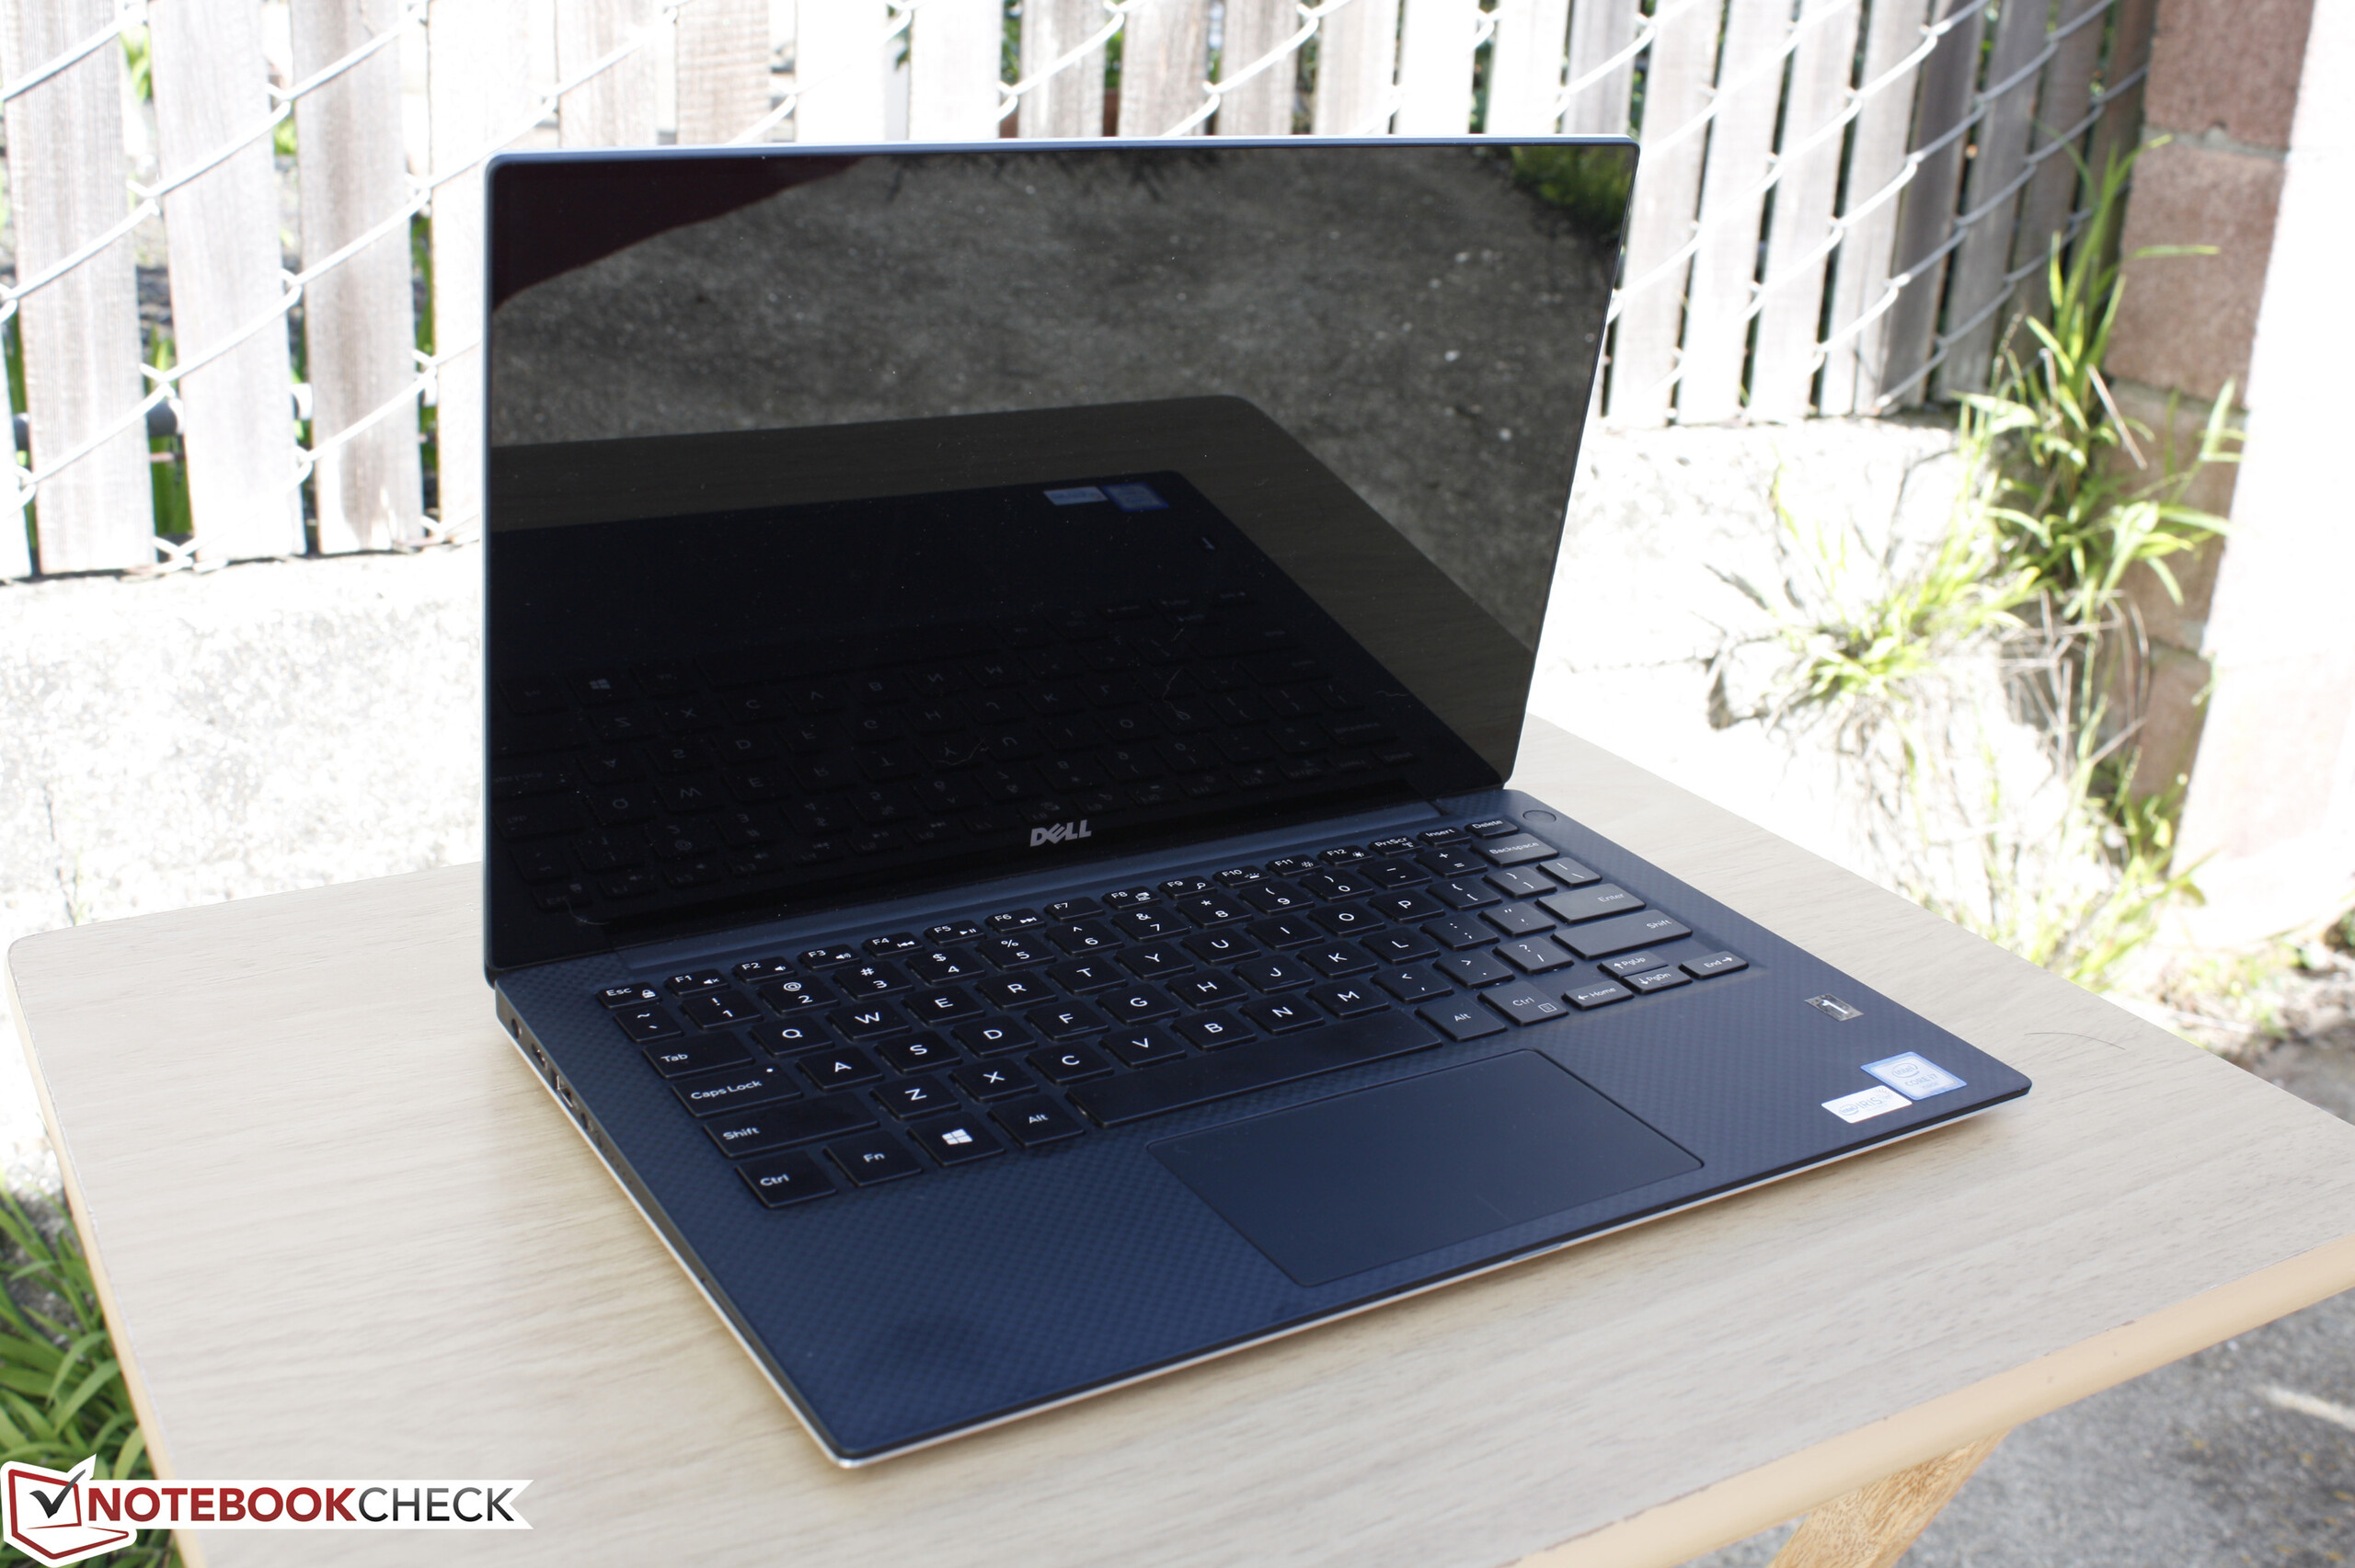
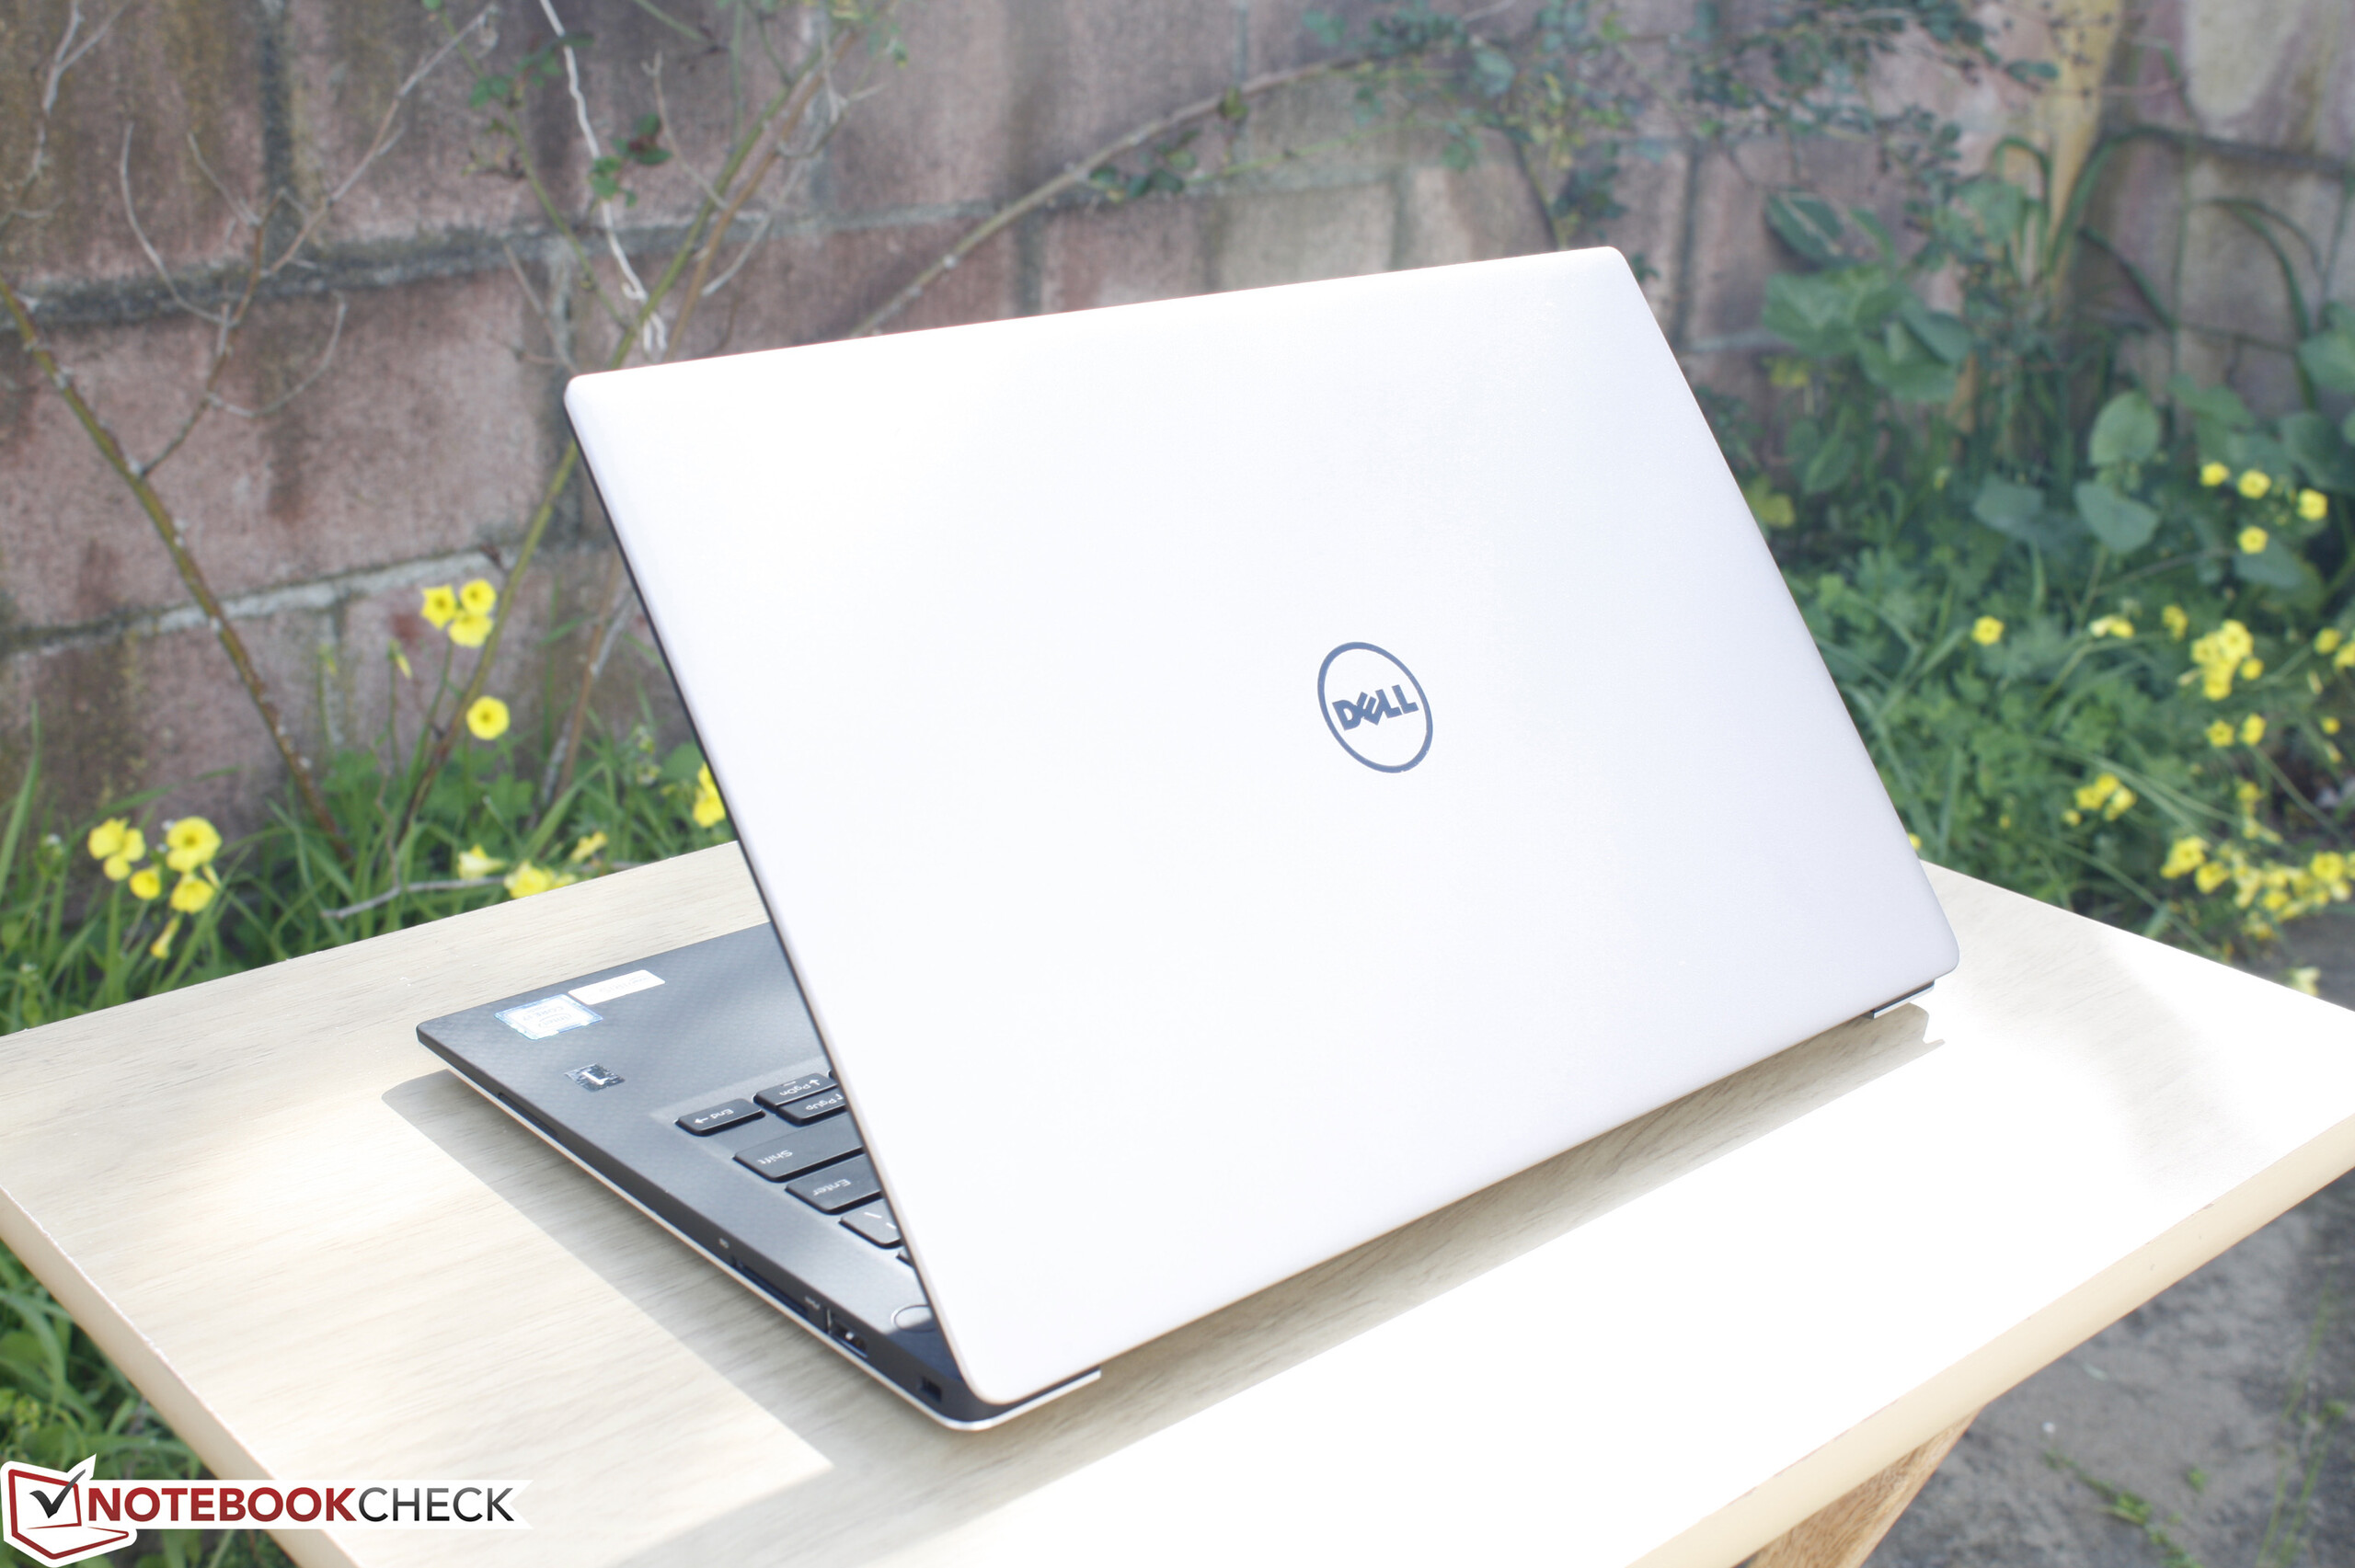
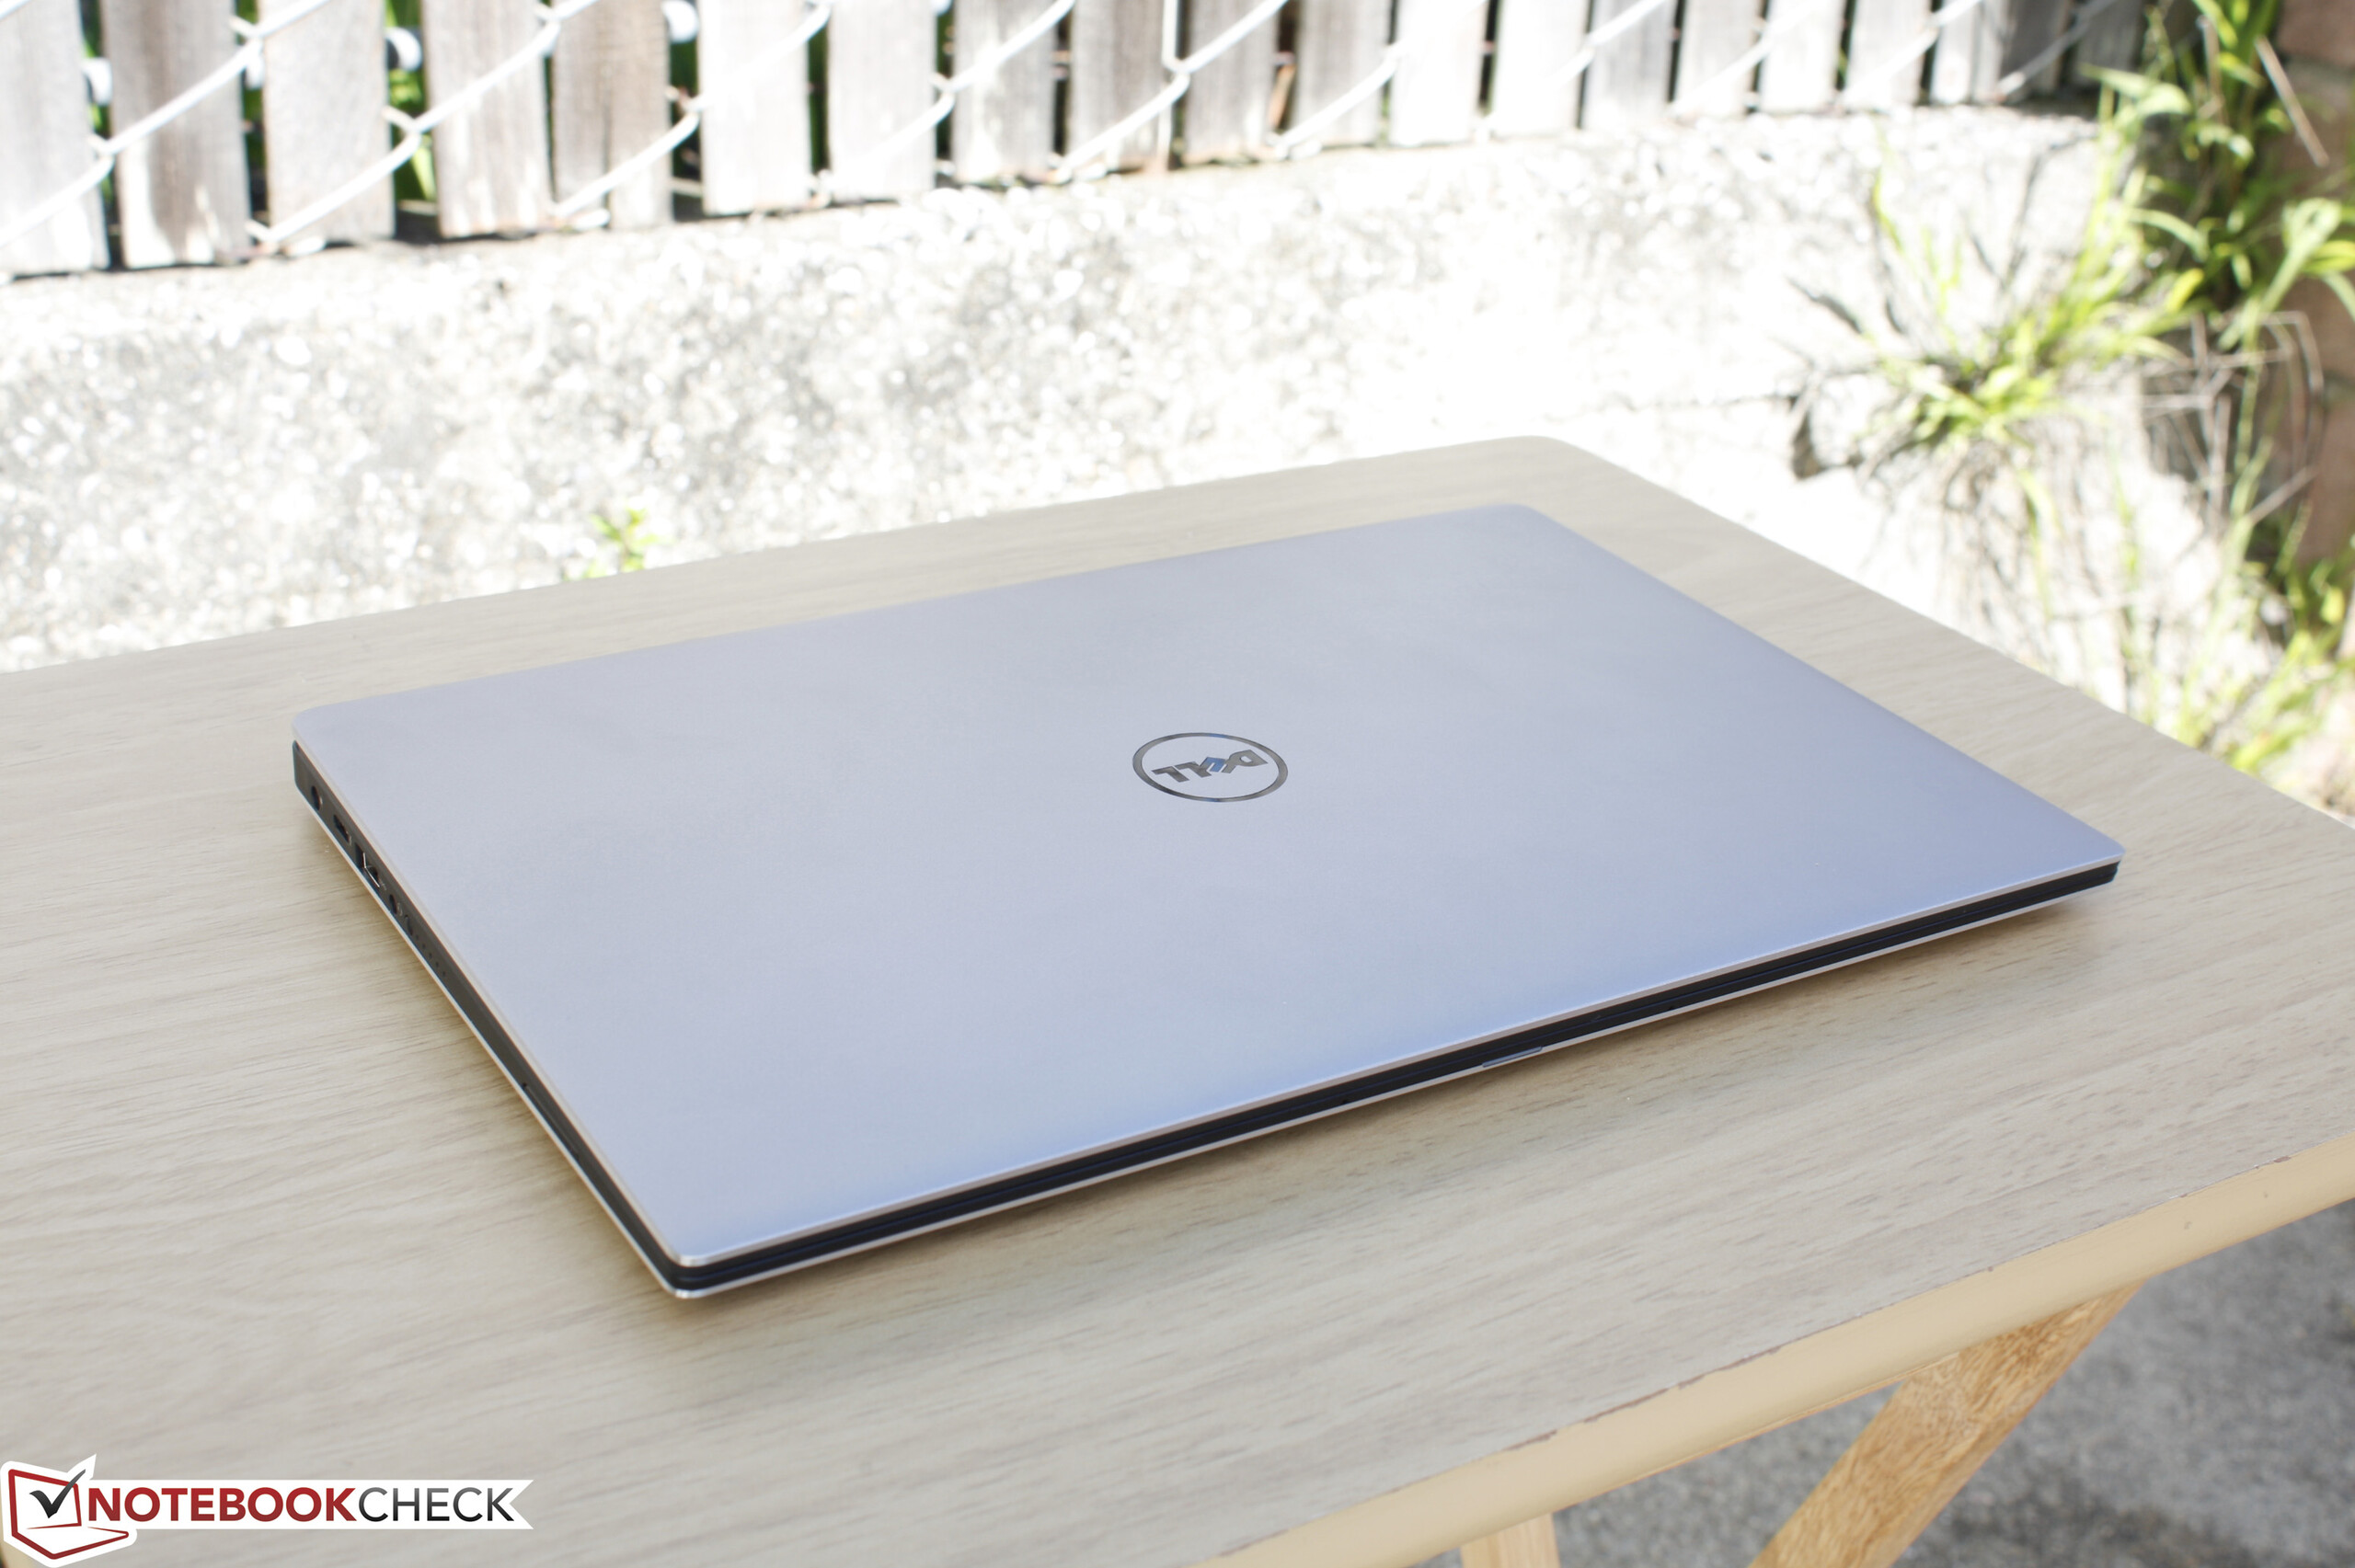
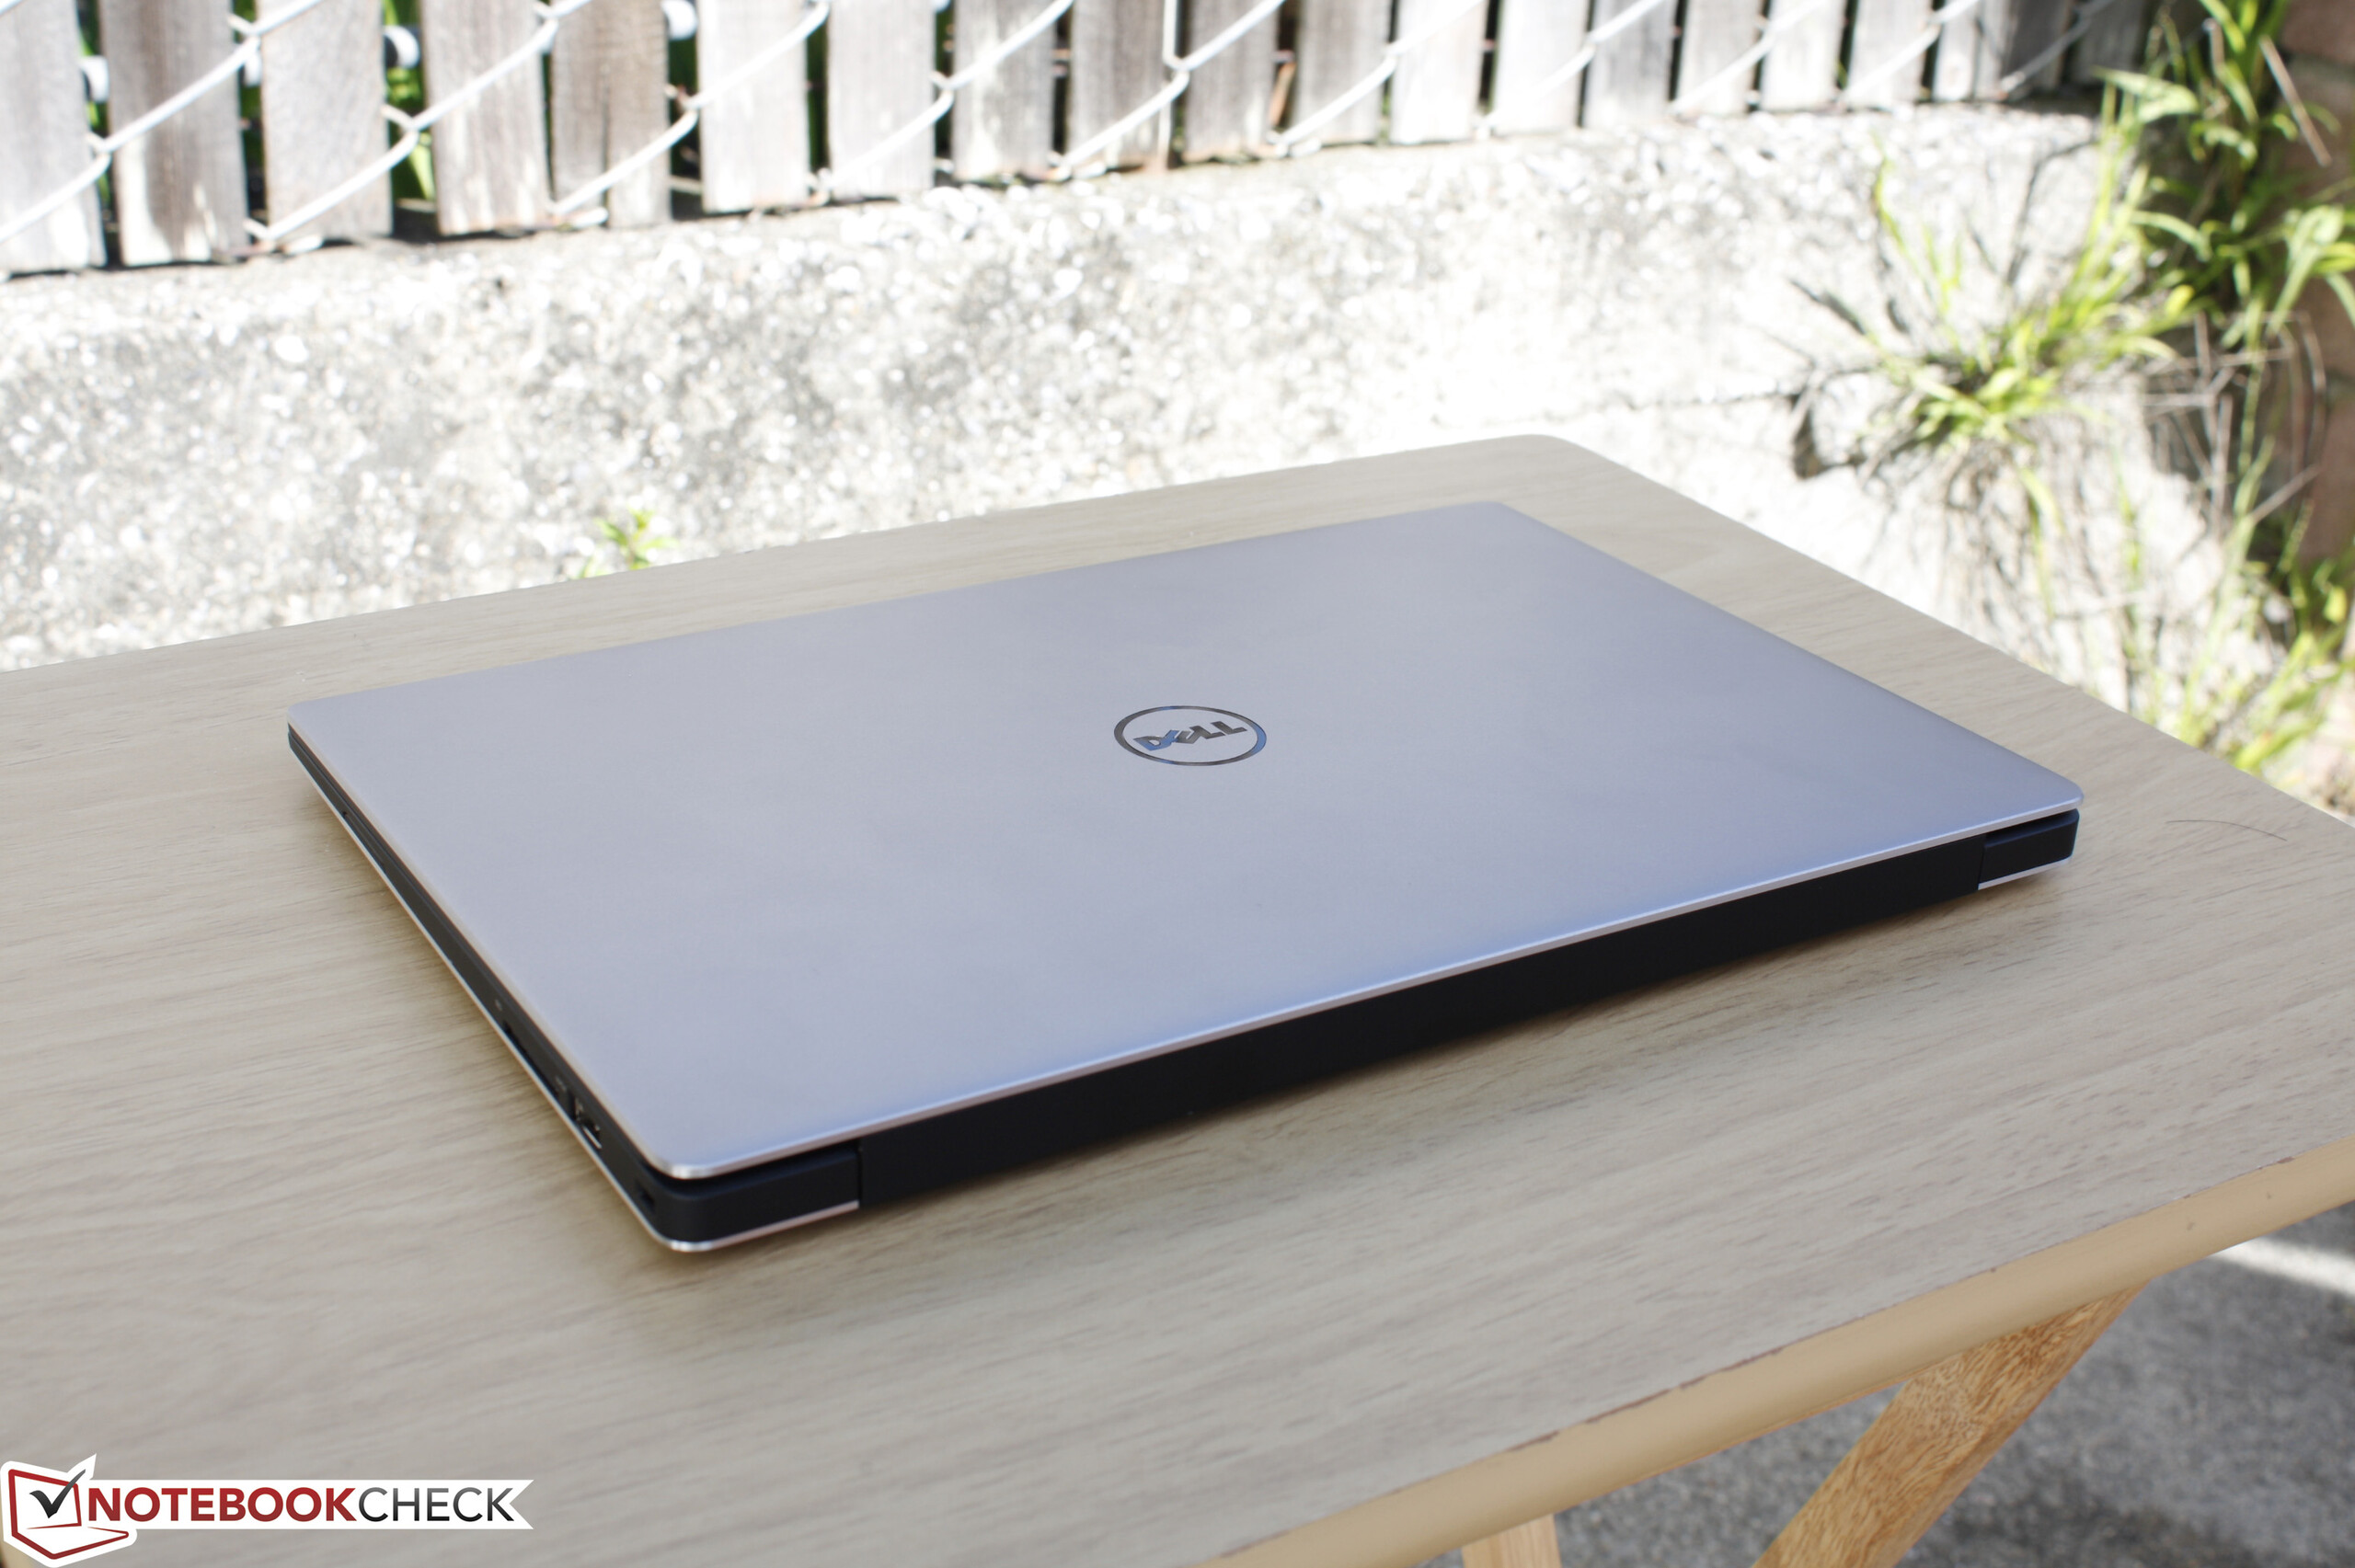
Courte critique de l'Ultrabook Dell XPS 13 9350 (i7-6560U, QHD+)
| |||||||||||||||||||||||||
Homogénéité de la luminosité: 92 %
Valeur mesurée au centre, sur batterie: 307.5 cd/m²
Contraste: 1486:1 (Valeurs des noirs: 0.207 cd/m²)
ΔE Color 4.18 | 0.5-29.43 Ø5
ΔE Greyscale 4.94 | 0.57-98 Ø5.3
92% sRGB (Argyll 1.6.3 3D)
59% AdobeRGB 1998 (Argyll 1.6.3 3D)
65.4% AdobeRGB 1998 (Argyll 2.2.0 3D)
92.3% sRGB (Argyll 2.2.0 3D)
63.6% Display P3 (Argyll 2.2.0 3D)
Gamma: 2.31
| Dell XPS 13 9350 WQXGA 13.30, 3200x1800 | HP ProBook 430 G3 P5T00ES 13.30, 1366x768 | Asus Zenbook UX303UB-DH74T 13.30, 3200x1800 | Apple MacBook Air 13 inch 2015-03 13.30, 1440x900 | Lenovo Yoga 900-13ISK 80MK 13.30, 3200x1800 | HP Spectre x360 13-4104ng 13.30, 2560x1440 | |
|---|---|---|---|---|---|---|
| Display | -43% | -5% | -36% | -2% | 3% | |
| Display P3 Coverage | 63.6 | 35.87 -44% | 60.9 -4% | 40.1 -37% | 63.2 -1% | 66.8 5% |
| sRGB Coverage | 92.3 | 54 -41% | 85.4 -7% | 59.8 -35% | 88.7 -4% | 92.8 1% |
| AdobeRGB 1998 Coverage | 65.4 | 37.06 -43% | 62.5 -4% | 41.51 -37% | 64.9 -1% | 67.3 3% |
| Response Times | -9% | -5% | 24% | 45% | ||
| Response Time Grey 50% / Grey 80% * | 50.8 ? | 54.4 ? -7% | 44.4 ? 13% | 38.8 ? 24% | 24 ? 53% | |
| Response Time Black / White * | 29.6 ? | 32.8 ? -11% | 36 ? -22% | 22.4 ? 24% | 19 ? 36% | |
| PWM Frequency | 192 ? | 1389 | 1316 | |||
| Screen | -92% | -56% | -17% | -33% | -9% | |
| Brightness middle | 307.5 | 212 -31% | 291.4 -5% | 329 7% | 319.8 4% | 324 5% |
| Brightness | 297 | 205 -31% | 270 -9% | 310 4% | 302 2% | 324 9% |
| Brightness Distribution | 92 | 90 -2% | 84 -9% | 82 -11% | 88 -4% | 90 -2% |
| Black Level * | 0.207 | 0.71 -243% | 0.954 -361% | 0.405 -96% | 0.835 -303% | 0.34 -64% |
| Contrast | 1486 | 299 -80% | 305 -79% | 812 -45% | 383 -74% | 953 -36% |
| Colorchecker dE 2000 * | 4.18 | 12.06 -189% | 4.63 -11% | 3.96 5% | 2.68 36% | 4.36 -4% |
| Colorchecker dE 2000 max. * | 7.84 | 7.51 4% | ||||
| Greyscale dE 2000 * | 4.94 | 13.41 -171% | 5.65 -14% | 3.51 29% | 2.35 52% | 4.62 6% |
| Gamma | 2.31 95% | 2.41 91% | 2.16 102% | 3.83 57% | 2.09 105% | 2.18 101% |
| CCT | 7645 85% | 15382 42% | 6320 103% | 6711 97% | 6975 93% | 6857 95% |
| Color Space (Percent of AdobeRGB 1998) | 59 | 34.3 -42% | 55.2 -6% | 38.4 -35% | 57 -3% | 60 2% |
| Color Space (Percent of sRGB) | 92 | 54.2 -41% | 85.2 -7% | 59.8 -35% | 88 -4% | 93 1% |
| Moyenne finale (programmes/paramètres) | -48% /
-70% | -22% /
-38% | -27% /
-22% | -4% /
-18% | 13% /
1% |
* ... Moindre est la valeur, meilleures sont les performances
Temps de réponse de l'écran
| ↔ Temps de réponse noir à blanc | ||
|---|---|---|
| 29.6 ms ... hausse ↗ et chute ↘ combinées | ↗ 6 ms hausse | 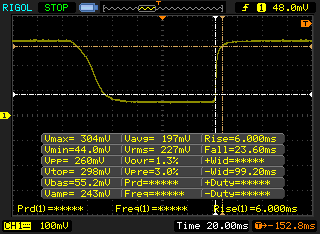 |
| ↘ 23.6 ms chute | ||
| L'écran souffre de latences relativement élevées, insuffisant pour le jeu. En comparaison, tous les appareils testés affichent entre 0.1 (minimum) et 240 (maximum) ms. » 76 % des appareils testés affichent de meilleures performances. Cela signifie que les latences relevées sont moins bonnes que la moyenne (21.5 ms) de tous les appareils testés. | ||
| ↔ Temps de réponse gris 50% à gris 80% | ||
| 50.8 ms ... hausse ↗ et chute ↘ combinées | ↗ 18.4 ms hausse | 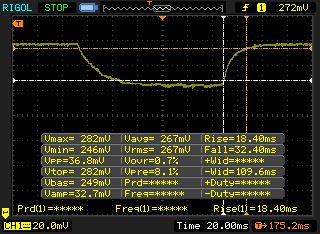 |
| ↘ 32.4 ms chute | ||
| L'écran souffre de latences très élevées, à éviter pour le jeu. En comparaison, tous les appareils testés affichent entre 0.2 (minimum) et 636 (maximum) ms. » 85 % des appareils testés affichent de meilleures performances. Cela signifie que les latences relevées sont moins bonnes que la moyenne (33.7 ms) de tous les appareils testés. | ||
Scintillement / MLI (Modulation de largeur d'impulsion)
| Scintillement / MLI (Modulation de largeur d'impulsion) non décelé | 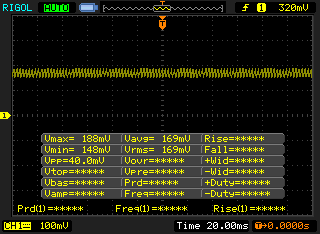 | ||
En comparaison, 53 % des appareils testés n'emploient pas MDI pour assombrir leur écran. Nous avons relevé une moyenne à 17924 (minimum : 5 - maximum : 3846000) Hz dans le cas où une MDI était active. | |||
| Cinebench R10 | |
| Rendering Single CPUs 64Bit (Classer selon les valeurs) | |
| Eurocom Shark 4 | |
| Microsoft Surface Pro 4 Core i7 | |
| Microsoft Surface Book Core i5 | |
| Lenovo ThinkPad T560-20FH001FGE | |
| Rendering Multiple CPUs 64Bit (Classer selon les valeurs) | |
| Eurocom Shark 4 | |
| Microsoft Surface Pro 4 Core i7 | |
| Microsoft Surface Book Core i5 | |
| Lenovo ThinkPad T560-20FH001FGE | |
| wPrime 2.10 - 1024m (Classer selon les valeurs) | |
| Dell XPS 13 9350 WQXGA | |
| Eurocom Shark 4 | |
| Microsoft Surface Pro 4 Core i7 | |
| Asus Zenbook UX303UB-DH74T | |
| Microsoft Surface Book Core i5 | |
| Super Pi Mod 1.5 XS 32M - 32M (Classer selon les valeurs) | |
| Dell XPS 13 9350 WQXGA | |
| Eurocom Shark 4 | |
| Microsoft Surface Pro 4 Core i7 | |
| Asus Zenbook UX303UB-DH74T | |
| Microsoft Surface Book Core i5 | |
| Lenovo ThinkPad T560-20FH001FGE | |
* ... Moindre est la valeur, meilleures sont les performances
| PCMark 7 - Score (Classer selon les valeurs) | |
| Dell XPS 13 9350 WQXGA | |
| Lenovo Yoga 900-13ISK 80MK | |
| Apple MacBook Air 13 inch 2015-03 | |
| Asus Zenbook UX303UB-DH74T | |
| HP ProBook 430 G3 P5T00ES | |
| PCMark 7 Score | 5672 points | |
| PCMark 8 Home Score Accelerated v2 | 2928 points | |
| PCMark 8 Creative Score Accelerated v2 | 4470 points | |
| PCMark 8 Work Score Accelerated v2 | 3438 points | |
Aide | ||
| Dell XPS 13 9350 WQXGA Iris Graphics 540, 6560U, Samsung PM951 NVMe 512 GB | HP ProBook 430 G2 L3Q21EA HD Graphics 5500, 5200U, Samsung SSD PM851 128 GB MZ7TE128HMGR | Asus Zenbook UX303UB-DH74T GeForce 940M, 6500U, CUK Cyclone SSD 1TB | Apple MacBook Air 13 inch 2015-03 HD Graphics 6000, 5650U, Apple SSD SD0256F | Lenovo Yoga 900-13ISK 80MK HD Graphics 520, 6500U, Samsung SSD PM871 MZNLN512HCJH | Dell XPS 13-9333 HD Graphics 4400, 4200U, Liteonit LMT-128M6M | |
|---|---|---|---|---|---|---|
| AS SSD | -74% | -63% | -68% | -42% | -63% | |
| Copy Game MB/s | 753 | 110.3 -85% | 392.8 -48% | 479.3 -36% | 298.7 -60% | |
| Copy Program MB/s | 271.8 | 105 -61% | 233.7 -14% | 245 -10% | 249.6 -8% | |
| Copy ISO MB/s | 1041 | 136.3 -87% | 382.5 -63% | 643 -38% | 364.5 -65% | |
| Score Total | 3158 | 838 -73% | 882 -72% | 2383 -25% | 1129 -64% | 902 -71% |
| Score Write | 664 | 218 -67% | 373 -44% | 463 -30% | 429 -35% | 337 -49% |
| Score Read | 1679 | 415 -75% | 333 -80% | 1281 -24% | 458 -73% | 373 -78% |
| Access Time Write * | 0.031 | 0.042 -35% | 0.051 -65% | 0.155 -400% | 0.039 -26% | 0.065 -110% |
| Access Time Read * | 0.046 | 0.141 -207% | 0.14 -204% | 0.171 -272% | 0.054 -17% | 0.078 -70% |
| 4K-64 Write | 492 | 111.1 -77% | 261.1 -47% | 338.9 -31% | 303 -38% | 249.5 -49% |
| 4K-64 Read | 1497 | 342.6 -77% | 256.9 -83% | 1140 -24% | 374.8 -75% | 294.2 -80% |
| 4K Write | 116.5 | 93.5 -20% | 71.3 -39% | 23.73 -80% | 80.6 -31% | 57.6 -51% |
| 4K Read | 38.29 | 26.84 -30% | 25.99 -32% | 19.16 -50% | 32.29 -16% | 29.32 -23% |
| Seq Write | 559 | 130.5 -77% | 409.8 -27% | 1001 79% | 454.6 -19% | 302.2 -46% |
| Seq Read | 1442 | 459 -68% | 505 -65% | 1212 -16% | 505 -65% | 492.7 -66% |
* ... Moindre est la valeur, meilleures sont les performances

| 3DMark 11 Performance | 2039 points | |
| 3DMark Ice Storm Standard Score | 58948 points | |
| 3DMark Cloud Gate Standard Score | 6730 points | |
| 3DMark Fire Strike Score | 1114 points | |
| 3DMark Fire Strike Extreme Score | 503 points | |
Aide | ||
| Tomb Raider - 1366x768 Normal Preset AA:FX AF:4x (Classer selon les valeurs) | |
| Dell XPS 13 9350 WQXGA | |
| Asus Zenbook UX303UB-DH74T | |
| Lenovo U31-70 80M5003EGE | |
| Asus Zenbook UX303UA-FN121T | |
| Lenovo IdeaPad Miix 700 | |
| Lenovo ThinkPad L440 20AT004QGE | |
| Bas | Moyen | Élevé | Ultra | |
| Tomb Raider (2013) | 85 | 49.2 | 33.3 | |
| Metro: Last Light (2013) | 28.1 | 23 | 15.8 | |
| Thief (2014) | 23.3 | 15.7 | 13.7 | |
| Metal Gear Solid V (2015) | 48.6 | 28.9 | 13.9 |
| Dell XPS 13 9350 WQXGA Iris Graphics 540, 6560U, Samsung PM951 NVMe 512 GB | HP ProBook 430 G3 P5T00ES HD Graphics 520, 6200U, Hitachi Travelstar Z7K500 HTS725050A7E630 | Asus Zenbook UX303UB-DH74T GeForce 940M, 6500U, CUK Cyclone SSD 1TB | Apple MacBook Air 13 inch 2015-03 HD Graphics 6000, 5650U, Apple SSD SD0256F | Lenovo Yoga 900-13ISK 80MK HD Graphics 520, 6500U, Samsung SSD PM871 MZNLN512HCJH | HP Spectre x360 13-4104ng HD Graphics 520, 6200U, Samsung SSD PM851 256 GB MZNTE256HMHP | |
|---|---|---|---|---|---|---|
| Noise | -7% | -11% | -15% | -6% | -10% | |
| off / environment * | 29.2 | |||||
| Idle Minimum * | 29.2 | 29.8 -2% | 29.8 -2% | 29.2 -0% | 29.7 -2% | 29.6 -1% |
| Idle Average * | 29.2 | 29.8 -2% | 29.8 -2% | 29.2 -0% | 29.8 -2% | 29.6 -1% |
| Idle Maximum * | 29.2 | 30.9 -6% | 29.8 -2% | 29.2 -0% | 30 -3% | 34.6 -18% |
| Load Average * | 31.4 | 33.3 -6% | 37.4 -19% | 40.2 -28% | 32 -2% | 34.7 -11% |
| Load Maximum * | 31.4 | 37.4 -19% | 40.3 -28% | 46.3 -47% | 38.5 -23% | 37.9 -21% |
* ... Moindre est la valeur, meilleures sont les performances
Degré de la nuisance sonore
| Au repos |
| 29.2 / 29.2 / 29.2 dB(A) |
| Fortement sollicité |
| 31.4 / 31.4 dB(A) |
 | ||
30 dB silencieux 40 dB(A) audible 50 dB(A) bruyant |
||
min: | ||
(±) La température maximale du côté supérieur est de 41.4 °C / 107 F, par rapport à la moyenne de 35.9 °C / 97 F, allant de 21.4 à 59 °C pour la classe Subnotebook.
(-) Le fond chauffe jusqu'à un maximum de 49.2 °C / 121 F, contre une moyenne de 39.4 °C / 103 F
(+) En utilisation inactive, la température moyenne du côté supérieur est de 26.7 °C / 80 F, par rapport à la moyenne du dispositif de 30.7 °C / 87 F.
(+) Les repose-poignets et le pavé tactile sont plus froids que la température de la peau avec un maximum de 28.7 °C / 83.7 F et sont donc froids au toucher.
(±) La température moyenne de la zone de l'appui-paume de dispositifs similaires était de 28.3 °C / 82.9 F (-0.4 °C / #-0.8 F).
| Éteint/en veille | |
| Au repos | |
| Fortement sollicité |
|
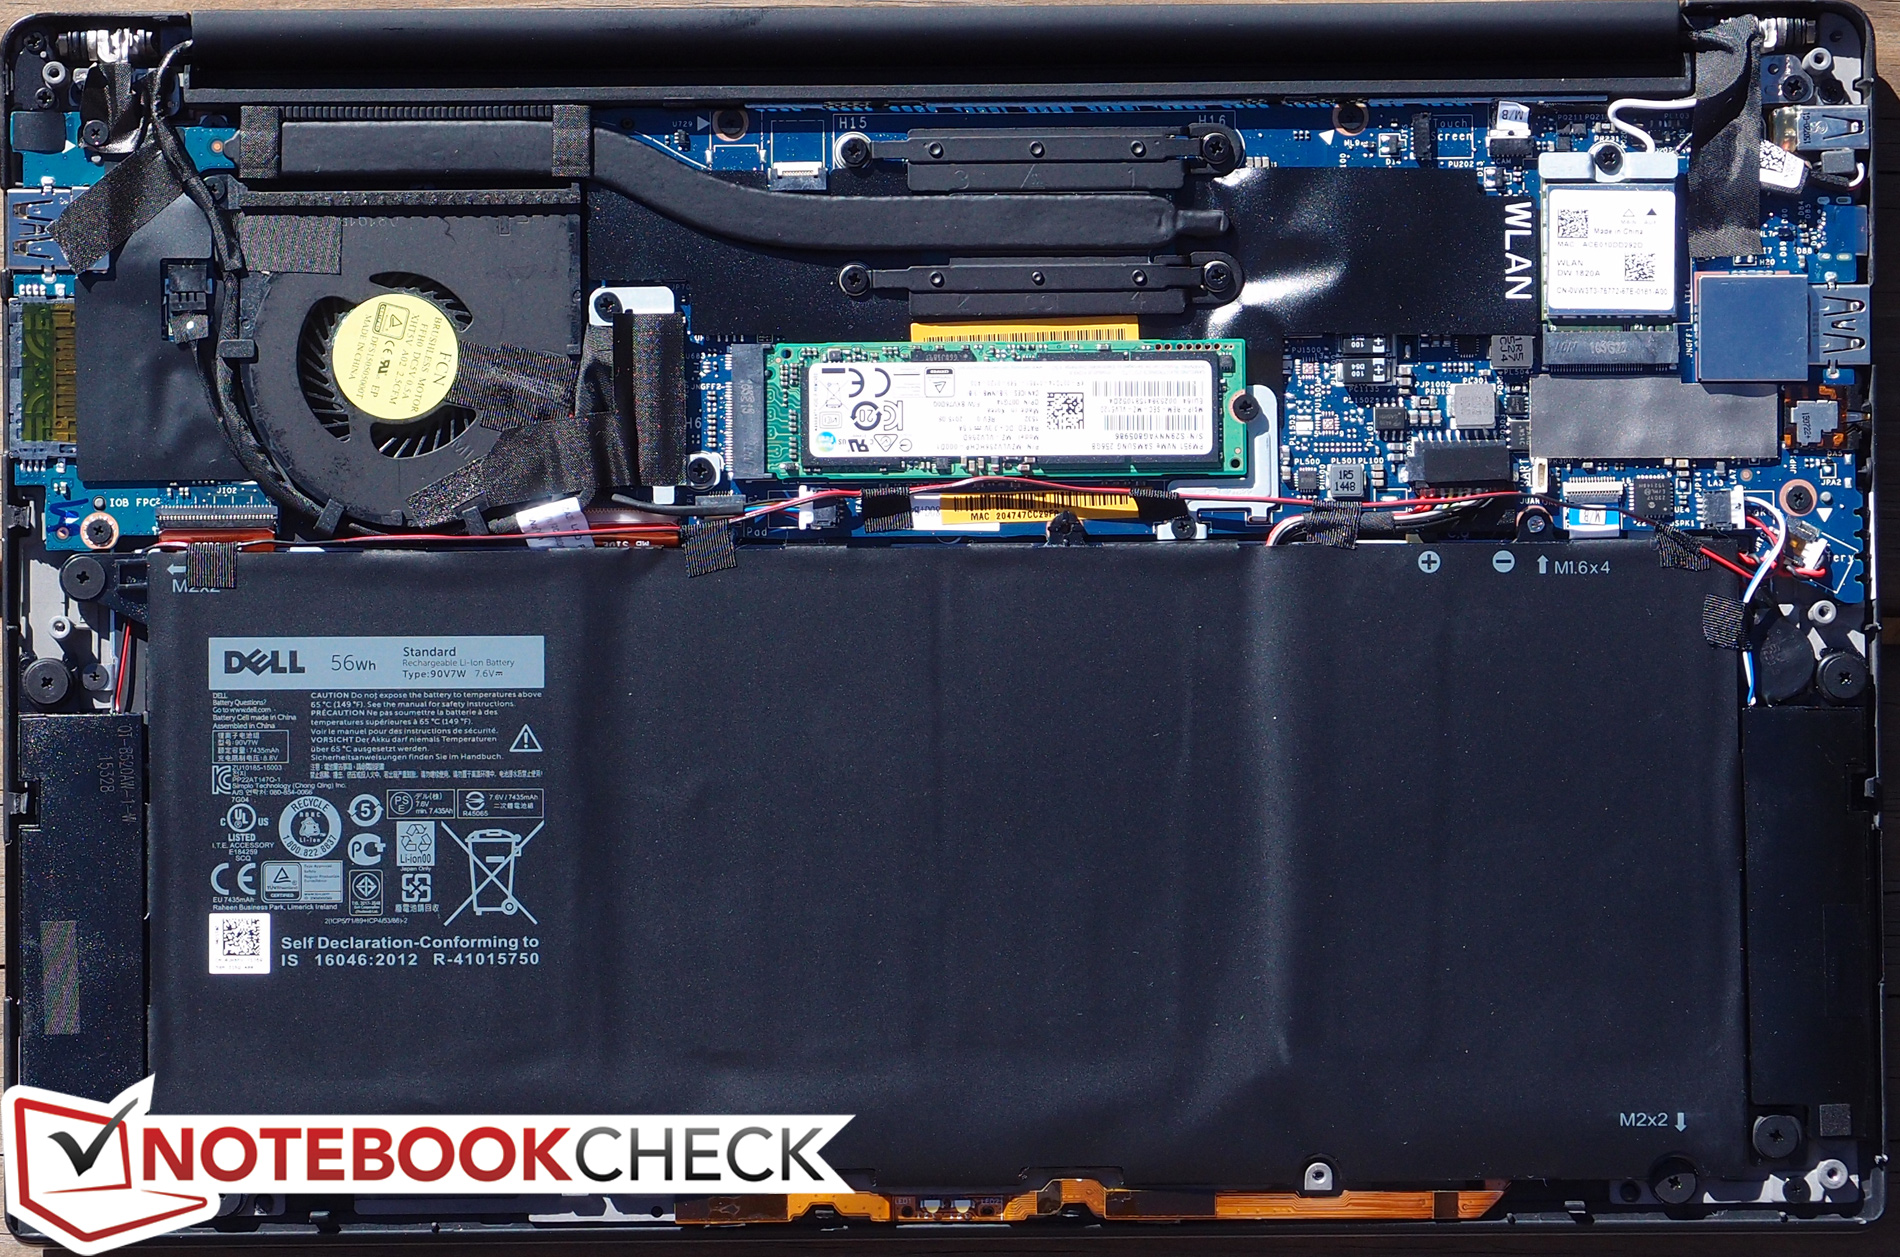
| Dell XPS 13 9350 WQXGA 56 Wh | HP ProBook 430 G3 P5T00ES 44 Wh | Asus Zenbook UX303UB-DH74T 50 Wh | Apple MacBook Air 13 inch 2015-03 54 Wh | Lenovo Yoga 900-13ISK 80MK 66 Wh | HP Spectre x360 13-4104ng 56 Wh | |
|---|---|---|---|---|---|---|
| Autonomie de la batterie | -4% | -3% | 78% | 23% | 61% | |
| Reader / Idle | 604 | 449 -26% | 617 2% | 1572 160% | 844 40% | |
| WiFi v1.3 | 311 | 377 21% | 341 10% | 620 99% | 403 30% | 500 61% |
| Load | 128 | 118 -8% | 103 -20% | 97 -24% | 128 0% |
Points positifs
Points négatifs
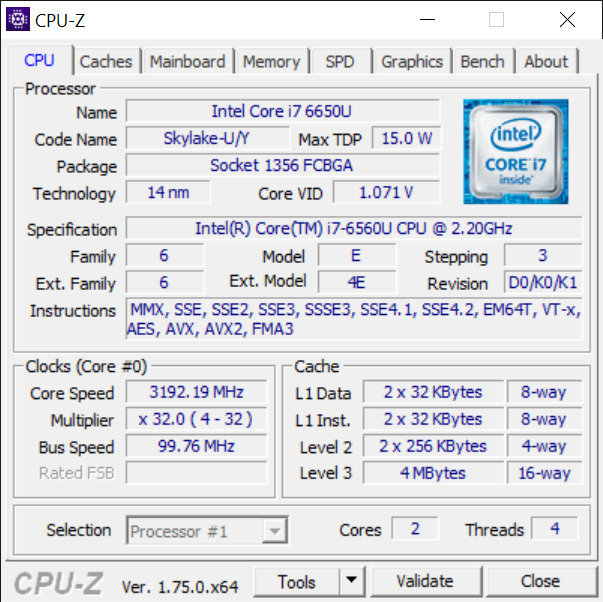
Outre sa légèreté, le XPS 13 se distingue de par ses ventilateurs très silencieux, et son écran époustouflant. Son Core i7-6560U et son Iris Graphis 540 intégrée le rendent encore plus puissant que jamais, sans pour autant le rendre plus bruyant, ce qui fait sa force. Mais ce gain en performances s'est malheureusement accompagné d'une augmentation notable des températures, tant internes qu'en surface, conduisant parfois à une auto-limitation du CPU lors de sessions de jeux prolongées. Son autonomie a été très impactée par la montée en résolution de son écran, désormais QHD+, et son nouveau processeur, plus gourmand. Dans l'ensemble, les performances, graphiques en particulier, de ce dernier sont légèrement en-deçà de celles du Core i7-6650U de la Surface Pro 4.
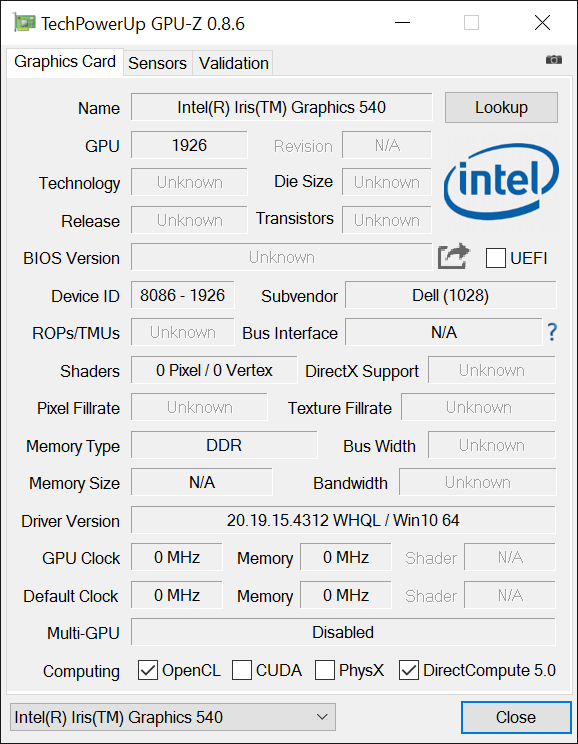
Si la différence de performances entre l'Iris Graphics et la Graphics 520 vous importe peu, vous devriez jeter un oeil à des configurations moins chères de cet appareil, qui offrent une meilleure autonomie. Si la puissance graphique est importante à vos yeux, peut-être serait-il judicieux d'investir un peu plus pour vous offrir un Zenbook UX303, qui, bien que légèrement plus grand, à l'avantage d'intégrer une carte graphique Nvidia dédiée, lui permettant de garantir un équilibre entre performances et mobilité.
Cet article est la traduction test complet rédigé en anglais, que vous trouverez ici.
Dell XPS 13 9350 WQXGA
-
02/26/2016 v5(old)
Allen Ngo
Pricecompare
