 Deutsch
 English
 Español
 Français
 Italiano
 Nederlands
 Polski
 Português
 Русский
 Türkçe
 Svenska
 Chinese
 Magyar
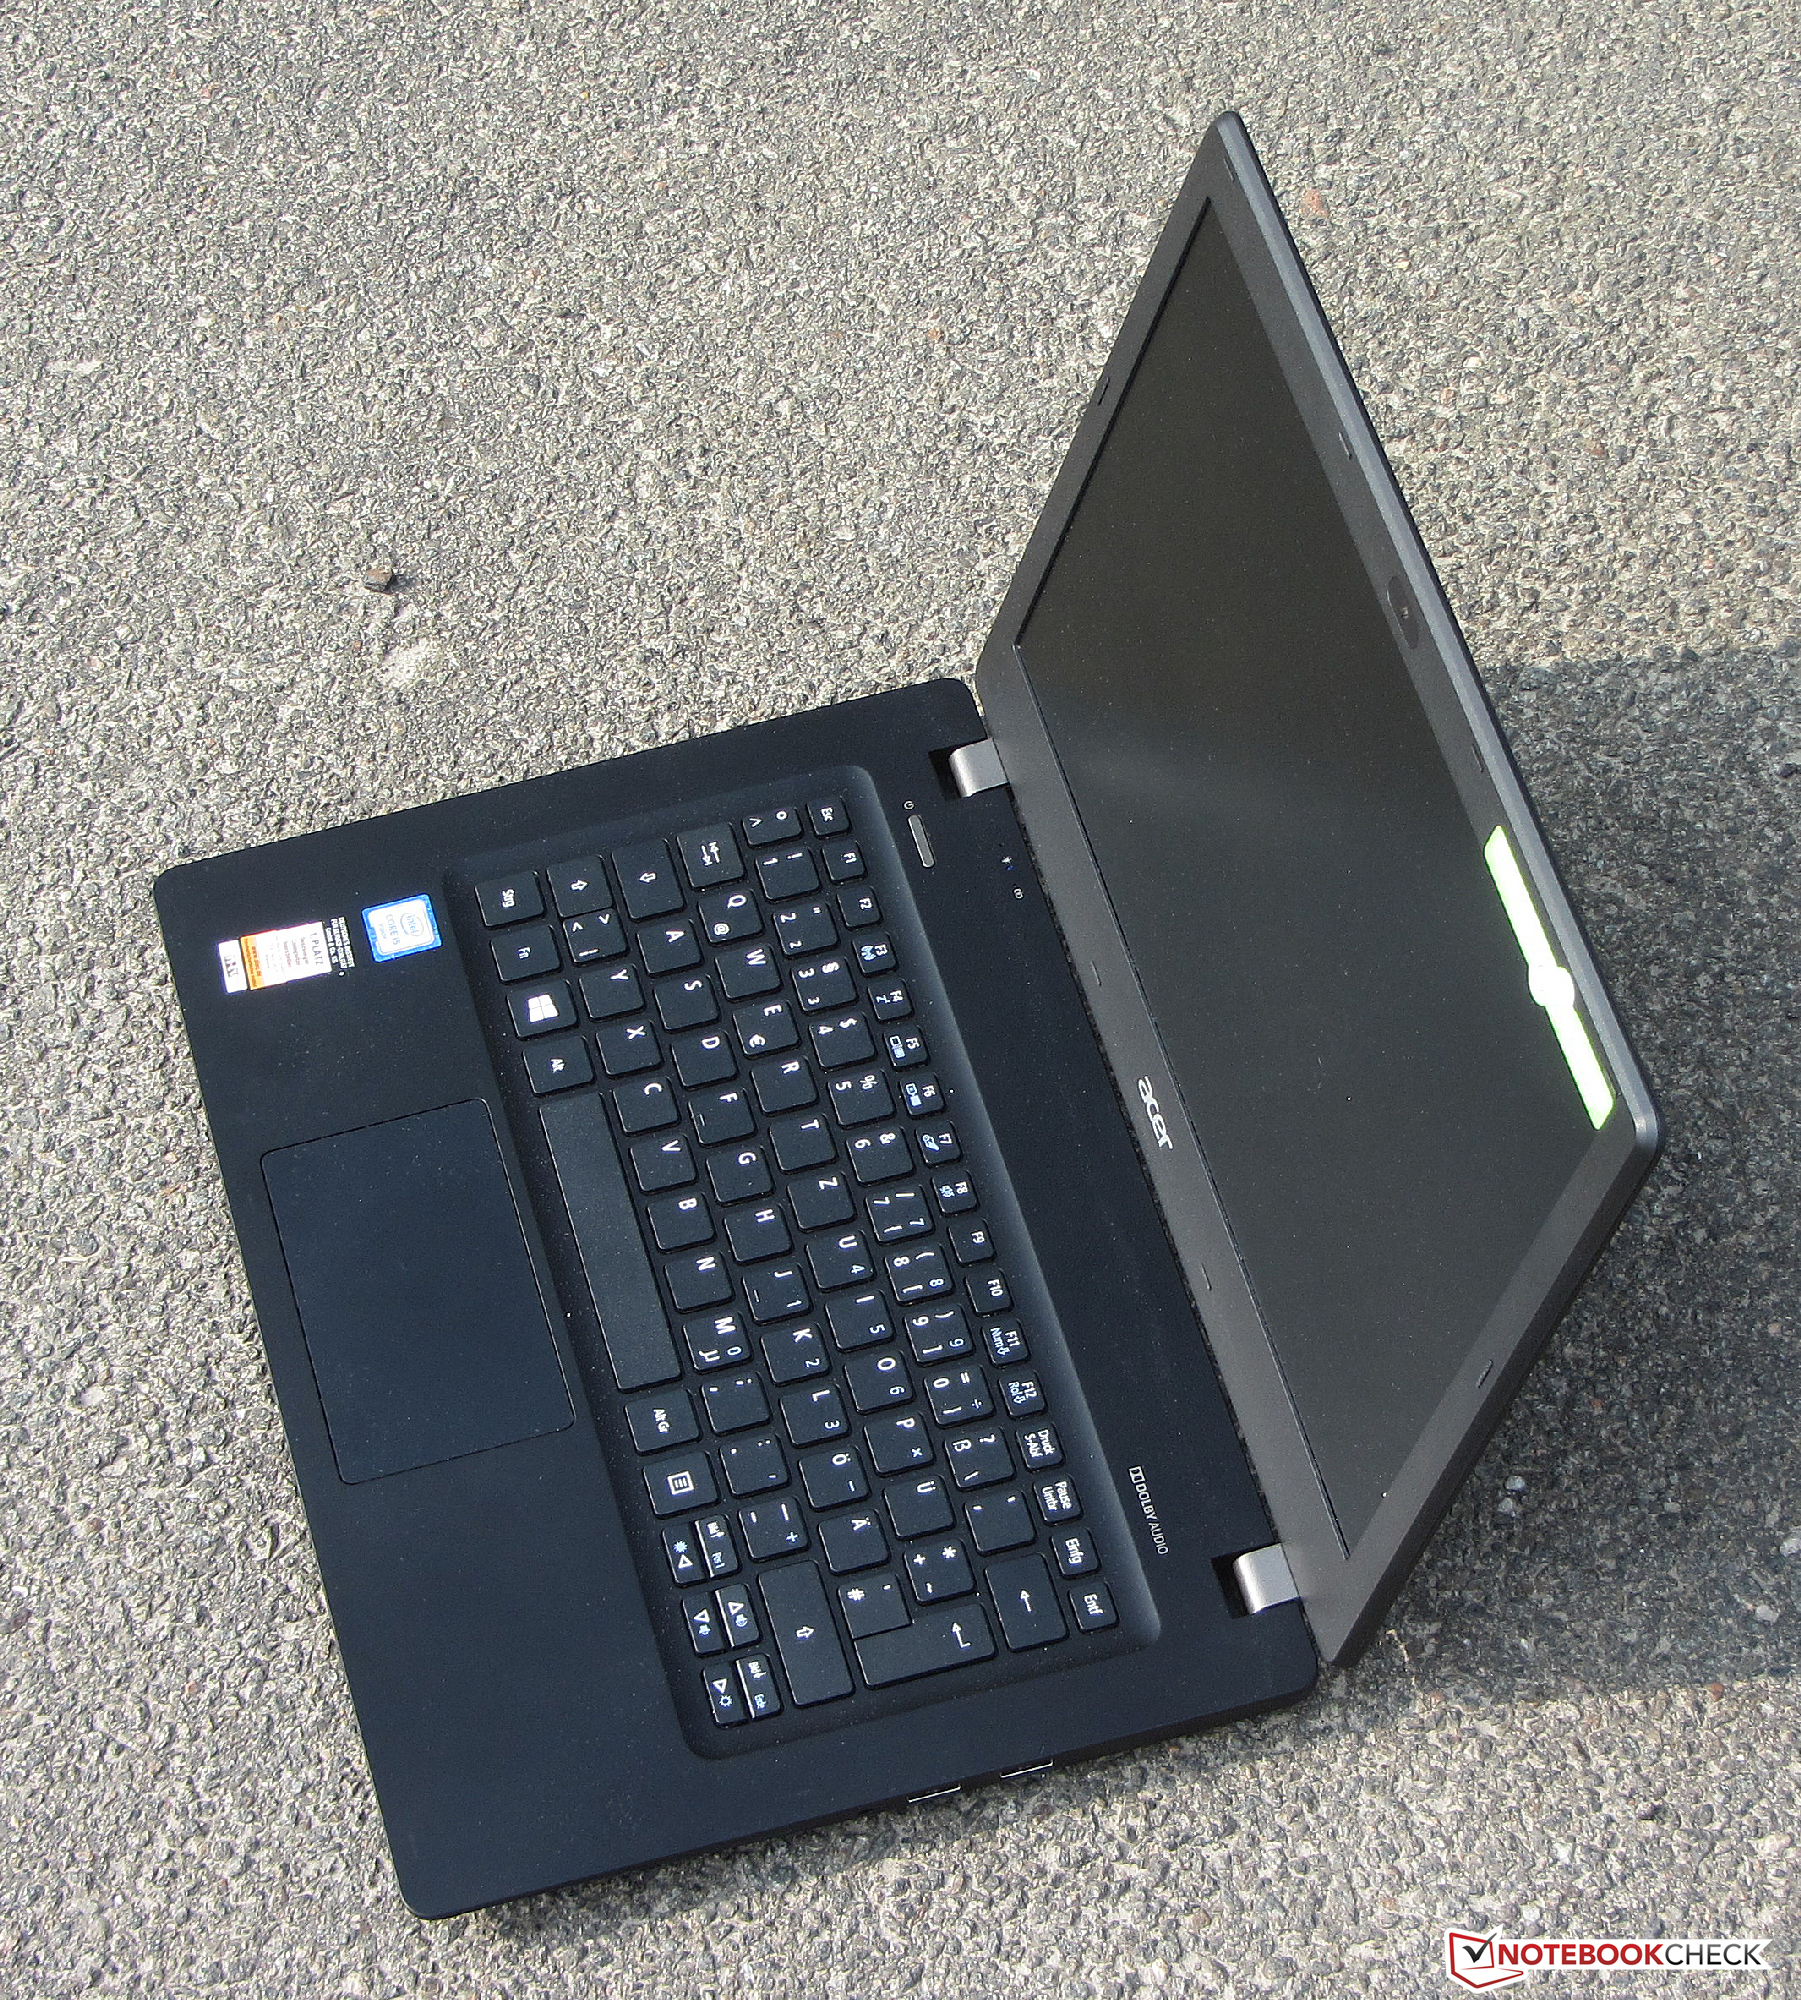
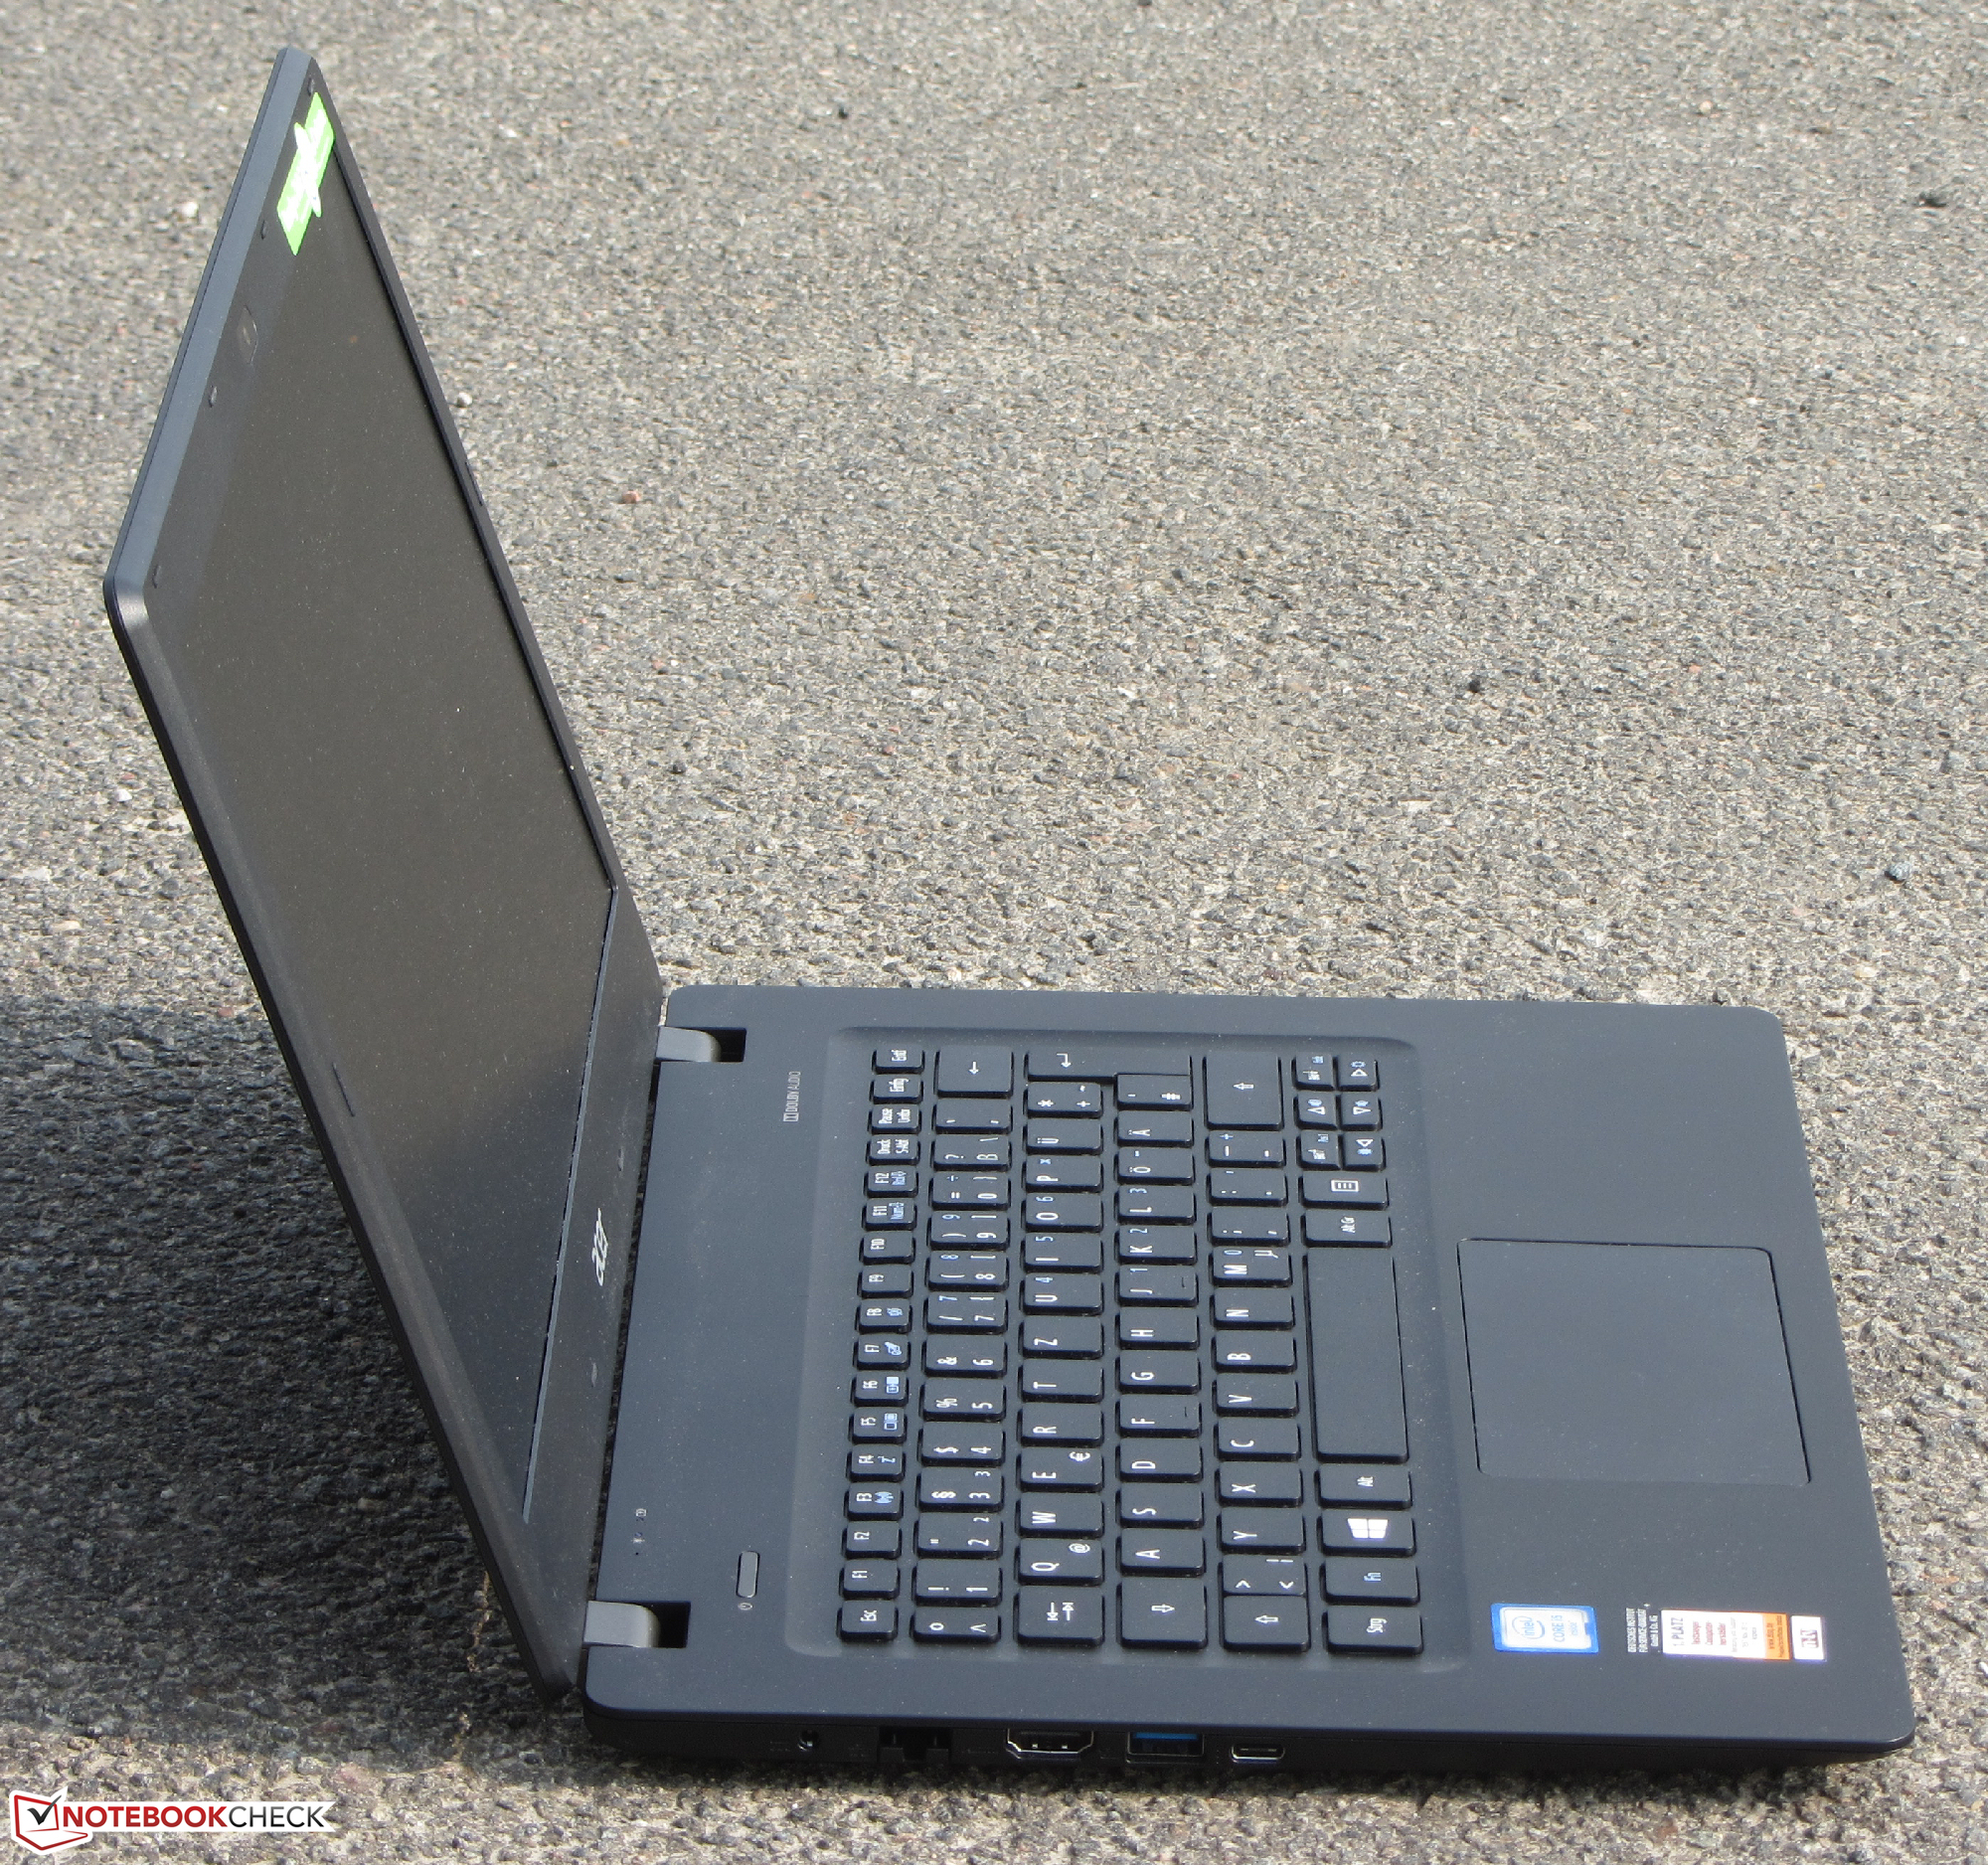
Courte critique de l'Ultraportable Acer TravelMate P238-M-5575
| |||||||||||||||||||||||||
Homogénéité de la luminosité: 91 %
Valeur mesurée au centre, sur batterie: 223 cd/m²
Contraste: 461:1 (Valeurs des noirs: 0.49 cd/m²)
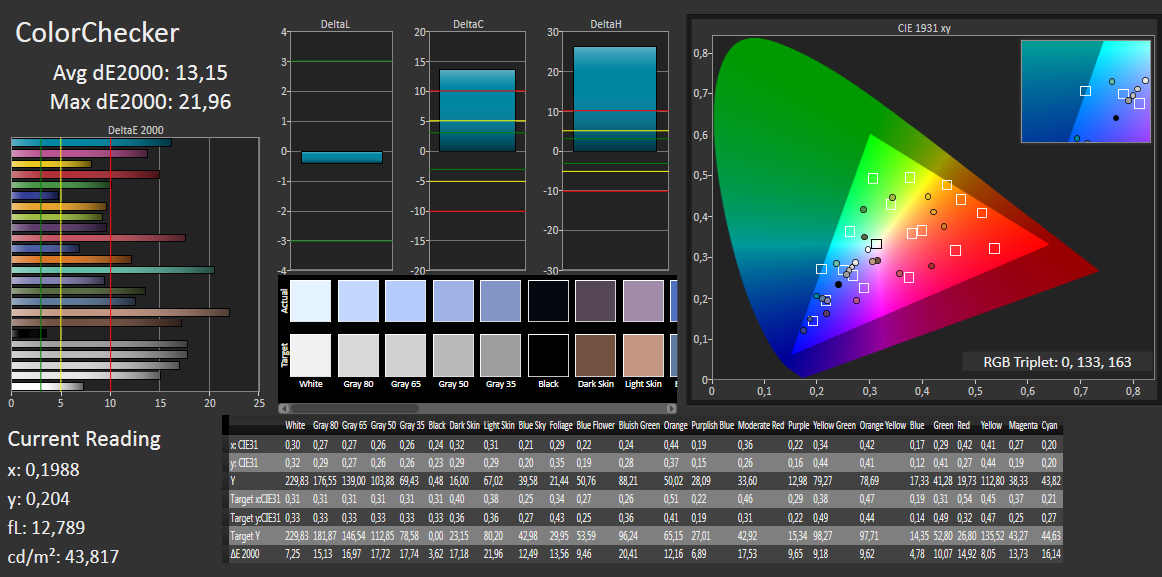
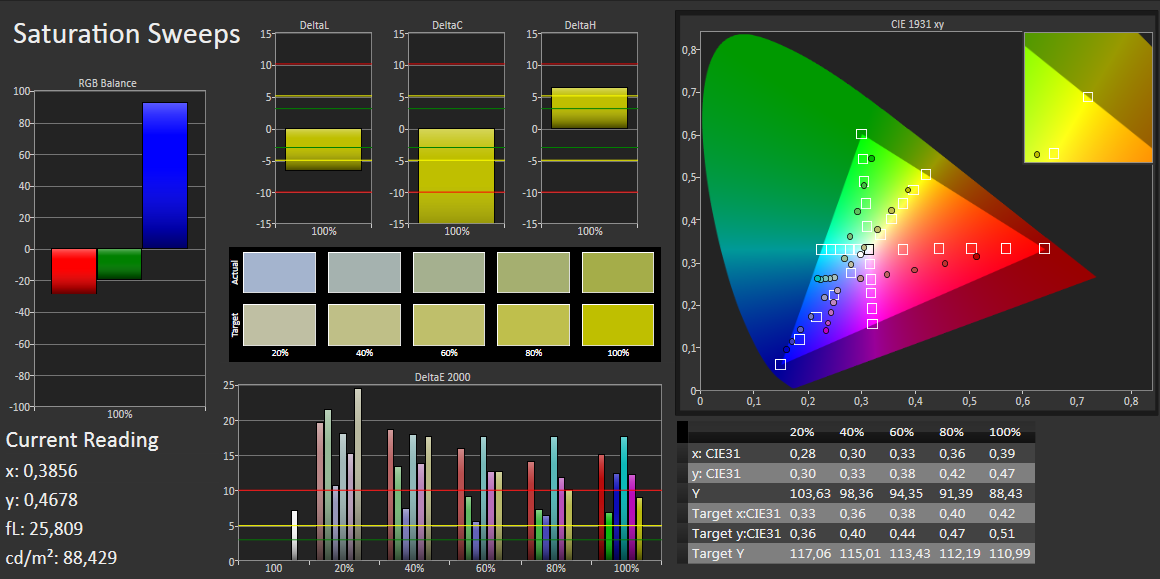
ΔE Color 13.15 | 0.5-29.43 Ø5
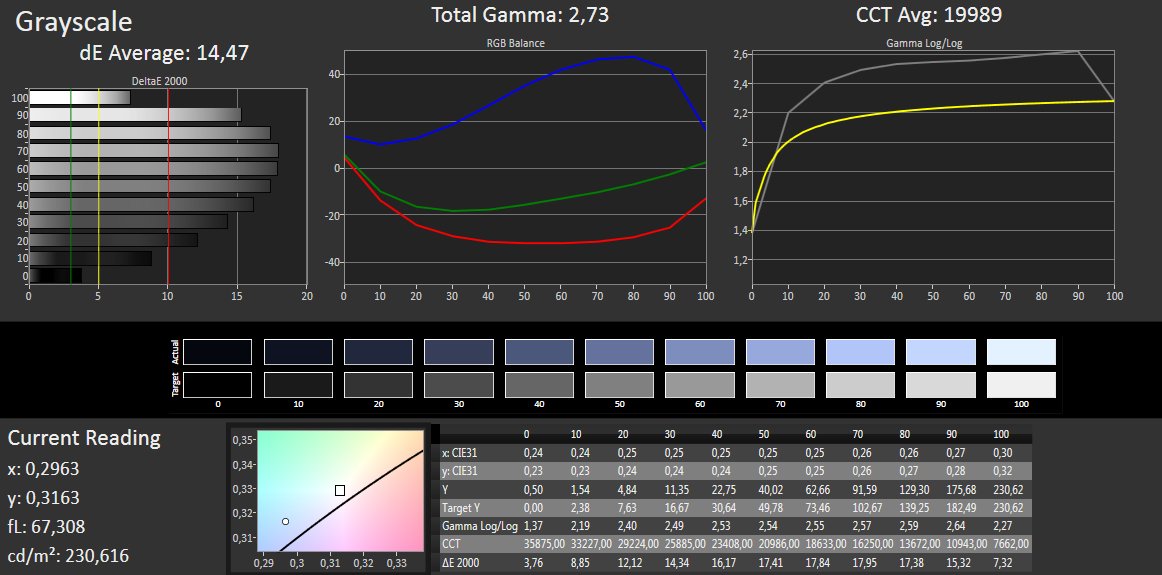
ΔE Greyscale 14.47 | 0.57-98 Ø5.3
56% sRGB (Argyll 1.6.3 3D)
36% AdobeRGB 1998 (Argyll 1.6.3 3D)
38.49% AdobeRGB 1998 (Argyll 2.2.0 3D)
56.1% sRGB (Argyll 2.2.0 3D)
37.25% Display P3 (Argyll 2.2.0 3D)
Gamma: 2.73
Scintillement / MLI (Modulation de largeur d'impulsion)
| Scintillement / MLI (Modulation de largeur d'impulsion) non décelé | ||
En comparaison, 53 % des appareils testés n'emploient pas MDI pour assombrir leur écran. Nous avons relevé une moyenne à 17924 (minimum : 5 - maximum : 3846000) Hz dans le cas où une MDI était active. | ||
Temps de réponse de l'écran
| ↔ Temps de réponse noir à blanc | ||
|---|---|---|
| 28 ms ... hausse ↗ et chute ↘ combinées | ↗ 10 ms hausse | 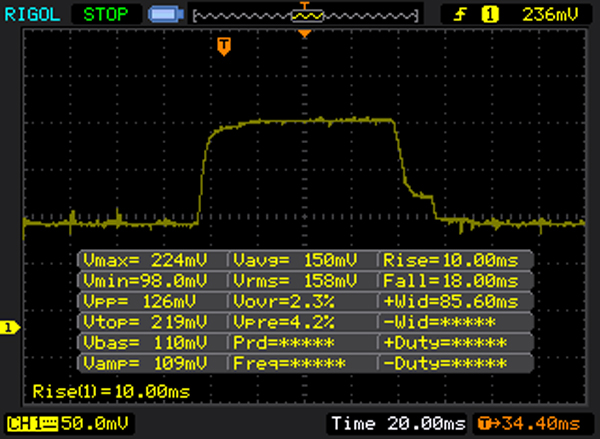 |
| ↘ 18 ms chute | ||
| L'écran souffre de latences relativement élevées, insuffisant pour le jeu. En comparaison, tous les appareils testés affichent entre 0.1 (minimum) et 240 (maximum) ms. » 67 % des appareils testés affichent de meilleures performances. Cela signifie que les latences relevées sont moins bonnes que la moyenne (21.5 ms) de tous les appareils testés. | ||
| ↔ Temps de réponse gris 50% à gris 80% | ||
| 42 ms ... hausse ↗ et chute ↘ combinées | ↗ 22 ms hausse | 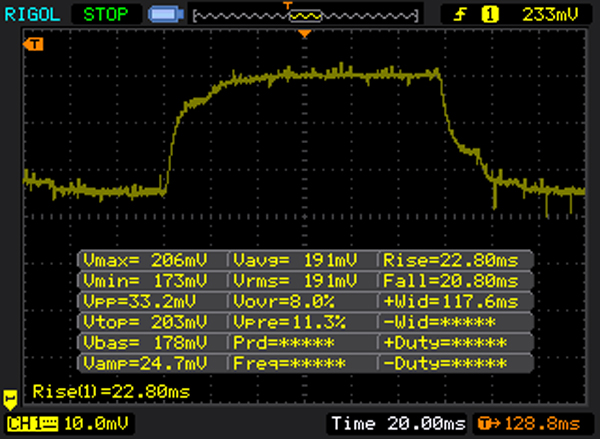 |
| ↘ 20 ms chute | ||
| L'écran souffre de latences très élevées, à éviter pour le jeu. En comparaison, tous les appareils testés affichent entre 0.2 (minimum) et 636 (maximum) ms. » 63 % des appareils testés affichent de meilleures performances. Cela signifie que les latences relevées sont moins bonnes que la moyenne (33.7 ms) de tous les appareils testés. | ||
| Acer TravelMate P238-M-5575 TN LED, 1366x768 | Acer Aspire V3-372-50LK IPS, 1920x1080 | HP ProBook 430 G3 P5T00ES TN LED, 1366x768 | Apple MacBook Air 13 inch 2015-03 TN LED, 1440x900 | Lenovo IdeaPad 500S-13ISK IPS, 1920x1080 | Acer TravelMate P236-M-57R4 TN, 1366x768 | HP Envy 13-d020ng IPS, 1920x1080 | SCHENKER S306 IPS, 1920x1080 | Asus Zenbook UX303UA-FN121T TN LED, 1366x768 | |
|---|---|---|---|---|---|---|---|---|---|
| Display | 5% | -4% | 8% | 7% | 11% | 69% | 76% | 16% | |
| Display P3 Coverage | 37.25 | 39.05 5% | 35.87 -4% | 40.1 8% | 40.74 9% 38.91 4% | 41.26 11% | 63.7 71% | 68.1 83% | 43.08 16% |
| sRGB Coverage | 56.1 | 58.7 5% | 54 -4% | 59.8 7% | 60.6 8% 58.5 4% | 62.1 11% | 93 66% | 93.4 66% | 64.8 16% |
| AdobeRGB 1998 Coverage | 38.49 | 40.35 5% | 37.06 -4% | 41.51 8% | 42.15 10% 40.21 4% | 42.64 11% | 65.1 69% | 68.4 78% | 44.52 16% |
| Response Times | 2% | -24% | 6% | 17% | -2% | 46% | |||
| Response Time Grey 50% / Grey 80% * | 42 ? | 46 ? -10% | 54.4 ? -30% | 46 ? -10% | 34 ? 19% | 46 ? -10% | 23 ? 45% | ||
| Response Time Black / White * | 28 ? | 24 ? 14% | 32.8 ? -17% | 22 ? 21% | 24 ? 14% | 26 ? 7% | 15 ? 46% | ||
| PWM Frequency | 192 ? | 208 ? | 1020 ? | 192 ? | |||||
| Screen | 23% | -9% | 40% | 24% | -16% | 68% | 56% | 23% | |
| Brightness middle | 226 | 250 11% | 212 -6% | 329 46% | 219 -3% | 188 -17% | 345 53% | 347 54% | 203 -10% |
| Brightness | 216 | 247 14% | 205 -5% | 310 44% | 212 -2% | 187 -13% | 335 55% | 333 54% | 193 -11% |
| Brightness Distribution | 91 | 87 -4% | 90 -1% | 82 -10% | 82 -10% | 78 -14% | 95 4% | 80 -12% | 84 -8% |
| Black Level * | 0.49 | 0.43 12% | 0.71 -45% | 0.405 17% | 0.35 29% | 0.777 -59% | 0.25 49% | 0.39 20% | 0.49 -0% |
| Contrast | 461 | 581 26% | 299 -35% | 812 76% | 626 36% | 242 -48% | 1380 199% | 890 93% | 414 -10% |
| Colorchecker dE 2000 * | 13.15 | 4.51 66% | 12.06 8% | 3.96 70% | 4.95 62% | 12.21 7% | 4.94 62% | 3.66 72% | 3.2 76% |
| Colorchecker dE 2000 max. * | 21.96 | 7.51 66% | 11.17 49% | 8.85 60% | 6.48 70% | 4.13 81% | |||
| Greyscale dE 2000 * | 14.47 | 3.18 78% | 13.41 7% | 3.51 76% | 3.45 76% | 13.1 9% | 5.85 60% | 4.18 71% | 2.77 81% |
| Gamma | 2.73 81% | 2.43 91% | 2.41 91% | 3.83 57% | 2.34 94% | 2.66 83% | 2.25 98% | 2.79 79% | 2.46 89% |
| CCT | 19989 33% | 6743 96% | 15382 42% | 6711 97% | 6815 95% | 17666 37% | 7105 91% | 6670 97% | 7176 91% |
| Color Space (Percent of AdobeRGB 1998) | 36 | 37 3% | 34.3 -5% | 38.4 7% | 37 3% | 39.4 9% | 60 67% | 61 69% | 41 14% |
| Color Space (Percent of sRGB) | 56 | 58 4% | 54.2 -3% | 59.8 7% | 58 4% | 93 66% | 93 66% | 65 16% | |
| Moyenne finale (programmes/paramètres) | 10% /
16% | -12% /
-10% | 24% /
32% | 12% /
16% | -3% /
-8% | 51% /
61% | 43% /
52% | 28% /
25% |
* ... Moindre est la valeur, meilleures sont les performances
| JetStream 1.1 - Total Score | |
| HP Envy 13-d020ng | |
| SCHENKER S306 | |
| Asus Zenbook UX303UA-FN121T | |
| Lenovo U31-70 80M5003EGE | |
| Acer TravelMate P238-M-5575 | |
| HP ProBook 430 G3 P5T00ES | |
| Peacekeeper - --- | |
| Lenovo U31-70 80M5003EGE | |
| HP Envy 13-d020ng | |
| SCHENKER S306 | |
| Acer TravelMate P238-M-5575 | |
| Asus Zenbook UX303UA-FN121T | |
| HP ProBook 430 G3 P5T00ES | |
* ... Moindre est la valeur, meilleures sont les performances
| PCMark 7 Score | 4629 points | |
| PCMark 8 Home Score Accelerated v2 | 3589 points | |
| PCMark 8 Creative Score Accelerated v2 | 3705 points | |
| PCMark 8 Work Score Accelerated v2 | 4748 points | |
Aide | ||

| 3DMark 06 Standard Score | 8980 points | |
| 3DMark 11 Performance | 1461 points | |
| 3DMark Ice Storm Standard Score | 53522 points | |
| 3DMark Cloud Gate Standard Score | 5882 points | |
| 3DMark Fire Strike Score | 773 points | |
Aide | ||
| Bas | Moyen | Élevé | Ultra | |
| Tomb Raider (2013) | 74.9 | 38.1 | 23.8 | |
| BioShock Infinite (2013) | 51.8 | 27.7 | 22.9 | |
| Battlefield 4 (2013) | 31.3 | 24.3 | 16.9 | |
| World of Warships (2015) | 80 | 45.3 | ||
| FIFA 16 (2015) | 62.5 | 39.4 | ||
| Need for Speed 2016 (2016) | 15.2 | 13.5 |
Degré de la nuisance sonore
| Au repos |
| 31.2 / 31.2 / 31.2 dB(A) |
| Fortement sollicité |
| 35.71 / 38.1 dB(A) |
 | ||
30 dB silencieux 40 dB(A) audible 50 dB(A) bruyant |
||
min: | ||
| Acer TravelMate P238-M-5575 6200U, HD Graphics 520 | Acer Aspire V3-372-50LK 6200U, HD Graphics 520 | HP ProBook 430 G3 P5T00ES 6200U, HD Graphics 520 | Apple MacBook Air 13 inch 2015-03 5650U, HD Graphics 6000 | Lenovo IdeaPad 500S-13ISK 6200U, HD Graphics 520 | Acer TravelMate P236-M-57R4 5200U, HD Graphics 5500 | HP Envy 13-d020ng 6200U, HD Graphics 520 | SCHENKER S306 6200U, HD Graphics 520 | Asus Zenbook UX303UA-FN121T 6200U, HD Graphics 520 | |
|---|---|---|---|---|---|---|---|---|---|
| Noise | 4% | 4% | -3% | -2% | 1% | -2% | -6% | 1% | |
| off / environment * | 31.2 | 31.3 -0% | 31.3 -0% | ||||||
| Idle Minimum * | 31.2 | 31.5 -1% | 29.8 4% | 29.2 6% | 31.3 -0% | 29.1 7% | 32.5 -4% | 31.3 -0% | 32.6 -4% |
| Idle Average * | 31.2 | 31.5 -1% | 29.8 4% | 29.2 6% | 31.7 -2% | 29.1 7% | 32.5 -4% | 31.3 -0% | 32.7 -5% |
| Idle Maximum * | 31.2 | 31.5 -1% | 30.9 1% | 29.2 6% | 31.8 -2% | 29.1 7% | 32.4 -4% | 31.4 -1% | 32.7 -5% |
| Load Average * | 35.71 | 32.4 9% | 33.3 7% | 40.2 -13% | 36.7 -3% | 38.7 -8% | 36 -1% | 38.6 -8% | 33.4 6% |
| Load Maximum * | 38.1 | 32.3 15% | 37.4 2% | 46.3 -22% | 39.4 -3% | 40.8 -7% | 36.5 4% | 48.5 -27% | 33.4 12% |
* ... Moindre est la valeur, meilleures sont les performances
(+) La température maximale du côté supérieur est de 34.2 °C / 94 F, par rapport à la moyenne de 35.9 °C / 97 F, allant de 21.4 à 59 °C pour la classe Subnotebook.
(+) Le fond chauffe jusqu'à un maximum de 31 °C / 88 F, contre une moyenne de 39.4 °C / 103 F
(+) En utilisation inactive, la température moyenne du côté supérieur est de 25.4 °C / 78 F, par rapport à la moyenne du dispositif de 30.7 °C / 87 F.
(+) Les repose-poignets et le pavé tactile sont plus froids que la température de la peau avec un maximum de 24.6 °C / 76.3 F et sont donc froids au toucher.
(+) La température moyenne de la zone de l'appui-paume de dispositifs similaires était de 28.3 °C / 82.9 F (+3.7 °C / #6.6 F).
| Acer TravelMate P238-M-5575 6200U, HD Graphics 520 | Acer Aspire V3-372-50LK 6200U, HD Graphics 520 | HP ProBook 430 G3 P5T00ES 6200U, HD Graphics 520 | Apple MacBook Air 13 inch 2015-03 5650U, HD Graphics 6000 | Lenovo IdeaPad 500S-13ISK 6200U, HD Graphics 520 | Acer TravelMate P236-M-57R4 5200U, HD Graphics 5500 | HP Envy 13-d020ng 6200U, HD Graphics 520 | SCHENKER S306 6200U, HD Graphics 520 | Asus Zenbook UX303UA-FN121T 6200U, HD Graphics 520 | |
|---|---|---|---|---|---|---|---|---|---|
| Heat | -35% | -25% | -18% | -10% | -18% | -20% | -20% | -7% | |
| Maximum Upper Side * | 34.2 | 49.3 -44% | 42.1 -23% | 43.8 -28% | 35.9 -5% | 33.5 2% | 51 -49% | 44.2 -29% | 39.7 -16% |
| Maximum Bottom * | 31 | 53.3 -72% | 44.1 -42% | 42.1 -36% | 39.1 -26% | 44.8 -45% | 46 -48% | 42.3 -36% | 34.8 -12% |
| Idle Upper Side * | 27.1 | 28.2 -4% | 31.1 -15% | 28.5 -5% | 27.8 -3% | 29.5 -9% | 25.5 6% | 29.6 -9% | 27.4 -1% |
| Idle Bottom * | 27.7 | 32.6 -18% | 32.9 -19% | 28.9 -4% | 29.1 -5% | 33 -19% | 24.4 12% | 29.2 -5% | 27.7 -0% |
* ... Moindre est la valeur, meilleures sont les performances
| Éteint/en veille | |
| Au repos | |
| Fortement sollicité |
|
| Acer TravelMate P238-M-5575 6200U, HD Graphics 520 | Acer Aspire V3-372-50LK 6200U, HD Graphics 520 | HP ProBook 430 G3 P5T00ES 6200U, HD Graphics 520 | Apple MacBook Air 13 inch 2015-03 5650U, HD Graphics 6000 | Lenovo IdeaPad 500S-13ISK 6200U, HD Graphics 520 | Acer TravelMate P236-M-57R4 5200U, HD Graphics 5500 | HP Envy 13-d020ng 6200U, HD Graphics 520 | SCHENKER S306 6200U, HD Graphics 520 | Asus Zenbook UX303UA-FN121T 6200U, HD Graphics 520 | |
|---|---|---|---|---|---|---|---|---|---|
| Power Consumption | -13% | -22% | -3% | -18% | -6% | -32% | -67% | -10% | |
| Idle Minimum * | 3.2 | 3.8 -19% | 4.7 -47% | 2.7 16% | 5.2 -63% | 3 6% | 4.2 -31% | 6.3 -97% | 4.2 -31% |
| Idle Average * | 5.5 | 5.8 -5% | 7.2 -31% | 5.7 -4% | 6.9 -25% | 5.7 -4% | 7.4 -35% | 10.1 -84% | 6.2 -13% |
| Idle Maximum * | 6 | 8.1 -35% | 8.3 -38% | 6 -0% | 7.2 -20% | 6.3 -5% | 10.1 -68% | 12.6 -110% | 6.4 -7% |
| Load Average * | 29.5 | 30.2 -2% | 26.4 11% | 32.1 -9% | 26.7 9% | 30.2 -2% | 33.4 -13% | 34.6 -17% | 29 2% |
| Load Maximum * | 30.9 | 32.4 -5% | 32 -4% | 36.2 -17% | 28.2 9% | 39.1 -27% | 34.7 -12% | 38.7 -25% | 31 -0% |
* ... Moindre est la valeur, meilleures sont les performances
| Acer TravelMate P238-M-5575 49.7 Wh | Acer Aspire V3-372-50LK 51 Wh | HP ProBook 430 G3 P5T00ES 44 Wh | Apple MacBook Air 13 inch 2015-03 54 Wh | Lenovo IdeaPad 500S-13ISK 35 Wh | Acer TravelMate P236-M-57R4 49 Wh | HP Envy 13-d020ng 45 Wh | SCHENKER S306 45 Wh | Asus Zenbook UX303UA-FN121T 50 Wh | |
|---|---|---|---|---|---|---|---|---|---|
| Autonomie de la batterie | -27% | -41% | -3% | -48% | -37% | -46% | -28% | ||
| Reader / Idle | 1290 | 906 -30% | 449 -65% | 1572 22% | 615 -52% | ||||
| H.264 | 557 | 337 -39% | 311 -44% | ||||||
| WiFi v1.3 | 608 | 349 -43% | 377 -38% | 620 2% | 301 -50% | 381 -37% | 329 -46% | 436 -28% | |
| Load | 147 | 135 -8% | 118 -20% | 97 -34% | 81 -45% | ||||
| WiFi | 359 |
Points positifs
Points négatifs
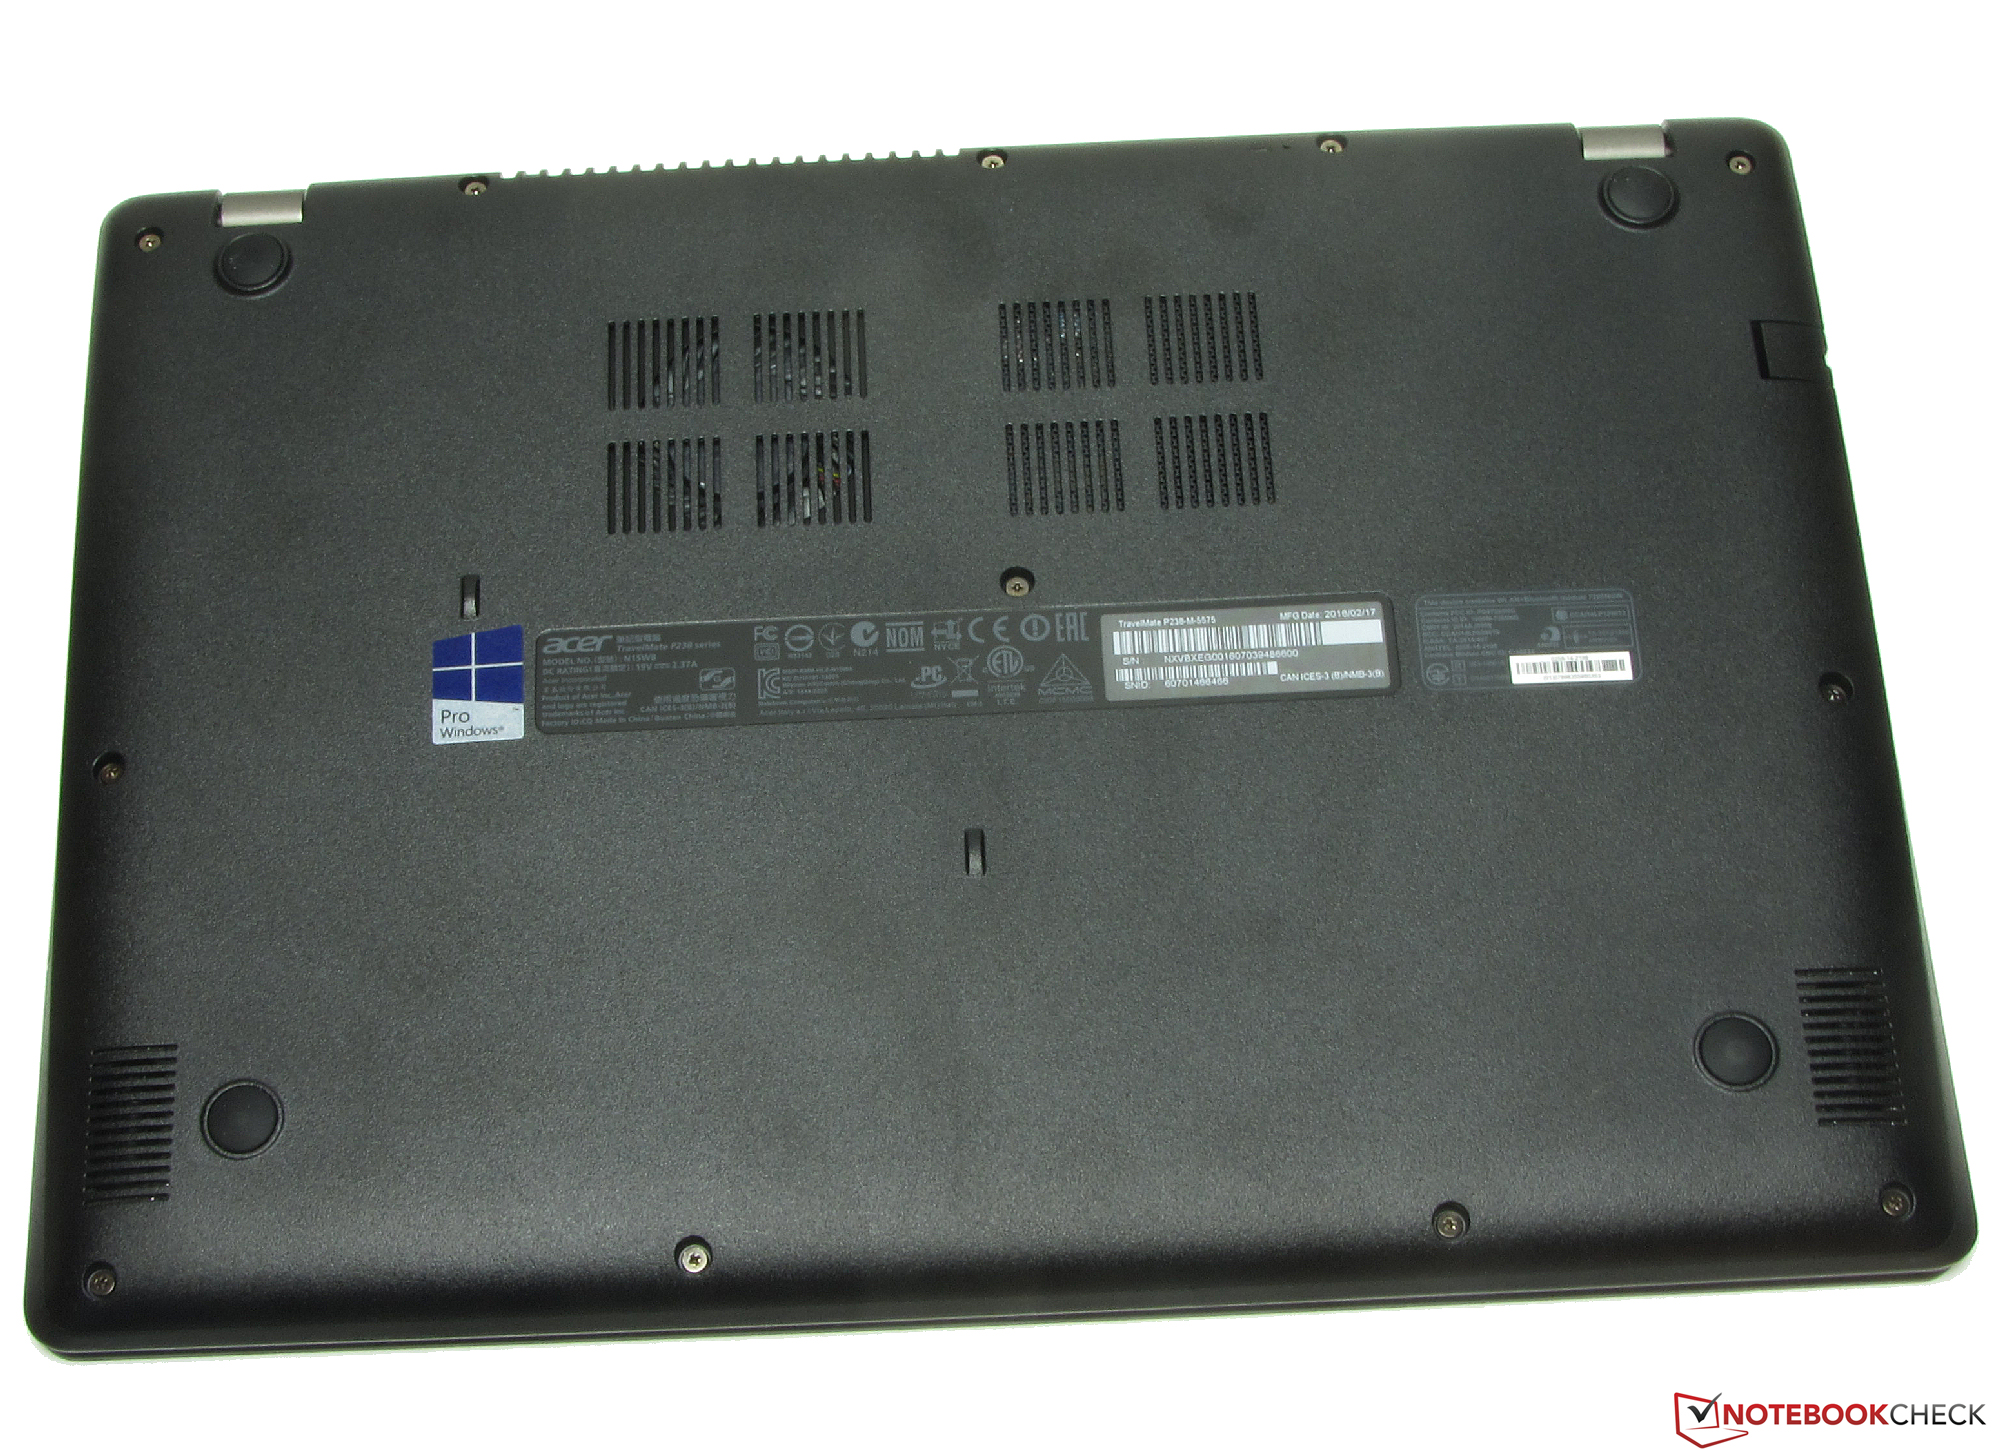
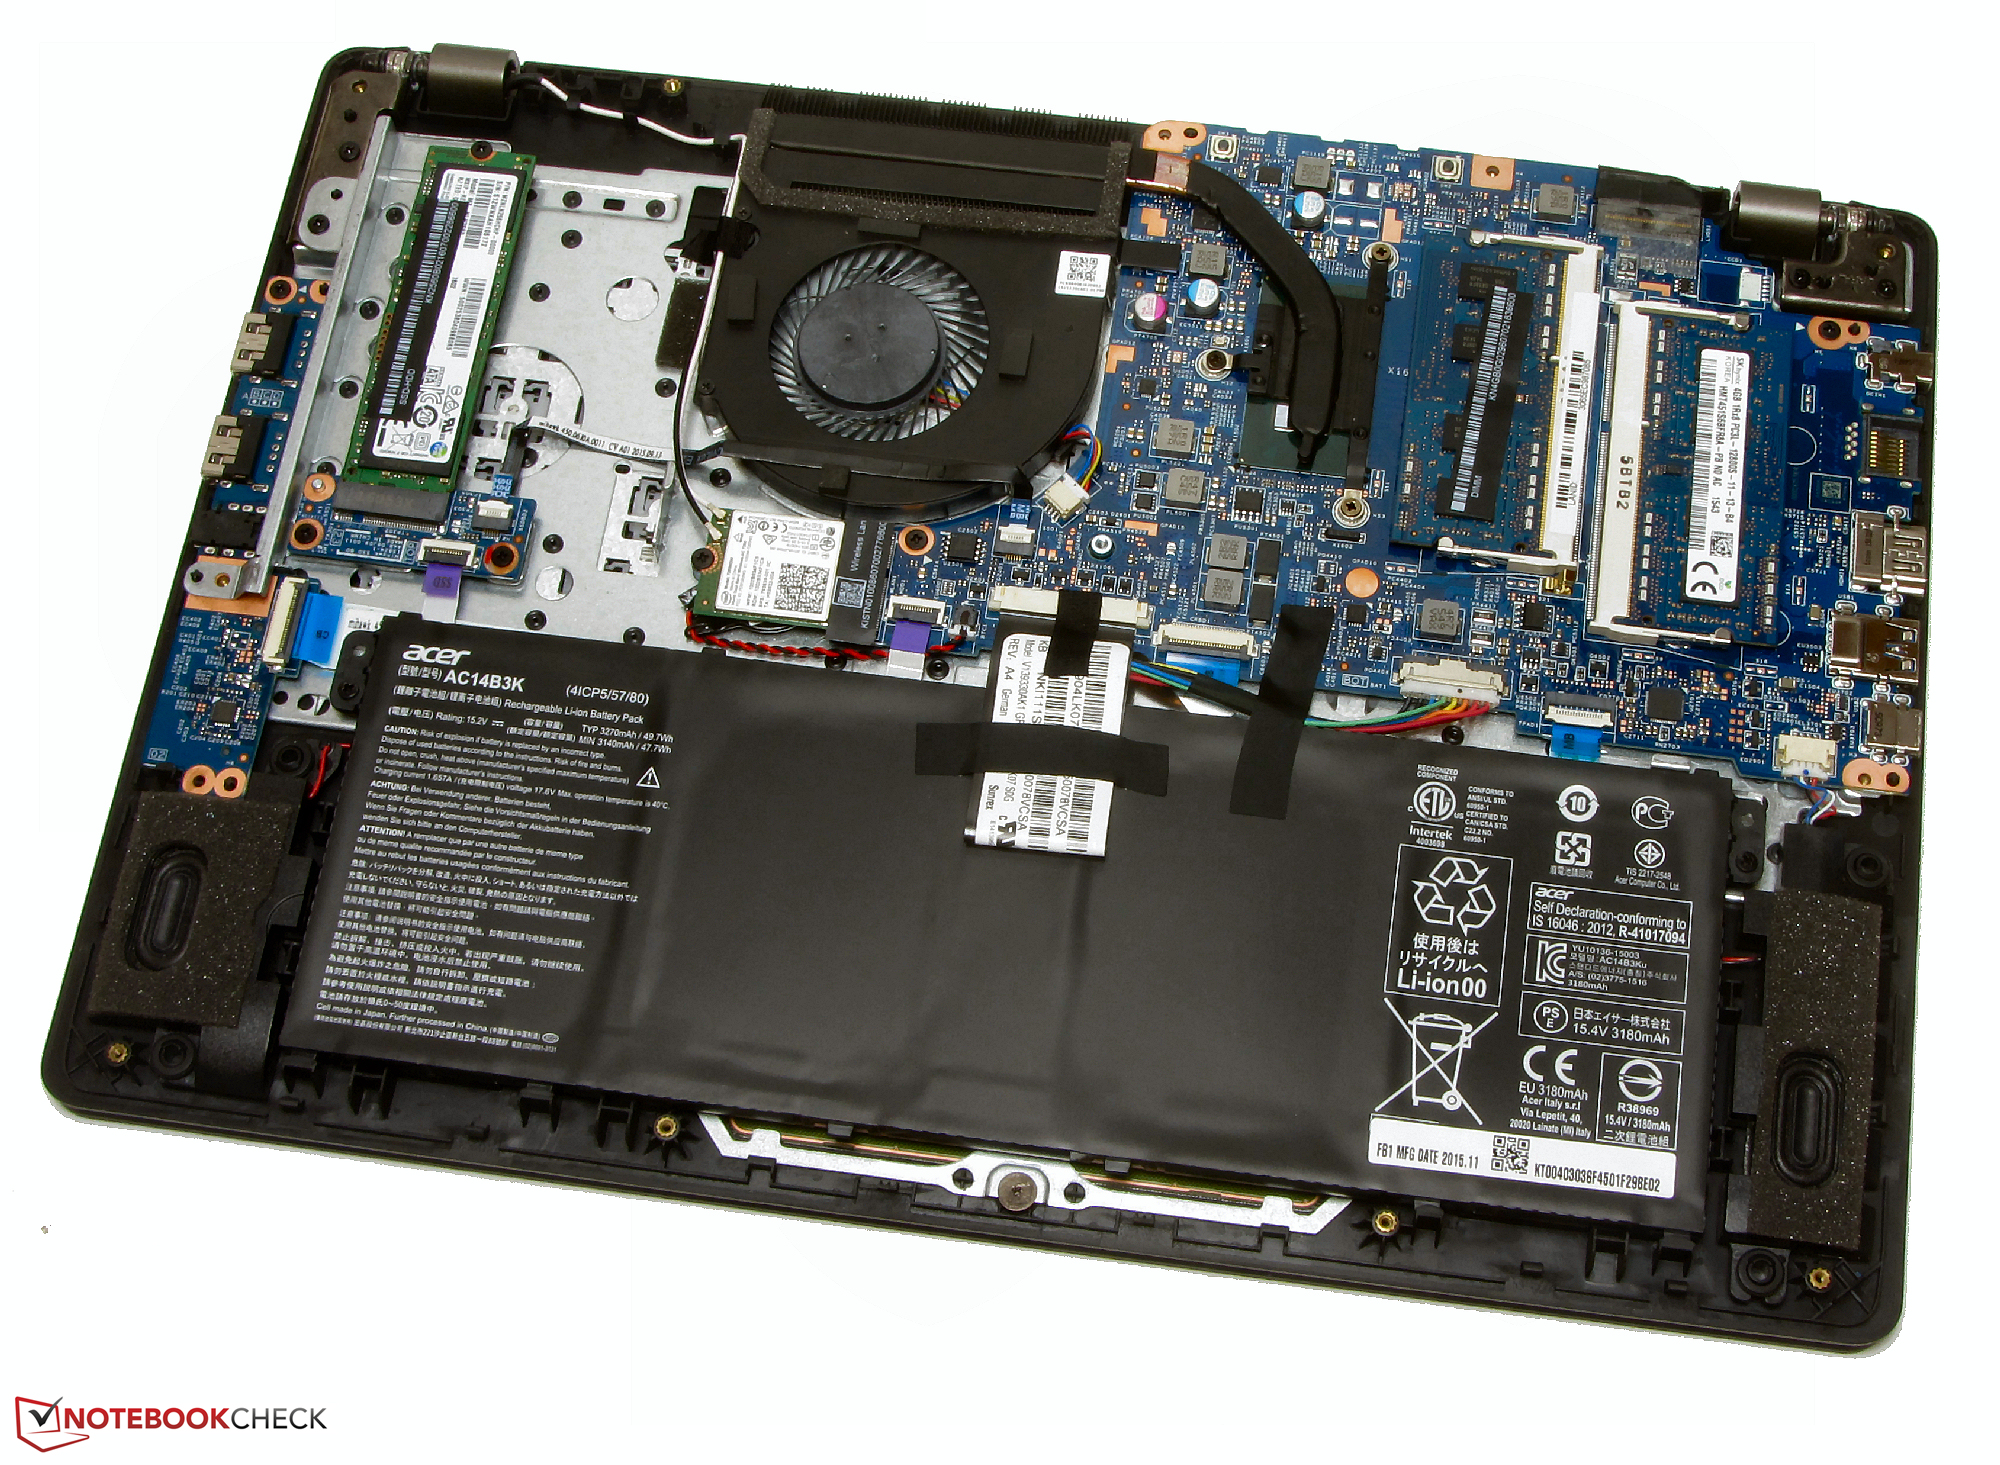
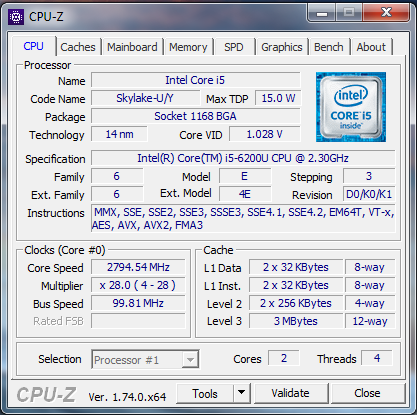
Le petit ultraportable d'Acer est livré avec un processeur Core i5 qui suffira dans la majorité des utilisations. La chauffe est à peine perceptible tout comme le ventilateur. Le SSD assure la réactivité du système. Son remplacement est possible mais difficile puisqu'il n'y a pas de trappe de maintenance.
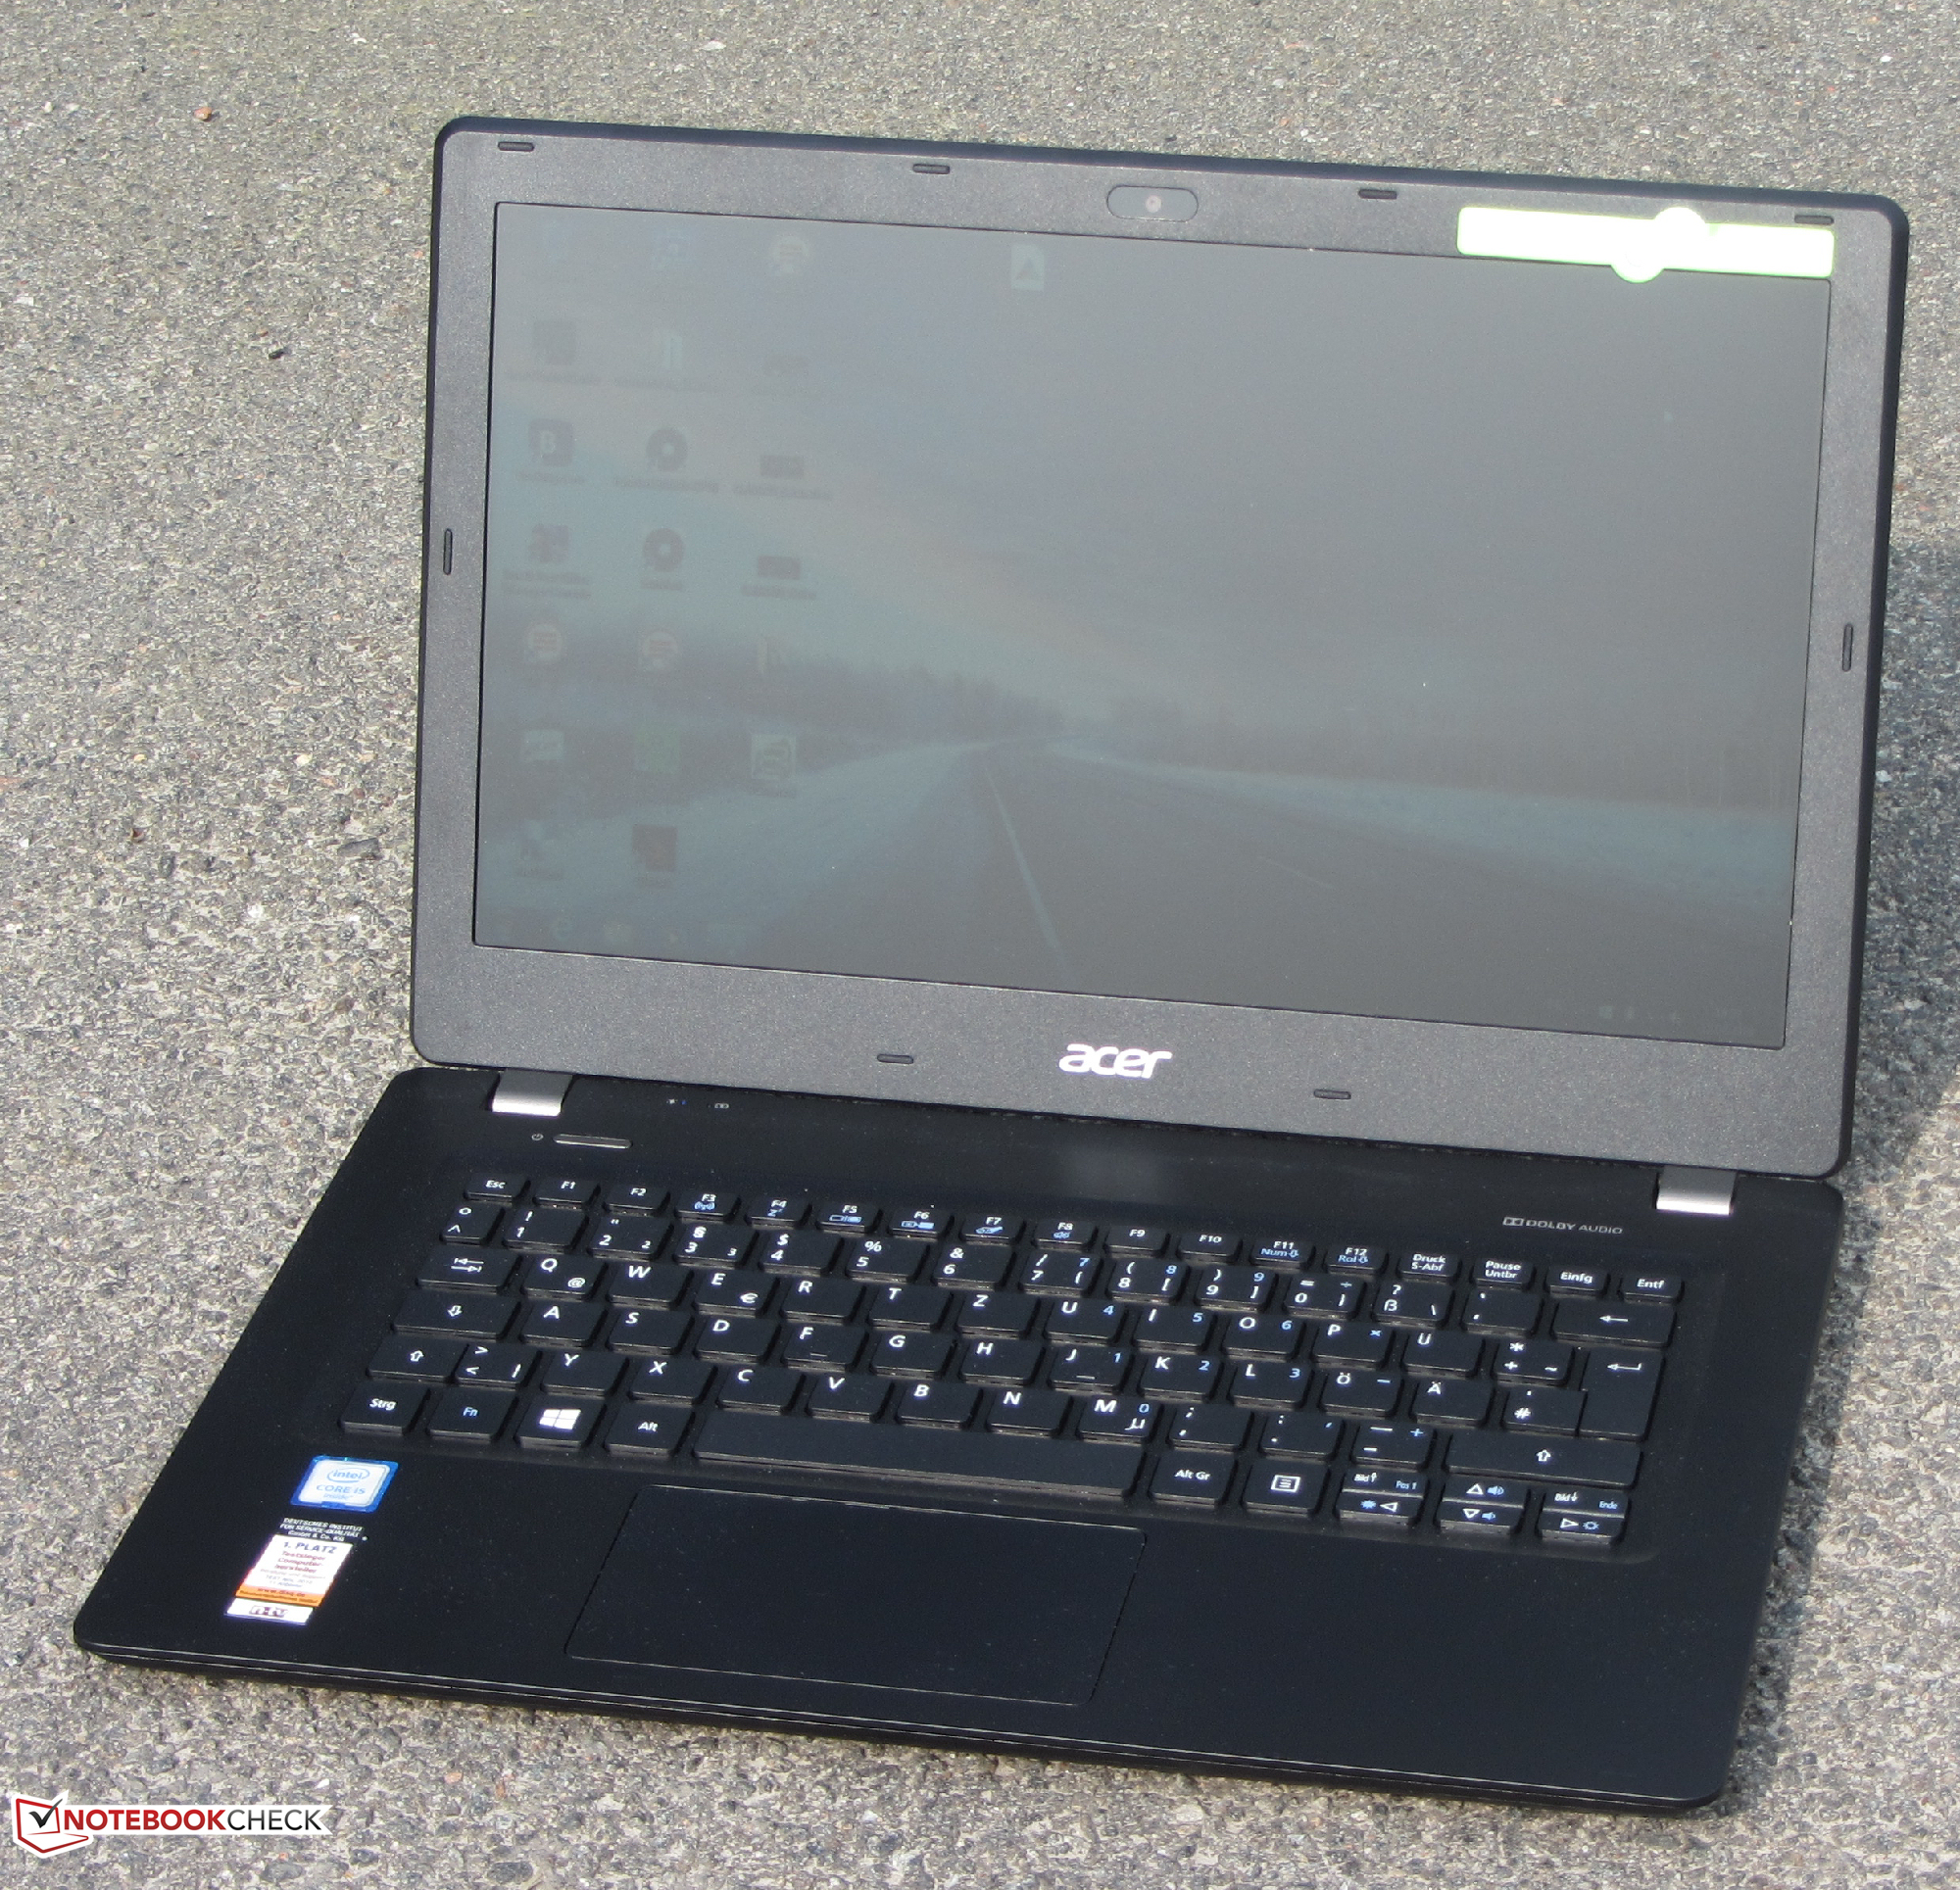
Avec le TravelMate P238-M, Acer aurait pu offrir au monde de l'entreprise un excellent ultraportable s'il n'avait pas fait des coupes au niveau du clavier ou de l'écran. Si vous êtes prêts à faire avec, alors vous tenez là un vrai marathonien parfaitement tailler pour les études ou un environnement professionnel nomade.
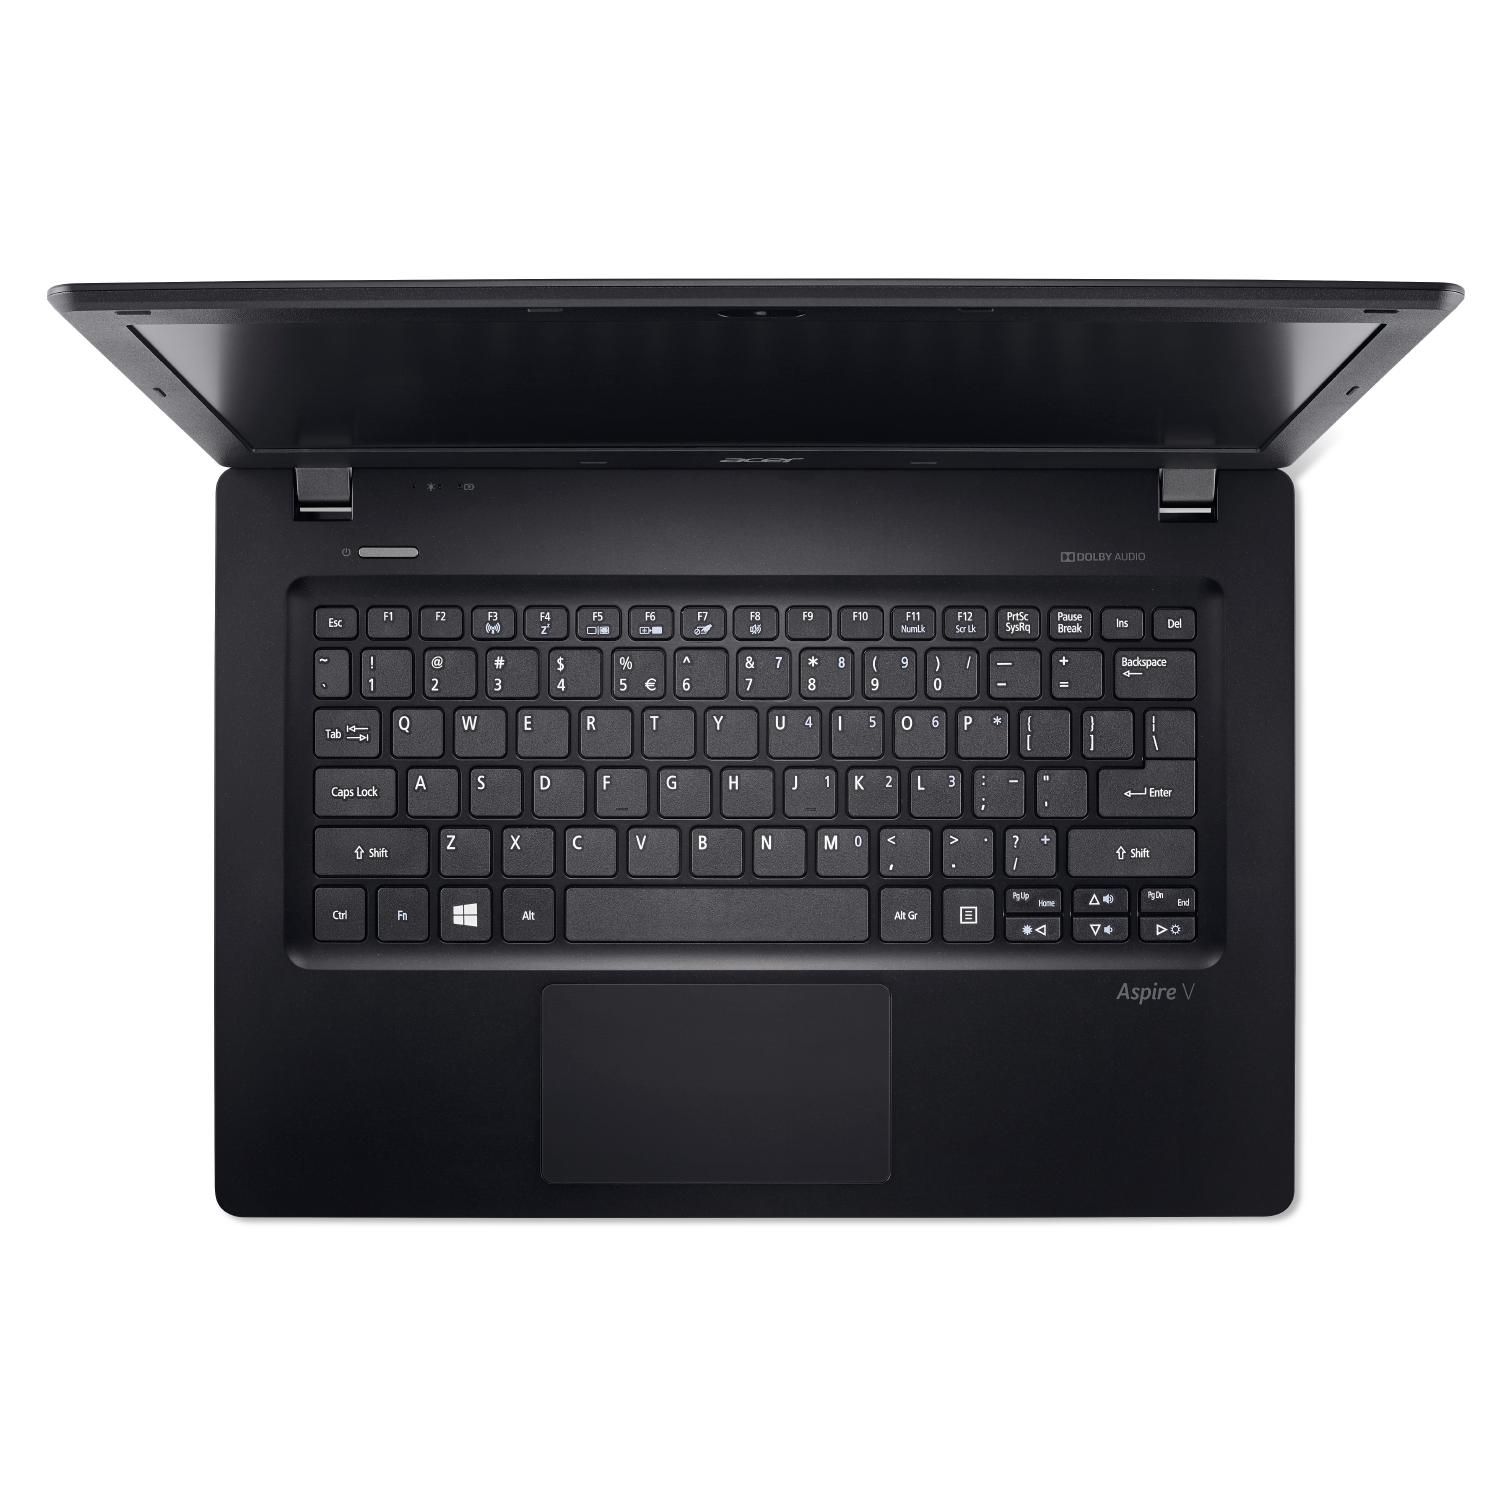
Acer a équipé son TravelMate d'un clavier correct mais loin d'être stellaire. A 750 euros, nous nous attendions à plus : le TravelMate est après tout une machine destinée au surf et au traitement de texte. L'écran ne remportera aucune distinction : sombre, il accuse des contrastes plutôt bas et des angles de vue trop fermés. Le Taïwanais aurait pu faire un effort à ce prix-là...
Pour plus de détails, vous trouverez la version complète (en anglais) de ce test ici.
Acer TravelMate P238-M-5575
-
04/21/2016 v5.1(old)
Sascha Mölck