 Deutsch
 English
 Español
 Français
 Italiano
 Nederlands
 Polski
 Português
 Русский
 Türkçe
 Svenska
 Chinese
 Magyar
Courte critique de l'Ultraportable Razer Blade Stealth


| |||||||||||||||||||||||||
Homogénéité de la luminosité: 93 %
Valeur mesurée au centre, sur batterie: 415 cd/m²
Contraste: 1343:1 (Valeurs des noirs: 0.309 cd/m²)
ΔE Color 3.78 | 0.5-29.43 Ø5
ΔE Greyscale 3.38 | 0.57-98 Ø5.3
99.3% sRGB (Argyll 1.6.3 3D)
85.1% AdobeRGB 1998 (Argyll 1.6.3 3D)
97.2% AdobeRGB 1998 (Argyll 2.2.0 3D)
99.2% sRGB (Argyll 2.2.0 3D)
83.7% Display P3 (Argyll 2.2.0 3D)
Gamma: 2.23
| Razer Blade Stealth UHD i7-6500U 12.50, 3840x2160 | Dell XPS 13 2016 i7 256GB QHD 13.30, 3200x1800 | Lenovo Yoga 900-13ISK 80MK 13.30, 3200x1800 | HP EliteBook Folio 1020 G1 12.50, 2560x1440 | Apple MacBook 12 (Early 2015) 1.1 GHz 12.00, 2304x1440 | Asus Zenbook UX303UB-DH74T 13.30, 3200x1800 | |
|---|---|---|---|---|---|---|
| Display | -21% | -23% | -17% | -17% | -26% | |
| Display P3 Coverage | 83.7 | 63.6 -24% | 63.2 -24% | 67.3 -20% | 67.6 -19% | 60.9 -27% |
| sRGB Coverage | 99.2 | 93.6 -6% | 88.7 -11% | 96.2 -3% | 95.6 -4% | 85.4 -14% |
| AdobeRGB 1998 Coverage | 97.2 | 65.5 -33% | 64.9 -33% | 68.9 -29% | 68.7 -29% | 62.5 -36% |
| Response Times | 29% | 40% | 18% | |||
| Response Time Grey 50% / Grey 80% * | 63.2 ? | 40 ? 37% | 38.8 ? 39% | 44.4 ? 30% | ||
| Response Time Black / White * | 38 ? | 30 ? 21% | 22.4 ? 41% | 36 ? 5% | ||
| PWM Frequency | 4900 ? | 1316 | 1389 | |||
| Screen | -14% | -31% | -12% | 7% | -55% | |
| Brightness middle | 415 | 285 -31% | 319.8 -23% | 306 -26% | 345 -17% | 291.4 -30% |
| Brightness | 399 | 281 -30% | 302 -24% | 297 -26% | 325 -19% | 270 -32% |
| Brightness Distribution | 93 | 90 -3% | 88 -5% | 80 -14% | 90 -3% | 84 -10% |
| Black Level * | 0.309 | 0.18 42% | 0.835 -170% | 0.3141 -2% | 0.324 -5% | 0.954 -209% |
| Contrast | 1343 | 1583 18% | 383 -71% | 974 -27% | 1065 -21% | 305 -77% |
| Colorchecker dE 2000 * | 3.78 | 4.89 -29% | 2.68 29% | 3.01 20% | 1.62 57% | 4.63 -22% |
| Colorchecker dE 2000 max. * | 7.2 | 2.51 65% | ||||
| Greyscale dE 2000 * | 3.38 | 5.16 -53% | 2.35 30% | 3.13 7% | 1.88 44% | 5.65 -67% |
| Gamma | 2.23 99% | 2.15 102% | 2.09 105% | 2.33 94% | 2.55 86% | 2.16 102% |
| CCT | 7329 89% | 7106 91% | 6975 93% | 6484 100% | 6411 101% | 6320 103% |
| Color Space (Percent of AdobeRGB 1998) | 85.1 | 59 -31% | 57 -33% | 62 -27% | 61.8 -27% | 55.2 -35% |
| Color Space (Percent of sRGB) | 99.3 | 93 -6% | 88 -11% | 95.5 -4% | 85.2 -14% | |
| Moyenne finale (programmes/paramètres) | -2% /
-9% | -5% /
-19% | -15% /
-13% | -5% /
1% | -21% /
-38% |
* ... Moindre est la valeur, meilleures sont les performances
Temps de réponse de l'écran
| ↔ Temps de réponse noir à blanc | ||
|---|---|---|
| 38 ms ... hausse ↗ et chute ↘ combinées | ↗ 8 ms hausse | 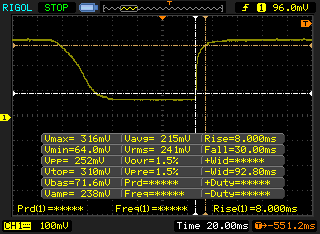 |
| ↘ 30 ms chute | ||
| L'écran souffre de latences très élevées, à éviter pour le jeu. En comparaison, tous les appareils testés affichent entre 0.1 (minimum) et 240 (maximum) ms. » 95 % des appareils testés affichent de meilleures performances. Cela signifie que les latences relevées sont moins bonnes que la moyenne (21.5 ms) de tous les appareils testés. | ||
| ↔ Temps de réponse gris 50% à gris 80% | ||
| 63.2 ms ... hausse ↗ et chute ↘ combinées | ↗ 27.6 ms hausse | 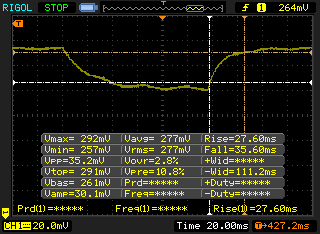 |
| ↘ 35.6 ms chute | ||
| L'écran souffre de latences très élevées, à éviter pour le jeu. En comparaison, tous les appareils testés affichent entre 0.2 (minimum) et 636 (maximum) ms. » 97 % des appareils testés affichent de meilleures performances. Cela signifie que les latences relevées sont moins bonnes que la moyenne (33.7 ms) de tous les appareils testés. | ||
Scintillement / MLI (Modulation de largeur d'impulsion)
| Scintillement / MLI (Modulation de largeur d'impulsion) non décelé | 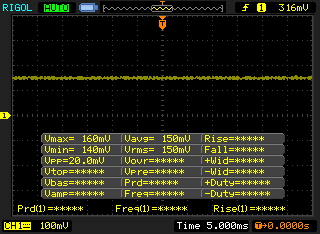 | ||
En comparaison, 53 % des appareils testés n'emploient pas MDI pour assombrir leur écran. Nous avons relevé une moyenne à 17924 (minimum : 5 - maximum : 3846000) Hz dans le cas où une MDI était active. | |||

* ... Moindre est la valeur, meilleures sont les performances
| PCMark 7 - Score (Classer selon les valeurs) | |
| Razer Blade Stealth UHD i7-6500U | |
| Dell XPS 13 9350 WQXGA | |
| Lenovo Yoga 900-13ISK 80MK | |
| Asus Zenbook UX303UB-DH74T | |
| HP EliteBook Folio 1020 G1 | |
| PCMark 7 Score | 5197 points | |
| PCMark 8 Home Score Accelerated v2 | 2868 points | |
| PCMark 8 Creative Score Accelerated v2 | 3795 points | |
| PCMark 8 Work Score Accelerated v2 | 3603 points | |
Aide | ||

| Razer Blade Stealth UHD i7-6500U HD Graphics 520, 6500U, Samsung PM951 NVMe MZ-VLV256D | Dell XPS 13 9350 WQXGA Iris Graphics 540, 6560U, Samsung PM951 NVMe 512 GB | Lenovo Yoga 900-13ISK 80MK HD Graphics 520, 6500U, Samsung SSD PM871 MZNLN512HCJH | HP EliteBook Folio 1020 G1 HD Graphics 5300, 5Y51, Samsung PM851 Series MZMTE256HMHP | Apple MacBook 12 (Early 2015) 1.1 GHz HD Graphics 5300, 5Y31, Apple SSD AP0256 | Asus Zenbook UX303UB-DH74T GeForce 940M, 6500U, CUK Cyclone SSD 1TB | |
|---|---|---|---|---|---|---|
| AS SSD | 64% | -12% | -46% | -48% | -31% | |
| Copy Game MB/s | 289.2 | 753 160% | 298.7 3% | 176.7 -39% | 392.8 36% | |
| Copy Program MB/s | 224.3 | 271.8 21% | 249.6 11% | 158.3 -29% | 233.7 4% | |
| Copy ISO MB/s | 304 | 1041 242% | 364.5 20% | 258.7 -15% | 464.3 53% | 382.5 26% |
| Score Total | 1898 | 3158 66% | 1129 -41% | 931 -51% | 1556 -18% | 882 -54% |
| Score Write | 418 | 664 59% | 429 3% | 275 -34% | 168 -60% | 373 -11% |
| Score Read | 1010 | 1679 66% | 458 -55% | 438 -57% | 927 -8% | 333 -67% |
| Access Time Write * | 0.034 | 0.031 9% | 0.039 -15% | 0.044 -29% | 0.051 -50% | |
| Access Time Read * | 0.055 | 0.046 16% | 0.054 2% | 0.137 -149% | 0.228 -315% | 0.14 -155% |
| 4K-64 Write | 280.8 | 492 75% | 303 8% | 174.1 -38% | 94.4 -66% | 261.1 -7% |
| 4K-64 Read | 835 | 1497 79% | 374.8 -55% | 361.1 -57% | 838 0% | 256.9 -69% |
| 4K Write | 108.1 | 116.5 8% | 80.6 -25% | 77.9 -28% | 26.26 -76% | 71.3 -34% |
| 4K Read | 38.03 | 38.29 1% | 32.29 -15% | 26.13 -31% | 17.55 -54% | 25.99 -32% |
| Seq Write | 295 | 559 89% | 454.6 54% | 229.5 -22% | 475.8 61% | 409.8 39% |
| Seq Read | 1371 | 1442 5% | 505 -63% | 507 -63% | 716 -48% | 505 -63% |
* ... Moindre est la valeur, meilleures sont les performances
| 3DMark 11 | |
| 1280x720 Performance (Classer selon les valeurs) | |
| Razer Blade Stealth UHD i7-6500U | |
| Dell XPS 13 9350 WQXGA | |
| MSI GT72 | |
| Lenovo ThinkPad Yoga 12 20DK002EPB | |
| Fujitsu LifeBook E554 | |
| HP EliteBook 840 G1 | |
| 1280x720 Performance GPU (Classer selon les valeurs) | |
| Razer Blade Stealth UHD i7-6500U | |
| Dell XPS 13 9350 WQXGA | |
| MSI GT72 | |
| Lenovo ThinkPad Yoga 12 20DK002EPB | |
| Fujitsu LifeBook E554 | |
| HP EliteBook 840 G1 | |
| 3DMark 11 Performance | 1504 points | |
| 3DMark Ice Storm Standard Score | 42940 points | |
| 3DMark Cloud Gate Standard Score | 5196 points | |
| 3DMark Fire Strike Score | 816 points | |
| 3DMark Fire Strike Extreme Score | 369 points | |
Aide | ||
| StarCraft II: Heart of the Swarm | |
| 1366x768 Medium | |
| Microsoft Surface Book Core i5 | |
| Razer Blade Stealth UHD i7-6500U | |
| Asus Q302LA-BHI | |
| Toshiba Tecra A50-C1510W10 | |
| 1366x768 High AA:on | |
| Microsoft Surface Book Core i5 | |
| Razer Blade Stealth UHD i7-6500U | |
| Asus Q302LA-BHI | |
| Toshiba Tecra A50-C1510W10 | |
| Bas | Moyen | Élevé | Ultra | |
| Tomb Raider (2013) | 68 | 35.1 | 23.5 | |
| StarCraft II: Heart of the Swarm (2013) | 171.9 | 58 | 31.4 | 17.6 |
| Thief (2014) | 25.3 | 15 |
| Razer Blade Stealth UHD i7-6500U HD Graphics 520, 6500U, Samsung PM951 NVMe MZ-VLV256D | Dell XPS 13 2016 i7 256GB QHD HD Graphics 520, 6500U, Samsung PM951 NVMe MZ-VLV256D | Lenovo Yoga 900-13ISK 80MK HD Graphics 520, 6500U, Samsung SSD PM871 MZNLN512HCJH | Asus Zenbook UX303UB-R4100T GeForce 940M, 6500U, Micron M600 MTFDDAK512MBF | Toshiba Satellite Radius 12 P20W-C-106 HD Graphics 520, 6500U, Samsung SSD PM871 MZNLN256HCHP | Acer Aspire R13 R7-372T HD Graphics 520, 6200U, 2x Hynix HFS128G39MND M.2 (RAID 0) | |
|---|---|---|---|---|---|---|
| Noise | -6% | -0% | -6% | -12% | -9% | |
| off / environment * | 28.9 | 31.3 -8% | ||||
| Idle Minimum * | 29.3 | 31.8 -9% | 29.7 -1% | 31.5 -8% | 32.5 -11% | 31.5 -8% |
| Idle Average * | 29.3 | 31.8 -9% | 29.8 -2% | 31.5 -8% | 32.6 -11% | 31.5 -8% |
| Idle Maximum * | 29.3 | 34.8 -19% | 30 -2% | 31.5 -8% | 32.6 -11% | 31.7 -8% |
| Load Average * | 33.1 | 34.8 -5% | 32 3% | 35.9 -8% | 41 -24% | 39.7 -20% |
| Load Maximum * | 38.8 | 34.8 10% | 38.5 1% | 38.2 2% | 41 -6% | 39.4 -2% |
* ... Moindre est la valeur, meilleures sont les performances
Degré de la nuisance sonore
| Au repos |
| 29.3 / 29.3 / 29.3 dB(A) |
| Fortement sollicité |
| 33.1 / 38.8 dB(A) |
 | ||
30 dB silencieux 40 dB(A) audible 50 dB(A) bruyant |
||
min: | ||
(-) La température maximale du côté supérieur est de 47.1 °C / 117 F, par rapport à la moyenne de 35.9 °C / 97 F, allant de 21.4 à 59 °C pour la classe Subnotebook.
(-) Le fond chauffe jusqu'à un maximum de 55.4 °C / 132 F, contre une moyenne de 39.4 °C / 103 F
(+) En utilisation inactive, la température moyenne du côté supérieur est de 25.5 °C / 78 F, par rapport à la moyenne du dispositif de 30.7 °C / 87 F.
(+) Les repose-poignets et le pavé tactile atteignent la température maximale de la peau (35.6 °C / 96.1 F) et ne sont donc pas chauds.
(-) La température moyenne de la zone de l'appui-paume de dispositifs similaires était de 28.3 °C / 82.9 F (-7.3 °C / #-13.2 F).
| Éteint/en veille | |
| Au repos | |
| Fortement sollicité |
|
| Razer Blade Stealth UHD i7-6500U HD Graphics 520, 6500U, Samsung PM951 NVMe MZ-VLV256D | Dell XPS 13 2016 i7 256GB QHD HD Graphics 520, 6500U, Samsung PM951 NVMe MZ-VLV256D | HP EliteBook Folio 1020 G1 HD Graphics 5300, 5Y51, Samsung PM851 Series MZMTE256HMHP | Apple MacBook 12 (Early 2015) 1.1 GHz HD Graphics 5300, 5Y31, Apple SSD AP0256 | Asus Zenbook UX303UB-R4100T GeForce 940M, 6500U, Micron M600 MTFDDAK512MBF | Microsoft Surface Pro 4, Core i5, 128GB HD Graphics 520, 6300U, Samsung MZFLV128 NVMe | |
|---|---|---|---|---|---|---|
| Power Consumption | 23% | 55% | 55% | 17% | 42% | |
| Idle Minimum * | 9 | 6.8 24% | 3.4 62% | 1.7 81% | 3.2 64% | 4.4 51% |
| Idle Average * | 12.8 | 10 22% | 6.7 48% | 5.3 59% | 7.6 41% | 9 30% |
| Idle Maximum * | 16.8 | 10.5 37% | 7.5 55% | 6 64% | 8 52% | 10.7 36% |
| Load Average * | 35.7 | 30.2 15% | 14.6 59% | 18.5 48% | 47 -32% | 19.6 45% |
| Load Maximum * | 39.3 | 33.6 15% | 18.4 53% | 29.3 25% | 55 -40% | 19.9 49% |
* ... Moindre est la valeur, meilleures sont les performances
| Razer Blade Stealth UHD i7-6500U 45 Wh | Dell XPS 13 9350 WQXGA 56 Wh | Lenovo Yoga 900-13ISK 80MK 66 Wh | HP EliteBook Folio 1020 G1 36 Wh | Apple MacBook 12 (Early 2015) 1.1 GHz 40 Wh | Asus Zenbook UX303UB-R4100T 50 Wh | |
|---|---|---|---|---|---|---|
| Autonomie de la batterie | 47% | 79% | 83% | 142% | 88% | |
| Reader / Idle | 437 | 604 38% | 844 93% | 660 51% | 1407 222% | 997 128% |
| WiFi v1.3 | 228 | 311 36% | 403 77% | 412 81% | 456 100% | 410 80% |
| Load | 76 | 128 68% | 128 68% | 164 116% | 155 104% | 118 55% |
Points positifs
Points négatifs

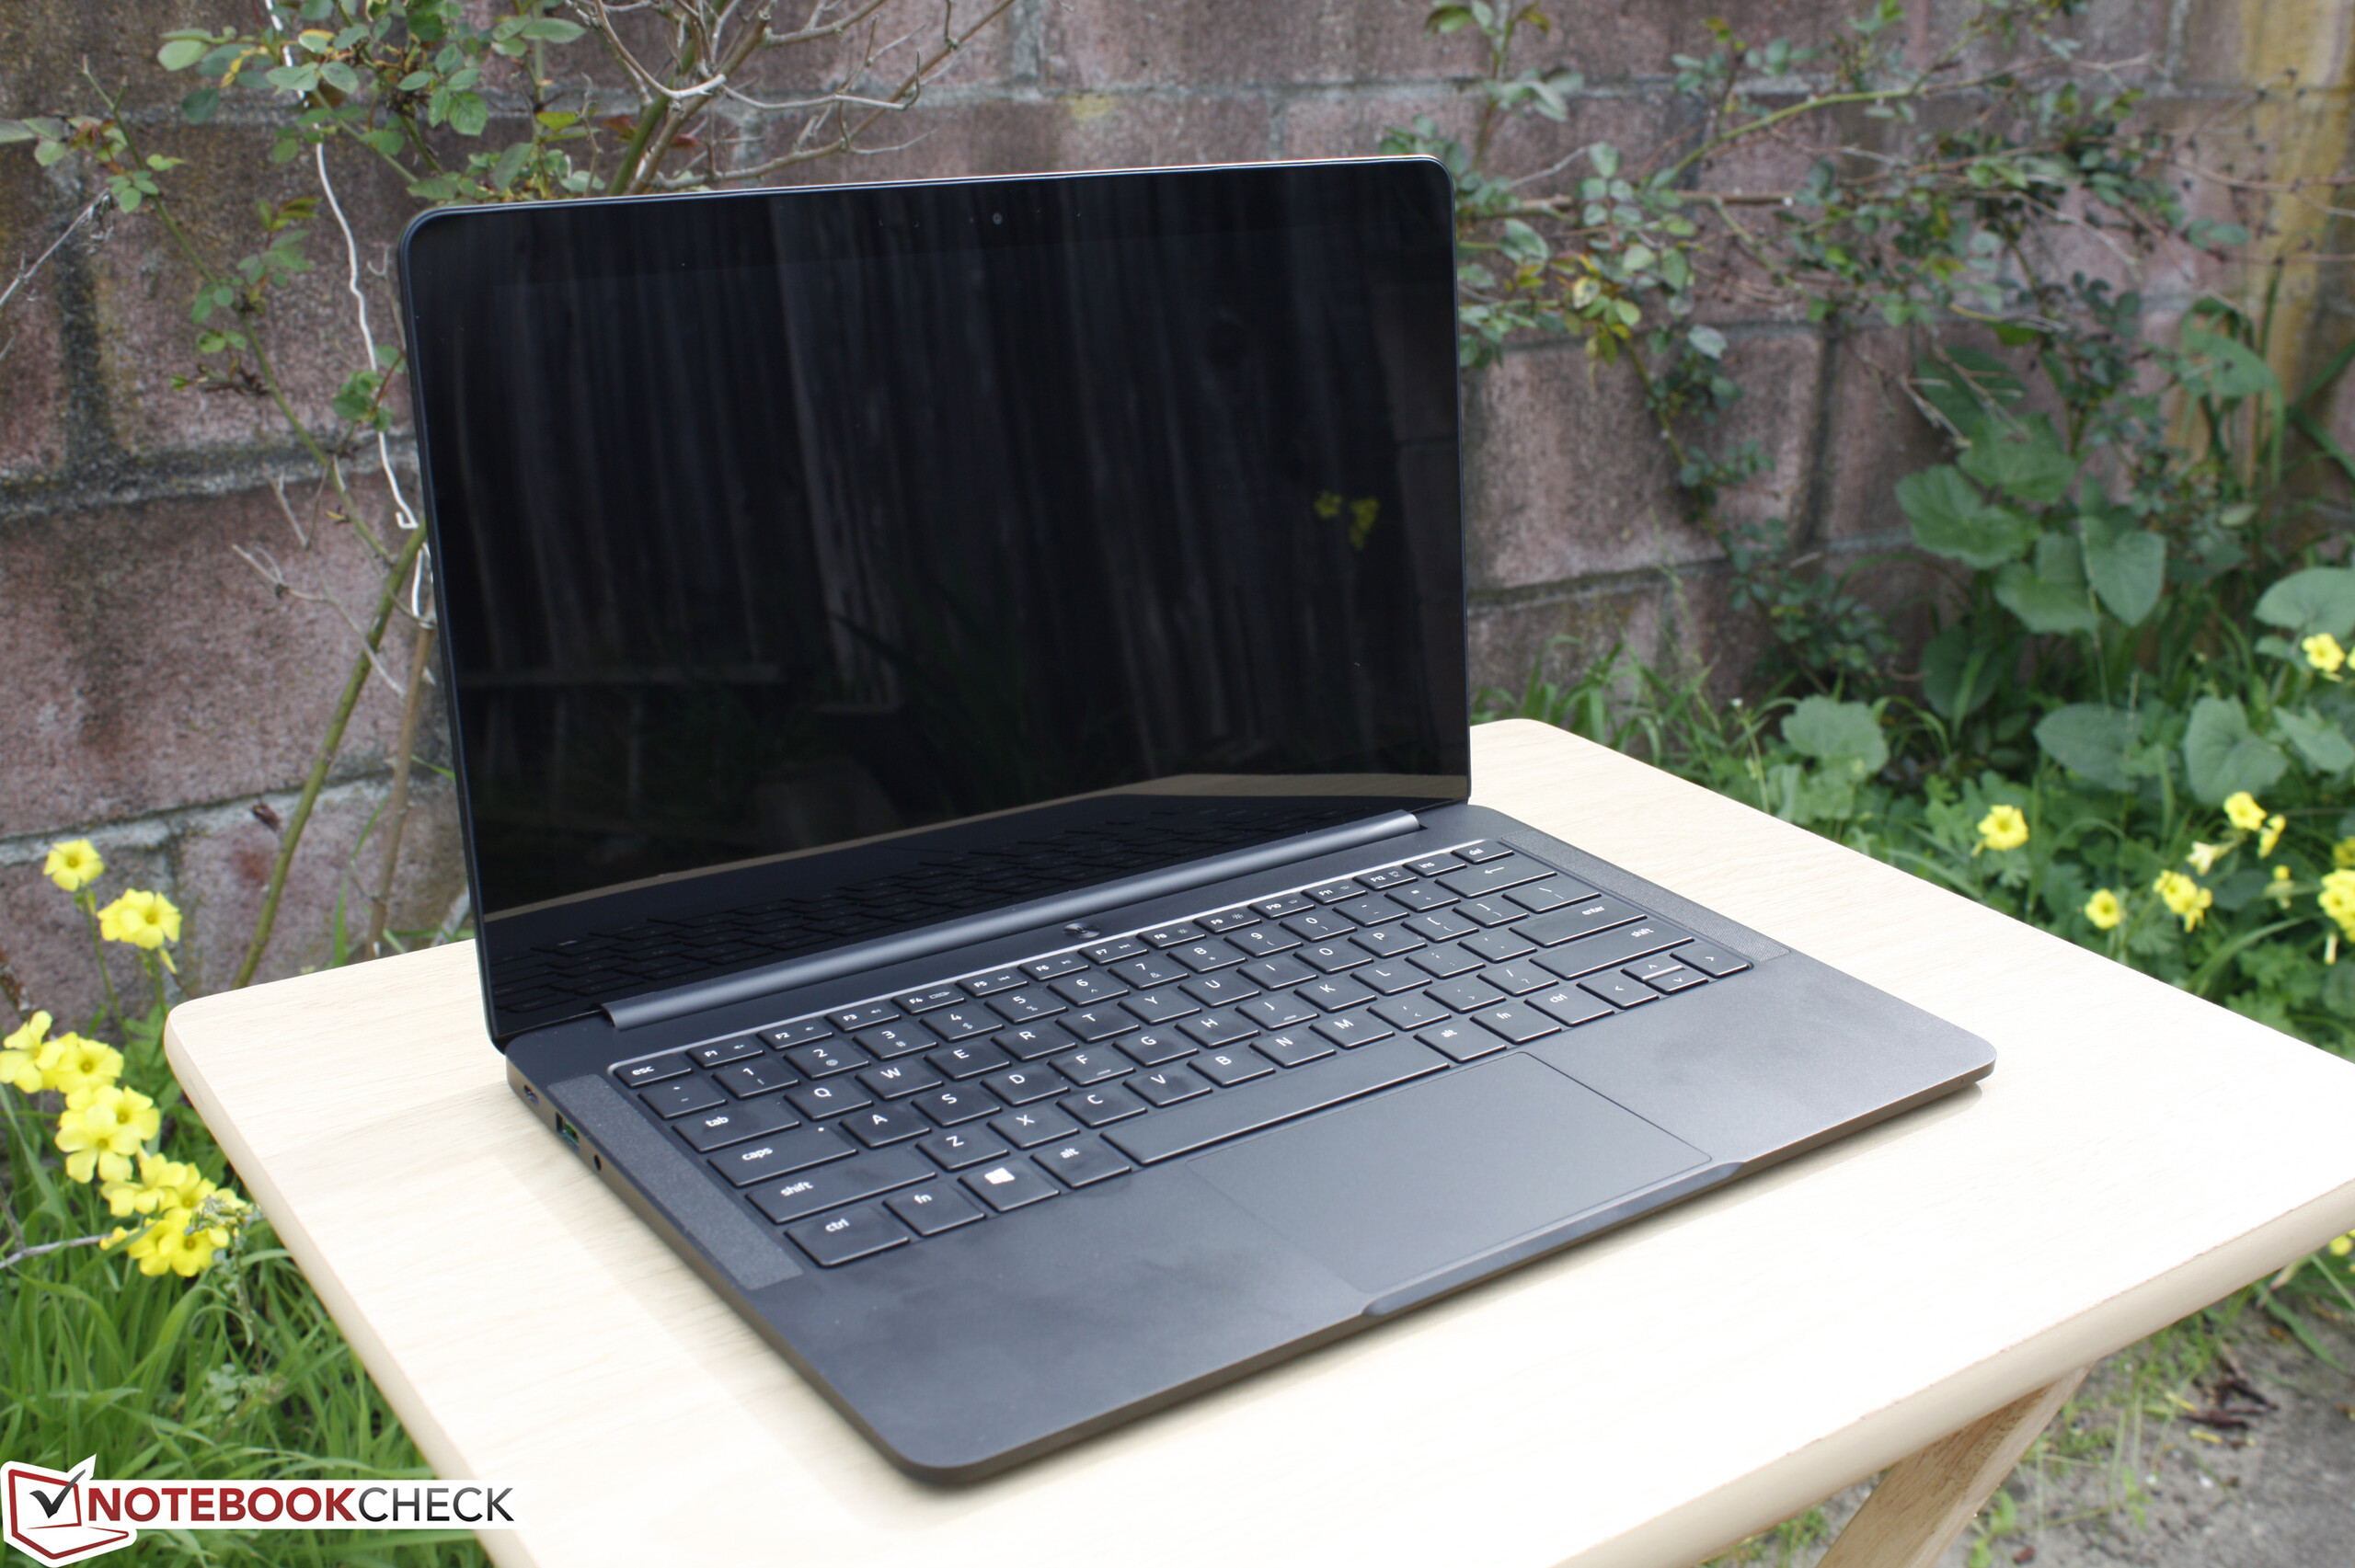
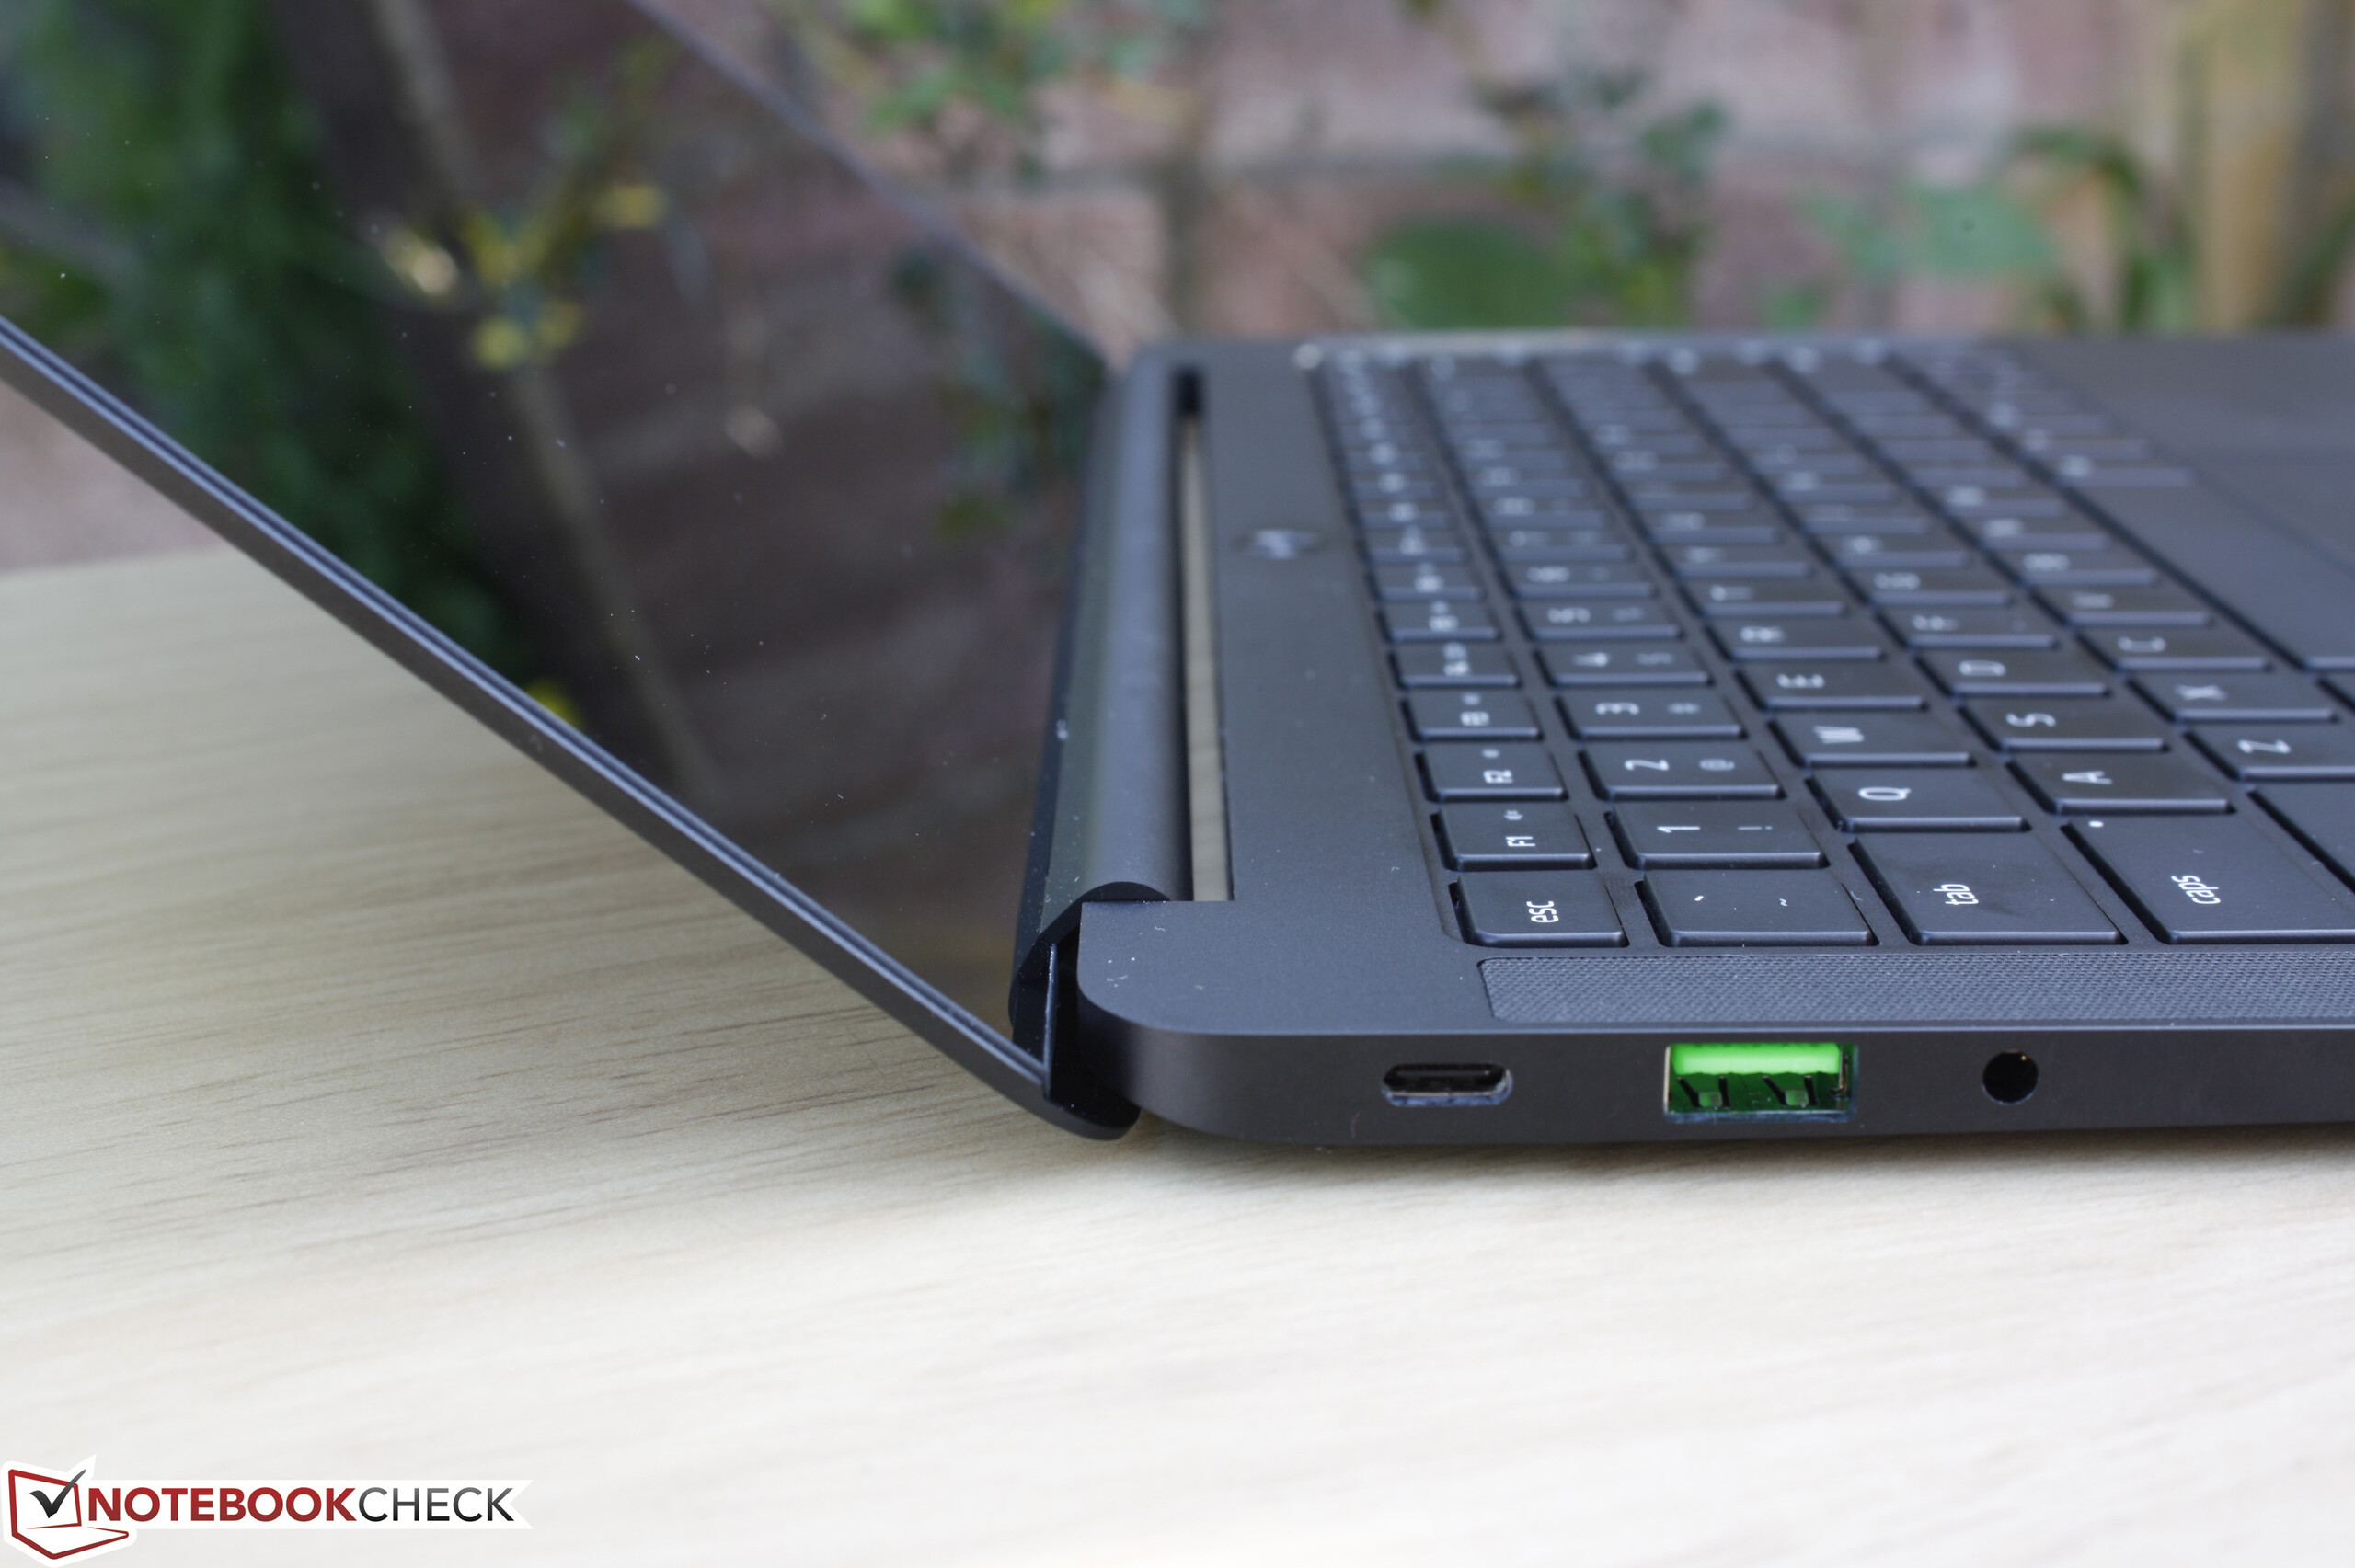
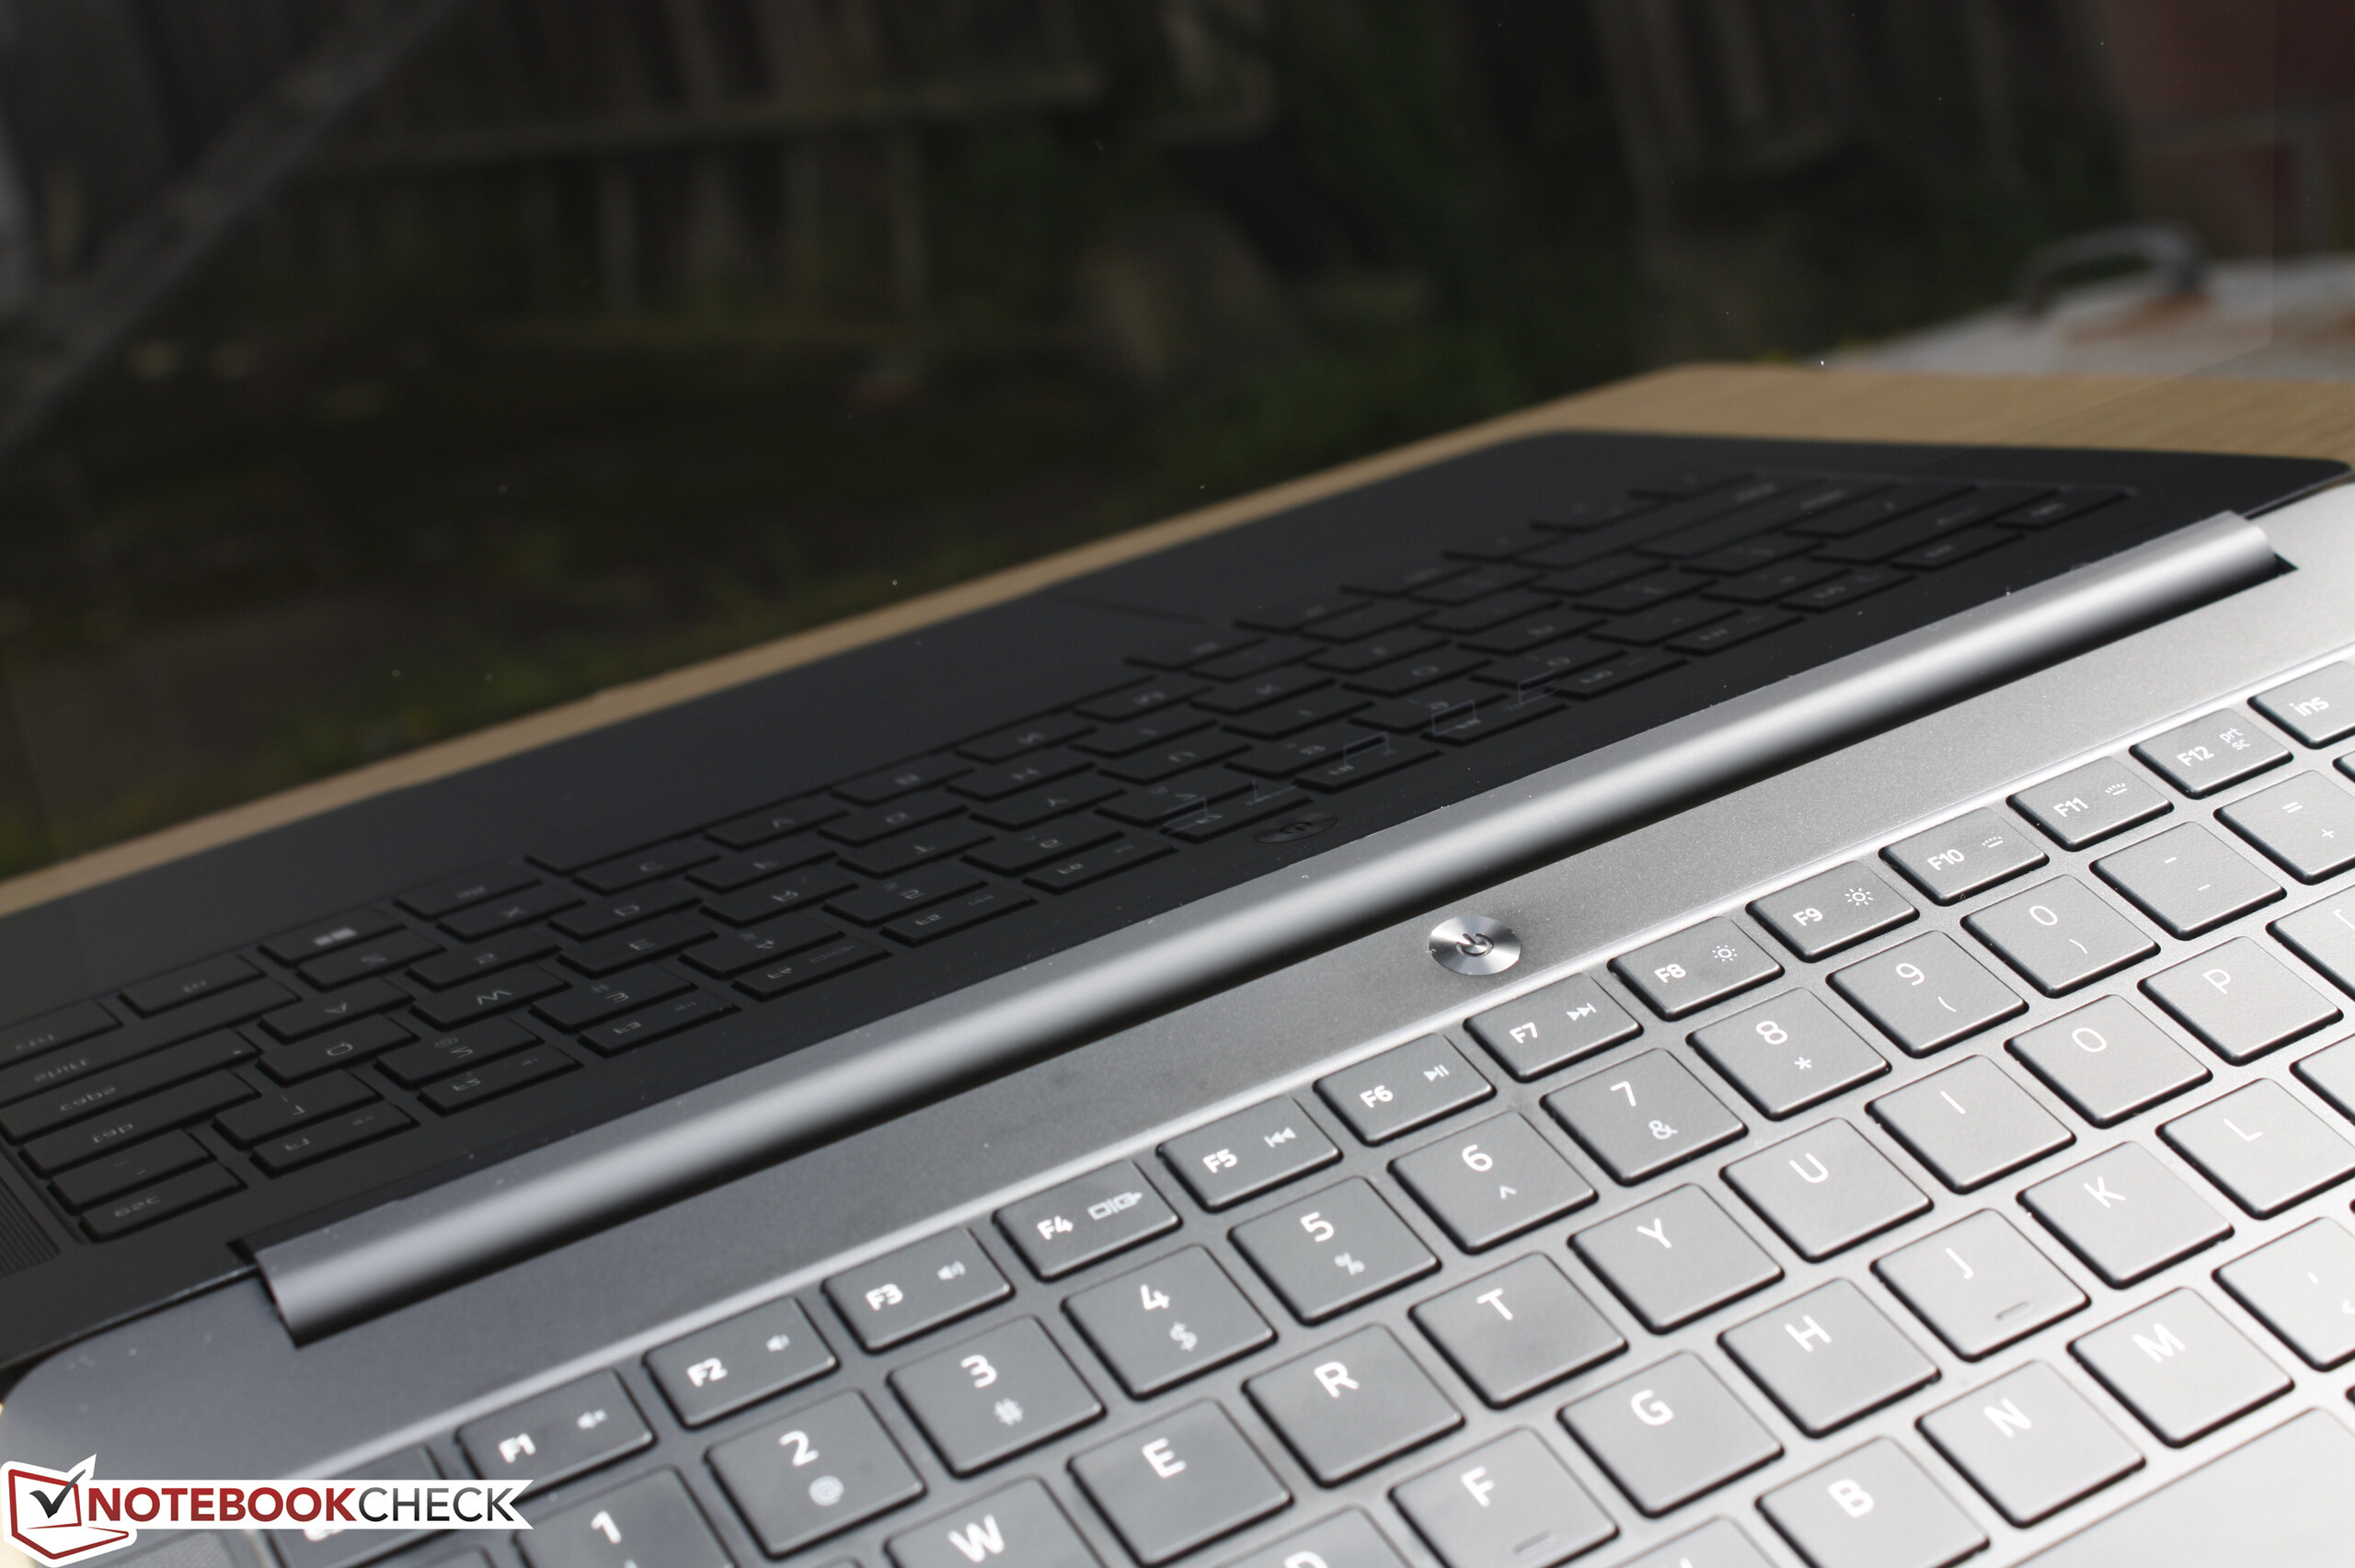
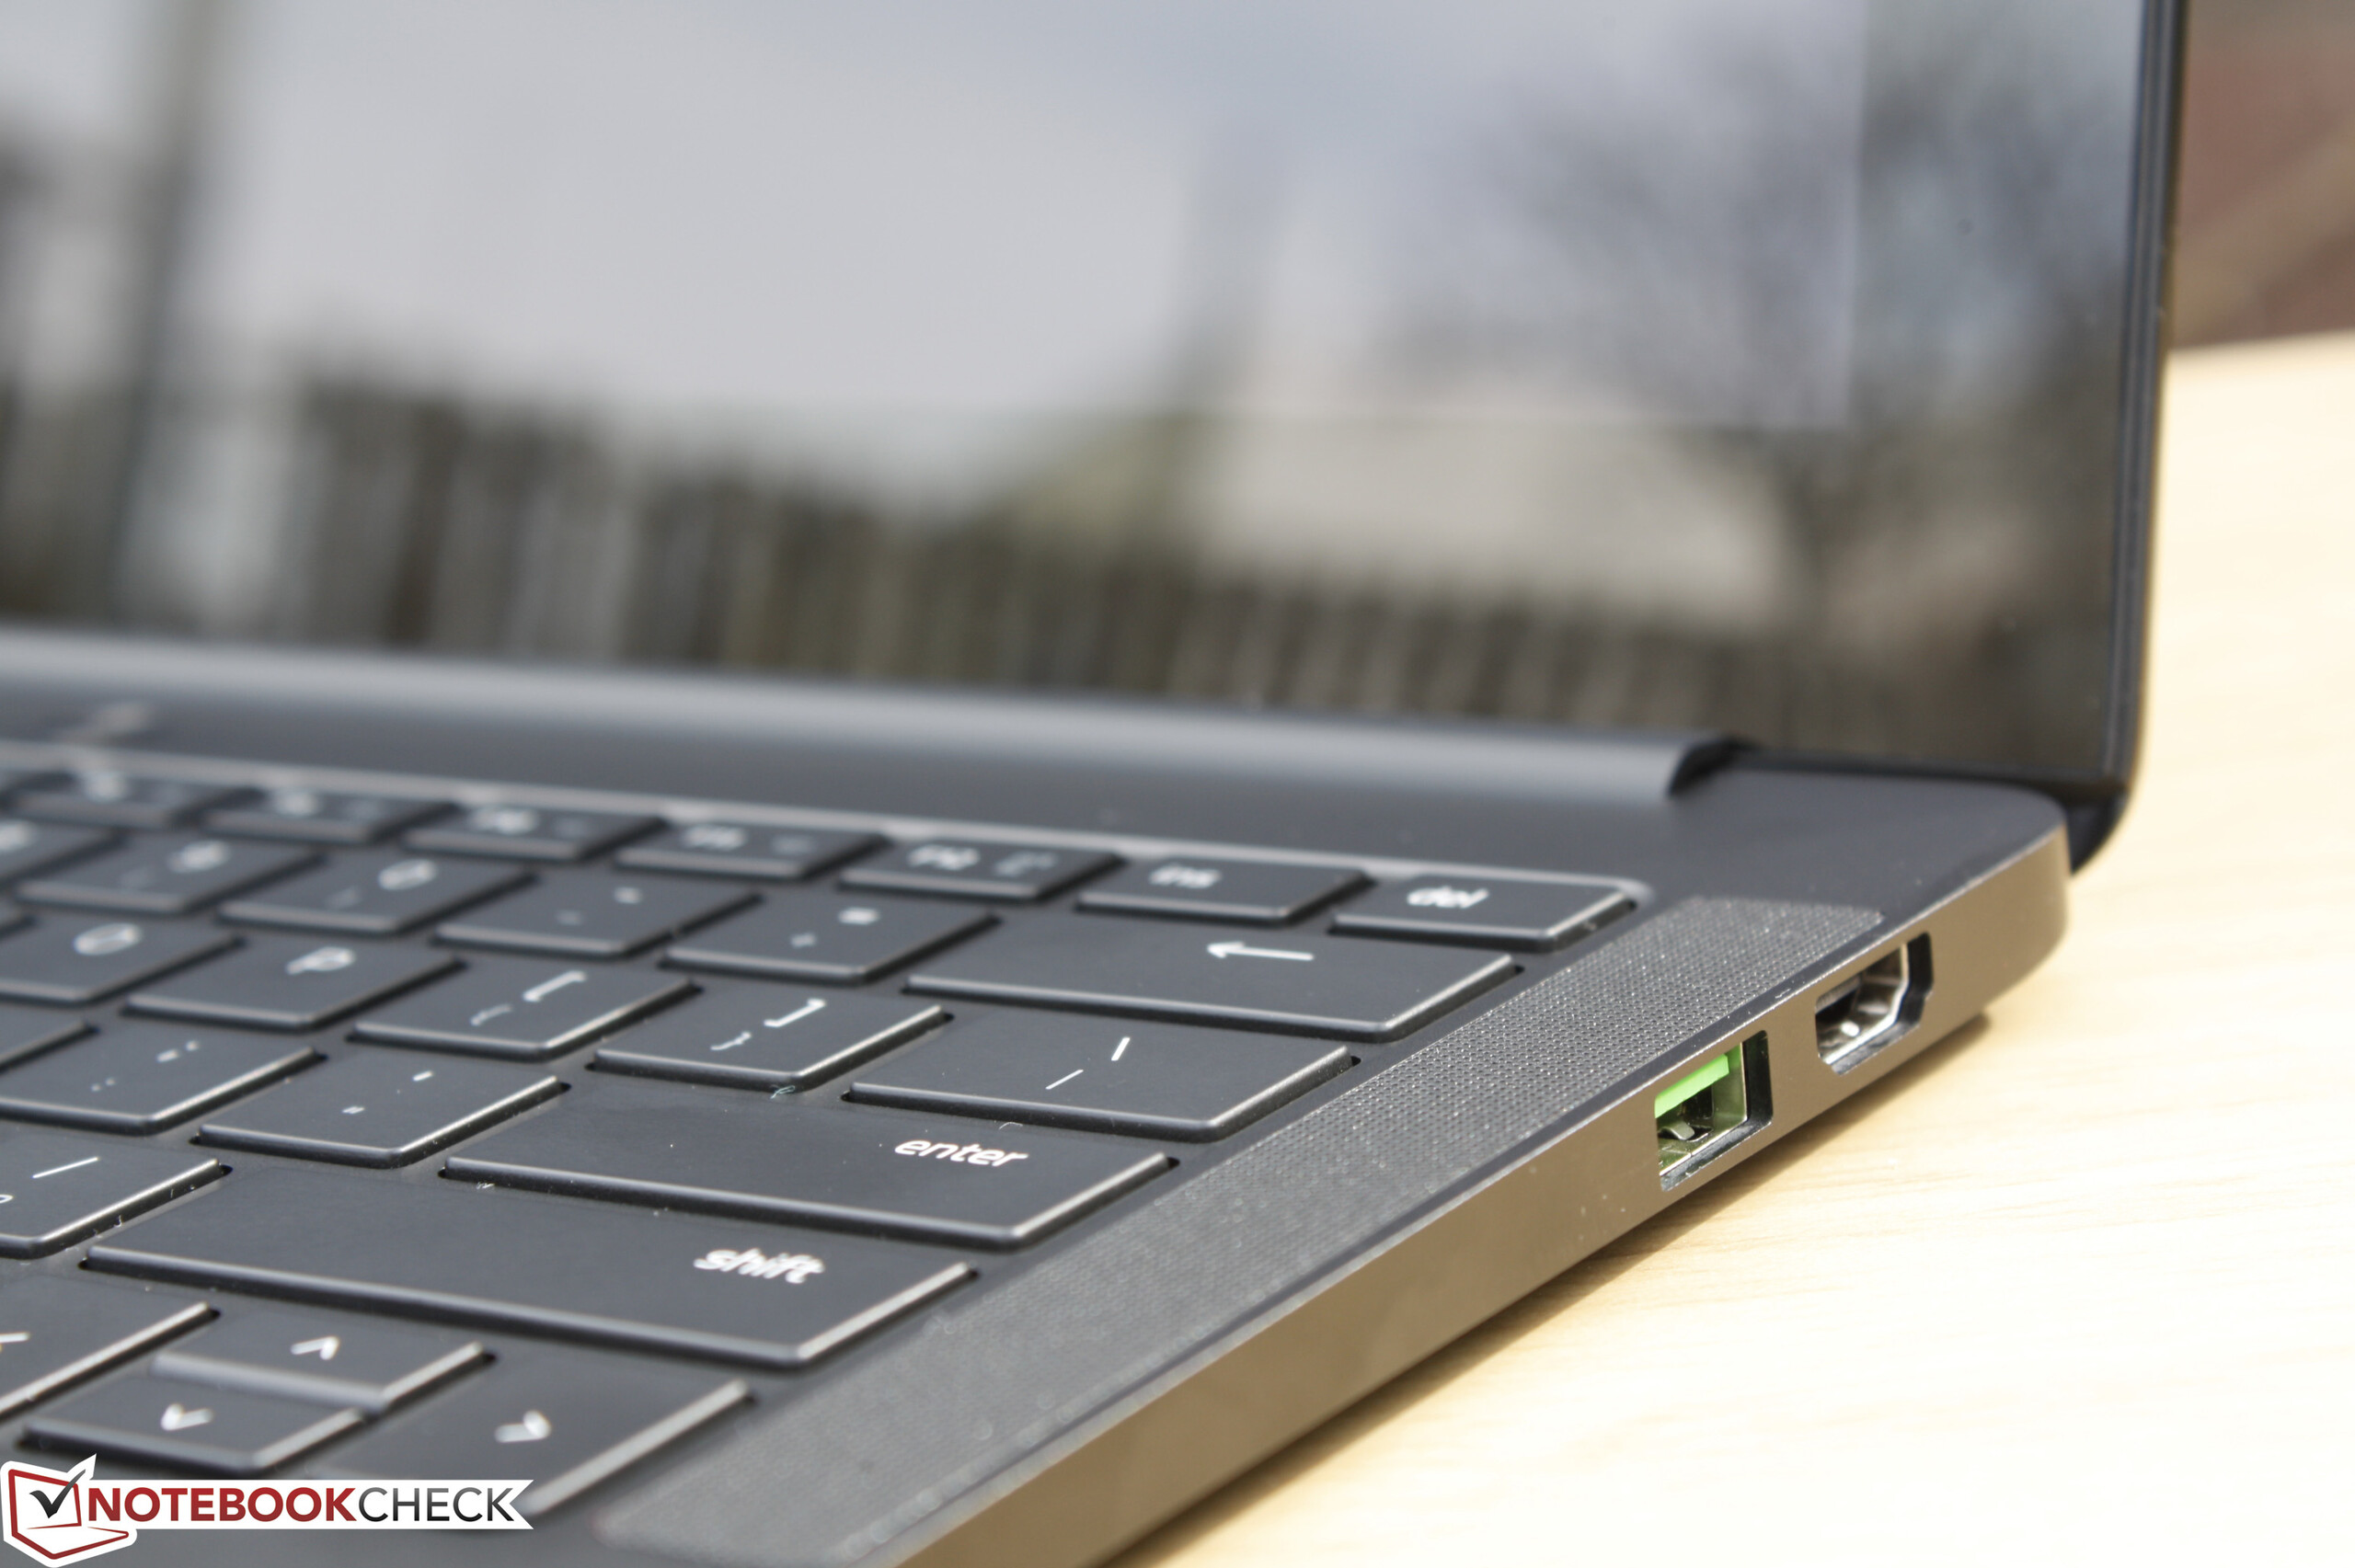
Le Blade Stealth marque le début de Razer sur le marché des ultraportables ultrafins, et quel départ tonitruant. Tout a été fait pour que l'appareil griffé Razer soit le plus "normal" des Ultrabooks possible, tout en rendant Lenovo ou Dell envieux sur certains points. Qui plus est, Razer a réussi a implanté un système de rétroéclairage individuel pour chaque touche du clavier : quelque chose qu'aucun rival n'oserait faire !
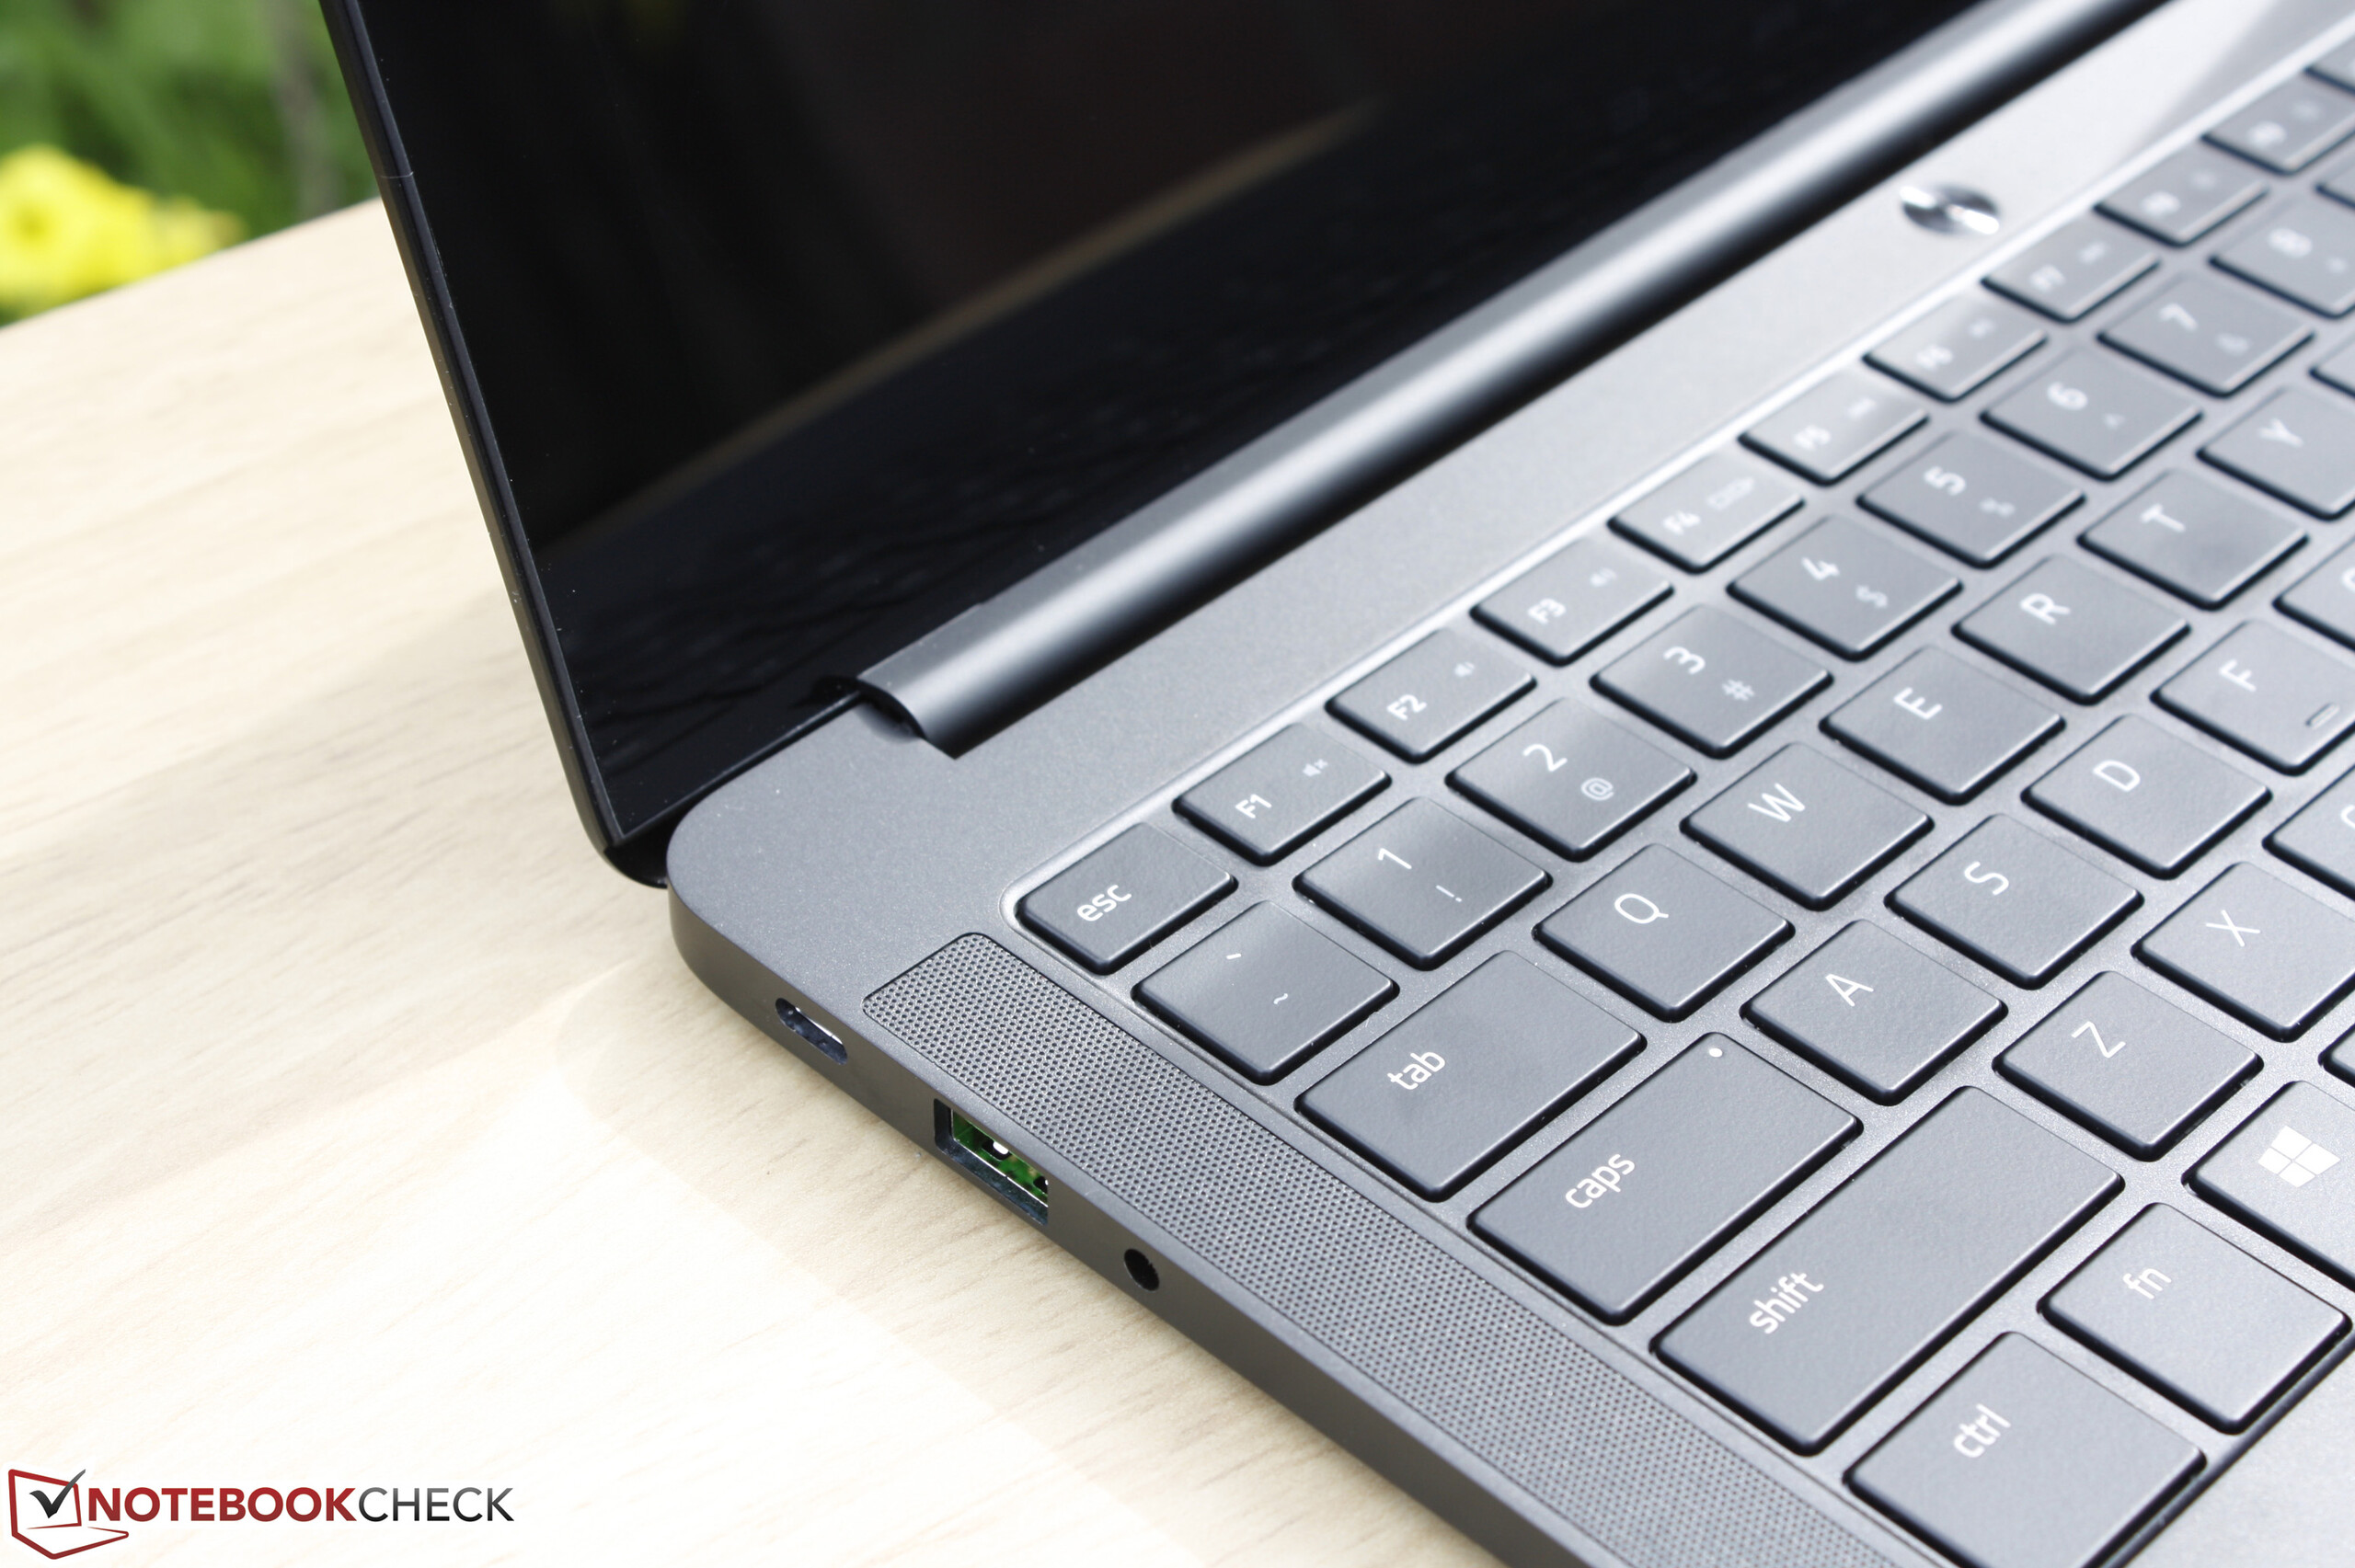
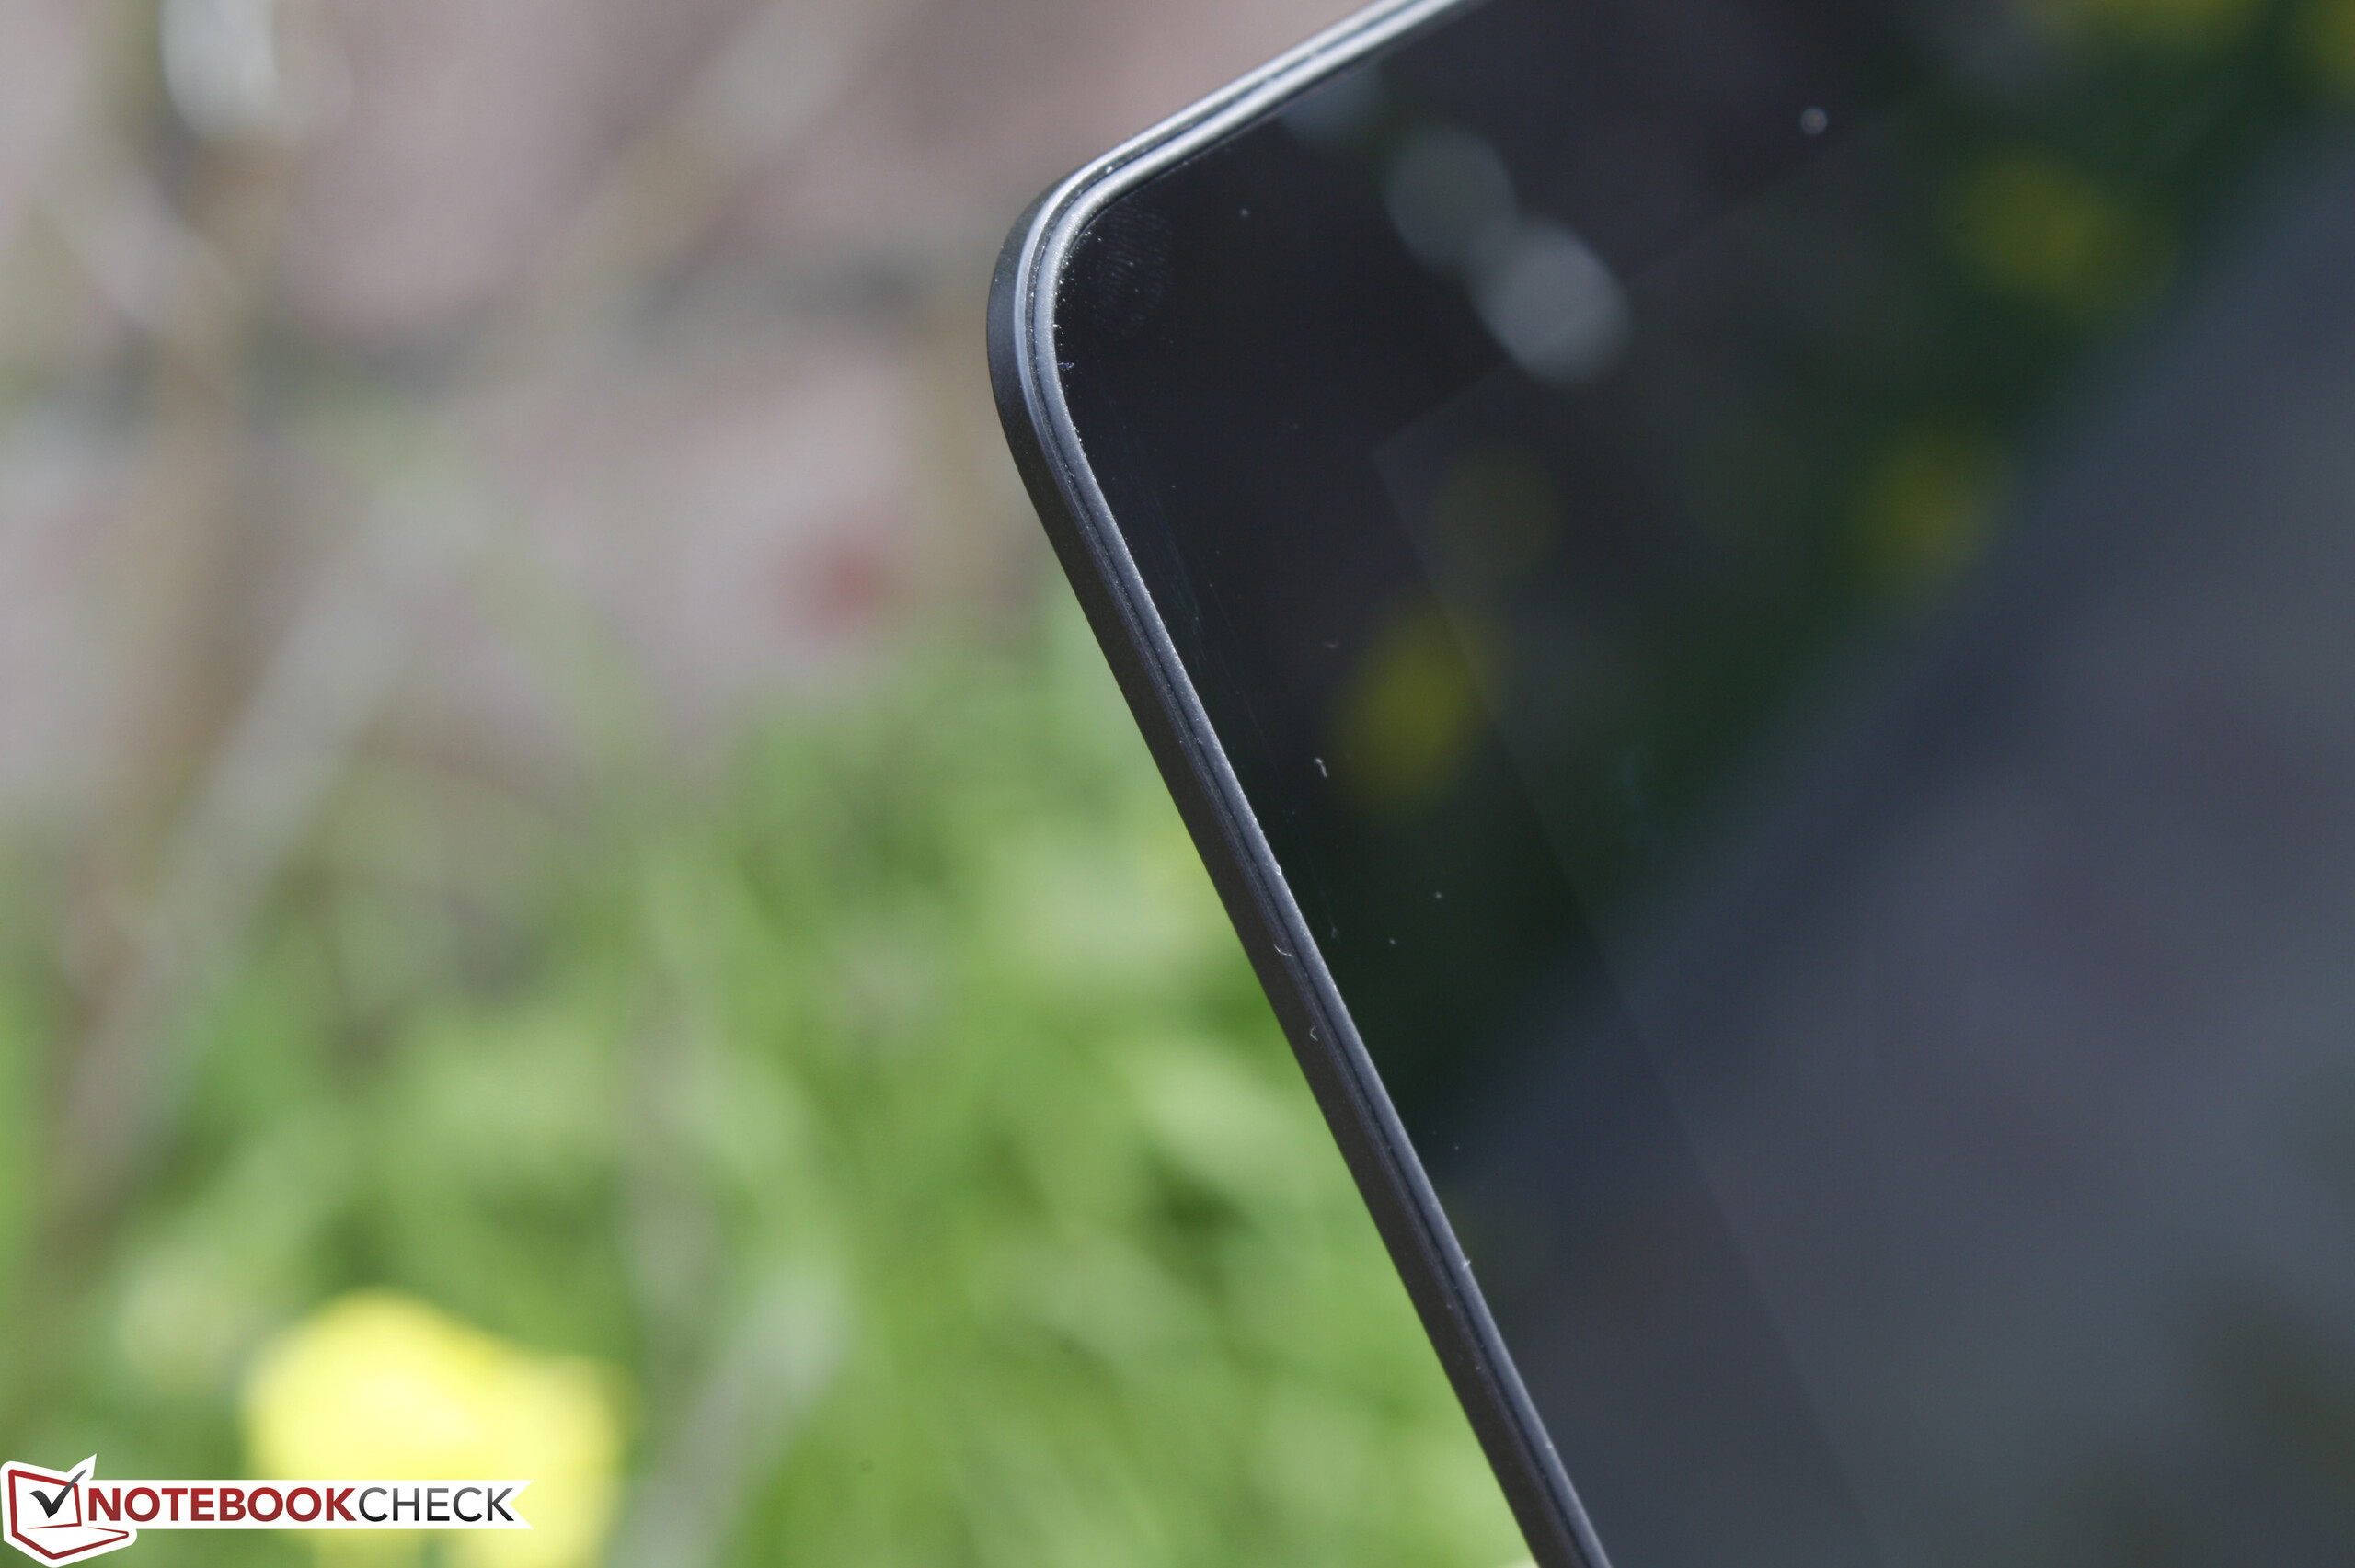
En regardant au-delà de l'esthétisme, on s'aperçoit que le châssis est de qualité, égalant facilement avec ce que proposent les vétérans du secteur (on ne va pas vous citer de nouveau Lenovo ou Dell). L'écran n'a pas d'équivalent sur le marché les couleurs sont vives et profondes alors que la luminosité est agréablement élevée. Ce dernier point permet une utilisation confortable au soleil tandis que le très bon rendu colorimétrique ravira les professionnels de l'image.
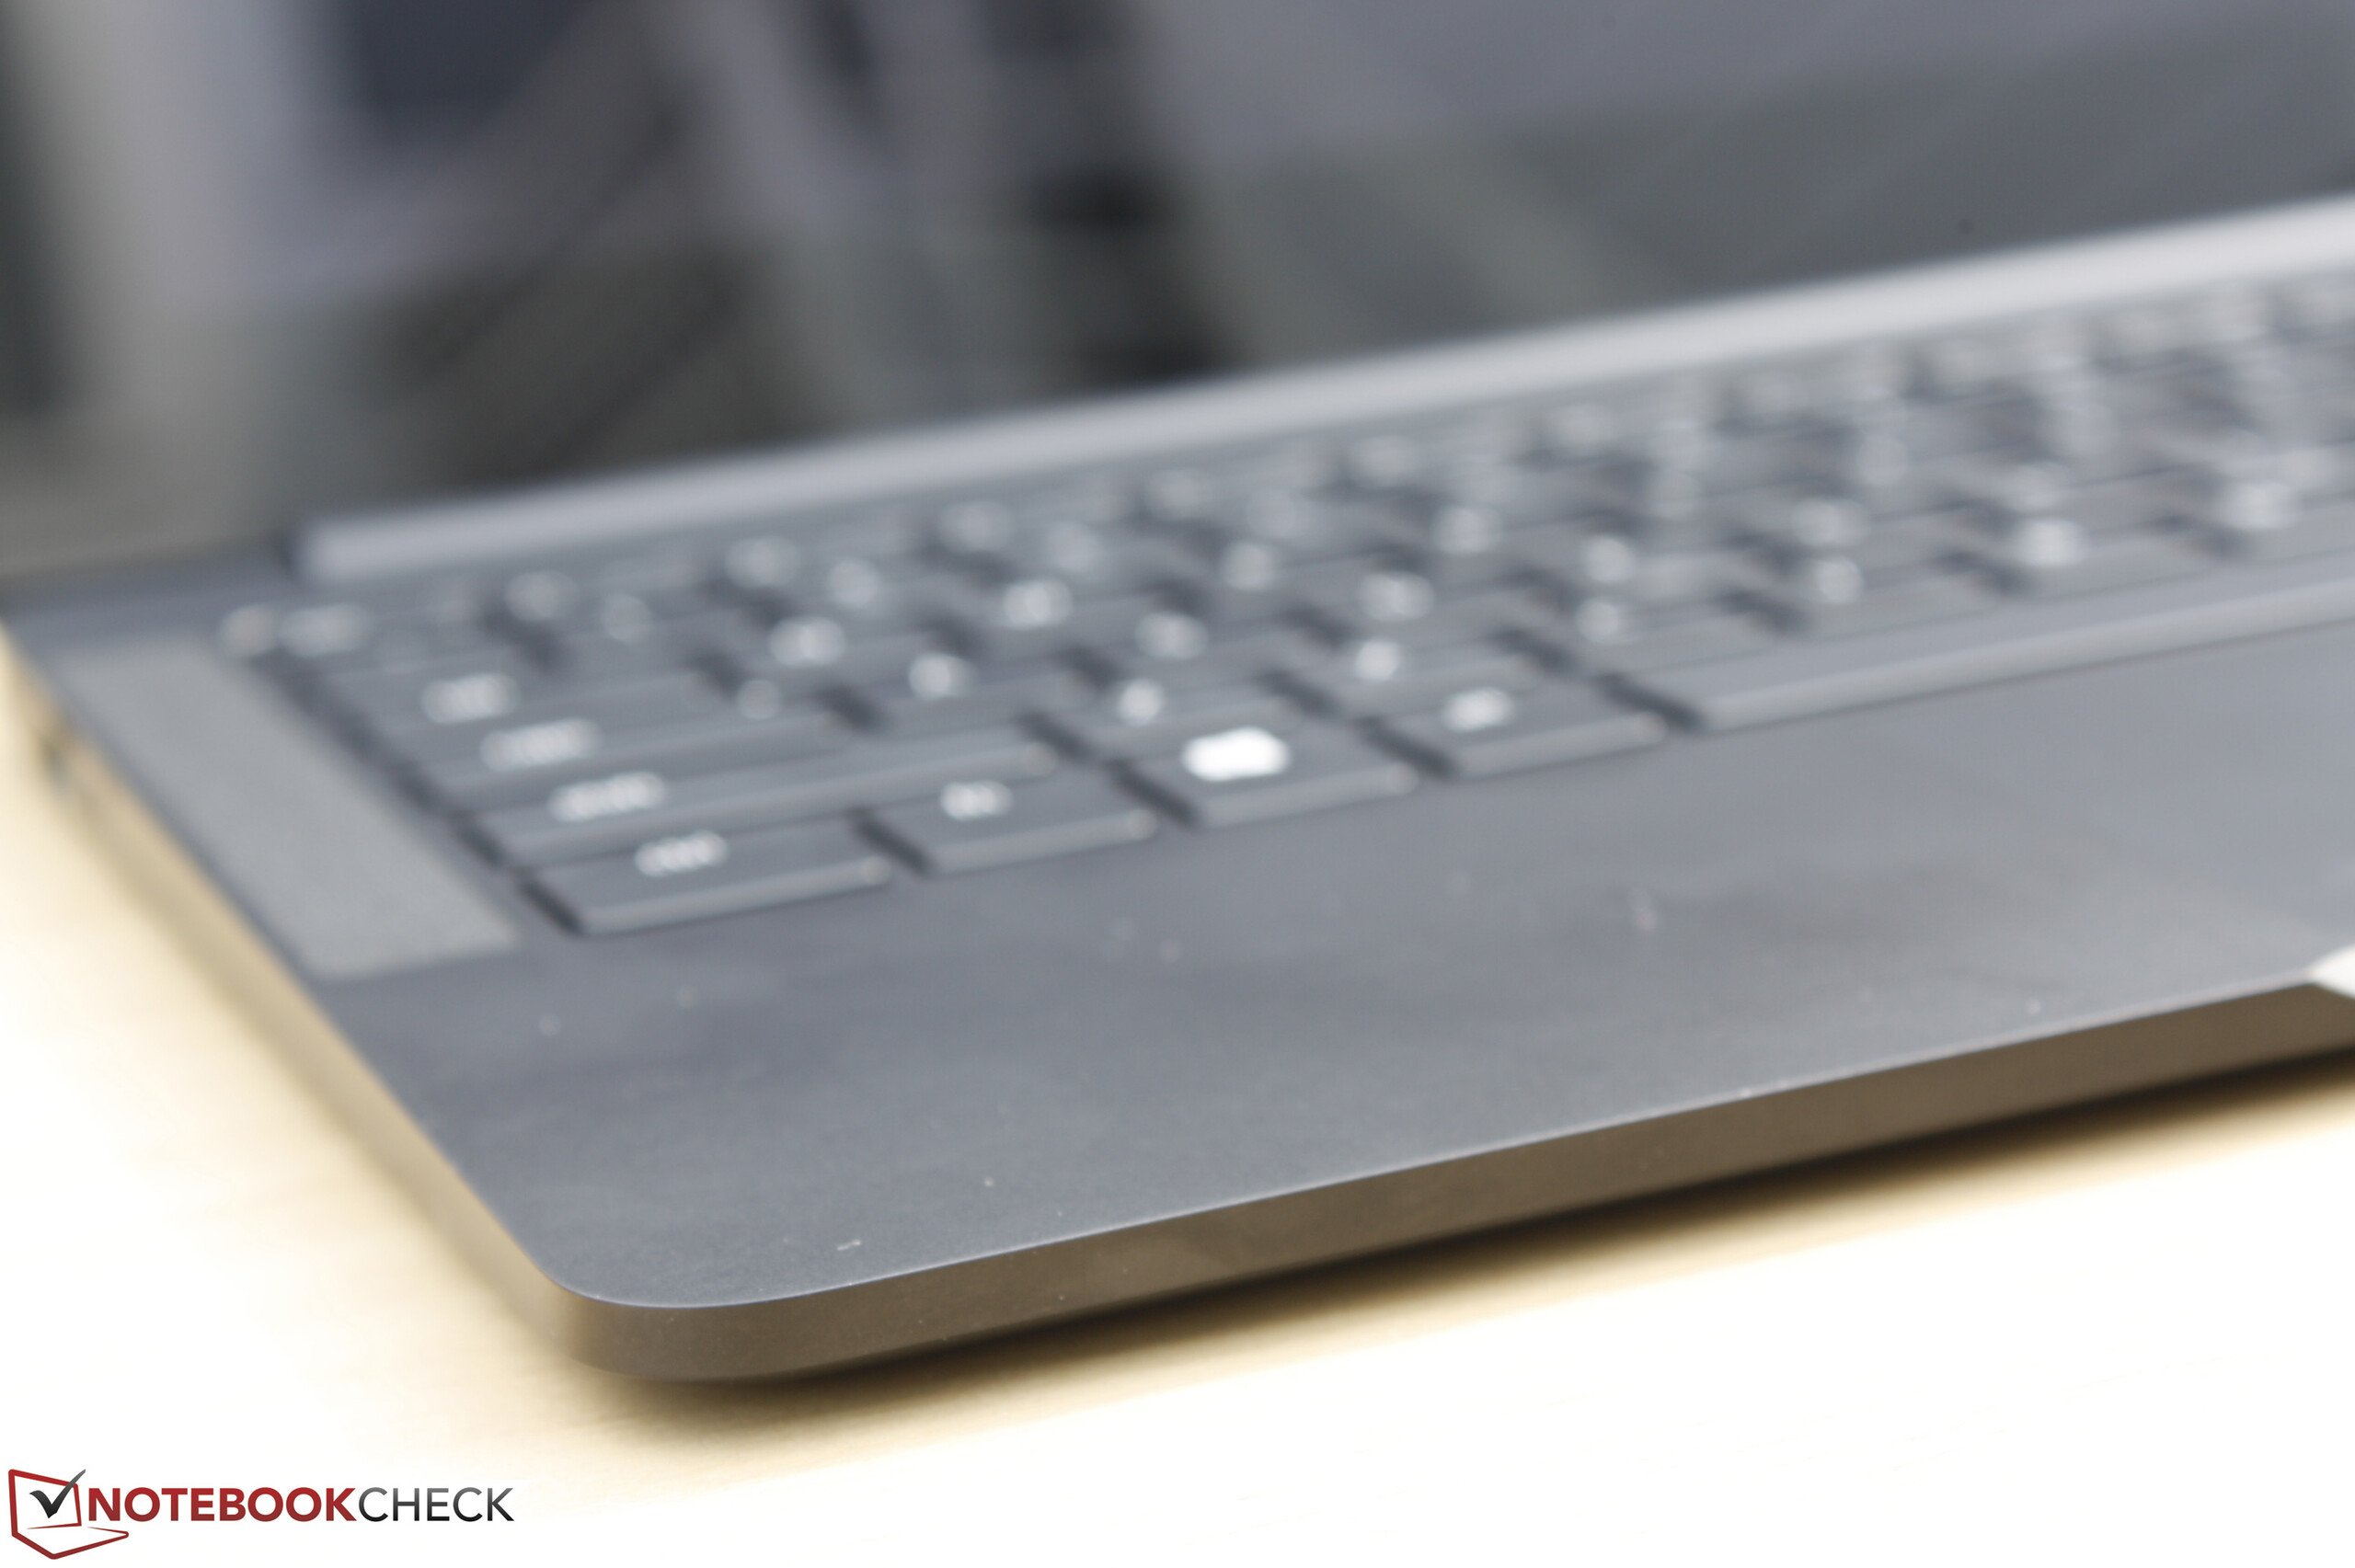
Cet Ultrabook a néanmoins quelques lacunes qui l'empêche d'être une référence en la matière : l'autonomie est très moyenne tout comme le retour du clavier. Les autres ultraportables de 12/13 pouces sur le marché arrivent facilement à faire mieux que le Blade Stealth. La course des touches et l'haptique risquent de rebuter plus d'un à délaisser leur ordinateur de bureau. Les XPS 13, MacBook 12, et Yoga 900 sont bien plus faciles à prendre en main.
En ce qui concerne les performances, l'absence de bridage est très appréciable, même lorsque la machine est fortement sollicitée ou sur batterie. Il est vrai qu'un processeur ULV peut faire la même chose, mais ce genre de puce ne conviendra pas à ceux qui se destinent à du multitâche intensif, de la retouche photo et ou du Photoshop se plairont mieux avec ce Blade Stealth et son superbe écran.
Son prix de départ en-dessous des 1000 euros le rend étonnamment abordable sur le marché des ultraportables. Nous vous recommandons même d'opter pour une configuration moins coûteuse en QHD afin de gagner en autonomie et éviter au maximum les problèmes de mise à l'échelle. La très bonne couverture de l'espace colorimétrique AdobeRGB de la dalle 4K est bien trop inutile pour une utilisation basique : traitement de textes, surf Internet, jeu léger...
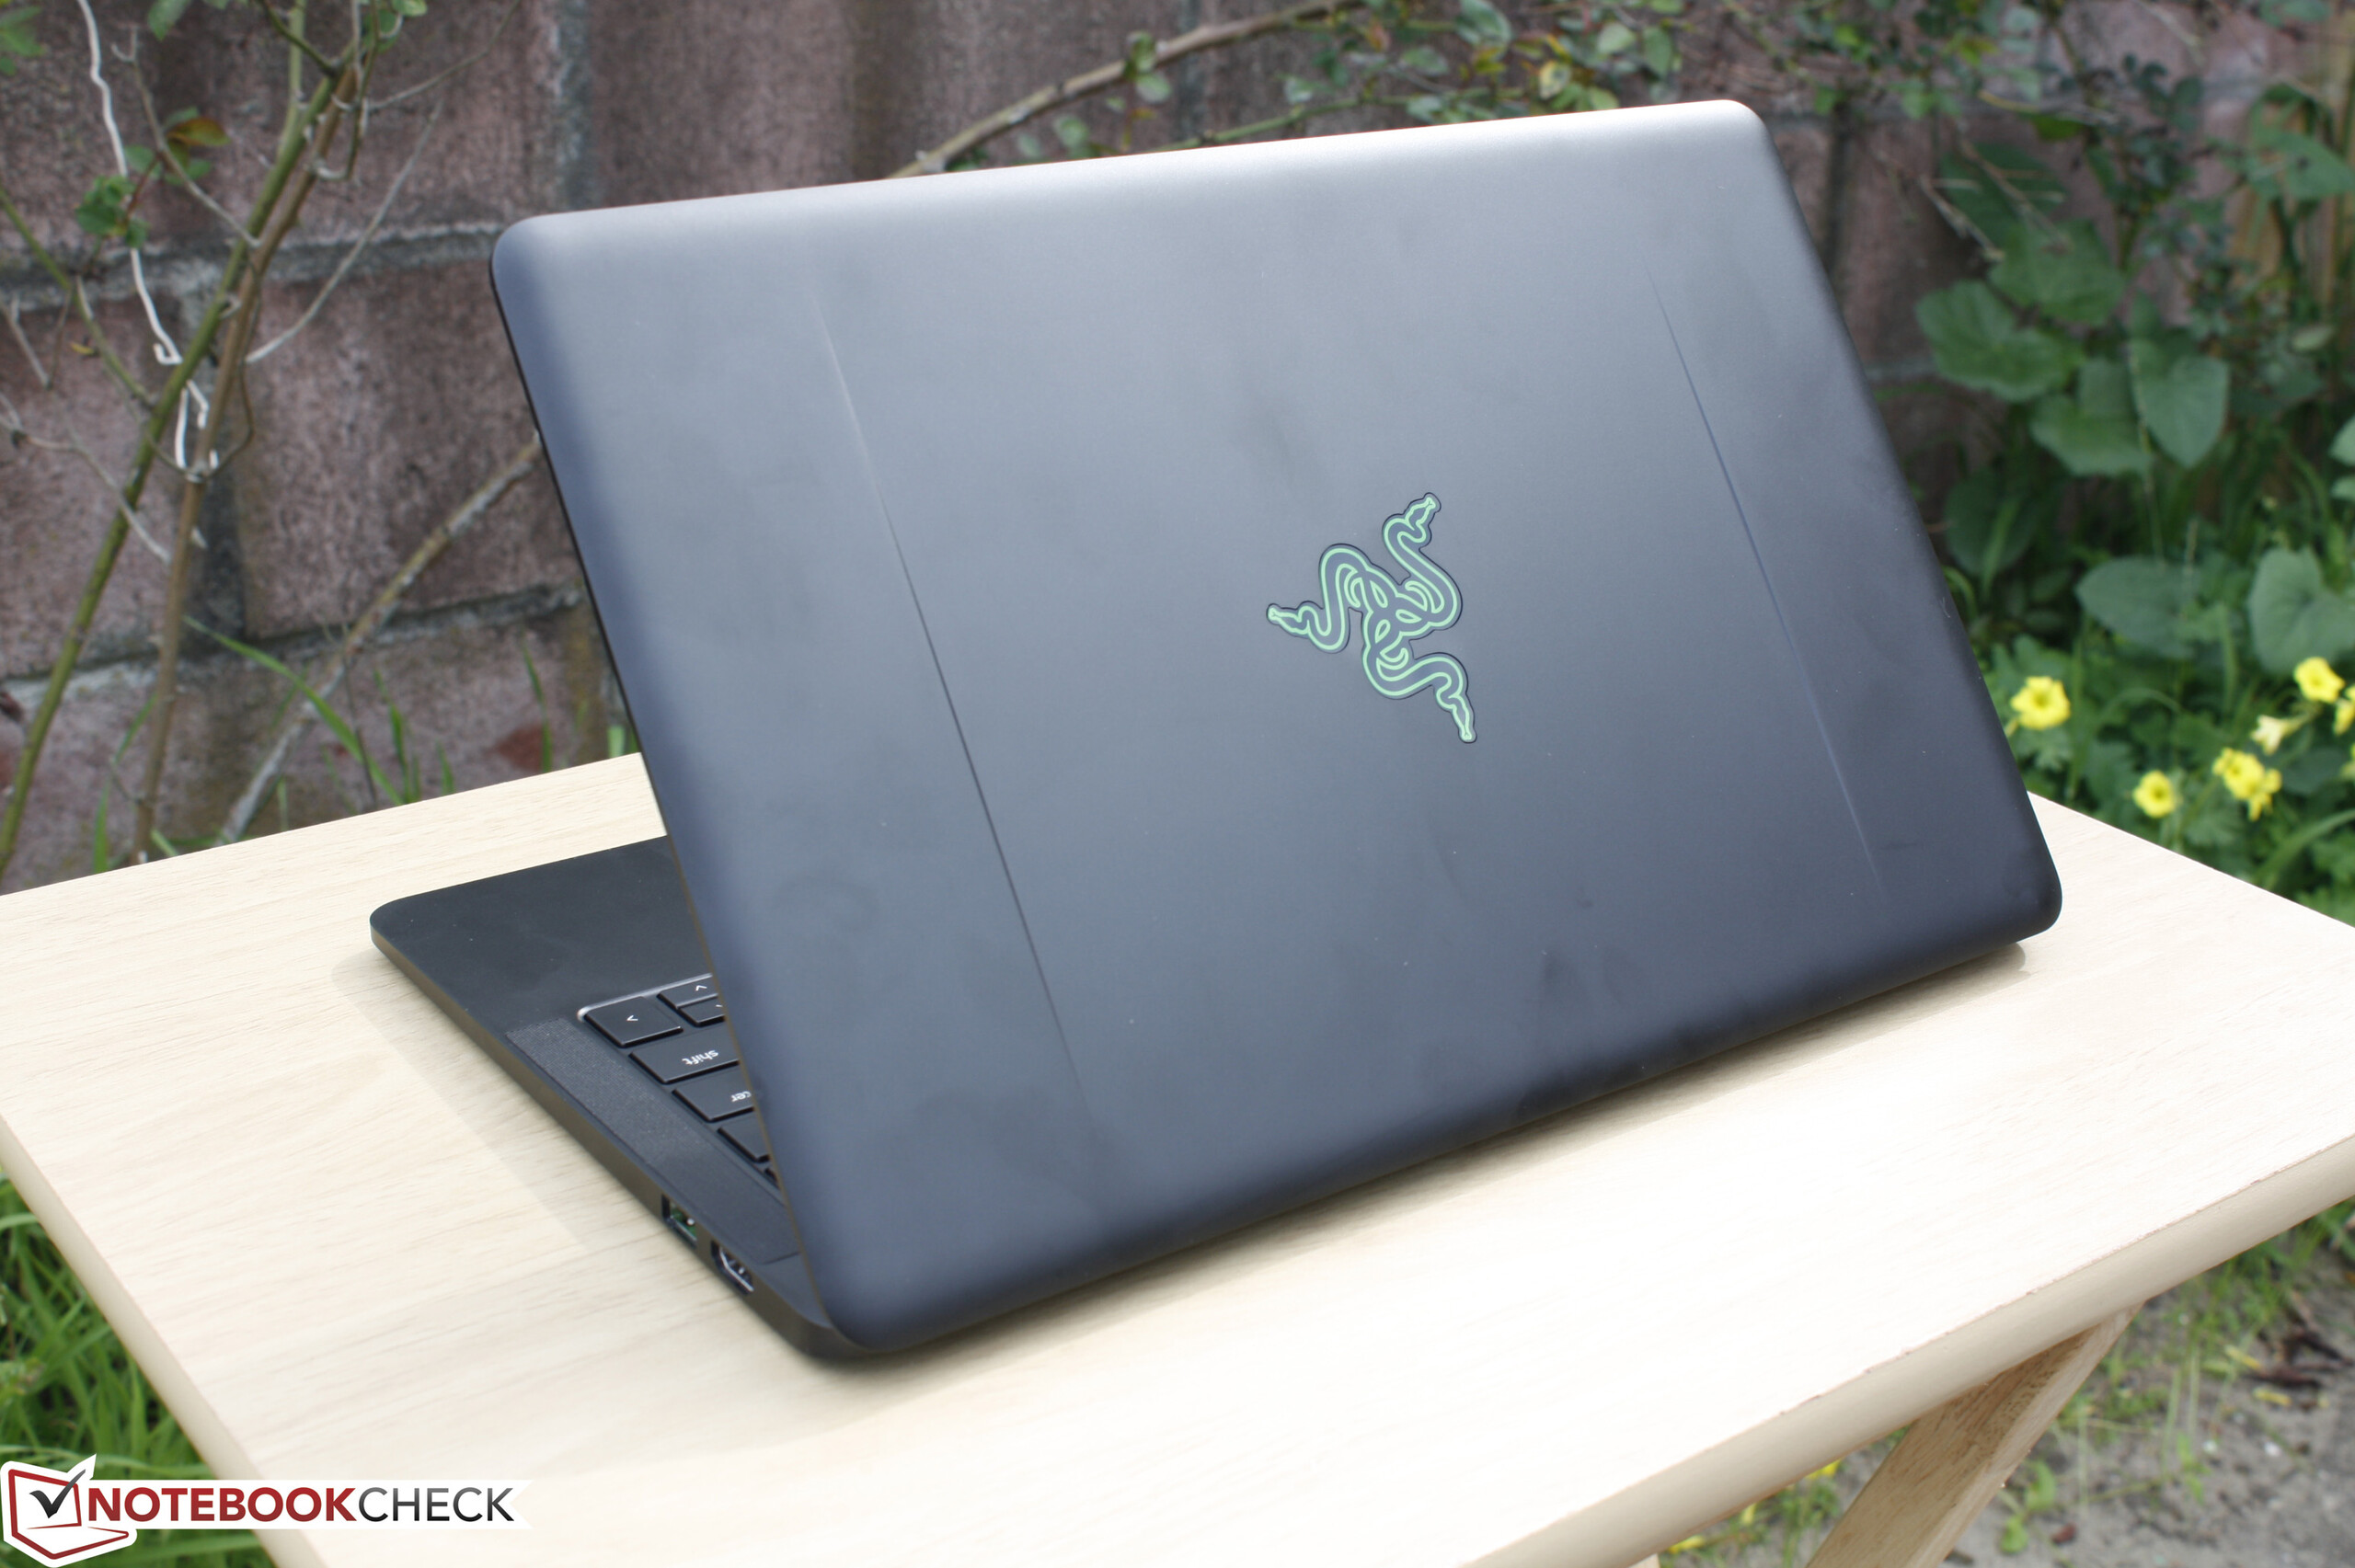
Le tout dernier ultraportable de Razer offre de spécificités uniques en leur genre, que l'on retrouve nul part ailleurs sur le segment visé. Il s'agit d'une alternative intéressante à ce qu'il se fait chez la concurrence, avec un peu plus de caractère du côté du design.
Pour plus de détails, vous trouverez la version complète (en anglais) de ce test ici.
Razer Blade Stealth UHD i7-6500U
-
03/03/2016 v5(old)
Allen Ngo
Pricecompare
