 Deutsch
 English
 Español
 Français
 Italiano
 Nederlands
 Polski
 Português
 Русский
 Türkçe
 Svenska
 Chinese
 Magyar
Courte critique de la Station de travail mobile Dell Precision 3510

| SD Card Reader | |
| average JPG Copy Test (av. of 3 runs) | |
| Dell Precision 3510 | |
| HP ZBook 15 G3 | |
| Lenovo ThinkPad P50 | |
| maximum AS SSD Seq Read Test (1GB) | |
| HP ZBook 15 G3 | |
| Dell Precision 3510 | |
| Lenovo ThinkPad P50 | |
| Networking | |
| WiFi Speed Client 1m | |
| WiFi Speed Server 1m |
| |||||||||||||||||||||||||
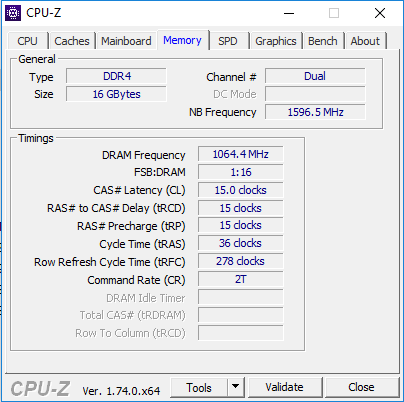
Homogénéité de la luminosité: 83 %
Valeur mesurée au centre, sur batterie: 199 cd/m²
Contraste: 498:1 (Valeurs des noirs: 0.4 cd/m²)
ΔE Color 9 | 0.5-29.43 Ø5
ΔE Greyscale 9.6 | 0.57-98 Ø5.3
73.7% sRGB (Calman 2D)
62.4% sRGB (Argyll 1.6.3 3D)
39.6% AdobeRGB 1998 (Argyll 1.6.3 3D)
42.86% AdobeRGB 1998 (Argyll 2.2.0 3D)
62.4% sRGB (Argyll 2.2.0 3D)
41.48% Display P3 (Argyll 2.2.0 3D)
Gamma: 2.41
| Dell Precision 3510 LGD04AF, K96D2_156WHU, , 1366x768, 15.60 | Dell Precision 3510 52452051.2 LG Display LGD049B / 156WF6, Dell P/N: F7HH2, , 1920x1080, 15.60 | Dell Precision 7510 (4K IGZO) Sharp LQ156D1, , 3840x2160, 15.60 | Dell Precision 5510 SHP143E, 7PHPT_LQ156D1, , 3840x2160, 15.60 | Lenovo ThinkPad P50 LQ156D1JW05, , 3840x2160, 15.60 | HP ZBook 15 G3 Samsung SDC5344, , 1920x1080, 15.60 | |
|---|---|---|---|---|---|---|
| Display | 54% | 100% | 102% | 98% | 58% | |
| Display P3 Coverage | 41.48 | 68.9 66% | 86.2 108% | 88.4 113% | 85.8 107% | 66.8 61% |
| sRGB Coverage | 62.4 | 88.9 42% | 99.7 60% | 100 60% | 98.6 58% | 95.5 53% |
| AdobeRGB 1998 Coverage | 42.86 | 65.4 53% | 99 131% | 99.5 132% | 98.2 129% | 69 61% |
| Response Times | 15% | -11% | 26% | -12% | ||
| Response Time Grey 50% / Grey 80% * | 56 ? | 40.4 ? 28% | 56.4 ? -1% | 39.2 ? 30% | 54 ? 4% | |
| Response Time Black / White * | 28 ? | 27.6 ? 1% | 34 ? -21% | 22 ? 21% | 35.6 ? -27% | |
| PWM Frequency | 198.4 ? | 217 | 198 ? | |||
| Screen | 47% | 57% | 65% | 42% | 40% | |
| Brightness middle | 199 | 364.6 83% | 279.2 40% | 391 96% | 250 26% | 306 54% |
| Brightness | 201 | 335 67% | 271 35% | 361 80% | 250 24% | 289 44% |
| Brightness Distribution | 83 | 83 0% | 83 0% | 87 5% | 86 4% | 85 2% |
| Black Level * | 0.4 | 0.4 -0% | 0.266 33% | 0.4 -0% | 0.31 22% | 0.34 15% |
| Contrast | 498 | 912 83% | 1050 111% | 978 96% | 806 62% | 900 81% |
| Colorchecker dE 2000 * | 9 | 4.14 54% | 4.85 46% | 4.5 50% | 5.1 43% | |
| Colorchecker dE 2000 max. * | 13.3 | 6.56 51% | 9.3 30% | 9.9 26% | ||
| Greyscale dE 2000 * | 9.6 | 3.26 66% | 4.01 58% | 7.2 25% | 7.4 23% | |
| Gamma | 2.41 91% | 2.19 100% | 2.18 101% | 2.31 95% | 2.37 93% | |
| CCT | 10695 61% | 6375 102% | 7340 89% | 6399 102% | 7263 89% | |
| Color Space (Percent of AdobeRGB 1998) | 39.6 | 85.68 116% | 96 142% | 85 115% | 63 59% | |
| Color Space (Percent of sRGB) | 62.4 | 99.72 60% | 100 60% | 98.6 58% | 95 52% | |
| Moyenne finale (programmes/paramètres) | 51% /
49% | 57% /
60% | 52% /
62% | 55% /
51% | 29% /
37% |
* ... Moindre est la valeur, meilleures sont les performances
Temps de réponse de l'écran
| ↔ Temps de réponse noir à blanc | ||
|---|---|---|
| 28 ms ... hausse ↗ et chute ↘ combinées | ↗ 11 ms hausse | |
| ↘ 17 ms chute | ||
| L'écran souffre de latences relativement élevées, insuffisant pour le jeu. En comparaison, tous les appareils testés affichent entre 0.1 (minimum) et 240 (maximum) ms. » 67 % des appareils testés affichent de meilleures performances. Cela signifie que les latences relevées sont moins bonnes que la moyenne (21.5 ms) de tous les appareils testés. | ||
| ↔ Temps de réponse gris 50% à gris 80% | ||
| 56 ms ... hausse ↗ et chute ↘ combinées | ↗ 27 ms hausse | |
| ↘ 29 ms chute | ||
| L'écran souffre de latences très élevées, à éviter pour le jeu. En comparaison, tous les appareils testés affichent entre 0.2 (minimum) et 636 (maximum) ms. » 91 % des appareils testés affichent de meilleures performances. Cela signifie que les latences relevées sont moins bonnes que la moyenne (33.7 ms) de tous les appareils testés. | ||
Scintillement / MLI (Modulation de largeur d'impulsion)
| Scintillement / MLI (Modulation de largeur d'impulsion) non décelé | ||
En comparaison, 53 % des appareils testés n'emploient pas MDI pour assombrir leur écran. Nous avons relevé une moyenne à 17900 (minimum : 5 - maximum : 3846000) Hz dans le cas où une MDI était active. | ||
| PCMark 8 | |
| Home Score Accelerated v2 | |
| Dell Precision 3510 | |
| Lenovo ThinkPad P50 | |
| Dell Precision 7510 (4K IGZO) | |
| HP ZBook 15u G3 | |
| HP ZBook 15 G3 | |
| Dell Precision 5510 | |
| Work Score Accelerated v2 | |
| Dell Precision 3510 | |
| HP ZBook 15 G3 | |
| Dell Precision 5510 | |
| HP ZBook 15u G3 | |
| Lenovo ThinkPad P50 | |
| Dell Precision 7510 (4K IGZO) | |
| PCMark 8 Home Score Accelerated v2 | 4405 points | |
| PCMark 8 Creative Score Accelerated v2 | 5244 points | |
| PCMark 8 Work Score Accelerated v2 | 5258 points | |
Aide | ||
| Dell Precision 3510 Samsung SM951 MZVPV256HDGL m.2 PCI-e | Dell Precision 5510 SK hynix SC920 512 GB | Dell Precision 7510 (4K IGZO) Samsung SSD SM951a 512GB M.2 PCIe 3.0 x4 NVMe (MZVKV512) | Lenovo ThinkPad P50 Samsung SM951 MZVPV256HDGL m.2 PCI-e | HP ZBook 15u G3 Samsung SM951 MZVPV256HDGL m.2 PCI-e | HP ZBook 15 G3 Samsung SM951 MZVPV512HDGL m.2 PCI-e | |
|---|---|---|---|---|---|---|
| AS SSD | -58% | 18% | 16% | 13% | 13% | |
| Seq Write | 1093 | 389 -64% | 1484 36% | 1252 15% | 1106 1% | 1181 8% |
| Seq Read | 1897 | 474 -75% | 1953 3% | 1930 2% | 1859 -2% | 1841 -3% |
| 4K-64 Write | 294.1 | 257 -13% | 375.7 28% | 340.7 16% | 335.6 14% | 257 -13% |
| 4K-64 Read | 1114 | 327 -71% | 1067 -4% | 1077 -3% | 1781 60% | 1066 -4% |
| 4K Write | 121.7 | 82.2 -32% | 145.1 19% | 212.2 74% | 126.2 4% | 173.1 42% |
| 4K Read | 46.76 | 17.95 -62% | 49.22 5% | 54.2 16% | 48.7 4% | 52.5 12% |
| Access Time Read * | 0.059 | 0.111 -88% | 0.036 39% | 0.062 -5% | 0.053 10% | 0.031 47% |
* ... Moindre est la valeur, meilleures sont les performances

| SPECviewperf 11 | |
| 1920x1080 Siemens NX | |
| Lenovo ThinkPad P50 | |
| HP ZBook 15 G3 | |
| Dell Precision 5510 | |
| Dell Precision 3510 | |
| Asus GL552VW-DK725T | |
| 1920x1080 Tcvis | |
| HP ZBook 15 G3 | |
| Lenovo ThinkPad P50 | |
| Dell Precision 5510 | |
| Dell Precision 3510 | |
| Asus GL552VW-DK725T | |
| 1920x1080 SolidWorks | |
| Lenovo ThinkPad P50 | |
| Dell Precision 5510 | |
| HP ZBook 15 G3 | |
| Dell Precision 3510 | |
| Asus GL552VW-DK725T | |
| 1920x1080 Pro/ENGINEER | |
| HP ZBook 15 G3 | |
| Lenovo ThinkPad P50 | |
| Dell Precision 5510 | |
| Dell Precision 3510 | |
| Asus GL552VW-DK725T | |
| 1920x1080 Maya | |
| HP ZBook 15 G3 | |
| Lenovo ThinkPad P50 | |
| Dell Precision 5510 | |
| Dell Precision 3510 | |
| Asus GL552VW-DK725T | |
| 1920x1080 Lightwave | |
| Lenovo ThinkPad P50 | |
| Dell Precision 5510 | |
| HP ZBook 15 G3 | |
| Dell Precision 3510 | |
| Asus GL552VW-DK725T | |
| 1920x1080 Ensight | |
| HP ZBook 15 G3 | |
| Lenovo ThinkPad P50 | |
| Dell Precision 5510 | |
| Asus GL552VW-DK725T | |
| Dell Precision 3510 | |
| 1920x1080 Catia | |
| Lenovo ThinkPad P50 | |
| Dell Precision 5510 | |
| HP ZBook 15 G3 | |
| Asus GL552VW-DK725T | |
| Dell Precision 3510 | |
| 3DMark 11 - 1280x720 Performance GPU | |
| Lenovo ThinkPad P50 | |
| Dell Precision 7510 (4K IGZO) | |
| HP ZBook 15 G3 | |
| Dell Precision 5510 | |
| HP ZBook 15u G3 | |
| 3DMark | |
| 1280x720 Cloud Gate Standard Graphics | |
| HP ZBook 15 G3 | |
| Dell Precision 7510 (4K IGZO) | |
| Lenovo ThinkPad P50 | |
| Dell Precision 5510 | |
| Dell Precision 3510 | |
| HP ZBook 15u G3 | |
| 1920x1080 Fire Strike Graphics | |
| Dell Precision 7510 (4K IGZO) | |
| HP ZBook 15 G3 | |
| Lenovo ThinkPad P50 | |
| Dell Precision 5510 | |
| Dell Precision 3510 | |
| HP ZBook 15u G3 | |
| 3DMark 06 Standard Score | 15680 points | |
| 3DMark Cloud Gate Standard Score | 11740 points | |
| 3DMark Fire Strike Score | 2001 points | |
Aide | ||
| Bas | Moyen | Élevé | Ultra | |
| Tomb Raider (2013) | 158 | 75 | 58 | 25 |
| BioShock Infinite (2013) | 137 | 66 | 57 | 22 |
| Total War: Rome II (2013) | 106 | 80 | 66 | 23 |
| Middle-earth: Shadow of Mordor (2014) | 66 | 41 | 23 | 21 |
| Dirt Rally (2015) | 216 | 71 | 47 | 19 |
| The Witcher 3 (2015) | 31 | 21 | 10 |
Degré de la nuisance sonore
| Au repos |
| 30 / 30 / 30 dB(A) |
| Fortement sollicité |
| 38.1 / 44.4 dB(A) |
 | ||
30 dB silencieux 40 dB(A) audible 50 dB(A) bruyant |
||
min: | ||
(-) La température maximale du côté supérieur est de 54.6 °C / 130 F, par rapport à la moyenne de 38.1 °C / 101 F, allant de 22.2 à 69.8 °C pour la classe Workstation.
(-) Le fond chauffe jusqu'à un maximum de 59.4 °C / 139 F, contre une moyenne de 41.3 °C / 106 F
(+) En utilisation inactive, la température moyenne du côté supérieur est de 28 °C / 82 F, par rapport à la moyenne du dispositif de 32 °C / 90 F.
(+) Les repose-poignets et le pavé tactile sont plus froids que la température de la peau avec un maximum de 31.5 °C / 88.7 F et sont donc froids au toucher.
(-) La température moyenne de la zone de l'appui-paume de dispositifs similaires était de 27.8 °C / 82 F (-3.7 °C / #-6.7 F).
| Éteint/en veille | |
| Au repos | |
| Fortement sollicité |
|
| Dell Precision 3510 6700HQ, FirePro W5130M, Samsung SM951 MZVPV256HDGL m.2 PCI-e, TN LED, 1366x768, 15.60 | Dell Precision 5510 E3-1505M v5, Quadro M1000M, SK hynix SC920 512 GB, IGZO LED, 3840x2160, 15.60 | Dell Precision 7510 (4K IGZO) E3-1535M v5, Quadro M2000M, Samsung SSD SM951a 512GB M.2 PCIe 3.0 x4 NVMe (MZVKV512), IGZO IPS, 3840x2160, 15.60 | Lenovo ThinkPad P50 E3-1505M v5, Quadro M2000M, Samsung SM951 MZVPV256HDGL m.2 PCI-e, IPS, 3840x2160, 15.60 | HP ZBook 15 G3 E3-1505M v5, Quadro M2000M, Samsung SM951 MZVPV512HDGL m.2 PCI-e, UWVA-IPS, 1920x1080, 15.60 | |
|---|---|---|---|---|---|
| Power Consumption | -89% | -247% | -102% | -52% | |
| Idle Minimum * | 4.2 | 8.6 -105% | 23.9 -469% | 10.2 -143% | 5.7 -36% |
| Idle Average * | 6.5 | 16.2 -149% | 28.9 -345% | 17.8 -174% | 12.2 -88% |
| Idle Maximum * | 7.1 | 16.7 -135% | 30 -323% | 18.3 -158% | 12.6 -77% |
| Load Average * | 74.6 | 82.6 -11% | 95.2 -28% | 76.9 -3% | 83.1 -11% |
| Load Maximum * | 92.2 | 131.8 -43% | 157.1 -70% | 123.5 -34% | 138.2 -50% |
* ... Moindre est la valeur, meilleures sont les performances
| Dell Precision 3510 6700HQ, FirePro W5130M, 84 Wh | Dell Precision 5510 E3-1505M v5, Quadro M1000M, 56 Wh | Dell Precision 7510 (4K IGZO) E3-1535M v5, Quadro M2000M, 91 Wh | Lenovo ThinkPad P50 E3-1505M v5, Quadro M2000M, 90 Wh | HP ZBook 15 G3 E3-1505M v5, Quadro M2000M, 90 Wh | HP ZBook 15u G3 6600U, FirePro W4190M, 90 Wh | |
|---|---|---|---|---|---|---|
| Autonomie de la batterie | -46% | -58% | -41% | -23% | -18% | |
| Reader / Idle | 1168 | 428 -63% | 268 -77% | 539 -54% | 822 -30% | 756 -35% |
| H.264 | 605 | 197 -67% | 331 -45% | 449 -26% | ||
| WiFi v1.3 | 591 | 286 -52% | 239 -60% | 288 -51% | 386 -35% | 312 -47% |
| Load | 111 | 109 -2% | 70 -37% | 98 -12% | 110 -1% | 141 27% |
| WiFi | 298 |
Points positifs
Points négatifs
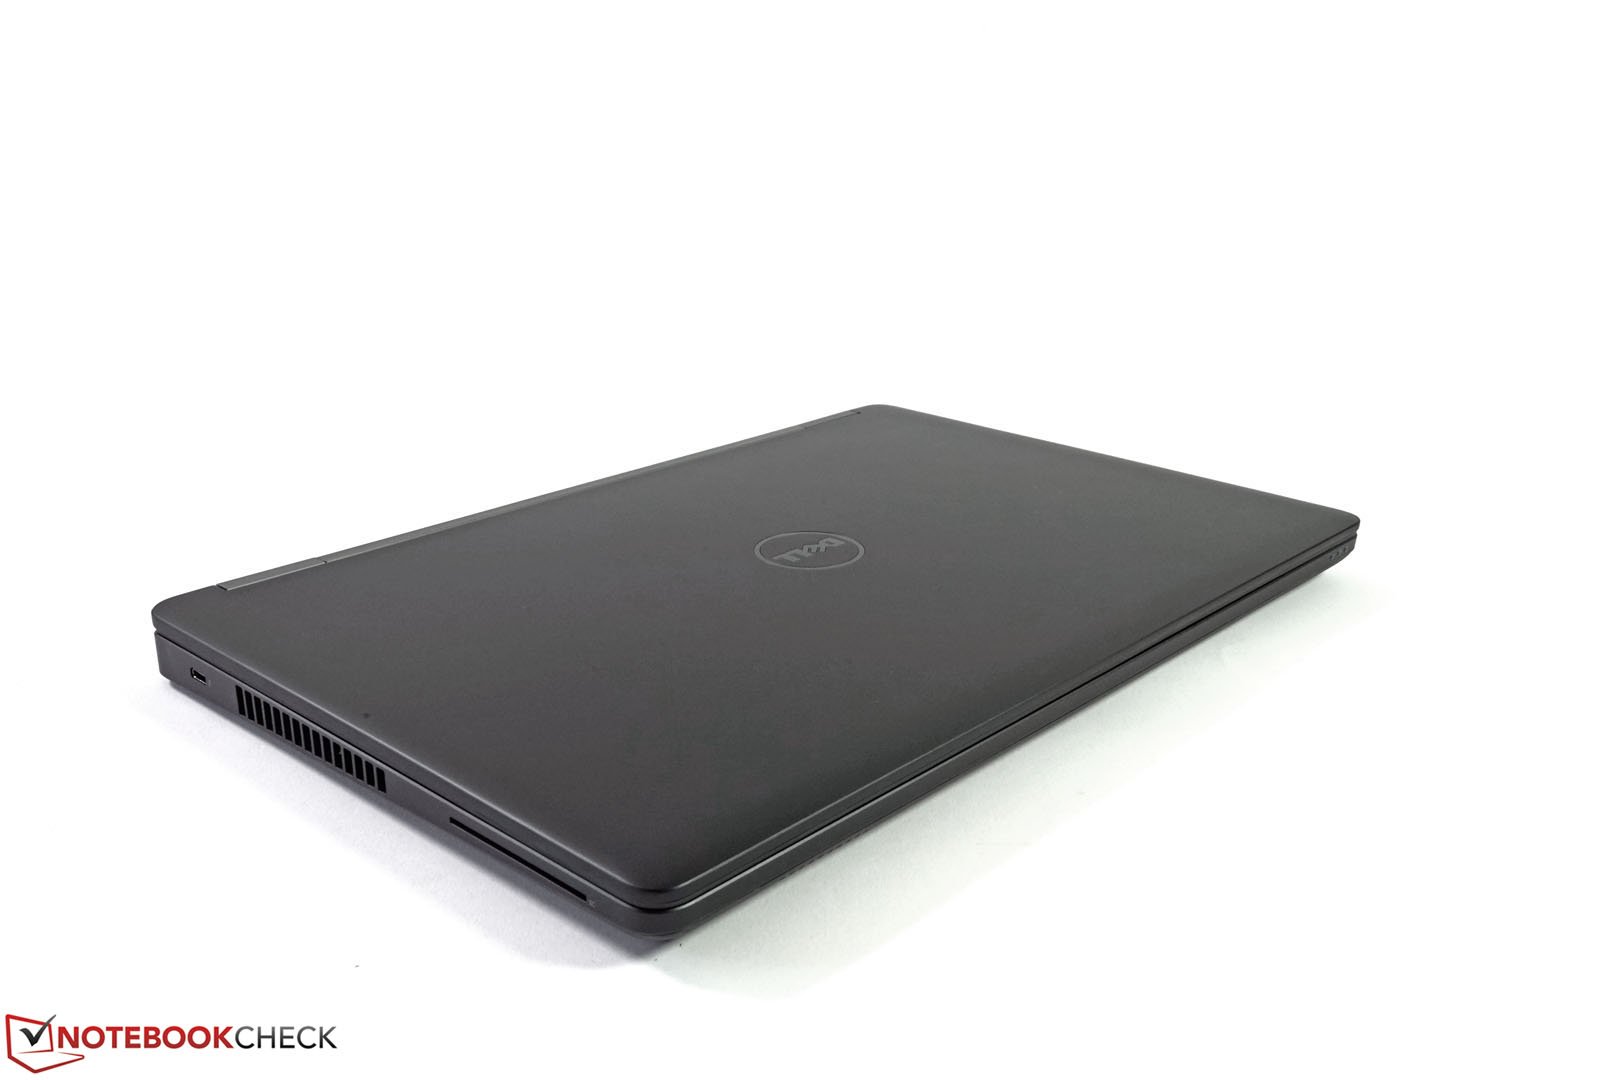
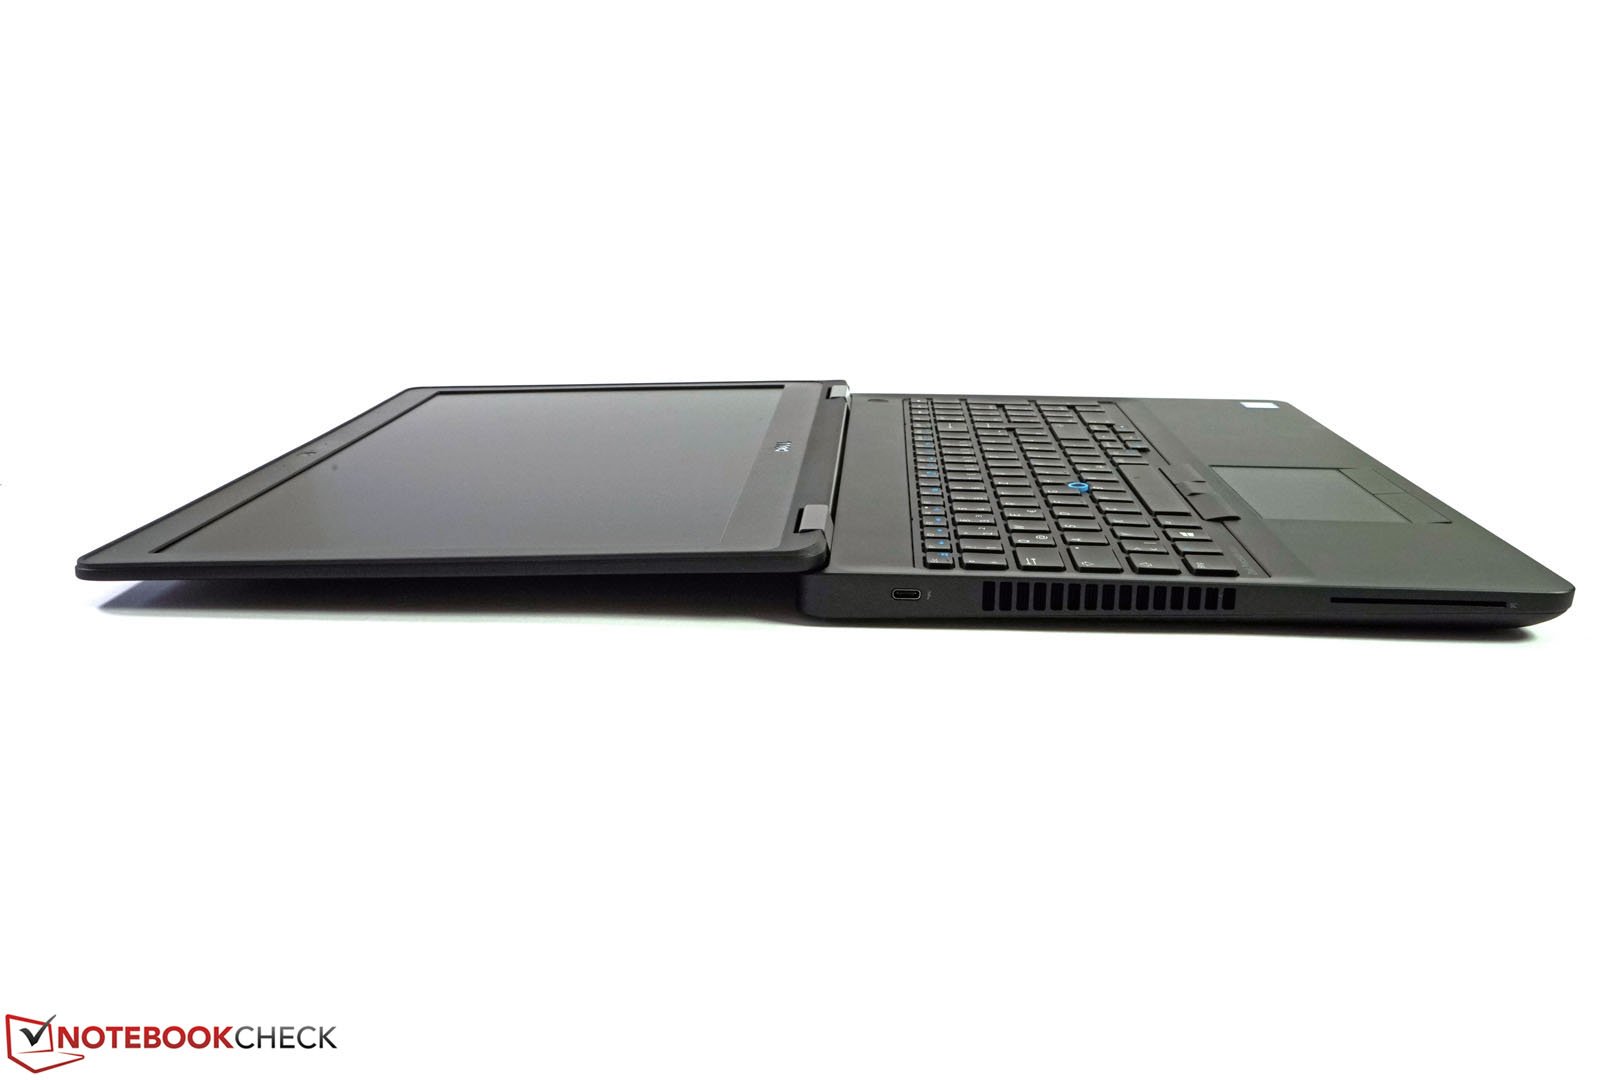
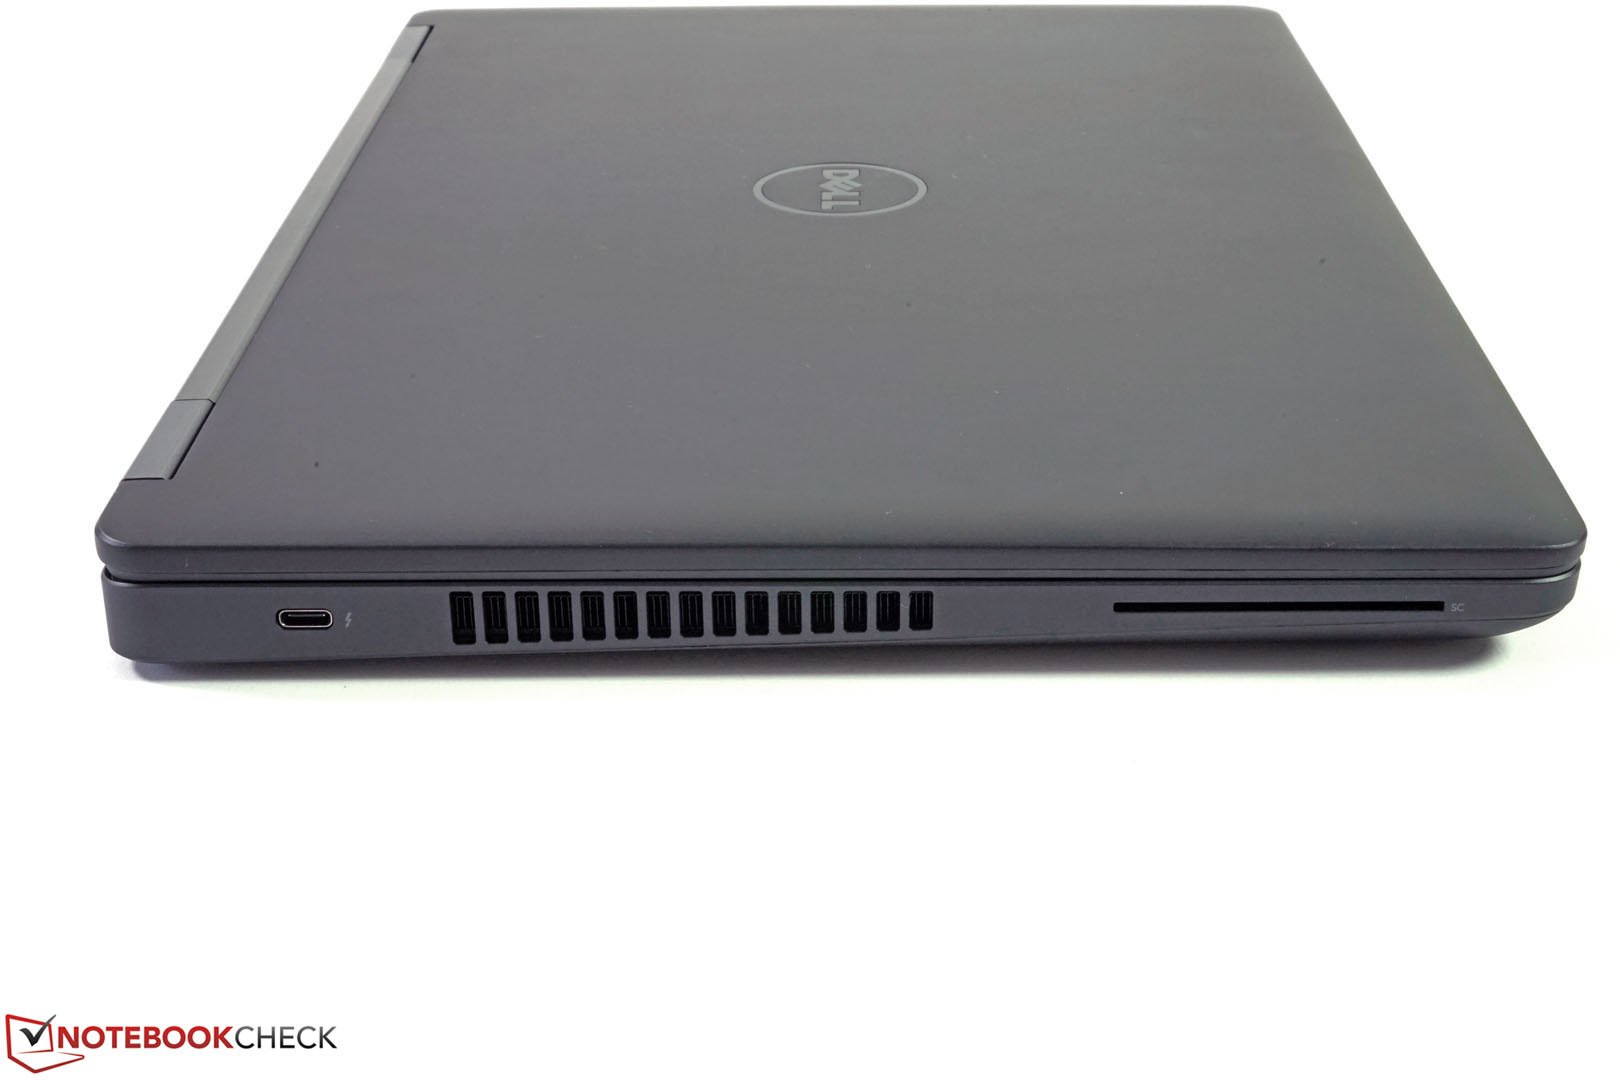
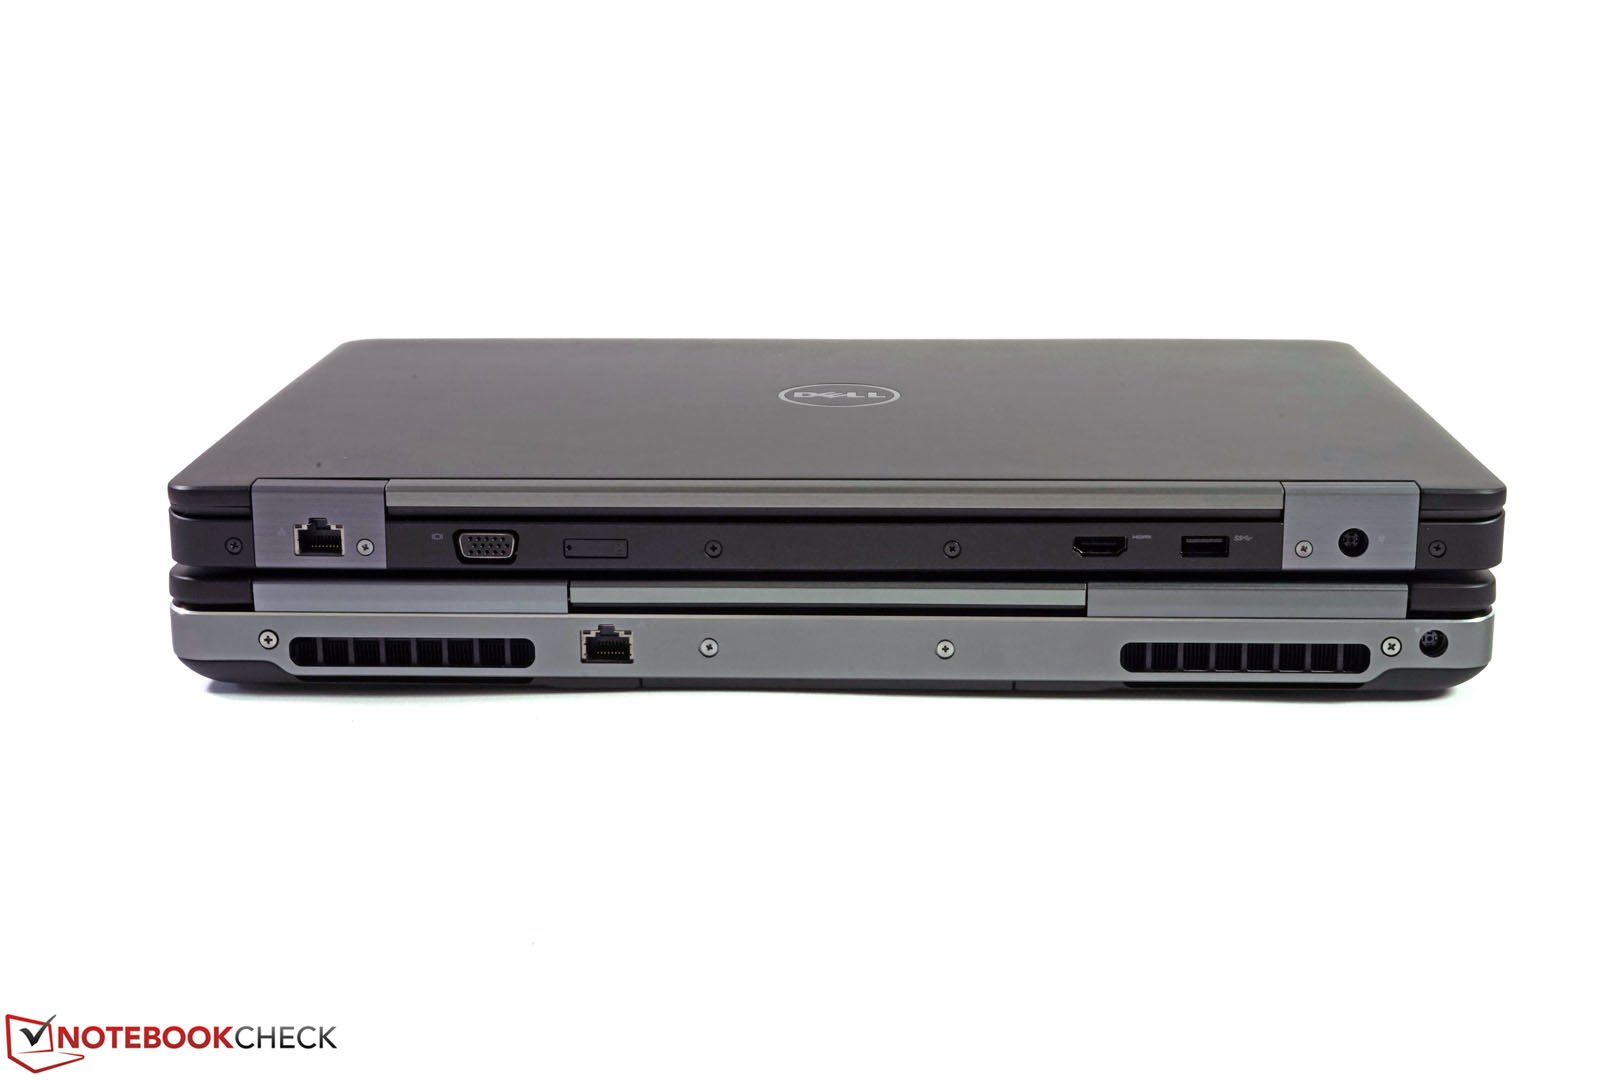
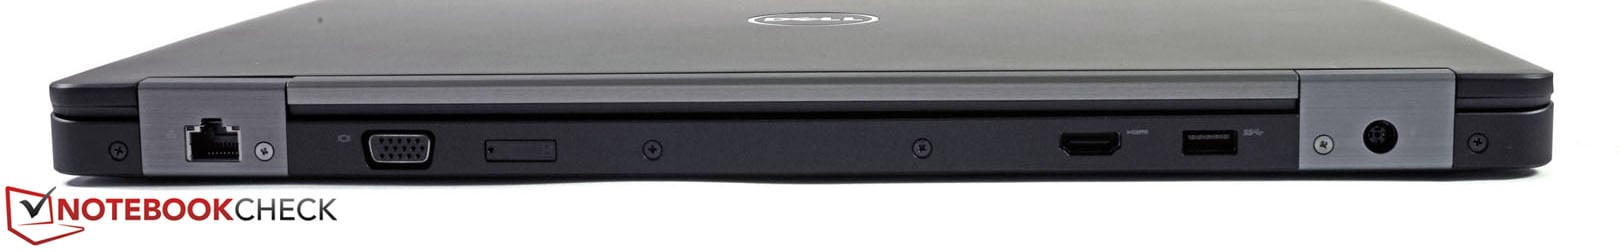
Le Dell Precision 3510 est un appareil professionnel avec un cap pris sur la mobilité. Grâce à sa finesse, son autonomie et son châssis robuste, il constitue une option très intéressante. Sa connectique et les différentes options de garantie et d'assistance disponibles sont des plus indéniables.
La gamme des Precision 3000 affiche un prix attrayant. Il s'agit là d'une entrée de gamme bon marché dans le monde des stations de travail mobiles.
Toutefois, il faudra toujours faire des compromis sur un point fâcheux : les performances. En charges soutenues, les performances chutent tandis que l'appareil devient réellement dérangeant. Un autre point de mécontentement concerne son évolutivité limitée et ses performances CAO en général. Certains références rivales offrent tout simplement plus.
Alors que vous pourriez être en mesure d'accepter ces sacrifices en fonction de votre utilisation, l'écran, composant plus commun, risque de faire plus d'un déçu. Compte tenu de l'orientation professionnelle de l'appareil, aucune des caractéristiques de la dalle (résolution, luminosité, contraste, gamut des couleurs, homogénéité de la luminosité, stabilité des angles de vue) répondent aux exigences de la clientèle ciblée.
Heureusement, Dell propose d'autres dalles dans le configurateur de sa boutique en ligne. Opter pour un écran procurera une bien meilleure expérience.
Pour plus de détails, vous trouverez la version complète (en anglais) de ce test ici.
Dell Precision 3510
-
07/17/2016 v5.1(old)
Tobias Winkler
Pricecompare
