 Deutsch
 English
 Español
 Français
 Italiano
 Nederlands
 Polski
 Português
 Русский
 Türkçe
 Svenska
 Chinese
 Magyar
Courte critique du Lenovo ThinkPad X260 (Core i7, FHD)
| |||||||||||||||||||||||||
Homogénéité de la luminosité: 91 %
Valeur mesurée au centre, sur batterie: 333 cd/m²
Contraste: 1053:1 (Valeurs des noirs: 0.32 cd/m²)
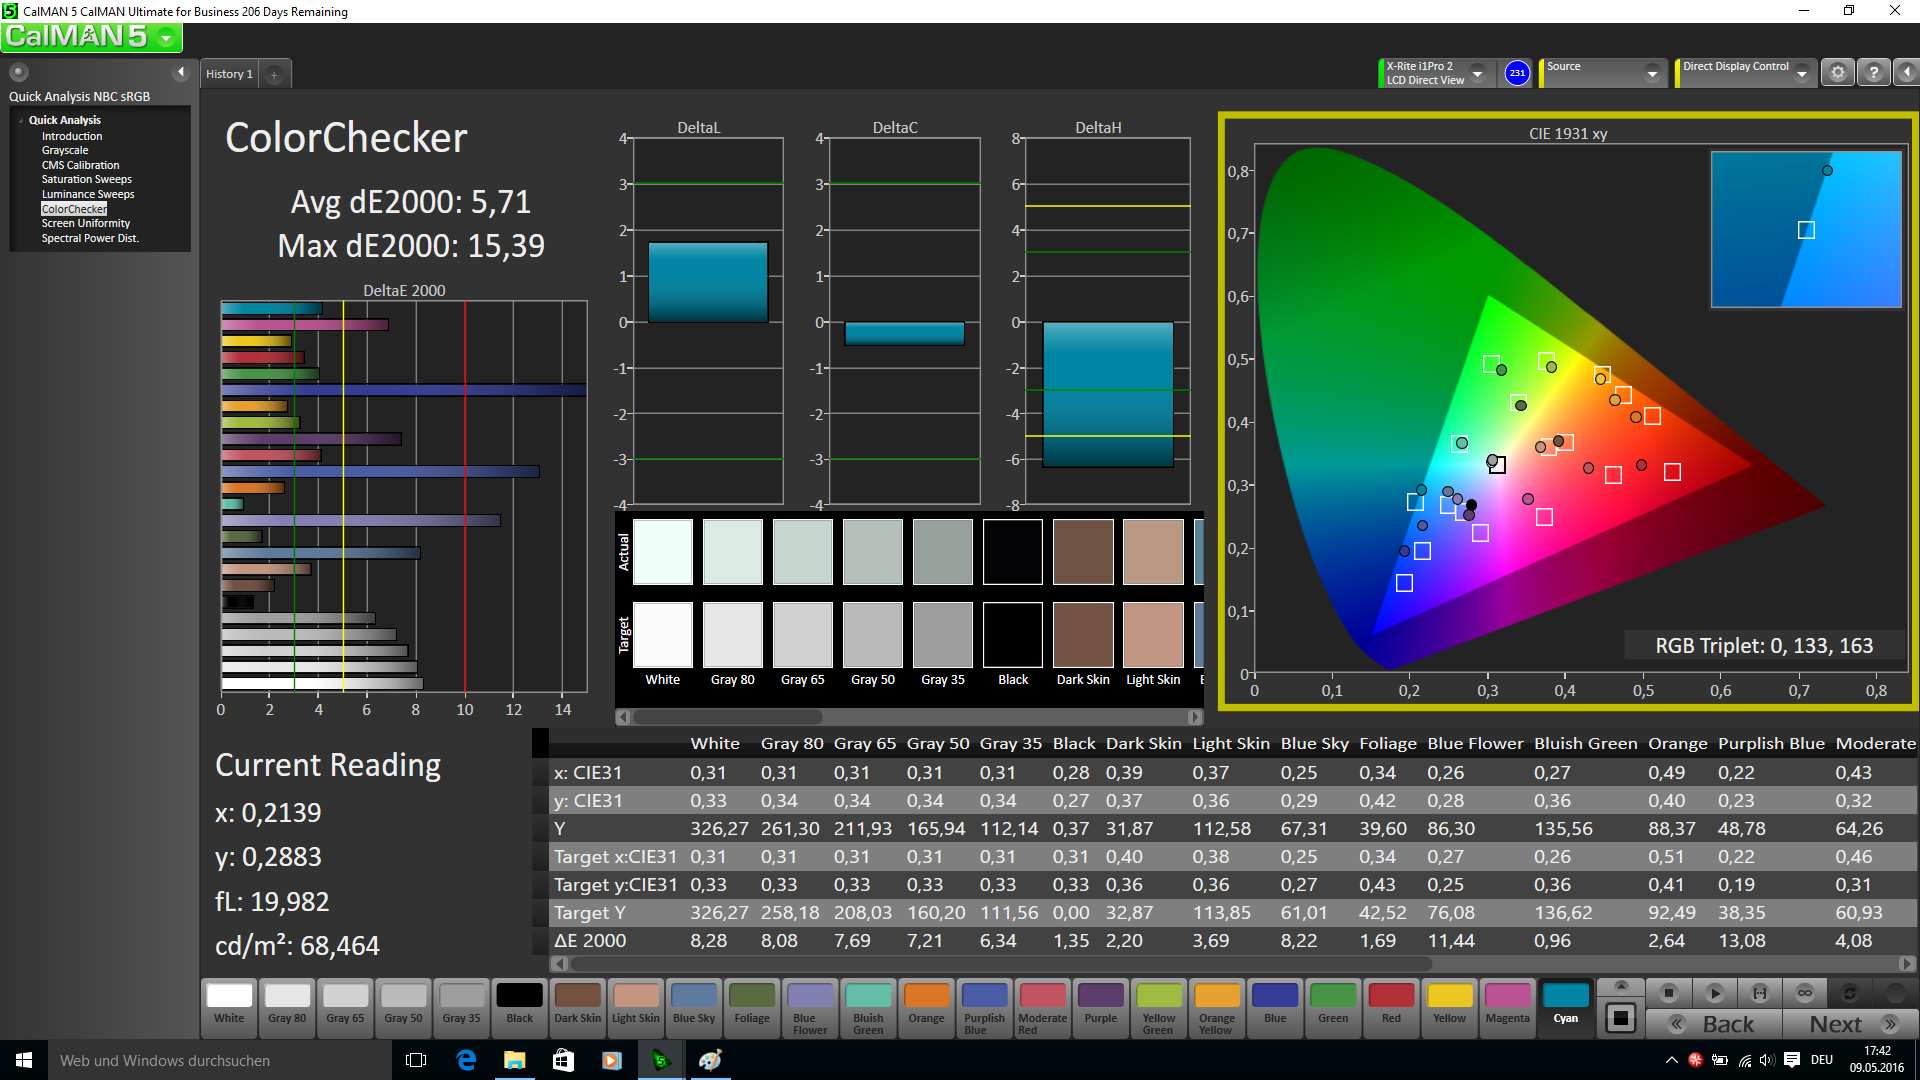
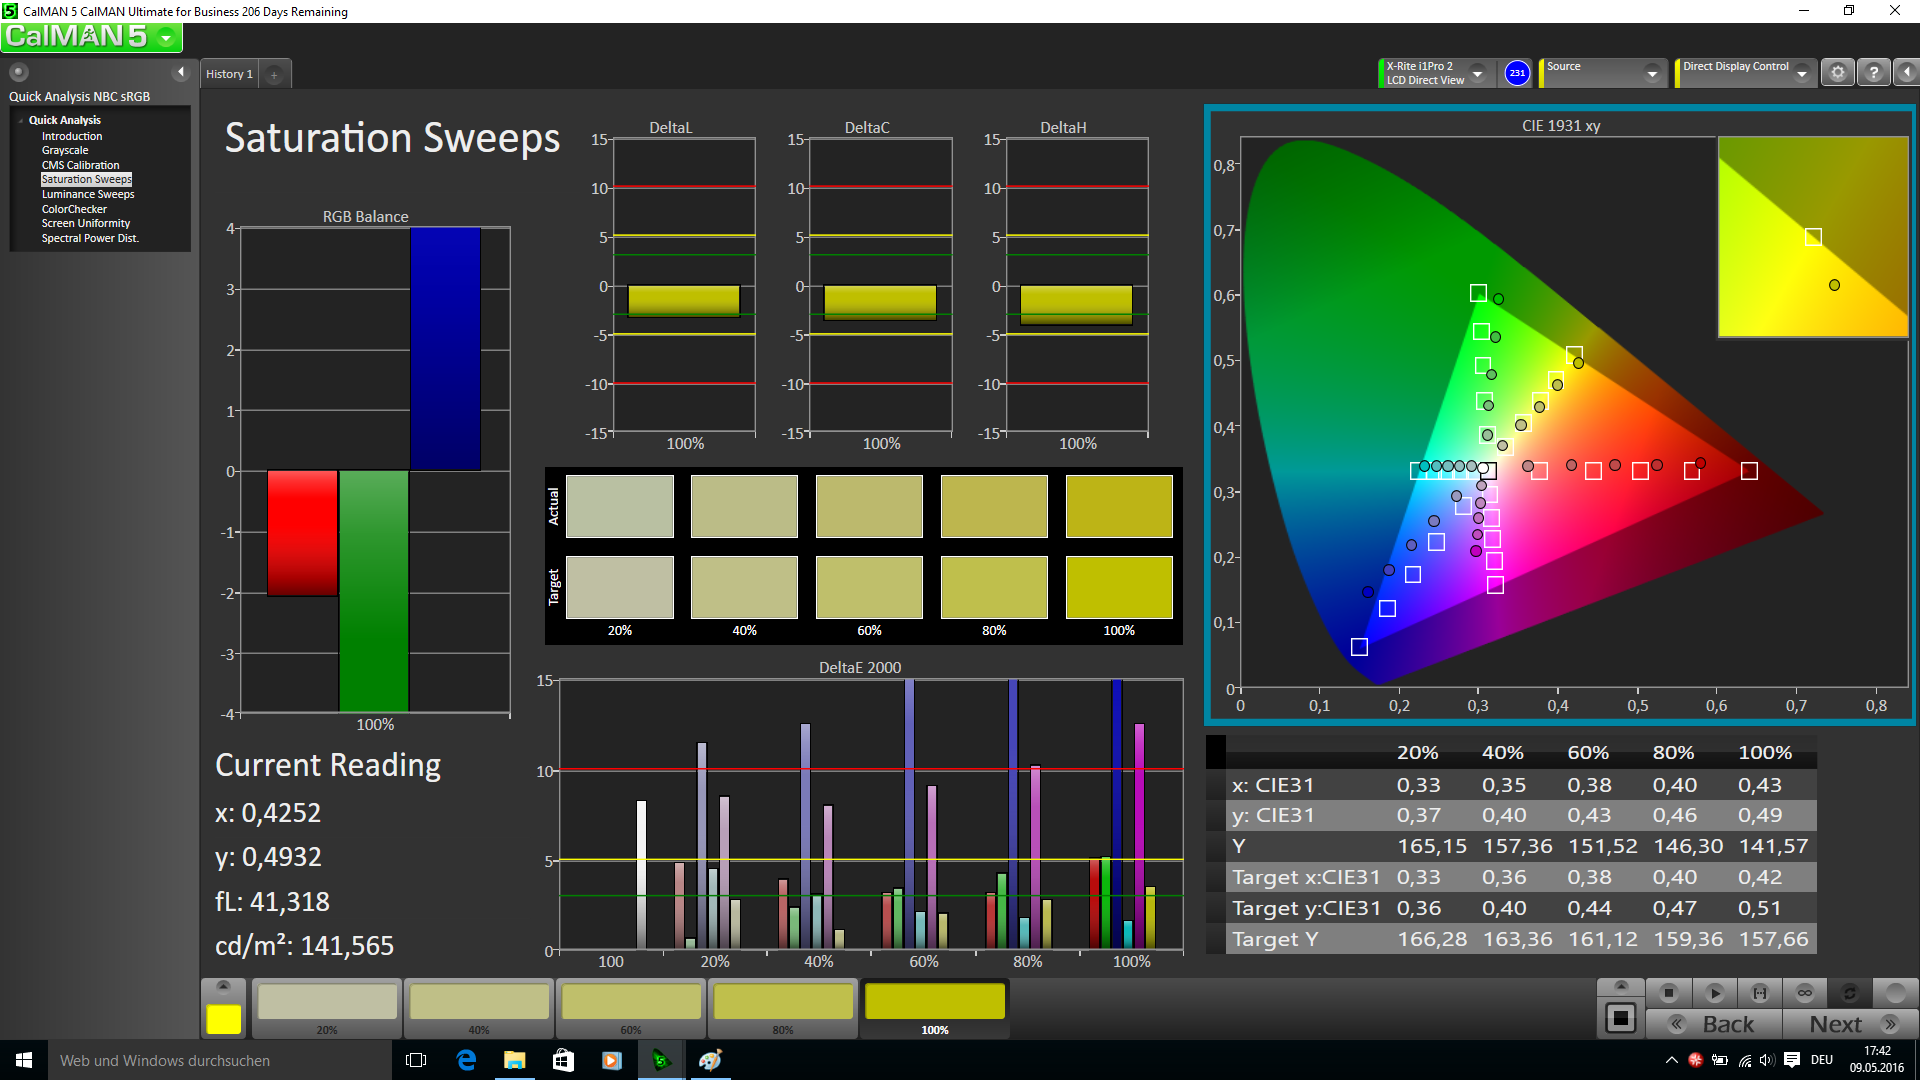
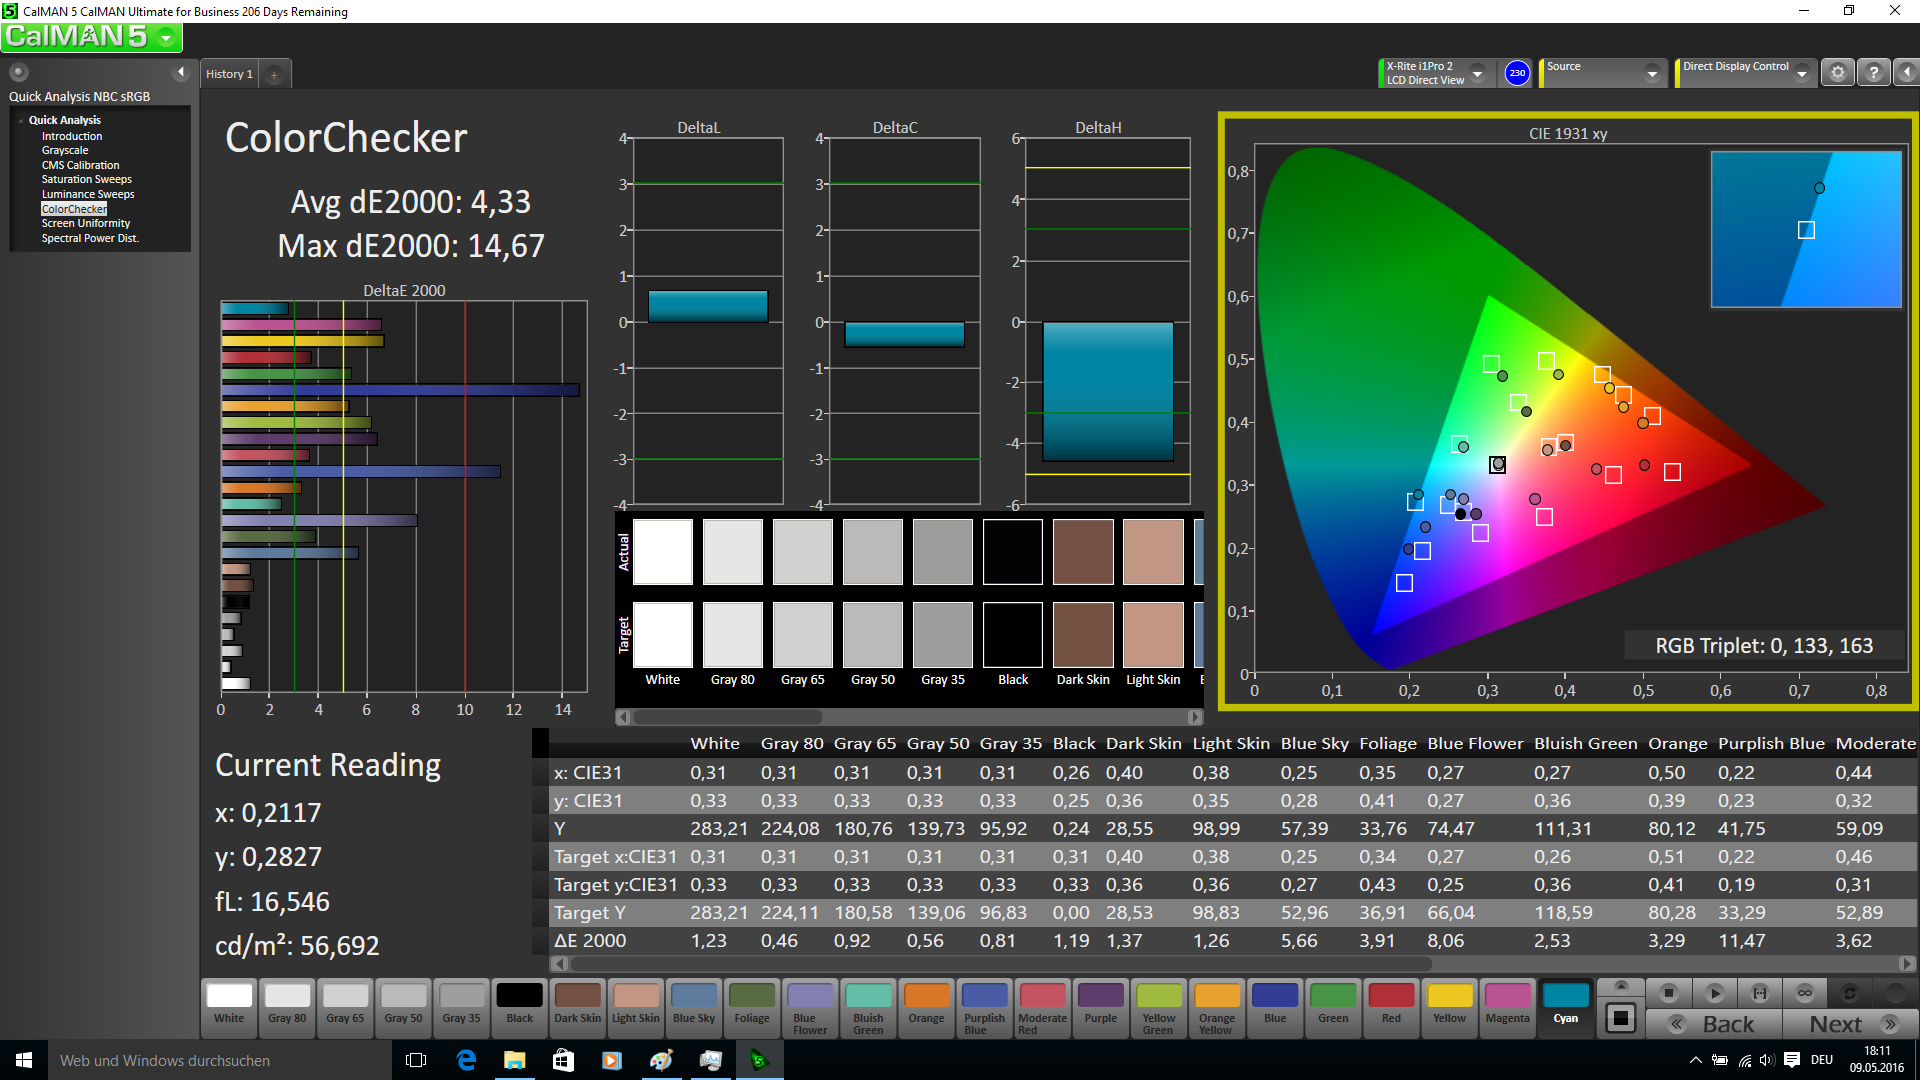
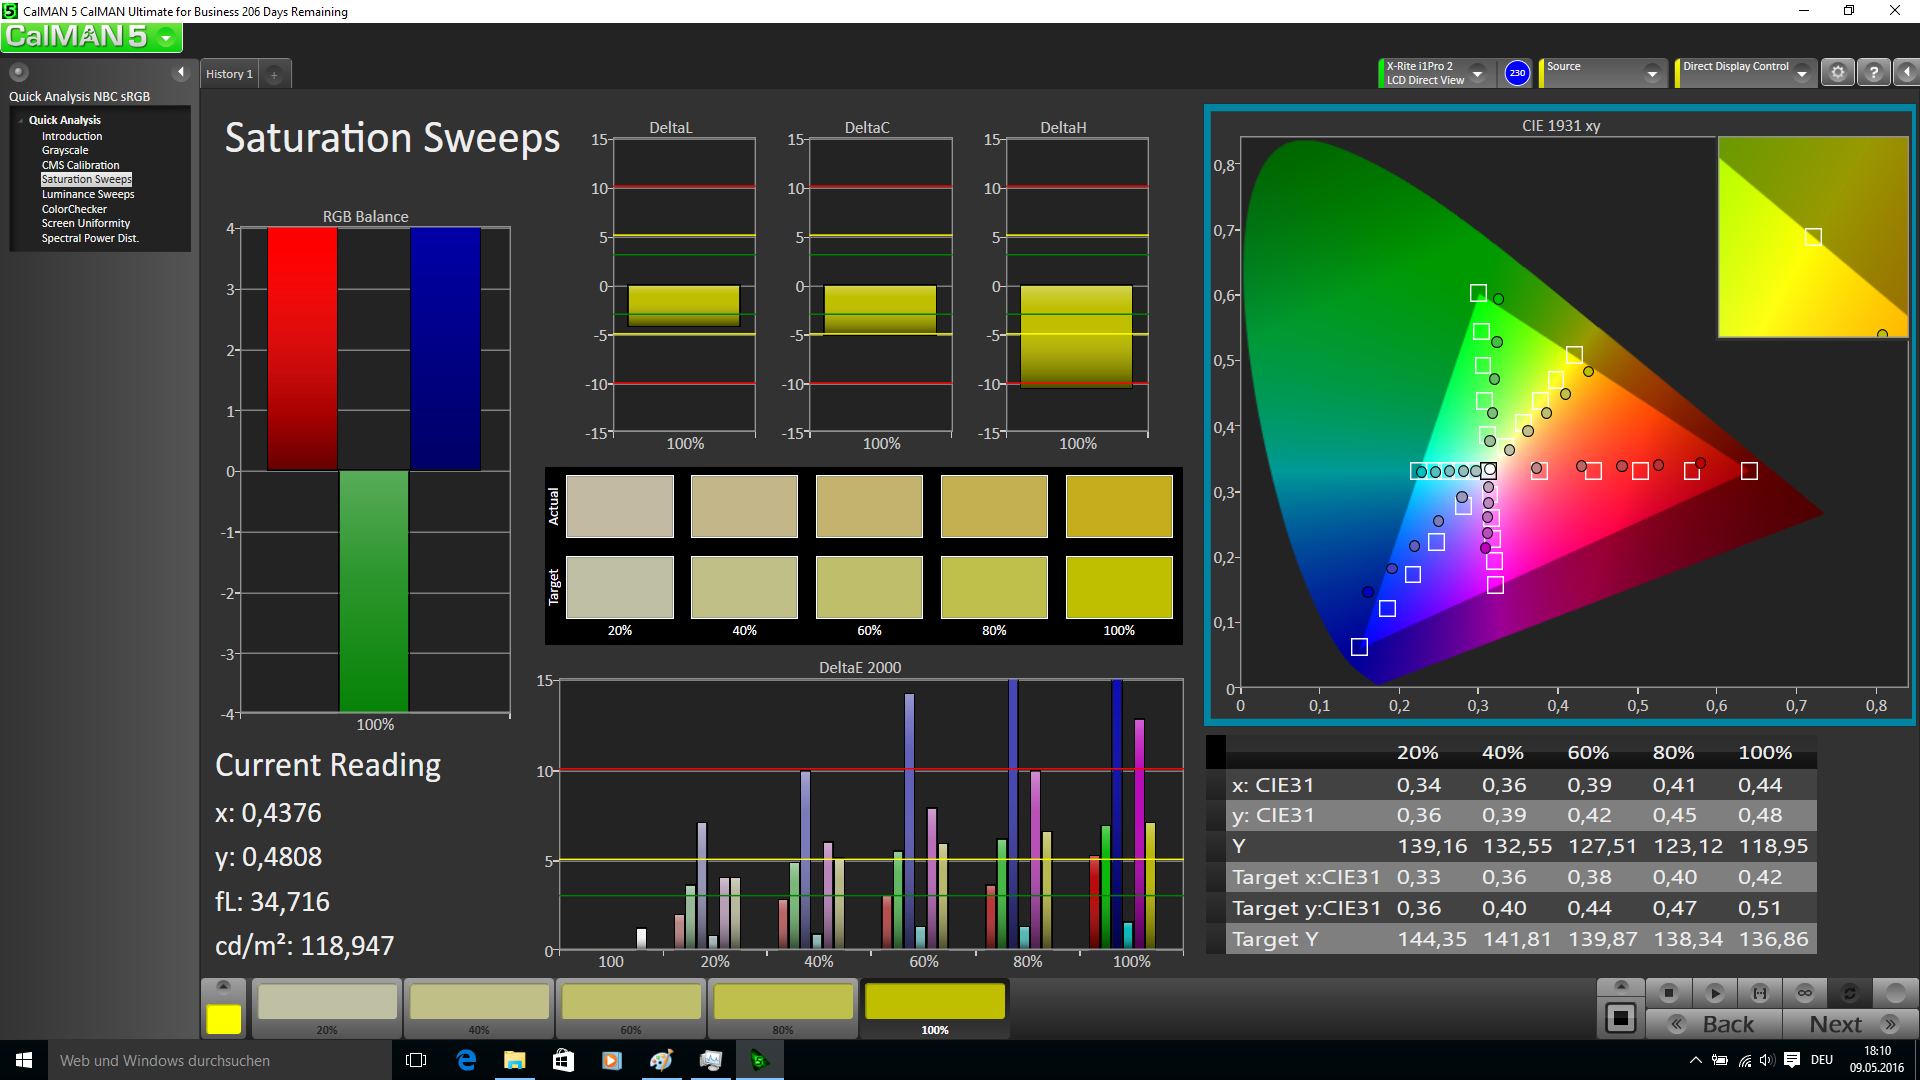
ΔE Color 5.71 | 0.5-29.43 Ø5
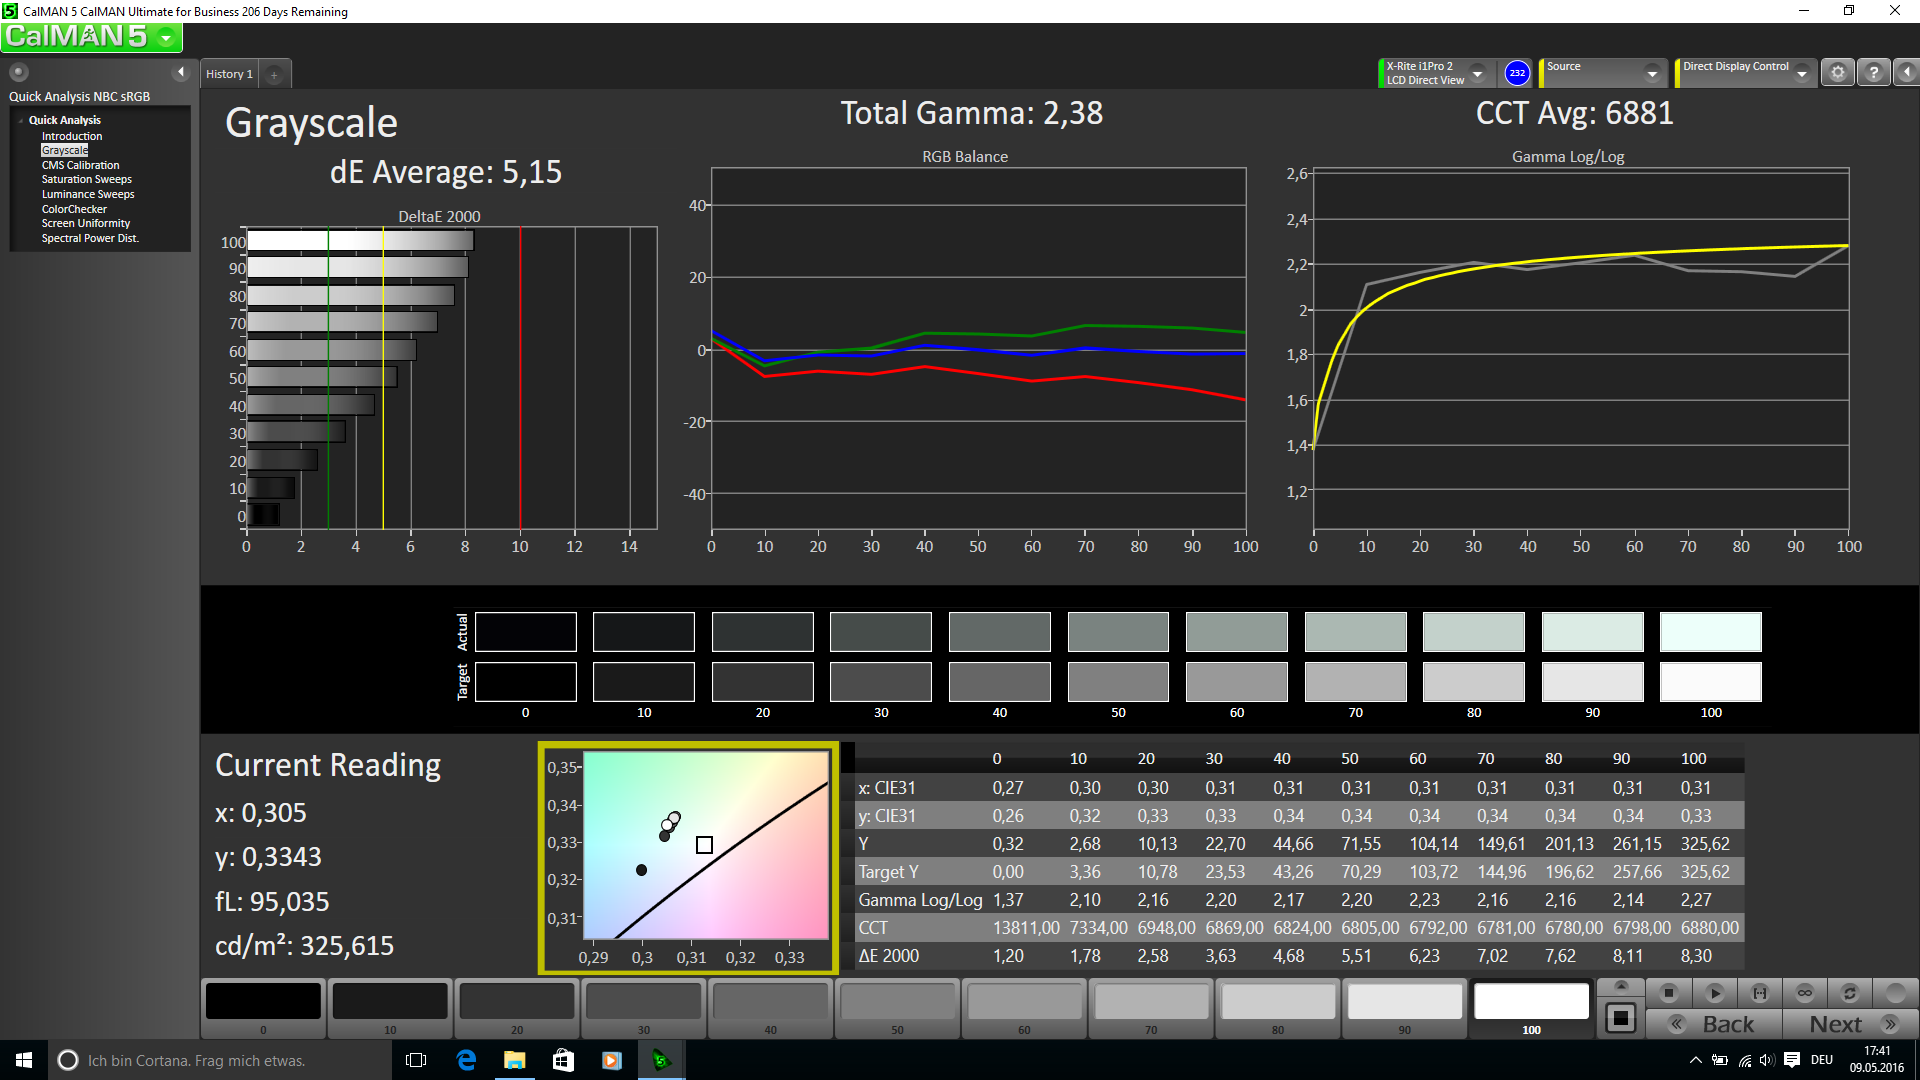
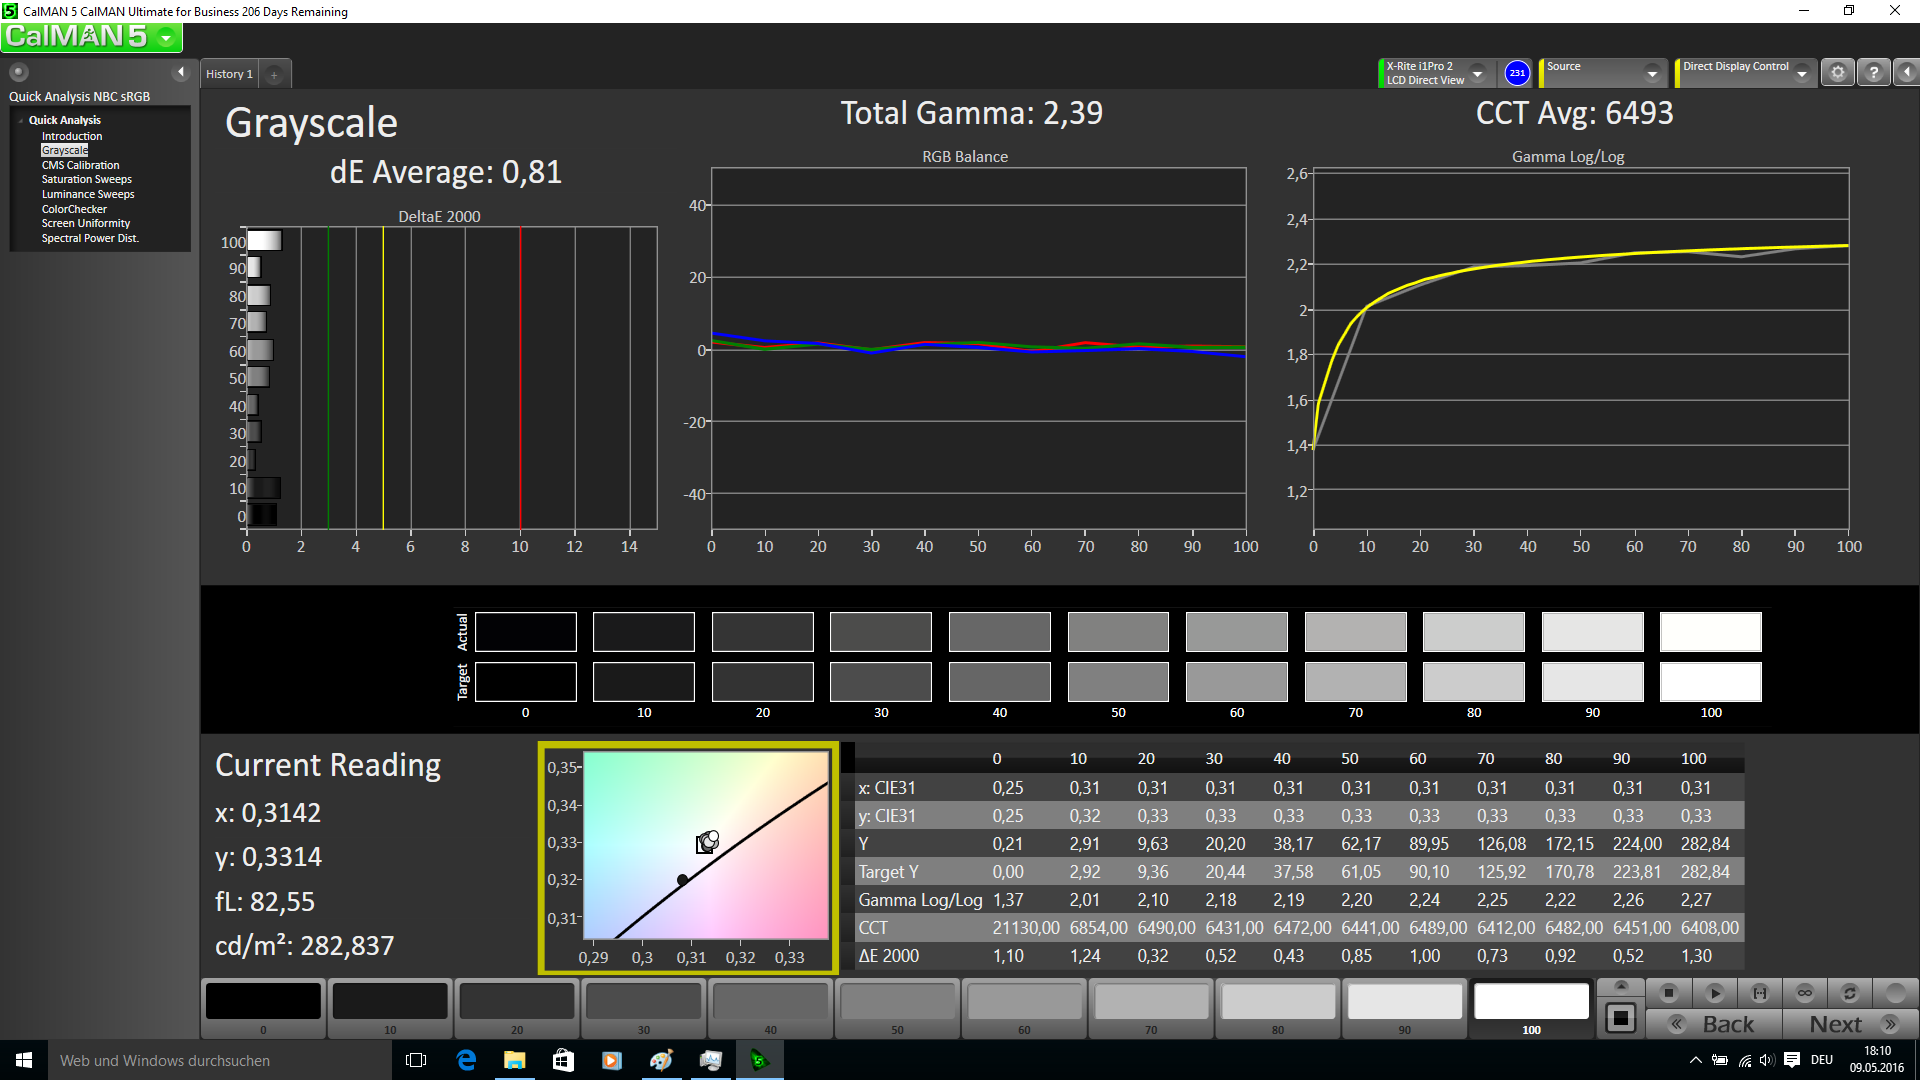
ΔE Greyscale 5.15 | 0.57-98 Ø5.3
65.62% sRGB (Argyll 1.6.3 3D)
42.38% AdobeRGB 1998 (Argyll 1.6.3 3D)
46.23% AdobeRGB 1998 (Argyll 2.2.0 3D)
66.1% sRGB (Argyll 2.2.0 3D)
44.71% Display P3 (Argyll 2.2.0 3D)
Gamma: 2.38
Scintillement / MLI (Modulation de largeur d'impulsion)
| Scintillement / MLI (Modulation de largeur d'impulsion) non décelé | ||
En comparaison, 53 % des appareils testés n'emploient pas MDI pour assombrir leur écran. Nous avons relevé une moyenne à 17924 (minimum : 5 - maximum : 3846000) Hz dans le cas où une MDI était active. | ||
Temps de réponse de l'écran
| ↔ Temps de réponse noir à blanc | ||
|---|---|---|
| 27.2 ms ... hausse ↗ et chute ↘ combinées | ↗ 12.4 ms hausse | 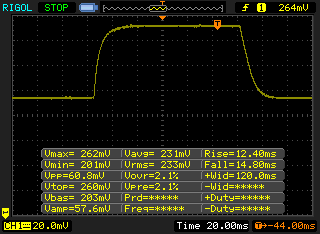 |
| ↘ 14.8 ms chute | ||
| L'écran souffre de latences relativement élevées, insuffisant pour le jeu. En comparaison, tous les appareils testés affichent entre 0.1 (minimum) et 240 (maximum) ms. » 65 % des appareils testés affichent de meilleures performances. Cela signifie que les latences relevées sont moins bonnes que la moyenne (21.5 ms) de tous les appareils testés. | ||
| ↔ Temps de réponse gris 50% à gris 80% | ||
| 32.8 ms ... hausse ↗ et chute ↘ combinées | ↗ 15.6 ms hausse | 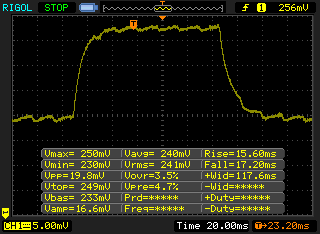 |
| ↘ 17.2 ms chute | ||
| L'écran souffre de latences très élevées, à éviter pour le jeu. En comparaison, tous les appareils testés affichent entre 0.2 (minimum) et 636 (maximum) ms. » 38 % des appareils testés affichent de meilleures performances. Cela signifie que les latences relevées sont similaires à la moyenne (33.7 ms) de tous les appareils testés. | ||
| Lenovo ThinkPad X260-20F6007RGE IPS, 1920x1080 | Lenovo ThinkPad X260-20F60041GE IPS, 1366x768 | HP EliteBook 820 G3 TN LED, 1366x768 | Dell Latitude 12 E7250 TN-LED, 1920x1080 | Microsoft Surface Pro 4, Core i5, 128GB IPS, 2736x1824 | |
|---|---|---|---|---|---|
| Display | 9% | -12% | -1% | 45% | |
| Display P3 Coverage | 44.71 | 48.19 8% | 38.9 -13% | 44.48 -1% | 65 45% |
| sRGB Coverage | 66.1 | 72.6 10% | 58.5 -11% | 66.2 0% | 96.5 46% |
| AdobeRGB 1998 Coverage | 46.23 | 49.79 8% | 40.2 -13% | 45.96 -1% | 67 45% |
| Response Times | -15% | -42% | -28% | ||
| Response Time Grey 50% / Grey 80% * | 32.8 ? | 42.8 ? -30% | 58 ? -77% | 46 ? -40% | |
| Response Time Black / White * | 27.2 ? | 27.2 ? -0% | 29.2 ? -7% | 31.2 ? -15% | |
| PWM Frequency | 220 ? | 50 ? | |||
| Screen | 12% | -38% | -10% | 22% | |
| Brightness middle | 337 | 262 -22% | 244 -28% | 360 7% | 413 23% |
| Brightness | 322 | 251 -22% | 240 -25% | 330 2% | 396 23% |
| Brightness Distribution | 91 | 88 -3% | 84 -8% | 81 -11% | 87 -4% |
| Black Level * | 0.32 | 0.26 19% | 0.6 -88% | 0.53 -66% | 0.36 -13% |
| Contrast | 1053 | 1008 -4% | 407 -61% | 679 -36% | 1147 9% |
| Colorchecker dE 2000 * | 5.71 | 3.55 38% | 9 -58% | 5.58 2% | 3.09 46% |
| Colorchecker dE 2000 max. * | 15.39 | 5.85 62% | 15.73 -2% | ||
| Greyscale dE 2000 * | 5.15 | 3.36 35% | 9.48 -84% | 3.98 23% | 3.92 24% |
| Gamma | 2.38 92% | 2.39 92% | 2.44 90% | 2.21 100% | 2.3 96% |
| CCT | 6881 94% | 5985 109% | 11116 58% | 6192 105% | 7333 89% |
| Color Space (Percent of AdobeRGB 1998) | 42.38 | 45.9 8% | 37.18 -12% | 42.2 0% | 61 44% |
| Color Space (Percent of sRGB) | 65.62 | 58.63 -11% | 97 48% | ||
| Moyenne finale (programmes/paramètres) | 2% /
8% | -31% /
-33% | -6% /
-7% | 13% /
20% |
* ... Moindre est la valeur, meilleures sont les performances
| Geekbench 3 | |
| 32 Bit Single-Core Score | |
| Microsoft Surface Pro 4, Core i5, 128GB | |
| Lenovo ThinkPad X260-20F6007RGE | |
| Dell Latitude 12 E7275 | |
| 32 Bit Multi-Core Score | |
| Microsoft Surface Pro 4, Core i5, 128GB | |
| Lenovo ThinkPad X260-20F6007RGE | |
| Dell Latitude 12 E7275 | |
| Sunspider - 1.0 Total Score | |
| Dell Latitude 12 E7275 | |
| Dell Latitude 12 E7250 | |
| Microsoft Surface Pro 4, Core i5, 128GB | |
| Lenovo ThinkPad X260-20F60041GE | |
| Lenovo ThinkPad X260-20F6007RGE | |
| JetStream 1.1 - Total Score | |
| Lenovo ThinkPad X260-20F6007RGE | |
| HP EliteBook 820 G3 | |
| Dell Latitude 12 E7275 | |
| Mozilla Kraken 1.1 - Total | |
| Dell Latitude 12 E7250 | |
| Dell Latitude 12 E7275 | |
| Lenovo ThinkPad X260-20F60041GE | |
| HP EliteBook 820 G3 | |
| Microsoft Surface Pro 4, Core i5, 128GB | |
| Lenovo ThinkPad X260-20F6007RGE | |
| Octane V2 - Total Score | |
| Lenovo ThinkPad X260-20F6007RGE | |
| Microsoft Surface Pro 4, Core i5, 128GB | |
| HP EliteBook 820 G3 | |
| Lenovo ThinkPad X260-20F60041GE | |
| Dell Latitude 12 E7275 | |
| Dell Latitude 12 E7250 | |
| Peacekeeper - --- | |
| Lenovo ThinkPad X260-20F6007RGE | |
| Microsoft Surface Pro 4, Core i5, 128GB | |
| Dell Latitude 12 E7275 | |
* ... Moindre est la valeur, meilleures sont les performances
| PCMark 7 Score | 5194 points | |
| PCMark 8 Home Score Accelerated v2 | 3284 points | |
| PCMark 8 Creative Score Accelerated v2 | 3945 points | |
| PCMark 8 Work Score Accelerated v2 | 4341 points | |
Aide | ||
| PCMark 8 - Work Score Accelerated v2 | |
| HP EliteBook 820 G3 | |
| Lenovo ThinkPad X260-20F6007RGE | |
| Lenovo ThinkPad X260-20F60041GE | |
| Microsoft Surface Pro 4, Core i5, 128GB | |
| Dell Latitude 12 E7275 | |
| PCMark 7 - Score | |
| Microsoft Surface Pro 4, Core i5, 128GB | |
| Lenovo ThinkPad X260-20F6007RGE | |
| Dell Latitude 12 E7250 | |
| Dell Latitude 12 E7275 | |
| Lenovo ThinkPad X260-20F60041GE | |

| 3DMark 06 Standard Score | 8553 points | |
| 3DMark 11 Performance | 1406 points | |
| 3DMark Ice Storm Standard Score | 47266 points | |
| 3DMark Cloud Gate Standard Score | 5321 points | |
| 3DMark Fire Strike Score | 747 points | |
Aide | ||
| 3DMark 11 - 1280x720 Performance | |
| Microsoft Surface Pro 4, Core i5, 128GB | |
| HP EliteBook 820 G3 | |
| Lenovo ThinkPad X260-20F6007RGE | |
| Lenovo ThinkPad X260-20F60041GE | |
| Dell Latitude 12 E7275 | |
| Dell Latitude 12 E7250 | |
| 3DMark 06 - 1280x1024 Standard Score AA:0x AF:0x | |
| Lenovo ThinkPad X260-20F6007RGE | |
| Dell Latitude 12 E7275 | |
| Bas | Moyen | Élevé | Ultra | |
| Tomb Raider (2013) | 56.8 | 28.1 | 18.6 | 8.9 |
| BioShock Infinite (2013) | 37.7 | 22 | 18.3 | 5.4 |
| Battlefield 4 (2013) | 36.7 | 26.4 | 15.8 | 4.4 |
Degré de la nuisance sonore
| Au repos |
| 29 / 29 / 29 dB(A) |
| Fortement sollicité |
| 35.1 / 37.8 dB(A) |
 | ||
30 dB silencieux 40 dB(A) audible 50 dB(A) bruyant |
||
min: | ||
| Lenovo ThinkPad X260-20F6007RGE 6500U, HD Graphics 520 | Lenovo ThinkPad X260-20F60041GE 6200U, HD Graphics 520 | HP EliteBook 820 G3 6300U, HD Graphics 520 | Dell Latitude 12 E7250 5300U, HD Graphics 5500 | Microsoft Surface Pro 4, Core i5, 128GB 6300U, HD Graphics 520 | |
|---|---|---|---|---|---|
| Noise | 2% | -1% | -5% | -10% | |
| off / environment * | 29 | 29 -0% | 29.2 -1% | ||
| Idle Minimum * | 29 | 29.4 -1% | 29.2 -1% | 29.3 -1% | 31.5 -9% |
| Idle Average * | 29 | 29.4 -1% | 29.2 -1% | 29.3 -1% | 31.5 -9% |
| Idle Maximum * | 29 | 29.4 -1% | 29.2 -1% | 29.3 -1% | 31.5 -9% |
| Load Average * | 35.1 | 33.2 5% | 35.6 -1% | 37.9 -8% | 40.5 -15% |
| Load Maximum * | 37.8 | 33.2 12% | 37 2% | 42.8 -13% | 40.7 -8% |
* ... Moindre est la valeur, meilleures sont les performances
(-) La température maximale du côté supérieur est de 47.5 °C / 118 F, par rapport à la moyenne de 35.9 °C / 97 F, allant de 21.4 à 59 °C pour la classe Subnotebook.
(±) Le fond chauffe jusqu'à un maximum de 43.6 °C / 110 F, contre une moyenne de 39.4 °C / 103 F
(+) En utilisation inactive, la température moyenne du côté supérieur est de 30.9 °C / 88 F, par rapport à la moyenne du dispositif de 30.7 °C / 87 F.
(+) Les repose-poignets et le pavé tactile atteignent la température maximale de la peau (32.3 °C / 90.1 F) et ne sont donc pas chauds.
(-) La température moyenne de la zone de l'appui-paume de dispositifs similaires était de 28.3 °C / 82.9 F (-4 °C / #-7.2 F).
| Lenovo ThinkPad X260-20F6007RGE 6500U, HD Graphics 520 | Lenovo ThinkPad X260-20F60041GE 6200U, HD Graphics 520 | HP EliteBook 820 G3 6300U, HD Graphics 520 | Dell Latitude 12 E7250 5300U, HD Graphics 5500 | Microsoft Surface Pro 4, Core i5, 128GB 6300U, HD Graphics 520 | |
|---|---|---|---|---|---|
| Heat | 5% | 14% | -1% | -13% | |
| Maximum Upper Side * | 47.5 | 45.3 5% | 39.6 17% | 46.7 2% | 52.3 -10% |
| Maximum Bottom * | 43.6 | 48.8 -12% | 40.1 8% | 56 -28% | 51.4 -18% |
| Idle Upper Side * | 34.9 | 29.3 16% | 29.4 16% | 30.1 14% | 43.2 -24% |
| Idle Bottom * | 35.9 | 32.4 10% | 30.6 15% | 33.2 8% | 36 -0% |
* ... Moindre est la valeur, meilleures sont les performances
| Éteint/en veille | |
| Au repos | |
| Fortement sollicité |
|
| Lenovo ThinkPad X260-20F6007RGE 6500U, HD Graphics 520 | Lenovo ThinkPad X260-20F60041GE 6200U, HD Graphics 520 | HP EliteBook 820 G3 6300U, HD Graphics 520 | Dell Latitude 12 E7250 5300U, HD Graphics 5500 | Microsoft Surface Pro 4, Core i5, 128GB 6300U, HD Graphics 520 | |
|---|---|---|---|---|---|
| Power Consumption | 1% | 4% | -23% | -13% | |
| Idle Minimum * | 3.5 | 3.6 -3% | 3.5 -0% | 4.1 -17% | 4.4 -26% |
| Idle Average * | 5.5 | 5.9 -7% | 5.4 2% | 8.3 -51% | 9 -64% |
| Idle Maximum * | 6.7 | 6.6 1% | 6.2 7% | 9.4 -40% | 10.7 -60% |
| Load Average * | 28.9 | 28.5 1% | 27.3 6% | 31.6 -9% | 19.6 32% |
| Load Maximum * | 42.1 | 36.8 13% | 39.5 6% | 40.4 4% | 19.9 53% |
* ... Moindre est la valeur, meilleures sont les performances
| Lenovo ThinkPad X260-20F6007RGE 46 Wh | Lenovo ThinkPad X260-20F60041GE 46 Wh | HP EliteBook 820 G3 44 Wh | Dell Latitude 12 E7250 52 Wh | Microsoft Surface Pro 4, Core i5, 128GB 38 Wh | |
|---|---|---|---|---|---|
| Autonomie de la batterie | 5% | 6% | -4% | 0% | |
| Reader / Idle | 953 | 795 -17% | 826 -13% | 845 -11% | 899 -6% |
| H.264 | 466 | 386 -17% | 495 6% | 402 -14% | |
| WiFi v1.3 | 501 | 396 -21% | 373 -26% | 427 -15% | |
| Load | 92 | 160 74% | 144 57% | 103 12% | 111 21% |
| WiFi | 446 |
Points positifs
Points négatifs
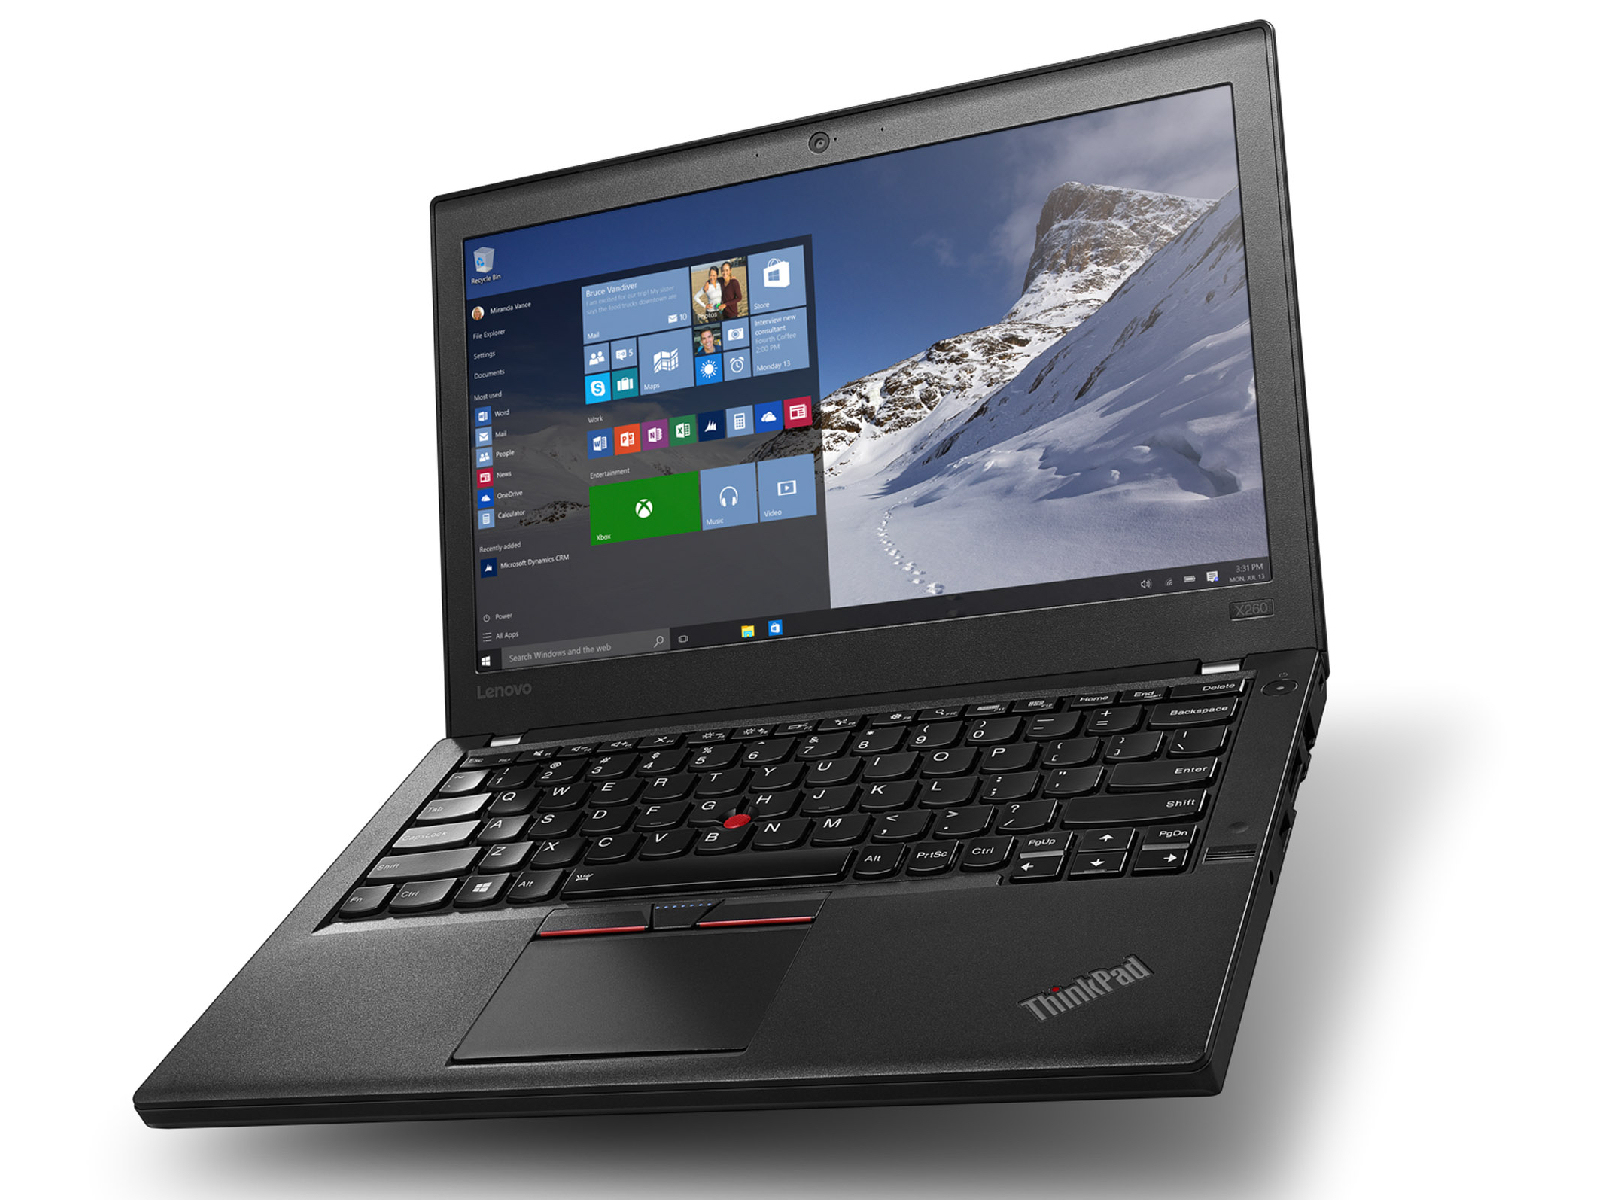
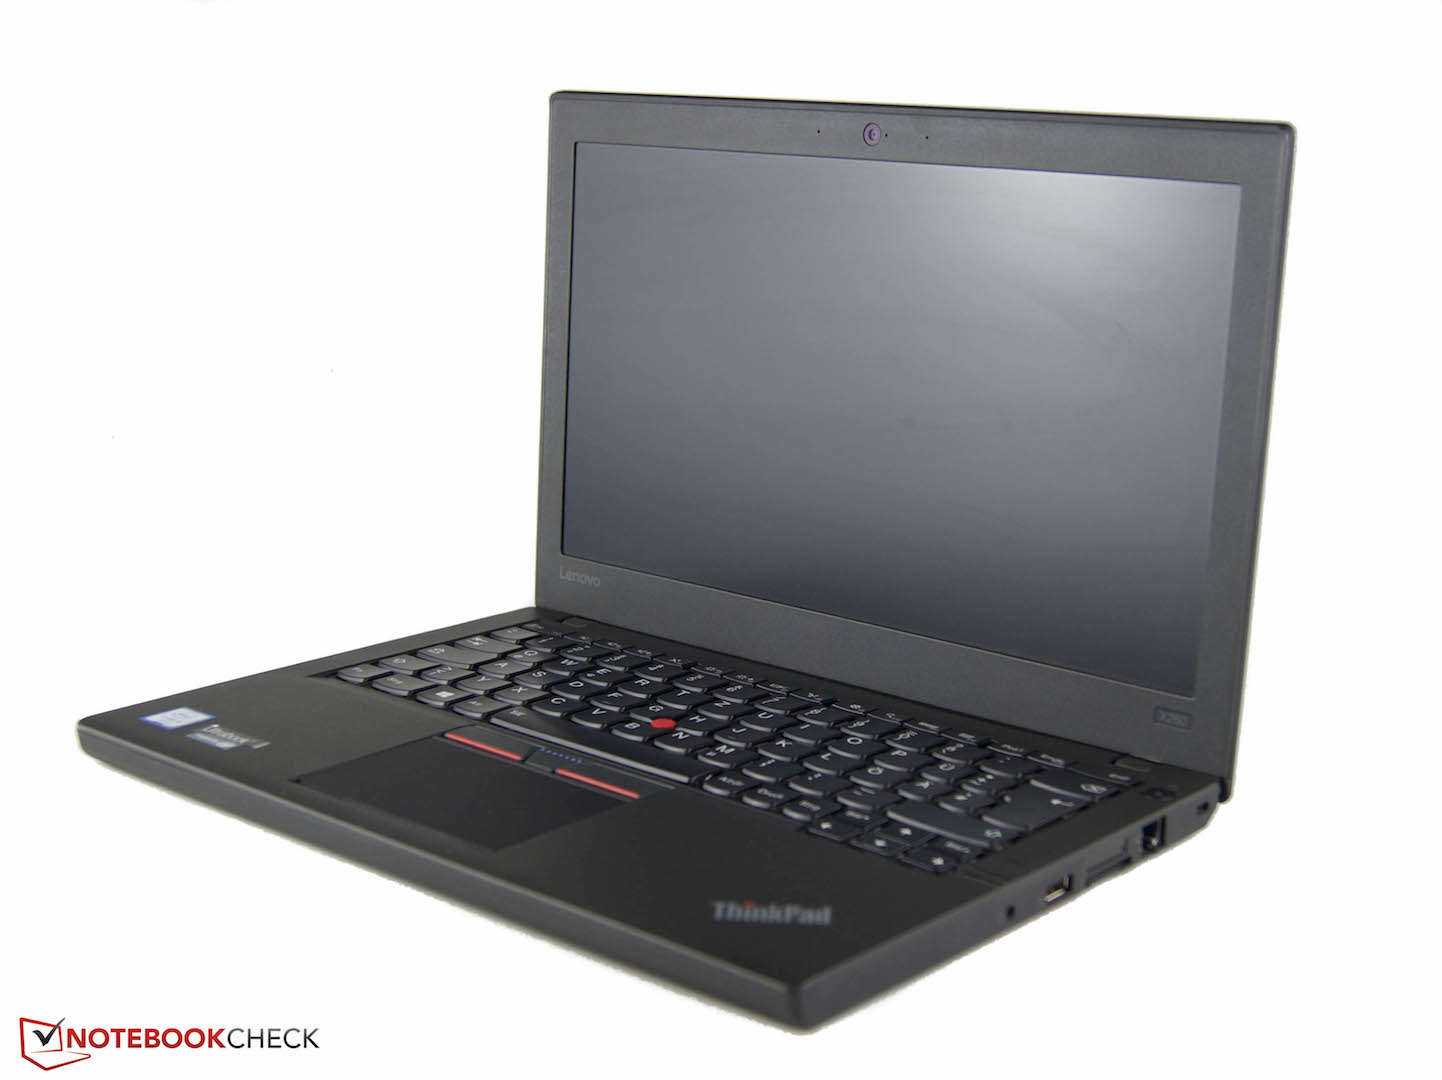
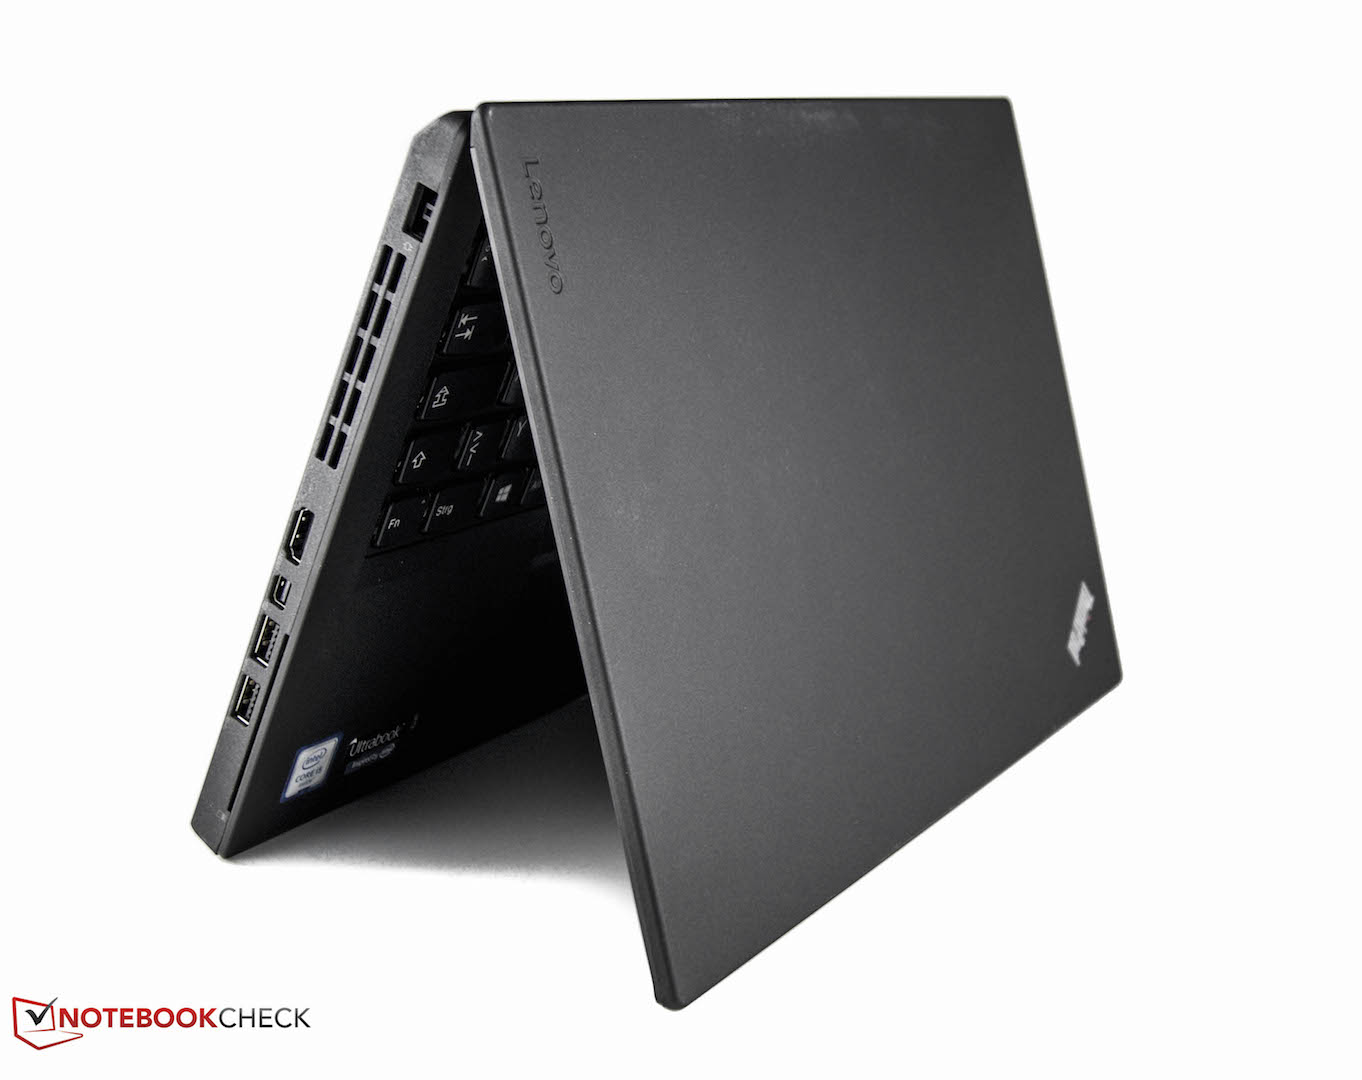
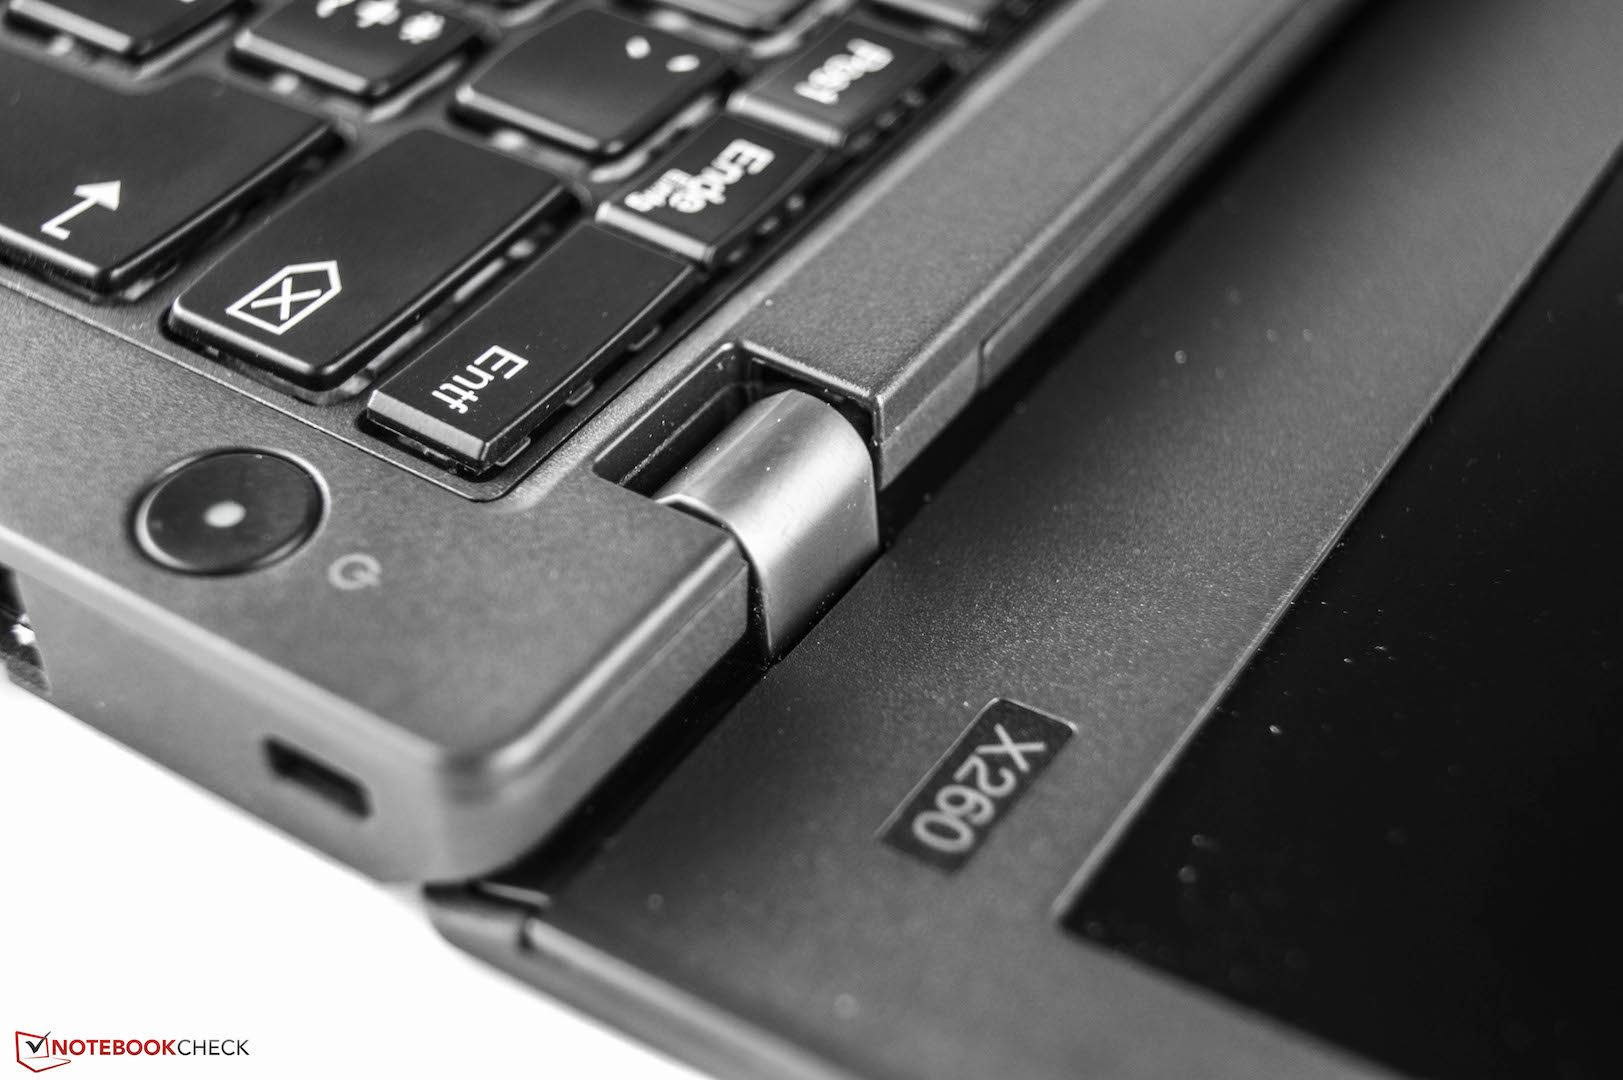
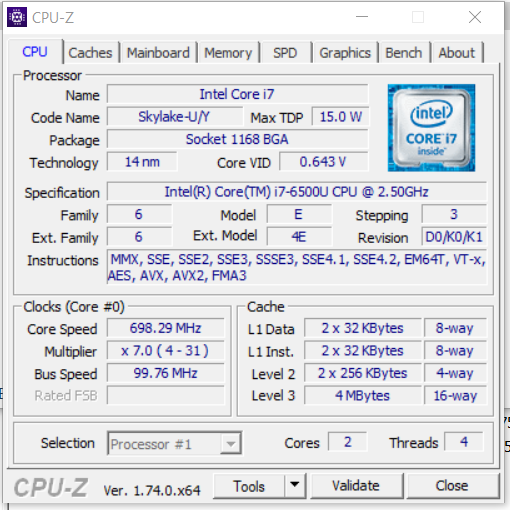
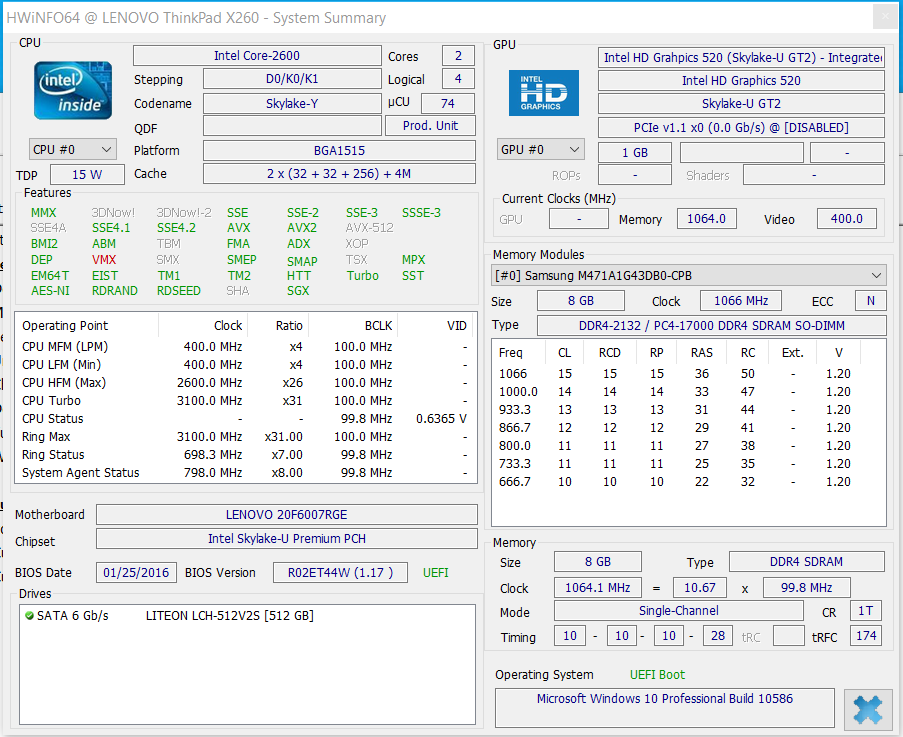
Le Thinkpad X260 de Lenovo est un PC portable pro complet et robuste. La version du X260 que nous avons testée il n’y a pas longtemps était une version d’entrée-de-gamme ; cette version-ci la plus haut-de-gamme de la série. La qualité de construction est très bonne, et le portable est très robuste. Le CPU fournit une très bonne puissance de traitement.
Le Core i7 est un peu plus rapide que le Core i5 de la version précédente. En usage quotidien, la différence n’est pas vraiment notable. Les utilisateurs qui n’ont pas besoin d’une puissance supplémentaire peuvent se contenter de la version i5, et économiser ainsi de l’argent.
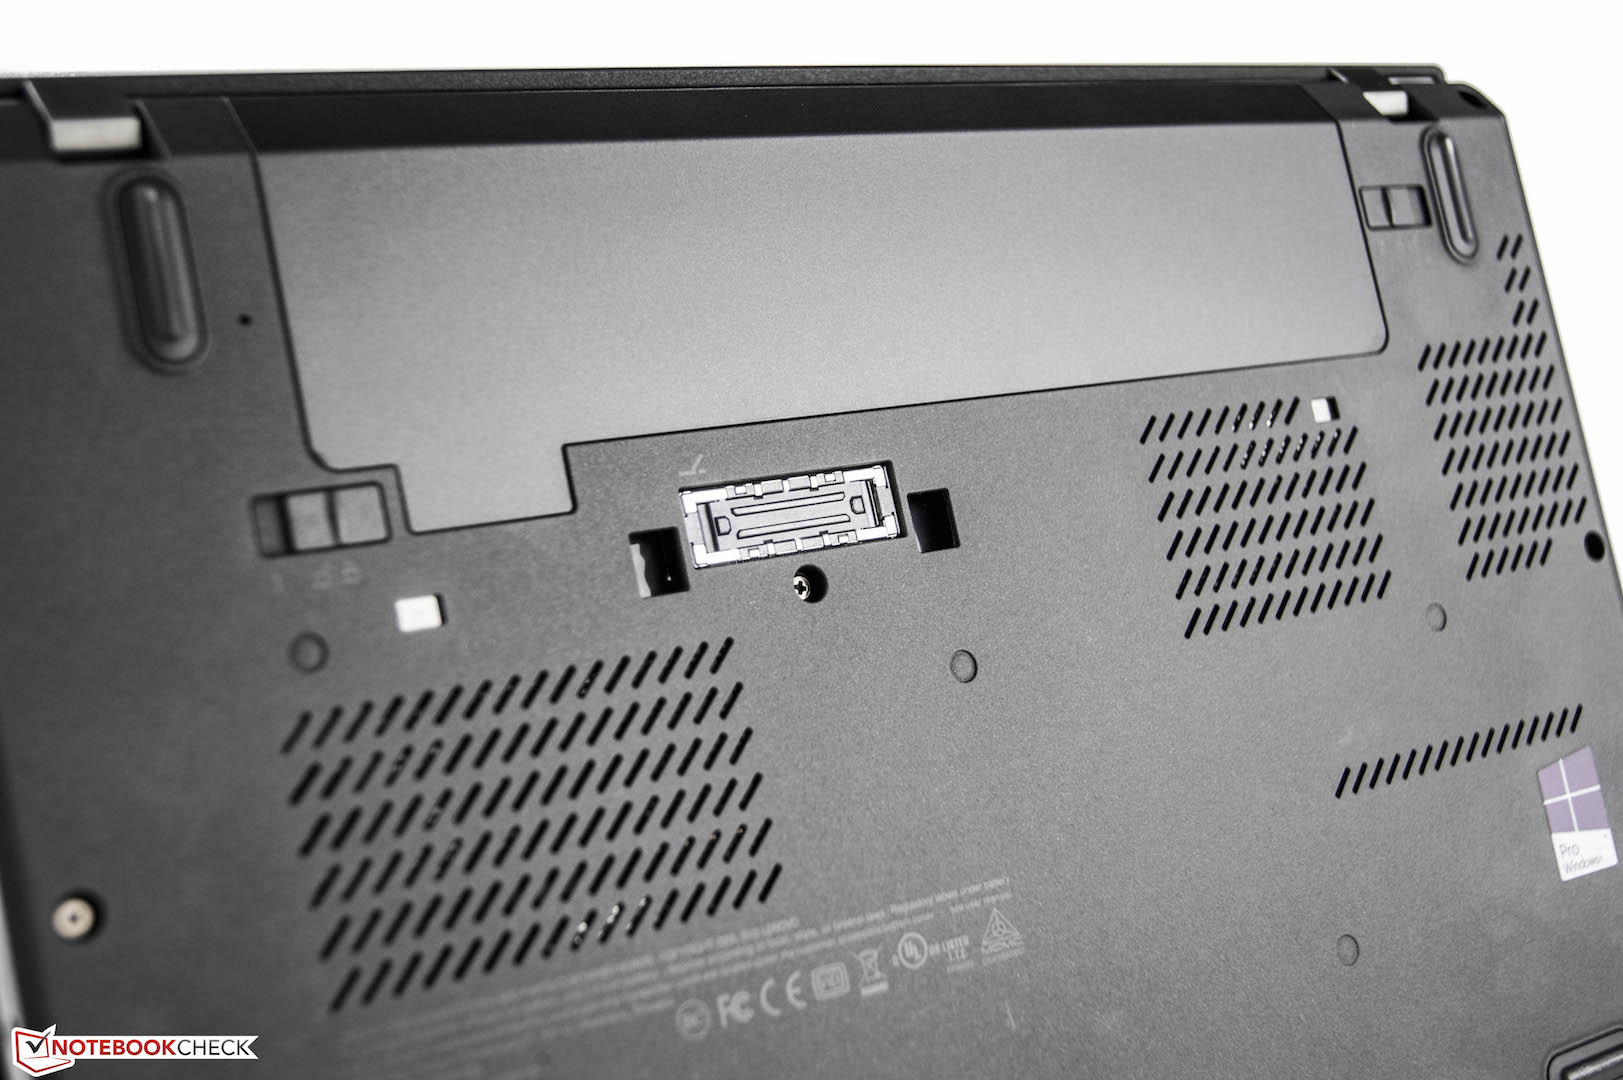
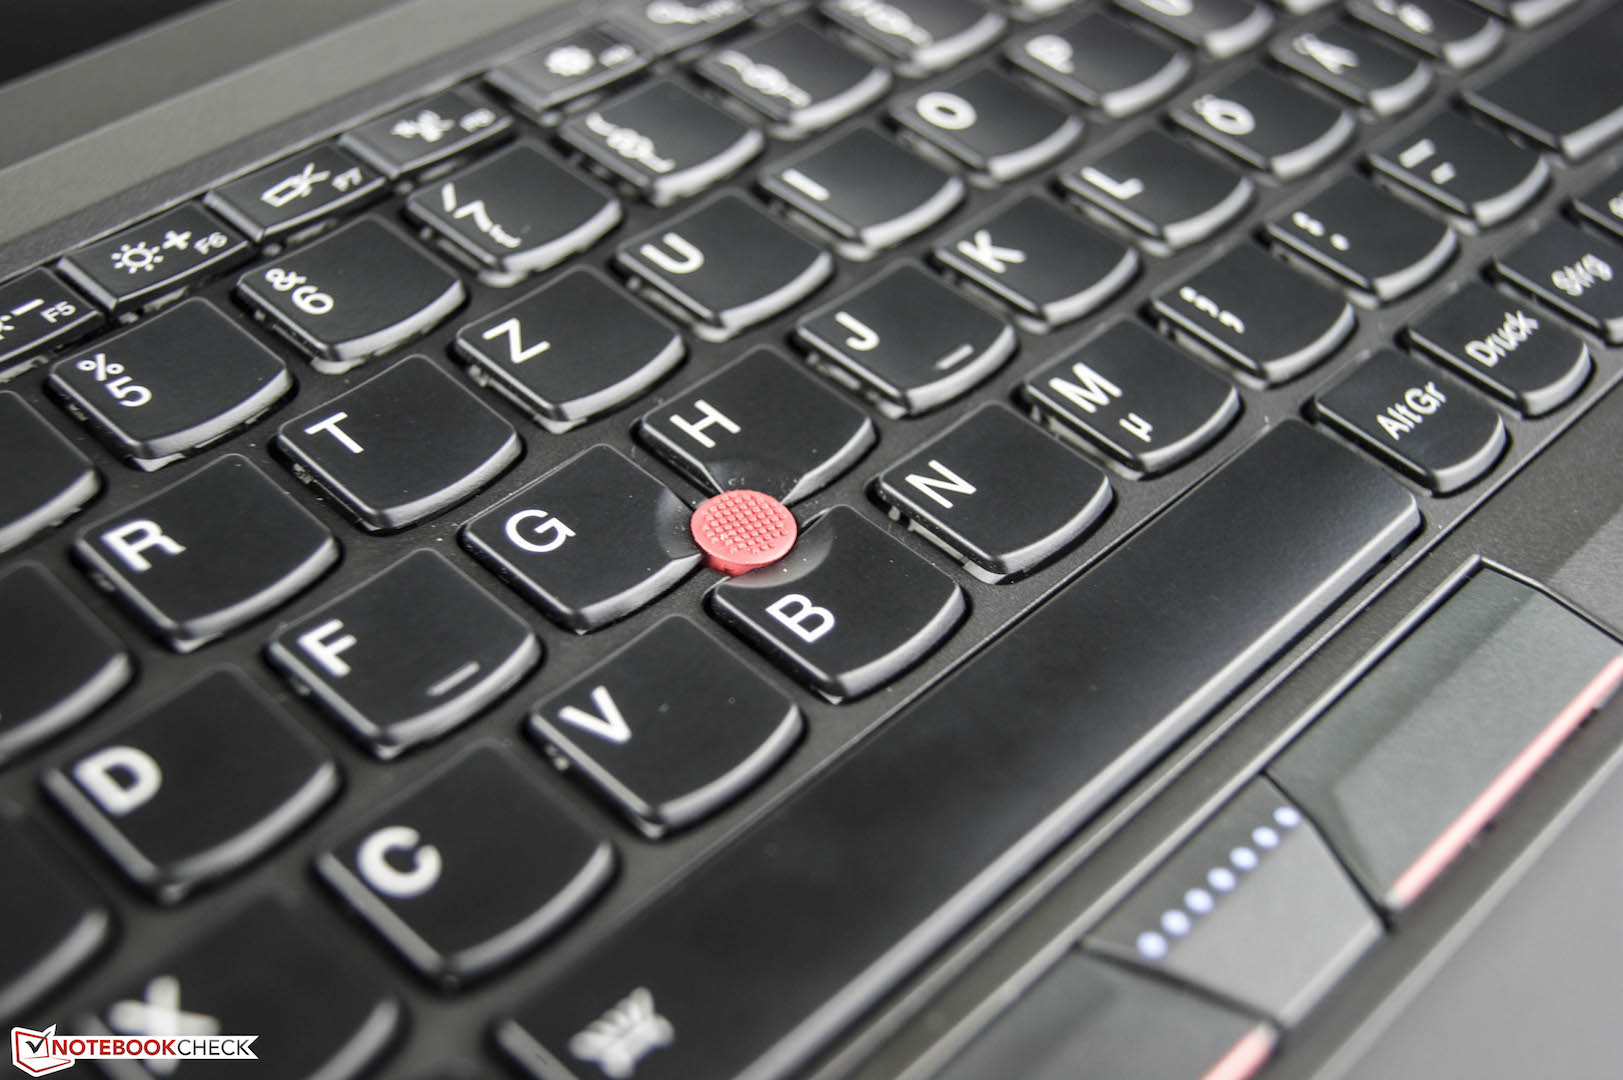
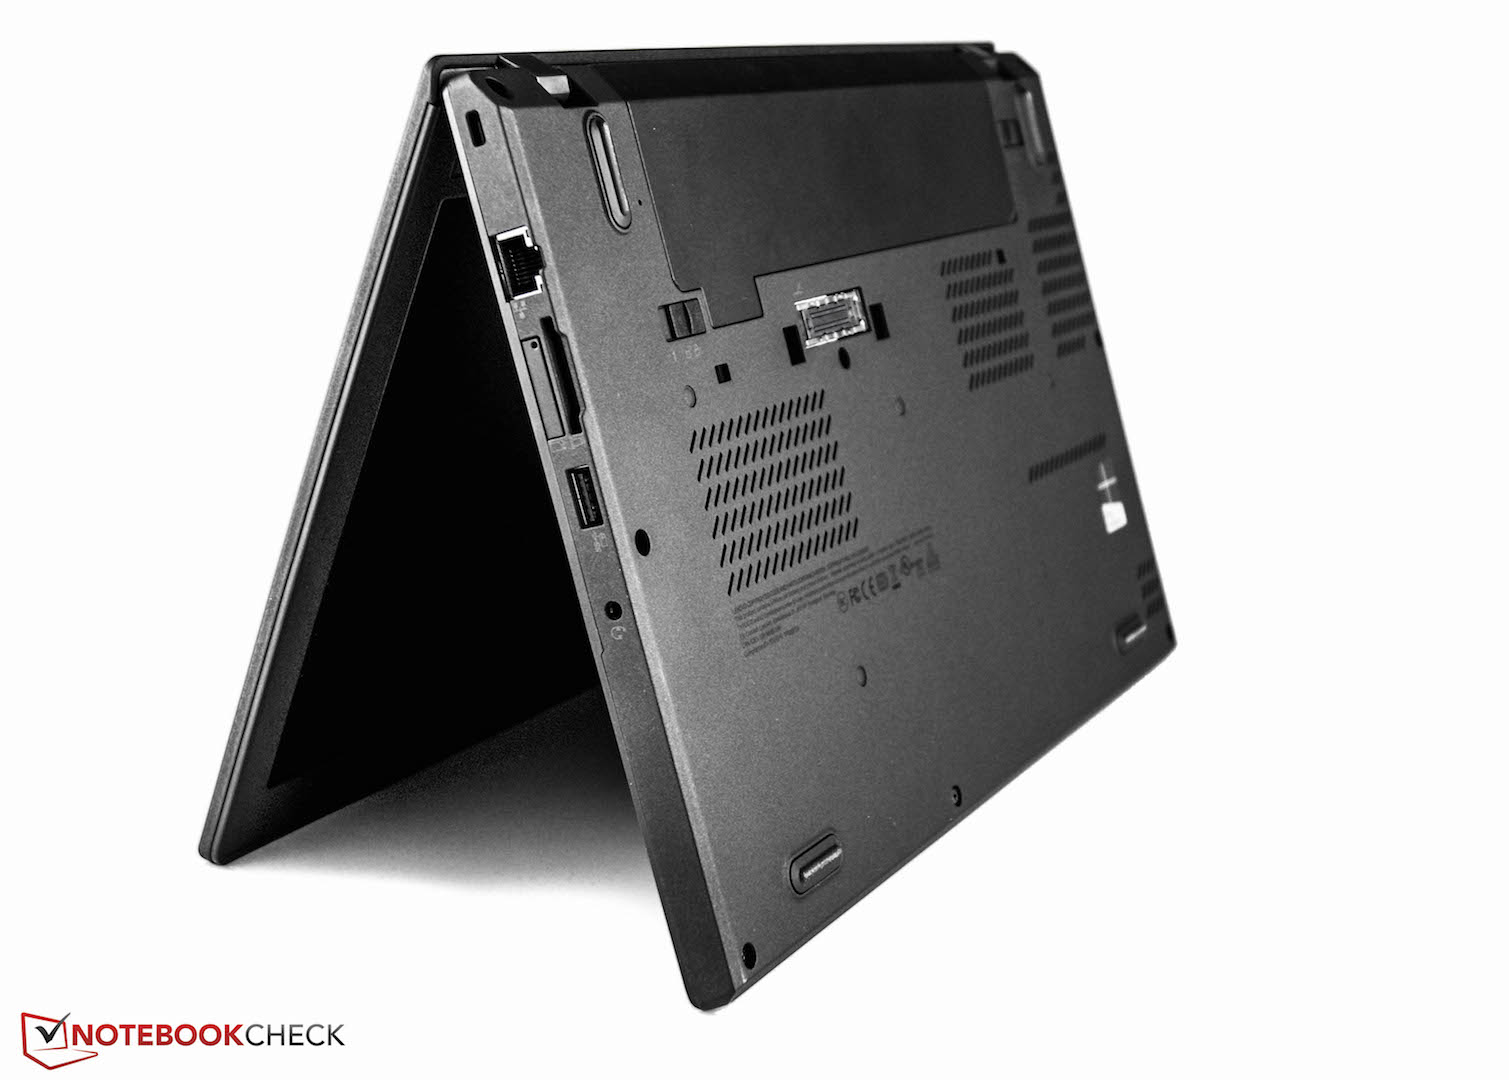
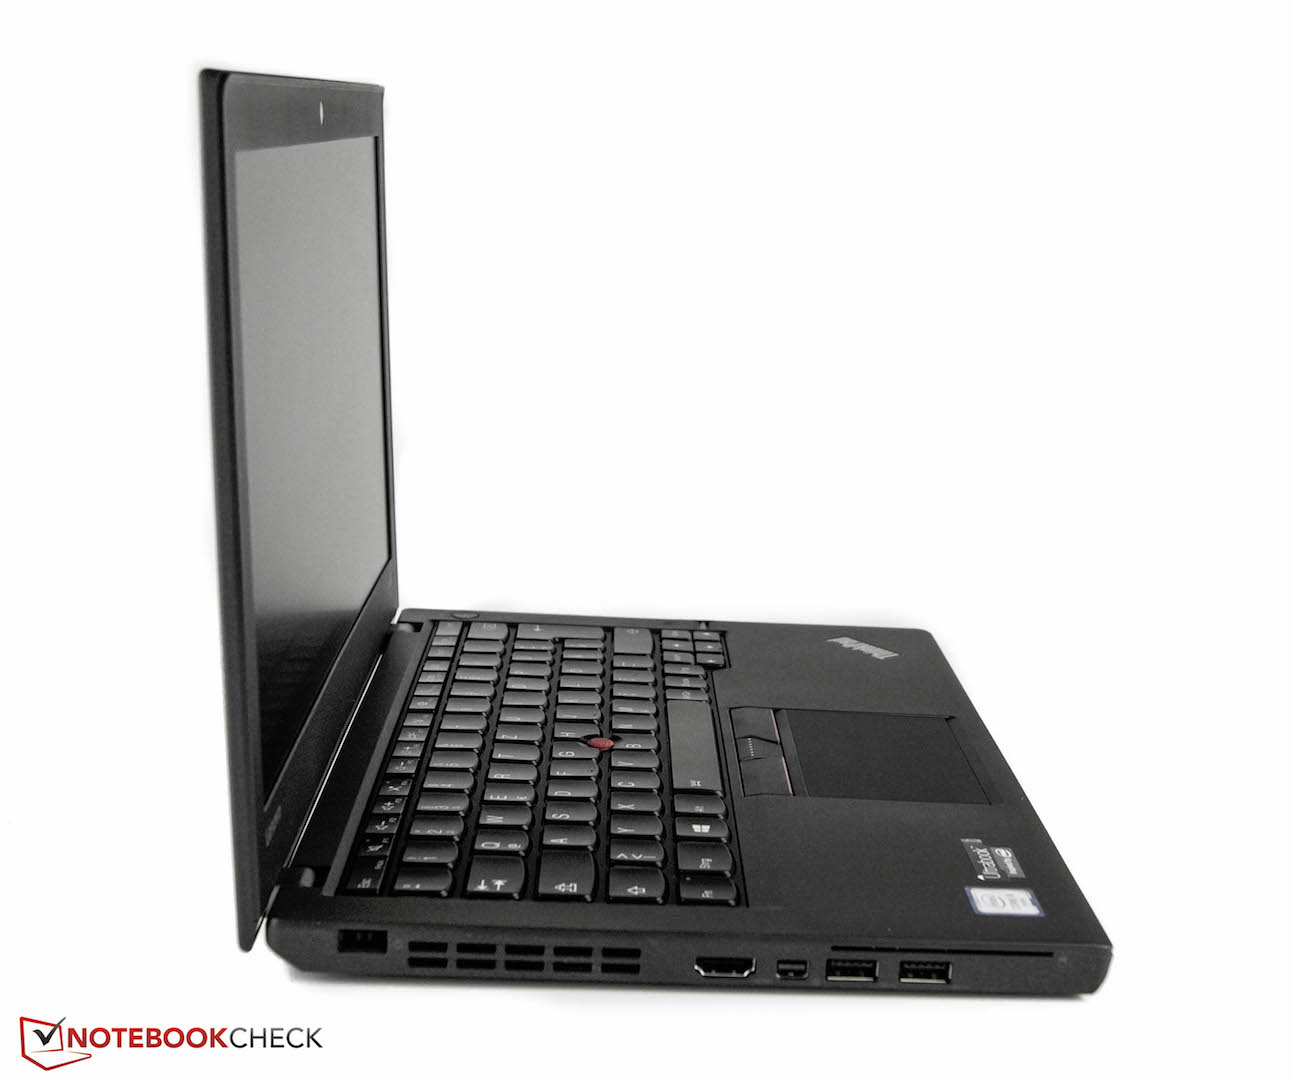
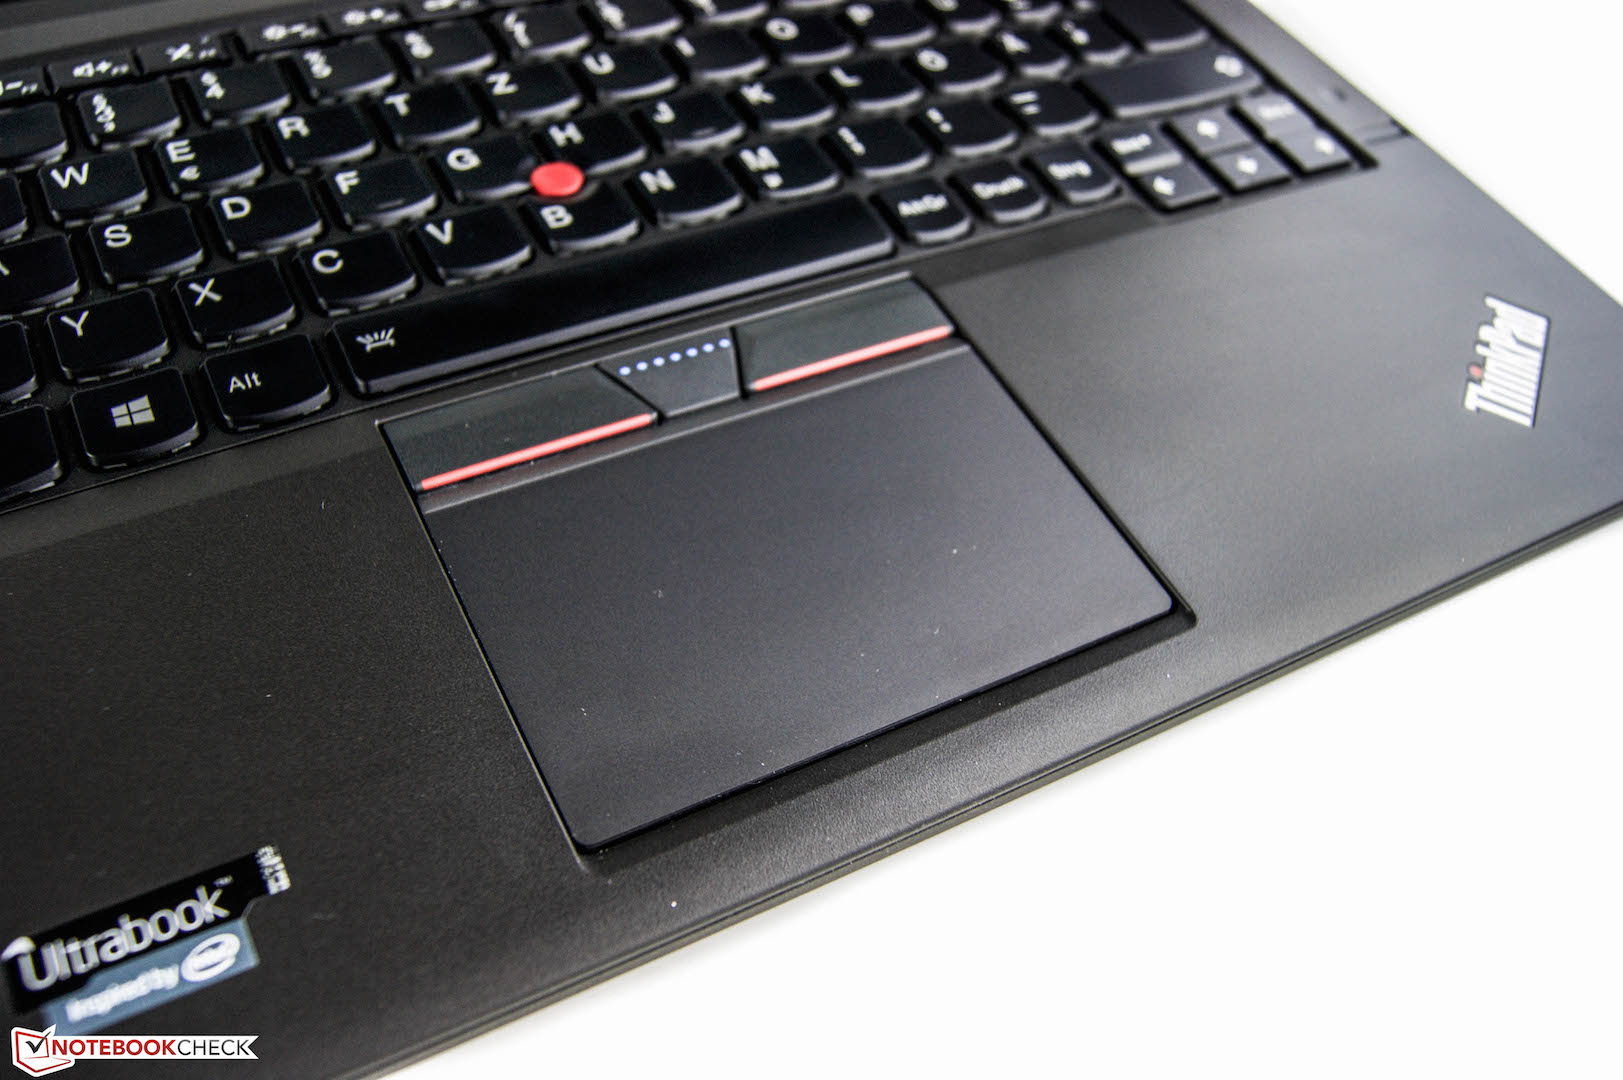
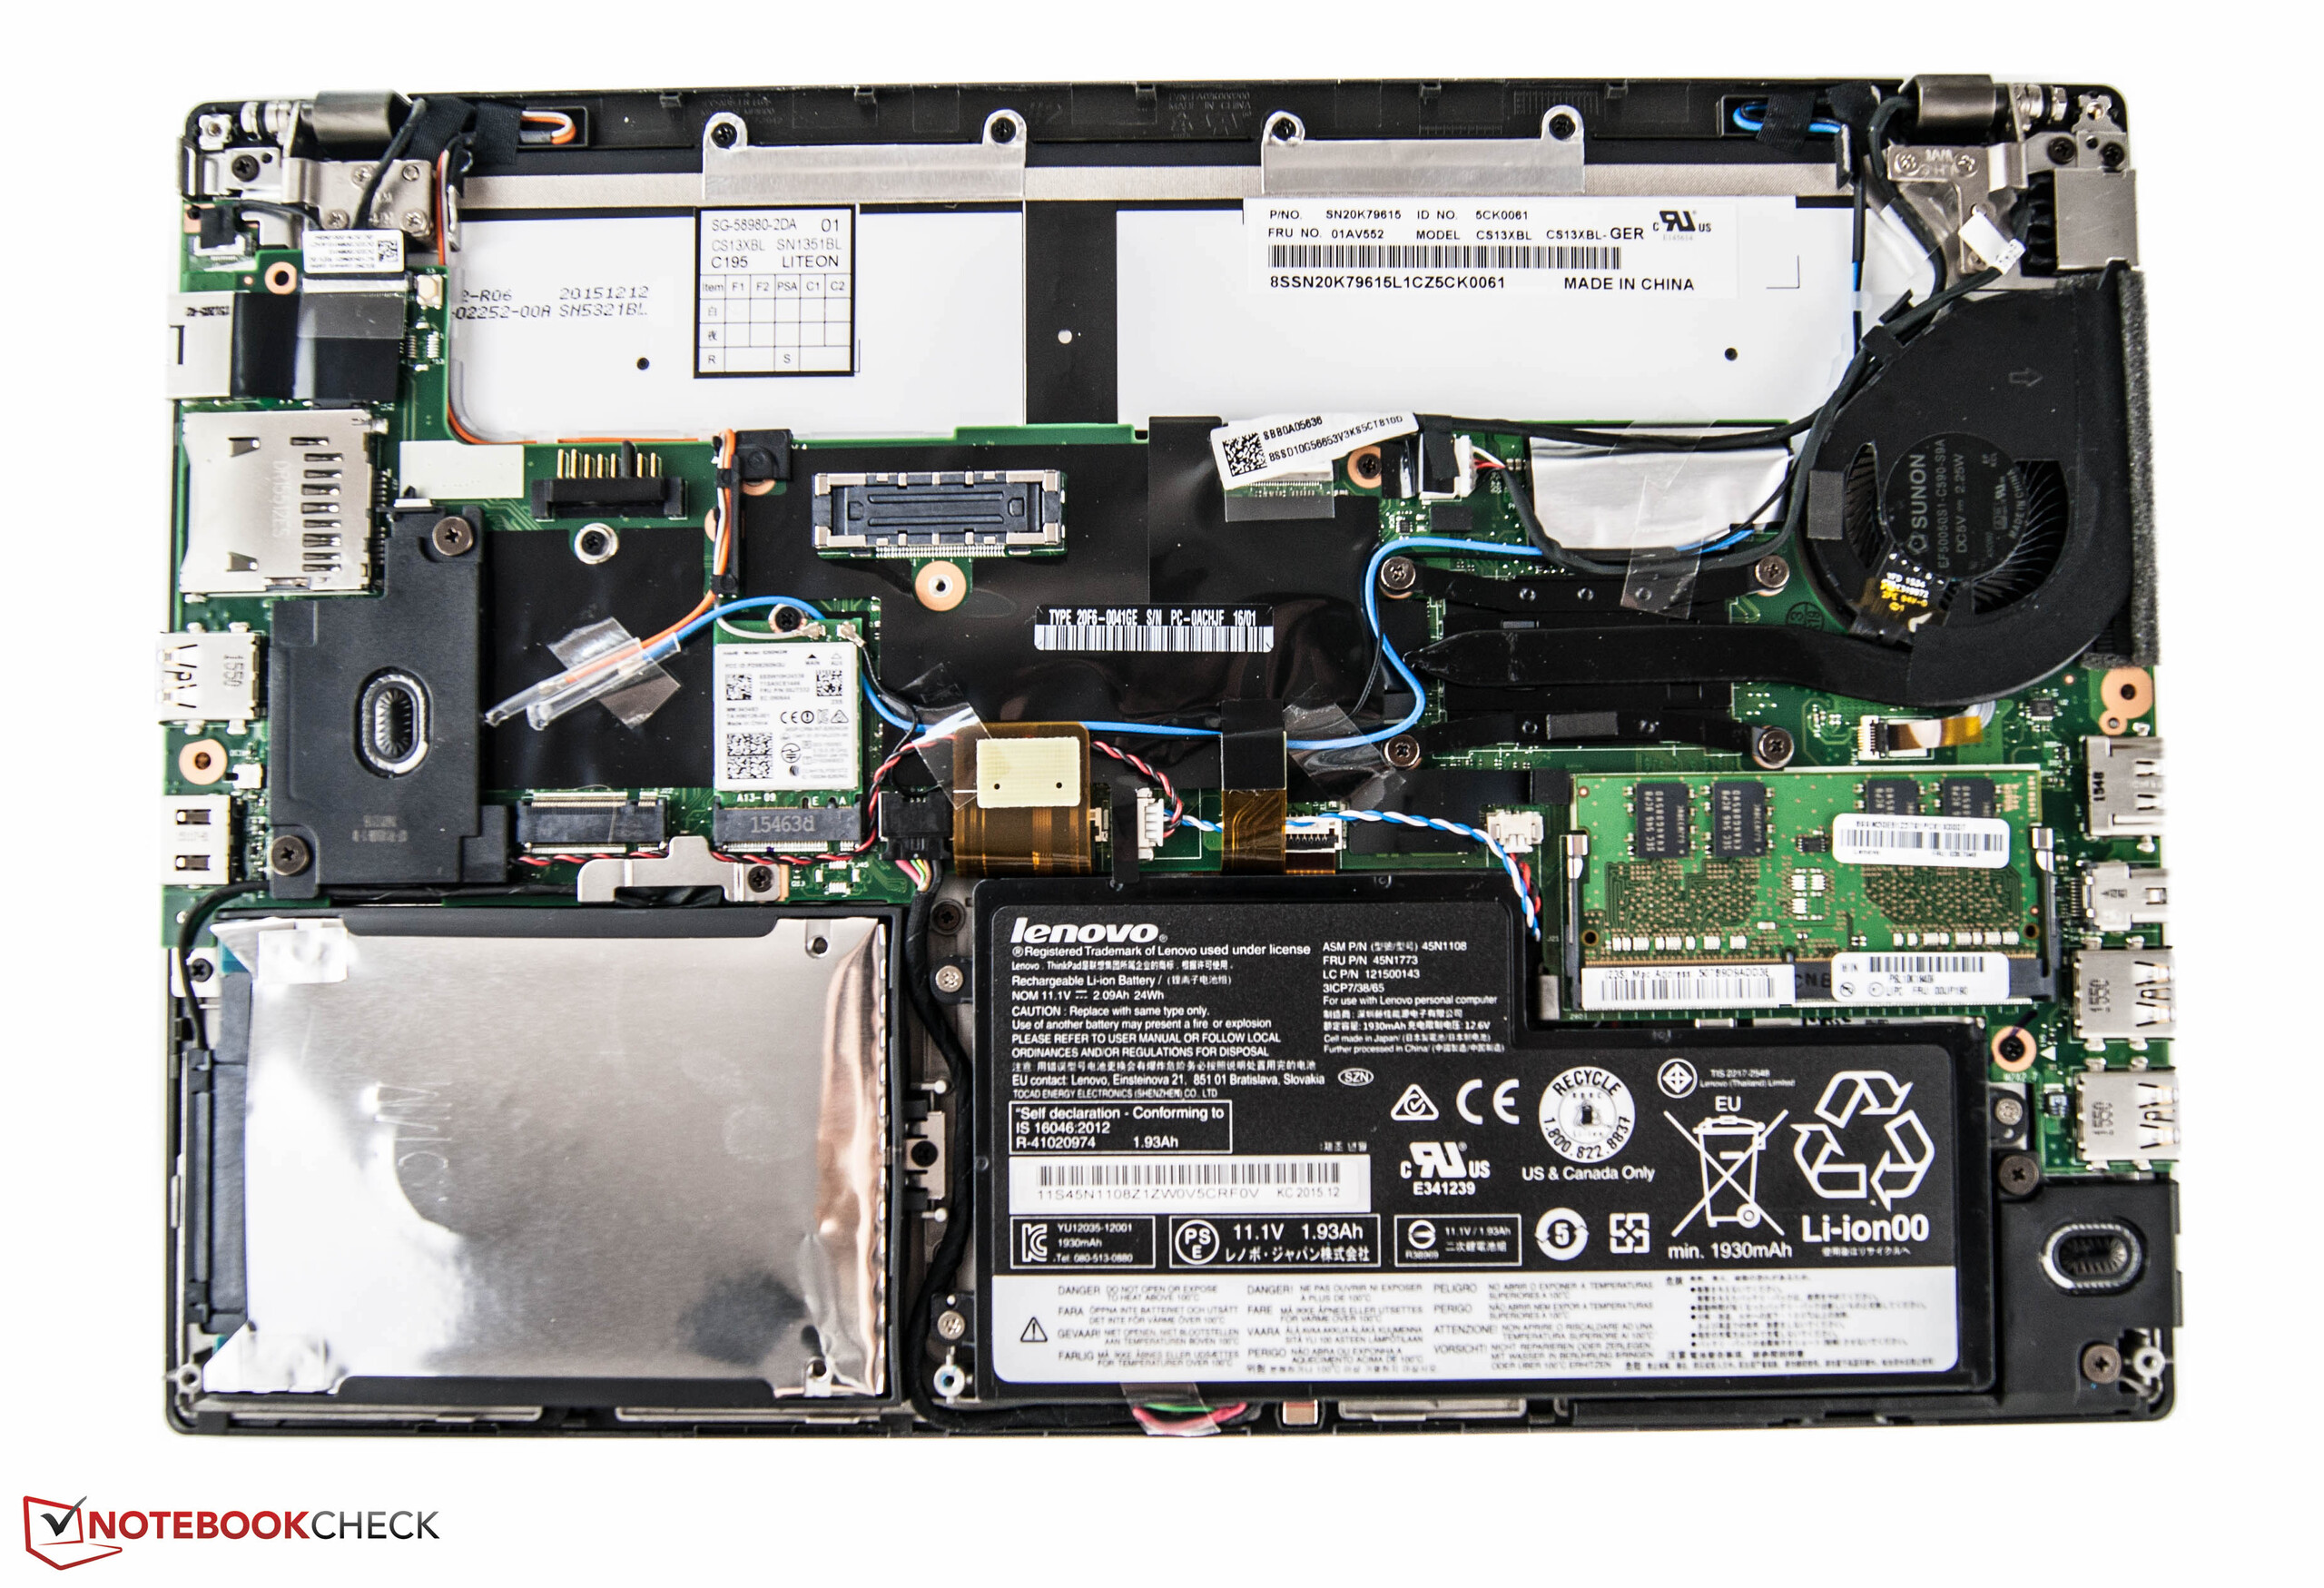
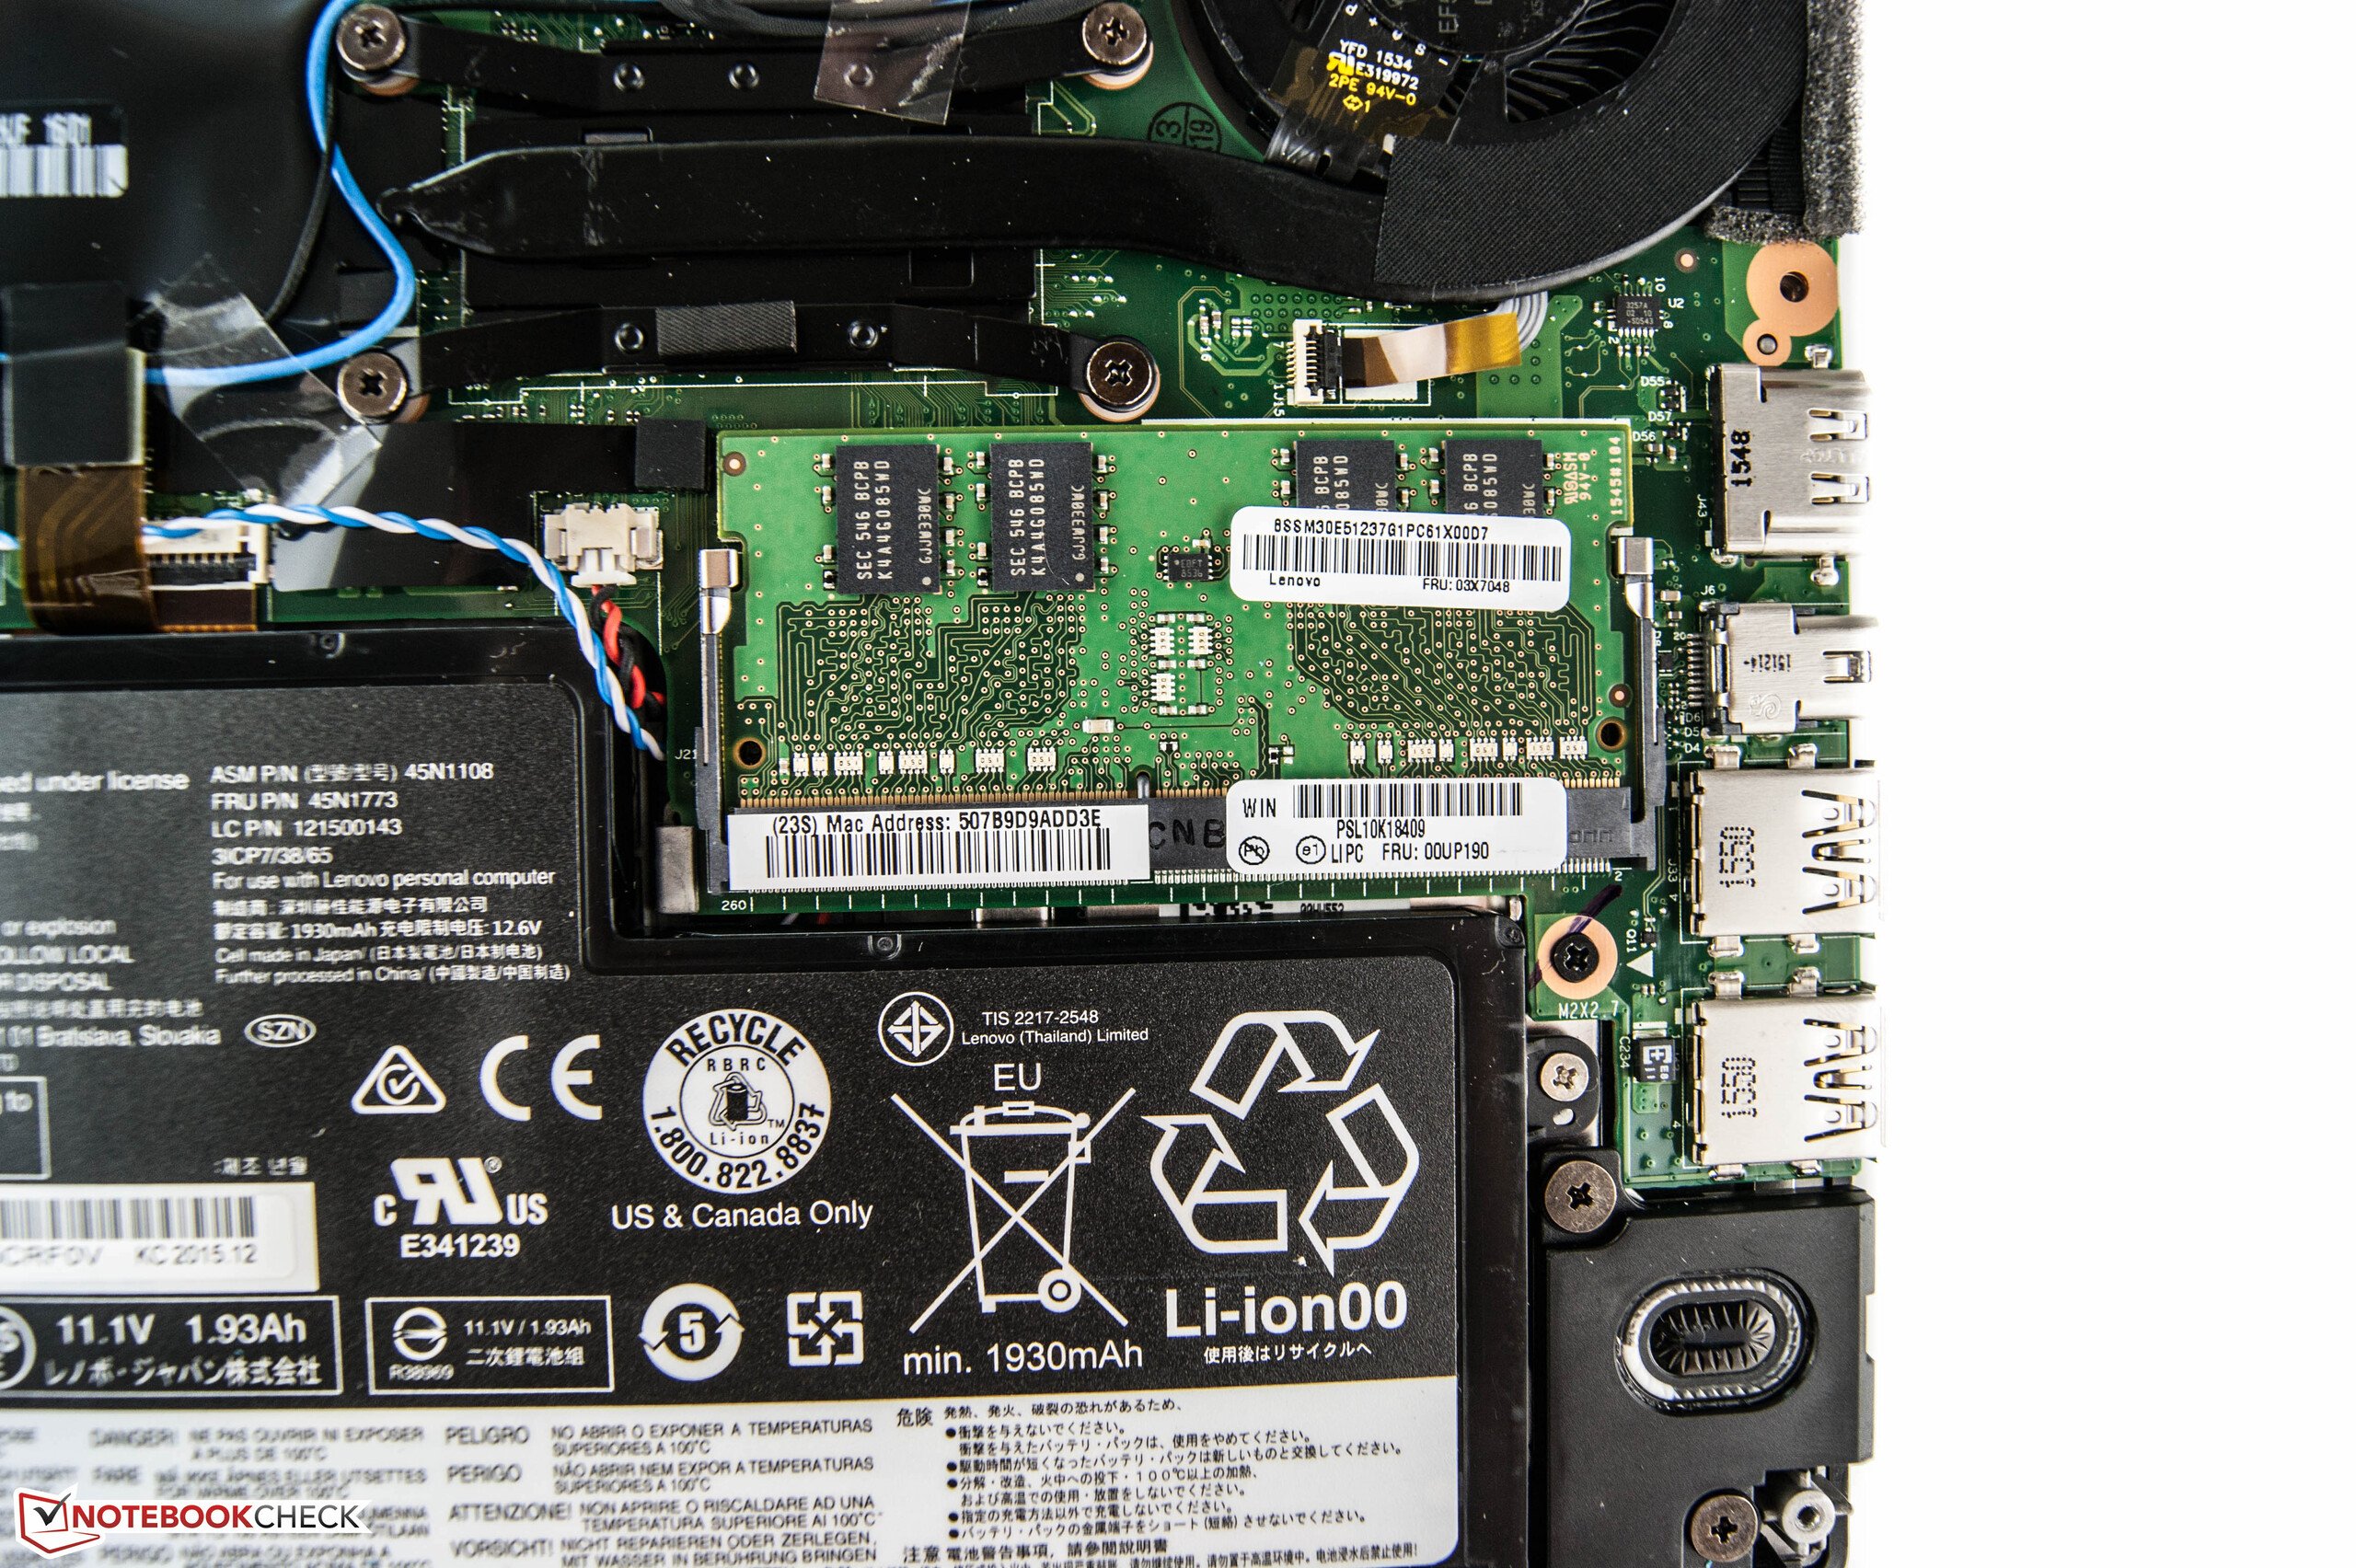
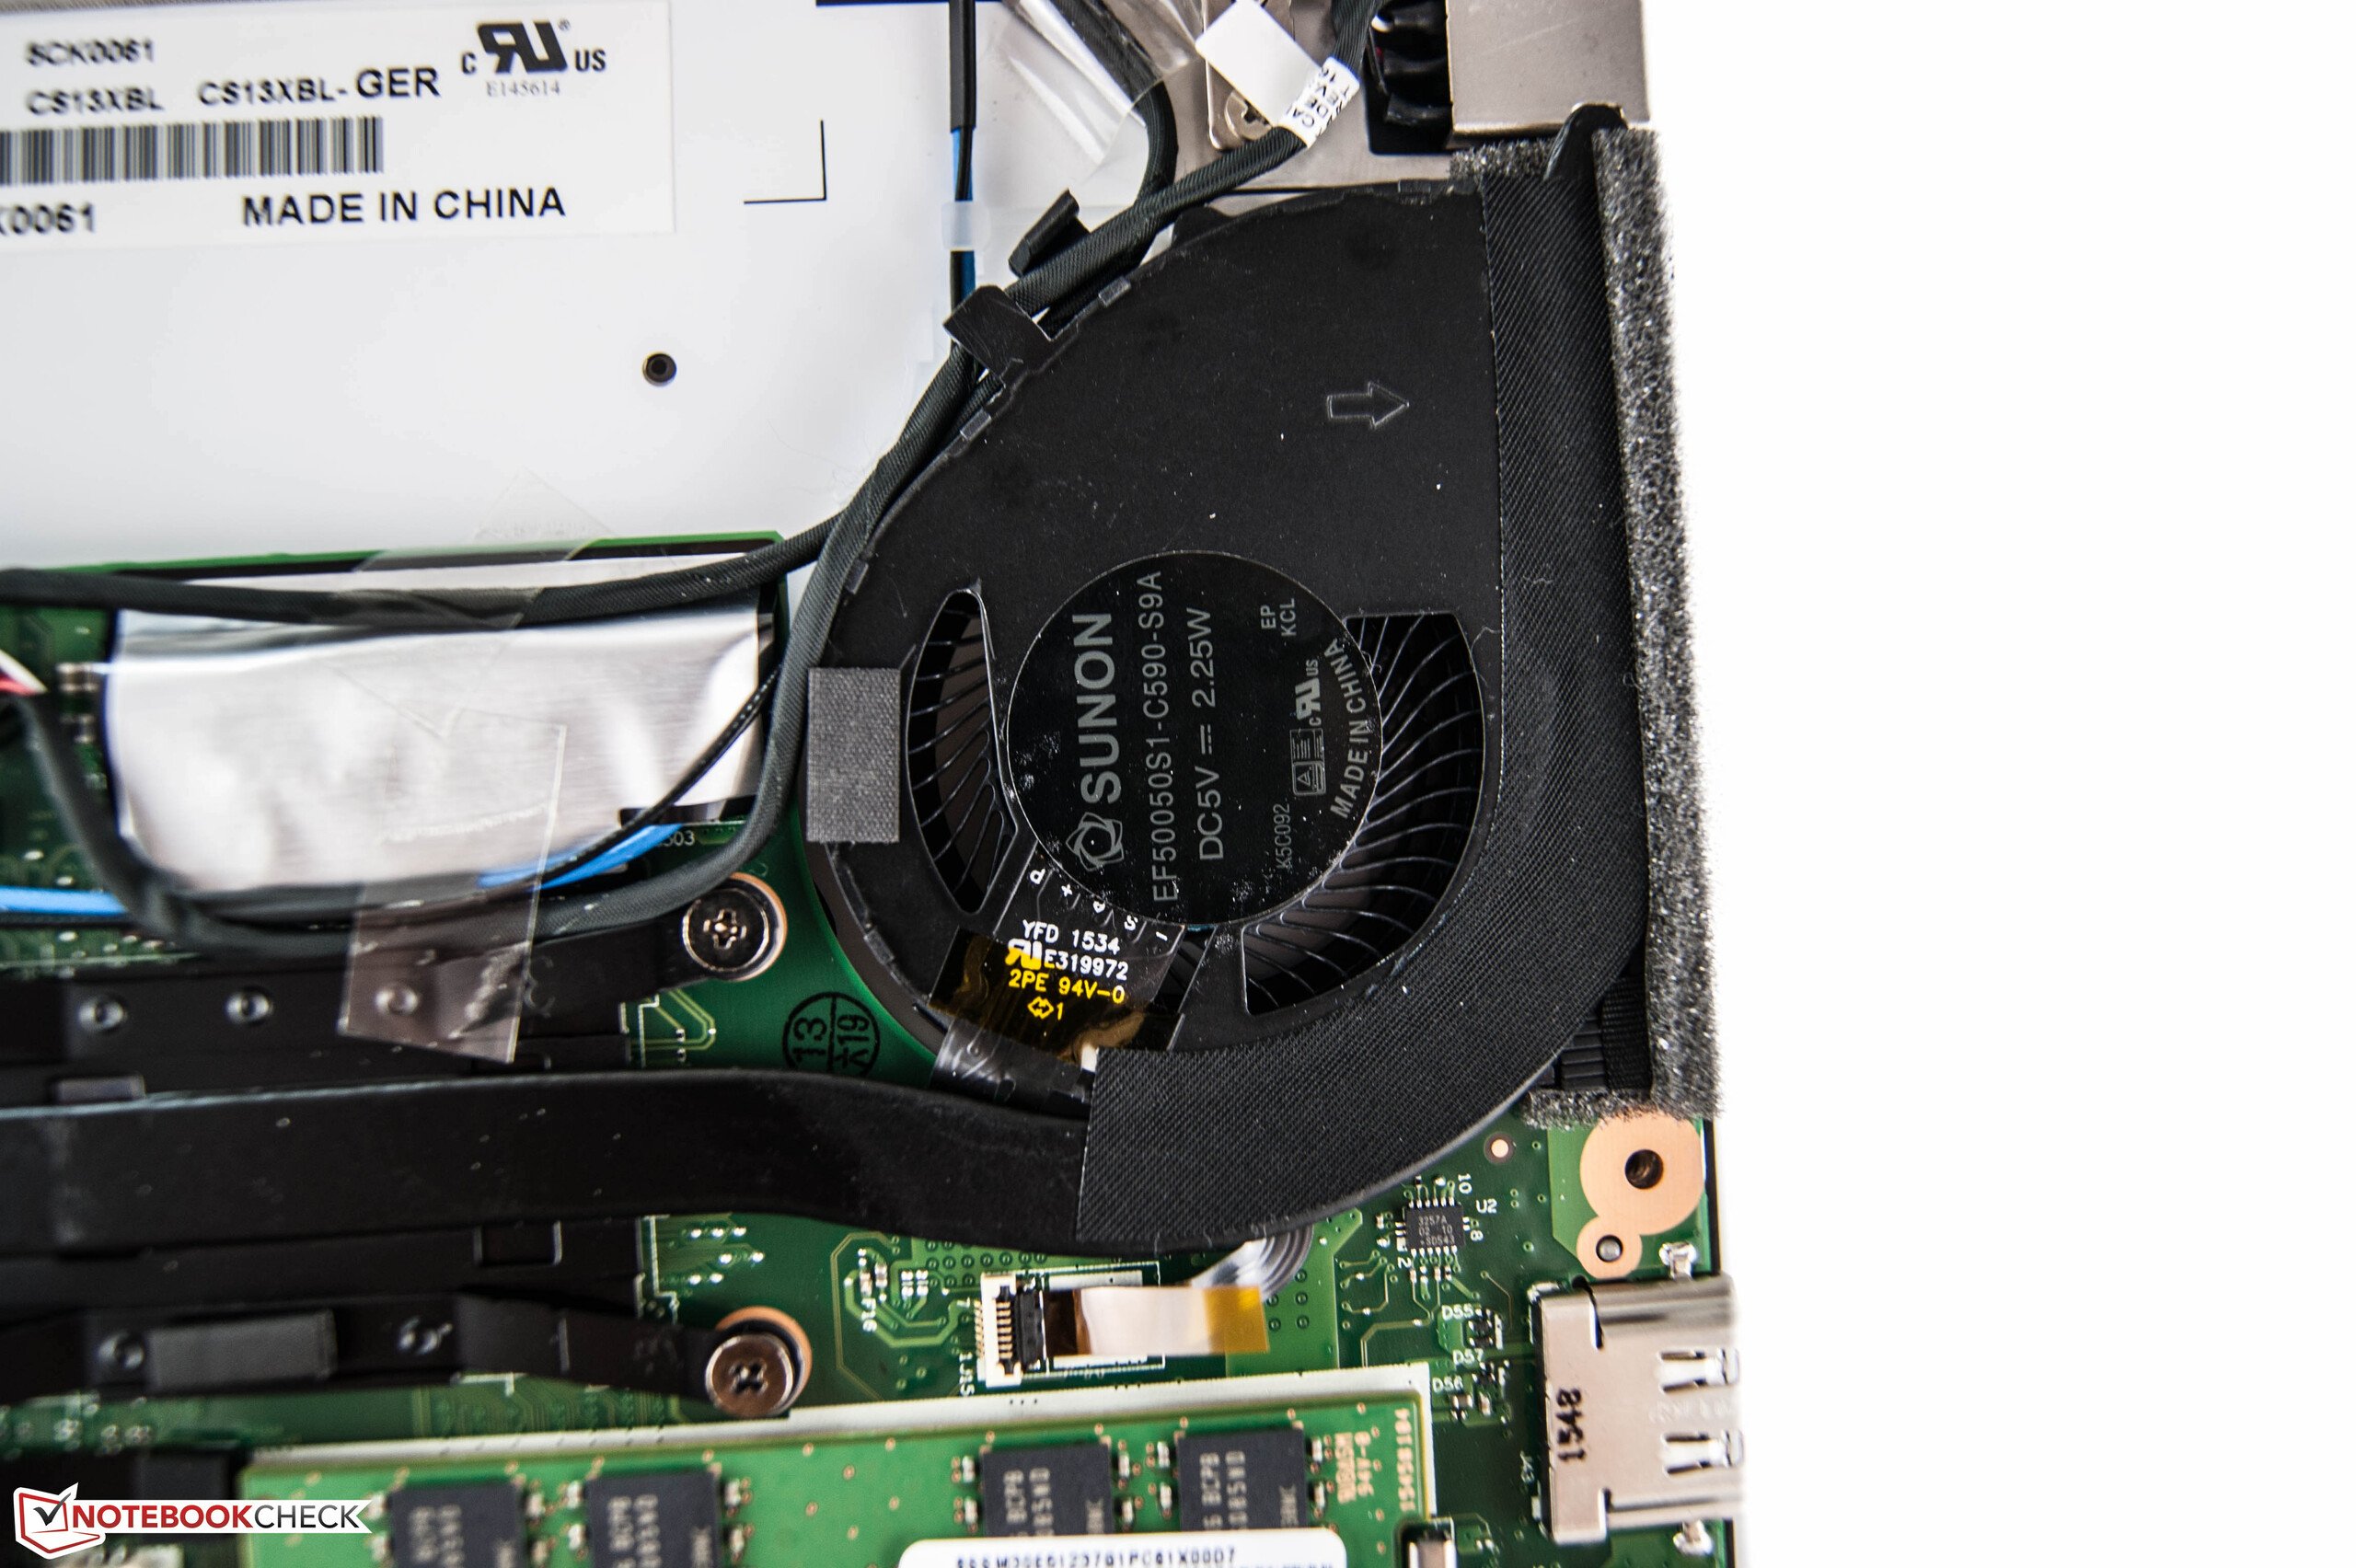
Malgré cette puissance élevée, et la conception compact du châssis, le portable n’est pas bruyant et ne chauffe pas. Son SSD permet une bonne réactivité et – avec 512 GB – fournit une bonne capacité de stockage. Si on le souhaite, le SSD peut être remplacé par un disque dur encore plus gros, même s’il n’y a pas de trappe de maintenance (c’est la coque inférieure de l’ordinateur qui est amovible). Comme attendu sur un ordinateur portable pro, le X260 possède un excellent clavier. L’autonomie est bonne, et peut être augmentée avec la batterie optionnelle de 72Wh. Ainsi renforcée, l’autonomie devrait presque doubler.
L’écran Full HD est également plutôt impressionnant. La dalle est lumineuse, bien contrastée, et ses angles de vue très stables. Il ne fait aucun doute qu’elle soit meilleure que la version simplement HD de certains modèles. En outre, l’écran Full HD ne présente pas de scintillement MLI et il est plus lumineux, ce qui en fait un meilleur choix pour une utilisation à l’extérieur.
Pour plus de détails, vous trouverez la version complète de ce test ici (en anglais).
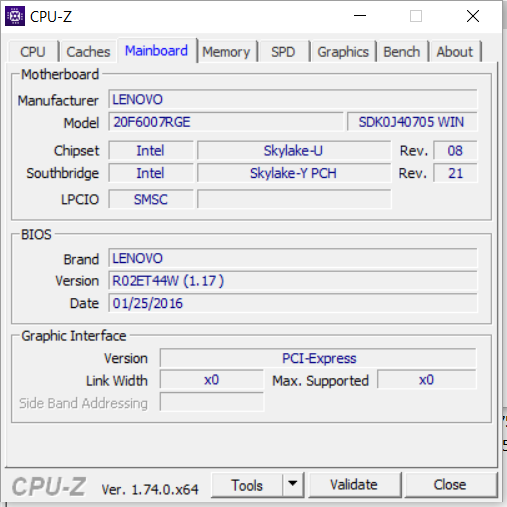
Lenovo ThinkPad X260-20F6007RGE
-
05/26/2016 v5.1(old)
Sascha Mölck
Pricecompare
