 Deutsch
 English
 Español
 Français
 Italiano
 Nederlands
 Polski
 Português
 Русский
 Türkçe
 Svenska
 Chinese
 Magyar
Courte critique du PC Convertible HP Spectre x360 15-ap012dx
| |||||||||||||||||||||||||
Homogénéité de la luminosité: 88 %
Valeur mesurée au centre, sur batterie: 298 cd/m²
Contraste: 523:1 (Valeurs des noirs: 0.57 cd/m²)
ΔE Color 4.43 | 0.5-29.43 Ø5
ΔE Greyscale 2.45 | 0.57-98 Ø5.3
87.8% sRGB (Argyll 1.6.3 3D)
57.2% AdobeRGB 1998 (Argyll 1.6.3 3D)
63.9% AdobeRGB 1998 (Argyll 2.2.0 3D)
88.2% sRGB (Argyll 2.2.0 3D)
62.8% Display P3 (Argyll 2.2.0 3D)
Gamma: 2.45
| HP Spectre x360 15-ap012dx 15.60, 3840x2160 | HP Spectre x360 15-ap011dx 15.60, 1920x1080 | Toshiba Satellite L50-C-275 15.60, 1920x1080 | Dell XPS 15 9550 i7 FHD 15.60, 1920x1080 | HP Envy 15-w103ng x360 15.60, 1920x1080 | Lenovo Ideapad 500s-14ISK 14.00, 1920x1080 | |
|---|---|---|---|---|---|---|
| Display | -2% | -3% | 10% | -34% | -33% | |
| Display P3 Coverage | 62.8 | 64.8 3% | 64.1 2% | 68.5 9% | 39.97 -36% | 40.74 -35% |
| sRGB Coverage | 88.2 | 83.5 -5% | 82.9 -6% | 97.2 10% | 59.8 -32% | 60.6 -31% |
| AdobeRGB 1998 Coverage | 63.9 | 61 -5% | 60.6 -5% | 70.4 10% | 41.32 -35% | 42.15 -34% |
| Response Times | -16% | 26% | -87% | -7% | -7% | |
| Response Time Grey 50% / Grey 80% * | 32.8 ? | 40 ? -22% | 24 ? 27% | 64 ? -95% | 37 ? -13% | 43 ? -31% |
| Response Time Black / White * | 28 ? | 30.4 ? -9% | 21 ? 25% | 50 ? -79% | 28 ? -0% | 23 ? 18% |
| PWM Frequency | 50 ? | |||||
| Screen | -2% | 2% | 3% | -32% | -64% | |
| Brightness middle | 298 | 289.9 -3% | 294 -1% | 371.5 25% | 208 -30% | 249 -16% |
| Brightness | 295 | 275 -7% | 285 -3% | 356 21% | 205 -31% | 235 -20% |
| Brightness Distribution | 88 | 88 0% | 83 -6% | 92 5% | 80 -9% | 87 -1% |
| Black Level * | 0.57 | 0.289 49% | 0.26 54% | 0.252 56% | 0.26 54% | 0.44 23% |
| Contrast | 523 | 1003 92% | 1131 116% | 1474 182% | 800 53% | 566 8% |
| Colorchecker dE 2000 * | 4.43 | 5.24 -18% | 5.07 -14% | 5.55 -25% | 6.97 -57% | 9.47 -114% |
| Colorchecker dE 2000 max. * | 6.62 | 9.55 -44% | 9.33 -41% | 10.95 -65% | 15.41 -133% | |
| Greyscale dE 2000 * | 2.45 | 4.46 -82% | 4.25 -73% | 7.1 -190% | 7.37 -201% | 10.22 -317% |
| Gamma | 2.45 90% | 2.31 95% | 2.49 88% | 2.1 105% | 2.34 94% | 2.34 94% |
| CCT | 6326 103% | 6818 95% | 6597 99% | 6823 95% | 11451 57% | |
| Color Space (Percent of AdobeRGB 1998) | 57.2 | 54.7 -4% | 54 -6% | 63.4 11% | 38 -34% | 39 -32% |
| Color Space (Percent of sRGB) | 87.8 | 83.3 -5% | 83 -5% | 97.9 12% | 59 -33% | 57 -35% |
| Moyenne finale (programmes/paramètres) | -7% /
-4% | 8% /
4% | -25% /
-8% | -24% /
-29% | -35% /
-50% |
* ... Moindre est la valeur, meilleures sont les performances
Temps de réponse de l'écran
| ↔ Temps de réponse noir à blanc | ||
|---|---|---|
| 28 ms ... hausse ↗ et chute ↘ combinées | ↗ 4.8 ms hausse | 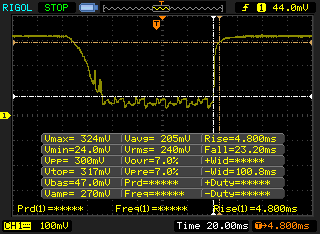 |
| ↘ 23.2 ms chute | ||
| L'écran souffre de latences relativement élevées, insuffisant pour le jeu. En comparaison, tous les appareils testés affichent entre 0.1 (minimum) et 240 (maximum) ms. » 67 % des appareils testés affichent de meilleures performances. Cela signifie que les latences relevées sont moins bonnes que la moyenne (21.5 ms) de tous les appareils testés. | ||
| ↔ Temps de réponse gris 50% à gris 80% | ||
| 32.8 ms ... hausse ↗ et chute ↘ combinées | ↗ 14.8 ms hausse |  |
| ↘ 18 ms chute | ||
| L'écran souffre de latences très élevées, à éviter pour le jeu. En comparaison, tous les appareils testés affichent entre 0.2 (minimum) et 636 (maximum) ms. » 38 % des appareils testés affichent de meilleures performances. Cela signifie que les latences relevées sont similaires à la moyenne (33.7 ms) de tous les appareils testés. | ||
Scintillement / MLI (Modulation de largeur d'impulsion)
| Scintillement / MLI (Modulation de largeur d'impulsion) non décelé | 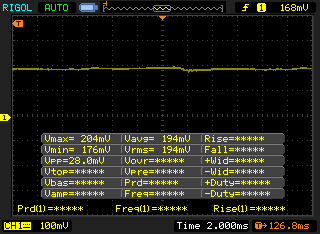 | ||
En comparaison, 53 % des appareils testés n'emploient pas MDI pour assombrir leur écran. Nous avons relevé une moyenne à 17924 (minimum : 5 - maximum : 3846000) Hz dans le cas où une MDI était active. | |||

| Cinebench R10 | |
| Rendering Single CPUs 64Bit (Classer selon les valeurs) | |
| Lenovo IdeaPad Y50 | |
| Microsoft Surface Pro 4 Core i7 | |
| Lenovo ThinkPad T440s 20AQ006BGE | |
| Rendering Multiple CPUs 64Bit (Classer selon les valeurs) | |
| Lenovo IdeaPad Y50 | |
| Microsoft Surface Pro 4 Core i7 | |
| Lenovo ThinkPad T440s 20AQ006BGE | |
| wPrime 2.10 - 1024m (Classer selon les valeurs) | |
| HP Spectre x360 15-ap012dx | |
| Lenovo IdeaPad Y50 | |
| Microsoft Surface Pro 4 Core i7 | |
| Razer Blade Stealth UHD i7-6500U | |
| Super Pi Mod 1.5 XS 32M - 32M (Classer selon les valeurs) | |
| HP Spectre x360 15-ap012dx | |
| Lenovo IdeaPad Y50 | |
| Microsoft Surface Pro 4 Core i7 | |
| Razer Blade Stealth UHD i7-6500U | |
* ... Moindre est la valeur, meilleures sont les performances
| PCMark 7 - Score (Classer selon les valeurs) | |
| HP Spectre x360 15-ap012dx | |
| Microsoft Surface Pro 4 Core i7 | |
| Dell XPS 15 9550 i7 FHD | |
| Lenovo IdeaPad Y50-70-59441231 | |
| HP Envy 15-w000ng x360 | |
| PCMark 7 Score | 5326 points | |
| PCMark 8 Home Score Accelerated v2 | 2847 points | |
| PCMark 8 Creative Score Accelerated v2 | 3796 points | |
| PCMark 8 Work Score Accelerated v2 | 3576 points | |
Aide | ||

| HP Spectre x360 15-ap012dx HD Graphics 520, 6200U, Sandisk X300 SD7SN6S-256G-1006 | HP Spectre x360 15-ap011dx HD Graphics 520, 6200U, Liteon L8H-256V2G | Toshiba Satellite L50-C-275 GeForce 930M, 6200U, Samsung SSD PM871 MZNLN256HCHP | Dell XPS 15 9550 i7 FHD GeForce GTX 960M, 6700HQ, Samsung PM951 NVMe 512 GB | HP Envy 15-w103ng x360 GeForce 930M, 6200U, Samsung SSD PM851 256 GB MZNTE256HMHP | Lenovo Ideapad 500s-14ISK GeForce 940M, 6500U, Samsung PM871 MZYLN256HCHP | |
|---|---|---|---|---|---|---|
| AS SSD | 1% | 6% | 134% | -3% | 8% | |
| Copy Game MB/s | 307.7 | 208.1 -32% | 178.3 -42% | 805 162% | 196.1 -36% | 197.6 -36% |
| Copy Program MB/s | 215.3 | 185.6 -14% | 105.3 -51% | 325.3 51% | 137.9 -36% | 168.7 -22% |
| Copy ISO MB/s | 403.4 | 224.2 -44% | 244.1 -39% | 1127 179% | 436.8 8% | 236 -41% |
| Score Total | 850 | 882 4% | 1080 27% | 2410 184% | 950 12% | 1032 21% |
| Score Write | 250 | 353 41% | 381 52% | 675 170% | 303 21% | 336 34% |
| Score Read | 397 | 352 -11% | 463 17% | 1180 197% | 432 9% | 460 16% |
| Access Time Write * | 0.057 | 0.05 12% | 0.041 28% | 0.035 39% | 0.044 23% | 0.041 28% |
| Access Time Read * | 0.08 | 0.067 16% | 0.102 -28% | 0.038 52% | 0.131 -64% | 0.067 16% |
| 4K-64 Write | 143.8 | 252.9 76% | 271.8 89% | 513 257% | 201.8 40% | 223 55% |
| 4K-64 Read | 318 | 274.8 -14% | 380.8 20% | 990 211% | 356.5 12% | 376.6 18% |
| 4K Write | 78.3 | 74.1 -5% | 81.8 4% | 105.4 35% | 78.3 0% | 82.8 6% |
| 4K Read | 31.04 | 26 -16% | 32.34 4% | 31.86 3% | 25.25 -19% | 33.12 7% |
| Seq Write | 278.1 | 263.2 -5% | 273.9 -2% | 570 105% | 226.4 -19% | 298.7 7% |
| Seq Read | 475.3 | 513 8% | 498 5% | 1579 232% | 507 7% | 500 5% |
* ... Moindre est la valeur, meilleures sont les performances
| 3DMark 11 | |
| 1280x720 Performance (Classer selon les valeurs) | |
| HP Spectre x360 15-ap012dx | |
| Microsoft Surface Pro 4 Core i7 | |
| Razer Blade Stealth UHD i7-6500U | |
| Lenovo IdeaPad 100-15IBD | |
| Dell Vostro 3546 JAN15HSW1601_1K9_Win | |
| 1280x720 Performance GPU (Classer selon les valeurs) | |
| HP Spectre x360 15-ap012dx | |
| Microsoft Surface Pro 4 Core i7 | |
| Razer Blade Stealth UHD i7-6500U | |
| Lenovo IdeaPad 100-15IBD | |
| Dell Vostro 3546 JAN15HSW1601_1K9_Win | |
| 3DMark 11 Performance | 1565 points | |
| 3DMark Ice Storm Standard Score | 41767 points | |
| 3DMark Cloud Gate Standard Score | 5217 points | |
| 3DMark Fire Strike Score | 825 points | |
| 3DMark Fire Strike Extreme Score | 373 points | |
Aide | ||
| HP Spectre x360 15-ap012dx HD Graphics 520, 6200U, Sandisk X300 SD7SN6S-256G-1006 | Toshiba Satellite L50-C-275 GeForce 930M, 6200U, Samsung SSD PM871 MZNLN256HCHP | HP Envy 15-w103ng x360 GeForce 930M, 6200U, Samsung SSD PM851 256 GB MZNTE256HMHP | Dell XPS 15 9550 i7 FHD GeForce GTX 960M, 6700HQ, Samsung PM951 NVMe 512 GB | Lenovo IdeaPad Y50-70-59441231 GeForce GTX 960M, 4710HQ, Samsung SSD PM851 512 GB MZ7TE512HMHP | Lenovo Yoga 500-14ISK GeForce 920M, 6200U, WDC Slim WD10SPCX-24HWST1 | |
|---|---|---|---|---|---|---|
| Noise | 2% | -10% | -4% | -14% | -8% | |
| off / environment * | 29.5 | 22 25% | 31.3 -6% | |||
| Idle Minimum * | 29.5 | 31.3 -6% | 32.9 -12% | 29.2 1% | 29.6 -0% | 32.8 -11% |
| Idle Average * | 29.5 | 31.3 -6% | 32.9 -12% | 29.3 1% | 31.1 -5% | 32.8 -11% |
| Idle Maximum * | 29.6 | 32.2 -9% | 32.9 -11% | 29.5 -0% | 34.3 -16% | 32.8 -11% |
| Load Average * | 38.1 | 36.4 4% | 37 3% | 36.5 4% | 45 -18% | 39.4 -3% |
| Load Maximum * | 38.2 | 36.6 4% | 46 -20% | 47.7 -25% | 49.2 -29% | 39.2 -3% |
* ... Moindre est la valeur, meilleures sont les performances
Degré de la nuisance sonore
| Au repos |
| 29.5 / 29.5 / 29.6 dB(A) |
| Fortement sollicité |
| 38.1 / 38.2 dB(A) |
 | ||
30 dB silencieux 40 dB(A) audible 50 dB(A) bruyant |
||
min: | ||
(+) La température maximale du côté supérieur est de 39.9 °C / 104 F, par rapport à la moyenne de 35.3 °C / 96 F, allant de 19.6 à 55.7 °C pour la classe Convertible.
(±) Le fond chauffe jusqu'à un maximum de 41 °C / 106 F, contre une moyenne de 36.8 °C / 98 F
(+) En utilisation inactive, la température moyenne du côté supérieur est de 24.1 °C / 75 F, par rapport à la moyenne du dispositif de 30.2 °C / 86 F.
(+) Les repose-poignets et le pavé tactile atteignent la température maximale de la peau (34.2 °C / 93.6 F) et ne sont donc pas chauds.
(-) La température moyenne de la zone de l'appui-paume de dispositifs similaires était de 28.1 °C / 82.6 F (-6.1 °C / #-11 F).
| HP Spectre x360 15-ap012dx HD Graphics 520, 6200U, Sandisk X300 SD7SN6S-256G-1006 | HP Spectre x360 15-ap011dx HD Graphics 520, 6200U, Liteon L8H-256V2G | Toshiba Satellite L50-C-275 GeForce 930M, 6200U, Samsung SSD PM871 MZNLN256HCHP | HP Envy 15-w103ng x360 GeForce 930M, 6200U, Samsung SSD PM851 256 GB MZNTE256HMHP | Lenovo IdeaPad Y50-70-59441229 GeForce GTX 960M, 4710HQ, Samsung SSD PM851 256 GB MZ7TE256HMHP | Dell XPS 15-9550 i7 GeForce GTX 960M, 6700HQ, Samsung PM951 NVMe 512 GB | |
|---|---|---|---|---|---|---|
| Power Consumption | 14% | 8% | 17% | -62% | -120% | |
| Idle Minimum * | 6.5 | 5.8 11% | 4.7 28% | 4.15 36% | 4.3 34% | 12.5 -92% |
| Idle Average * | 13.3 | 9.9 26% | 9.9 26% | 8.2 38% | 7.8 41% | 19.6 -47% |
| Idle Maximum * | 15.1 | 11.1 26% | 10.1 33% | 8.2 46% | 10.6 30% | 22.8 -51% |
| Load Average * | 30.8 | 30.6 1% | 36 -17% | 34.6 -12% | 99.7 -224% | 102 -231% |
| Load Maximum * | 38.5 | 36.2 6% | 51 -32% | 48 -25% | 112.3 -192% | 107 -178% |
* ... Moindre est la valeur, meilleures sont les performances
| Éteint/en veille | |
| Au repos | |
| Fortement sollicité |
|
| HP Spectre x360 15-ap012dx 65 Wh | HP Spectre x360 15-ap011dx 65 Wh | Toshiba Satellite L50-C-275 45 Wh | Dell XPS 15 9550 i7 FHD 84 Wh | HP Envy 15-w103ng x360 48 Wh | Lenovo IdeaPad Y50-70-59441229 56 Wh | |
|---|---|---|---|---|---|---|
| Autonomie de la batterie | 25% | -20% | 20% | -8% | -41% | |
| Reader / Idle | 705 | 823 17% | 979 39% | |||
| WiFi v1.3 | 431 | 537 25% | 345 -20% | 544 26% | 398 -8% | 254 -41% |
| Load | 113 | 149 32% | 106 -6% |
Points positifs
Points négatifs
Vous faut-il opter pour la configuration intégrant un écran 4K Ultra HD en lieu et place du Spectre x360 avec écran Full HD ? Au niveau de la finesse des polices et des images, la comparaison n'a même pas lieu d'être : la 4K est bien plus intéressante sur ce point et offre qui plus est un plus grand espace si vous êtes adepte du multitâche. La luminosité n'a subi aucune baisse, ce qui est fréquemment le cas, en passant de la dalle Full HD à la dalle 4K.
La transition vers une dalle à matrice RVBB/RGBW (Red, Green, Blue, White) permet une fidélité dans le rendu colorimétrique légèrement accrue avant étalonnage, mais les contrastes et les températures des niveaux de gris ont souffert lors du passage à la 4K. L'autonomie est elle aussi en berne, avec deux heures d'autonomie en moins en test pratique surf Internet en WiFi. Il existe une configuration encore plus puissante et encore plus énergivore intégrant un processeur Core i7-6560U et une carte graphique Iris Graphics 540. Il n'en reste pas moins que 7 heures d'autonomie est un score de plus honorables pour un ordinateur portable de 15,6 pouces.
La petite poignée de reproches à faire n'est pas si significative et ne devrait pas, selon nous, vous dissuader de passer à l'achat. Il faudra néanmoins garder à l'esprit que les spécifications données par le constructeurs peuvent grandement différer avec la réalité : la luminosité de l'écran, les contrastes ou la couverture des spectres colorimétriques des différentes dalles sont des données souvent inaccessibles avant achat. HP n'est pas le seul constructeur fautif, nous avons obtenu des mesures différentes de luminosité, de contrastes et de gamut entre les différentes configurations des XPS 13 ou Zenbook UX303. La résolution n'est pas la seule différence et induit d'autres écarts..
Le Spectre x360 15 4K UHD offre un écran tactile encore plus agréable que sur la version Full HD. L'autonomie et les contrastes ont été revus à la baisse, mais le Spectre x360 demeure l'un des convertibles de 15 pouces les mieux réussis du marché.
Pour plus de détails, vous trouverez la version complète (en anglais) de ce test ici.
HP Spectre x360 15-ap012dx
-
02/27/2017 v6(old)
Allen Ngo
Pricecompare
