 Deutsch
 English
 Español
 Français
 Italiano
 Nederlands
 Polski
 Português
 Русский
 Türkçe
 Svenska
 Chinese
 Magyar
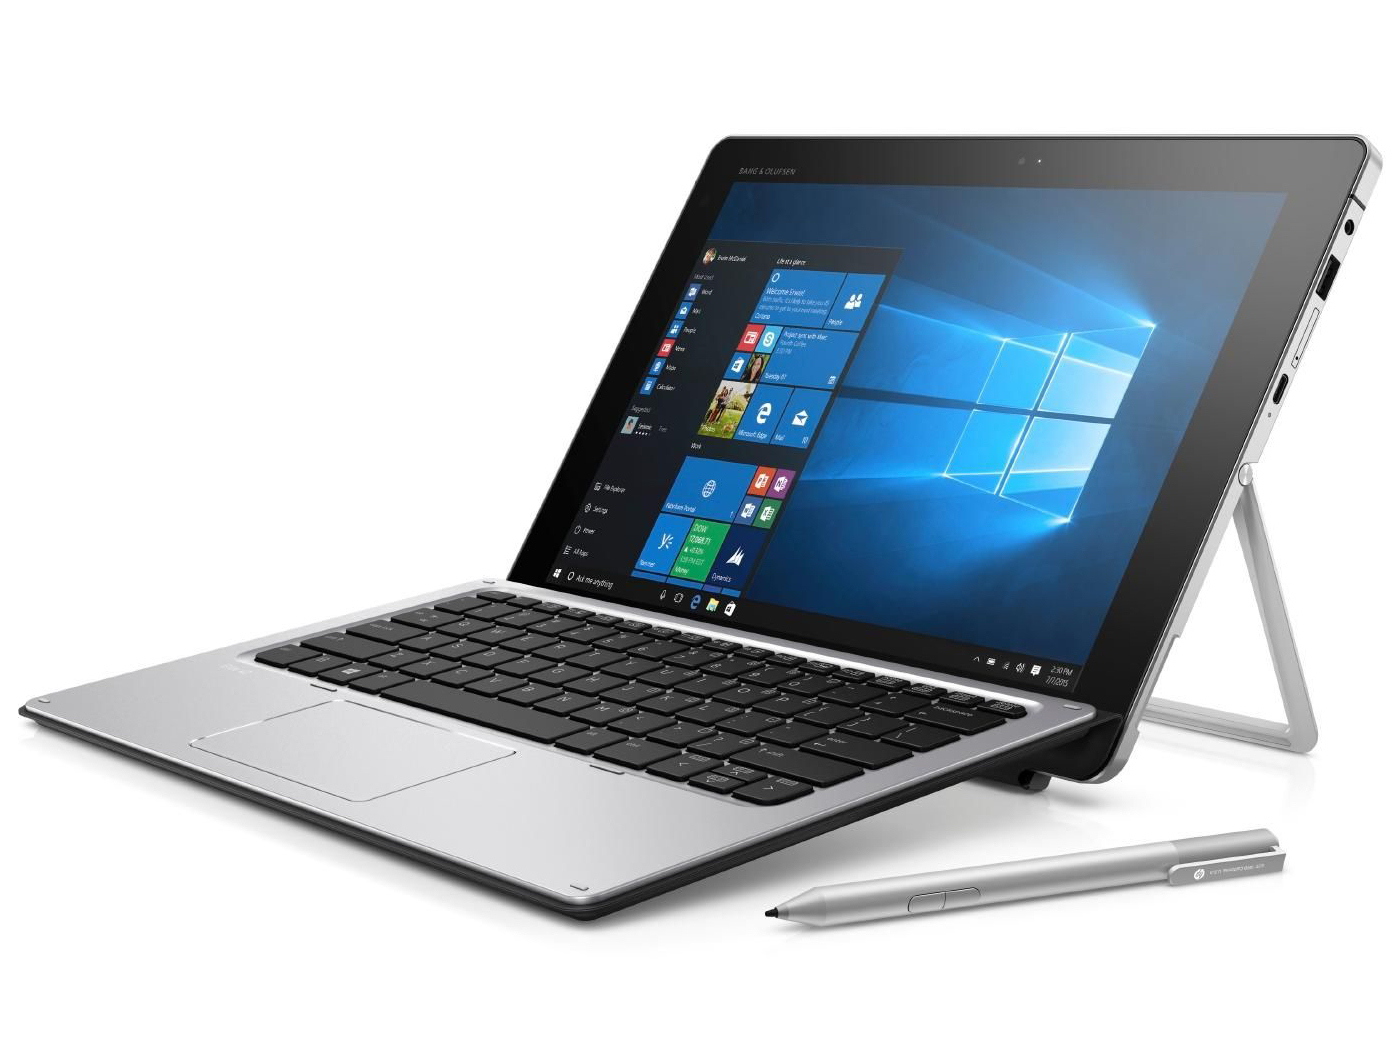
Courte critique du PC convertible HP Elite x2 1012 G1


| |||||||||||||||||||||||||
Homogénéité de la luminosité: 97 %
Valeur mesurée au centre, sur batterie: 322 cd/m²
Contraste: 767:1 (Valeurs des noirs: 0.42 cd/m²)
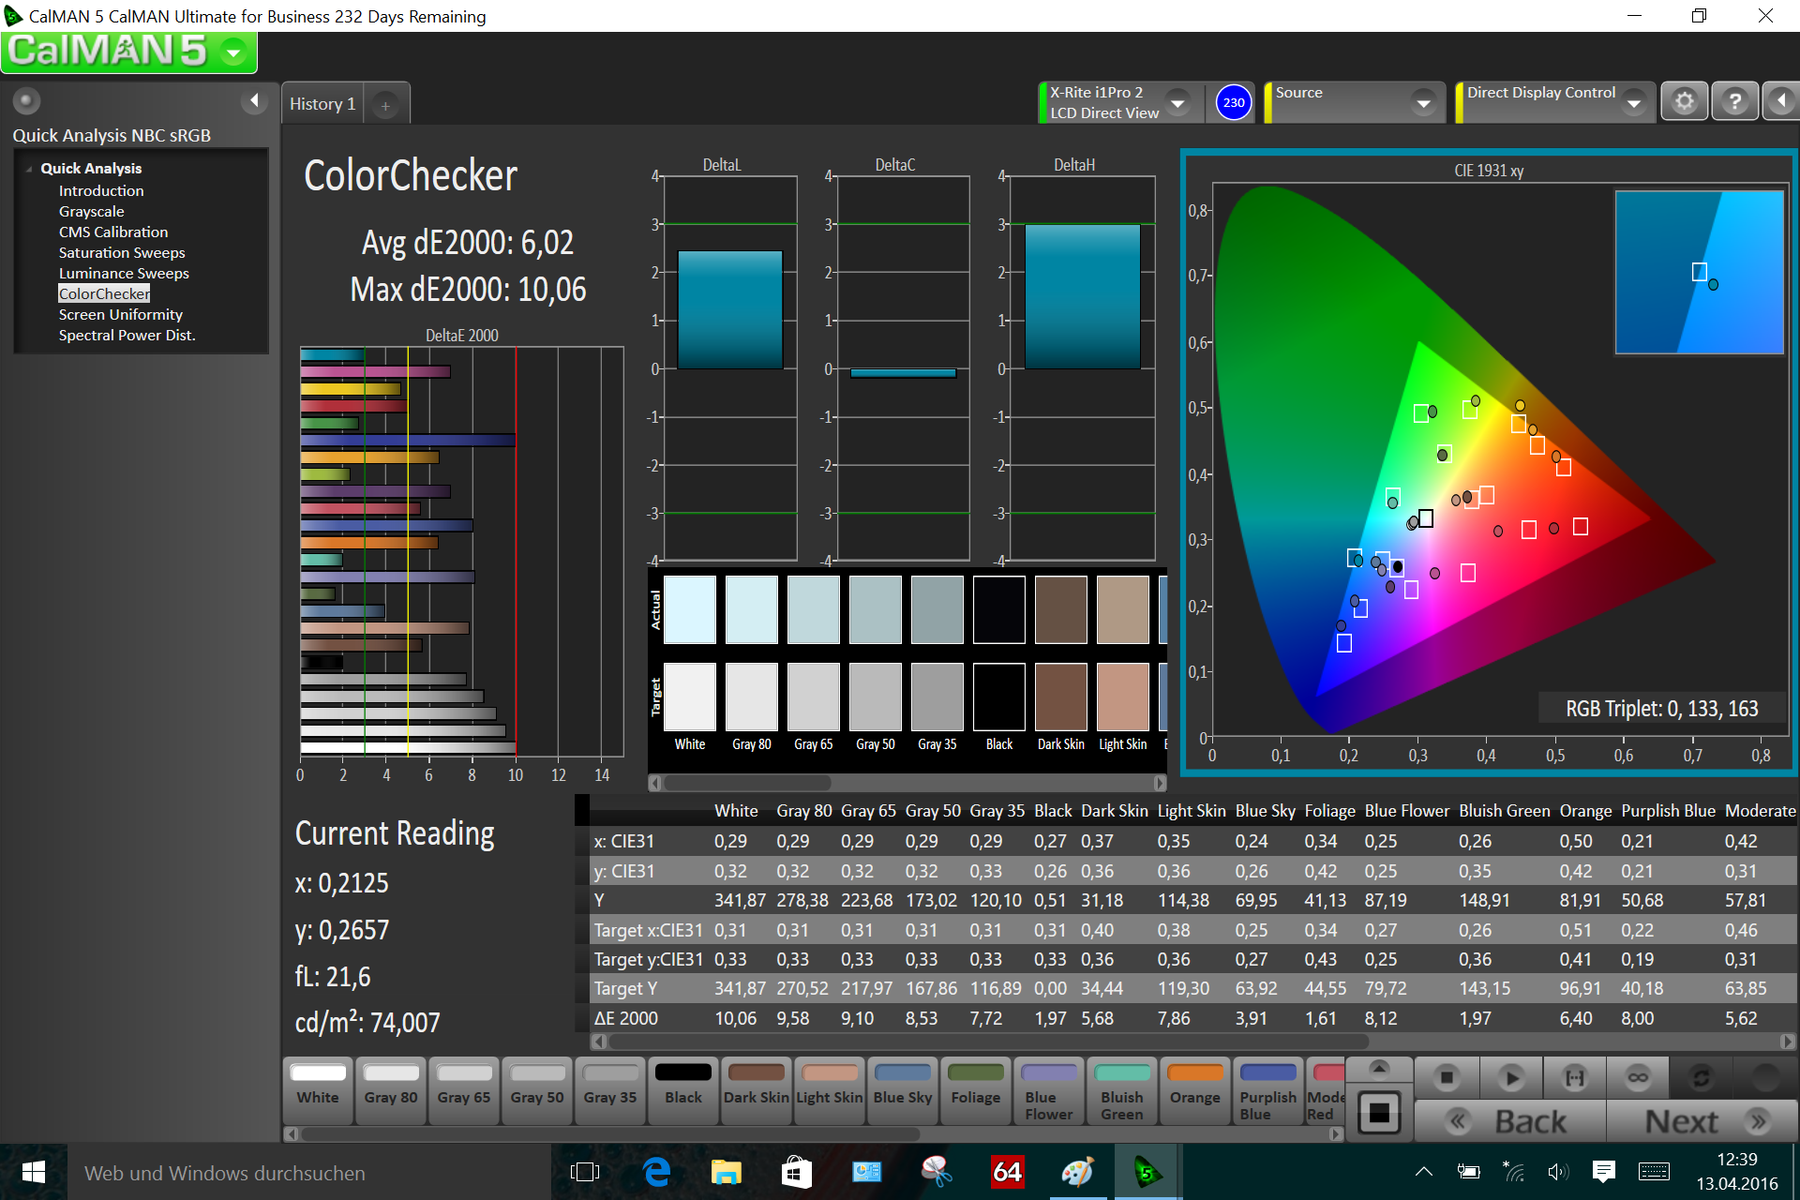
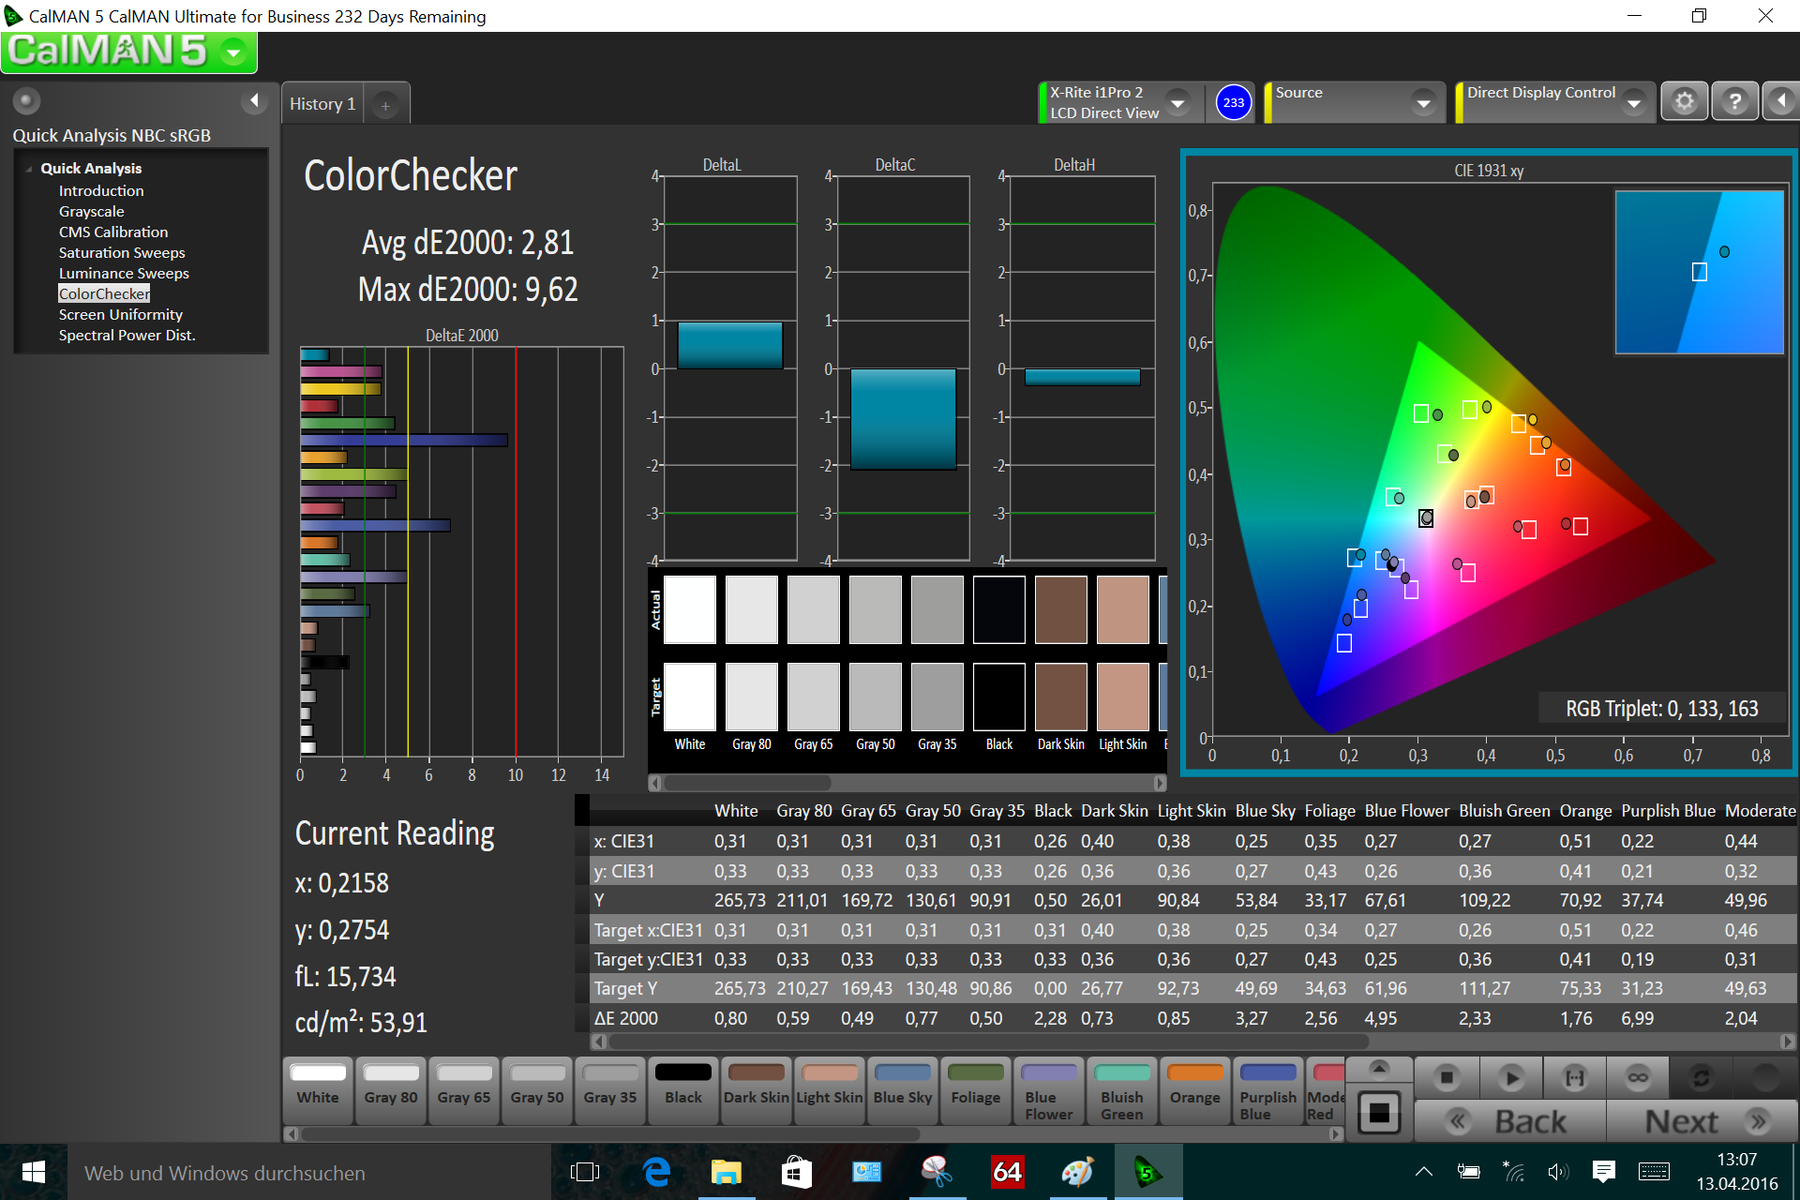
ΔE Color 6.02 | 0.5-29.43 Ø5
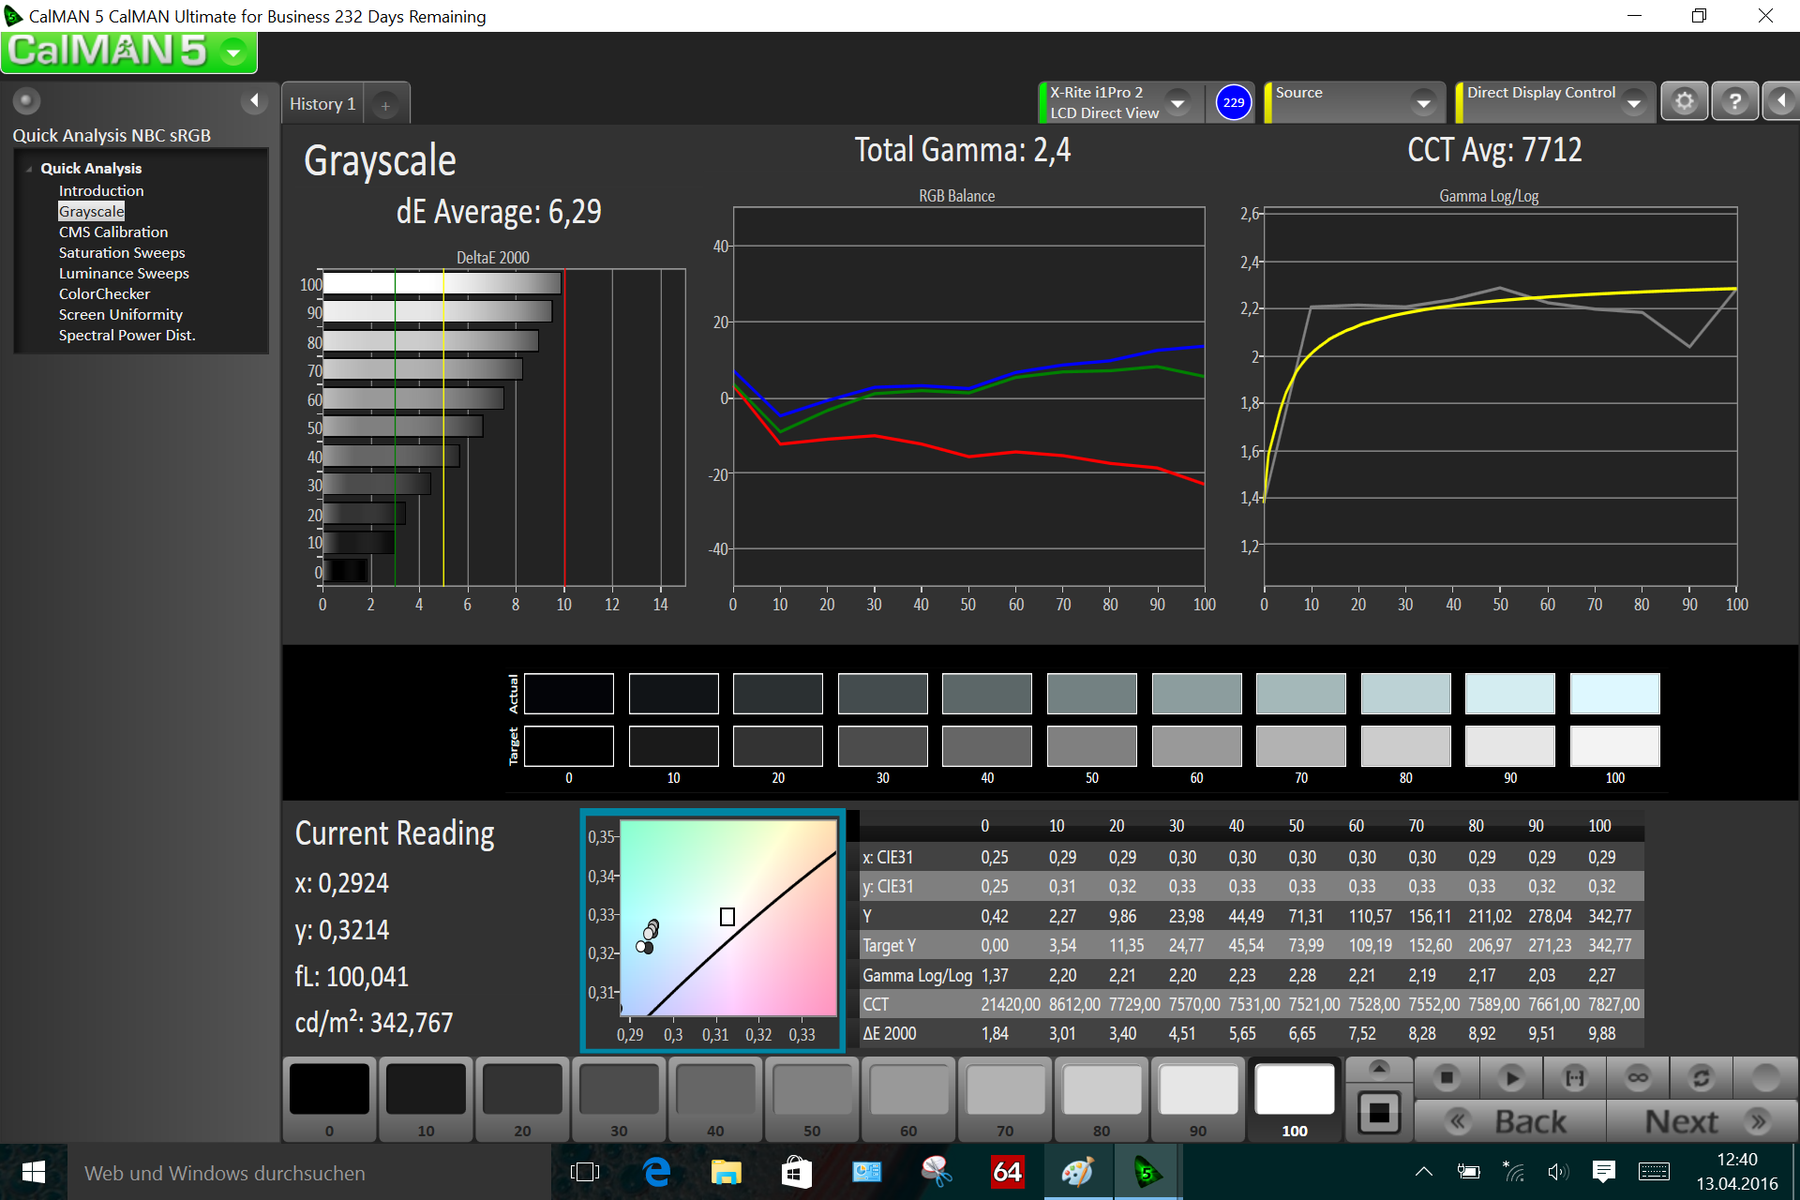
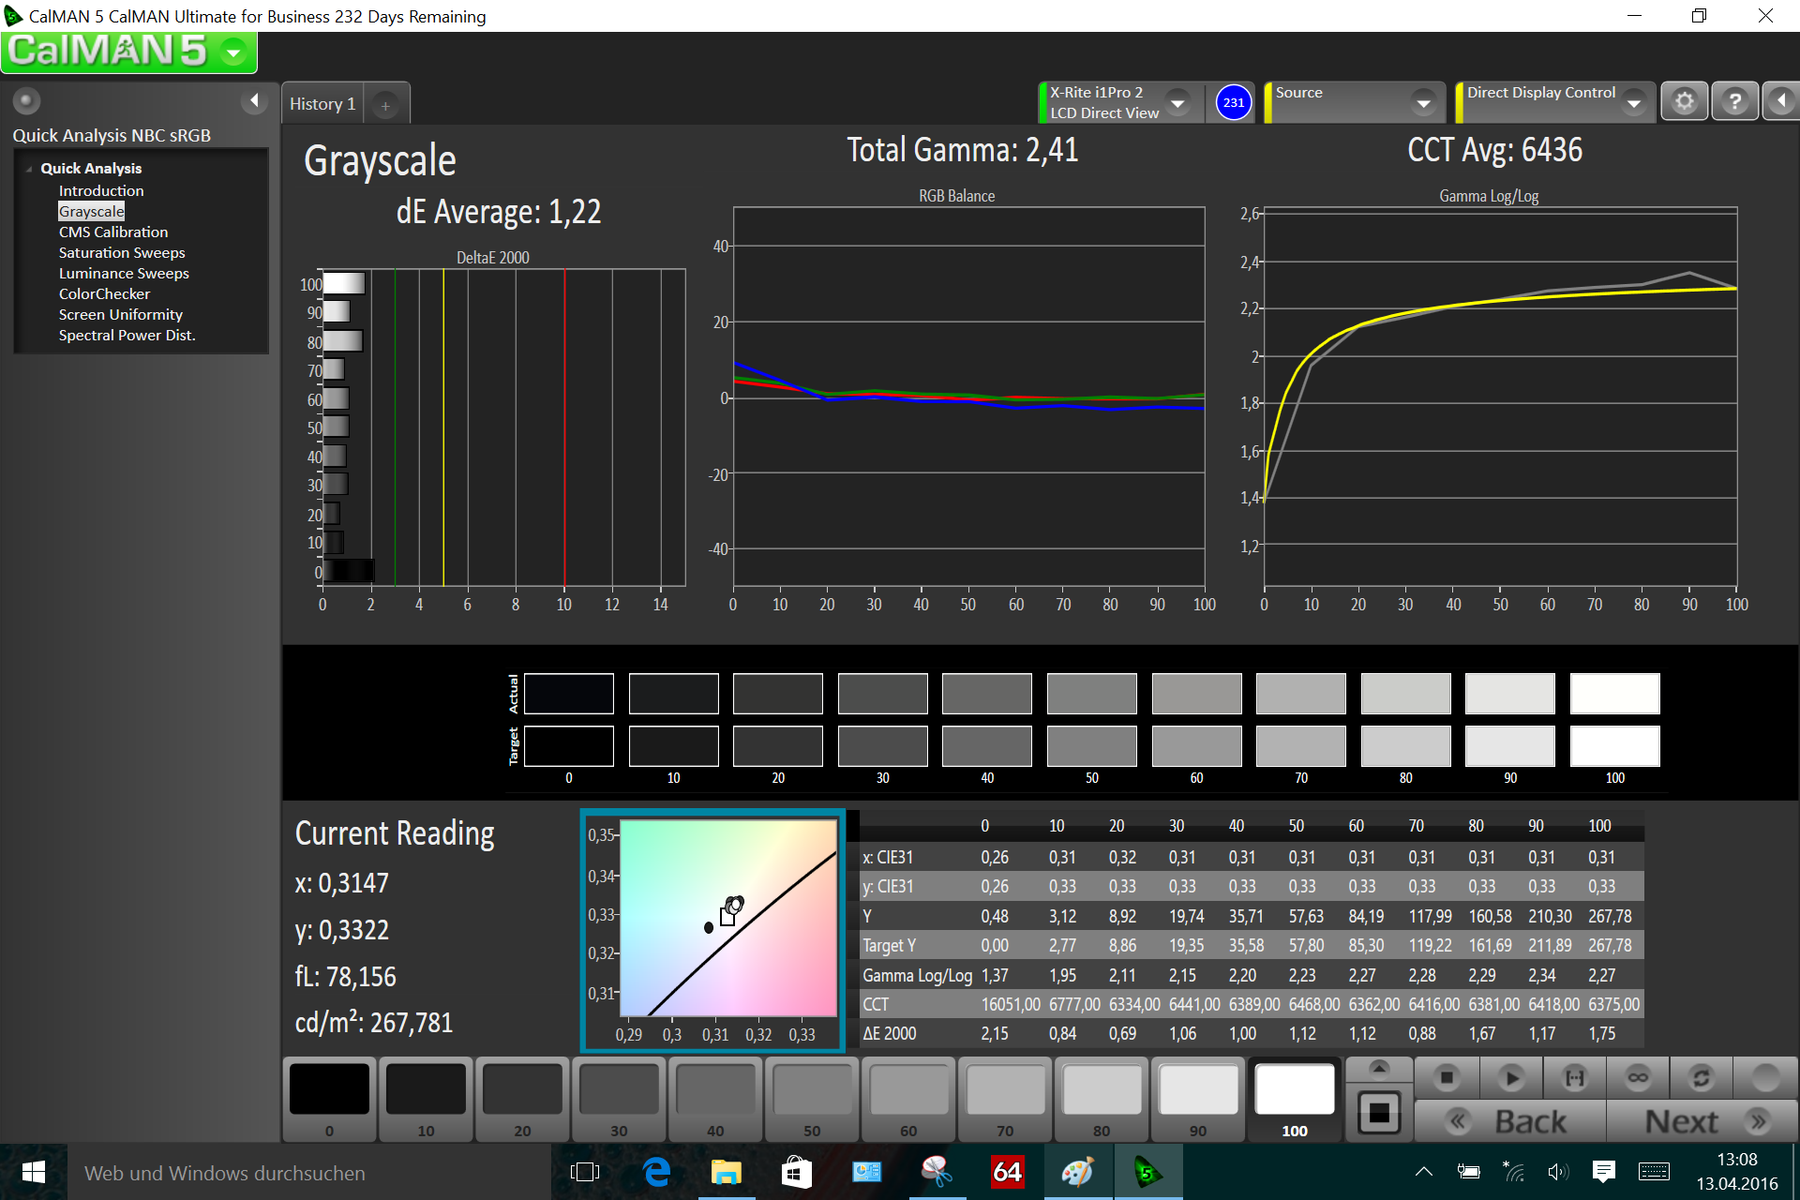
ΔE Greyscale 6.29 | 0.57-98 Ø5.3
73.2% sRGB (Argyll 1.6.3 3D)
47.8% AdobeRGB 1998 (Argyll 1.6.3 3D)
53.8% AdobeRGB 1998 (Argyll 2.2.0 3D)
73.7% sRGB (Argyll 2.2.0 3D)
53.8% Display P3 (Argyll 2.2.0 3D)
Gamma: 2.4
Scintillement / MLI (Modulation de largeur d'impulsion)
| Scintillement / MLI (Modulation de largeur d'impulsion) non décelé | ||
En comparaison, 53 % des appareils testés n'emploient pas MDI pour assombrir leur écran. Nous avons relevé une moyenne à 17924 (minimum : 5 - maximum : 3846000) Hz dans le cas où une MDI était active. | ||
Temps de réponse de l'écran
| ↔ Temps de réponse noir à blanc | ||
|---|---|---|
| 22.8 ms ... hausse ↗ et chute ↘ combinées | ↗ 10.4 ms hausse | 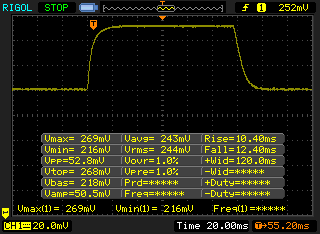 |
| ↘ 12.4 ms chute | ||
| L'écran montre de bons temps de réponse, mais insuffisant pour du jeu compétitif. En comparaison, tous les appareils testés affichent entre 0.1 (minimum) et 240 (maximum) ms. » 45 % des appareils testés affichent de meilleures performances. Cela signifie que les latences relevées sont similaires à la moyenne (21.5 ms) de tous les appareils testés. | ||
| ↔ Temps de réponse gris 50% à gris 80% | ||
| 33.2 ms ... hausse ↗ et chute ↘ combinées | ↗ 15.2 ms hausse |  |
| ↘ 18 ms chute | ||
| L'écran souffre de latences très élevées, à éviter pour le jeu. En comparaison, tous les appareils testés affichent entre 0.2 (minimum) et 636 (maximum) ms. » 39 % des appareils testés affichent de meilleures performances. Cela signifie que les latences relevées sont similaires à la moyenne (33.7 ms) de tous les appareils testés. | ||
| HP Elite x2 1012 G1 IPS, 1920x1280 | Microsoft Surface Pro 4, Core m3 IPS, 2736x1824 | Lenovo IdeaPad Miix 700 IPS, 2160x1440 | Microsoft Surface Pro 4, Core i5, 128GB IPS, 2736x1824 | Apple iPad Pro 12.9 IPS, 2732x2048 | Dell XPS 12 9250 4K IPS, 3840x2160 | HP Elite x2 1011 G1 IPS-Panel, 1920x1080 | |
|---|---|---|---|---|---|---|---|
| Display | 28% | 30% | 26% | 50% | 58% | -14% | |
| Display P3 Coverage | 53.8 | 67.5 25% | 68.1 27% | 65 21% | 91.2 70% | 83.9 56% | 44.4 -17% |
| sRGB Coverage | 73.7 | 96.6 31% | 97.4 32% | 96.5 31% | 98.1 33% | 99.8 35% | 66.4 -10% |
| AdobeRGB 1998 Coverage | 53.8 | 69 28% | 70.2 30% | 67 25% | 79.3 47% | 98.1 82% | 45.91 -15% |
| Response Times | -38% | 20% | -38% | -31% | |||
| Response Time Grey 50% / Grey 80% * | 33.2 ? | 46 ? -39% | 30 ? 10% | 46 ? -39% | 36 ? -8% | ||
| Response Time Black / White * | 22.8 ? | 31 ? -36% | 16 ? 30% | 31.2 ? -37% | 35 ? -54% | ||
| PWM Frequency | 50 ? | 200 ? | 50 ? | 1000 ? | |||
| Screen | 34% | 8% | 28% | 46% | 35% | -6% | |
| Brightness middle | 322 | 389.2 21% | 341 6% | 413 28% | 399 24% | 437 36% | 364 13% |
| Brightness | 319 | 392 23% | 318 0% | 396 24% | 393 23% | 399 25% | 331 4% |
| Brightness Distribution | 97 | 92 -5% | 87 -10% | 87 -10% | 92 -5% | 81 -16% | 84 -13% |
| Black Level * | 0.42 | 0.27 36% | 0.36 14% | 0.36 14% | 0.22 48% | 0.35 17% | 0.44 -5% |
| Contrast | 767 | 1441 88% | 947 23% | 1147 50% | 1814 137% | 1249 63% | 827 8% |
| Colorchecker dE 2000 * | 6.02 | 3.61 40% | 6 -0% | 3.09 49% | 2.96 51% | 3.56 41% | 7.32 -22% |
| Colorchecker dE 2000 max. * | 10.06 | 9.3 8% | |||||
| Greyscale dE 2000 * | 6.29 | 3.8 40% | 8.12 -29% | 3.92 38% | 3 52% | 2.67 58% | 7.37 -17% |
| Gamma | 2.4 92% | 2.16 102% | 2.23 99% | 2.3 96% | 2.21 100% | 2.17 101% | 2.03 108% |
| CCT | 7712 84% | 5969 109% | 7011 93% | 7333 89% | 7049 92% | 6681 97% | 6479 100% |
| Color Space (Percent of AdobeRGB 1998) | 47.8 | 63 32% | 63.4 33% | 61 28% | 71.15 49% | 86 80% | 42.2 -12% |
| Color Space (Percent of sRGB) | 73.2 | 97 33% | 97.4 33% | 97 33% | 97.87 34% | 100 37% | 66.1 -10% |
| Moyenne finale (programmes/paramètres) | 8% /
23% | 19% /
14% | 5% /
18% | 48% /
47% | 21% /
31% | -10% /
-8% |
* ... Moindre est la valeur, meilleures sont les performances
| Geekbench 3 | |
| 32 Bit Single-Core Score (Classer selon les valeurs) | |
| HP Elite x2 1012 G1 | |
| Lenovo IdeaPad Miix 700 | |
| Microsoft Surface Pro 4, Core i5, 128GB | |
| 32 Bit Multi-Core Score (Classer selon les valeurs) | |
| HP Elite x2 1012 G1 | |
| Lenovo IdeaPad Miix 700 | |
| Microsoft Surface Pro 4, Core i5, 128GB | |
| JetStream 1.1 - Total Score (Classer selon les valeurs) | |
| HP Elite x2 1012 G1 | |
| Lenovo IdeaPad Miix 700 | |
| Apple iPad Pro 12.9 | |
| Octane V2 - Total Score (Classer selon les valeurs) | |
| HP Elite x2 1012 G1 | |
| Lenovo IdeaPad Miix 700 | |
| Microsoft Surface Pro 4, Core i5, 128GB | |
| Apple iPad Pro 12.9 | |
| HP Elite x2 1011 G1 | |
| Peacekeeper - --- (Classer selon les valeurs) | |
| HP Elite x2 1012 G1 | |
| Microsoft Surface Pro 4, Core m3 | |
| Lenovo IdeaPad Miix 700 | |
| Microsoft Surface Pro 4, Core i5, 128GB | |
| Apple iPad Pro 12.9 | |
| HP Elite x2 1011 G1 | |
* ... Moindre est la valeur, meilleures sont les performances
| PCMark 7 Score | 4808 points | |
| PCMark 8 Home Score Accelerated v2 | 2983 points | |
| PCMark 8 Creative Score Accelerated v2 | 3423 points | |
| PCMark 8 Work Score Accelerated v2 | 3932 points | |
Aide | ||

| 3DMark 06 Standard Score | 7912 points | |
| 3DMark 11 Performance | 1334 points | |
| 3DMark Ice Storm Standard Score | 47242 points | |
| 3DMark Cloud Gate Standard Score | 4943 points | |
| 3DMark Fire Strike Score | 739 points | |
Aide | ||
| 3DMark 06 - 1280x1024 Standard Score AA:0x AF:0x (Classer selon les valeurs) | |
| HP Elite x2 1012 G1 | |
| Microsoft Surface Pro 4, Core m3 | |
| Lenovo IdeaPad Miix 700 | |
| HP Elite x2 1011 G1 | |
| Bas | Moyen | Élevé | Ultra | |
| Tomb Raider (2013) | 59.9 | 31.2 | 21.6 | 9.5 |
| BioShock Infinite (2013) | 44.1 | 24.6 | 20.7 | 5.9 |
| Battlefield 4 (2013) | 35.5 | 23.5 | 15 | 4.3 |
| The Witcher 3 (2015) | 11.2 | 7.1 | ||
| The Division (2016) | 12 | 8.4 | ||
| Hitman 2016 (2016) | 10.1 | 9.2 |
| BioShock Infinite - 1280x720 Very Low Preset (Classer selon les valeurs) | |
| HP Elite x2 1012 G1 | |
| Microsoft Surface Pro 4, Core m3 | |
| Lenovo IdeaPad Miix 700 | |
| Microsoft Surface Pro 4, Core i5, 128GB | |
| Microsoft Surface Pro 4 Core i7 | |
(+) La température maximale du côté supérieur est de 39 °C / 102 F, par rapport à la moyenne de 35.3 °C / 96 F, allant de 19.6 à 55.7 °C pour la classe Convertible.
(±) Le fond chauffe jusqu'à un maximum de 41.2 °C / 106 F, contre une moyenne de 36.8 °C / 98 F
(+) En utilisation inactive, la température moyenne du côté supérieur est de 28.7 °C / 84 F, par rapport à la moyenne du dispositif de 30.2 °C / 86 F.
(+) Les repose-poignets et le pavé tactile atteignent la température maximale de la peau (34.9 °C / 94.8 F) et ne sont donc pas chauds.
(-) La température moyenne de la zone de l'appui-paume de dispositifs similaires était de 28.1 °C / 82.6 F (-6.8 °C / #-12.2 F).
| HP Elite x2 1012 G1 6Y54, HD Graphics 515 | Microsoft Surface Pro 4, Core m3 6Y30, HD Graphics 515 | Lenovo IdeaPad Miix 700 6Y54, HD Graphics 515 | Microsoft Surface Pro 4, Core i5, 128GB 6300U, HD Graphics 520 | Apple iPad Pro 12.9 A9X, A9X / PowerVR GT7xxx | Dell XPS 12 9250 4K 6Y75, HD Graphics 515 | HP Elite x2 1011 G1 5Y51, HD Graphics 5300 | |
|---|---|---|---|---|---|---|---|
| Heat | -8% | 1% | -32% | -6% | -8% | 3% | |
| Maximum Upper Side * | 39 | 43.6 -12% | 38.6 1% | 52.3 -34% | 40.1 -3% | 41.4 -6% | 36.6 6% |
| Maximum Bottom * | 41.2 | 45.2 -10% | 40.8 1% | 51.4 -25% | 39.3 5% | 43.9 -7% | 37.3 9% |
| Idle Upper Side * | 29.5 | 32.4 -10% | 30.4 -3% | 43.2 -46% | 33.8 -15% | 34.7 -18% | 30.5 -3% |
| Idle Bottom * | 29.8 | 29.6 1% | 28 6% | 36 -21% | 32.9 -10% | 29.4 1% | 29.9 -0% |
* ... Moindre est la valeur, meilleures sont les performances
| Éteint/en veille | |
| Au repos | |
| Fortement sollicité |
|
| HP Elite x2 1012 G1 6Y54, HD Graphics 515 | Lenovo IdeaPad Miix 700 6Y54, HD Graphics 515 | Microsoft Surface Pro 4, Core i5, 128GB 6300U, HD Graphics 520 | Apple iPad Pro 12.9 A9X, A9X / PowerVR GT7xxx | Dell XPS 12 9250 4K 6Y75, HD Graphics 515 | HP Elite x2 1011 G1 5Y51, HD Graphics 5300 | |
|---|---|---|---|---|---|---|
| Power Consumption | -9% | -7% | 6% | -25% | 45% | |
| Idle Minimum * | 3.7 | 4 -8% | 4.4 -19% | 2.69 27% | 5.4 -46% | 1.5 59% |
| Idle Average * | 6.8 | 8.6 -26% | 9 -32% | 10.95 -61% | 10.2 -50% | 4 41% |
| Idle Maximum * | 7.6 | 9.3 -22% | 10.7 -41% | 11.14 -47% | 12.5 -64% | 5 34% |
| Load Average * | 22.5 | 18.6 17% | 19.6 13% | 11.54 49% | 21.4 5% | 13.9 38% |
| Load Maximum * | 34.5 | 36.3 -5% | 19.9 42% | 12.8 63% | 24.4 29% | 16.9 51% |
* ... Moindre est la valeur, meilleures sont les performances
| HP Elite x2 1012 G1 37 Wh | Microsoft Surface Pro 4, Core m3 38 Wh | Lenovo IdeaPad Miix 700 41 Wh | Microsoft Surface Pro 4, Core i5, 128GB 38 Wh | Apple iPad Pro 12.9 39 Wh | Dell XPS 12 9250 4K 28 Wh | HP Elite x2 1011 G1 54 Wh | |
|---|---|---|---|---|---|---|---|
| Autonomie de la batterie | 8% | 11% | 1% | 79% | -41% | 68% | |
| Reader / Idle | 732 | 791 8% | 861 18% | 899 23% | 1933 164% | 370 -49% | 1063 45% |
| H.264 | 432 | 450 4% | 630 46% | 658 52% | |||
| WiFi v1.3 | 443 | 488 10% | 440 -1% | 427 -4% | 695 57% | 243 -45% | 675 52% |
| Load | 130 | 138 6% | 157 21% | 111 -15% | 195 50% | 93 -28% | 288 122% |
Points positifs
Points négatifs
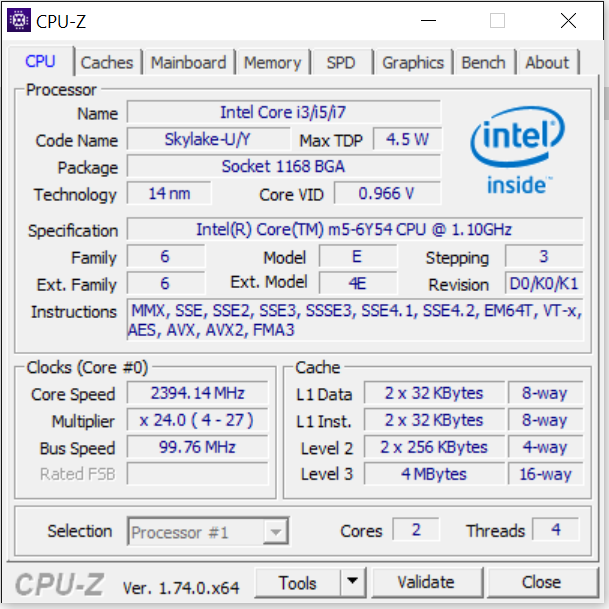
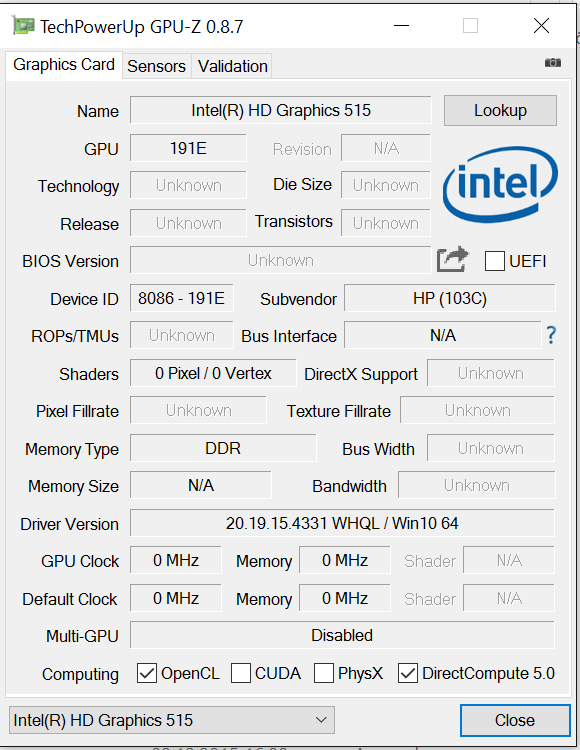
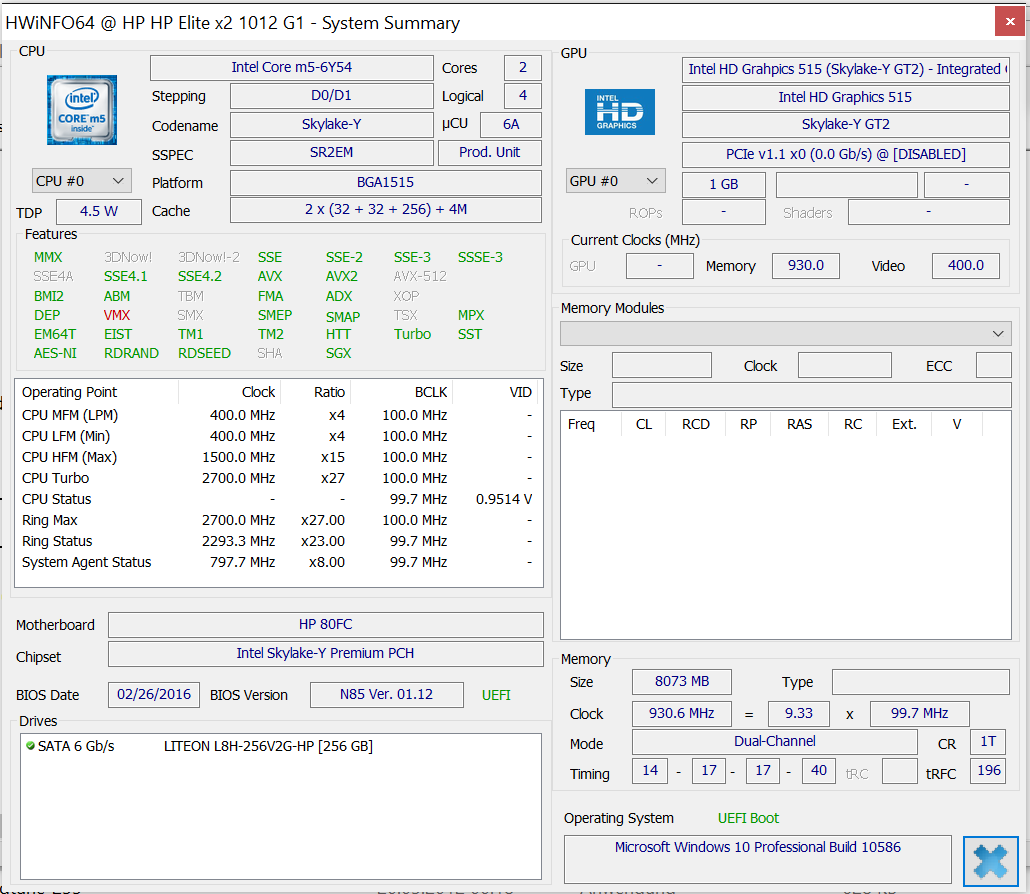
Tout comme ses concurrents, HP a équipé son x2 Elite avec un Core-m Skylake. Les performances sont plus que suffisantes pour la plupart des utilisations. Aucune baisse de performance n'est à noter en utilisation prolongée. La carte graphique se bride néanmoins afin de se refroidir avant de revenir à ses niveaux normaux. À notre avis, HP s'en est bien mieux sorti dans le refroidissement du SoC que Lenovo avec par exemple son IdeaPad Miix 700.
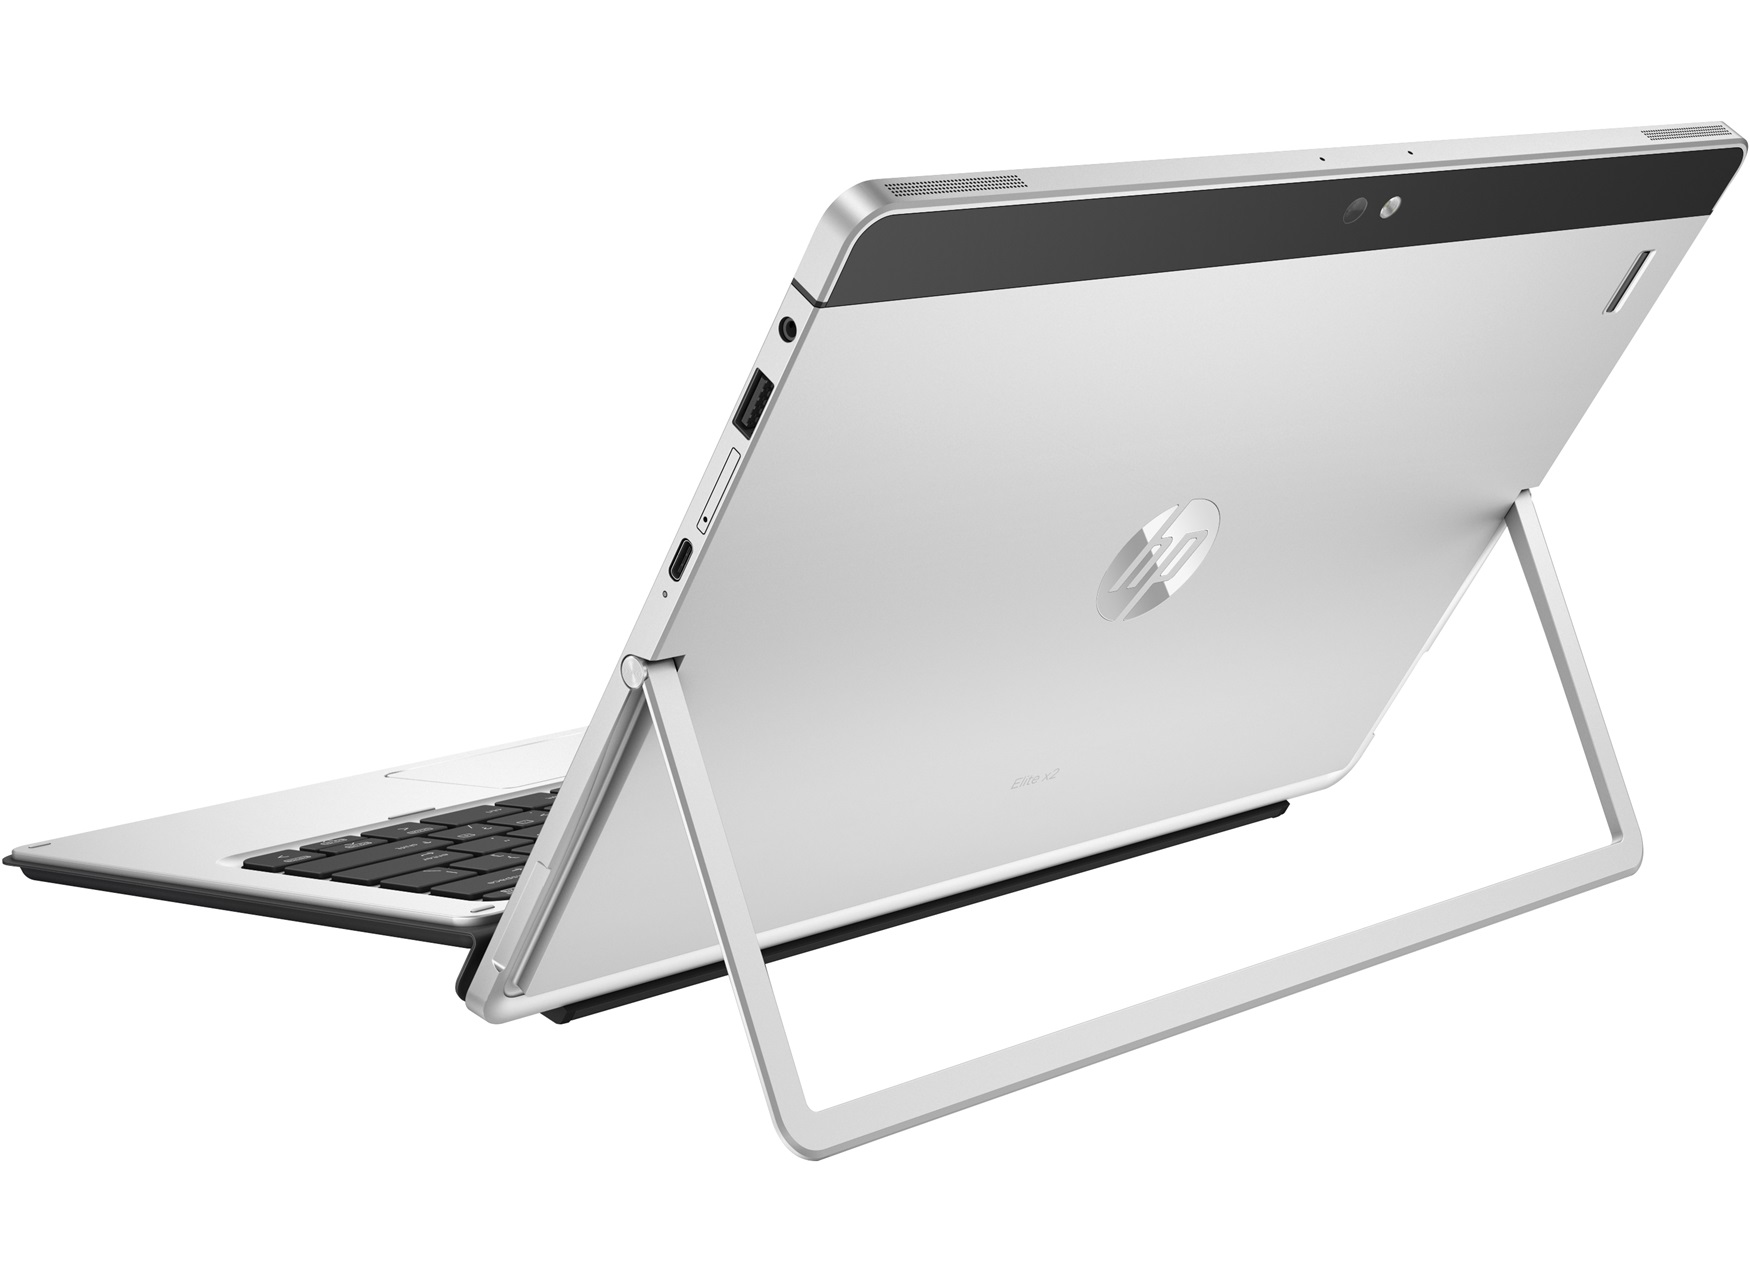
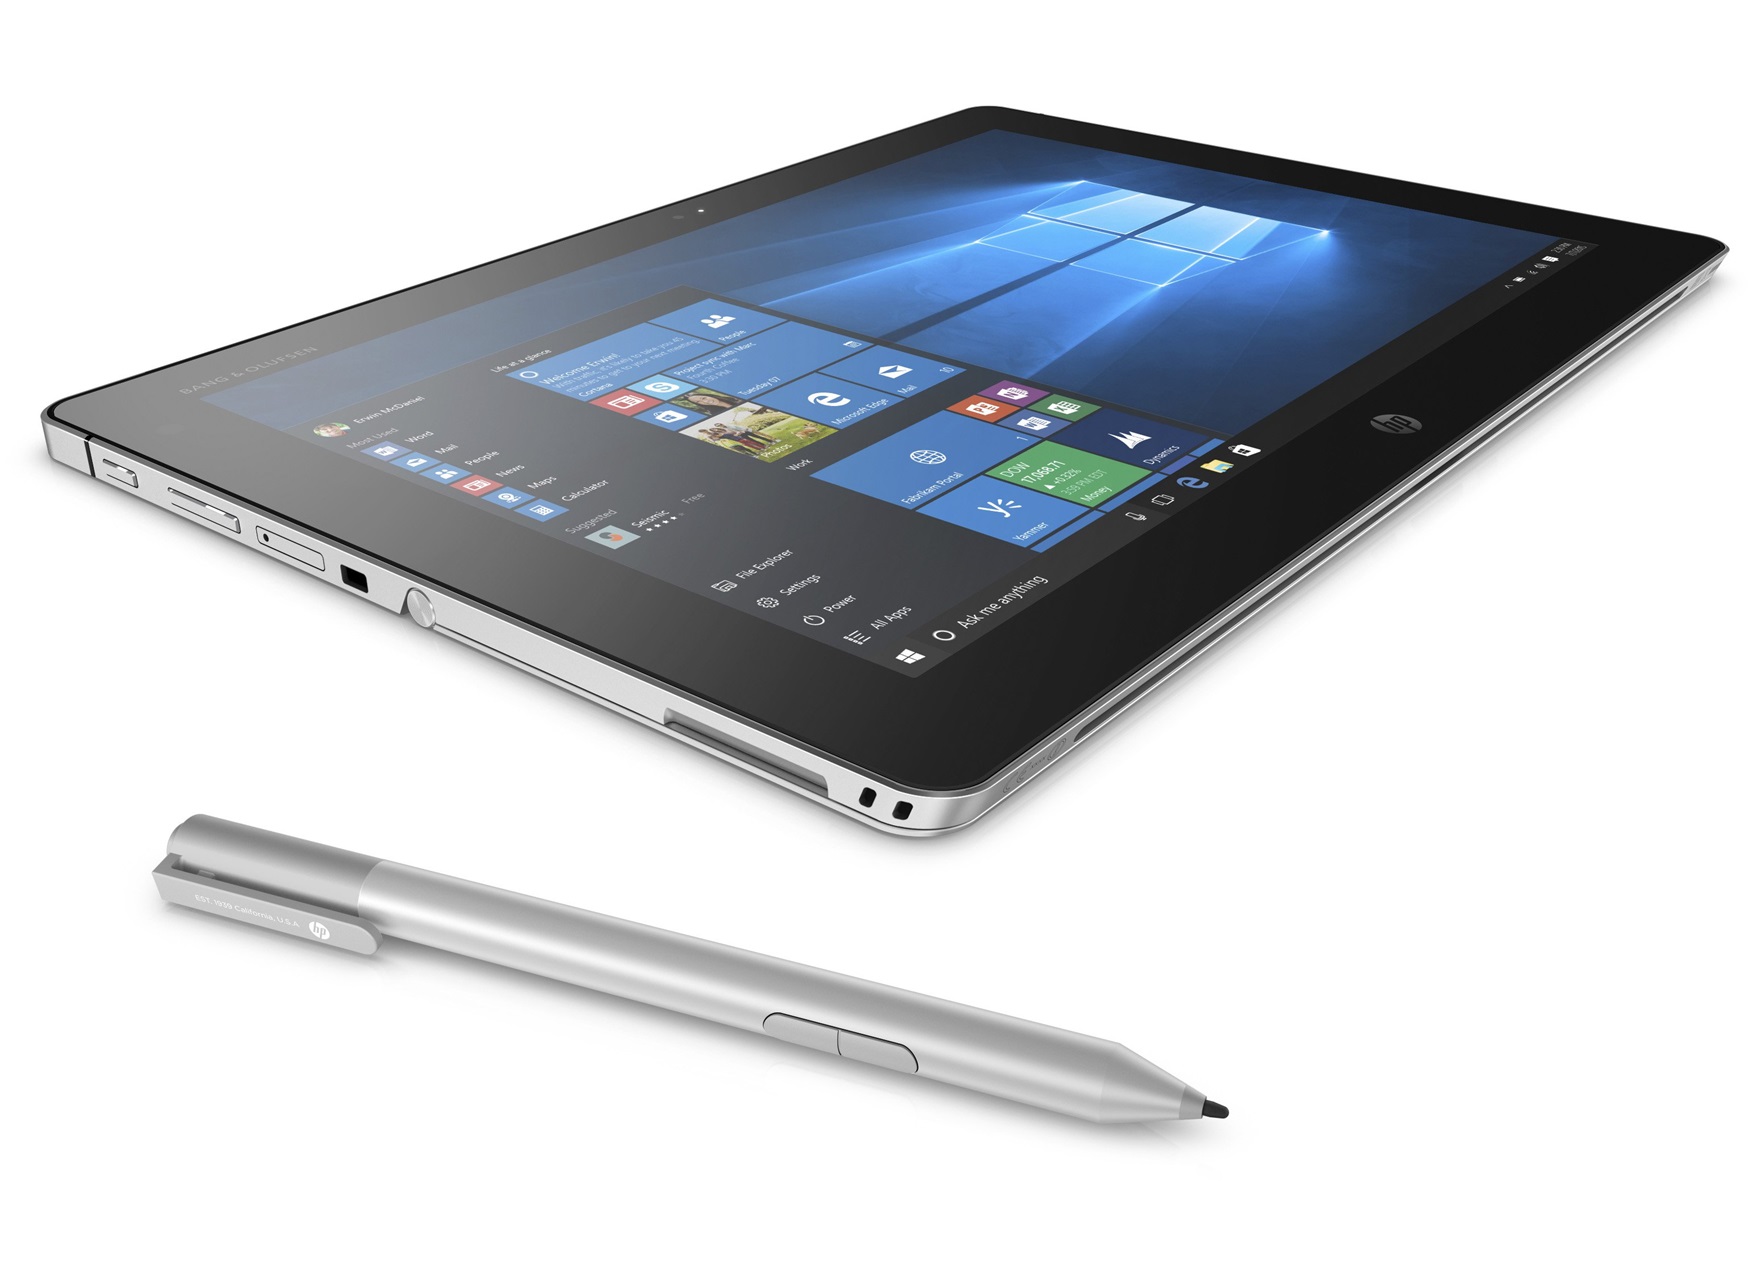
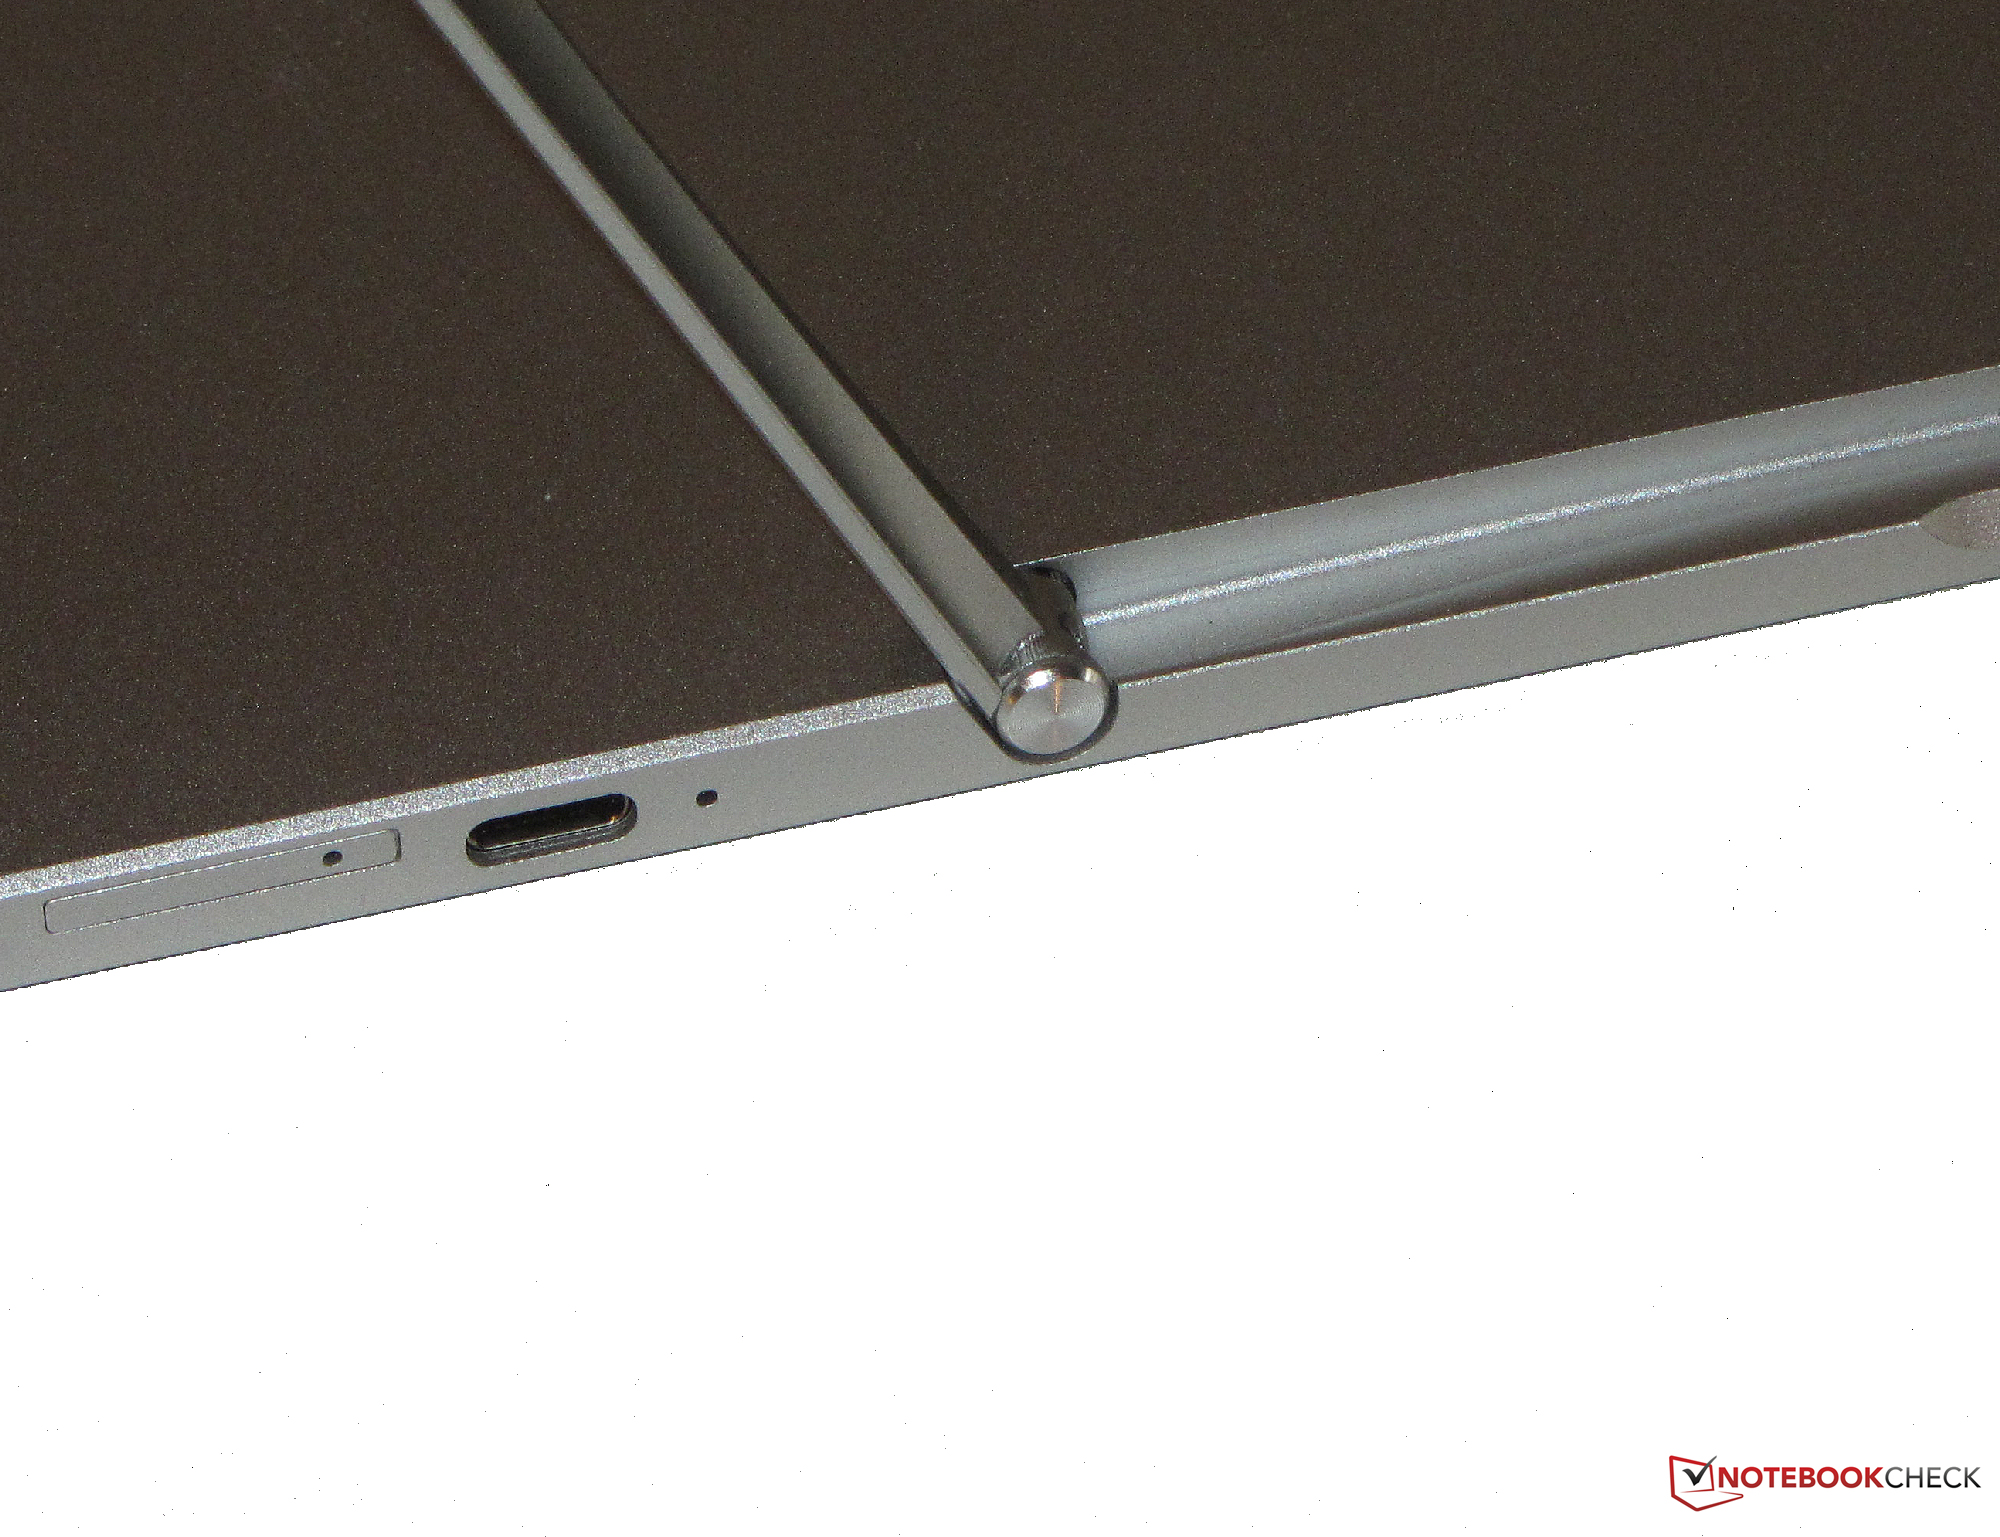
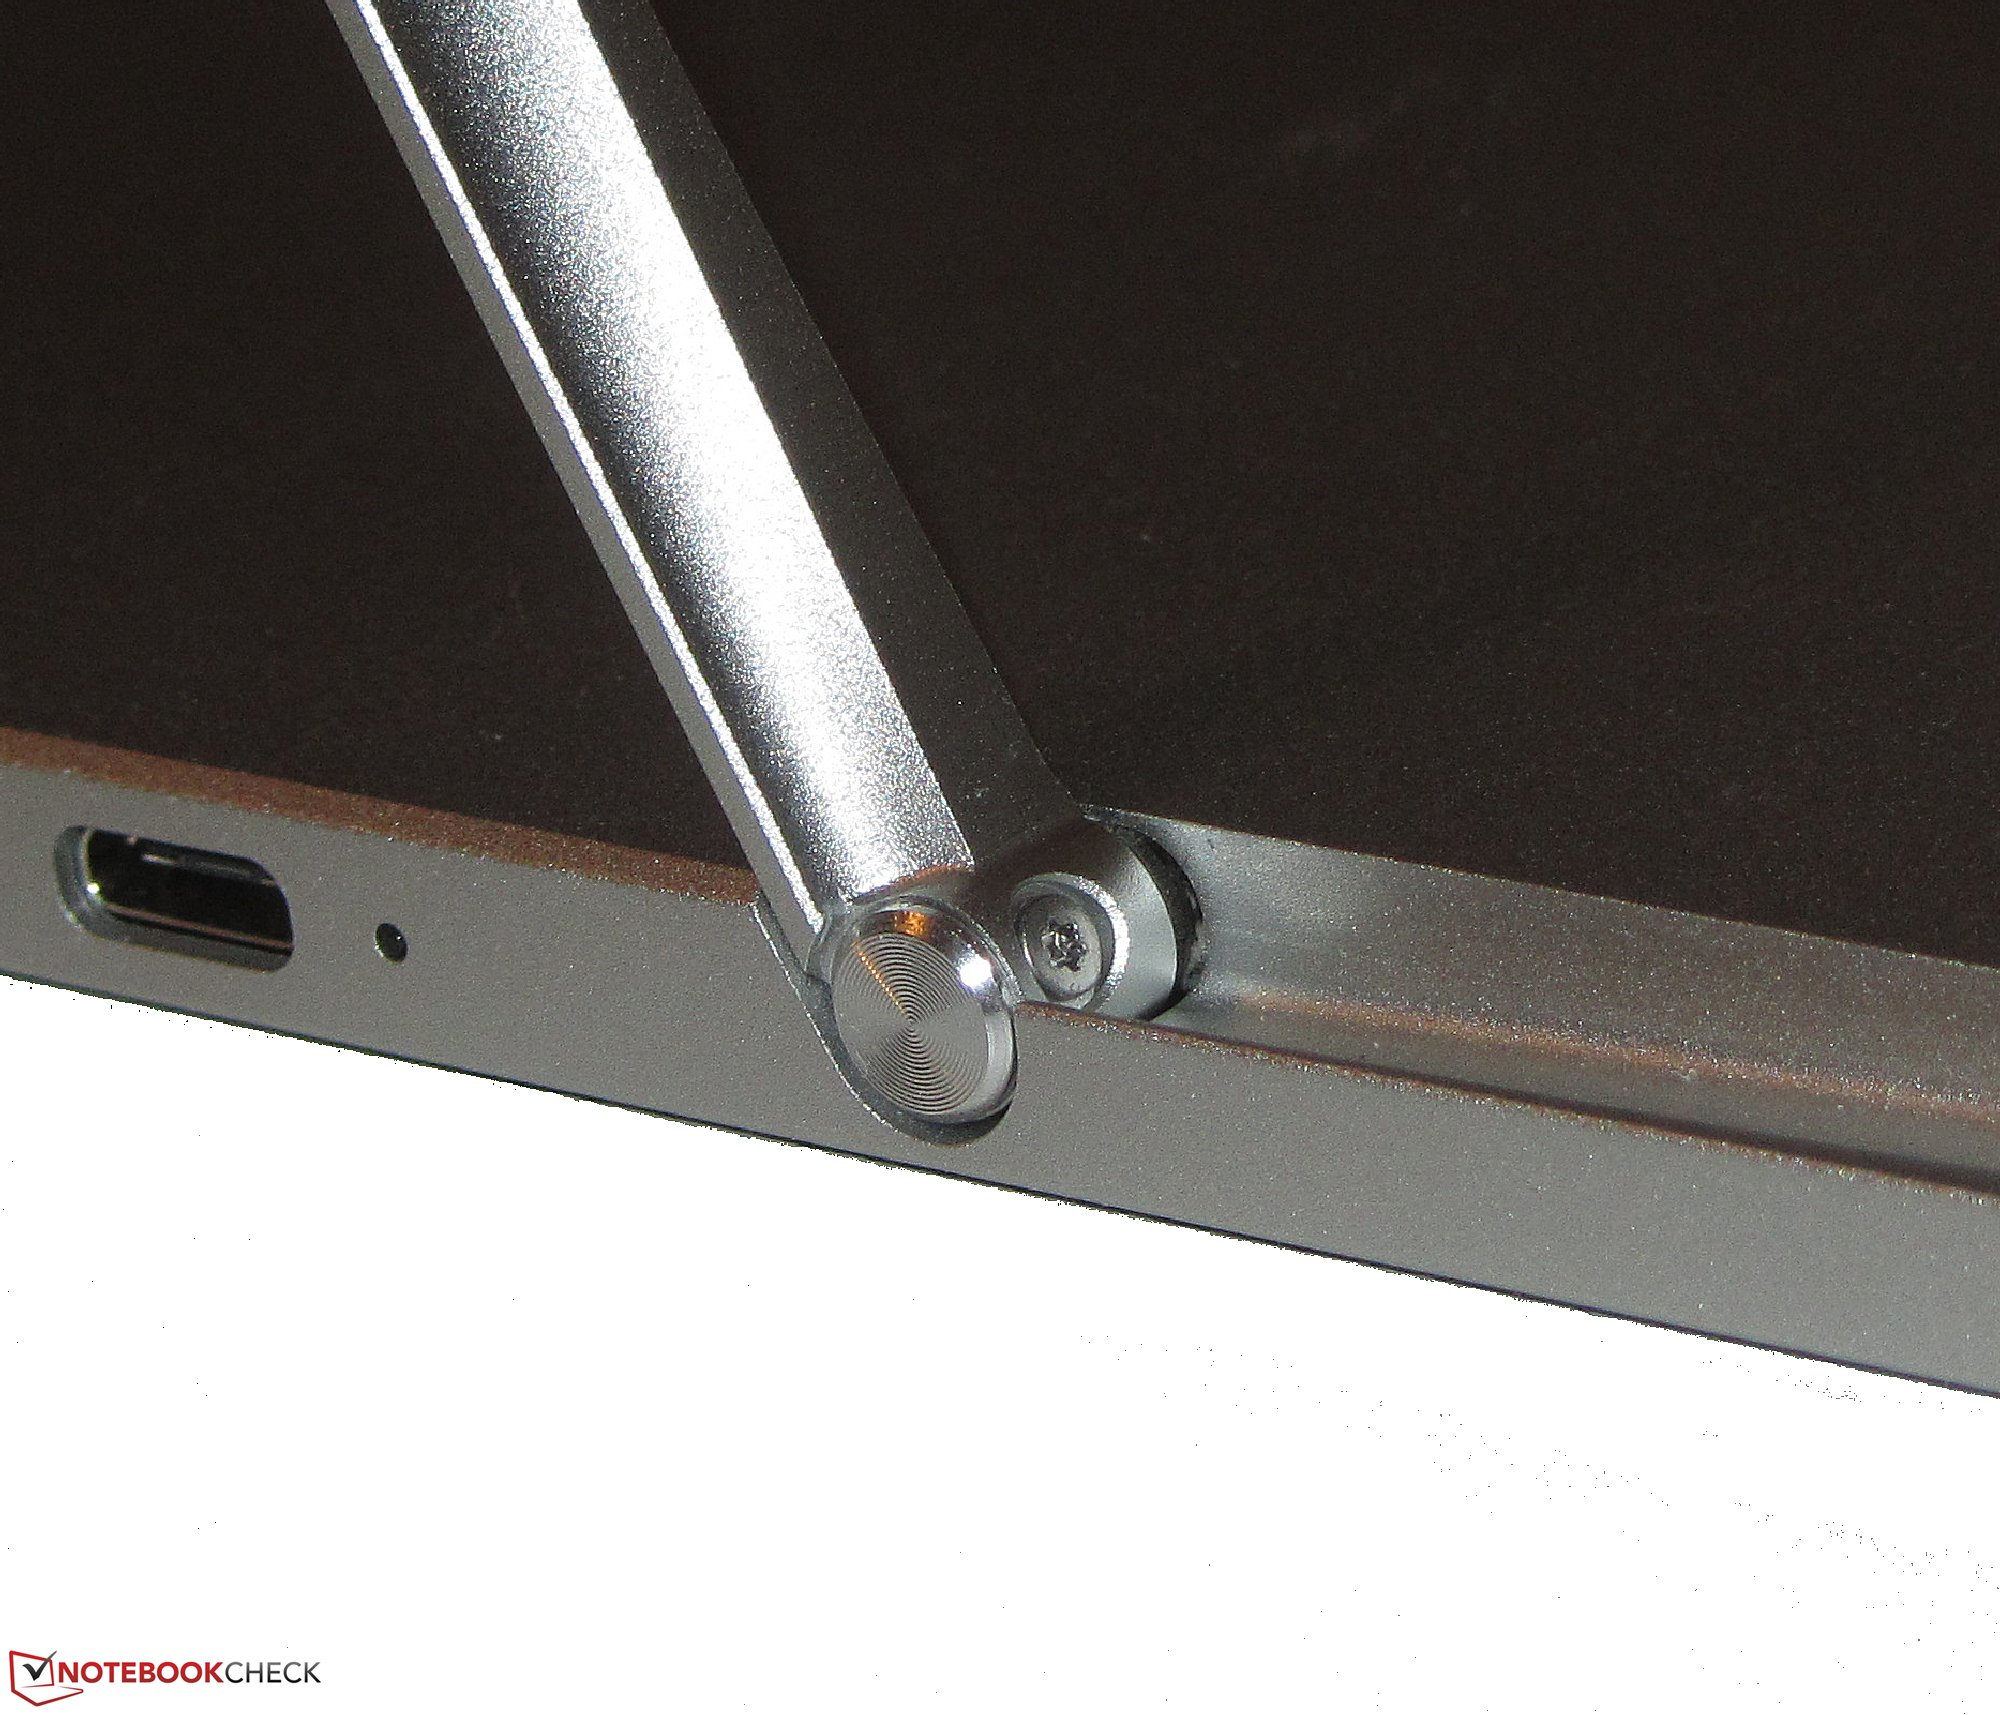
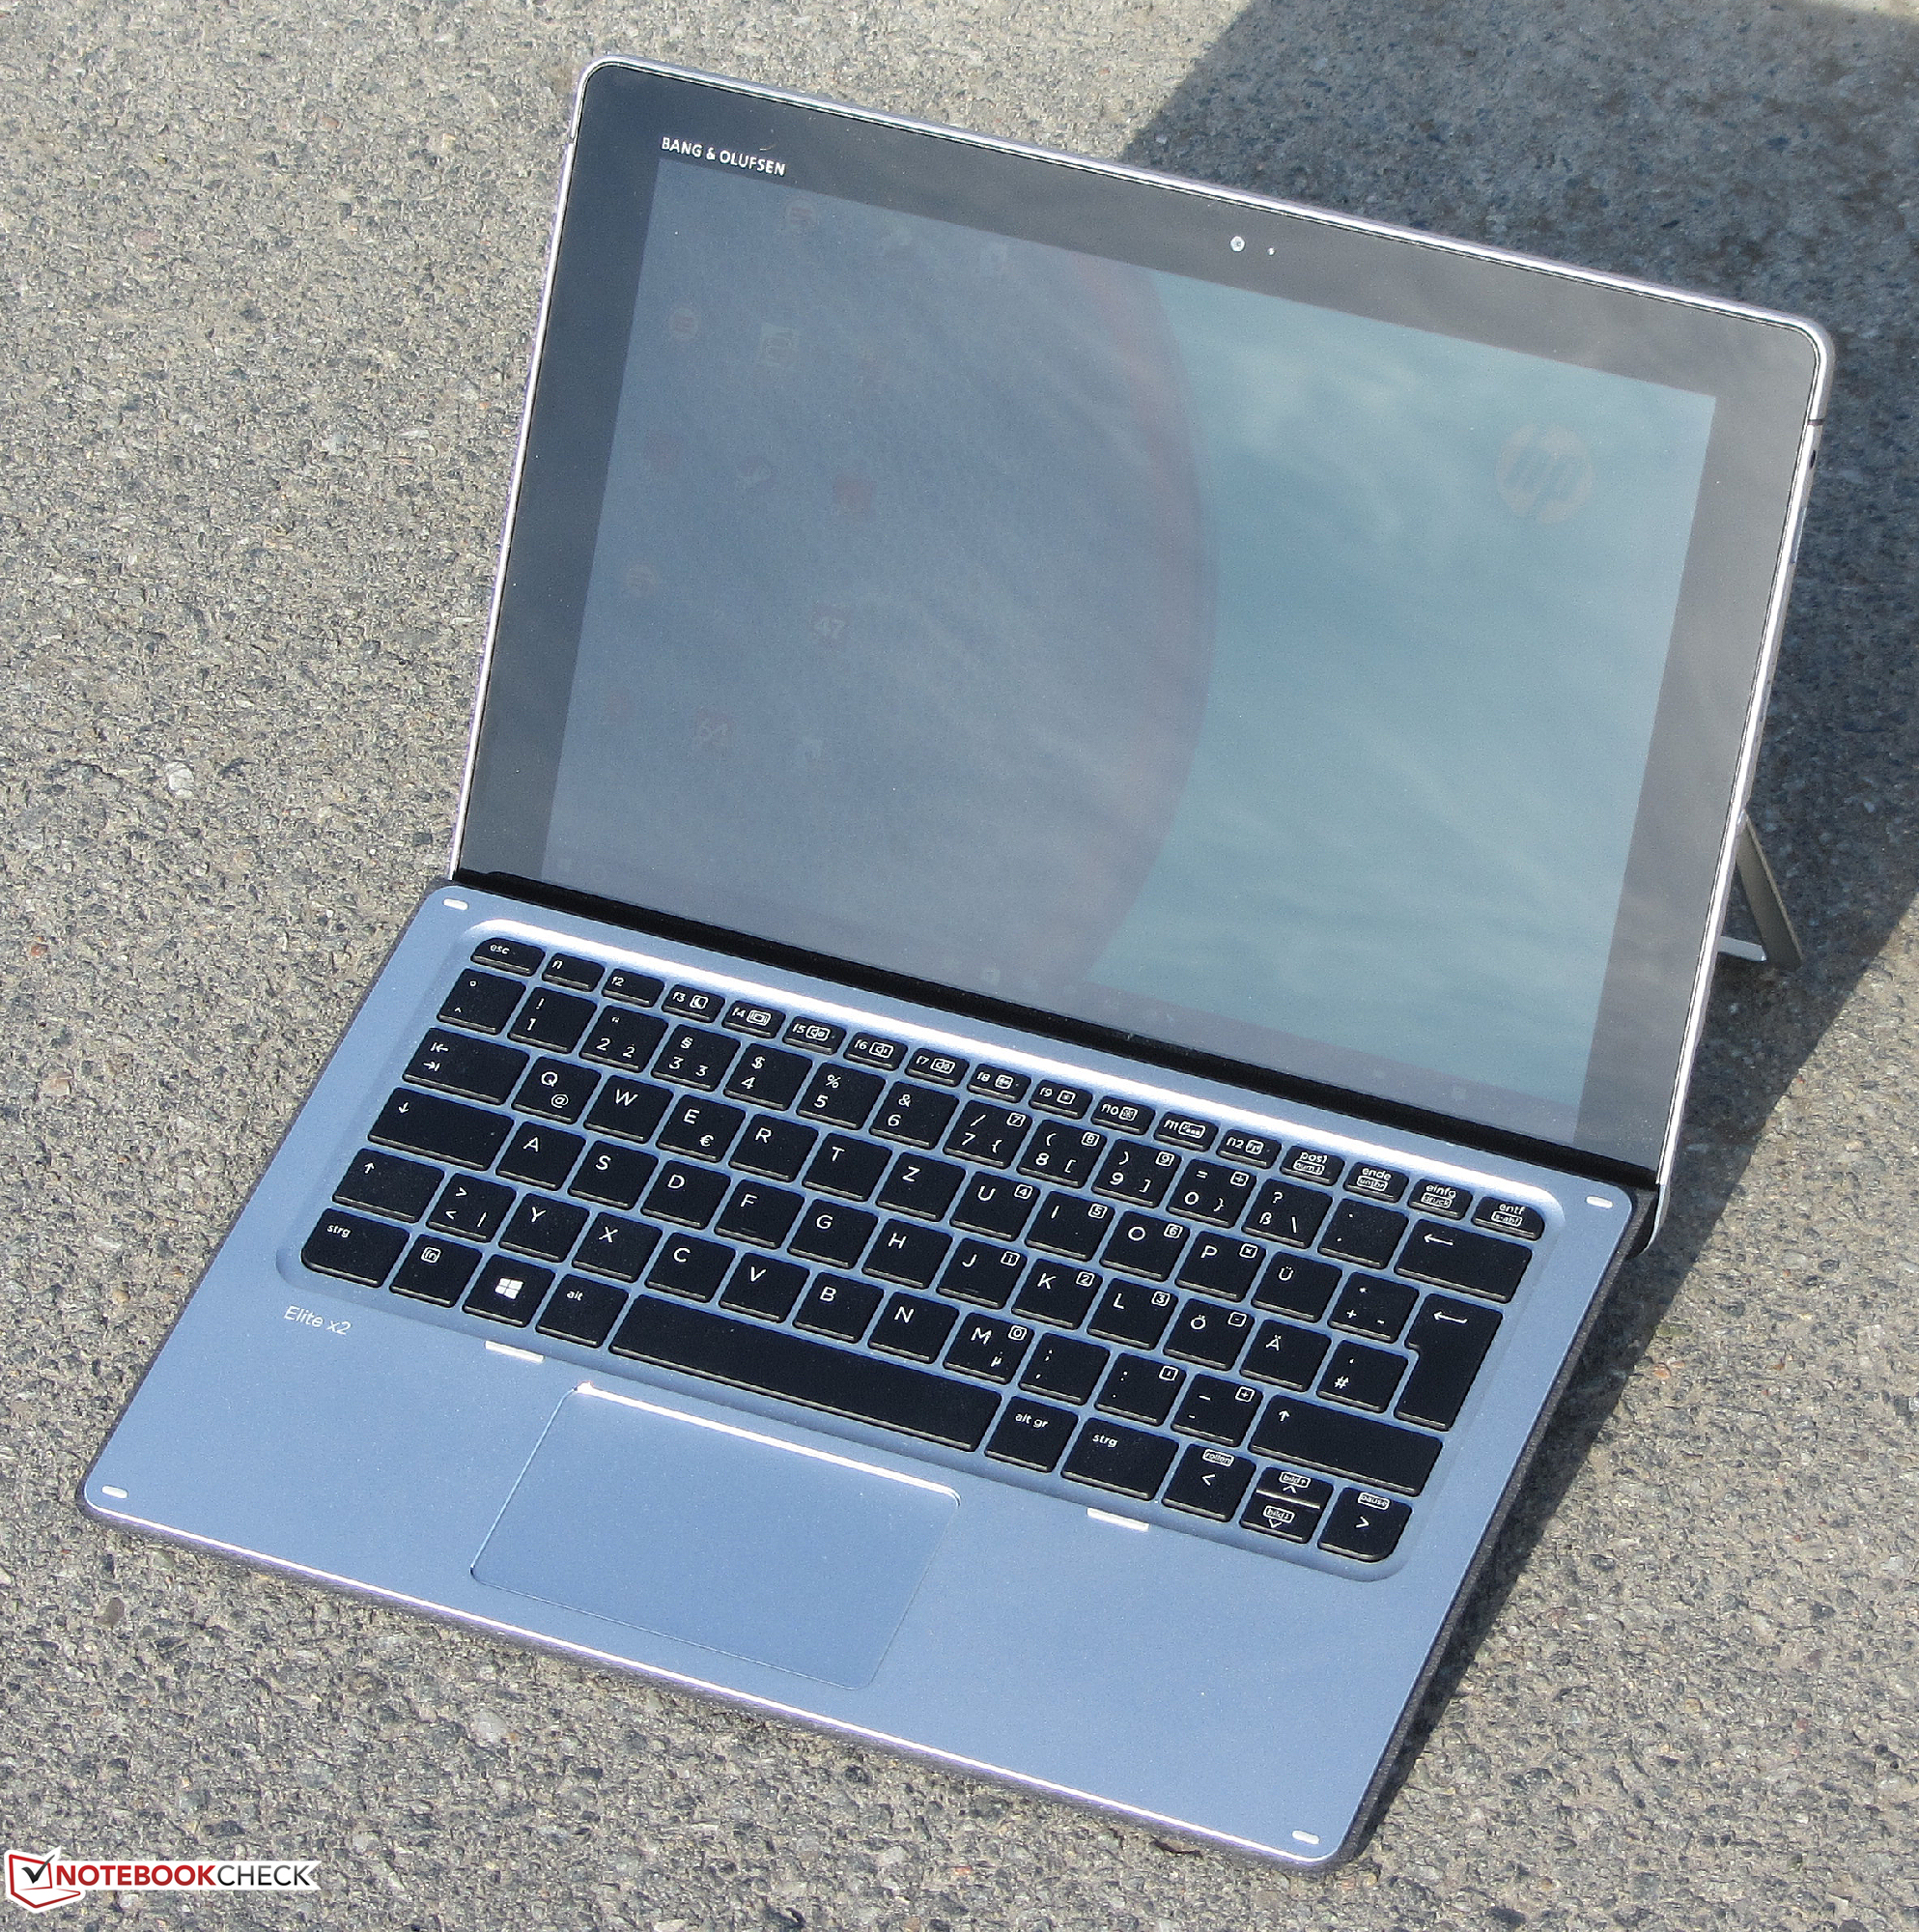
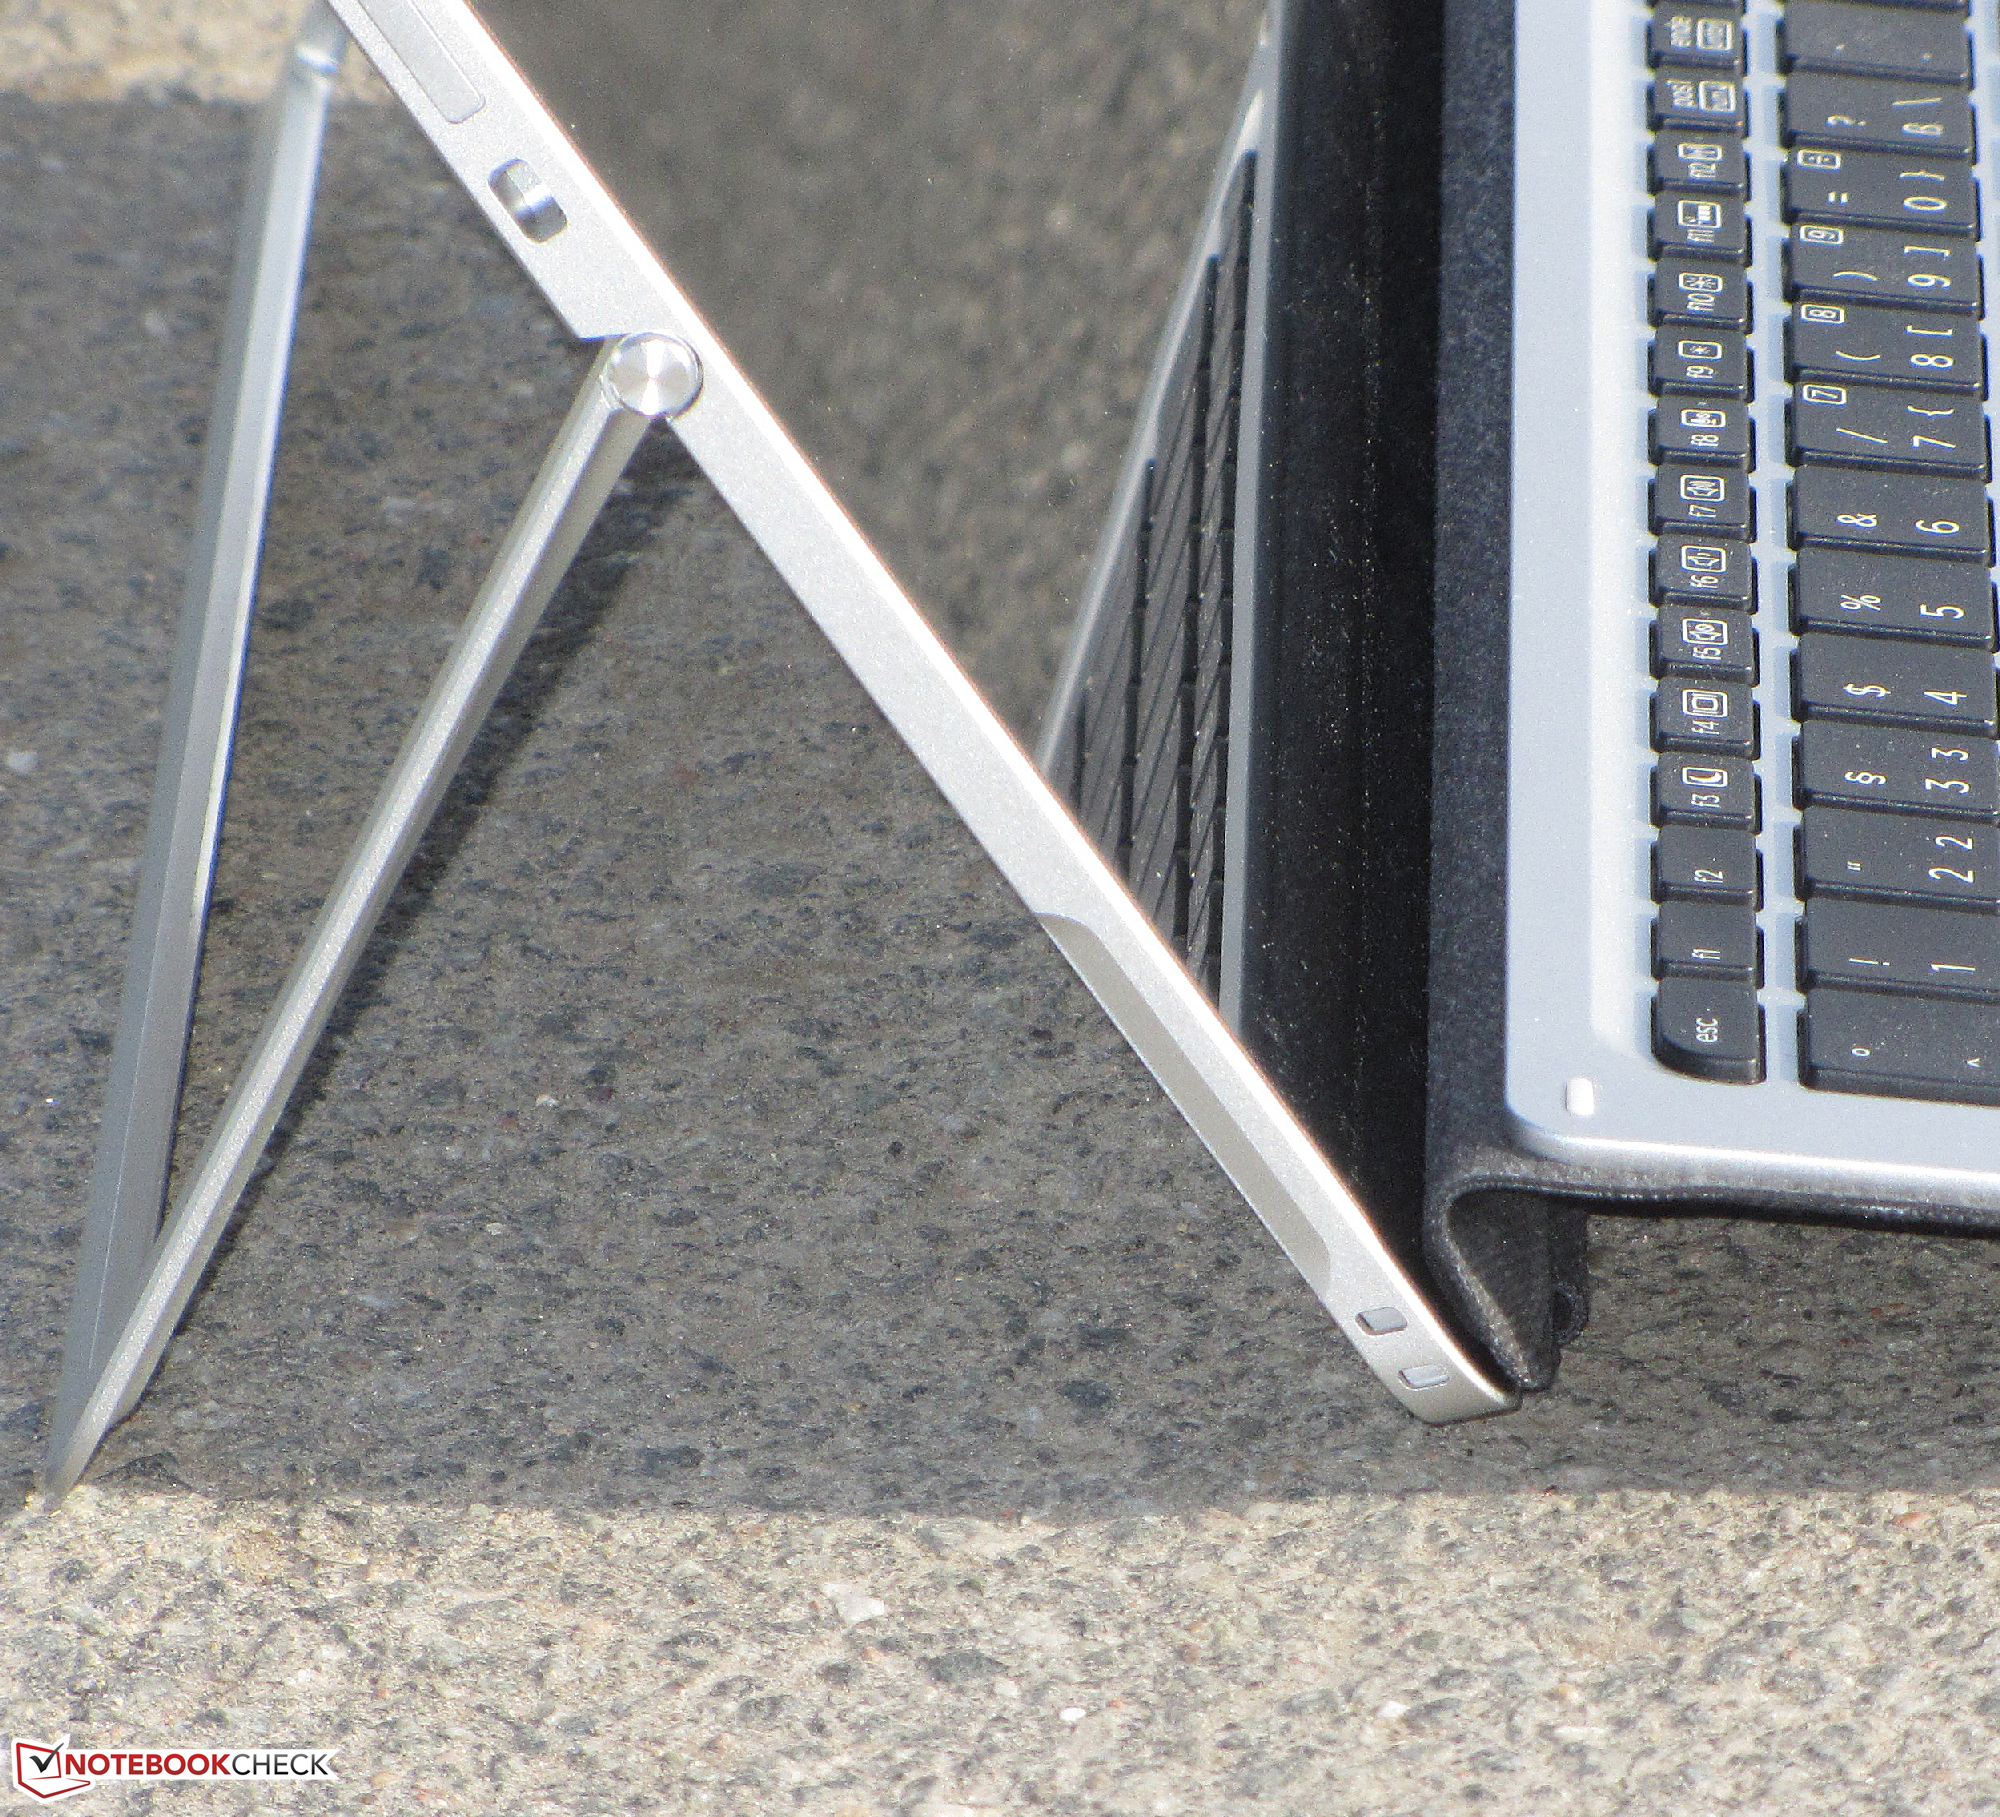
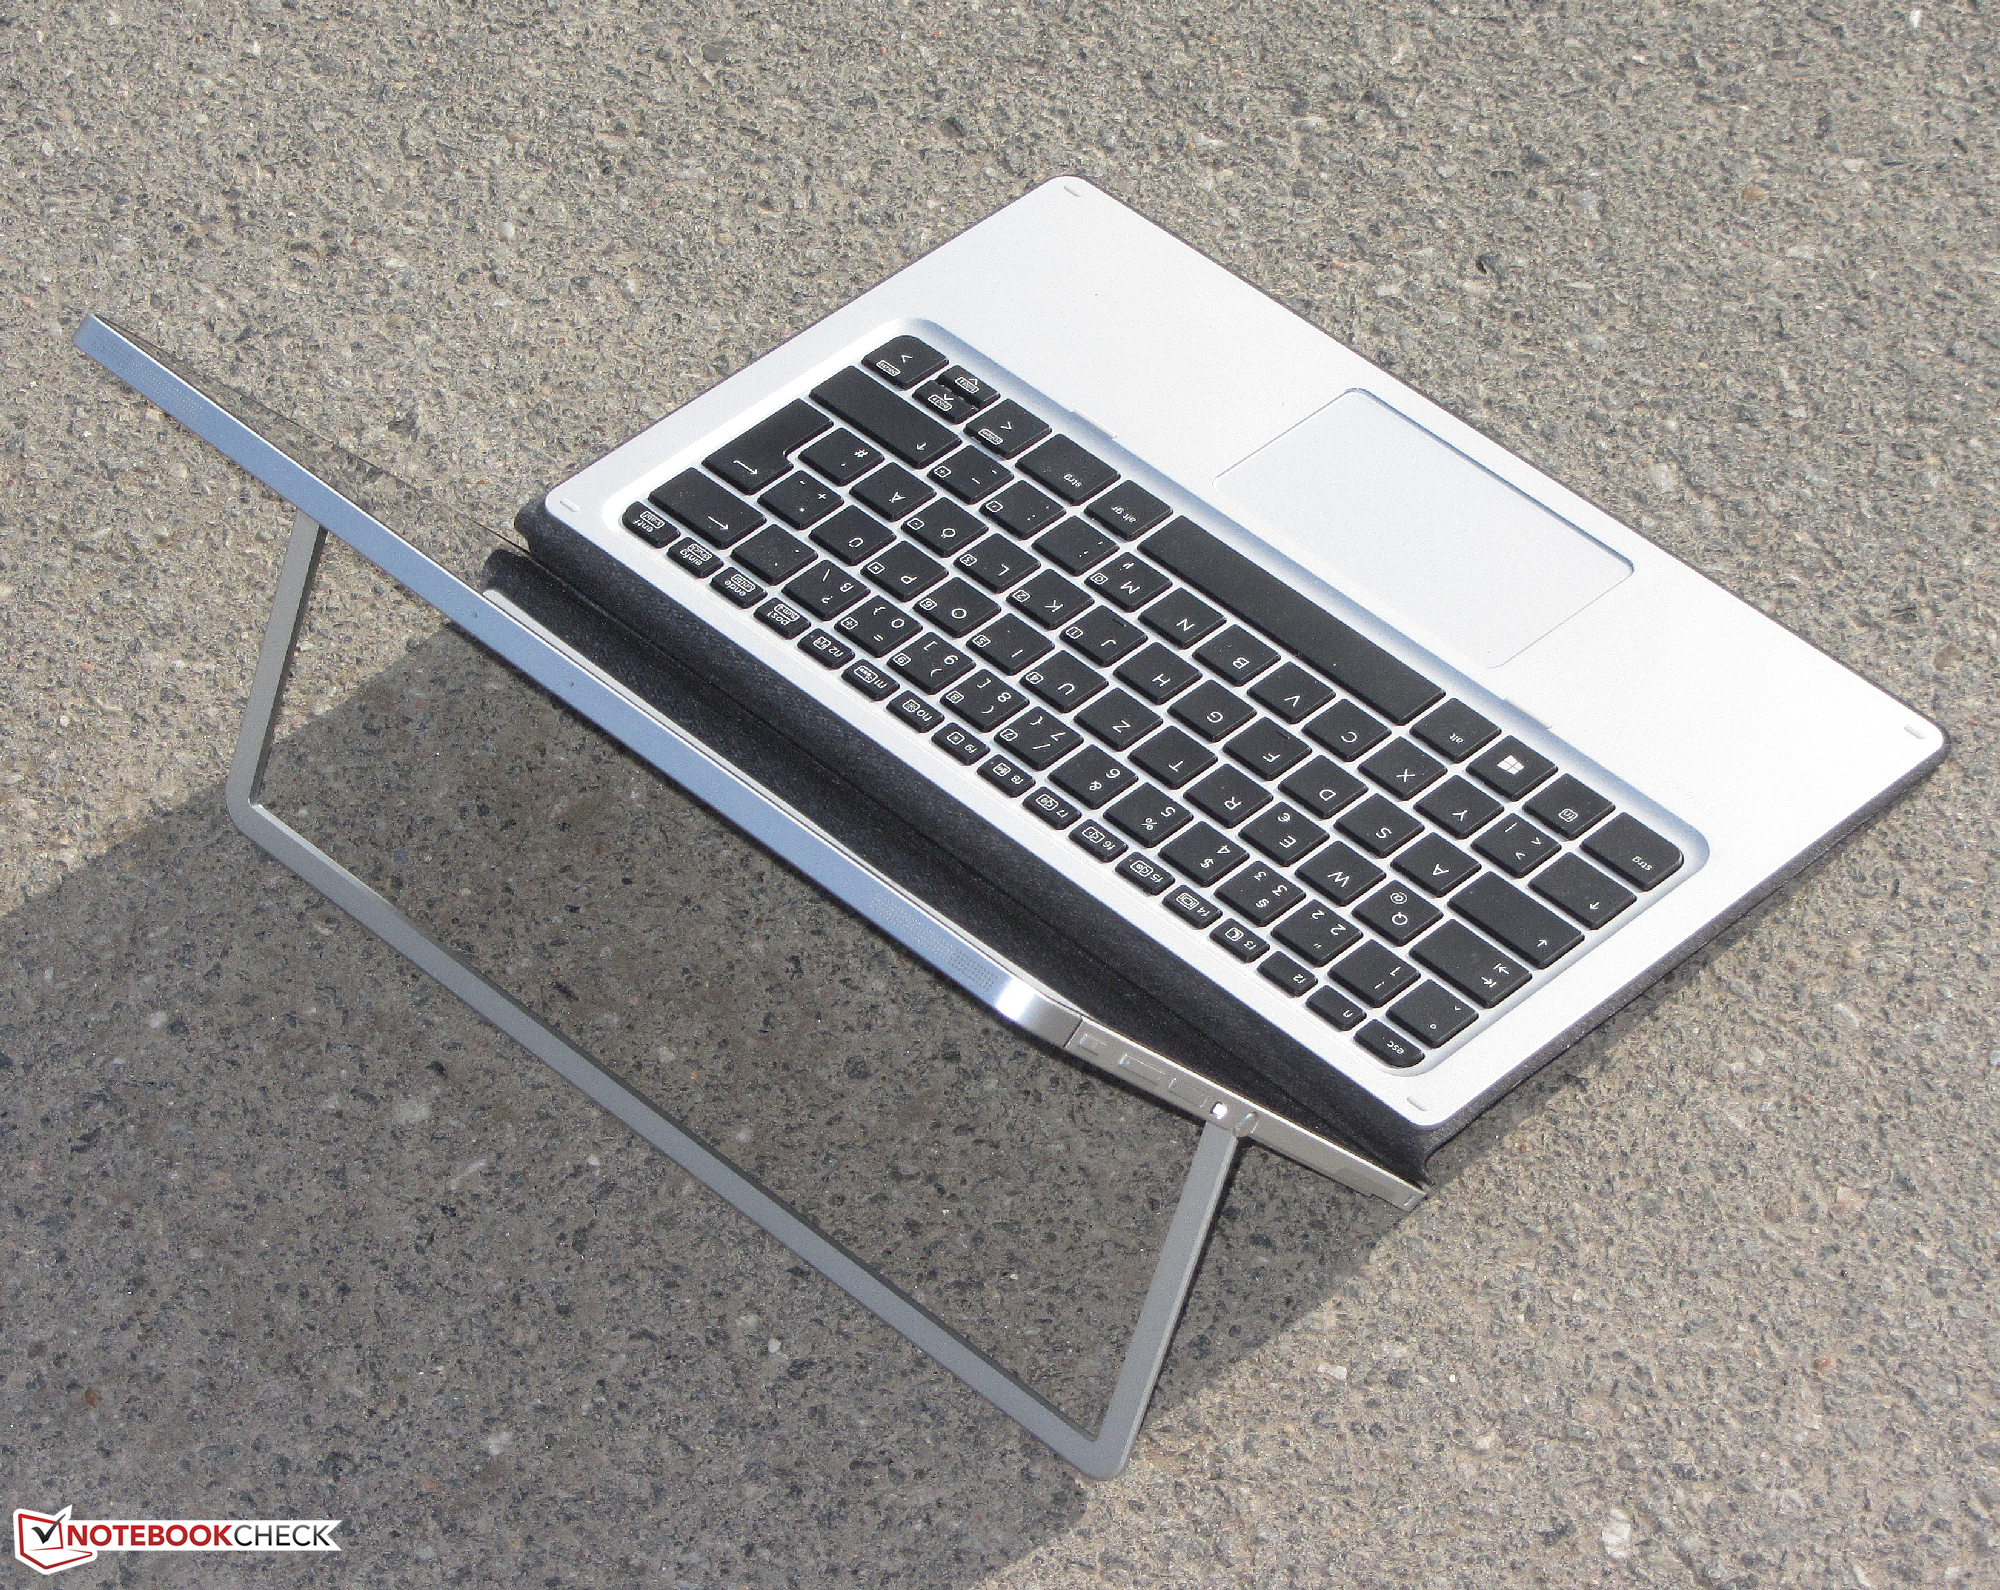
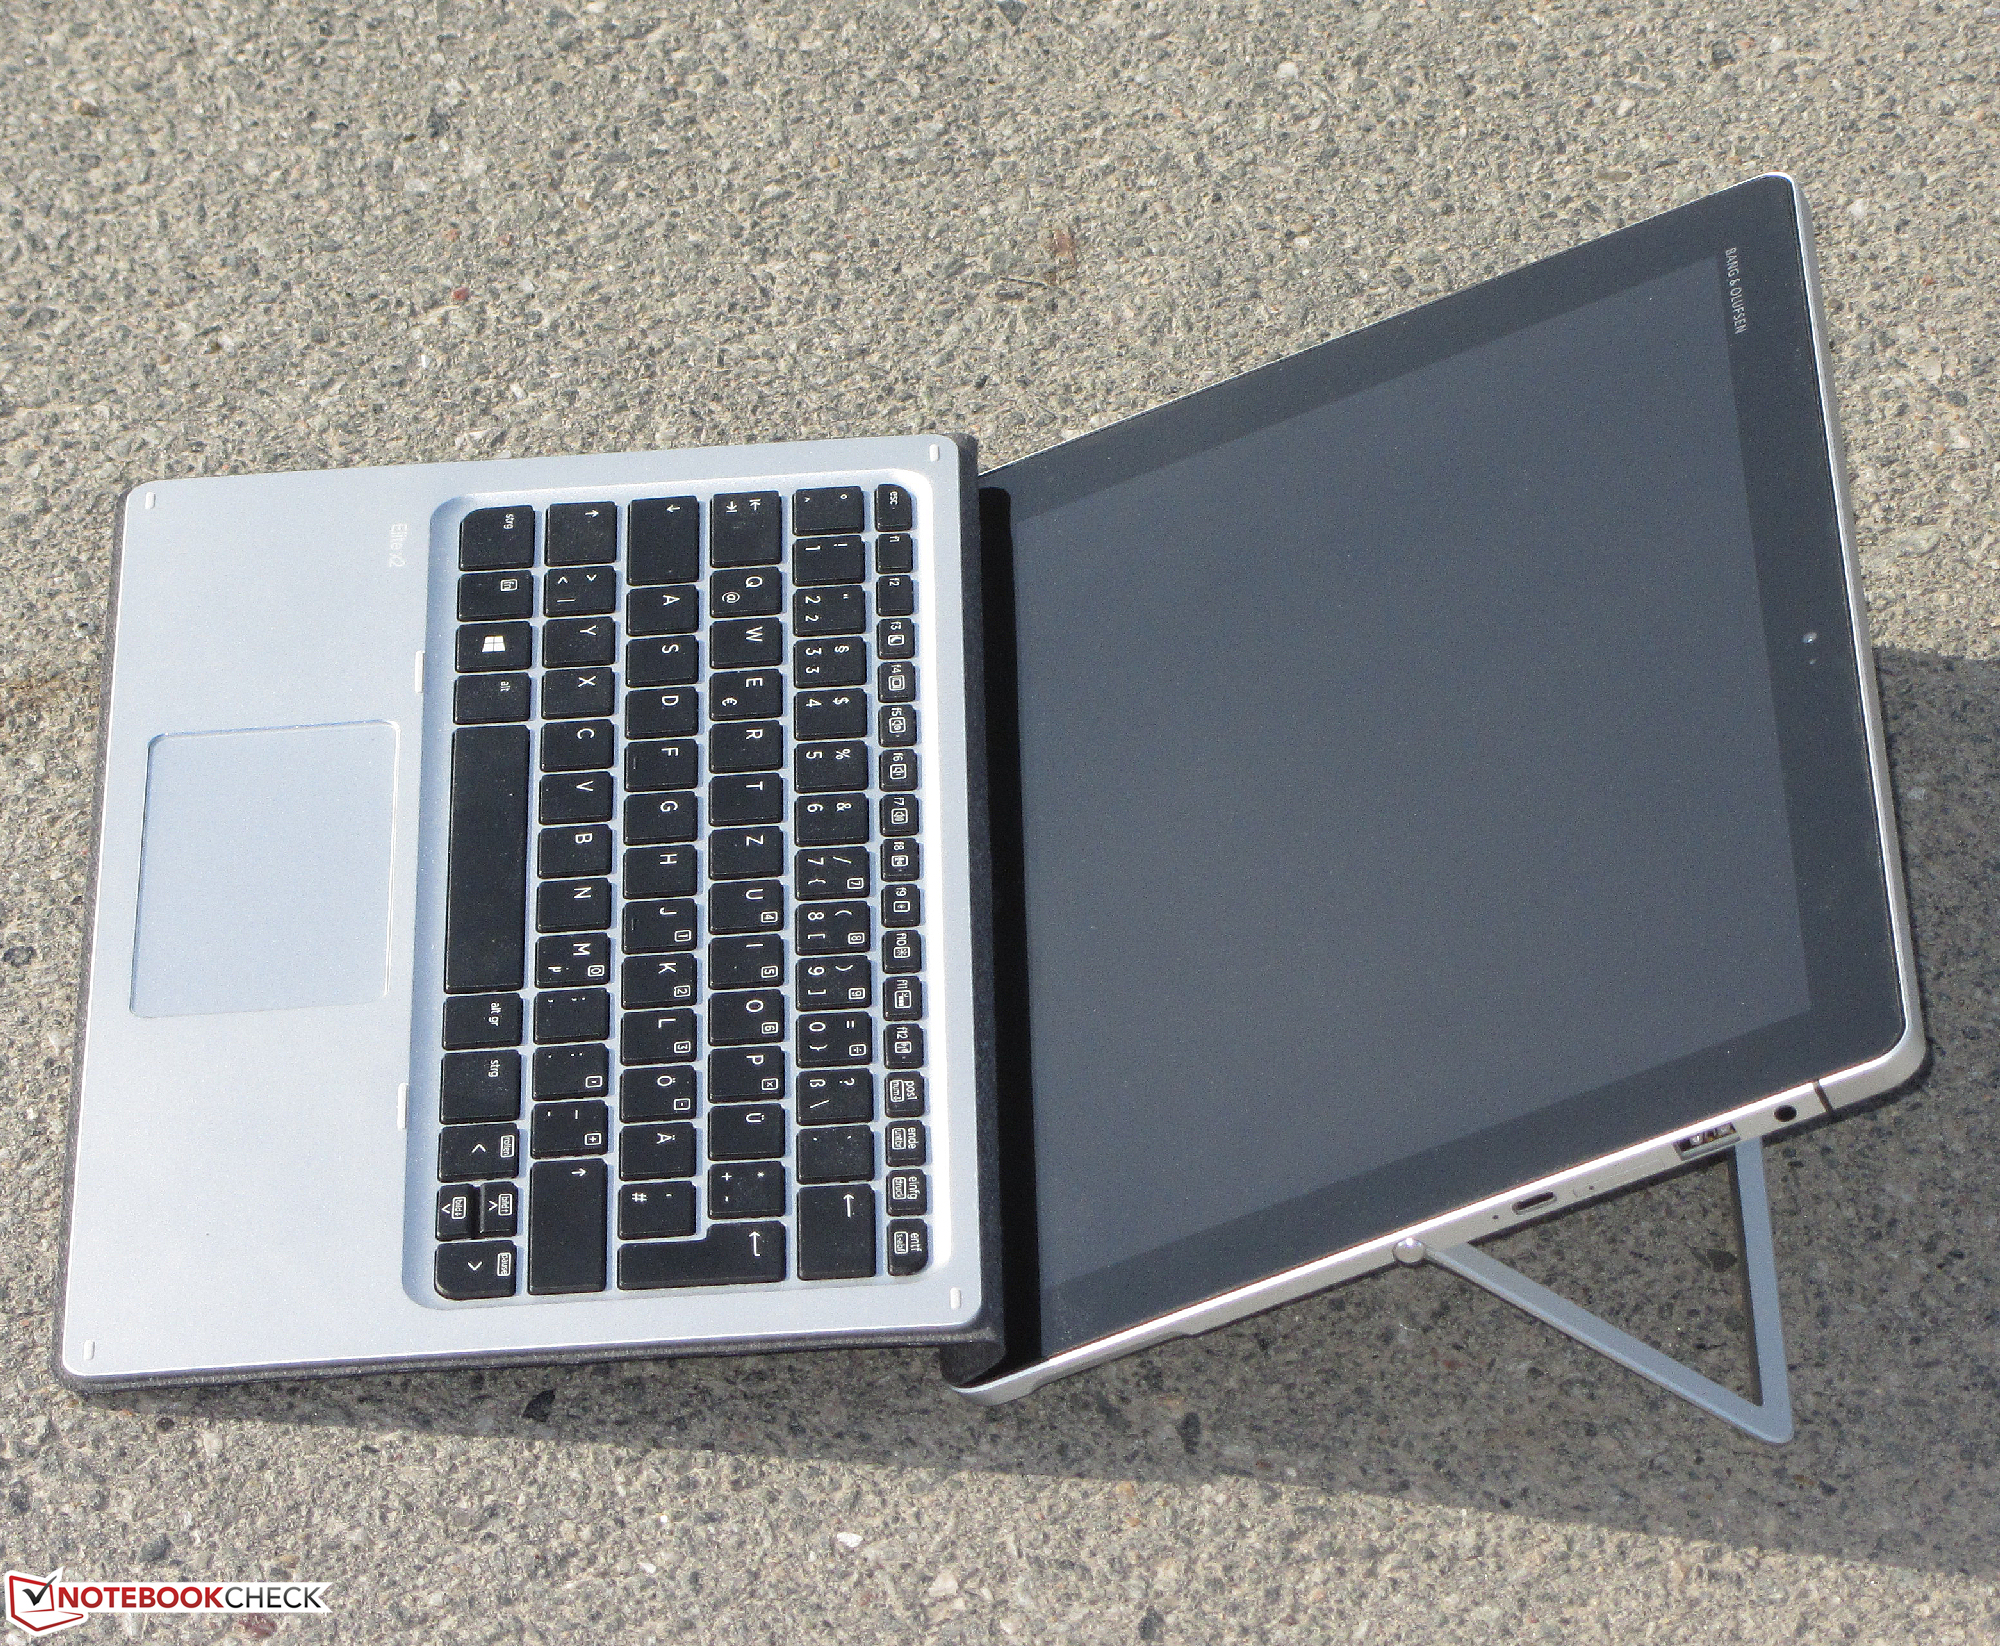
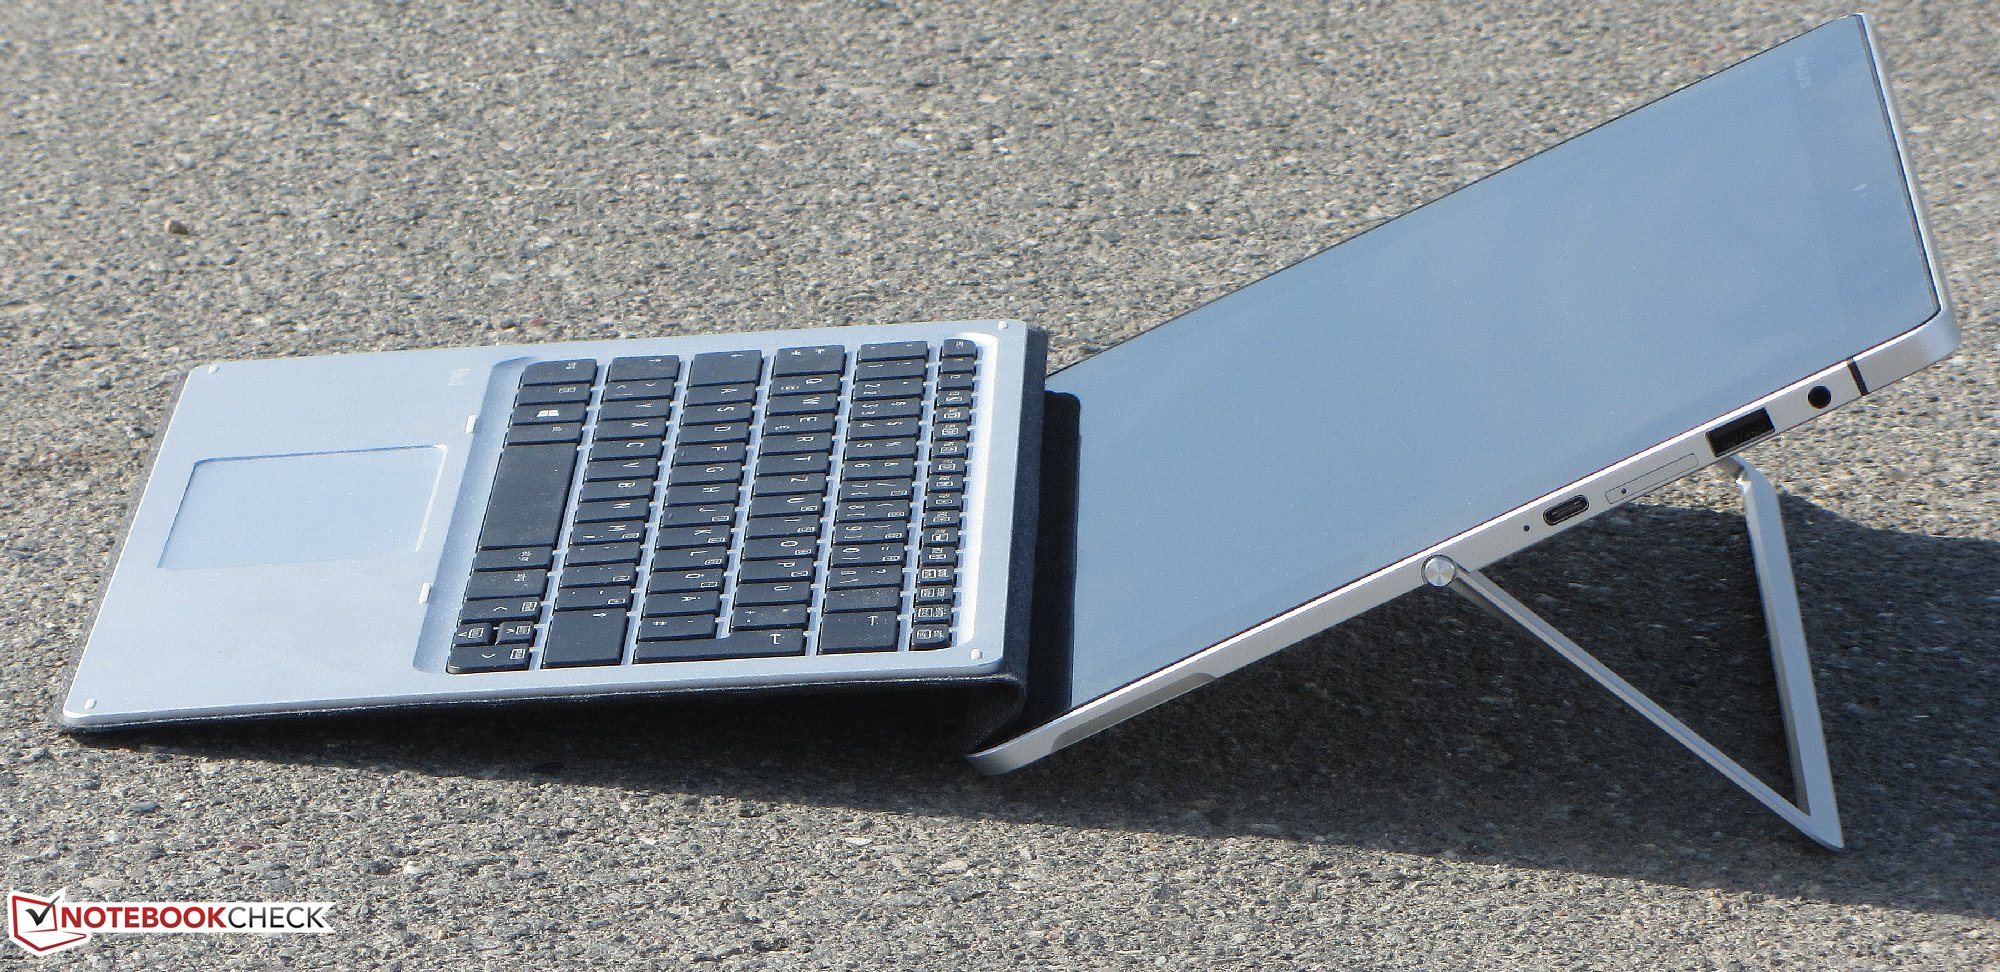
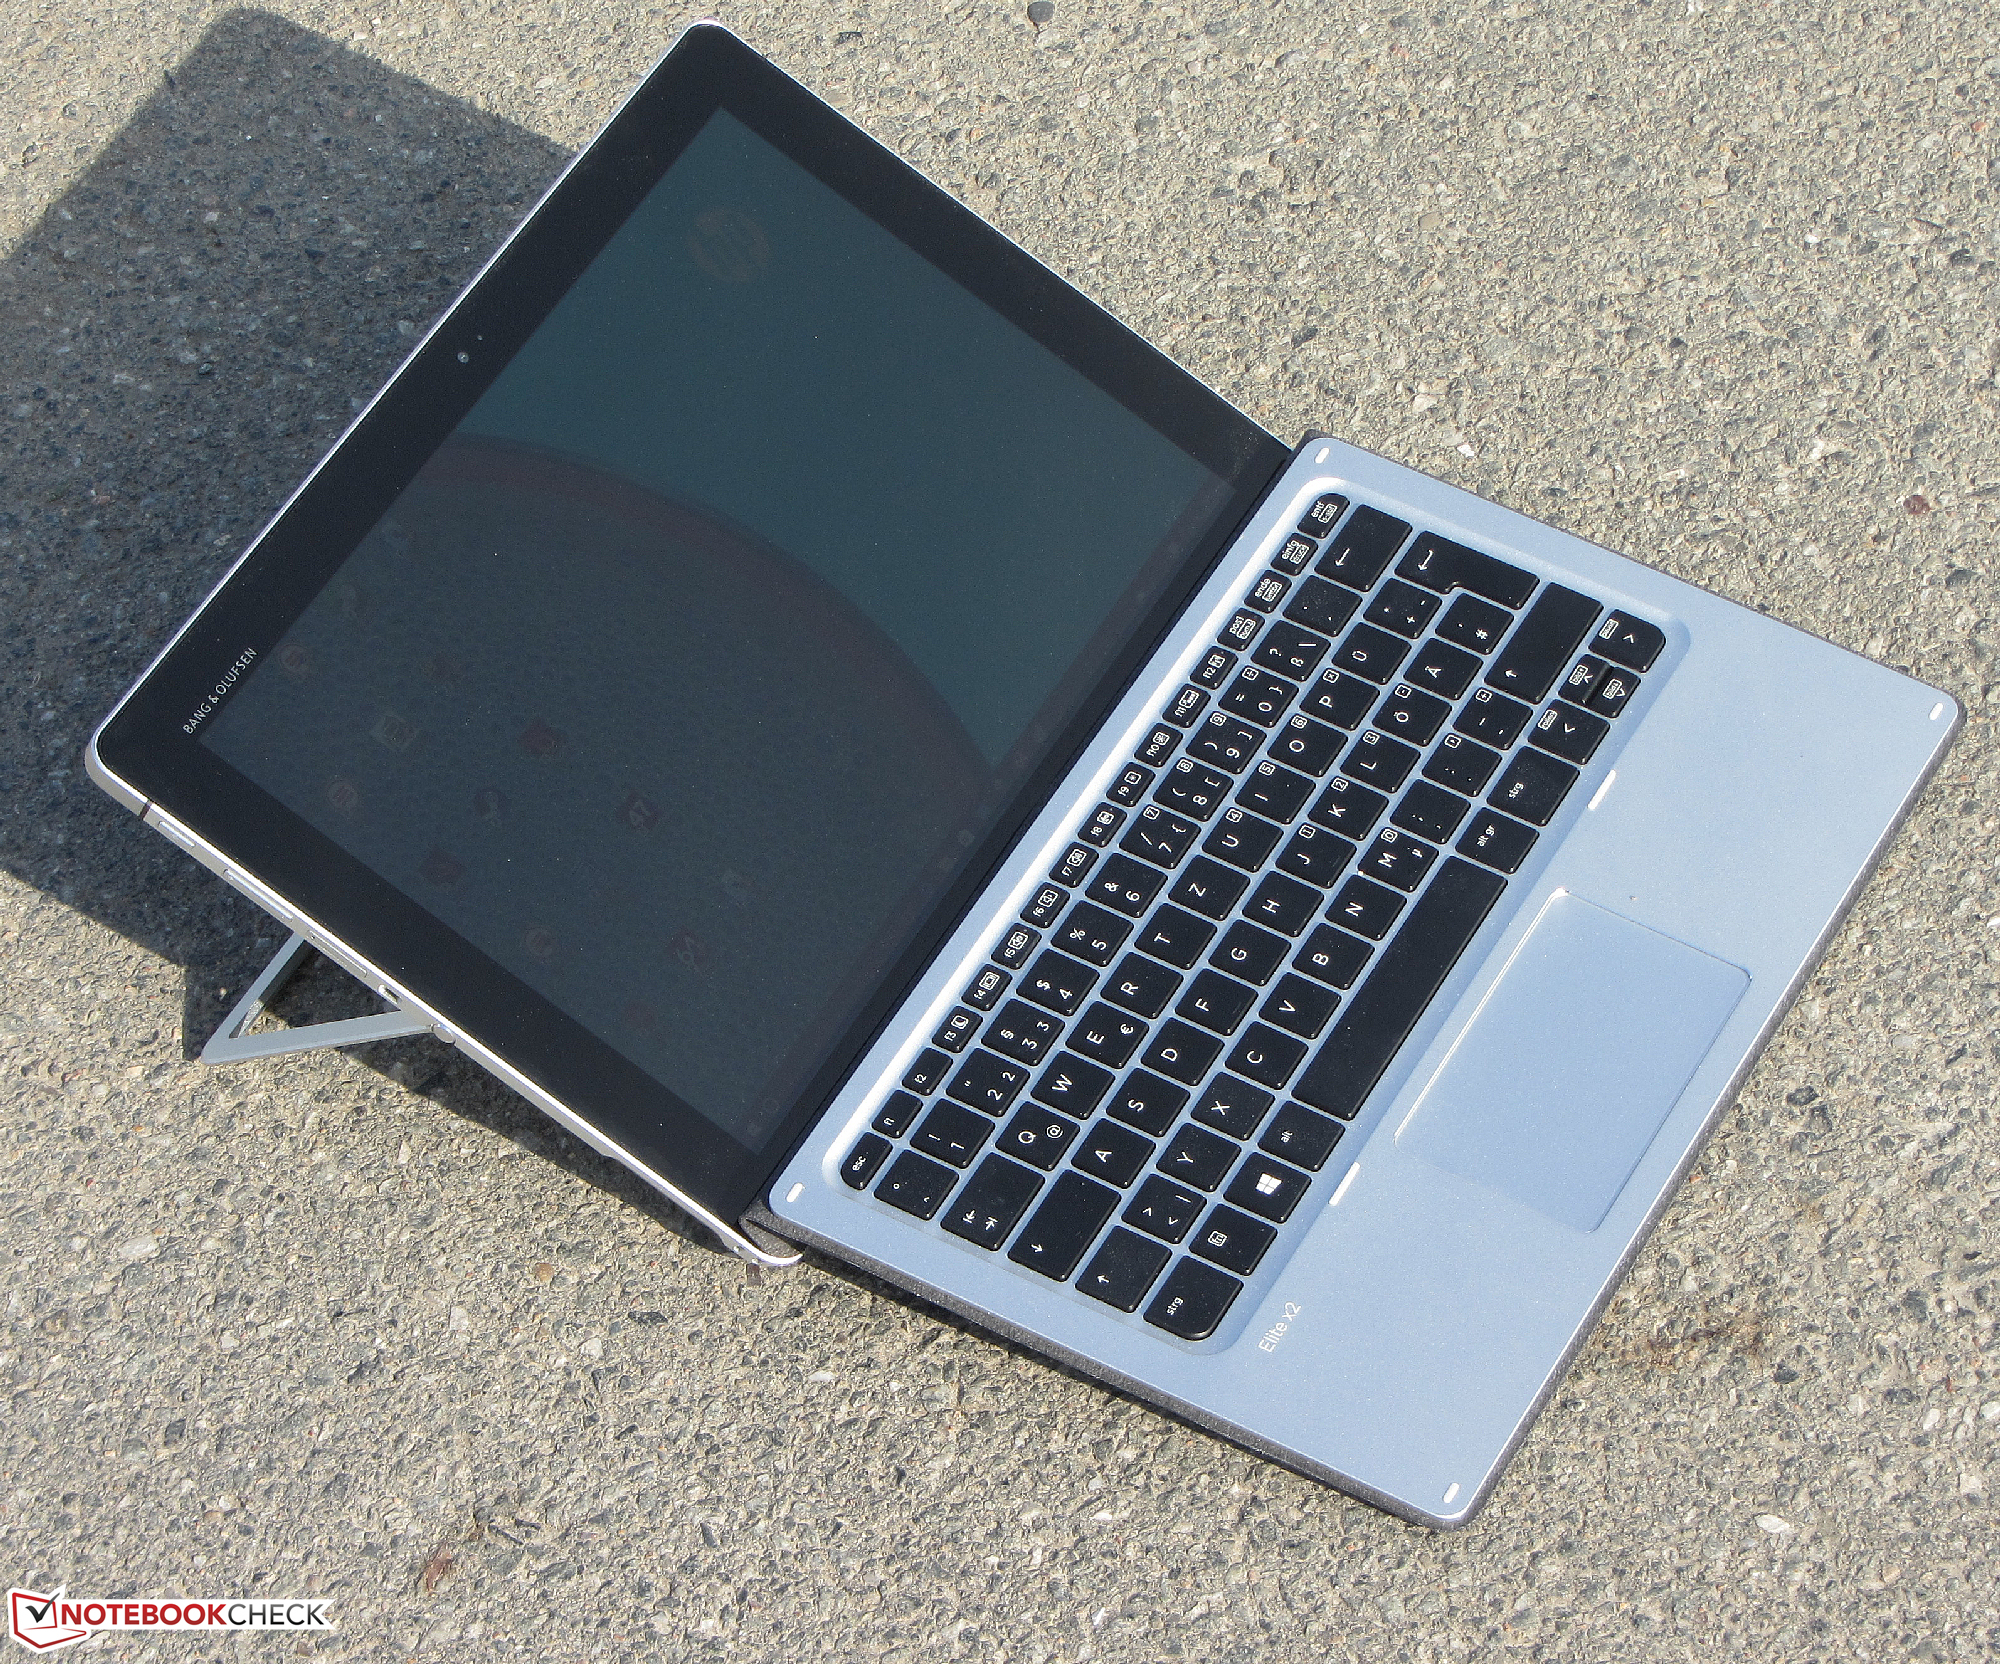
Le SSD en fait un système très réactif. Si nécessaire, ce SSD peut être remplacé pour un modèle plus ample, mais nous vous recommandons de laisser cette tâche à un professionnel. Le dock clavier est intéressant, il fonctionne très bien et est au niveau de la compétition. Un autre bon point à ce propos, le dock clavier dispose d'un rétro-éclairage, ce qui manque à l'IdeaPad Miix 700. L'autonomie de la batterie est tout à fait correcte. L'écran pourrait être meilleur, la dalle n'est pas particulièrement mauvaise mais vu le prix, nous nous attendons à un peu plus en termes de luminosité et de contrastes.
Le nom Elite x2 1012 G1 indique bien que l'appareil est destiné à une certaine clientèle : les professionnels. Un peu coûteux, il conviendra néanmoins très bien au grand public.
Microsoft Surface 4 Pro, Lenovo IdeaPad Miix 700, HP Elite x2 1012 G1 ou Dell XPS 12 9250, quel convertible choisir ? Le Dell est directement hors course du fait de sa médiocre autonomie. Pour les trois autres, il s'agit plus d'une question de goût, de besoin et de prix. Tous trois s'en ont très bien sortis dans nos tests. L'IdeaPad Miix 700 est le moins coûteux mais se destine plus au grand public voire à une utilisation purement sédentaire à la maison. Avec son clavier et son stylet, le Miix 700 annonce un ticket d'entrée de 950 euros. La Surface Pro 4 a l'écran le plus lumineux, beaucoup de contrastes et la résolution la plus forte. Le HP Elite x2 1012 G1 a les meilleures performances processeur et intègre tout comme le Lenovo un modem LTE. Un autre choix possible serait la Samsung Galaxy Tab PRO S...
Pour plus de détails, vous trouverez la version complète (en anglais) de ce test ici.
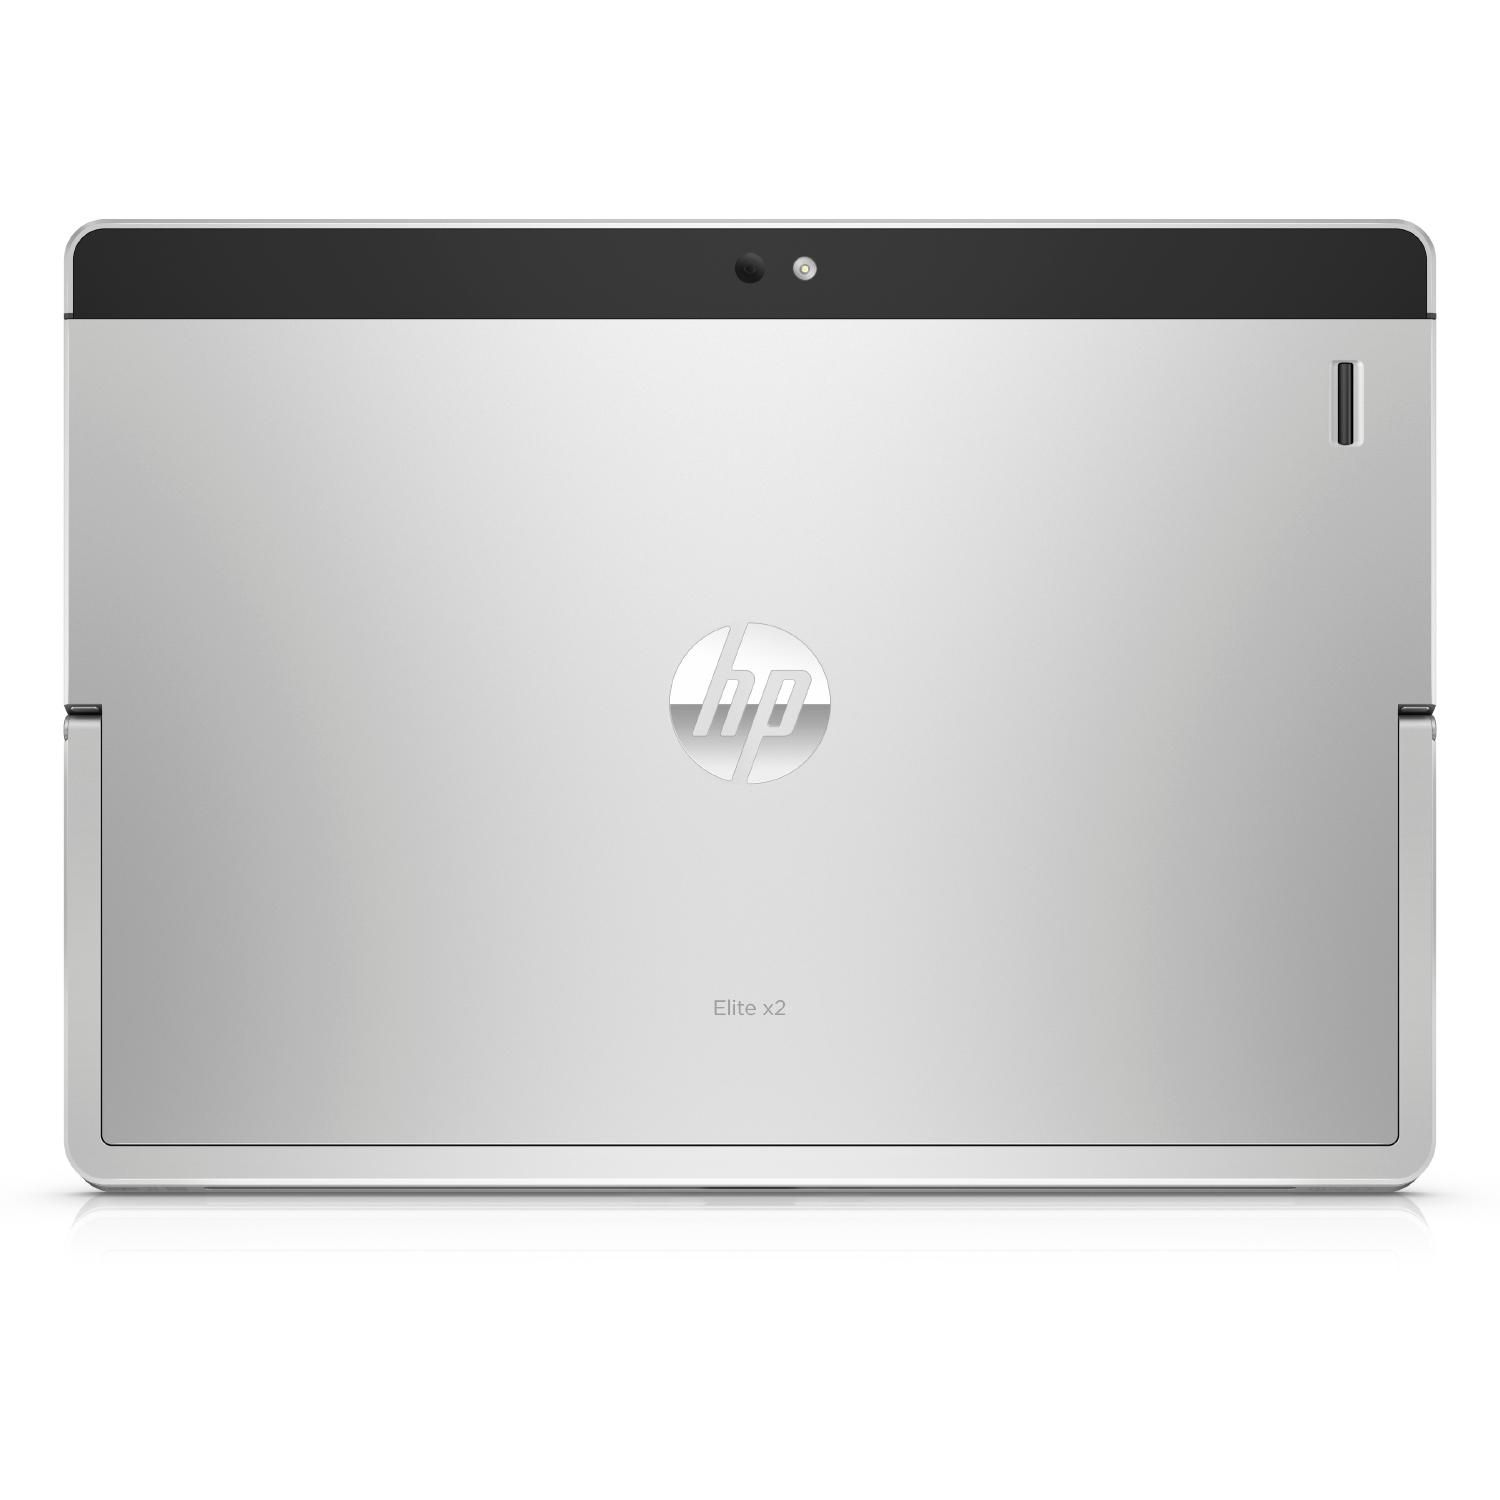
HP Elite x2 1012 G1
-
04/19/2016 v5.1(old)
Sascha Mölck
Pricecompare
