 Deutsch
 English
 Español
 Français
 Italiano
 Nederlands
 Polski
 Português
 Русский
 Türkçe
 Svenska
 Chinese
 Magyar
Courte critique du PC portable Asus ASUSPRO Advanced B8430UA-FA0084E

| |||||||||||||||||||||||||
Homogénéité de la luminosité: 87 %
Valeur mesurée au centre, sur batterie: 213 cd/m²
Contraste: 525:1 (Valeurs des noirs: 0.4 cd/m²)
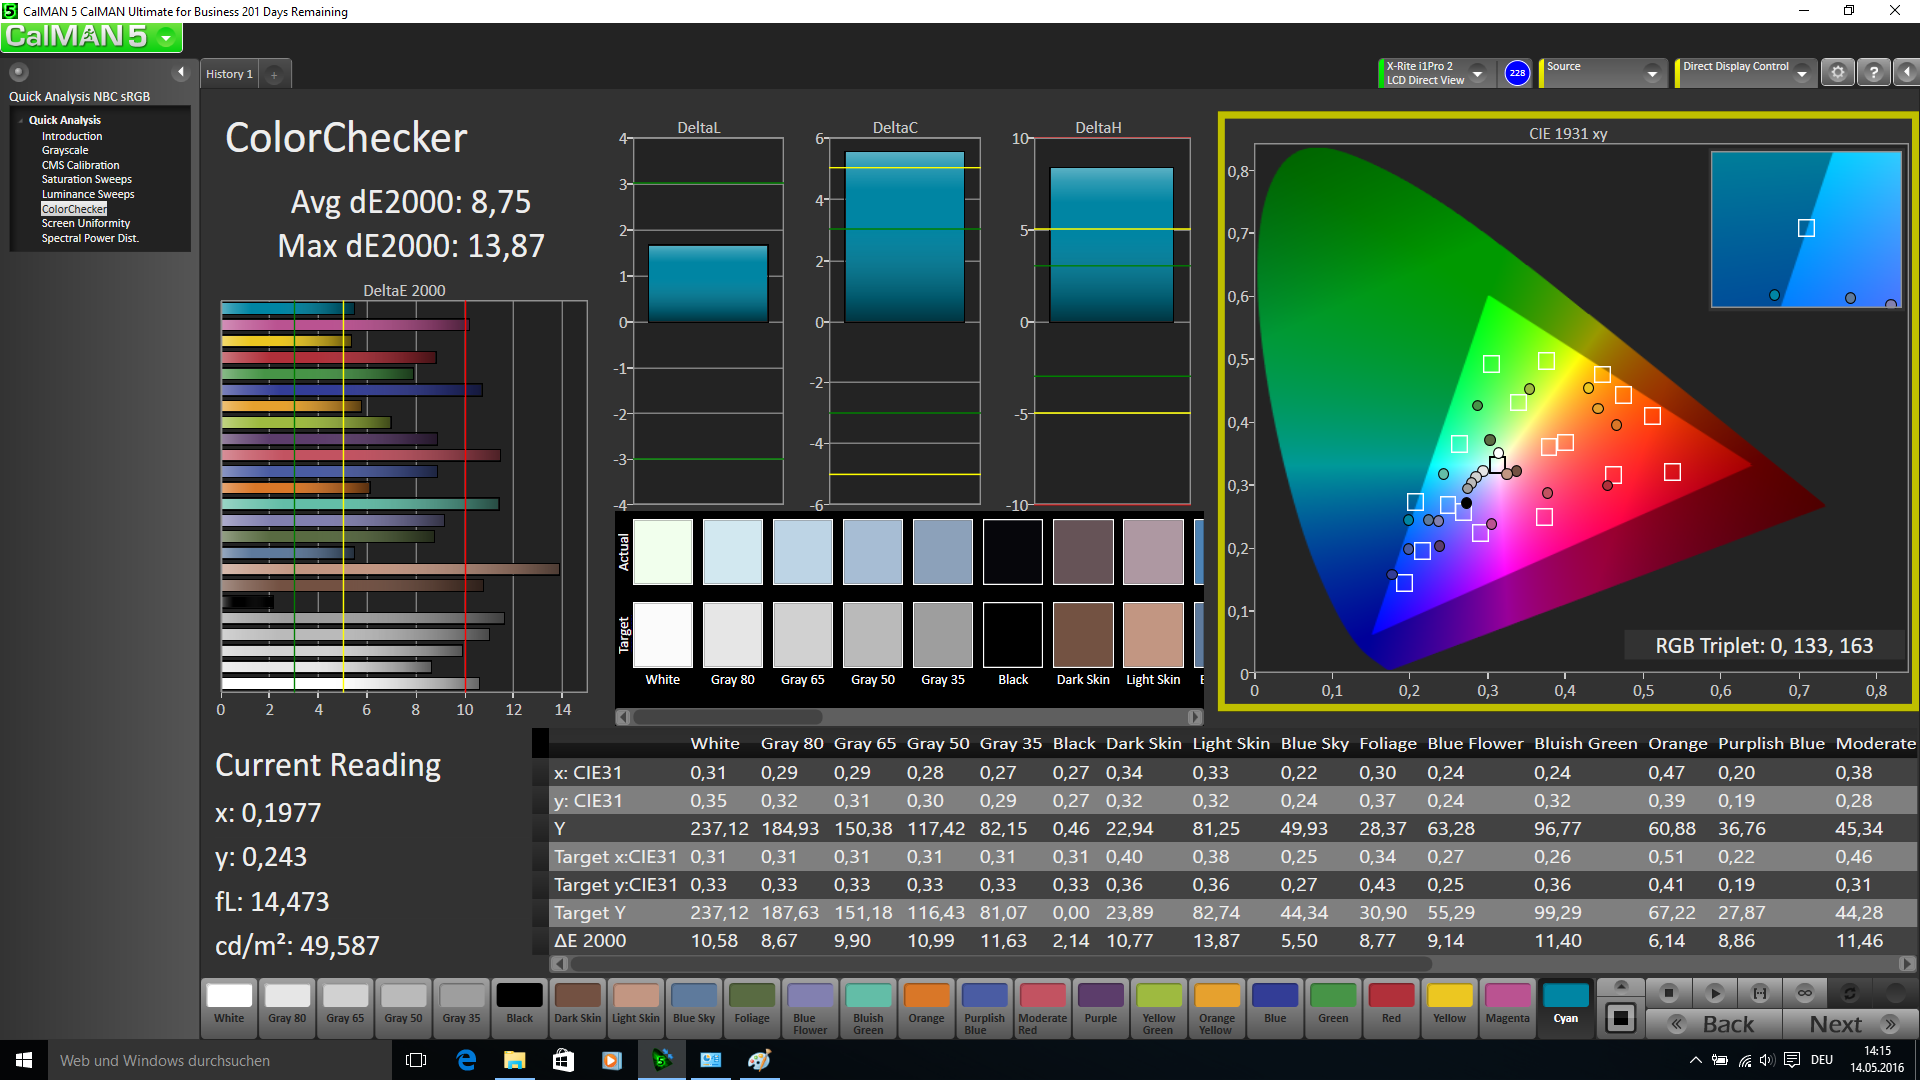
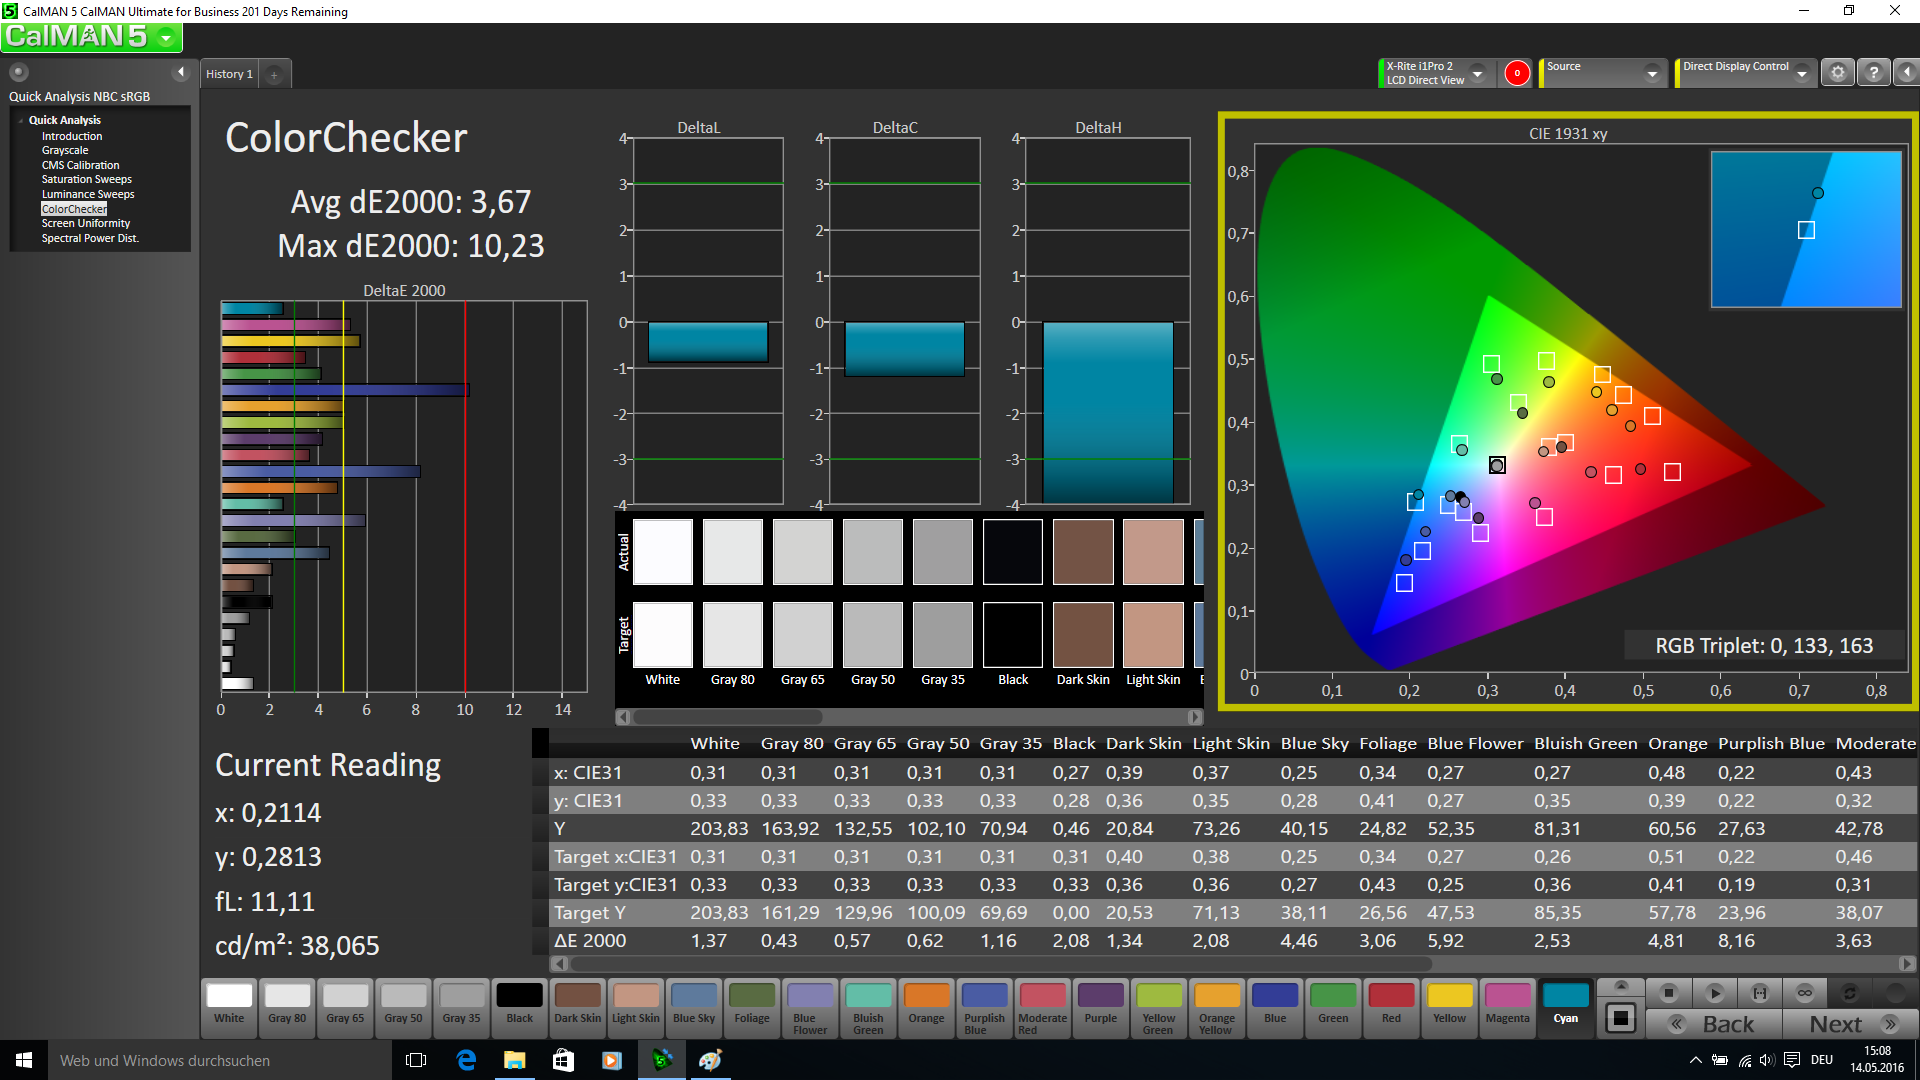
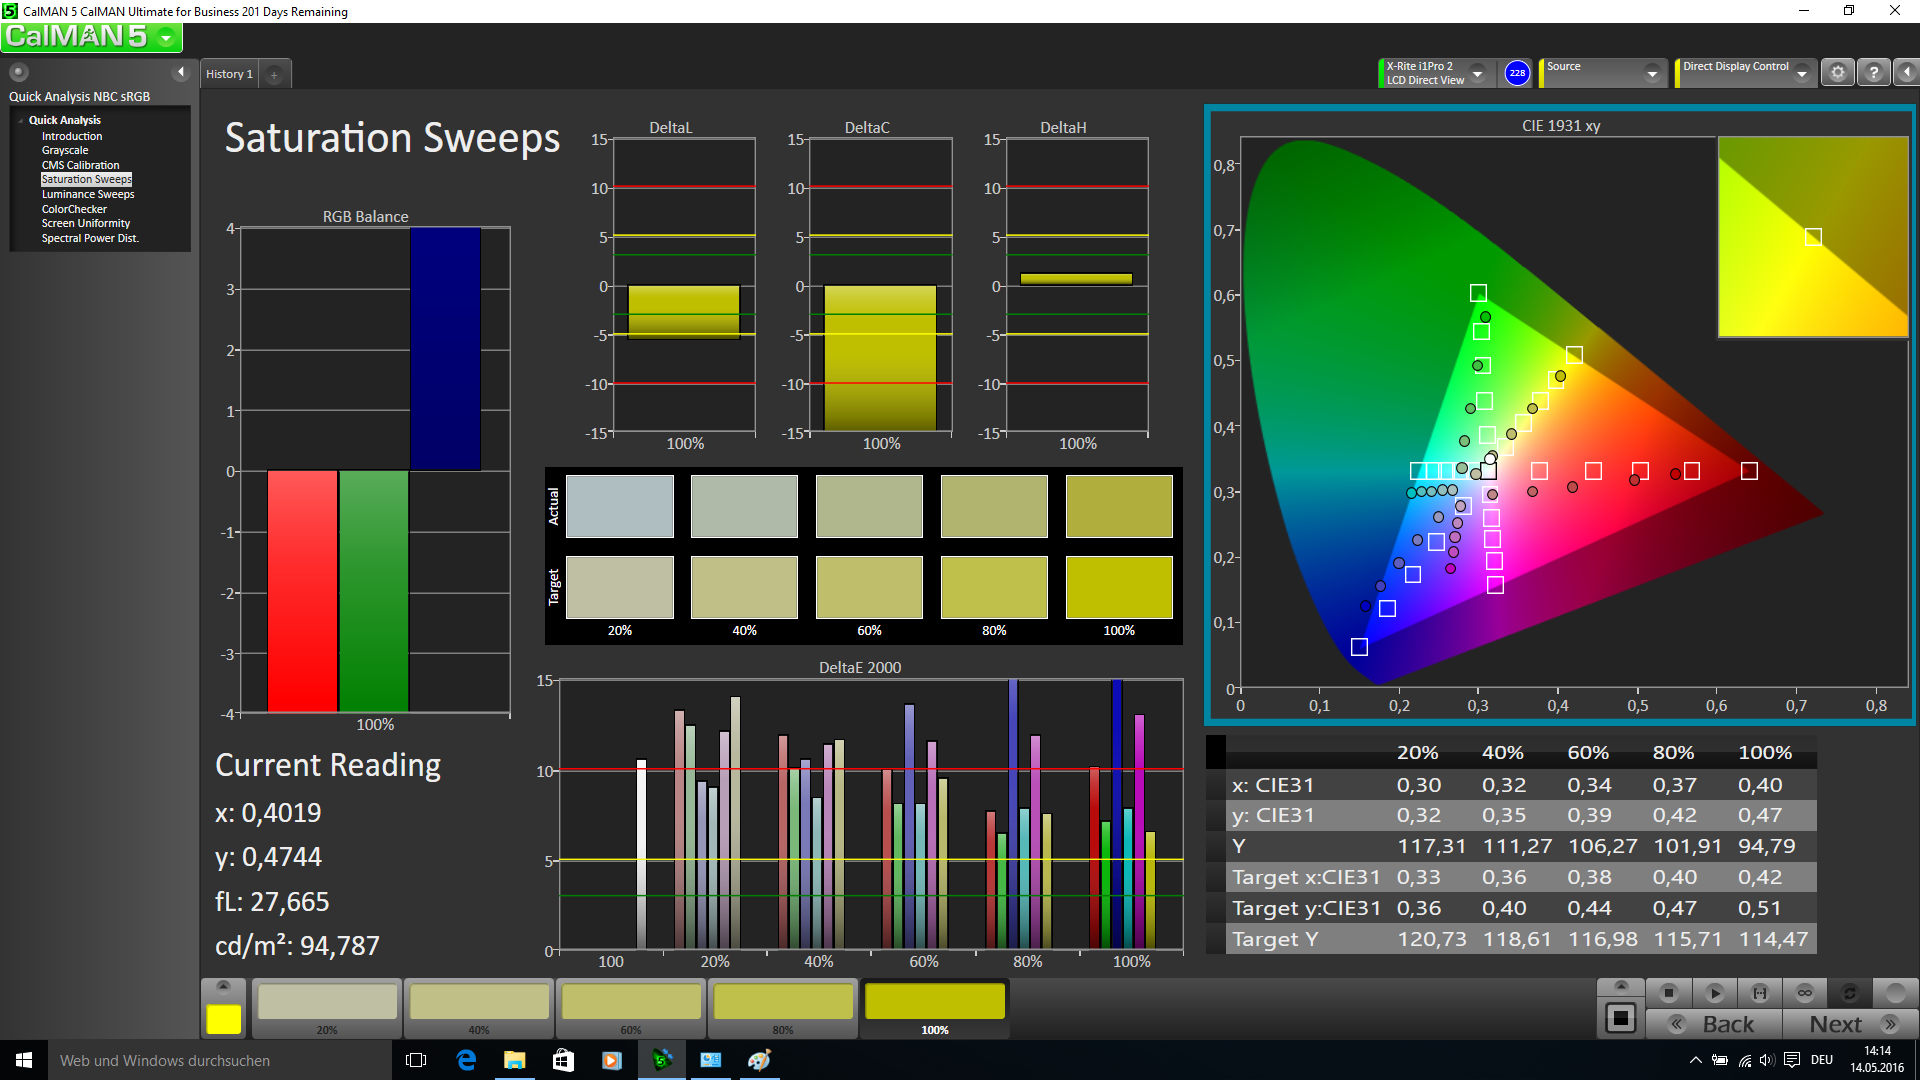
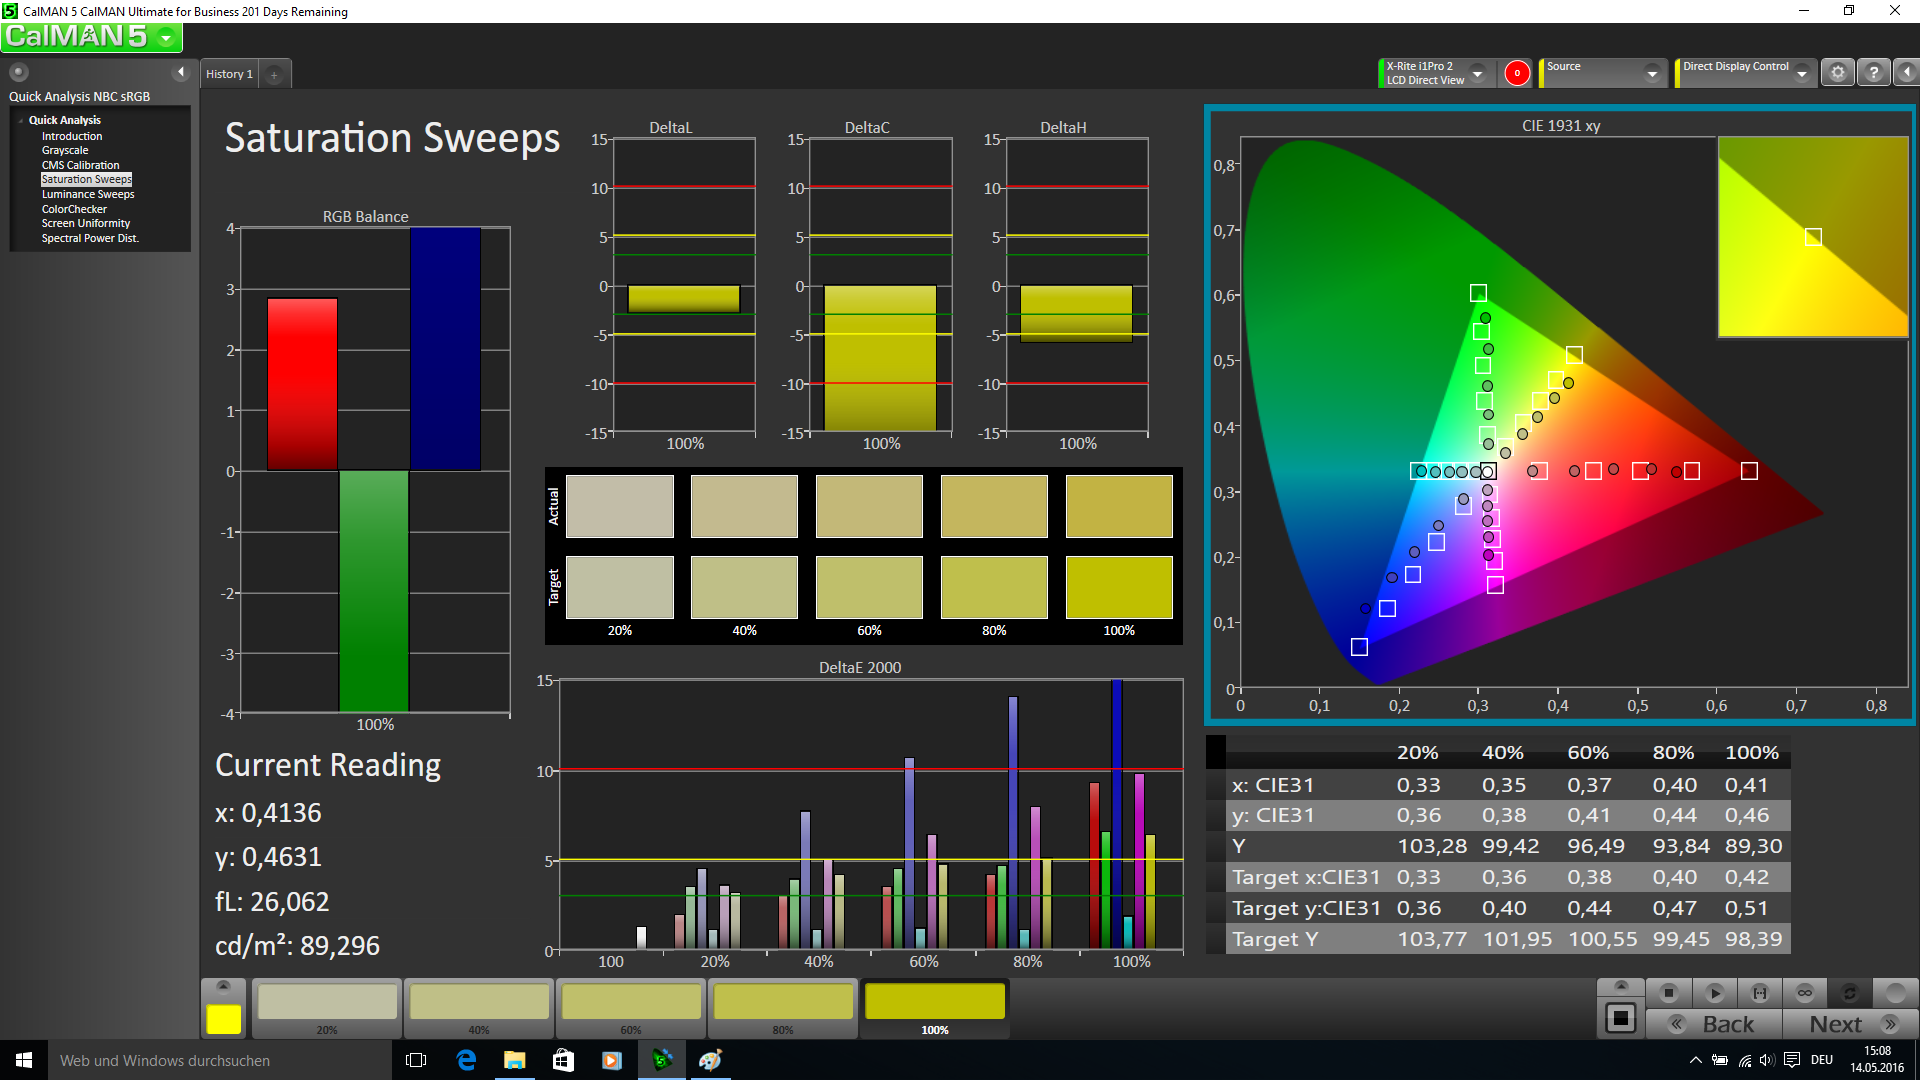
ΔE Color 8.75 | 0.5-29.43 Ø5
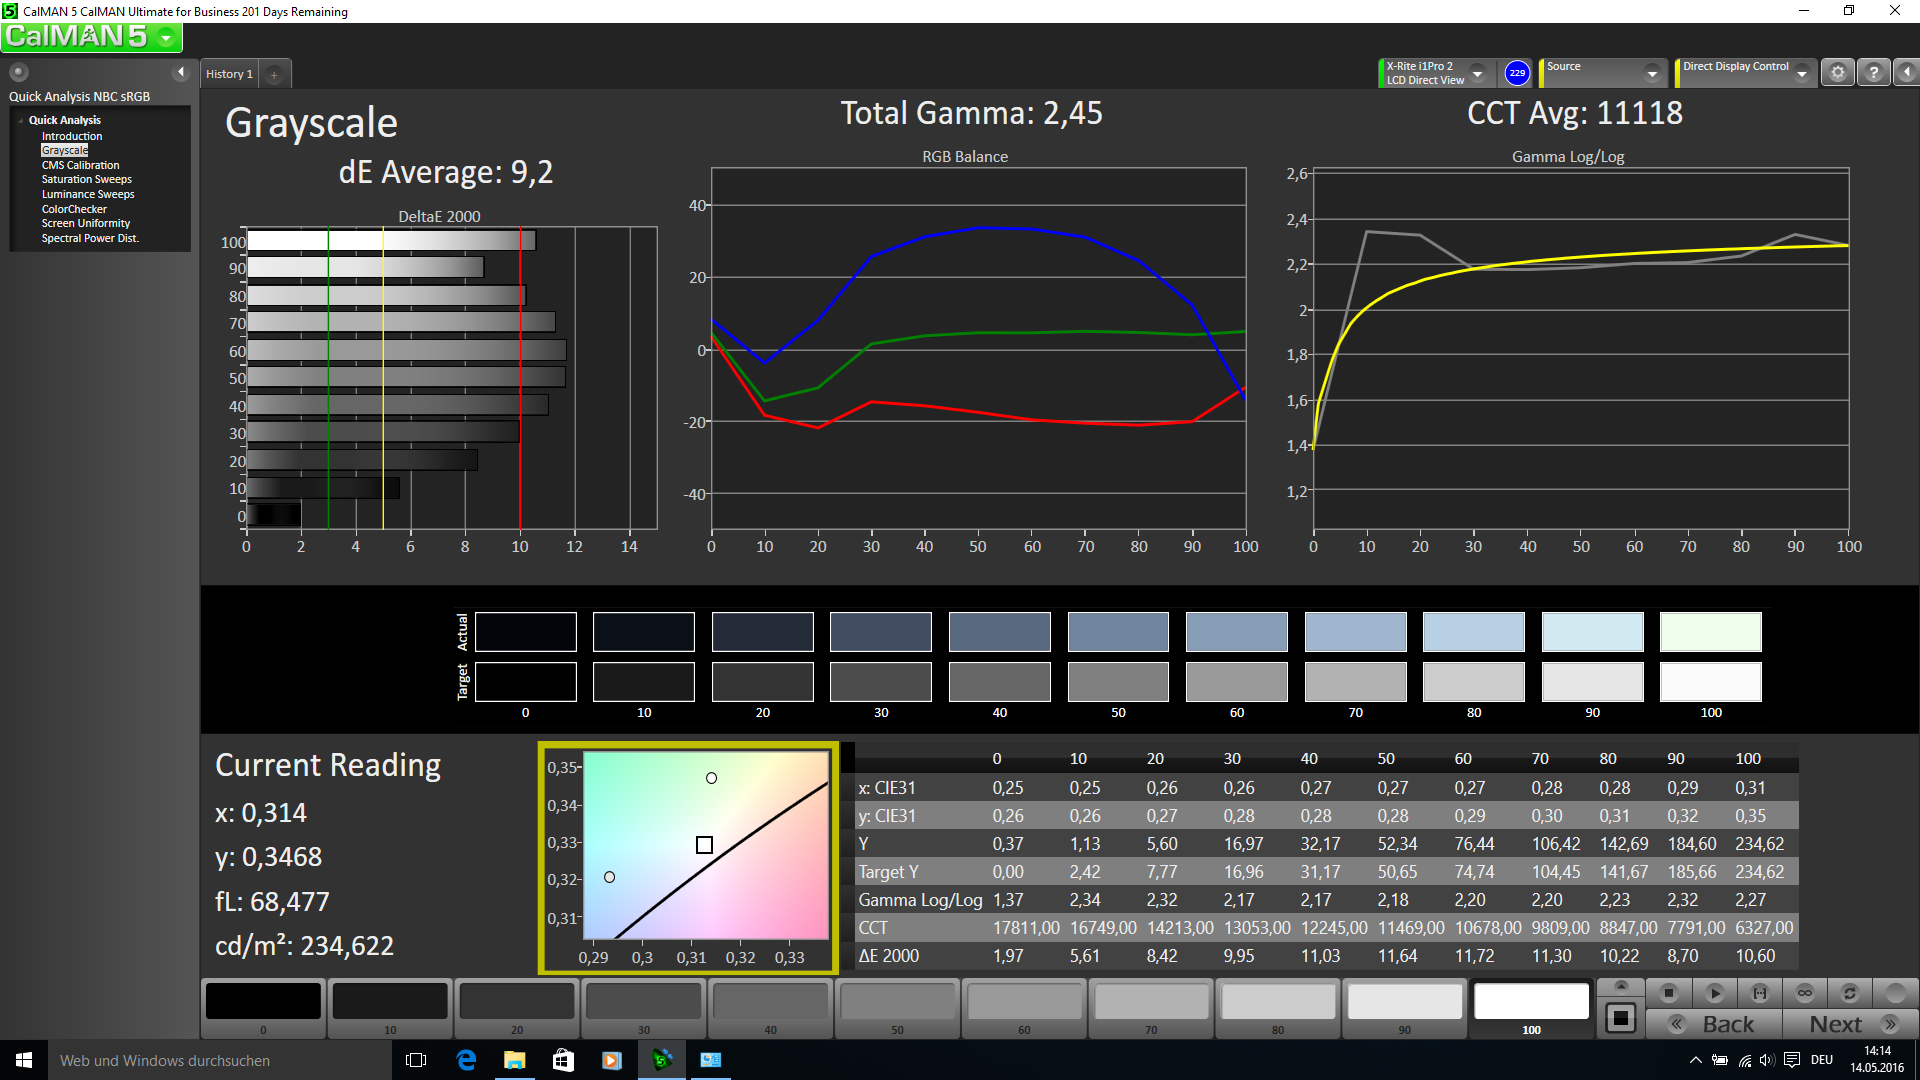
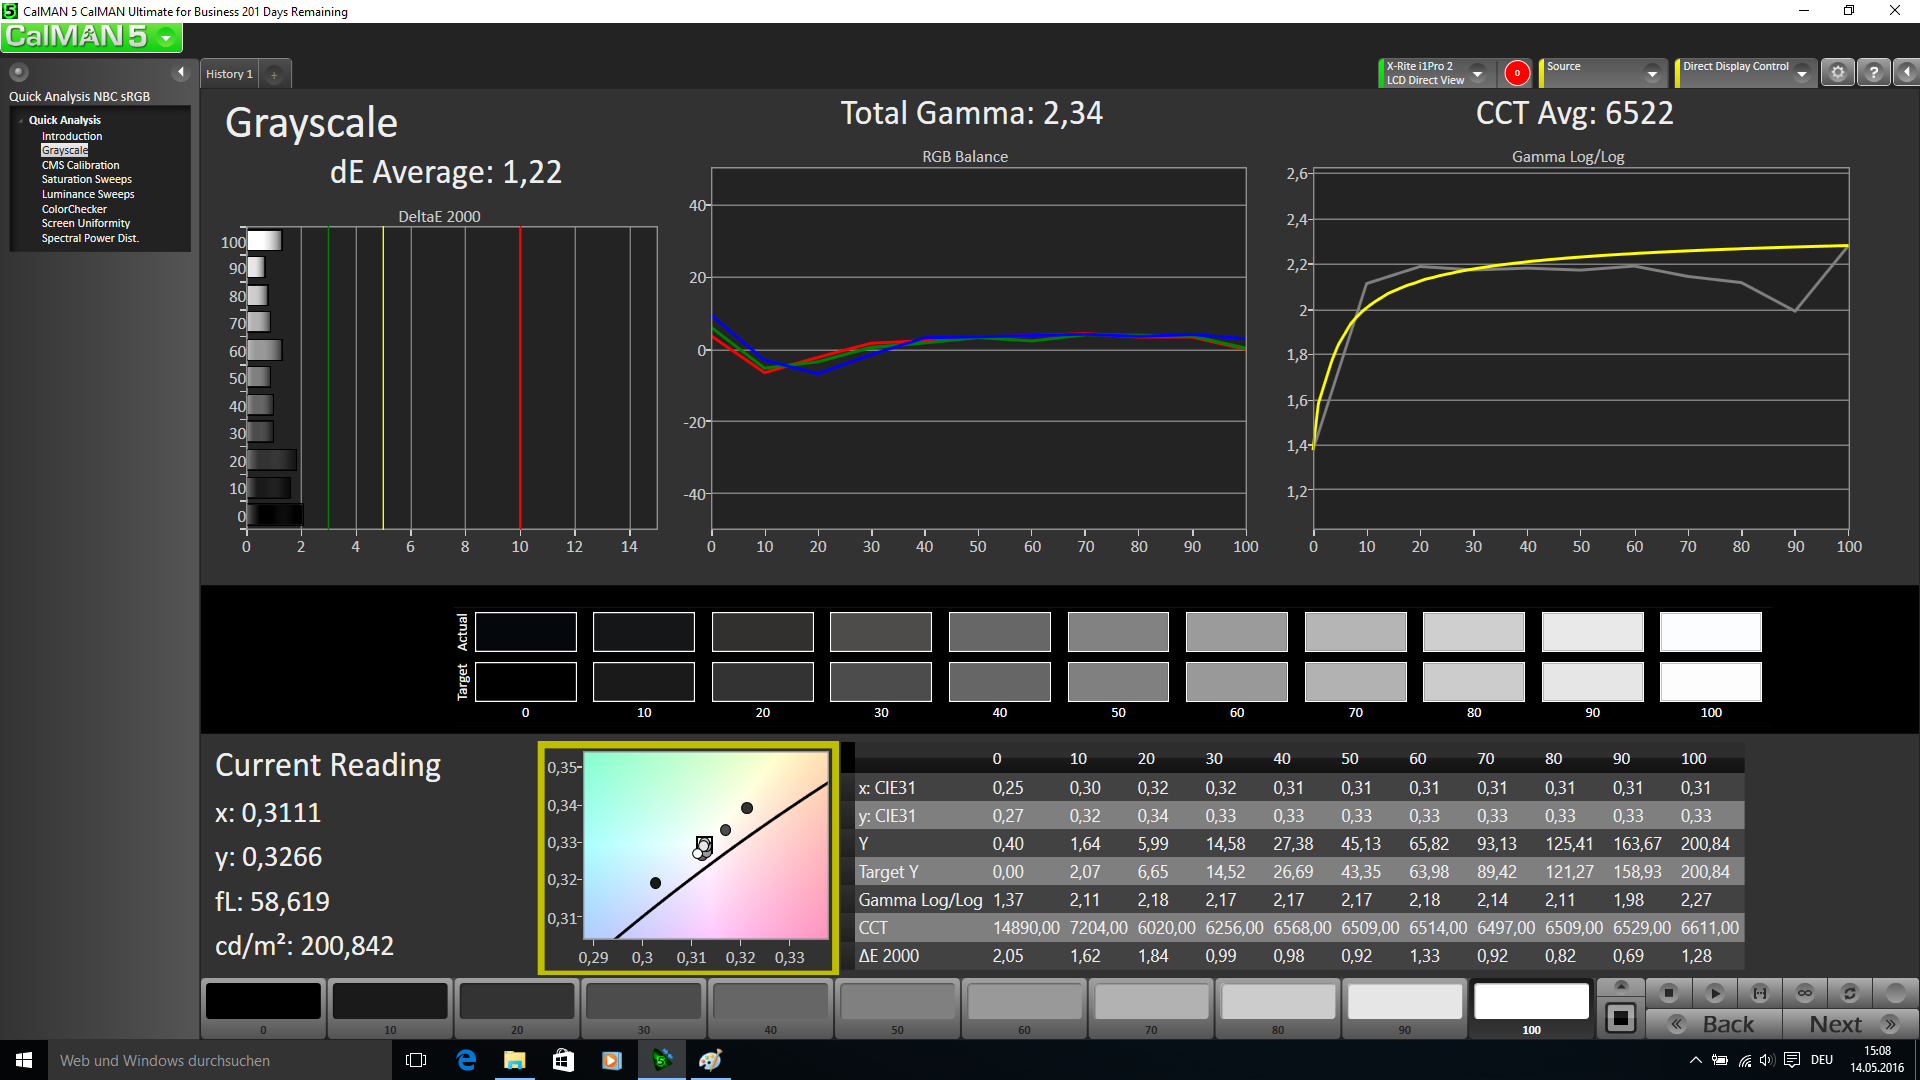
ΔE Greyscale 9.2 | 0.57-98 Ø5.3
57.96% sRGB (Argyll 1.6.3 3D)
37.46% AdobeRGB 1998 (Argyll 1.6.3 3D)
40.63% AdobeRGB 1998 (Argyll 2.2.0 3D)
58.1% sRGB (Argyll 2.2.0 3D)
39.25% Display P3 (Argyll 2.2.0 3D)
Gamma: 2.45
| Asus ASUSPRO Advanced B8430UA-FA0084E TN WLED, 1920x1080 | Asus ASUSPRO Advanced BU401LA-CZ020G TN-Panel, 1600x900 | Lenovo ThinkPad L460-20FVS01400 IPS, 1920x1080 | Dell Latitude 14 E5470 TN, 1366x768 | HP EliteBook 840 G3 T9X59ET#ABD TN LED, 1920x1080 | Lenovo ThinkPad T460s-20F9003SGE IPS, 1920x1080 | Lenovo ThinkPad T460-20FN003LGE IPS, 1920x1080 | |
|---|---|---|---|---|---|---|---|
| Display | 20% | 8% | 3% | 25% | 6% | 7% | |
| Display P3 Coverage | 39.25 | 46.98 20% | 42.2 8% | 40.06 2% | 48.93 25% | 41.65 6% | 42.09 7% |
| sRGB Coverage | 58.1 | 69.8 20% | 62.3 7% | 60.3 4% | 73.7 27% | 61.6 6% | 62 7% |
| AdobeRGB 1998 Coverage | 40.63 | 48.67 20% | 43.72 8% | 41.42 2% | 50.5 24% | 43.14 6% | 43.6 7% |
| Response Times | -23% | -36% | -10% | -19% | -9% | ||
| Response Time Grey 50% / Grey 80% * | 42 ? | 44.4 ? -6% | 56.8 ? -35% | 43 ? -2% | 42 ? -0% | 42.4 ? -1% | |
| Response Time Black / White * | 21.2 ? | 29.6 ? -40% | 28.8 ? -36% | 25 ? -18% | 29.2 ? -38% | 24.8 ? -17% | |
| PWM Frequency | 204 ? | ||||||
| Screen | -2% | 19% | -16% | 10% | 20% | 14% | |
| Brightness middle | 210 | 216 3% | 245 17% | 229 9% | 366 74% | 226 8% | 230 10% |
| Brightness | 207 | 209 1% | 225 9% | 207 0% | 336 62% | 211 2% | 216 4% |
| Brightness Distribution | 87 | 89 2% | 83 -5% | 80 -8% | 87 0% | 89 2% | 85 -2% |
| Black Level * | 0.4 | 0.436 -9% | 0.24 40% | 0.69 -73% | 0.65 -63% | 0.22 45% | 0.26 35% |
| Contrast | 525 | 495 -6% | 1021 94% | 332 -37% | 563 7% | 1027 96% | 885 69% |
| Colorchecker dE 2000 * | 8.75 | 9.63 -10% | 6.89 21% | 10.16 -16% | 10.26 -17% | 6.44 26% | 7.32 16% |
| Colorchecker dE 2000 max. * | 13.87 | 17.62 -27% | 17.18 -24% | 17.18 -24% | 18.14 -31% | ||
| Greyscale dE 2000 * | 9.2 | 10.72 -17% | 6.45 30% | 10.87 -18% | 11.51 -25% | 5.87 36% | 6.98 24% |
| Gamma | 2.45 90% | 2.49 88% | 2.46 89% | 2.41 91% | 2.4 92% | 2.37 93% | 2.5 88% |
| CCT | 11118 58% | 12873 50% | 6857 95% | 12881 50% | 12725 51% | 6856 95% | 6683 97% |
| Color Space (Percent of AdobeRGB 1998) | 37.46 | 44.8 20% | 40.1 7% | 38.4 3% | 47 25% | 39.58 6% | 39.97 7% |
| Color Space (Percent of sRGB) | 57.96 | 61.8 7% | 60.4 4% | 74 28% | 61.15 6% | 61.55 6% | |
| Moyenne finale (programmes/paramètres) | 9% /
4% | 1% /
11% | -16% /
-15% | 8% /
11% | 2% /
12% | 4% /
9% |
* ... Moindre est la valeur, meilleures sont les performances
Temps de réponse de l'écran
| ↔ Temps de réponse noir à blanc | ||
|---|---|---|
| 21.2 ms ... hausse ↗ et chute ↘ combinées | ↗ 16.8 ms hausse | 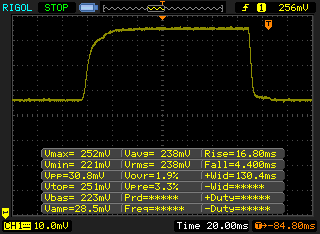 |
| ↘ 4.4 ms chute | ||
| L'écran montre de bons temps de réponse, mais insuffisant pour du jeu compétitif. En comparaison, tous les appareils testés affichent entre 0.1 (minimum) et 240 (maximum) ms. » 41 % des appareils testés affichent de meilleures performances. Cela signifie que les latences relevées sont similaires à la moyenne (21.5 ms) de tous les appareils testés. | ||
| ↔ Temps de réponse gris 50% à gris 80% | ||
| 42 ms ... hausse ↗ et chute ↘ combinées | ↗ 22.4 ms hausse | 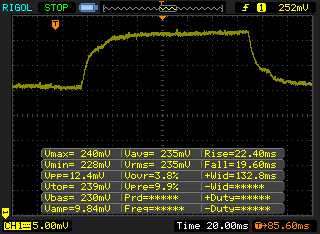 |
| ↘ 19.6 ms chute | ||
| L'écran souffre de latences très élevées, à éviter pour le jeu. En comparaison, tous les appareils testés affichent entre 0.2 (minimum) et 636 (maximum) ms. » 63 % des appareils testés affichent de meilleures performances. Cela signifie que les latences relevées sont moins bonnes que la moyenne (33.7 ms) de tous les appareils testés. | ||
Scintillement / MLI (Modulation de largeur d'impulsion)
| Scintillement / MLI (Modulation de largeur d'impulsion) non décelé | ||
En comparaison, 53 % des appareils testés n'emploient pas MDI pour assombrir leur écran. Nous avons relevé une moyenne à 17900 (minimum : 5 - maximum : 3846000) Hz dans le cas où une MDI était active. | ||

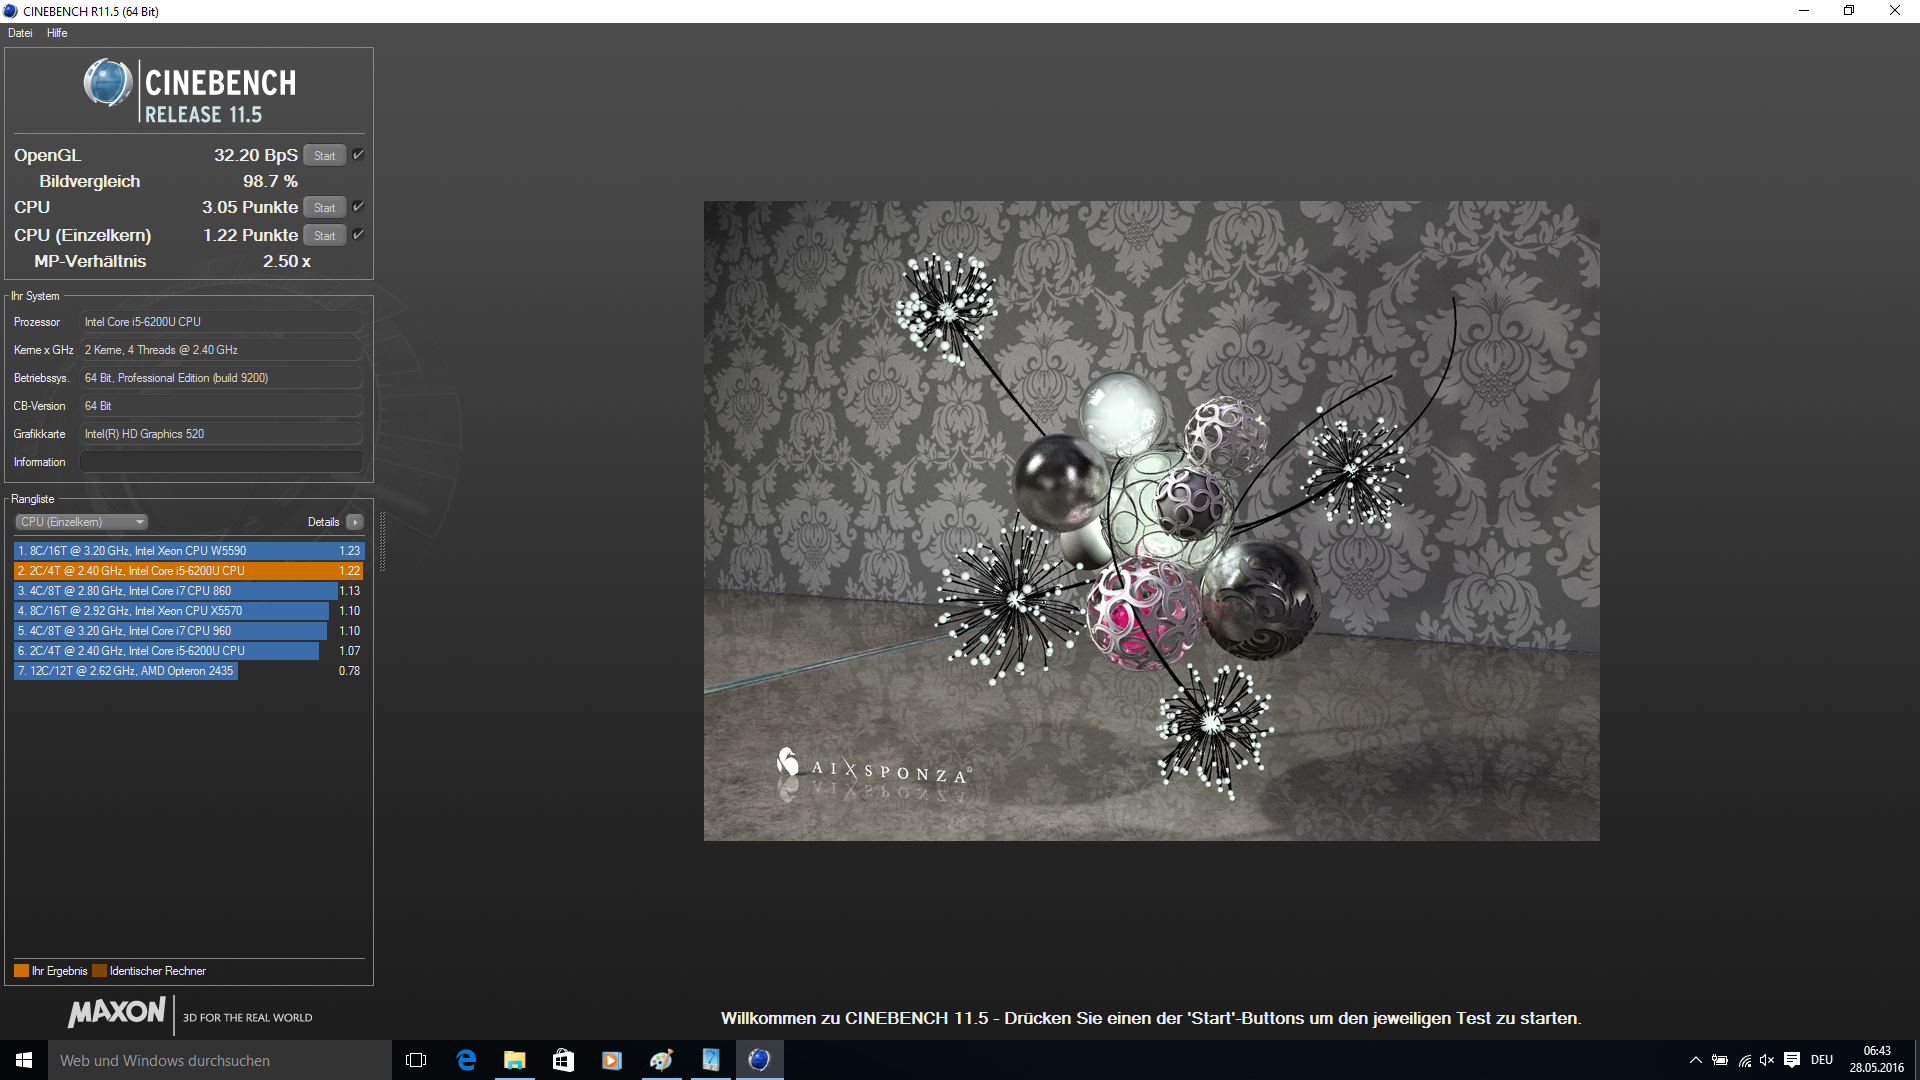
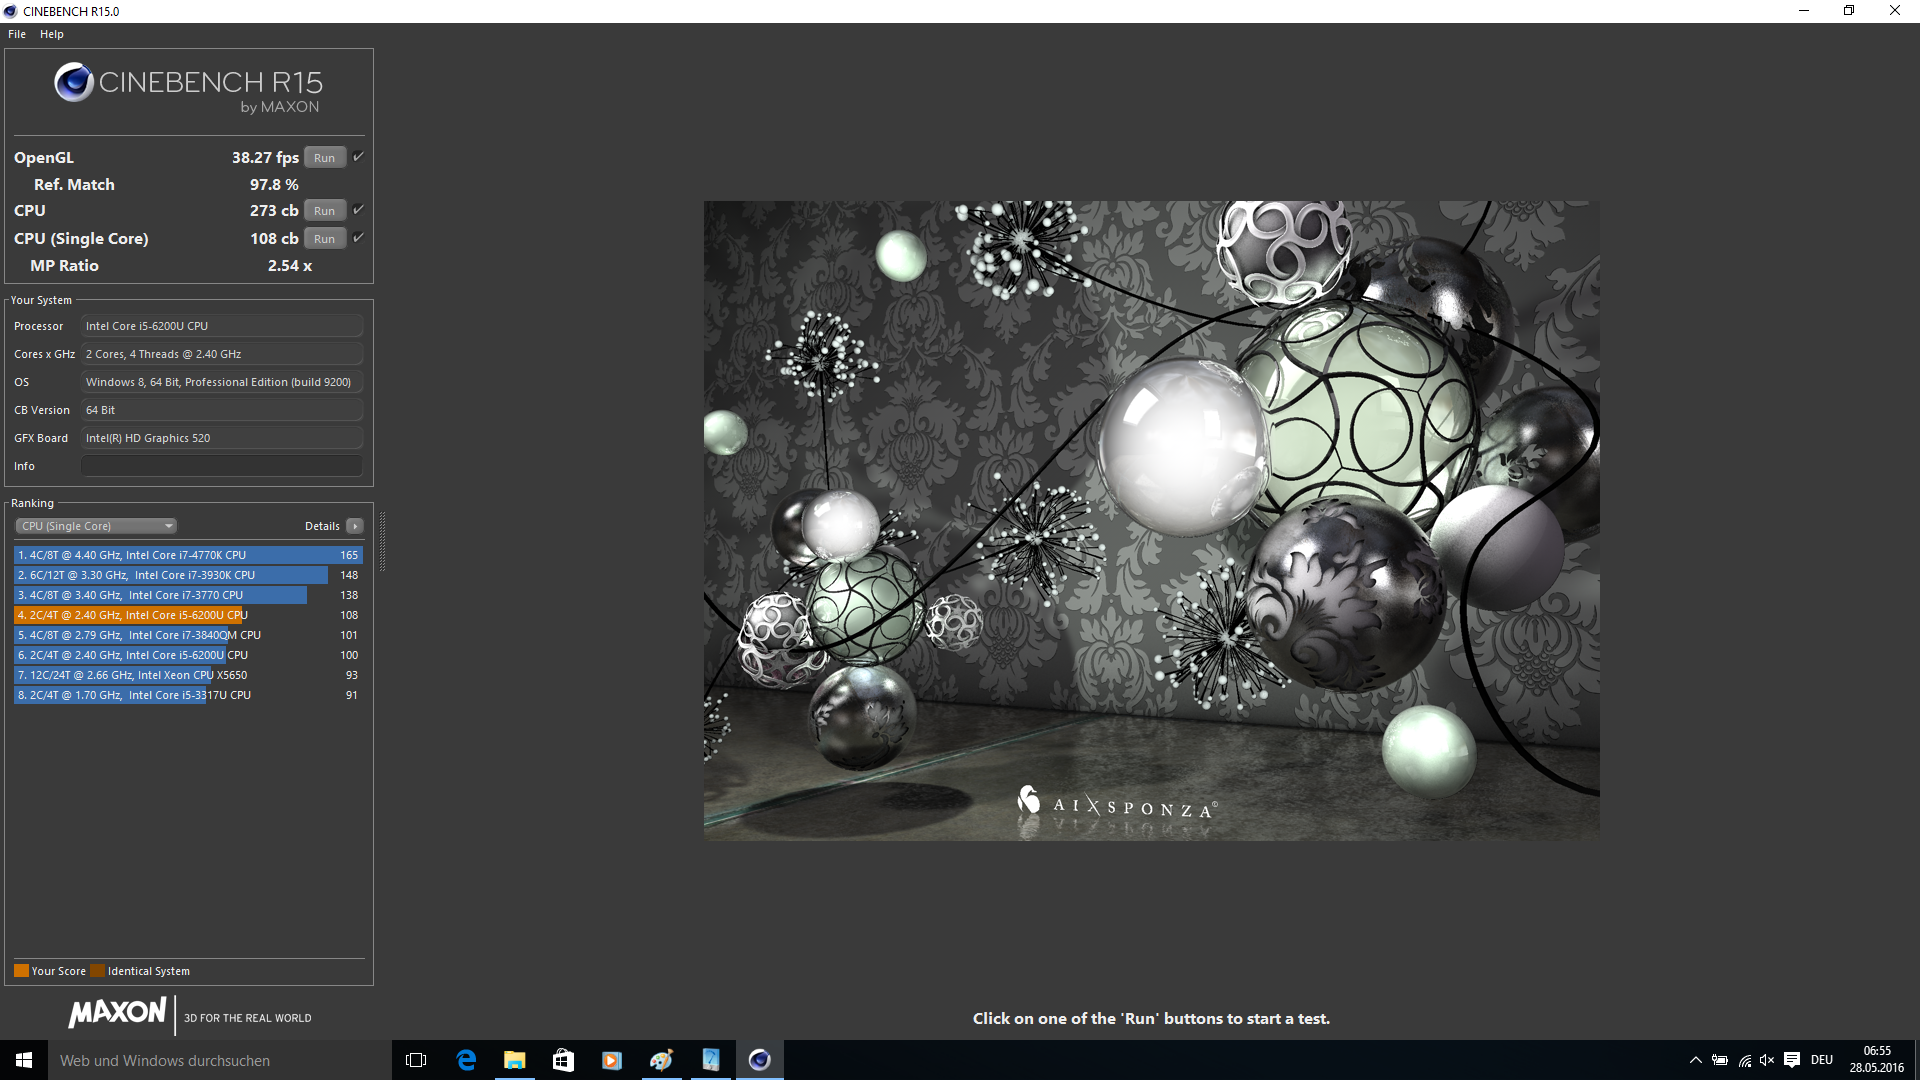
| Cinebench R10 | |
| Rendering Single CPUs 64Bit (Classer selon les valeurs) | |
| Asus ASUSPRO Advanced B8430UA-FA0084E | |
| Asus ASUSPRO Advanced BU401LA-CZ020G | |
| Dell Latitude 14 E5470 | |
| Rendering Multiple CPUs 64Bit (Classer selon les valeurs) | |
| Asus ASUSPRO Advanced B8430UA-FA0084E | |
| Asus ASUSPRO Advanced BU401LA-CZ020G | |
| Dell Latitude 14 E5470 | |
* ... Moindre est la valeur, meilleures sont les performances

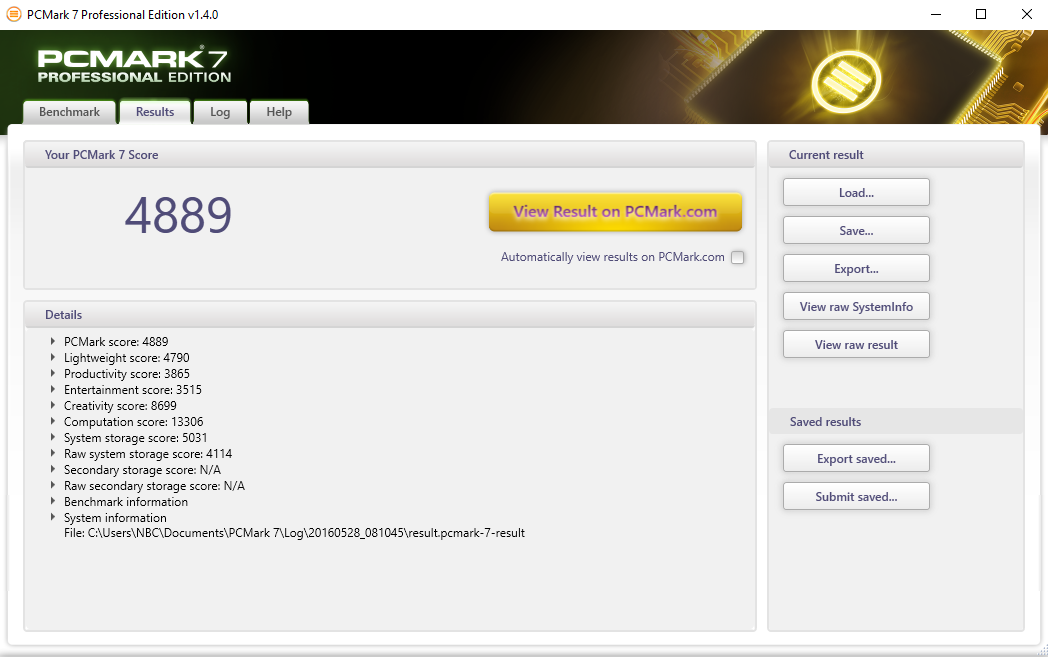
| PCMark 7 Score | 4889 points | |
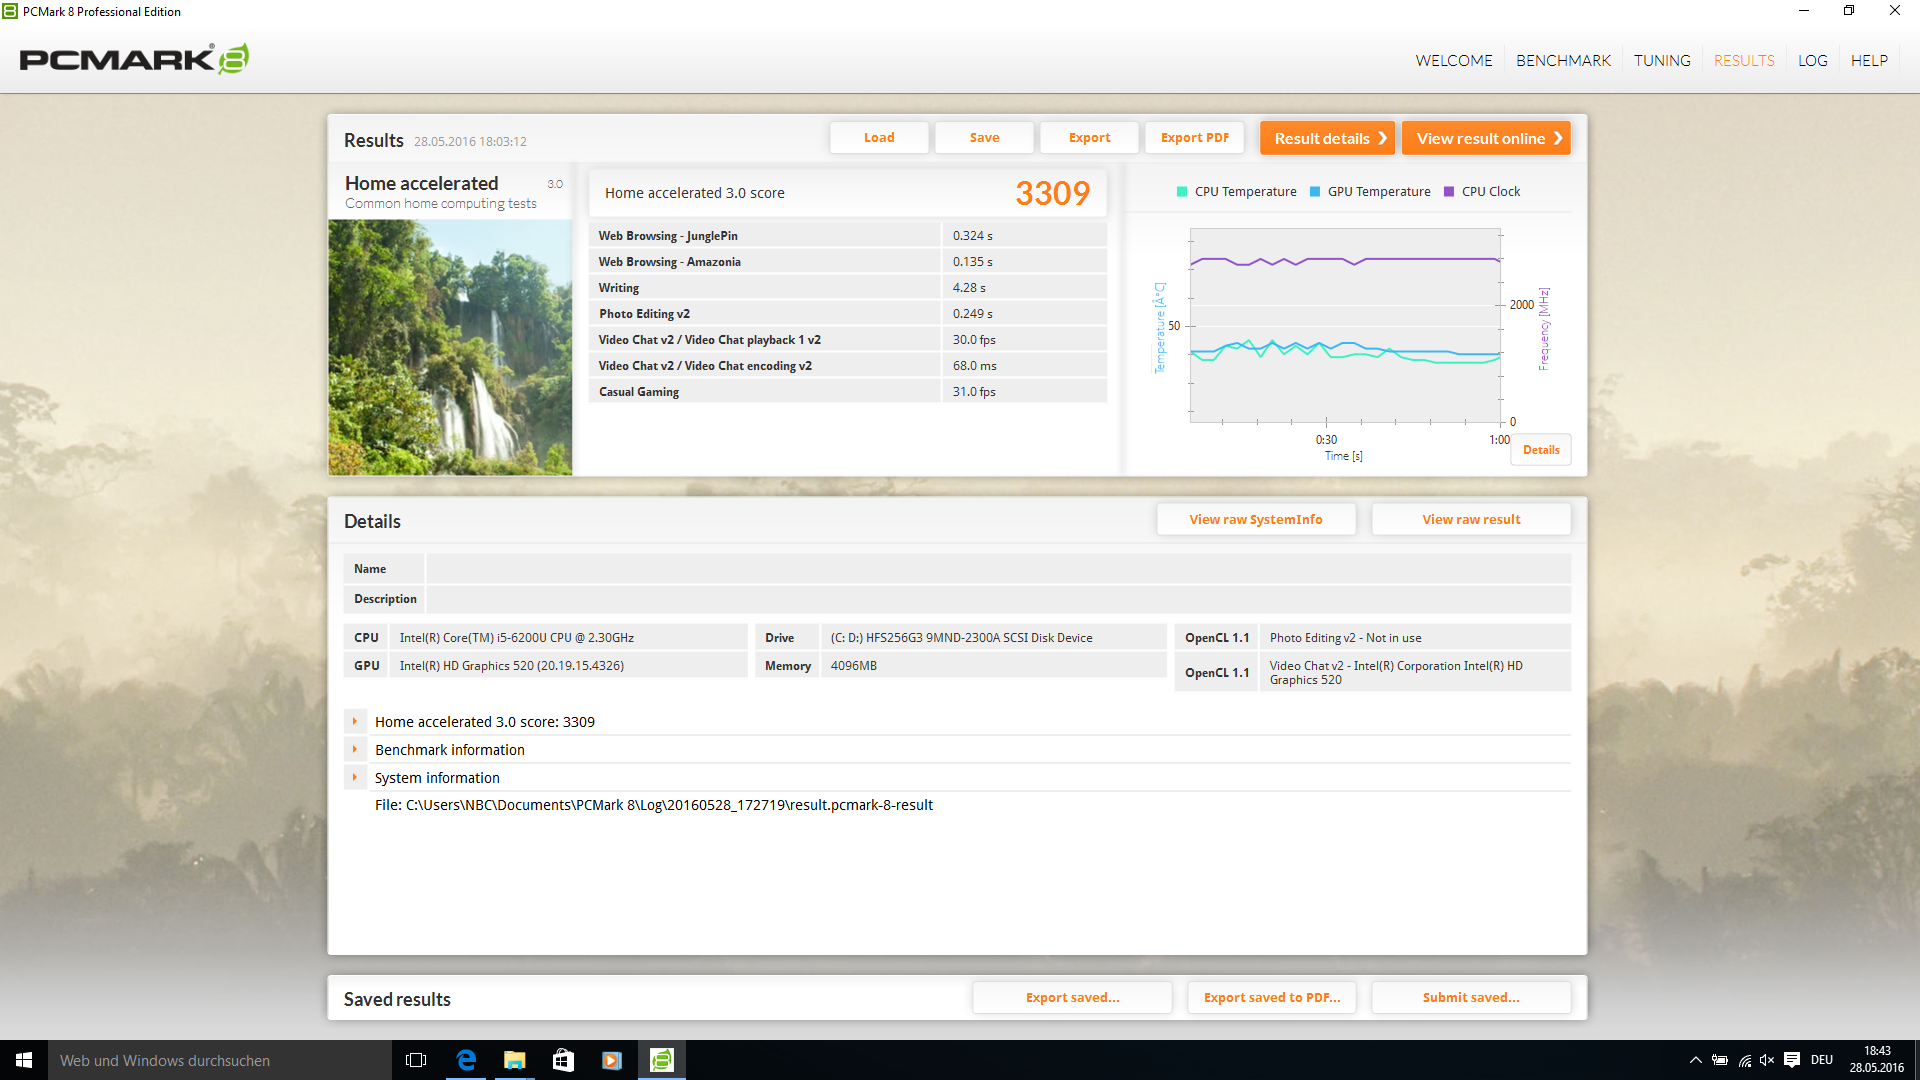
| PCMark 8 Home Score Accelerated v2 | 3309 points | |
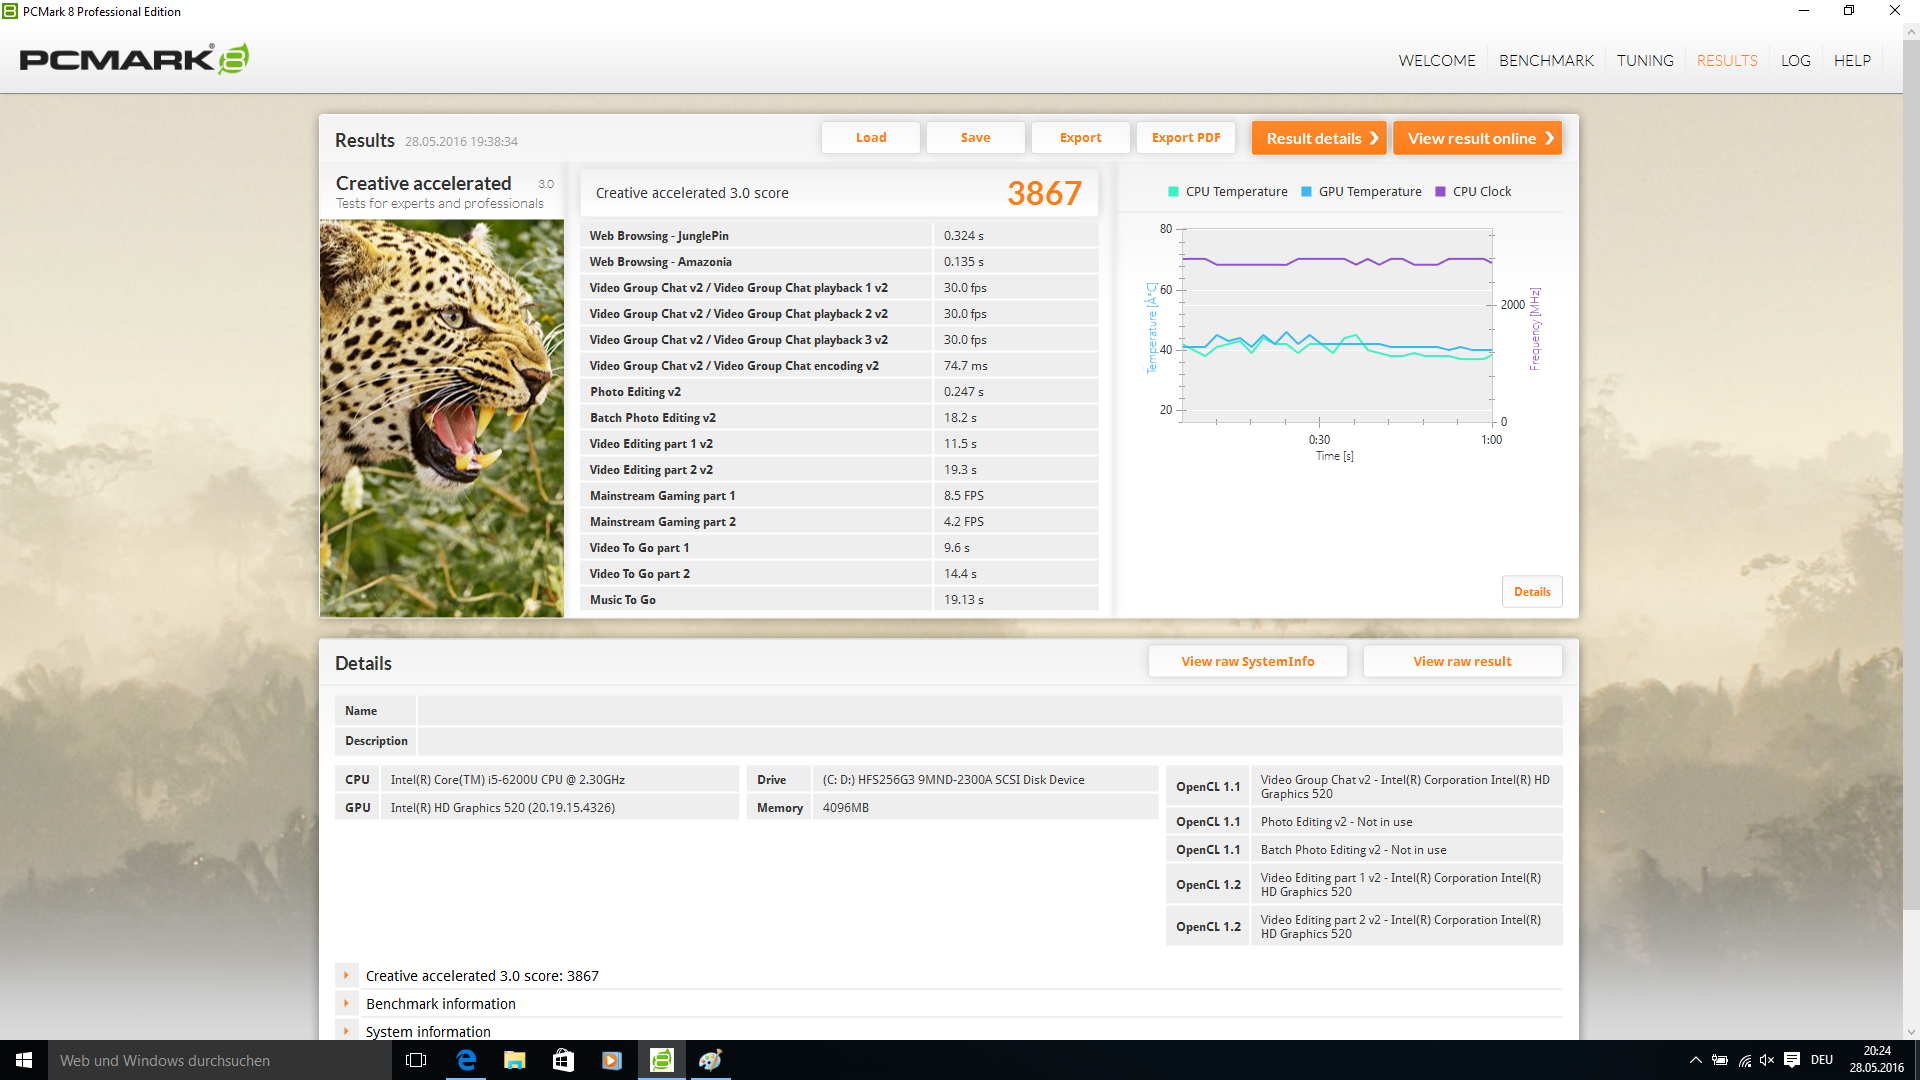
| PCMark 8 Creative Score Accelerated v2 | 3867 points | |
| PCMark 8 Work Score Accelerated v2 | 4192 points | |
Aide | ||

| 3DMark 06 - 1280x1024 Standard Score AA:0x AF:0x (Classer selon les valeurs) | |
| Asus ASUSPRO Advanced B8430UA-FA0084E | |
| Lenovo ThinkPad L460-20FVS01400 | |
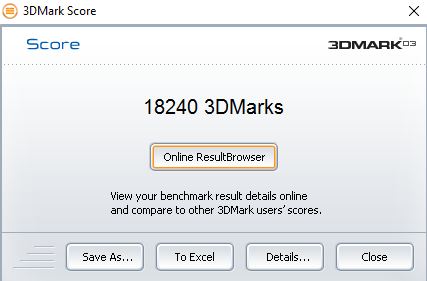
| 3DMark 03 Standard | 18240 points | |
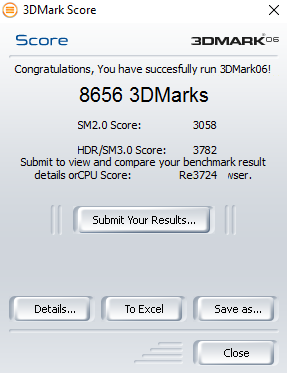
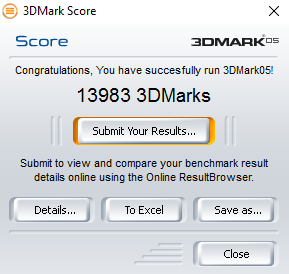
| 3DMark 06 Standard Score | 8656 points | |
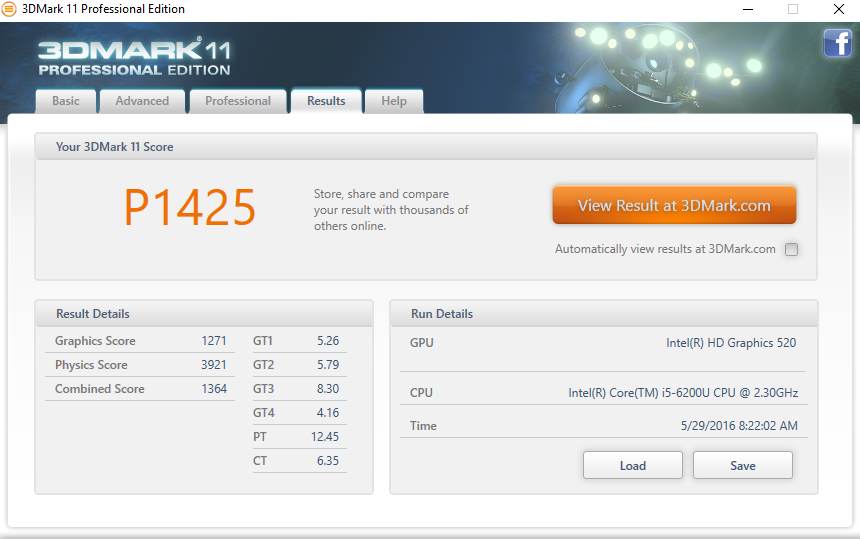
| 3DMark 11 Performance | 1425 points | |
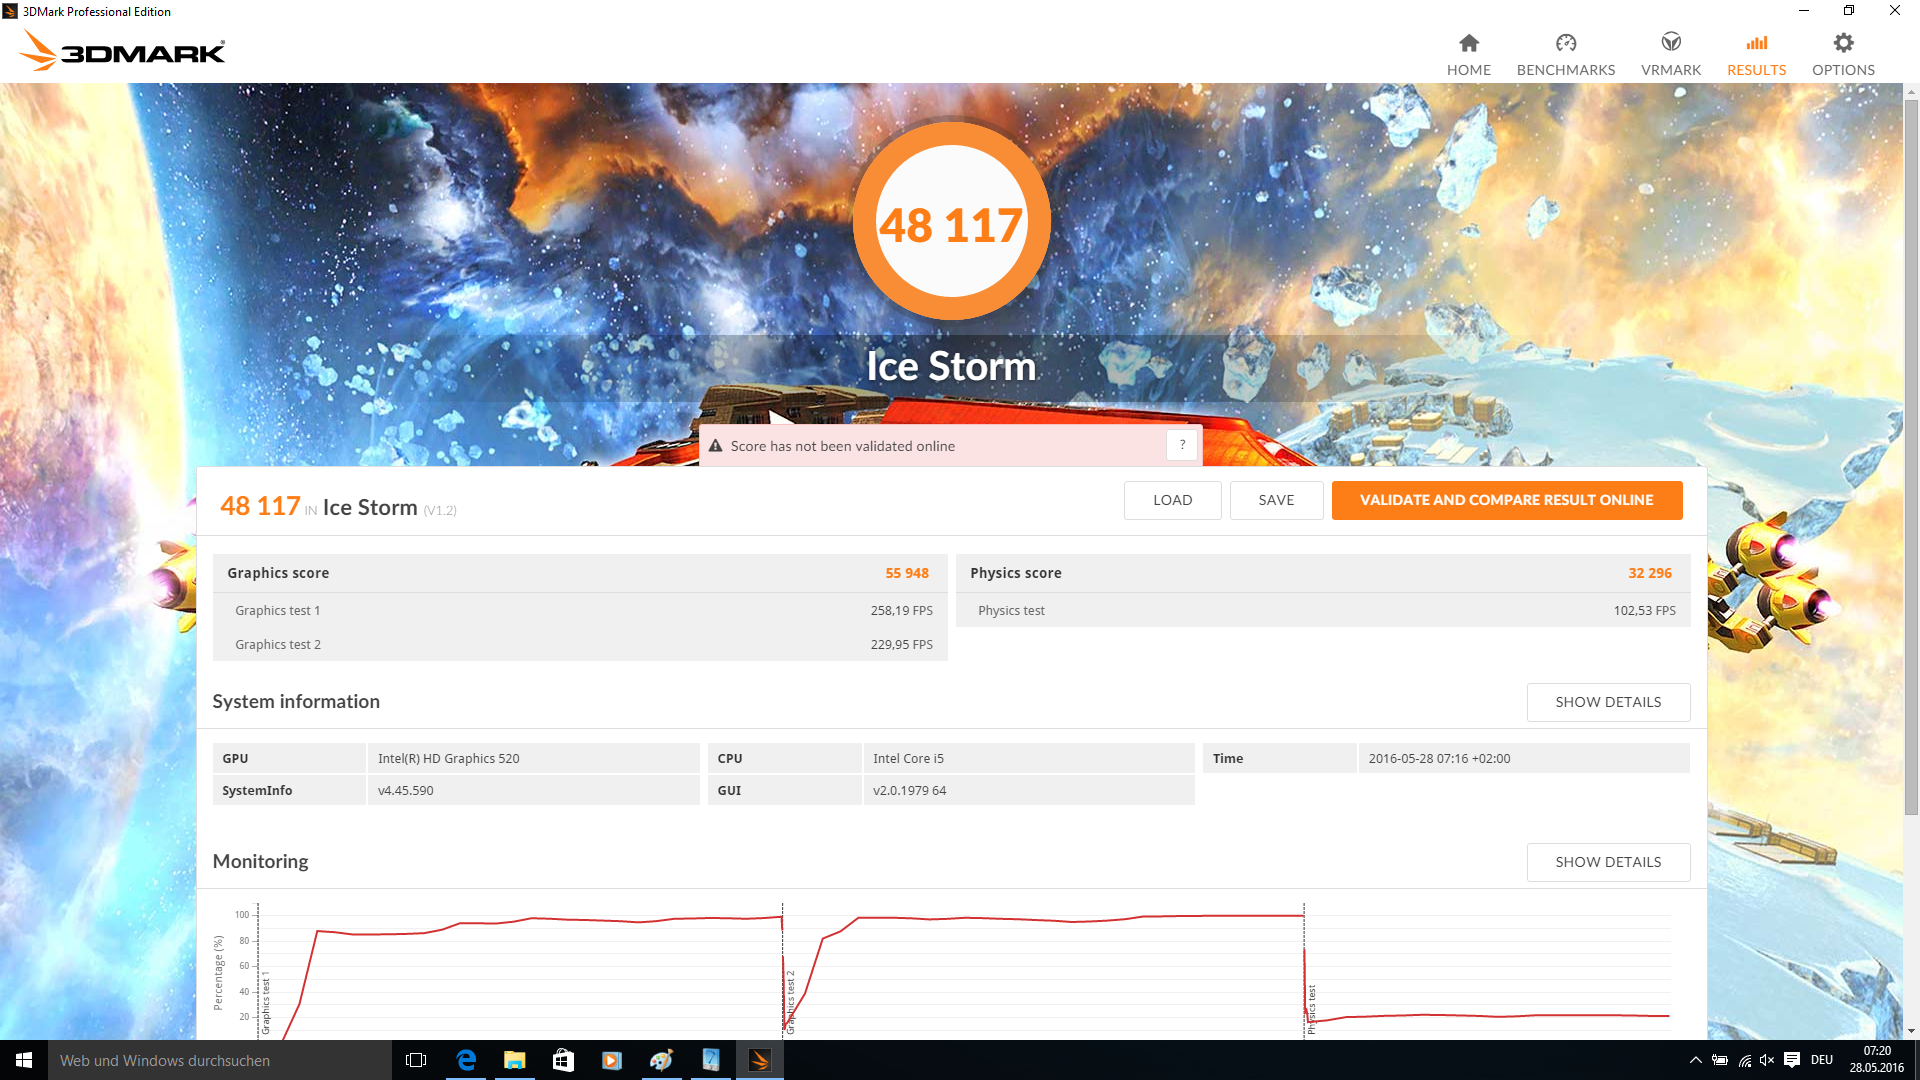
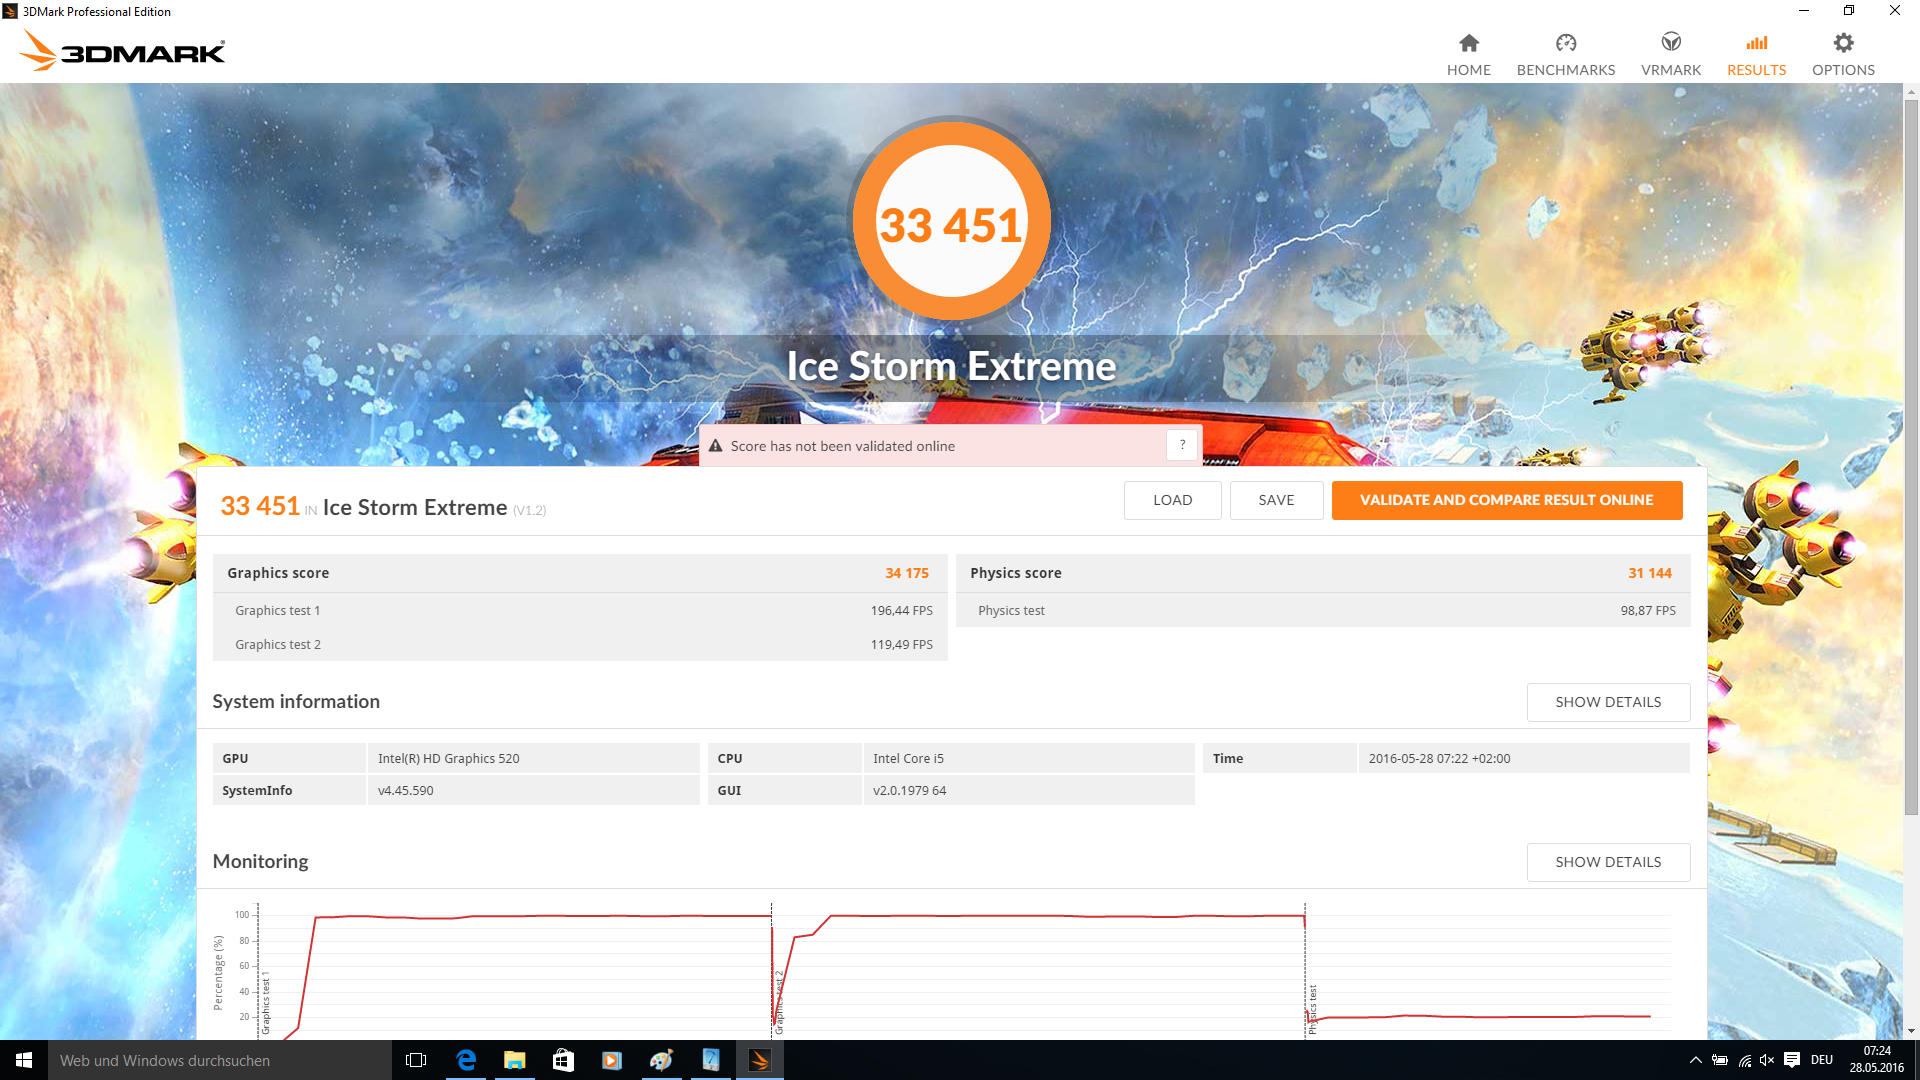
| 3DMark Ice Storm Standard Score | 48117 points | |
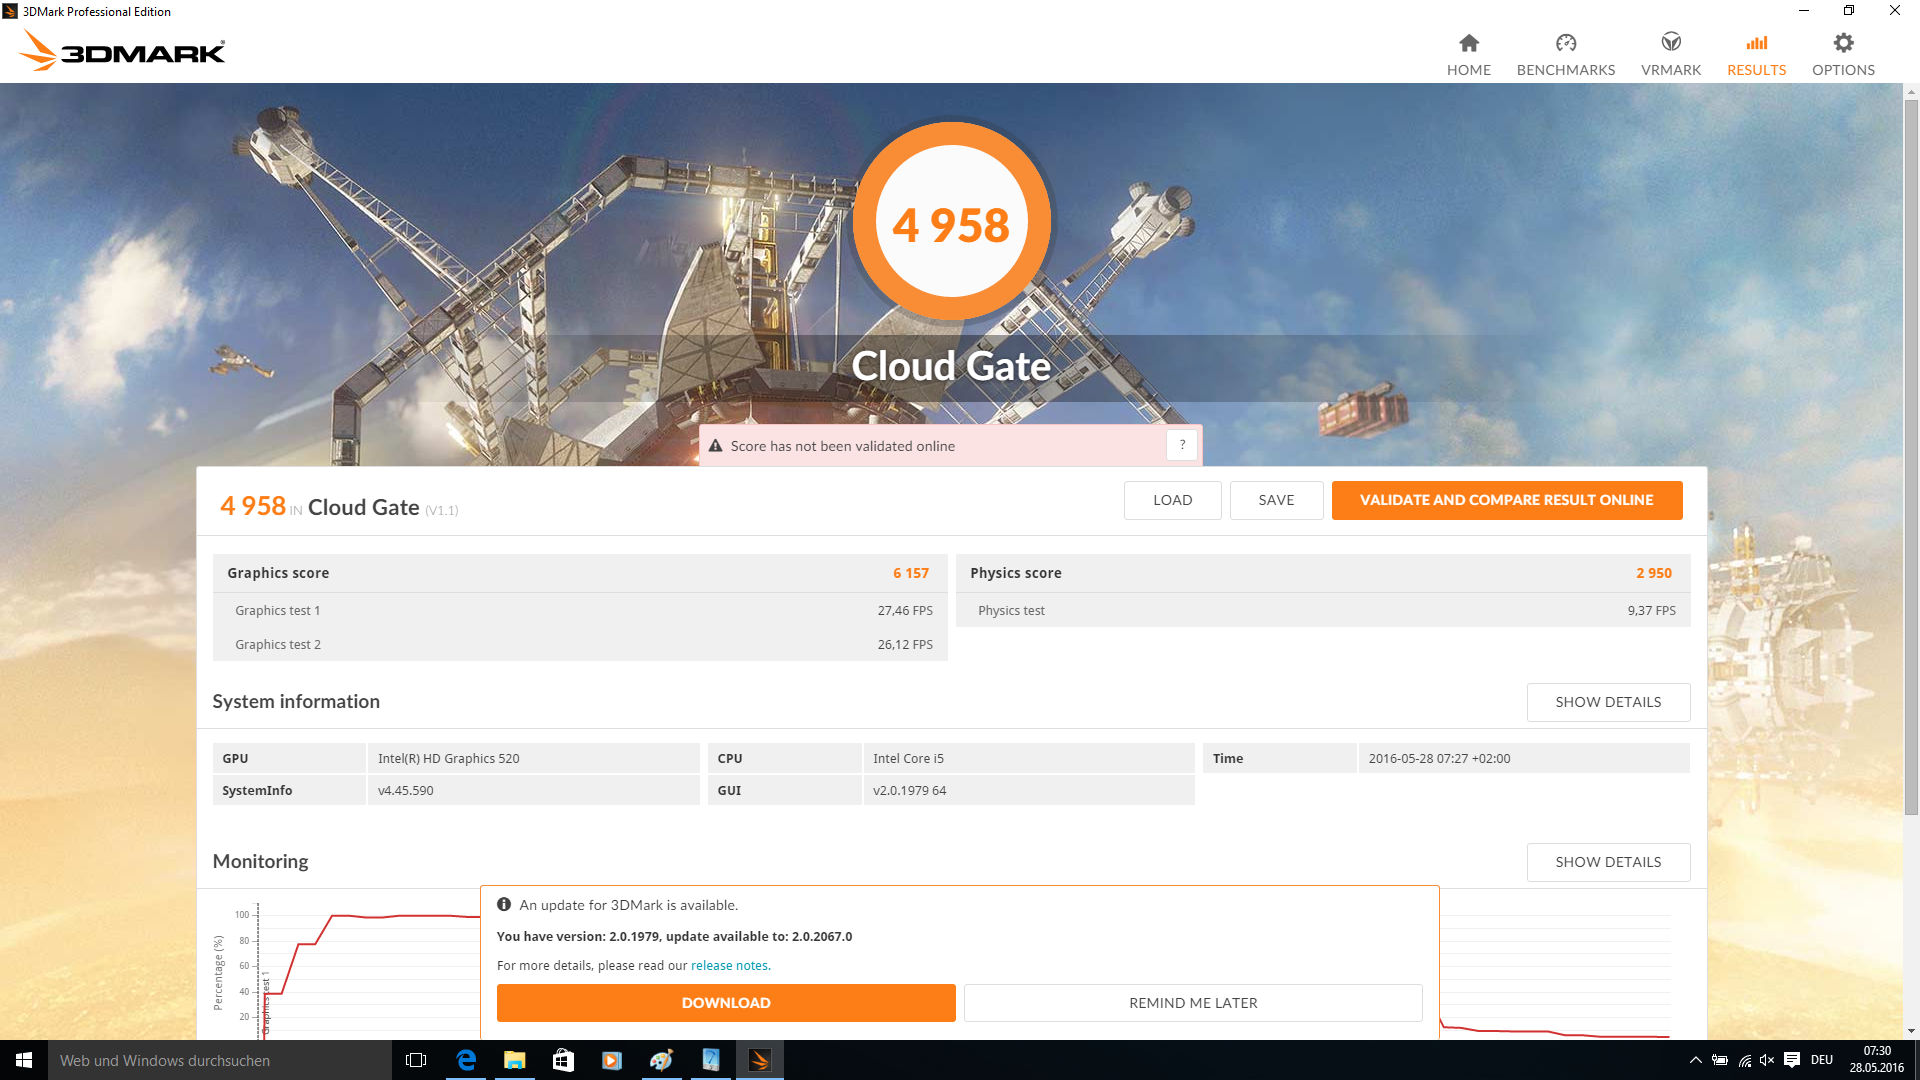
| 3DMark Cloud Gate Standard Score | 4958 points | |
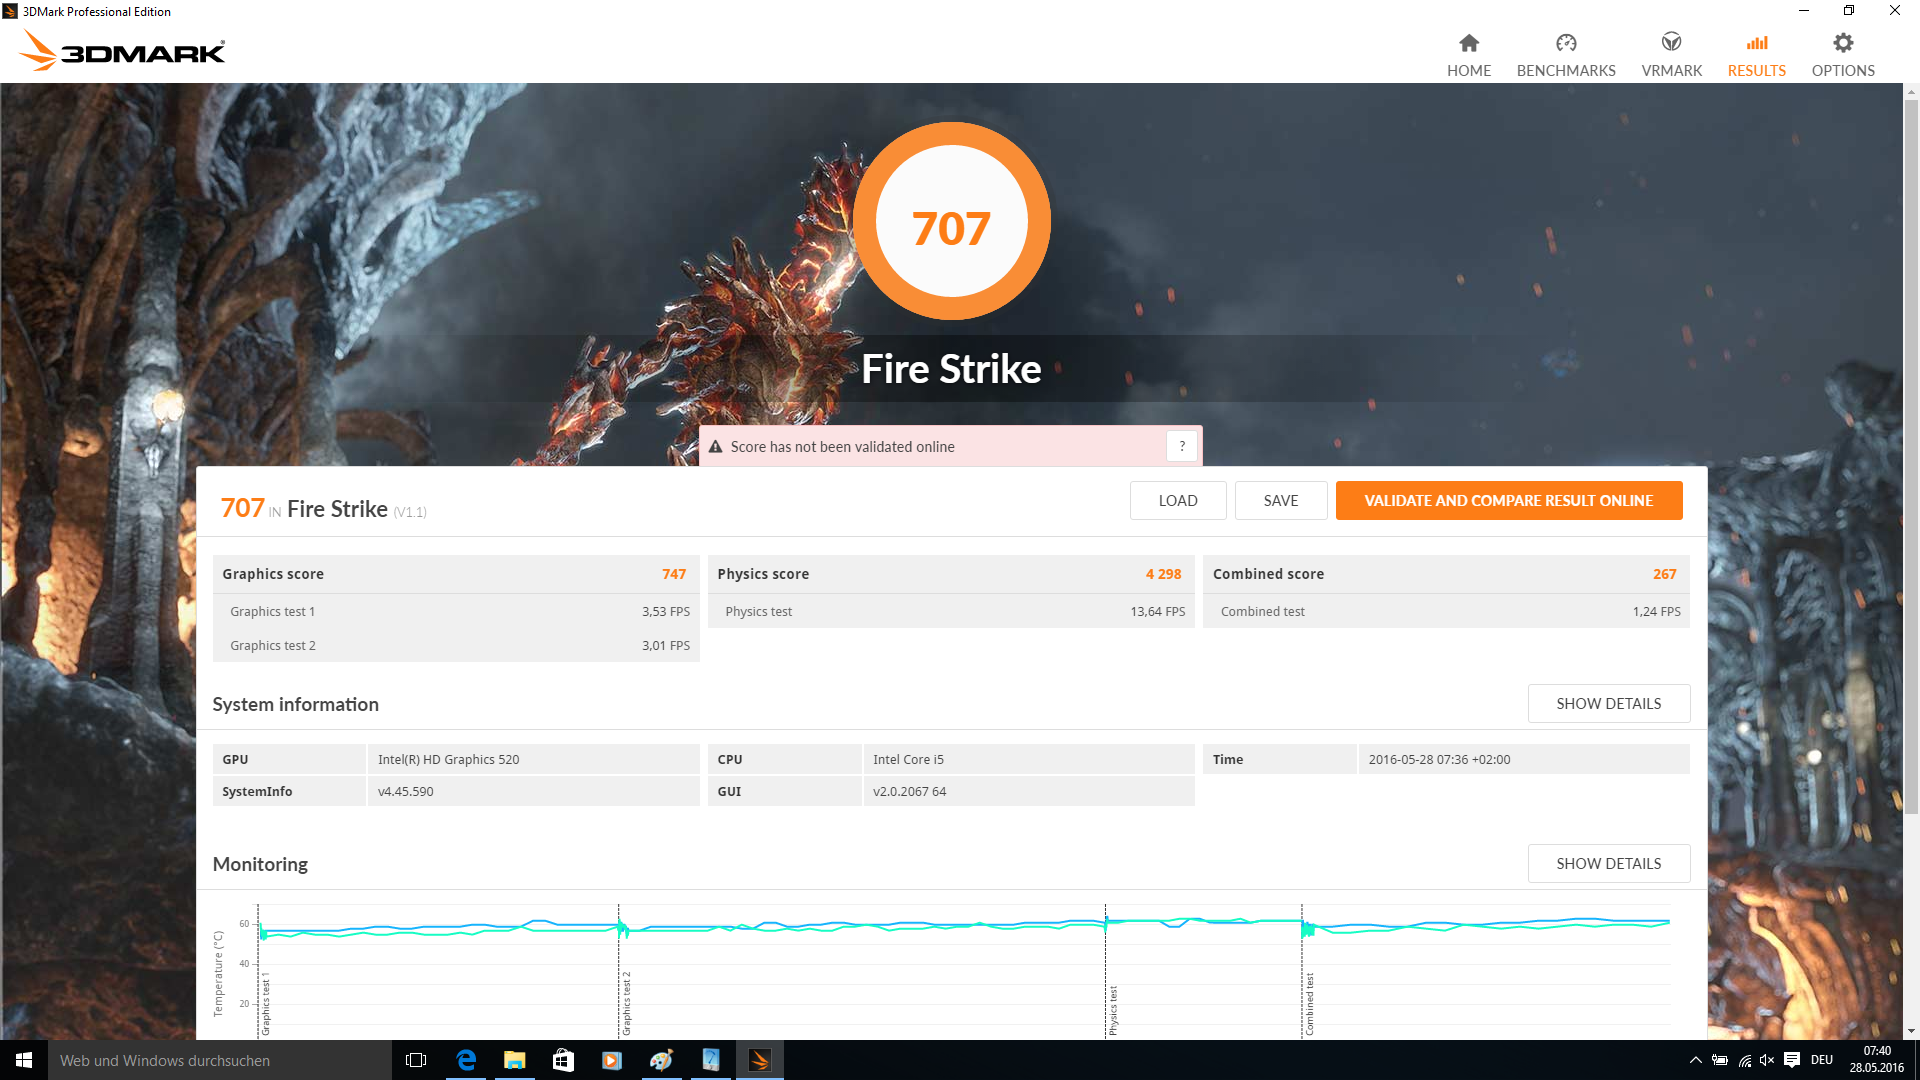
| 3DMark Fire Strike Score | 707 points | |
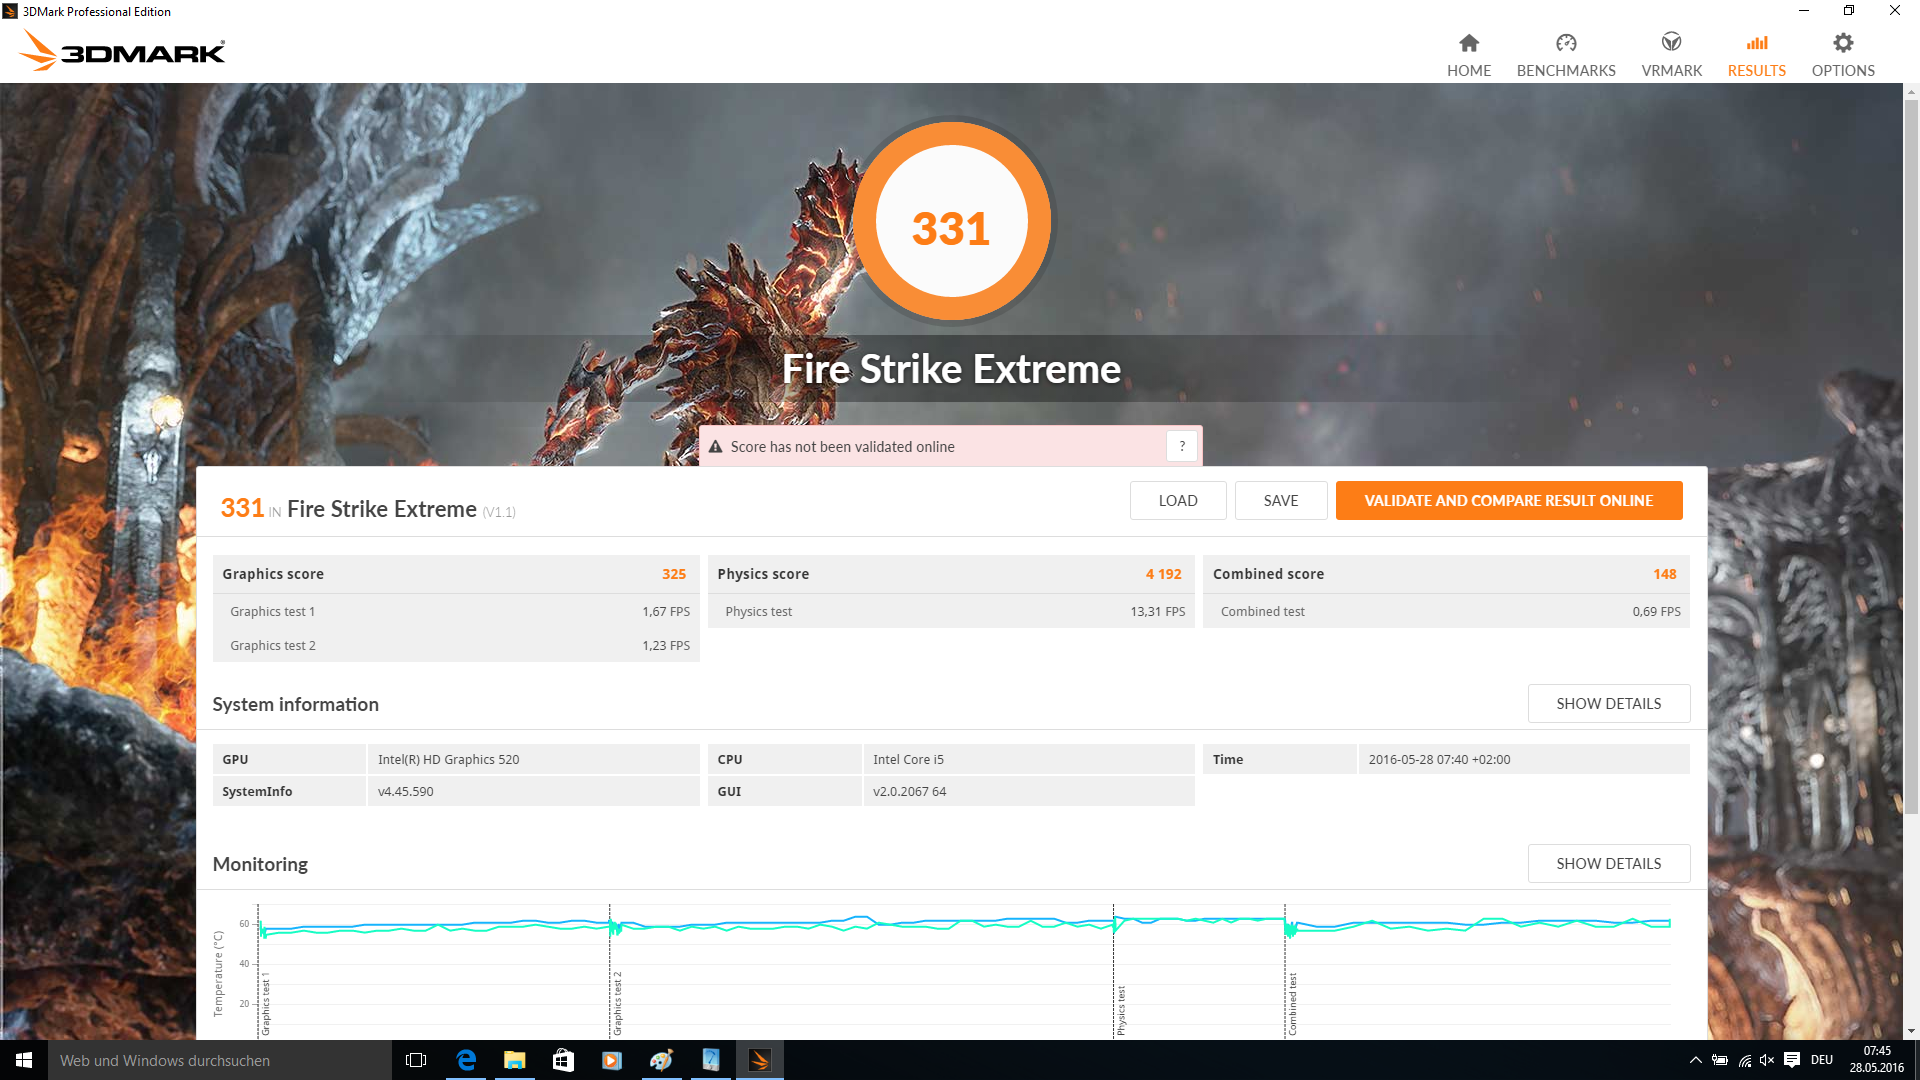
| 3DMark Fire Strike Extreme Score | 331 points | |
Aide | ||
| Bas | Moyen | Élevé | Ultra | |
| BioShock Infinite (2013) | 44.04 | 23.58 | 19.79 | 5.82 |
| Battlefield 4 (2013) | 40.9 | 24.1 | 18.7 | |
| Rise of the Tomb Raider (2016) | 17.8 | 11.9 | 7.2 |
Degré de la nuisance sonore
| Au repos |
| 28.8 / 28.8 / 28.8 dB(A) |
| Fortement sollicité |
| 34.7 / 36.1 dB(A) |
 | ||
30 dB silencieux 40 dB(A) audible 50 dB(A) bruyant |
||
min: | ||
| Asus ASUSPRO Advanced B8430UA-FA0084E Intel Core i5-6200U, HD Graphics 520 | Asus ASUSPRO Advanced BU401LA-CZ020G Intel Core i7-4650U, HD Graphics 5000 | Lenovo ThinkPad L460-20FVS01400 Intel Core i7-6500U, Radeon R5 M330 | Dell Latitude 14 E5470 Intel Core i5-6300U, HD Graphics 520 | HP EliteBook 840 G3 T9X59ET#ABD Intel Core i7-6500U, HD Graphics 520 | Lenovo ThinkPad T460s-20F9003SGE Intel Core i5-6200U, HD Graphics 520 | Lenovo ThinkPad T460-20FN003LGE Intel Core i5-6200U, HD Graphics 520 | |
|---|---|---|---|---|---|---|---|
| Noise | -2% | -0% | 0% | -9% | 0% | -1% | |
| off / environment * | 28.8 | 29.2 -1% | 29.2 -1% | 31.2 -8% | 29.1 -1% | 29 -1% | |
| Idle Minimum * | 28.8 | 29.3 -2% | 29.2 -1% | 29.2 -1% | 31.2 -8% | 29.1 -1% | 29 -1% |
| Idle Average * | 28.8 | 29.3 -2% | 29.2 -1% | 29.2 -1% | 32.1 -11% | 29.1 -1% | 29 -1% |
| Idle Maximum * | 28.8 | 30.9 -7% | 29.2 -1% | 29.2 -1% | 33.1 -15% | 29.1 -1% | 29 -1% |
| Load Average * | 34.7 | 33.1 5% | 32.5 6% | 32.1 7% | 36.2 -4% | 32.3 7% | 34.2 1% |
| Load Maximum * | 36.1 | 37.3 -3% | 37.2 -3% | 36.8 -2% | 37.8 -5% | 36.6 -1% | 37.8 -5% |
* ... Moindre est la valeur, meilleures sont les performances
(±) La température maximale du côté supérieur est de 40.1 °C / 104 F, par rapport à la moyenne de 34.2 °C / 94 F, allant de 21.2 à 62.5 °C pour la classe Office.
(±) Le fond chauffe jusqu'à un maximum de 41.8 °C / 107 F, contre une moyenne de 36.7 °C / 98 F
(+) En utilisation inactive, la température moyenne du côté supérieur est de 28.8 °C / 84 F, par rapport à la moyenne du dispositif de 29.5 °C / 85 F.
(+) Les repose-poignets et le pavé tactile sont plus froids que la température de la peau avec un maximum de 30.7 °C / 87.3 F et sont donc froids au toucher.
(-) La température moyenne de la zone de l'appui-paume de dispositifs similaires était de 27.7 °C / 81.9 F (-3 °C / #-5.4 F).
| Asus ASUSPRO Advanced B8430UA-FA0084E HD Graphics 520, 6200U, Hynix HFS256G39MND | Asus ASUSPRO Advanced BU401LA-CZ020G HD Graphics 5000, 4650U, Liteonit LCS-256M6S | Lenovo ThinkPad L460-20FVS01400 Radeon R5 M330, 6500U, Toshiba HG6 THNSFJ256GCSU | Dell Latitude 14 E5470 HD Graphics 520, 6300U, Liteon L8H-256V2G | HP EliteBook 840 G3 T9X59ET#ABD HD Graphics 520, 6500U, Samsung SSD PM851 256 GB MZNTE256HMHP | Lenovo ThinkPad T460s-20F9003SGE HD Graphics 520, 6200U, Samsung CM871 MZ7LF192HCGS | Lenovo ThinkPad T460-20FN003LGE HD Graphics 520, 6200U, Toshiba HG6 THNSFJ256GCSU | |
|---|---|---|---|---|---|---|---|
| Power Consumption | 4% | -4% | 15% | 6% | 6% | 6% | |
| Idle Minimum * | 4.2 | 4.1 2% | 3.1 26% | 3.5 17% | 3.8 10% | 3.7 12% | 3.5 17% |
| Idle Average * | 6.5 | 7.1 -9% | 6.3 3% | 5.3 18% | 6.3 3% | 6.8 -5% | 6.7 -3% |
| Idle Maximum * | 7.2 | 7.3 -1% | 7.9 -10% | 6 17% | 6.8 6% | 7.3 -1% | 7.3 -1% |
| Load Average * | 29.2 | 28.9 1% | 29.5 -1% | 26.3 10% | 34.4 -18% | 26.3 10% | 28.2 3% |
| Load Maximum * | 41 | 29.3 29% | 57.3 -40% | 36.6 11% | 28.3 31% | 34.6 16% | 34.6 16% |
* ... Moindre est la valeur, meilleures sont les performances
| Éteint/en veille | |
| Au repos | |
| Fortement sollicité |
|
| Asus ASUSPRO Advanced B8430UA-FA0084E 48 Wh | Asus ASUSPRO Advanced BU401LA-CZ020G 53 Wh | Lenovo ThinkPad L460-20FVS01400 48 Wh | Dell Latitude 14 E5470 62 Wh | HP EliteBook 840 G3 T9X59ET#ABD 46 Wh | Lenovo ThinkPad T460s-20F9003SGE 49 Wh | Lenovo ThinkPad T460-20FN003LGE 46 Wh | |
|---|---|---|---|---|---|---|---|
| Autonomie de la batterie | -7% | 22% | 75% | 29% | 23% | 15% | |
| Reader / Idle | 716 | 699 -2% | 1153 61% | 1304 82% | 1020 42% | 915 28% | 953 33% |
| H.264 | 336 | 296 -12% | 431 28% | 645 92% | 534 59% | 512 52% | |
| WiFi v1.3 | 344 | 425 24% | 667 94% | 453 32% | 395 15% | 338 -2% | |
| Load | 129 | 120 -7% | 97 -25% | 172 33% | 146 13% | 116 -10% | 98 -24% |
| WiFi | 310 |
Points positifs
Points négatifs
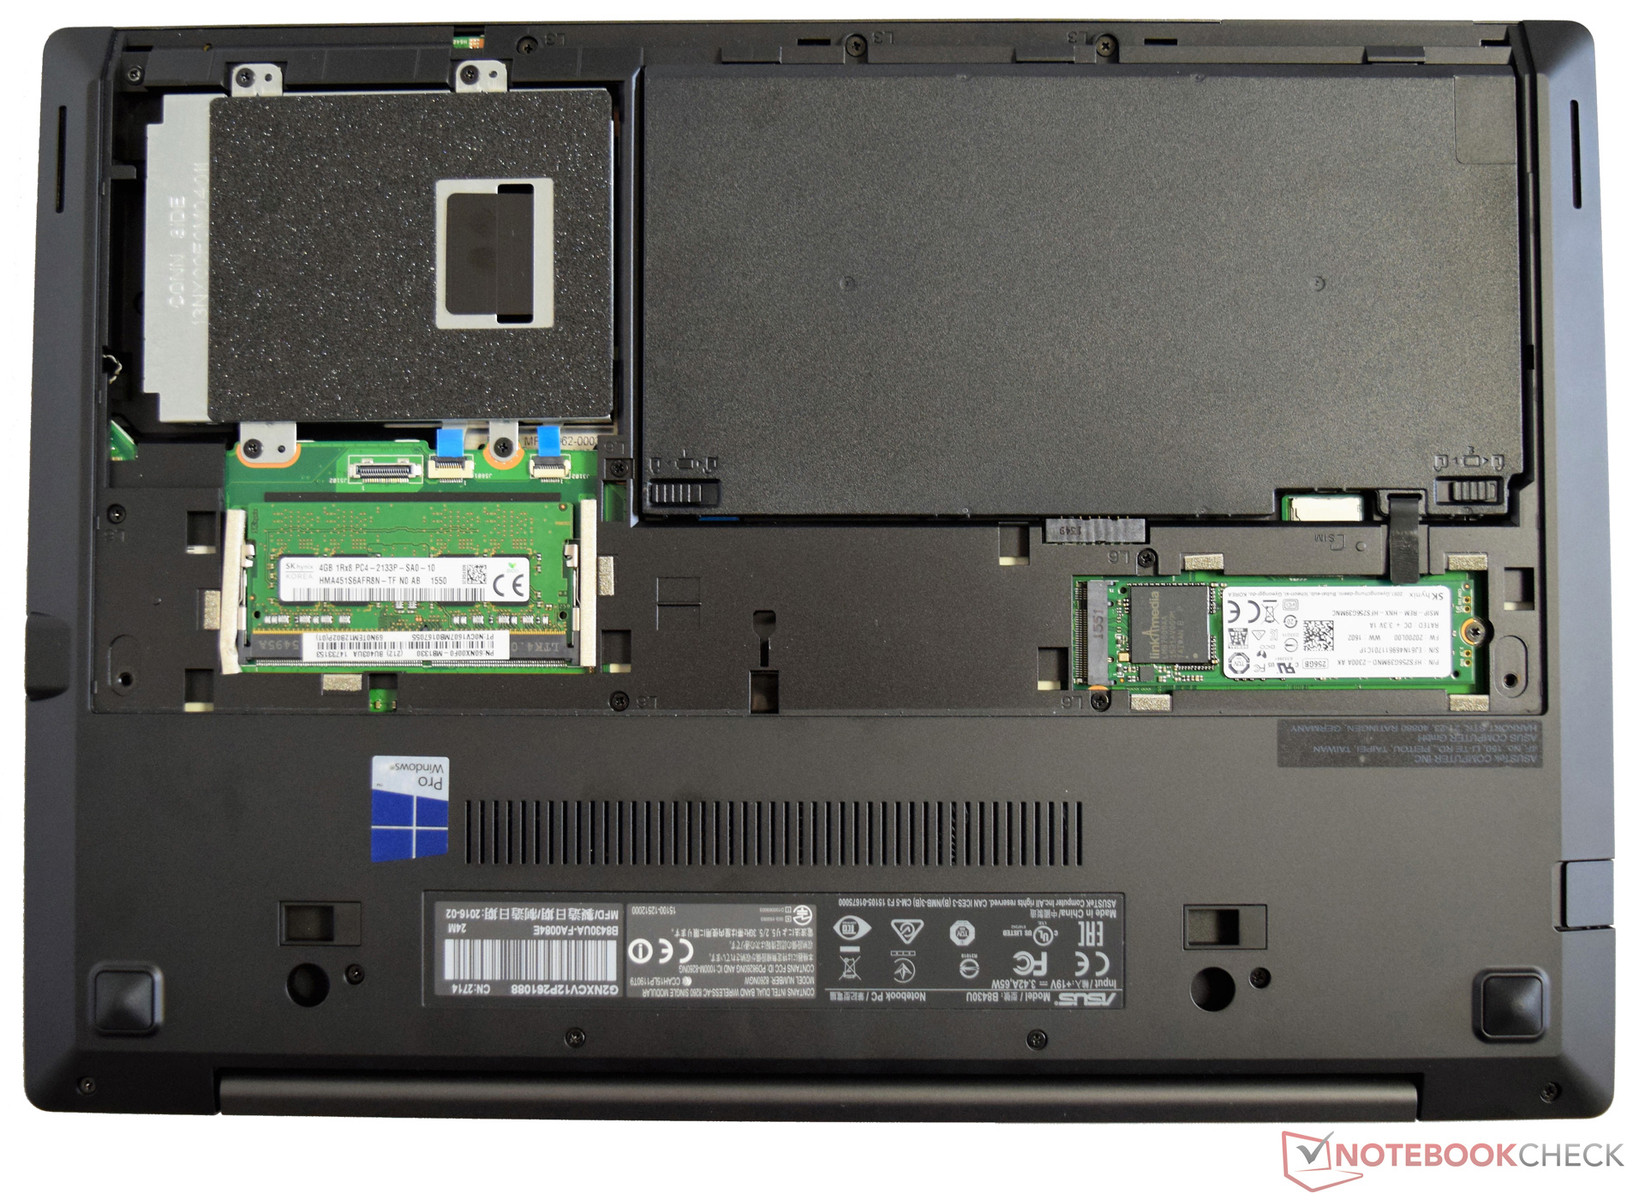
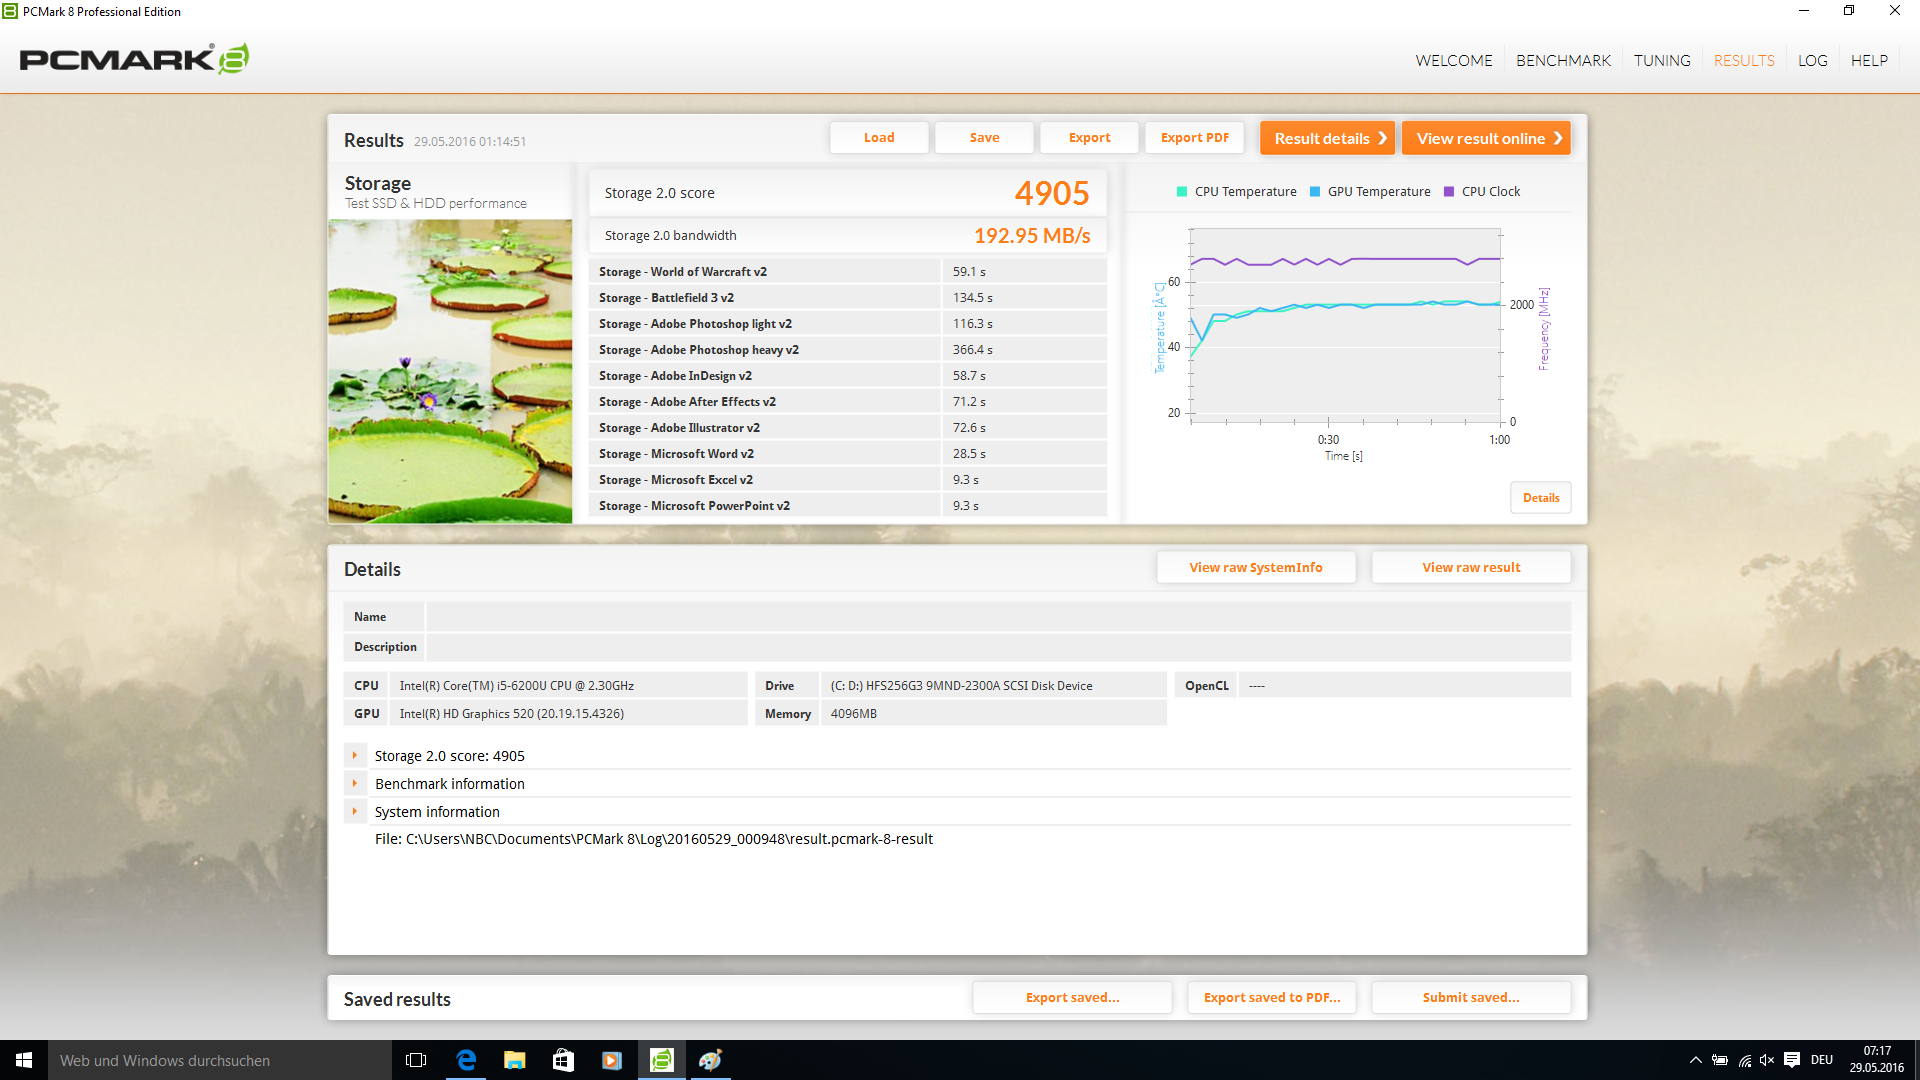
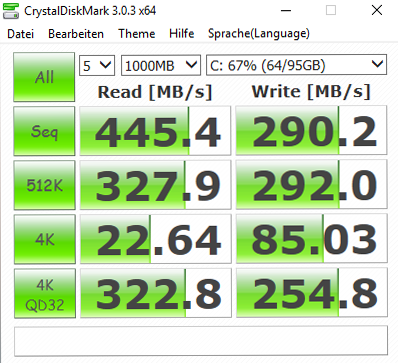
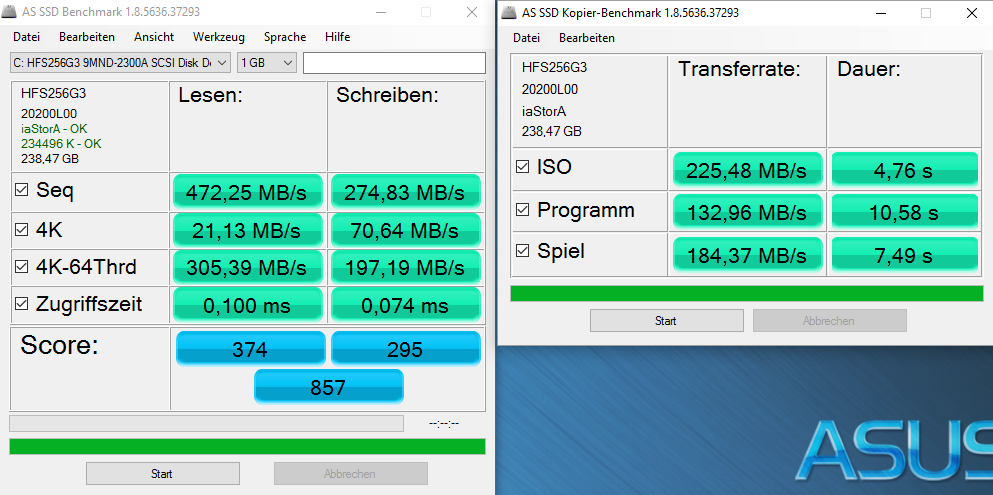
L'AsusPro Advanced B8430UA est un bon 14 pouces professionnel doté d'une très bonne autonomie. Grâce à des composants au goût du jour, les performances en nette hausse. Son petit poids assure une bonne mobilité et son prix sous la barre des 1000 euros vont dans son sens. Les performances sont un aspect important dans le choix d'un appareil lorsque ce dernier endosse le rôle de compagnon au quotidien. Le choix d'opter pour un SSD a un sens, il s'agit du composant qui agit le plus sur la sensation subjective de performance.
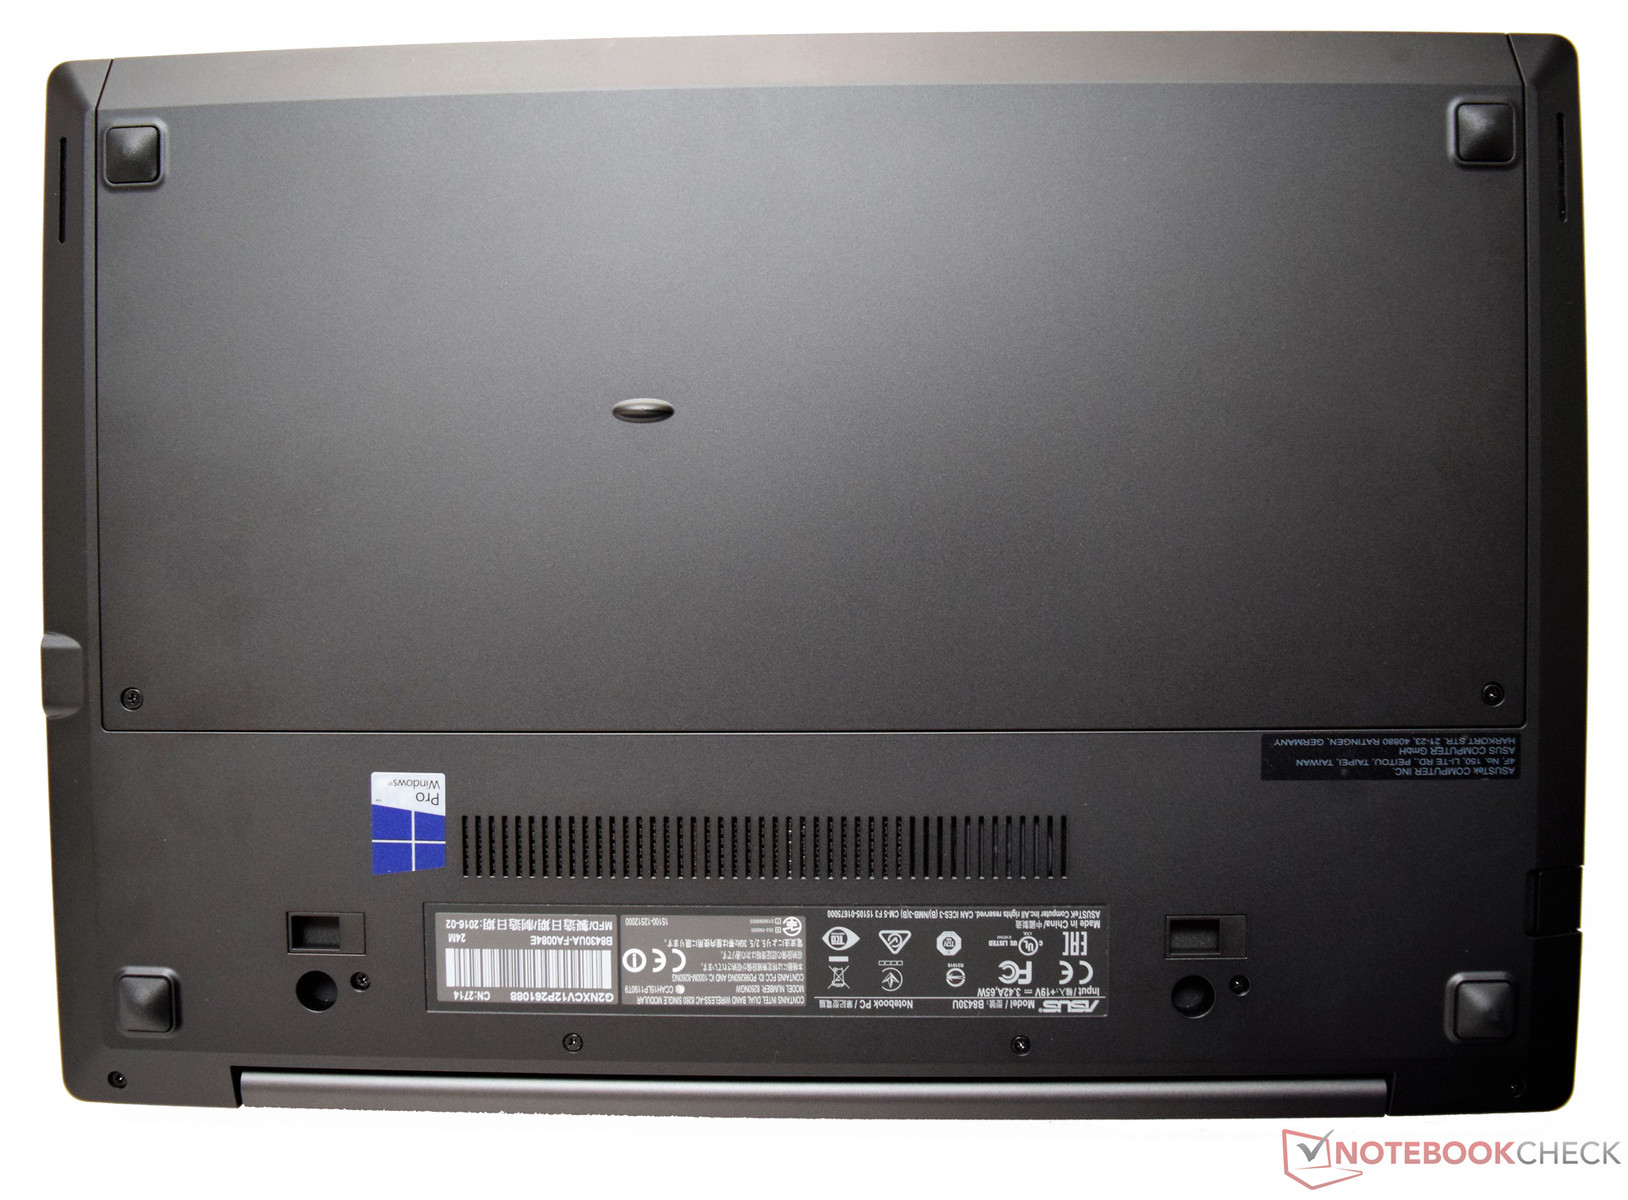
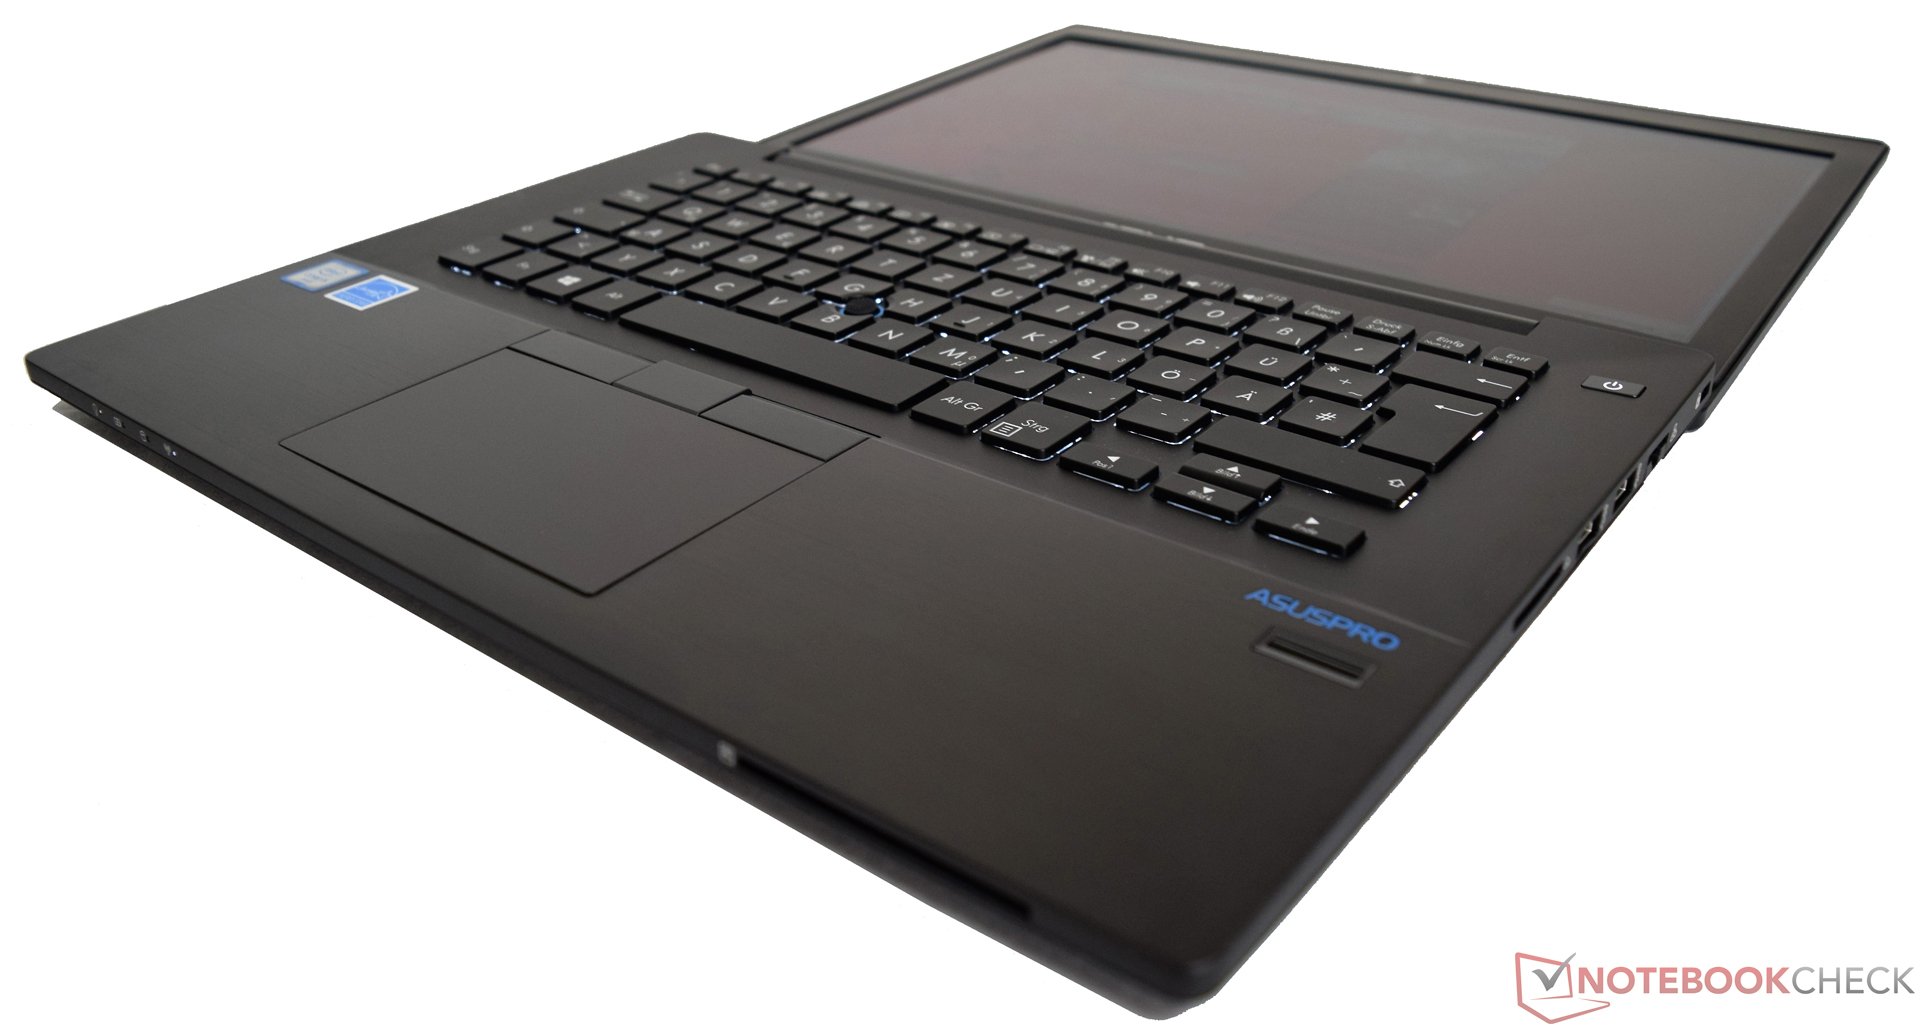
Du haut de son châssis relativement robuste et discret, l'ensemble risque de faire tourner des têtes avec des composants intéressants pour un prix en-dessous de la barre des 1000 euros.
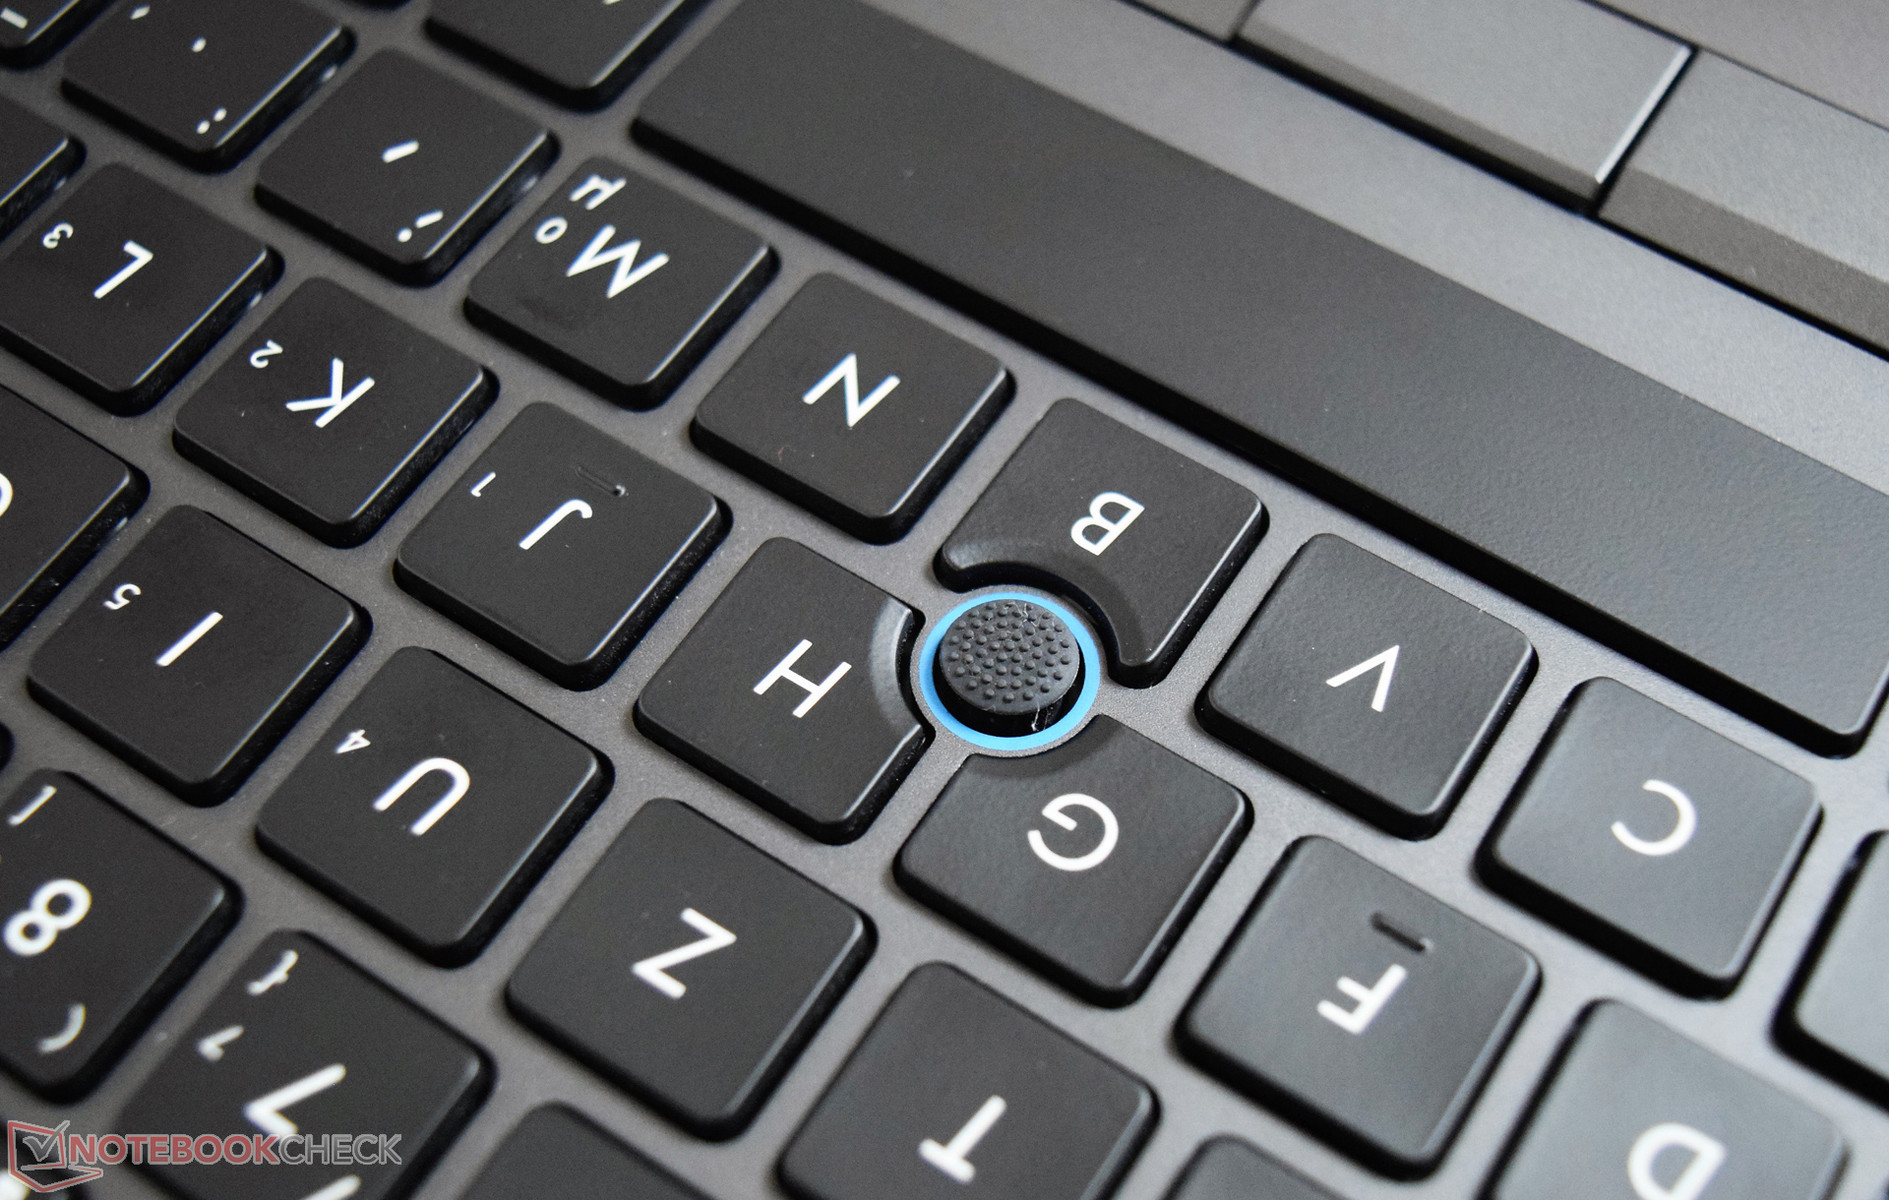
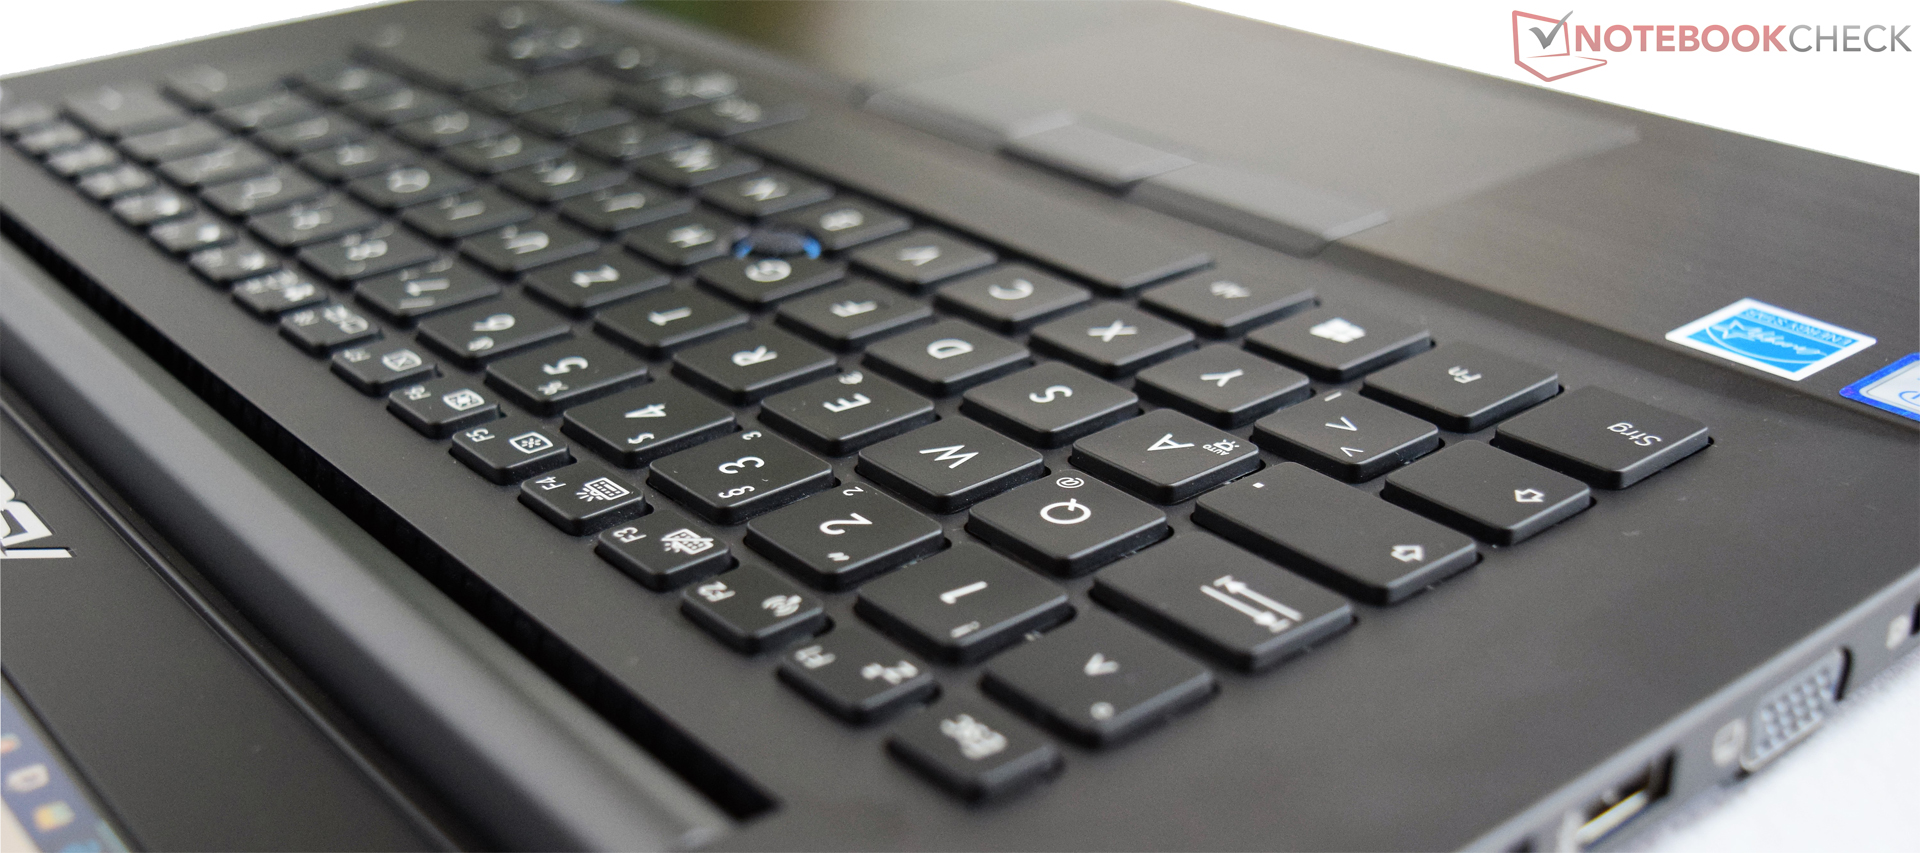
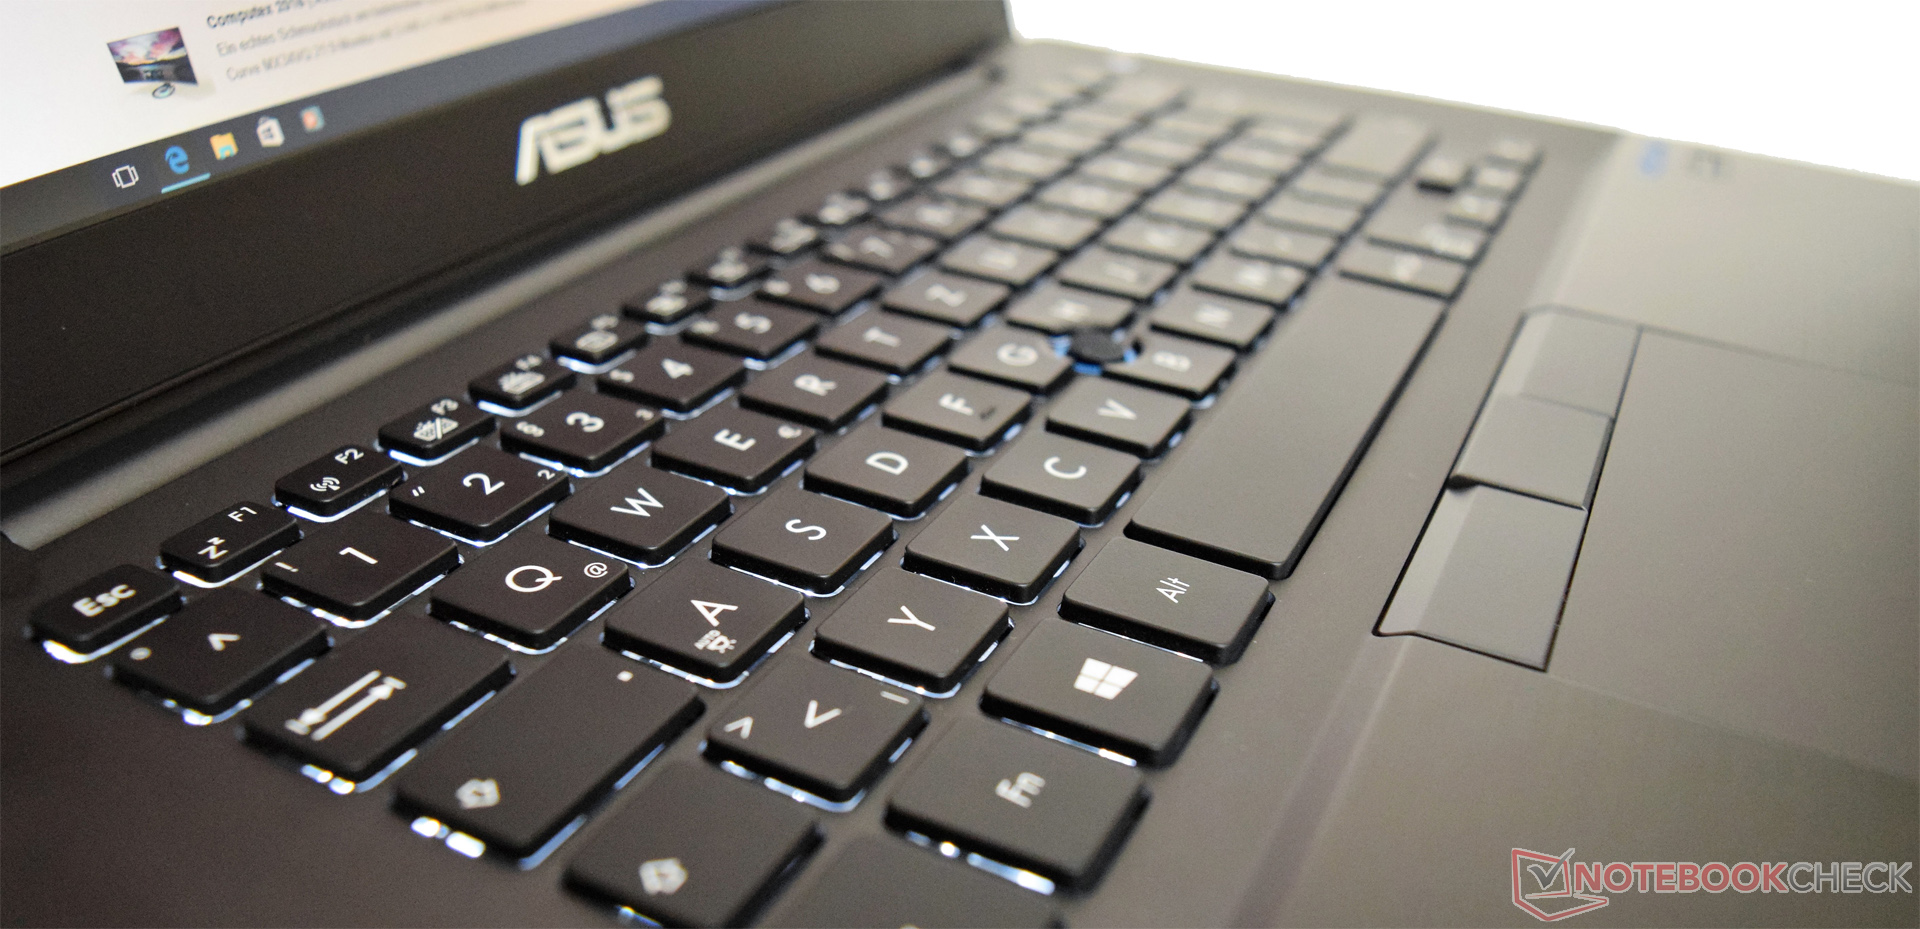
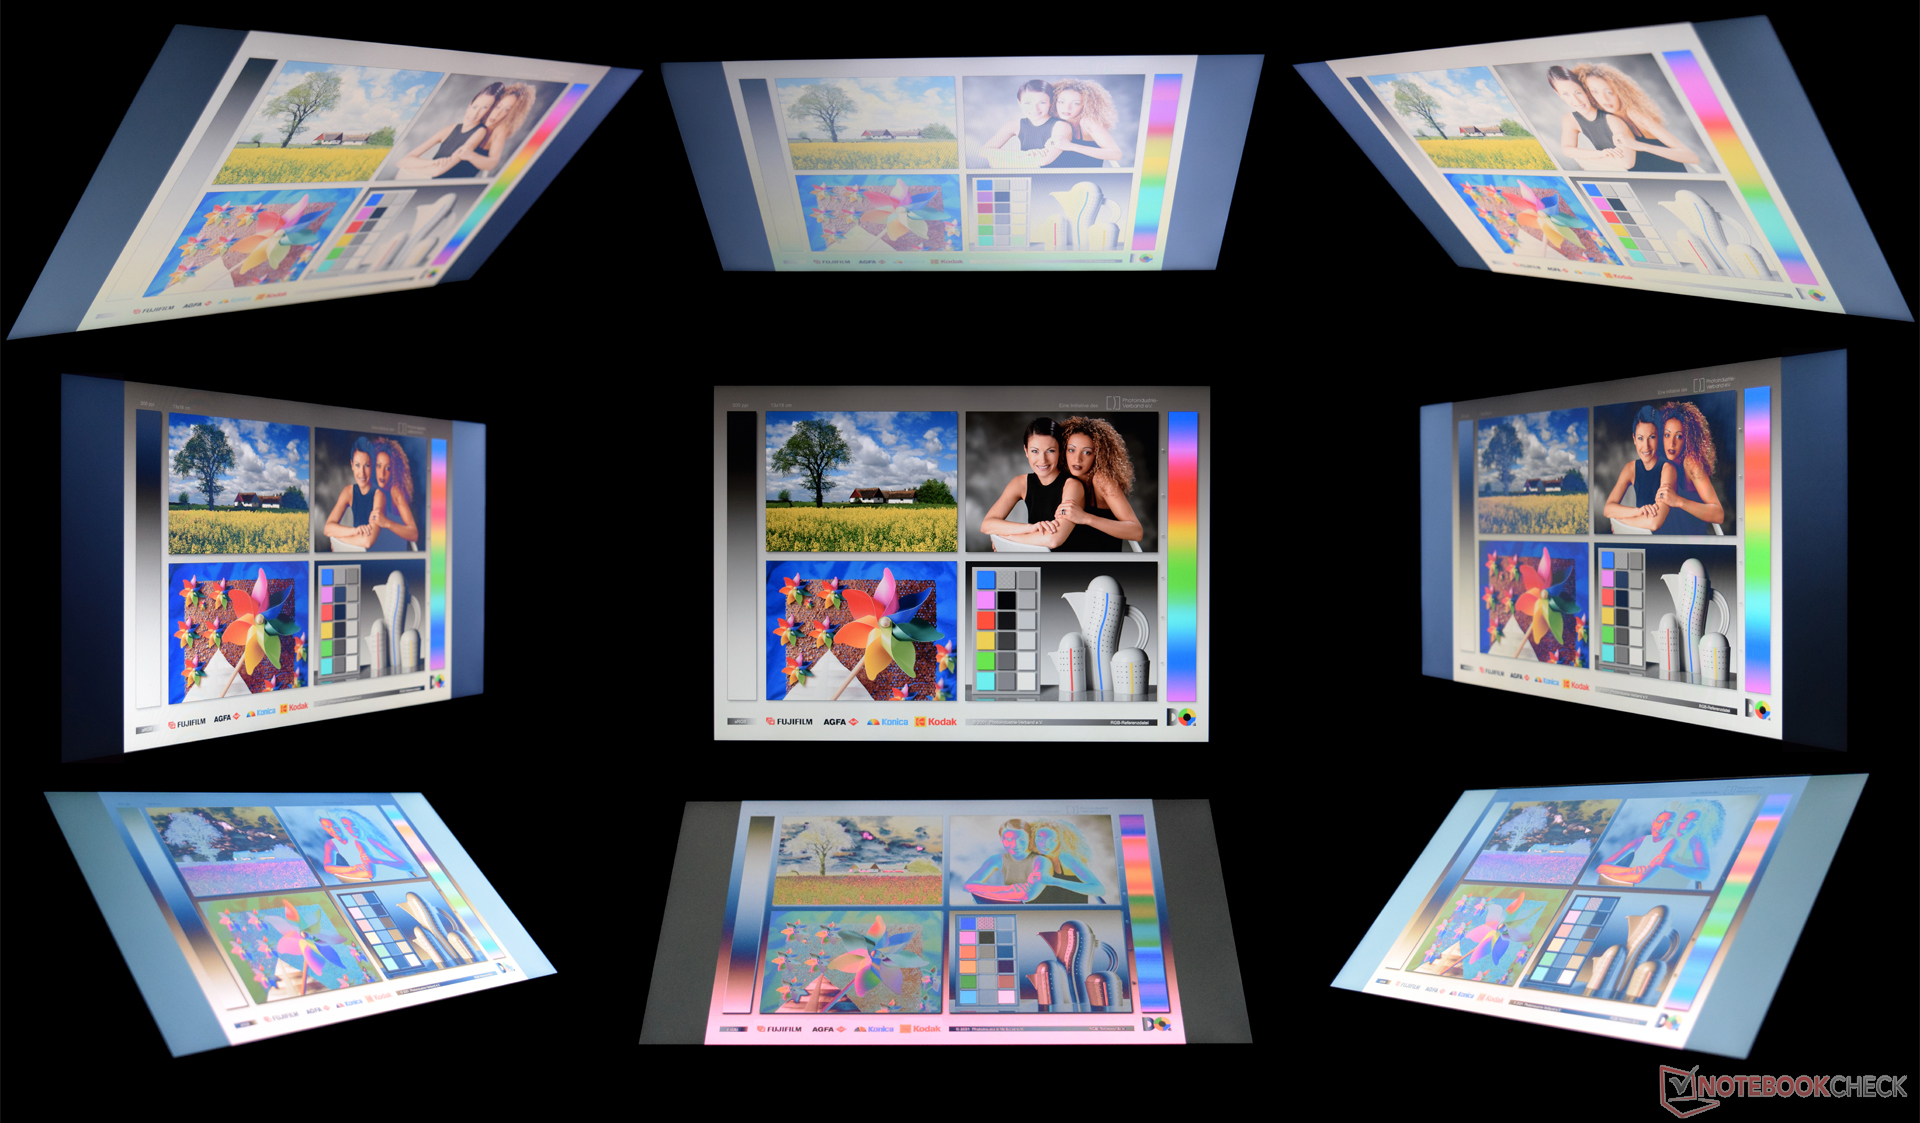
L'écran ne nous a pas totalement convaincus, les angles de vue sont bons malgré la technologie TN mais la luminosité était bien en-dessous de nos attentes. Il en va de même pour les petits haut-parleurs qui n'ont pas su trouver grâce à nos yeux. Les performances sont insuffisantes pour faire tourner des jeux vidéo mais il ne s'agit pas vraiment de l'environnement dans lequel cet appareil se sent intrinsèquement à l'aise. Il faudra opter pour une machine dotée d'une carte graphique dédiée. Les périphériques d'entrée sont bons tout comme l'autonomie, des points cruciaux pour les aspirations de cet AsusPro Advanced qui se positionne en tant que successeur réussi de l'AsusPro Advanced BU401LA.
Pour plus de détails, vous trouverez la version complète (en anglais) de ce test ici.
Asus ASUSPRO Advanced B8430UA-FA0084E
-
07/03/2016 v5.1(old)
Sebastian Bade
Pricecompare
