 Deutsch
 English
 Español
 Français
 Italiano
 Nederlands
 Polski
 Português
 Русский
 Türkçe
 Svenska
 Chinese
 Magyar
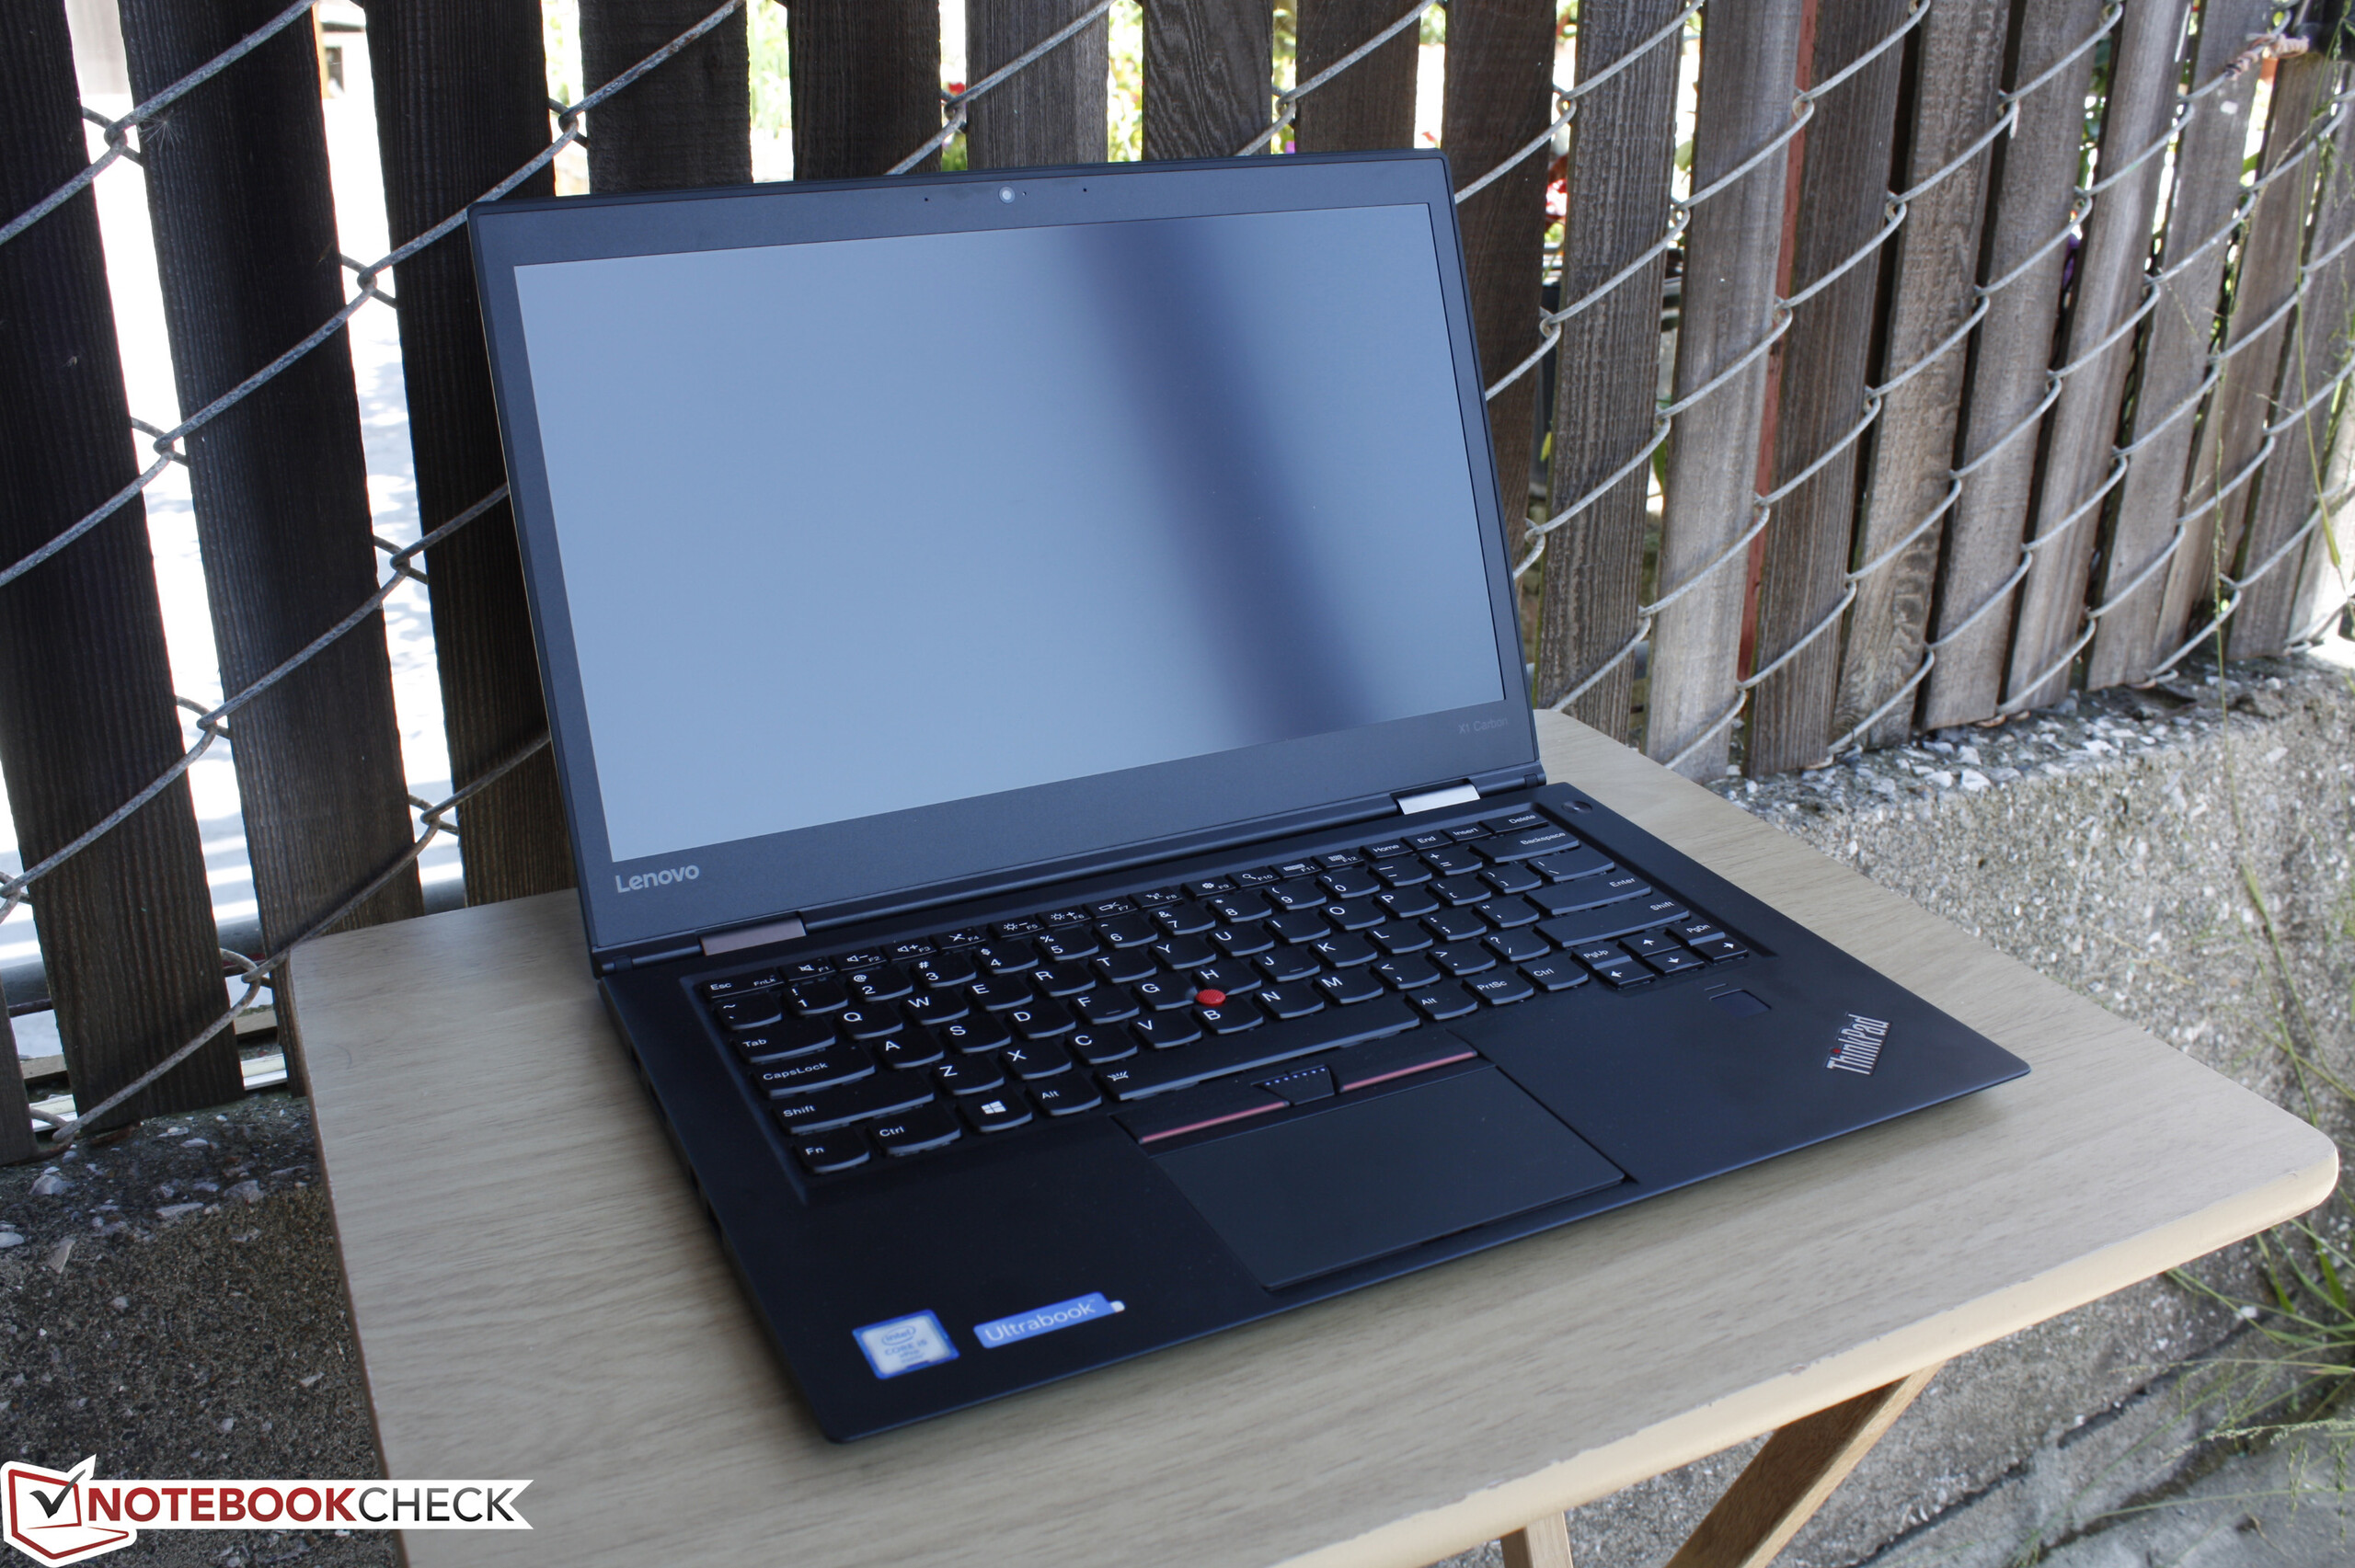
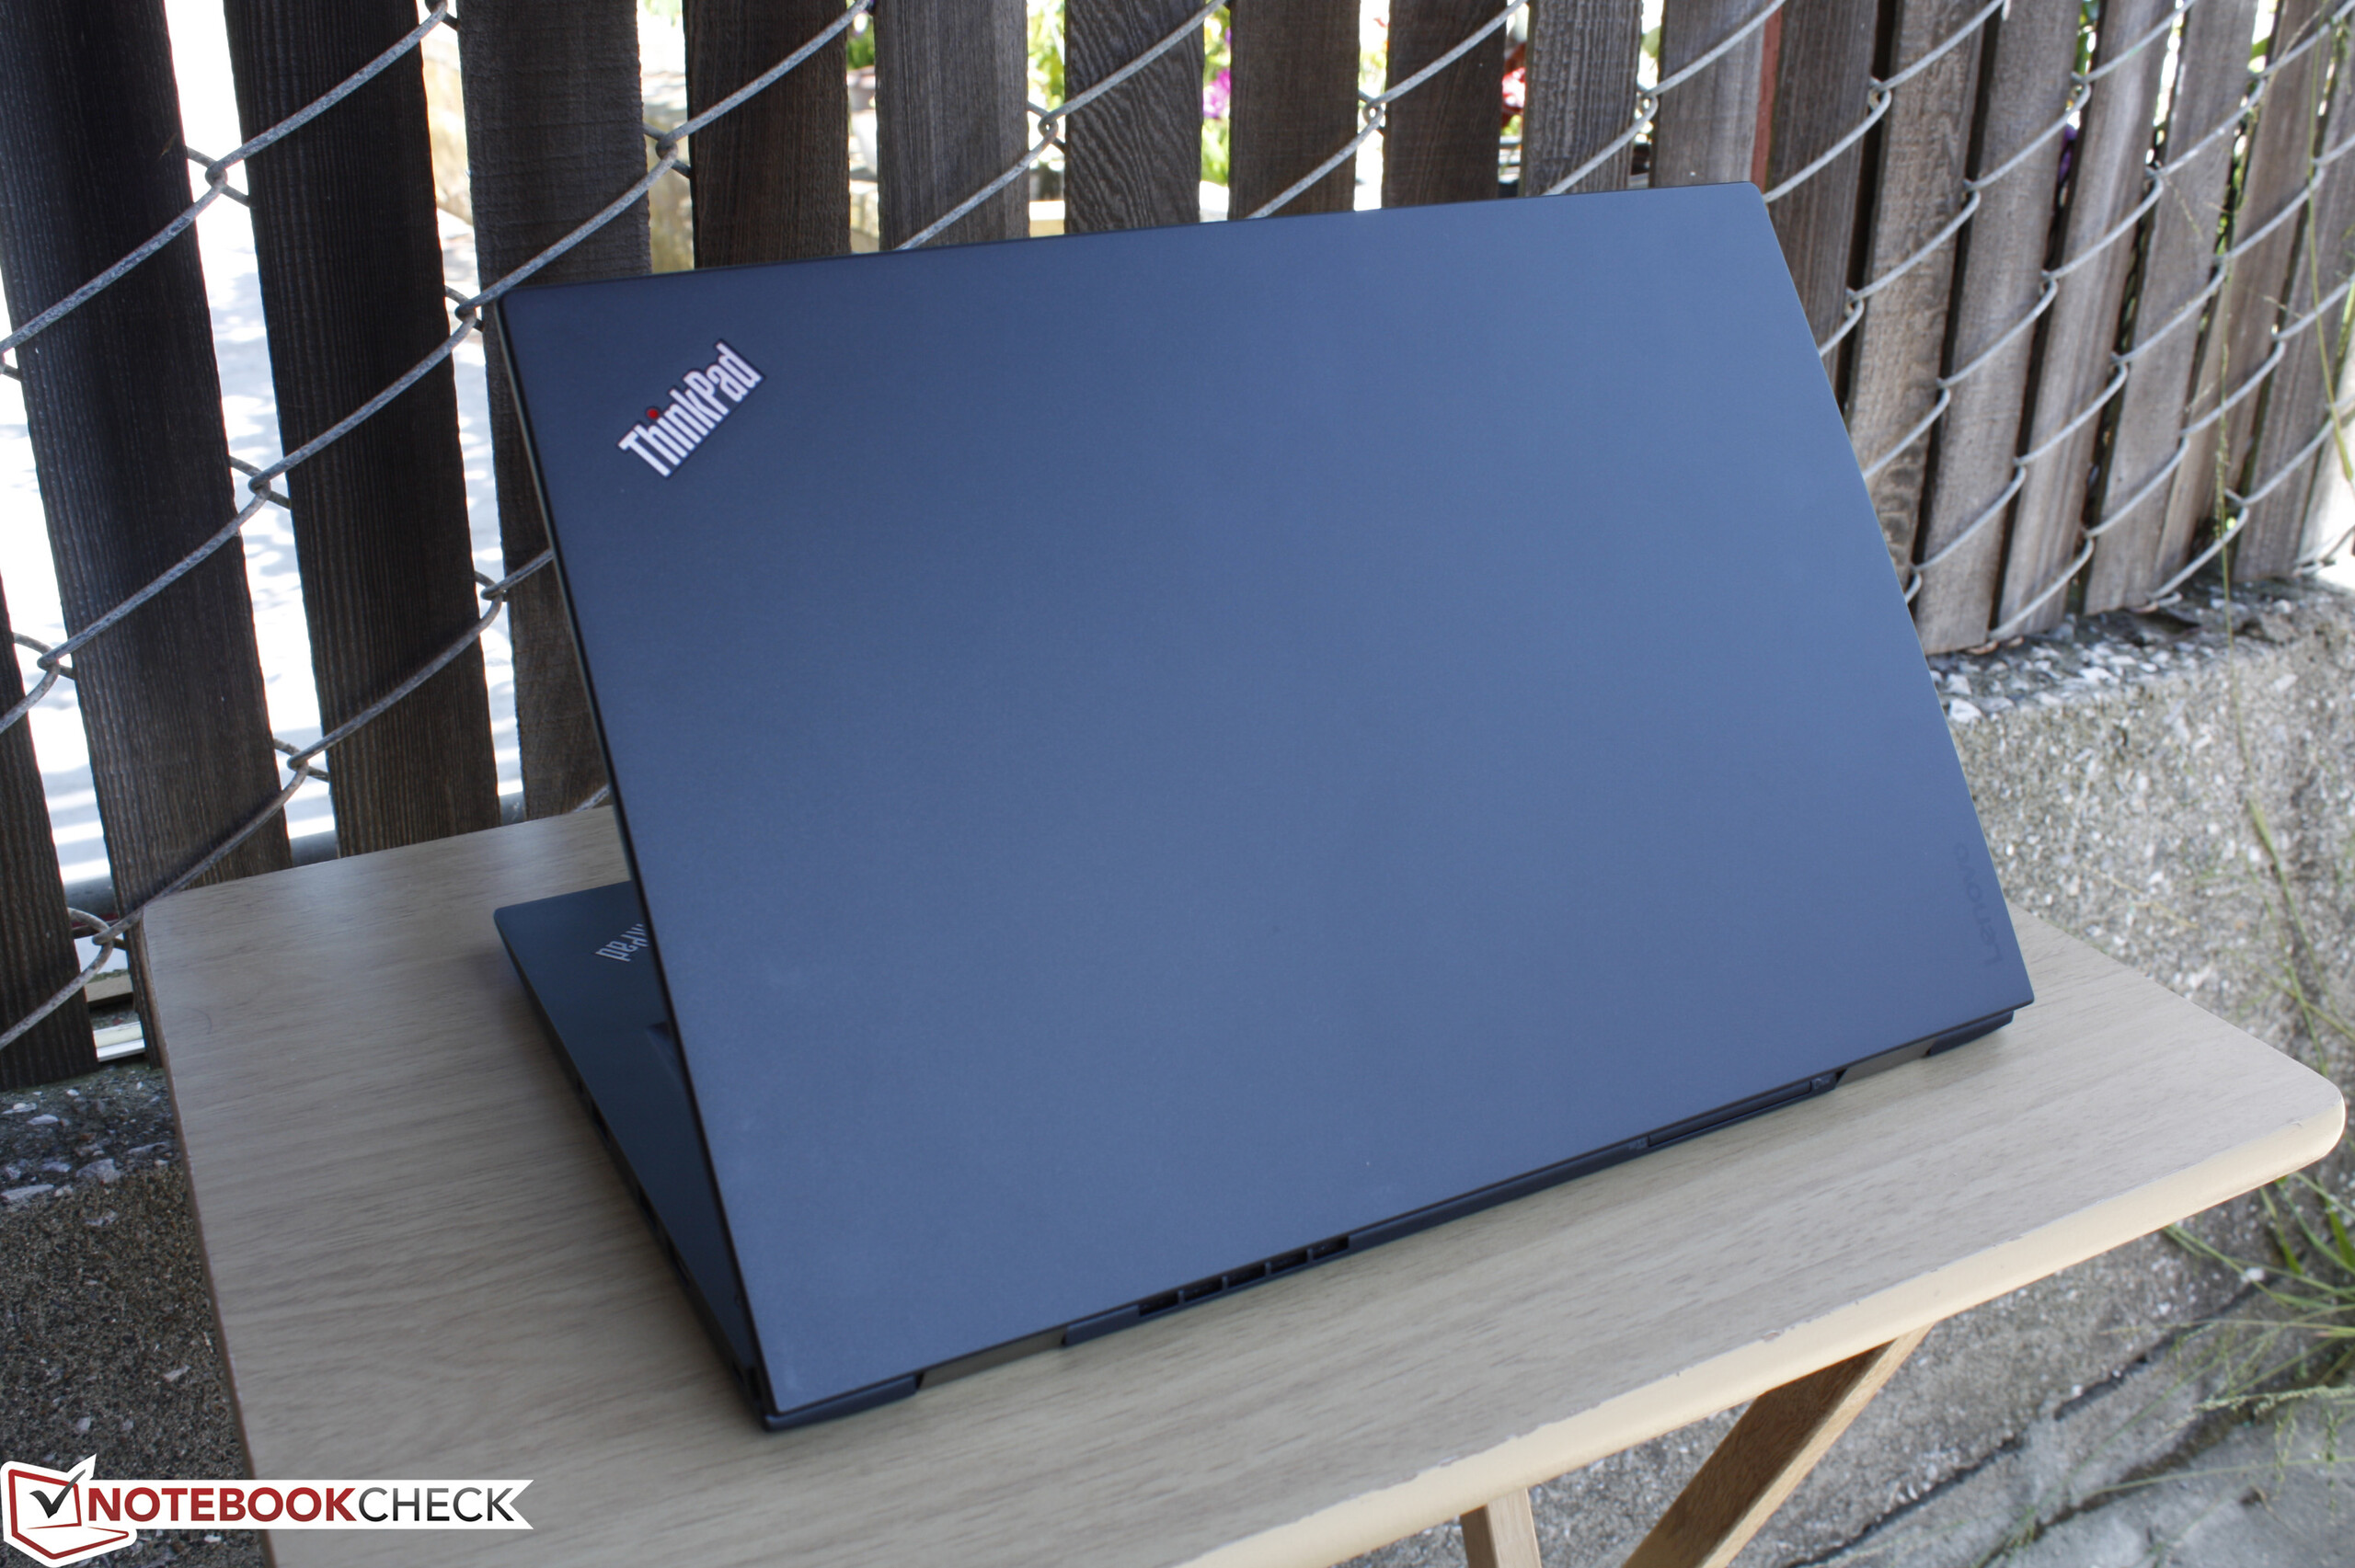
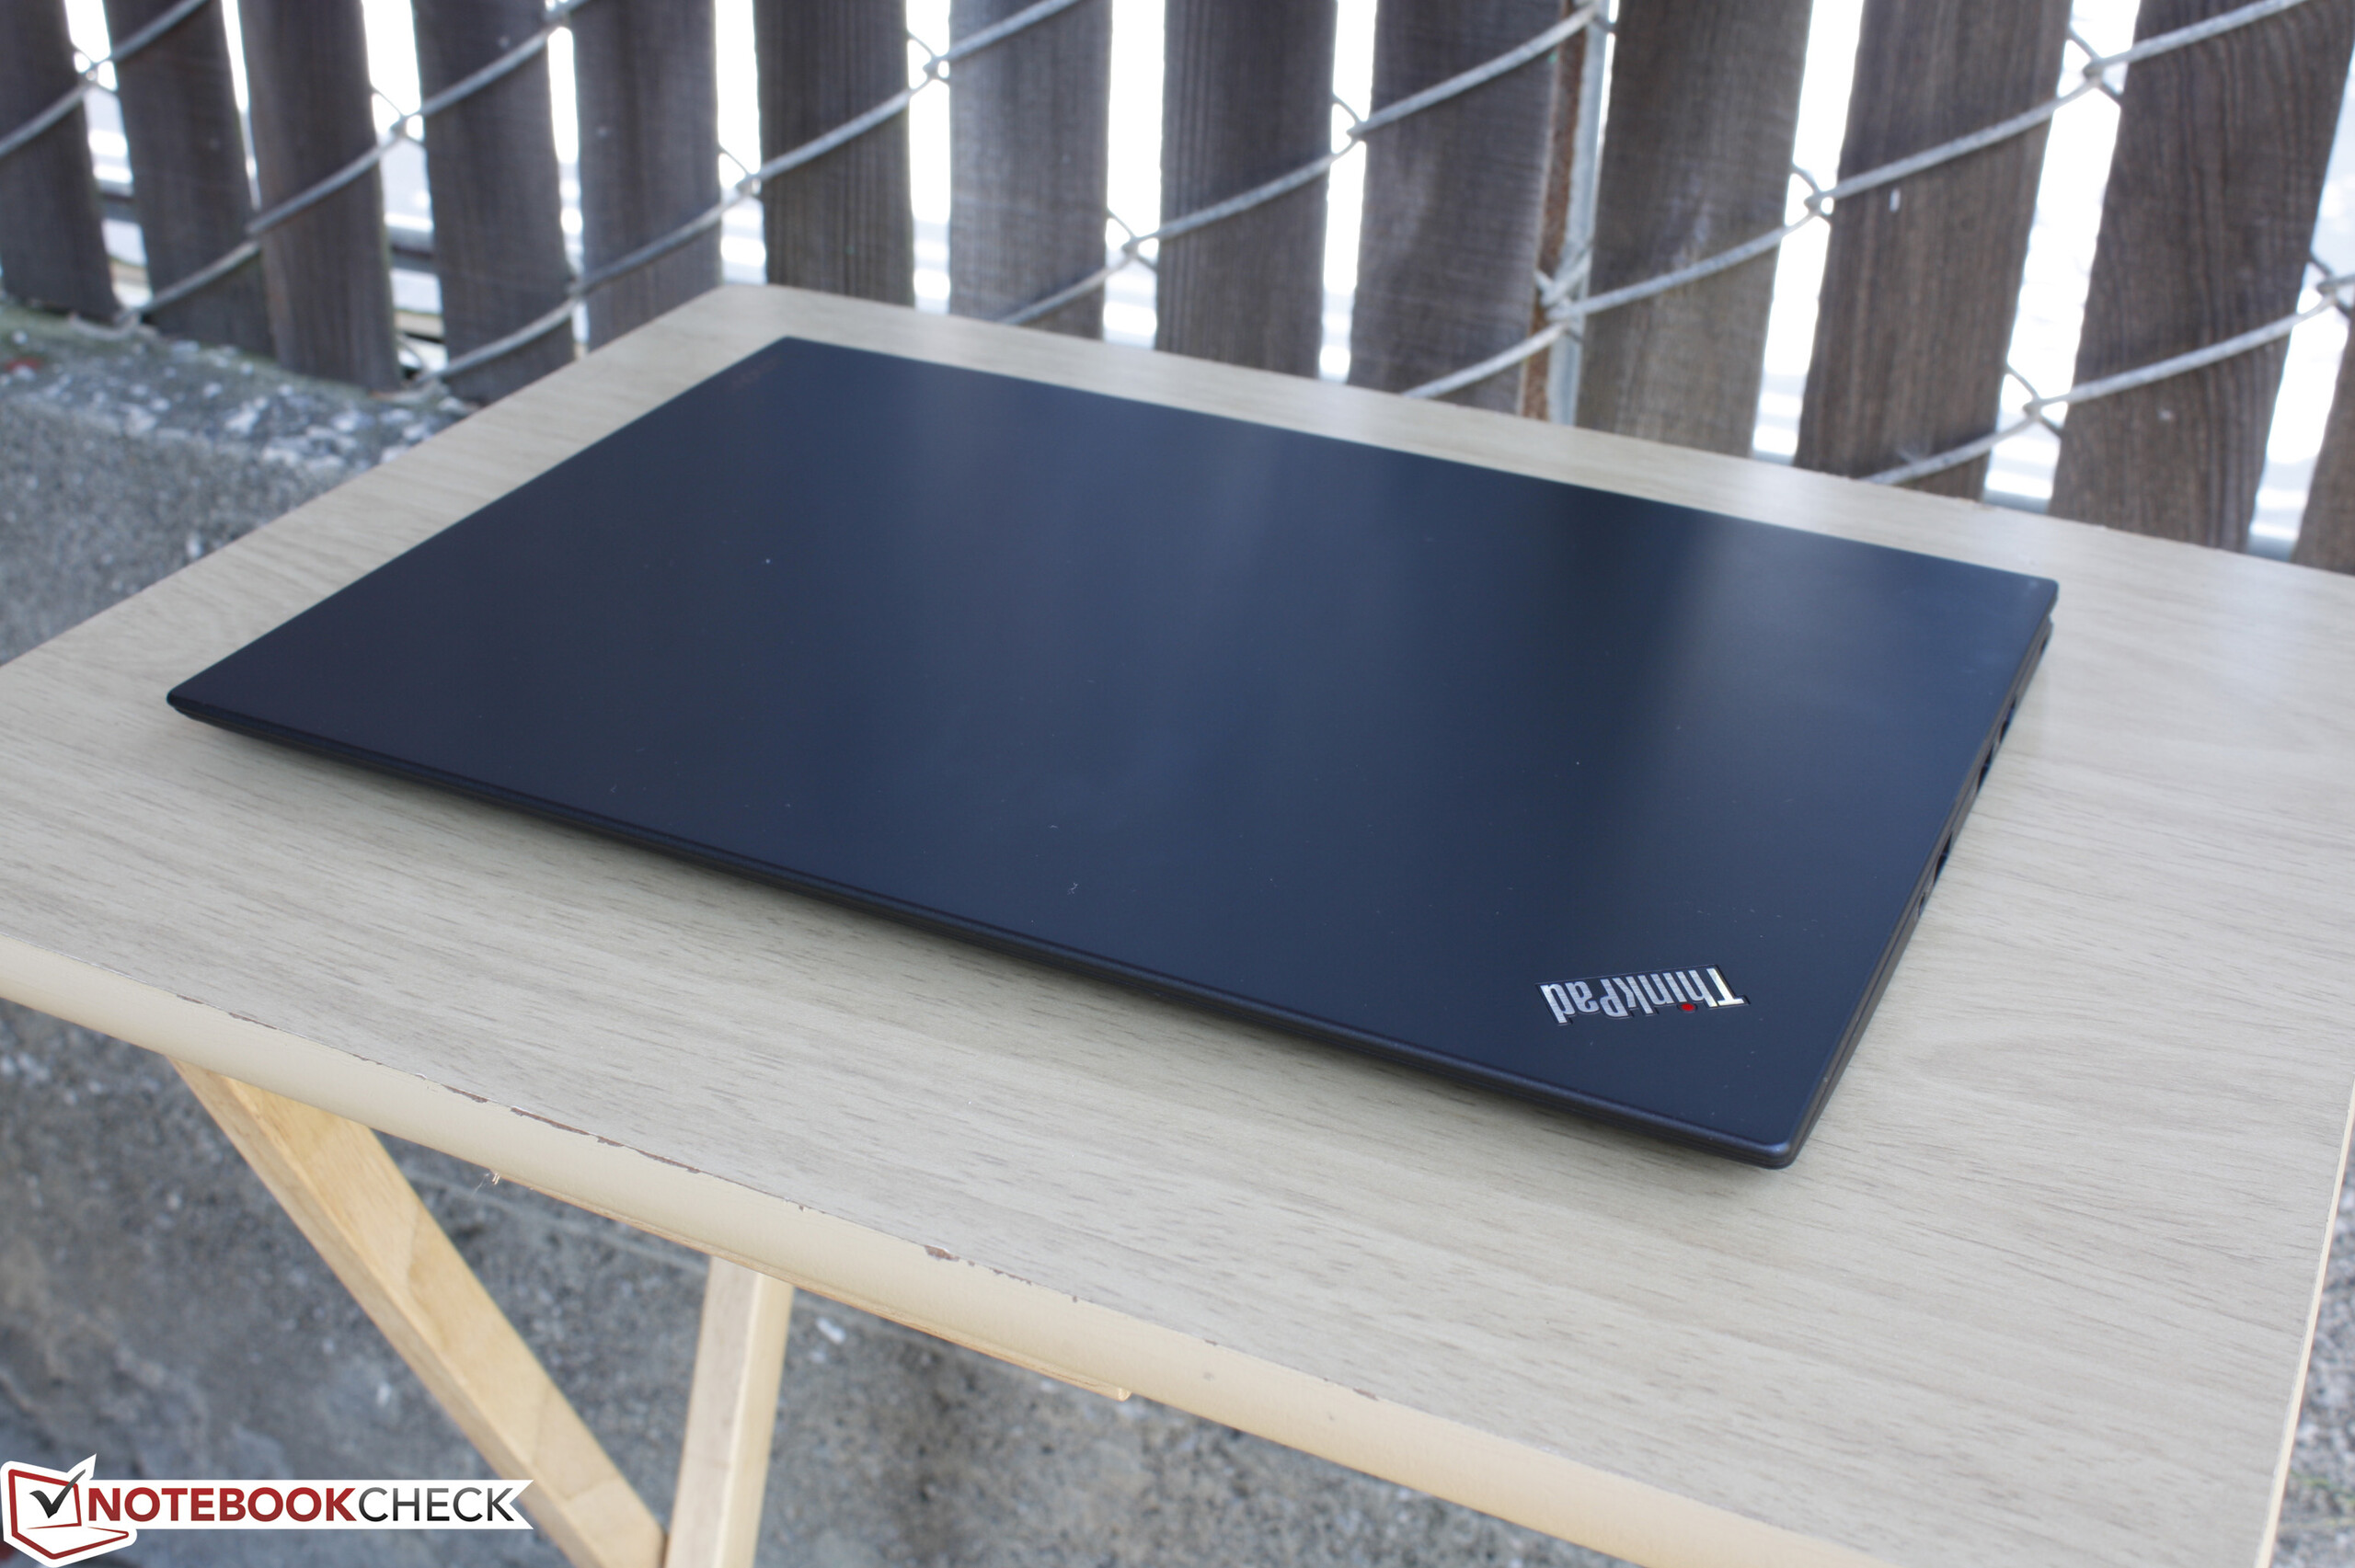
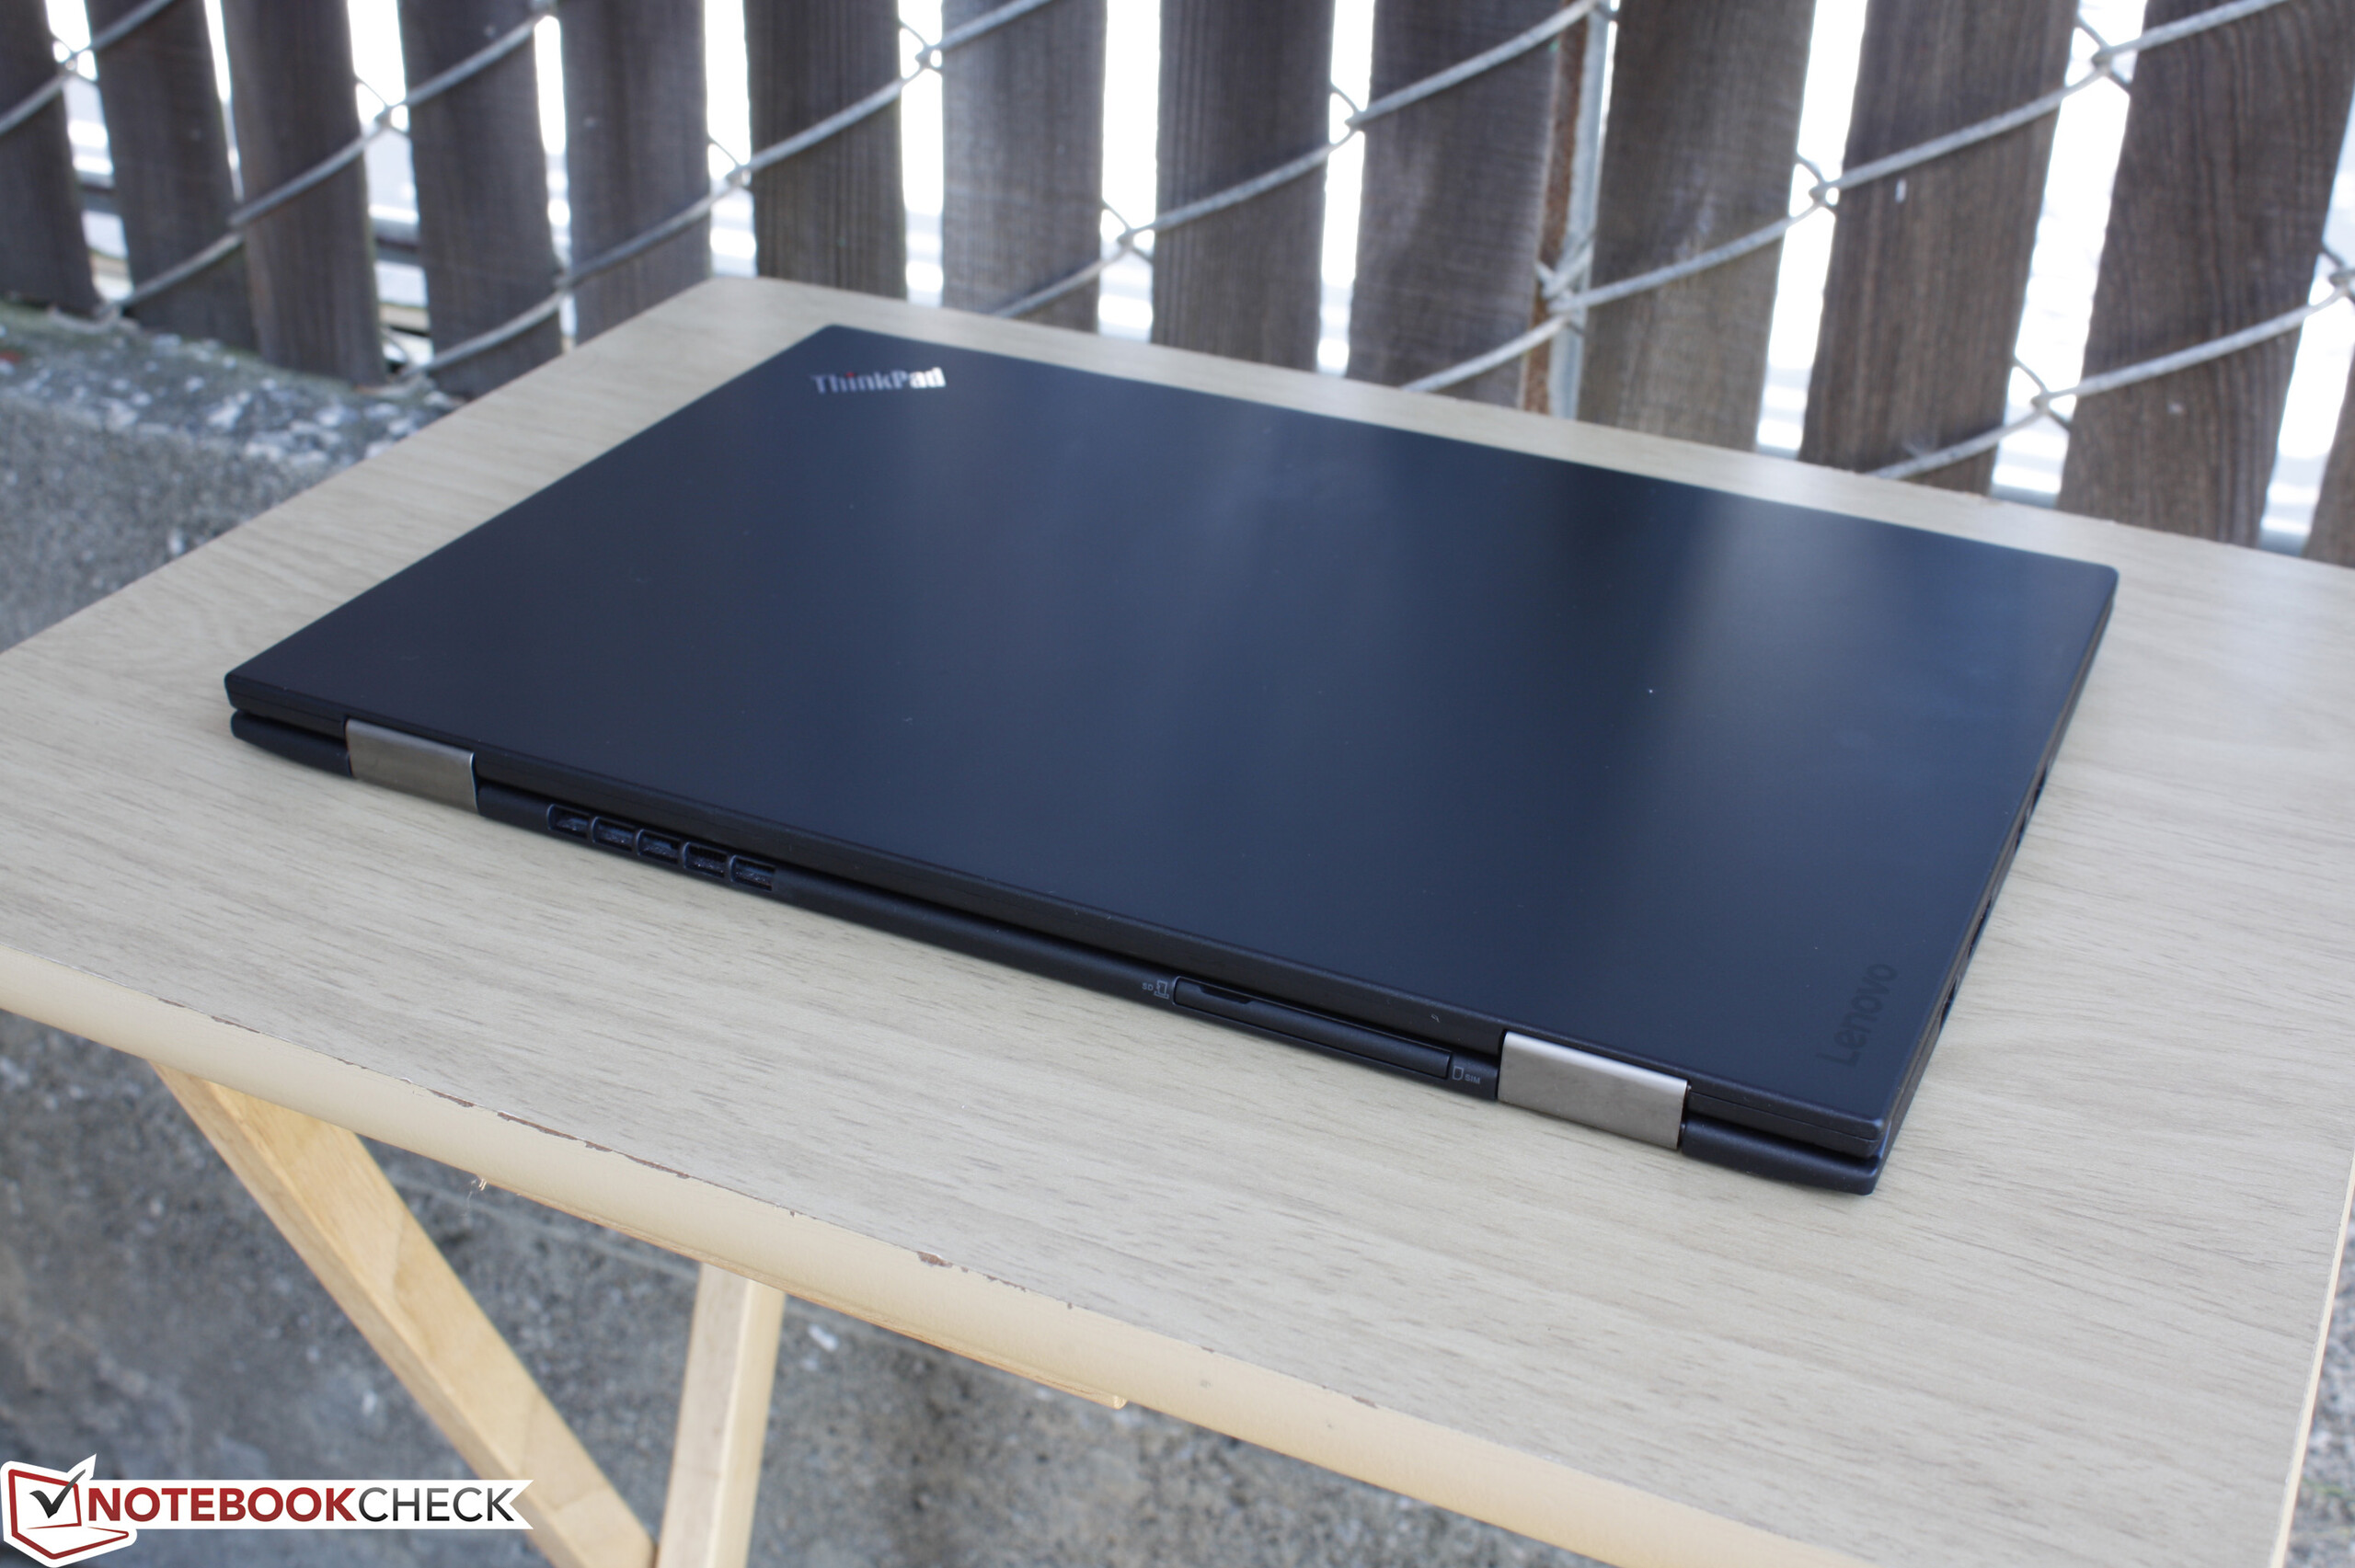
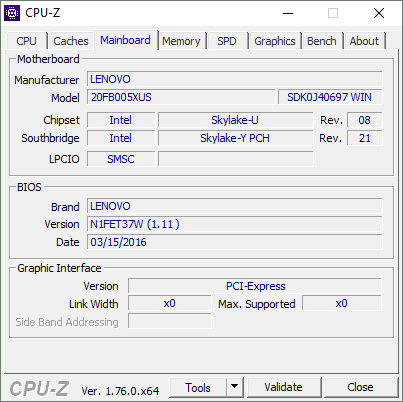
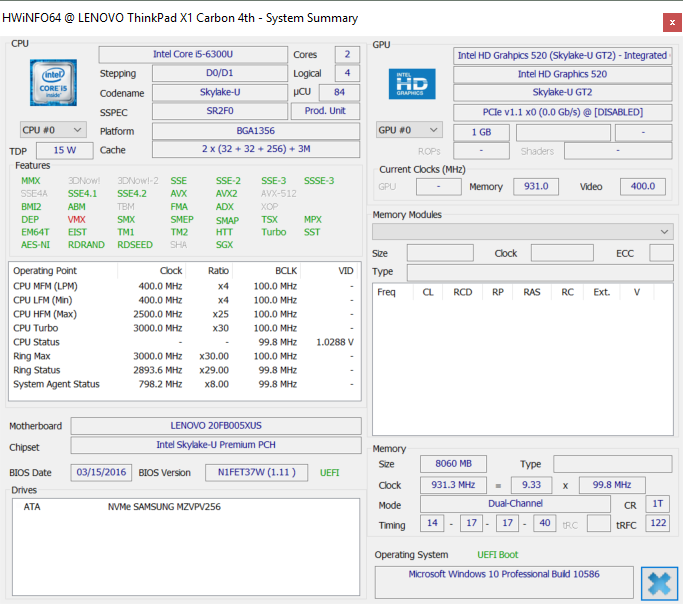
Courte critique du PC portable Lenovo ThinkPad X1 Carbon 20FB-005XUS


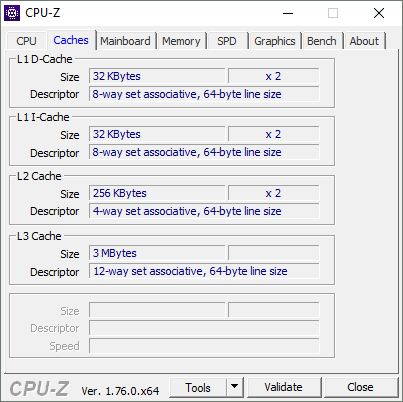
| |||||||||||||||||||||||||
Homogénéité de la luminosité: 89 %
Valeur mesurée au centre, sur batterie: 321.7 cd/m²
Contraste: 1094:1 (Valeurs des noirs: 0.294 cd/m²)
ΔE Color 3.96 | 0.5-29.43 Ø5
ΔE Greyscale 3.15 | 0.57-98 Ø5.3
82.7% sRGB (Argyll 1.6.3 3D)
53.8% AdobeRGB 1998 (Argyll 1.6.3 3D)
60.3% AdobeRGB 1998 (Argyll 2.2.0 3D)
83.1% sRGB (Argyll 2.2.0 3D)
58.9% Display P3 (Argyll 2.2.0 3D)
Gamma: 2.34
| Lenovo ThinkPad X1 Carbon 20FB-005XUS 14.00, 1920x1080 | Lenovo ThinkPad X1 Carbon 20FB003RGE 14.00, 2560x1440 | Lenovo ThinkPad T460s-20FA003GGE 14.00, 2560x1440 | Lenovo Thinkpad X1 Yoga 20FQ-000QUS 14.00, 2560x1440 | HP ProBook 440 G3 14.00, 1920x1080 | |
|---|---|---|---|---|---|
| Display | 13% | 17% | 16% | -31% | |
| Display P3 Coverage | 58.9 | 66.7 13% | 68.7 17% | 68.1 16% | 39.6 -33% |
| sRGB Coverage | 83.1 | 94.7 14% | 98.1 18% | 97.2 17% | 59.1 -29% |
| AdobeRGB 1998 Coverage | 60.3 | 68.4 13% | 70.4 17% | 70.2 16% | 40.94 -32% |
| Response Times | 10% | 10% | 5% | 2% | |
| Response Time Grey 50% / Grey 80% * | 47.2 ? | 44 ? 7% | 35.6 ? 25% | 38 ? 19% | 46 ? 3% |
| Response Time Black / White * | 27.6 ? | 24 ? 13% | 29.2 ? -6% | 30.4 ? -10% | 27.6 ? -0% |
| PWM Frequency | 220 ? | 220 ? | 219 ? | ||
| Screen | 2% | -15% | -27% | -62% | |
| Brightness middle | 321.7 | 272 -15% | 257 -20% | 284.7 -12% | 246 -24% |
| Brightness | 301 | 268 -11% | 248 -18% | 272 -10% | 215 -29% |
| Brightness Distribution | 89 | 95 7% | 94 6% | 89 0% | 84 -6% |
| Black Level * | 0.294 | 0.32 -9% | 0.26 12% | 0.383 -30% | 0.5 -70% |
| Contrast | 1094 | 850 -22% | 988 -10% | 743 -32% | 492 -55% |
| Colorchecker dE 2000 * | 3.96 | 2.61 34% | 4.59 -16% | 5.24 -32% | 8.6 -117% |
| Colorchecker dE 2000 max. * | 6.69 | 6.43 4% | 9.72 -45% | 11.22 -68% | |
| Greyscale dE 2000 * | 3.15 | 3.31 -5% | 6.38 -103% | 7.32 -132% | 9.36 -197% |
| Gamma | 2.34 94% | 2.35 94% | 2.51 88% | 2.22 99% | 2.39 92% |
| CCT | 7082 92% | 6360 102% | 6238 104% | 6277 104% | 11226 58% |
| Color Space (Percent of AdobeRGB 1998) | 53.8 | 63 17% | 65 21% | 70.17 30% | 37.8 -30% |
| Color Space (Percent of sRGB) | 82.7 | 95 15% | 98 19% | 94.68 14% | 59.1 -29% |
| Moyenne finale (programmes/paramètres) | 8% /
5% | 4% /
-6% | -2% /
-14% | -30% /
-46% |
* ... Moindre est la valeur, meilleures sont les performances
Temps de réponse de l'écran
| ↔ Temps de réponse noir à blanc | ||
|---|---|---|
| 27.6 ms ... hausse ↗ et chute ↘ combinées | ↗ 4.4 ms hausse | 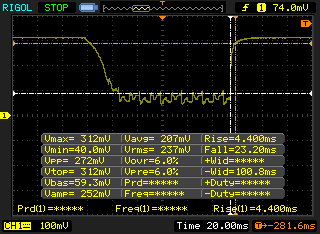 |
| ↘ 23.2 ms chute | ||
| L'écran souffre de latences relativement élevées, insuffisant pour le jeu. En comparaison, tous les appareils testés affichent entre 0.1 (minimum) et 240 (maximum) ms. » 66 % des appareils testés affichent de meilleures performances. Cela signifie que les latences relevées sont moins bonnes que la moyenne (21.5 ms) de tous les appareils testés. | ||
| ↔ Temps de réponse gris 50% à gris 80% | ||
| 47.2 ms ... hausse ↗ et chute ↘ combinées | ↗ 18.8 ms hausse | 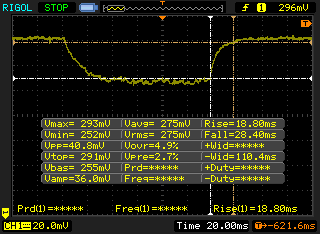 |
| ↘ 28.4 ms chute | ||
| L'écran souffre de latences très élevées, à éviter pour le jeu. En comparaison, tous les appareils testés affichent entre 0.2 (minimum) et 636 (maximum) ms. » 79 % des appareils testés affichent de meilleures performances. Cela signifie que les latences relevées sont moins bonnes que la moyenne (33.7 ms) de tous les appareils testés. | ||
Scintillement / MLI (Modulation de largeur d'impulsion)
| Scintillement / MLI (Modulation de largeur d'impulsion) non décelé | 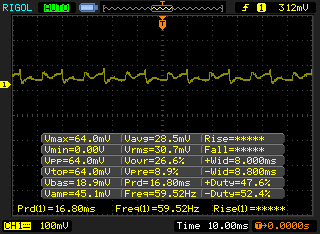 | ||
En comparaison, 53 % des appareils testés n'emploient pas MDI pour assombrir leur écran. Nous avons relevé une moyenne à 17900 (minimum : 5 - maximum : 3846000) Hz dans le cas où une MDI était active. | |||
| Cinebench R15 | |
| CPU Single 64Bit (Classer selon les valeurs) | |
| Lenovo ThinkPad X1 Carbon 20FB-005XUS | |
| Lenovo ThinkPad X1 Carbon 20FB003RGE | |
| Asus GL552VW-DK725T | |
| HP ProBook 430 G3 P4N86EA | |
| Lenovo IdeaPad Z40-59422614 | |
| Toshiba Tecra A50-C1510W10 | |
| CPU Multi 64Bit (Classer selon les valeurs) | |
| Lenovo ThinkPad X1 Carbon 20FB-005XUS | |
| Lenovo ThinkPad X1 Carbon 20FB003RGE | |
| Asus GL552VW-DK725T | |
| HP ProBook 430 G3 P4N86EA | |
| Lenovo IdeaPad Z40-59422614 | |
| Toshiba Tecra A50-C1510W10 | |
| Cinebench R11.5 | |
| CPU Single 64Bit (Classer selon les valeurs) | |
| Lenovo ThinkPad X1 Carbon 20FB-005XUS | |
| Lenovo ThinkPad X1 Carbon 20FB003RGE | |
| Asus GL552VW-DK725T | |
| HP ProBook 430 G3 P4N86EA | |
| Lenovo IdeaPad Z40-59422614 | |
| Toshiba Tecra A50-C1510W10 | |
| CPU Multi 64Bit (Classer selon les valeurs) | |
| Lenovo ThinkPad X1 Carbon 20FB-005XUS | |
| Lenovo ThinkPad X1 Carbon 20FB003RGE | |
| Asus GL552VW-DK725T | |
| HP ProBook 430 G3 P4N86EA | |
| Lenovo IdeaPad Z40-59422614 | |
| Toshiba Tecra A50-C1510W10 | |
| Cinebench R10 | |
| Rendering Multiple CPUs 32Bit (Classer selon les valeurs) | |
| Lenovo ThinkPad X1 Carbon 20FB-005XUS | |
| Lenovo ThinkPad X1 Carbon 20FB003RGE | |
| Asus GL552VW-DK725T | |
| HP ProBook 430 G3 P4N86EA | |
| Lenovo IdeaPad Z40-59422614 | |
| Toshiba Tecra A50-C1510W10 | |
| Rendering Single 32Bit (Classer selon les valeurs) | |
| Lenovo ThinkPad X1 Carbon 20FB-005XUS | |
| Lenovo ThinkPad X1 Carbon 20FB003RGE | |
| Asus GL552VW-DK725T | |
| HP ProBook 430 G3 P4N86EA | |
| Lenovo IdeaPad Z40-59422614 | |
| Toshiba Tecra A50-C1510W10 | |
| wPrime 2.10 - 1024m (Classer selon les valeurs) | |
| Lenovo ThinkPad X1 Carbon 20FB-005XUS | |
| Asus GL552VW-DK725T | |
| HP ProBook 430 G3 P4N86EA | |
| Lenovo IdeaPad Z40-59422614 | |
| Toshiba Tecra A50-C1510W10 | |
| Super Pi Mod 1.5 XS 32M - 32M (Classer selon les valeurs) | |
| Lenovo ThinkPad X1 Carbon 20FB-005XUS | |
| Lenovo ThinkPad X1 Carbon 20FB003RGE | |
| Asus GL552VW-DK725T | |
| HP ProBook 430 G3 P4N86EA | |
| Lenovo IdeaPad Z40-59422614 | |
| Toshiba Tecra A50-C1510W10 | |
| 3DMark 11 - 1280x720 Performance Physics (Classer selon les valeurs) | |
| Lenovo ThinkPad X1 Carbon 20FB-005XUS | |
| Lenovo ThinkPad X1 Carbon 20FB003RGE | |
| Asus GL552VW-DK725T | |
| HP ProBook 430 G3 P4N86EA | |
| Lenovo IdeaPad Z40-59422614 | |
| Toshiba Tecra A50-C1510W10 | |
* ... Moindre est la valeur, meilleures sont les performances
| PCMark 8 | |
| Home Score Accelerated v2 (Classer selon les valeurs) | |
| Lenovo ThinkPad X1 Carbon 20FB-005XUS | |
| Lenovo ThinkPad X1 Carbon 20FB003RGE | |
| HP EliteBook 840 G3 T9X59ET#ABD | |
| Dell Latitude 14 7000 Series E7470 | |
| Lenovo ThinkPad T460s-20FA003GGE | |
| Work Score Accelerated v2 (Classer selon les valeurs) | |
| Lenovo ThinkPad X1 Carbon 20FB-005XUS | |
| Lenovo ThinkPad X1 Carbon 20FB003RGE | |
| HP EliteBook 840 G3 T9X59ET#ABD | |
| Dell Latitude 14 7000 Series E7470 | |
| Lenovo ThinkPad T460s-20FA003GGE | |
| Creative Score Accelerated v2 (Classer selon les valeurs) | |
| Lenovo ThinkPad X1 Carbon 20FB-005XUS | |
| Lenovo ThinkPad X1 Carbon 20FB003RGE | |
| Lenovo ThinkPad T460s-20FA003GGE | |
| PCMark 8 Home Score Accelerated v2 | 3237 points | |
| PCMark 8 Creative Score Accelerated v2 | 3989 points | |
| PCMark 8 Work Score Accelerated v2 | 3944 points | |
Aide | ||
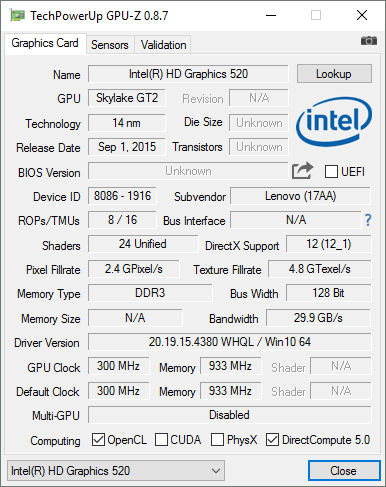
| Lenovo ThinkPad X1 Carbon 20FB-005XUS HD Graphics 520, 6300U, Samsung SM951 MZVPV256 m.2 | HP EliteBook 840 G3 T8X41EA HD Graphics 520, 6600U, Samsung SSD 850 EVO 500GB | Lenovo ThinkPad T460s-20FA003GGE HD Graphics 520, 6600U, Samsung SSD SM951a 512GB M.2 PCIe 3.0 x4 NVMe (MZVKV512) | Lenovo Thinkpad X1 Yoga 20FQ-000QUS HD Graphics 520, 6500U, Samsung SSD PM871 MZNLN512HCJH | Dell Latitude 14 7000 Series E7470 HD Graphics 520, 6600U, Samsung SSD PM851 M.2 2280 256GB | |
|---|---|---|---|---|---|
| AS SSD | -31% | 20% | -45% | -57% | |
| Copy Game MB/s | 598 | 791 32% | 236.4 -60% | ||
| Copy Program MB/s | 354.9 | 421.9 19% | 196.5 -45% | ||
| Copy ISO MB/s | 709 | 1135 60% | 258.4 -64% | ||
| Score Total | 1976 | 1125 -43% | 2439 23% | 1068 -46% | 913 -54% |
| Score Write | 552 | 436 -21% | 621 13% | 382 -31% | 283 -49% |
| Score Read | 960 | 447 -53% | 1218 27% | 449 -53% | 417 -57% |
| Access Time Write * | 0.036 | 0.034 6% | 0.033 8% | 0.046 -28% | 0.04 -11% |
| Access Time Read * | 0.043 | 0.053 -23% | 0.041 5% | 0.058 -35% | 0.113 -163% |
| 4K-64 Write | 338.3 | 290.8 -14% | 366 8% | 261.9 -23% | 170 -50% |
| 4K-64 Read | 731 | 355.9 -51% | 968 32% | 369.1 -50% | 336.1 -54% |
| 4K Write | 103.7 | 98.6 -5% | 114.4 10% | 75.7 -27% | 85.1 -18% |
| 4K Read | 43.72 | 41.29 -6% | 45.41 4% | 30.35 -31% | 30.91 -29% |
| Seq Write | 1099 | 464 -58% | 1407 28% | 447.5 -59% | 283.7 -74% |
| Seq Read | 1851 | 498.6 -73% | 2039 10% | 490.1 -74% | 495.5 -73% |
* ... Moindre est la valeur, meilleures sont les performances

| 3DMark 11 Performance | 1396 points | |
| 3DMark Ice Storm Standard Score | 57713 points | |
| 3DMark Cloud Gate Standard Score | 5659 points | |
| 3DMark Fire Strike Score | 772 points | |
Aide | ||
| Bas | Moyen | Élevé | Ultra | |
| BioShock Infinite (2013) | 47.6 | 27.1 | 24.8 | 6.6 |
| Lenovo ThinkPad X1 Carbon 20FB-005XUS HD Graphics 520, 6300U, Samsung SM951 MZVPV256 m.2 | Lenovo ThinkPad X1 Carbon 20FB003RGE HD Graphics 520, 6500U, Samsung SSD PM871 MZNLN256HCHP | HP EliteBook 840 G3 T9X59ET#ABD HD Graphics 520, 6500U, Samsung SSD PM851 256 GB MZNTE256HMHP | Lenovo ThinkPad T460s-20FA003GGE HD Graphics 520, 6600U, Samsung SSD SM951a 512GB M.2 PCIe 3.0 x4 NVMe (MZVKV512) | Lenovo Thinkpad X1 Yoga 20FQ-000QUS HD Graphics 520, 6500U, Samsung SSD PM871 MZNLN512HCJH | Dell Latitude 14 7000 Series E7470 HD Graphics 520, 6600U, Samsung SSD PM851 M.2 2280 256GB | |
|---|---|---|---|---|---|---|
| Noise | -2% | -9% | -1% | 0% | -2% | |
| off / environment * | 28.8 | 29.1 -1% | 31.2 -8% | 29.2 -1% | 28.8 -0% | 31.2 -8% |
| Idle Minimum * | 28.8 | 29.1 -1% | 31.2 -8% | 29.2 -1% | 28.8 -0% | 31.2 -8% |
| Idle Average * | 28.9 | 29.1 -1% | 32.1 -11% | 29.2 -1% | 28.8 -0% | 31.2 -8% |
| Idle Maximum * | 28.9 | 29.1 -1% | 33.1 -15% | 29.2 -1% | 28.8 -0% | 31.2 -8% |
| Load Average * | 35 | 35.6 -2% | 36.2 -3% | 33.7 4% | 35.2 -1% | 31.9 9% |
| Load Maximum * | 35.8 | 38.1 -6% | 37.8 -6% | 38.5 -8% | 35.2 2% | 31.9 11% |
* ... Moindre est la valeur, meilleures sont les performances
Degré de la nuisance sonore
| Au repos |
| 28.8 / 28.9 / 28.9 dB(A) |
| Fortement sollicité |
| 35 / 35.8 dB(A) |
 | ||
30 dB silencieux 40 dB(A) audible 50 dB(A) bruyant |
||
min: | ||
(±) La température maximale du côté supérieur est de 40 °C / 104 F, par rapport à la moyenne de 34.2 °C / 94 F, allant de 21.2 à 62.5 °C pour la classe Office.
(±) Le fond chauffe jusqu'à un maximum de 42.8 °C / 109 F, contre une moyenne de 36.7 °C / 98 F
(+) En utilisation inactive, la température moyenne du côté supérieur est de 24.2 °C / 76 F, par rapport à la moyenne du dispositif de 29.5 °C / 85 F.
(+) Les repose-poignets et le pavé tactile sont plus froids que la température de la peau avec un maximum de 24.6 °C / 76.3 F et sont donc froids au toucher.
(+) La température moyenne de la zone de l'appui-paume de dispositifs similaires était de 27.7 °C / 81.9 F (+3.1 °C / #5.6 F).
| Lenovo ThinkPad X1 Carbon 20FB-005XUS HD Graphics 520, 6300U, Samsung SM951 MZVPV256 m.2 | Lenovo ThinkPad X1 Carbon 20FB003RGE HD Graphics 520, 6500U, Samsung SSD PM871 MZNLN256HCHP | HP EliteBook 840 G3 T9X59ET#ABD HD Graphics 520, 6500U, Samsung SSD PM851 256 GB MZNTE256HMHP | Lenovo ThinkPad T460s-20FA003GGE HD Graphics 520, 6600U, Samsung SSD SM951a 512GB M.2 PCIe 3.0 x4 NVMe (MZVKV512) | Lenovo Thinkpad X1 Yoga 20FQ-000QUS HD Graphics 520, 6500U, Samsung SSD PM871 MZNLN512HCJH | Dell Latitude 14 7000 Series E7470 HD Graphics 520, 6600U, Samsung SSD PM851 M.2 2280 256GB | |
|---|---|---|---|---|---|---|
| Power Consumption | 4% | 15% | -2% | -19% | -2% | |
| Idle Minimum * | 7.6 | 3.8 50% | 3.8 50% | 3.8 50% | 6.82 10% | 5.1 33% |
| Idle Average * | 9 | 7.1 21% | 6.3 30% | 7.1 21% | 8.21 9% | 8.5 6% |
| Idle Maximum * | 9.6 | 7.7 20% | 6.8 29% | 7.8 19% | 17.55 -83% | 10.1 -5% |
| Load Average * | 24.5 | 30.2 -23% | 34.4 -40% | 36.3 -48% | 28.81 -18% | 35.2 -44% |
| Load Maximum * | 30.3 | 44.7 -48% | 28.3 7% | 46 -52% | 34.07 -12% | 31 -2% |
* ... Moindre est la valeur, meilleures sont les performances
| Éteint/en veille | |
| Au repos | |
| Fortement sollicité |
|
| Lenovo ThinkPad X1 Carbon 20FB-005XUS 52 Wh | Lenovo ThinkPad X1 Carbon 20FB003RGE 52 Wh | HP EliteBook 840 G3 T9X59ET#ABD 46 Wh | Lenovo ThinkPad T460s-20FA003GGE 49 Wh | Lenovo Thinkpad X1 Yoga 20FQ-000QUS 52 Wh | |
|---|---|---|---|---|---|
| Autonomie de la batterie | 6% | 20% | -20% | 1% | |
| Reader / Idle | 776 | 942 21% | 1020 31% | 833 7% | 922 19% |
| WiFi v1.3 | 411 | 429 4% | 453 10% | 340 -17% | 356 -13% |
| Load | 123 | 115 -7% | 146 19% | 62 -50% | 120 -2% |
Points positifs
Points négatifs
Avec de solides concurrents tels que le MacBook Air ou le XPS 13, la pression a été rude pour Lenovo. Le dernier modèle semble mieux que jamais et ses options WWAN ne manqueront pas d'attirer beaucoup d'intéressés.
Est-ce que la configuration i5/Full HD permet une autonomie sensiblement plus élevée et une chauffe plus contenue par rapport au modèle Core i7/WQHD ? L'autonomie n'est pas significativement différente mais les températures de surface sont un peu plus basses. C'est toujours quelques degrés de mieux. Ces différences mineures entre les deux références signifient que les utilisateurs peuvent opter pour le modèle plus coûteux pour ses performances, son meilleur rendu des couleurs et un affichage plus dense sans pour autant sacrifier sur l'autonomie.
Les performances du Core i5 sont plus faibles que prévues, en particulier dans les opérations à cœur unique. La différence la plus notable de cette configuration est que la dalle Full HD n'emploie pas de PWM pour le contrôle de luminosité, contrairement à la configuration WQHD. Ainsi, les utilisateurs qui sont sensibles au scintillement d'écran peuvent préférer le modèle Full HD au détriment du processeur.
Pour plus de détails, vous trouverez la version complète (en anglais) de ce test ici.
Lenovo ThinkPad X1 Carbon 20FB-005XUS
-
05/13/2016 v5.1(old)
Allen Ngo
Pricecompare
