 Deutsch
 English
 Español
 Français
 Italiano
 Nederlands
 Polski
 Português
 Русский
 Türkçe
 Svenska
 Chinese
 Magyar
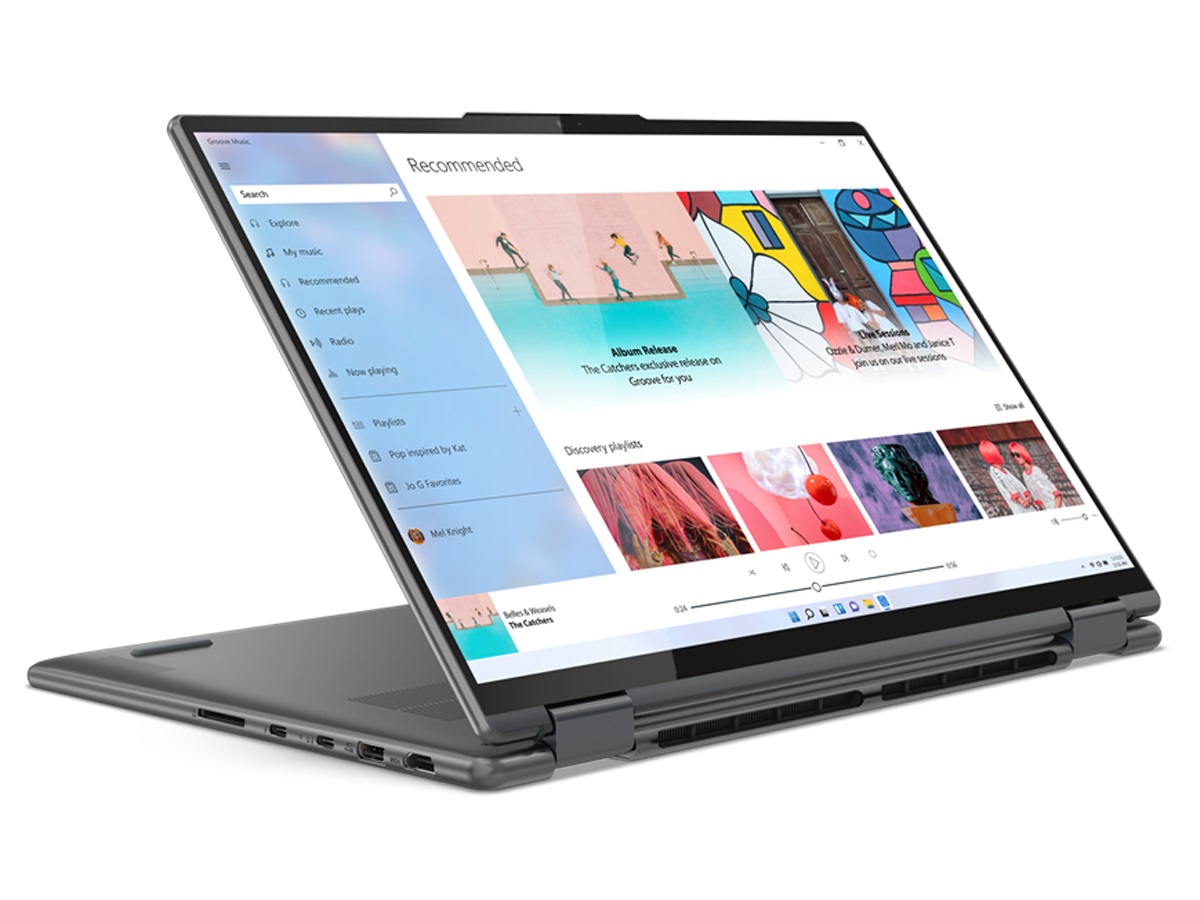
Test du Lenovo Yoga 7 16 Gen 7 : ordinateur portable convertible massif de 16 pouces
Le Lenovo Yoga 7 16IAP7 est un convertible de milieu à haut de gamme et le premier convertible Yoga 16 pouces du fabricant. Il est également remarquable pour être le premier convertible de 16 pouces à avoir des configurations Core i7-1240P, Core i7-1260P, et Core i7-12700H avec l'option Intel Arc A370M gPU discret en option. L'écran tactile est par ailleurs fixé à 2560 x 1600 IPS, sans autre choix.
L'unité que nous avons examinée est l'une des configurations les plus modestes avec le Core i7-1260P et sans carte graphique Intel discrète, pour un prix d'environ 1400 USD. Les alternatives incluent des modèles 16 pouces concurrents comme le Dell Inspiron 16 7620 2-en-1, LG Gram 16 2-en-1ouHuawei MateBook D 16. Il n'y a pas beaucoup de convertibles de 16 pouces sur le marché et le Yoga 7 16IAP7 est donc l'un des rares disponibles.
Plus de commentaires sur Lenovo :
Comparaison avec les concurrents potentiels
Note | Date | Modèle | Poids | Épaisseur | Taille | Résolution | Meilleur prix |
|---|---|---|---|---|---|---|---|
| 88.7 % | 08/22 | Lenovo Yoga 7 16IAP7 i7-1260P, Iris Xe G7 96EUs | 2 kg | 19.2 mm | 16.00" | 2560x1600 | |
| 83.6 % | 07/22 | Huawei MateBook D 16 2022 i7-12700H, Iris Xe G7 96EUs | 1.7 kg | 18.4 mm | 16.00" | 1920x1200 | |
| 85.7 % | 06/22 | Dell Inspiron 16 7620 2-in-1 i7-1260P, Iris Xe G7 96EUs | 2.1 kg | 18.41 mm | 16.00" | 1920x1200 | |
| 86.2 % | 07/22 | Acer Swift X SFX16-51G-5388 i5-11320H, GeForce RTX 3050 4GB Laptop GPU | 1.8 kg | 18.9 mm | 16.10" | 1920x1080 | |
| 86.3 % | 06/21 | LG Gram 16 (2021) i7-1165G7, Iris Xe G7 96EUs | 1.2 kg | 16.8 mm | 16.00" | 2560x1600 | |
| 86.1 % | 09/21 | Lenovo IdeaPad 5 Pro 16ACH R7 5800H, GeForce GTX 1650 Mobile | 2 kg | 17.5 mm | 16.00" | 2560x1600 |
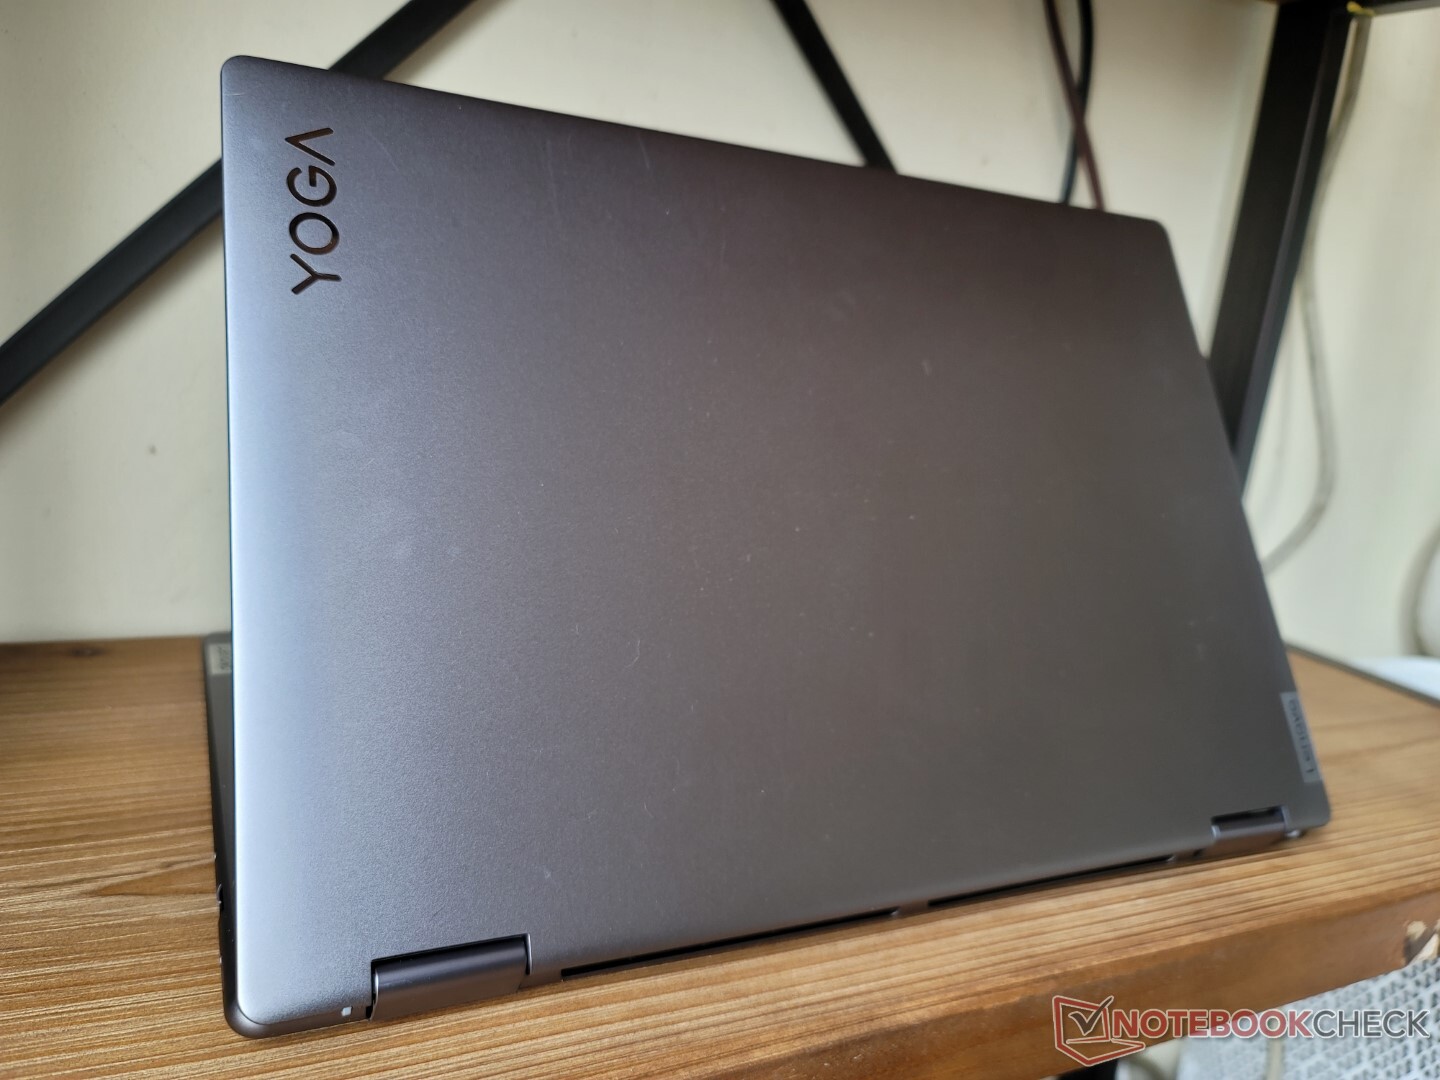
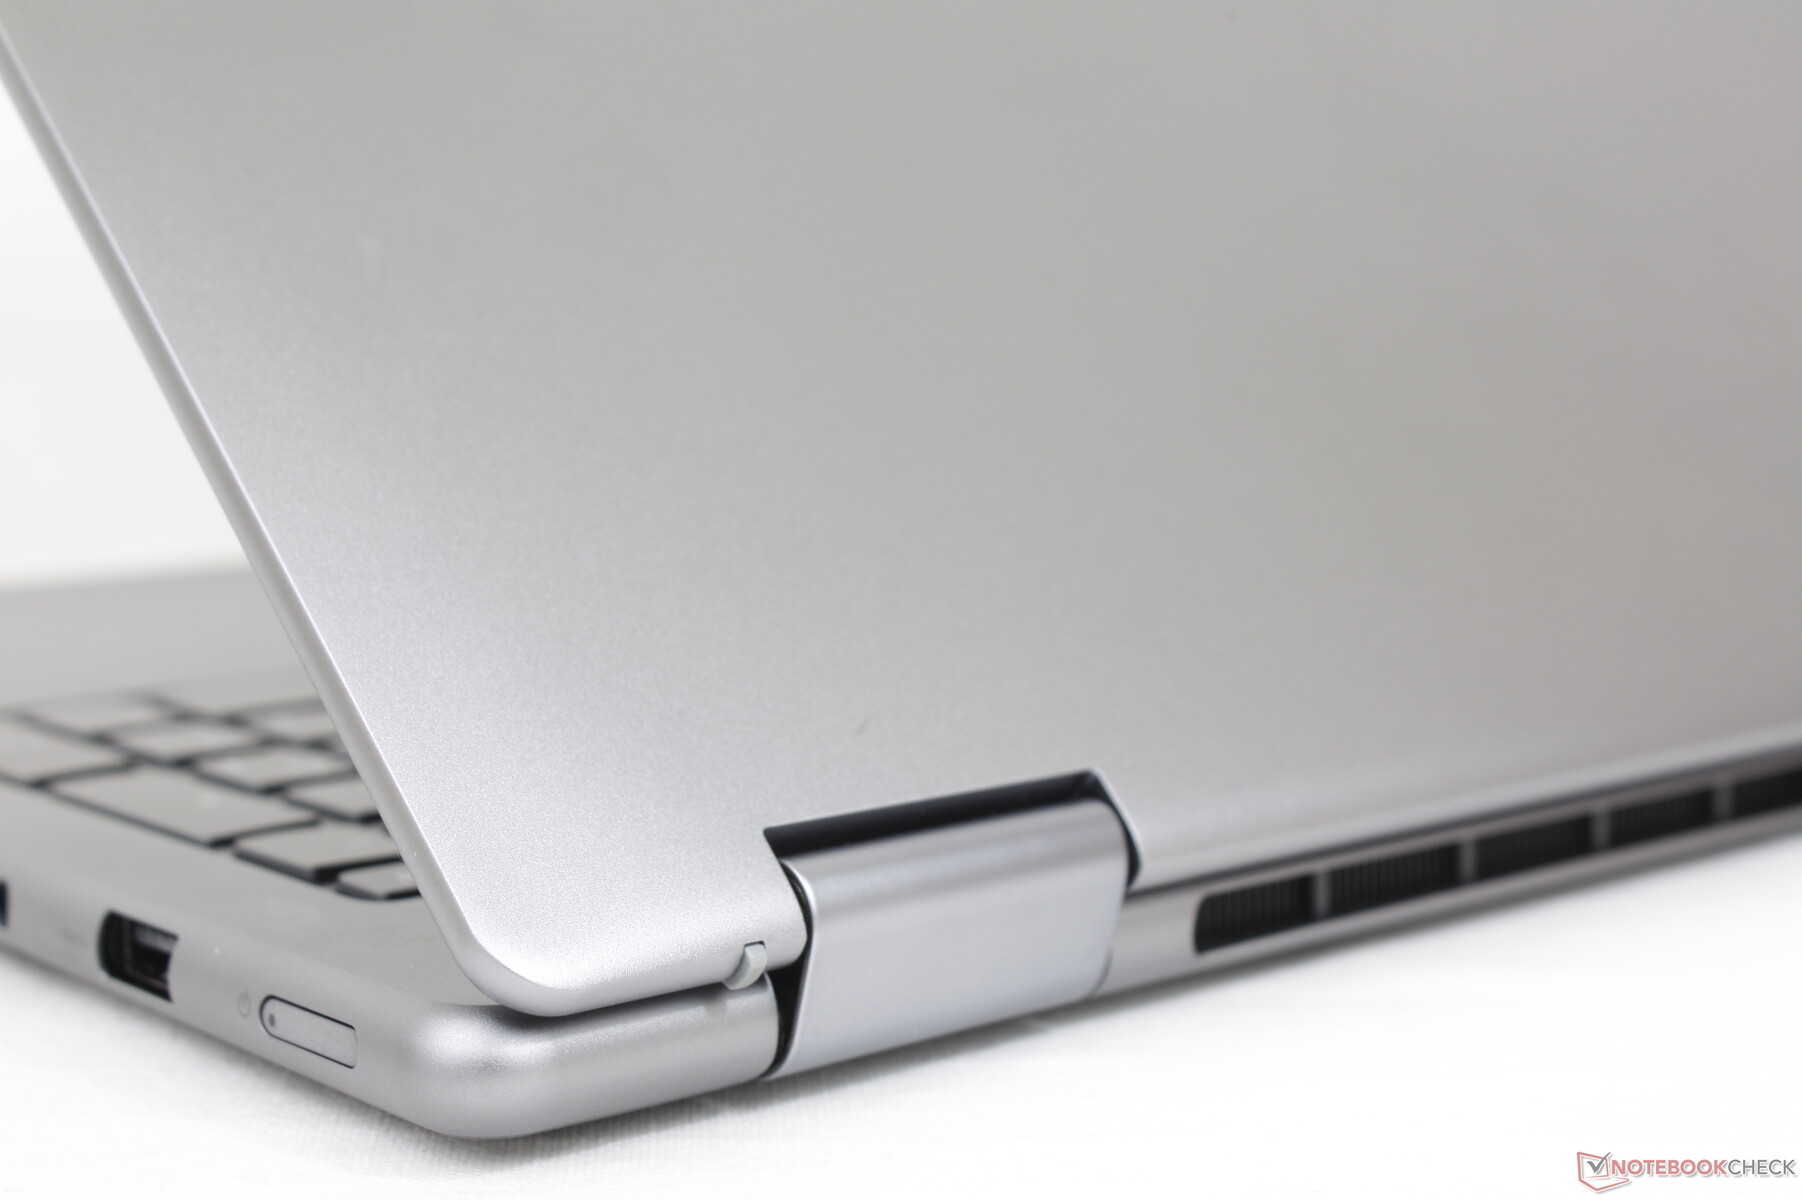
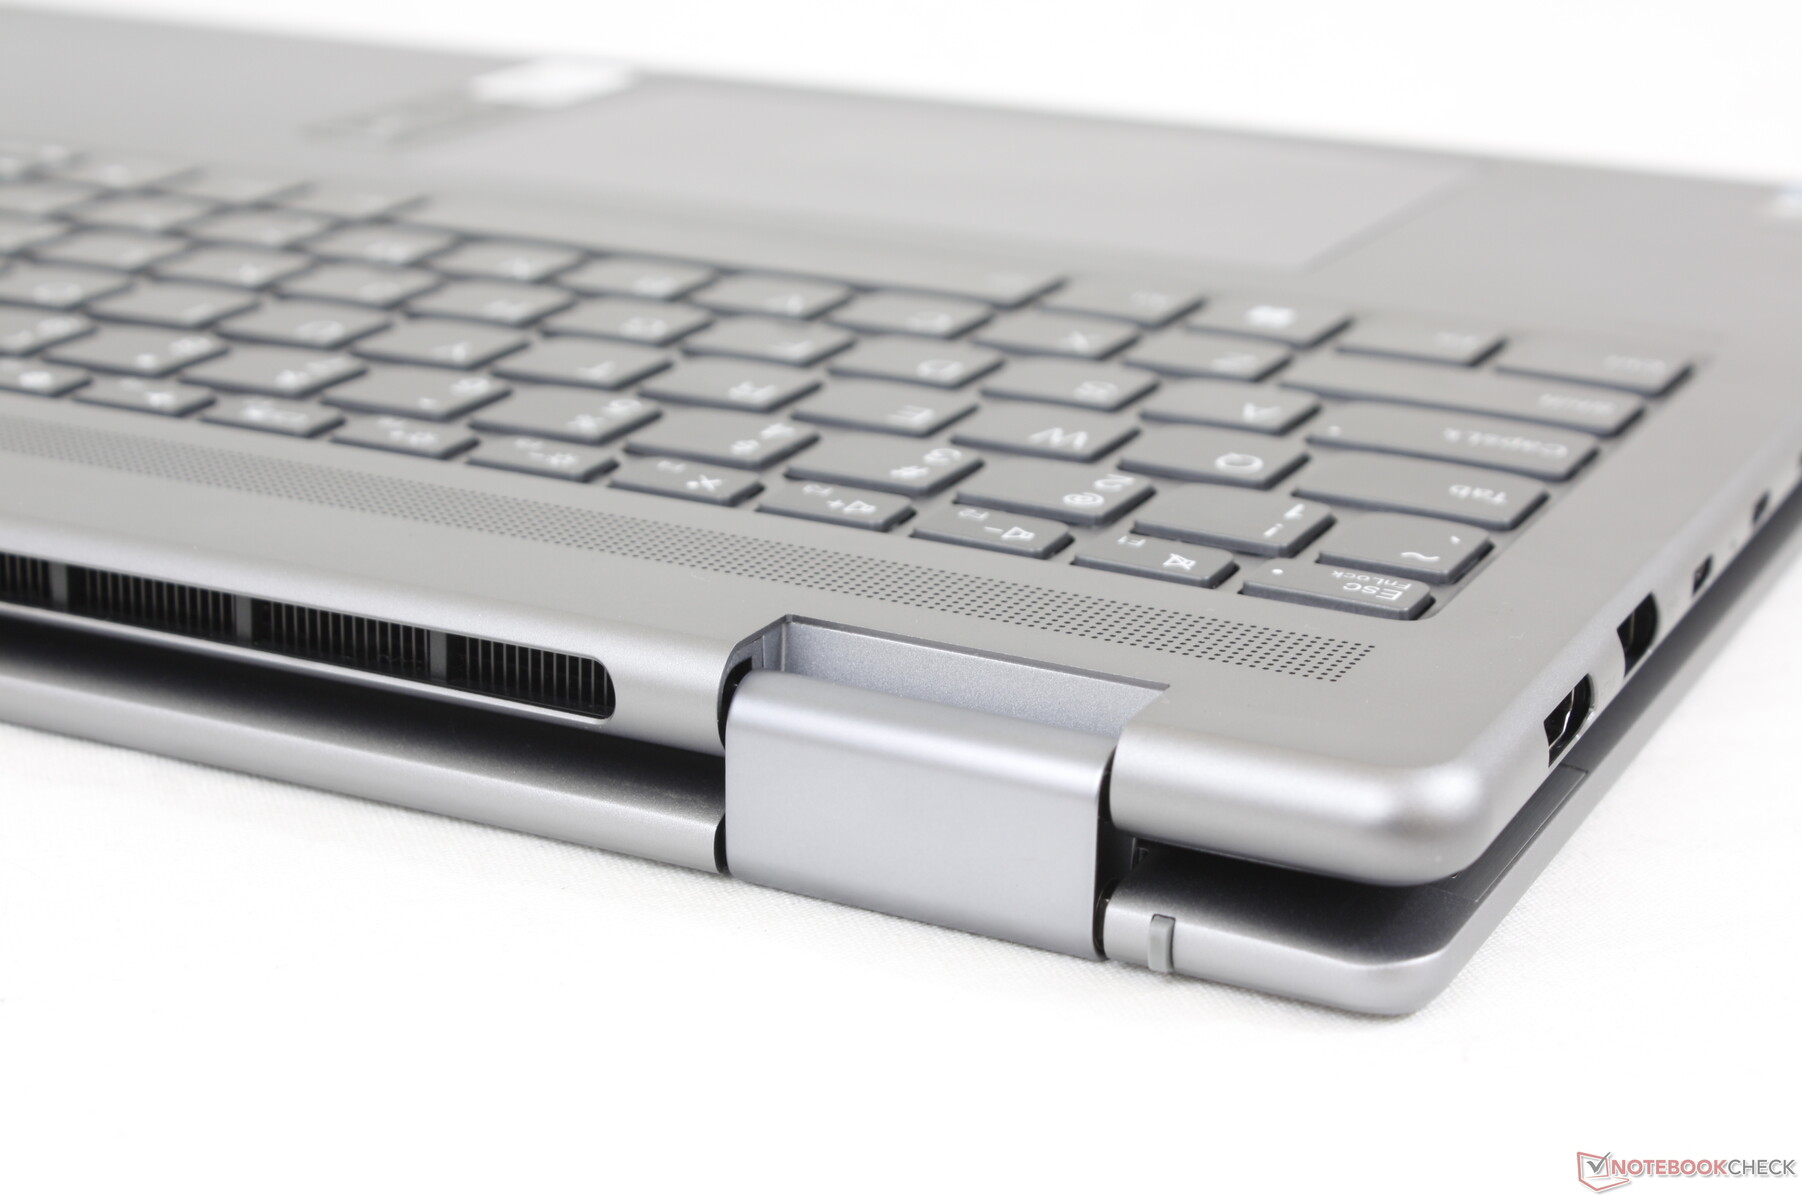
Cas - lisse et rond
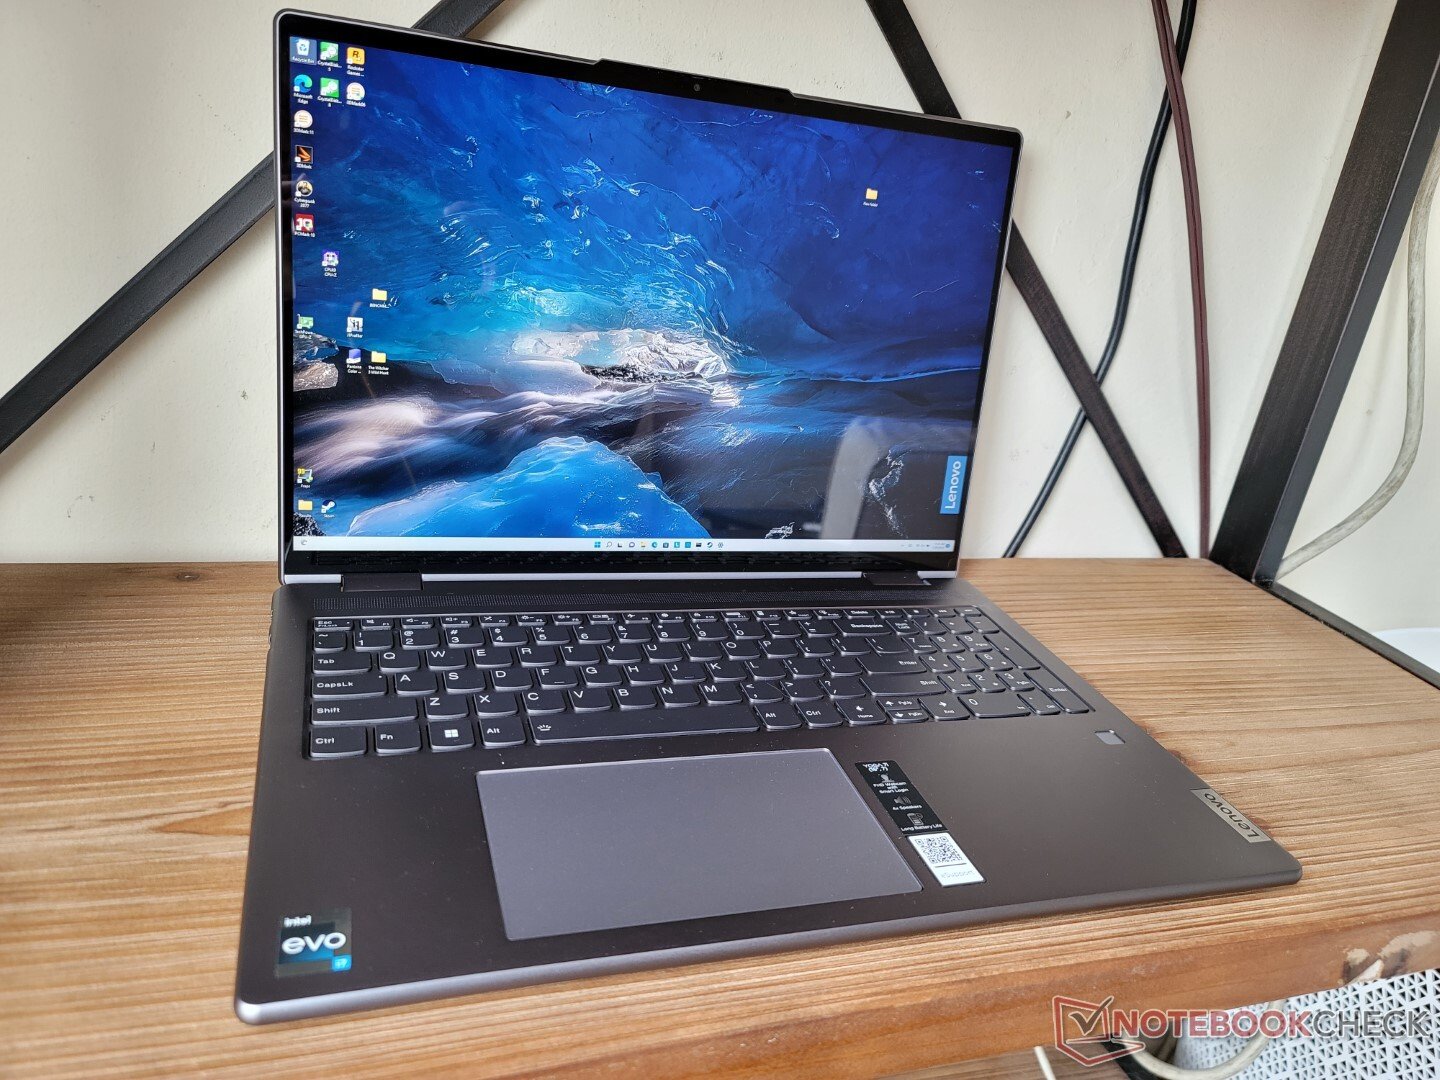
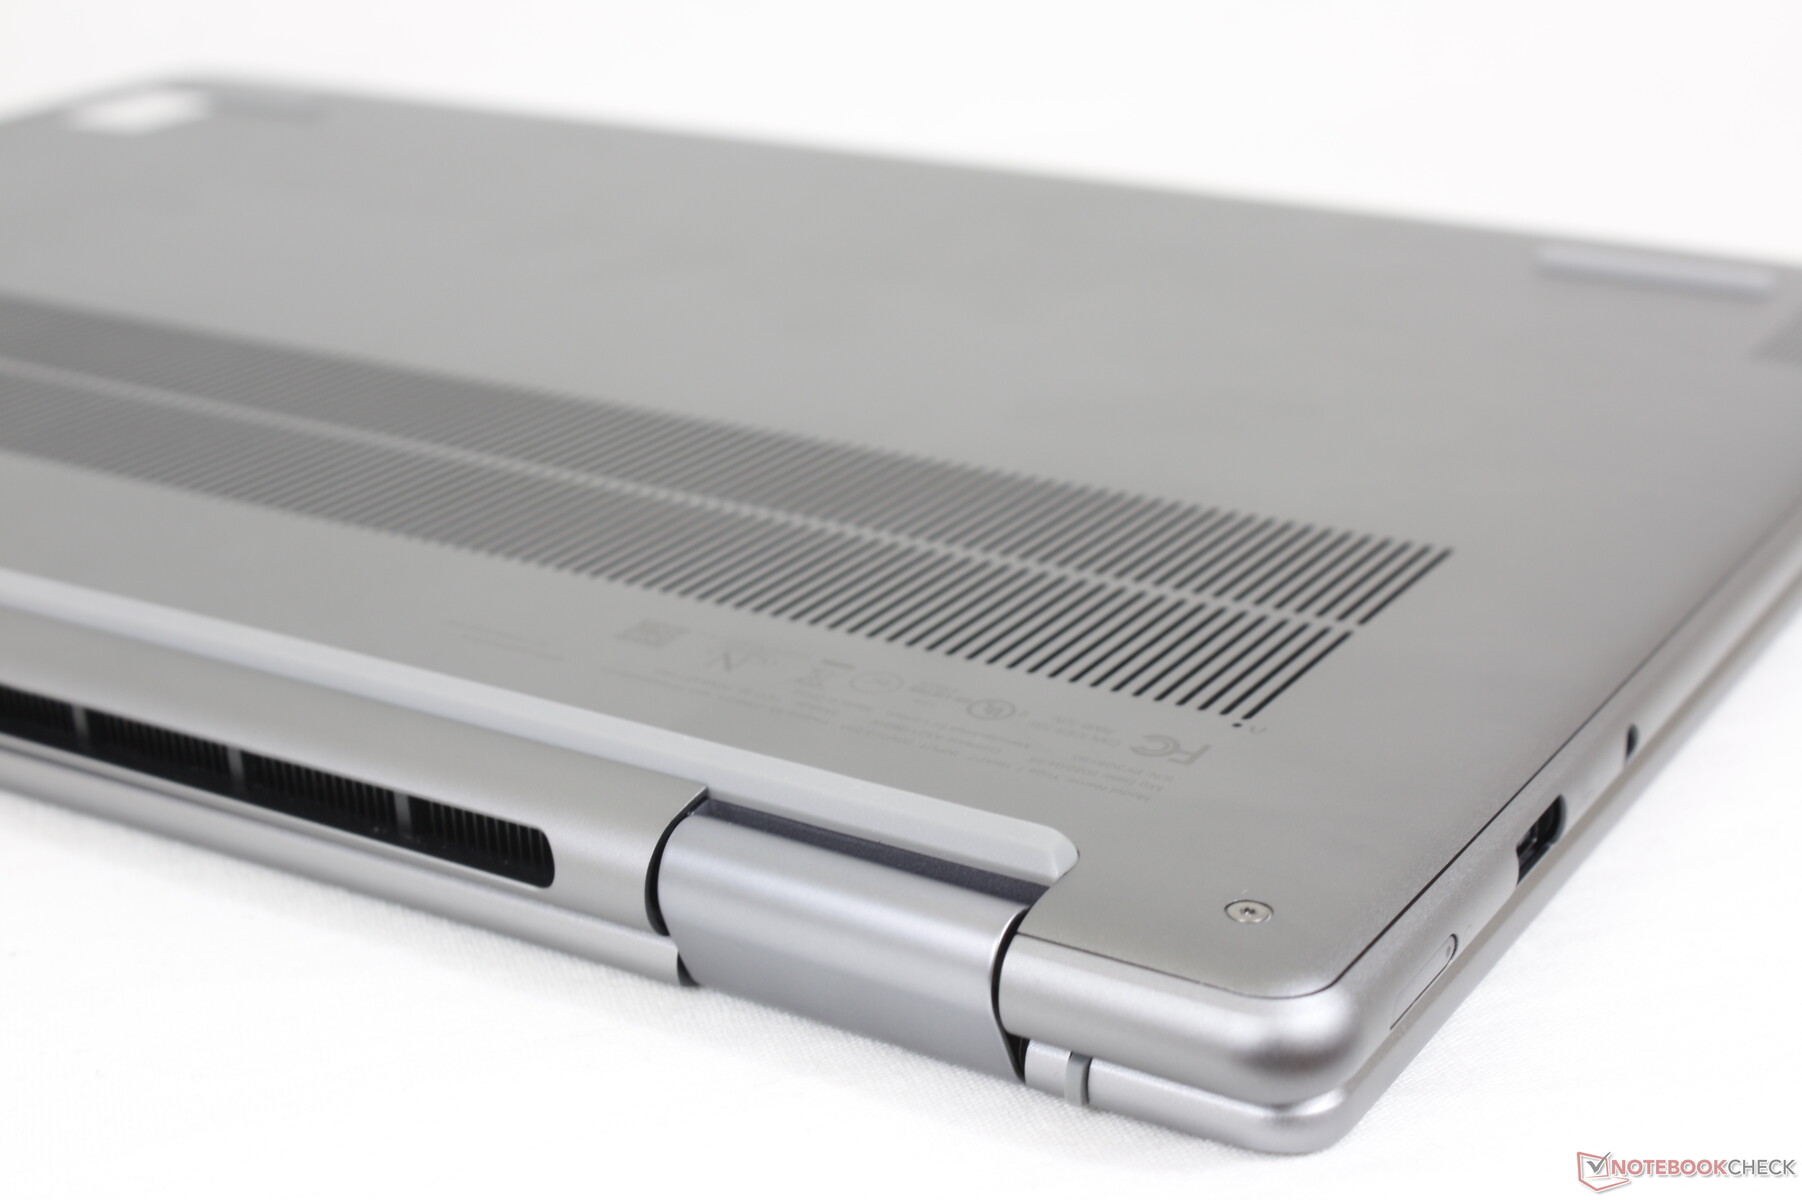
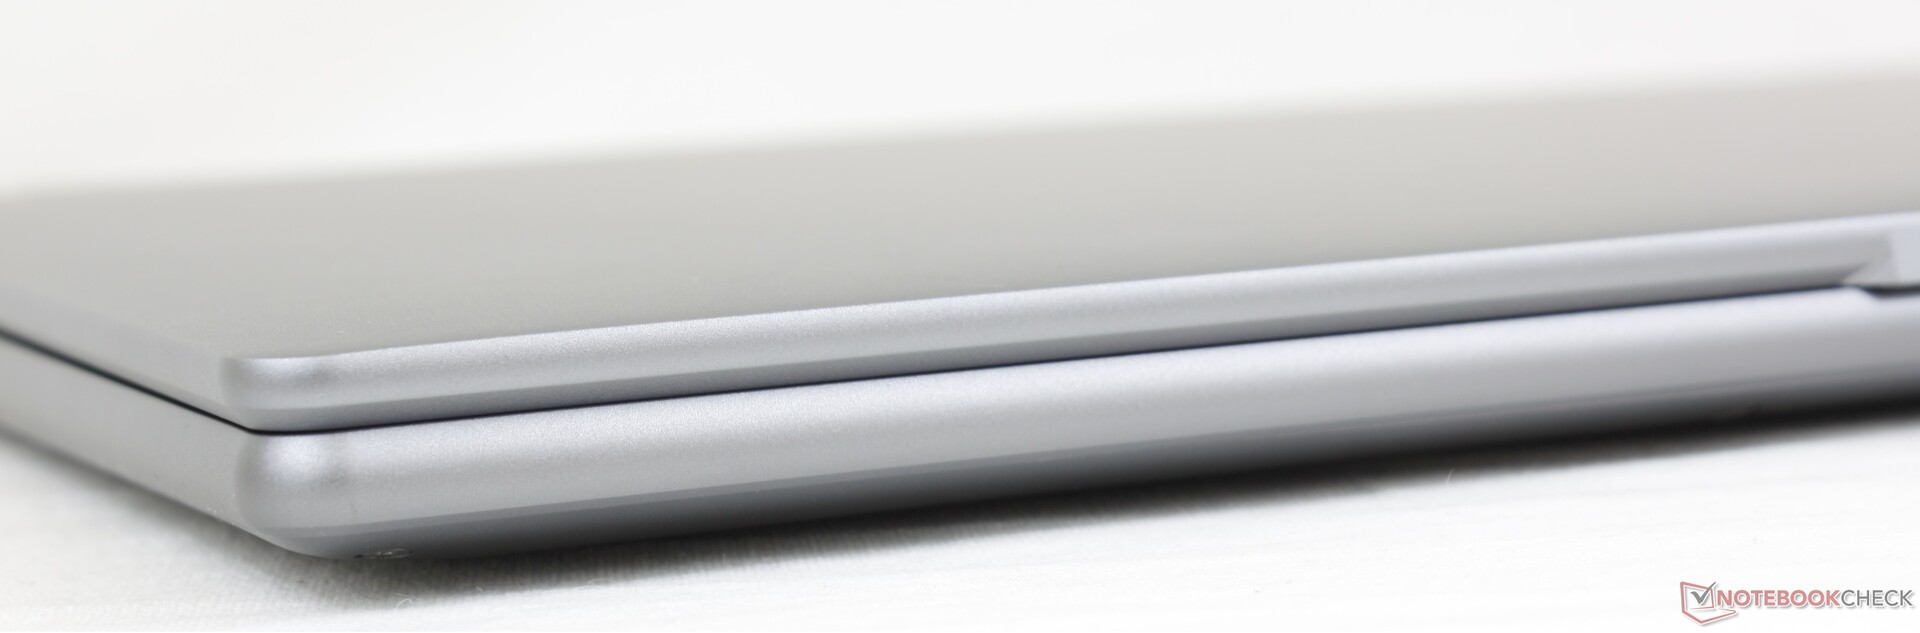
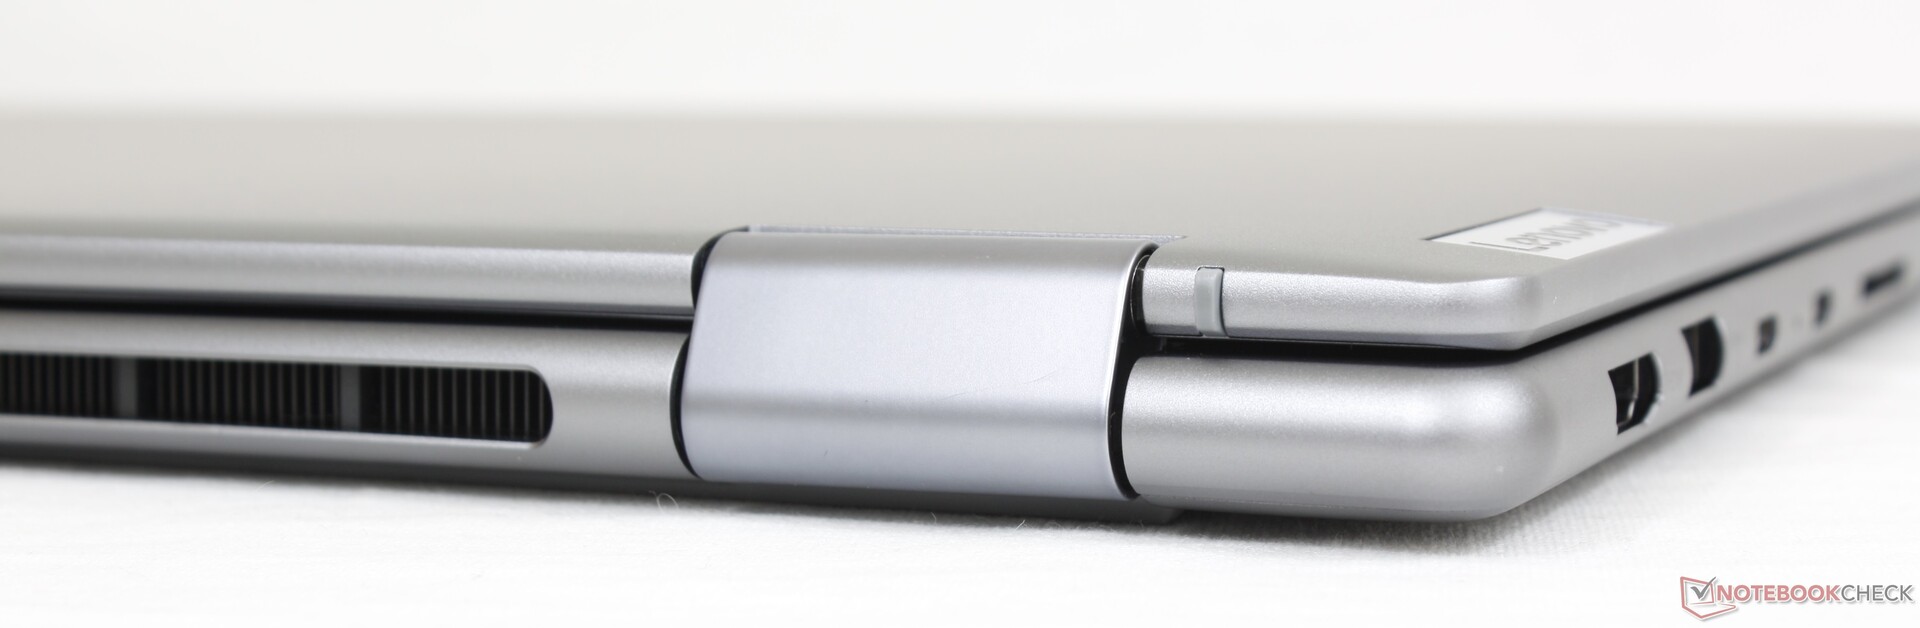
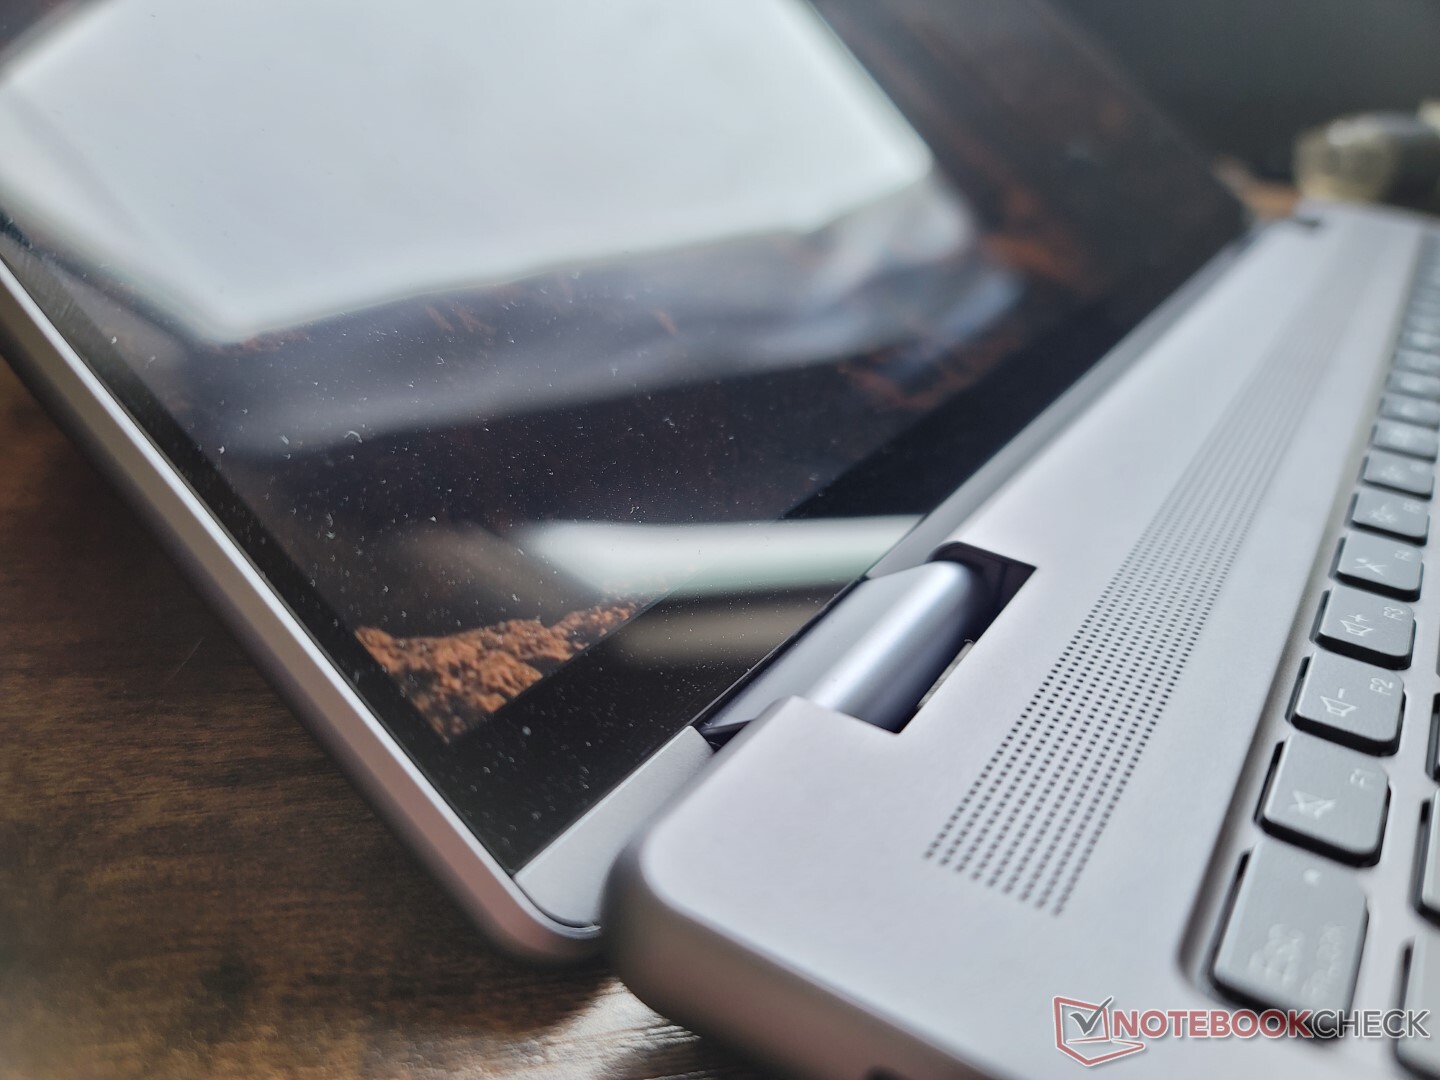
Visuellement, le châssis peut être décrit comme la version 16 pouces du 14 pouces Yoga 9 14IAP7. Le design se distingue par ses bords arrondis pour un aspect convexe, par opposition aux bords souvent plats de la plupart des autres ordinateurs portables. En conséquence, l'ensemble de l'unité est particulièrement lisse, car les bords et les coins arrondis sont plus fluides au toucher que le reste de l'ordinateur portable.
En ce qui concerne la rigidité, la base métallique et le couvercle sont fermes avec un minimum de craquements ou de torsions pour des impressions solides. Cependant, si l'on applique une pression sur le centre du clavier, on constate que celui-ci cède visiblement plus que sur le modèle concurrentDell Inspiron 16 7620 2-en-1 concurrent et il y a donc encore une certaine marge d'amélioration.
Le système est lourd, même pour un format de 16 pouces. Le siteAcer Swift X SFX16huawei MateBook D 16, ou LG Gram 16, par exemple, sont chacun plusieurs centaines de grammes plus légers tout en offrant la même taille d'écran de 16 pouces. Pour la défense de Lenovo, le Yoga 7 16IAP7 est au moins comparable à l'Inspiron 16 7620 2-en-1 en termes de dimensions et de poids.
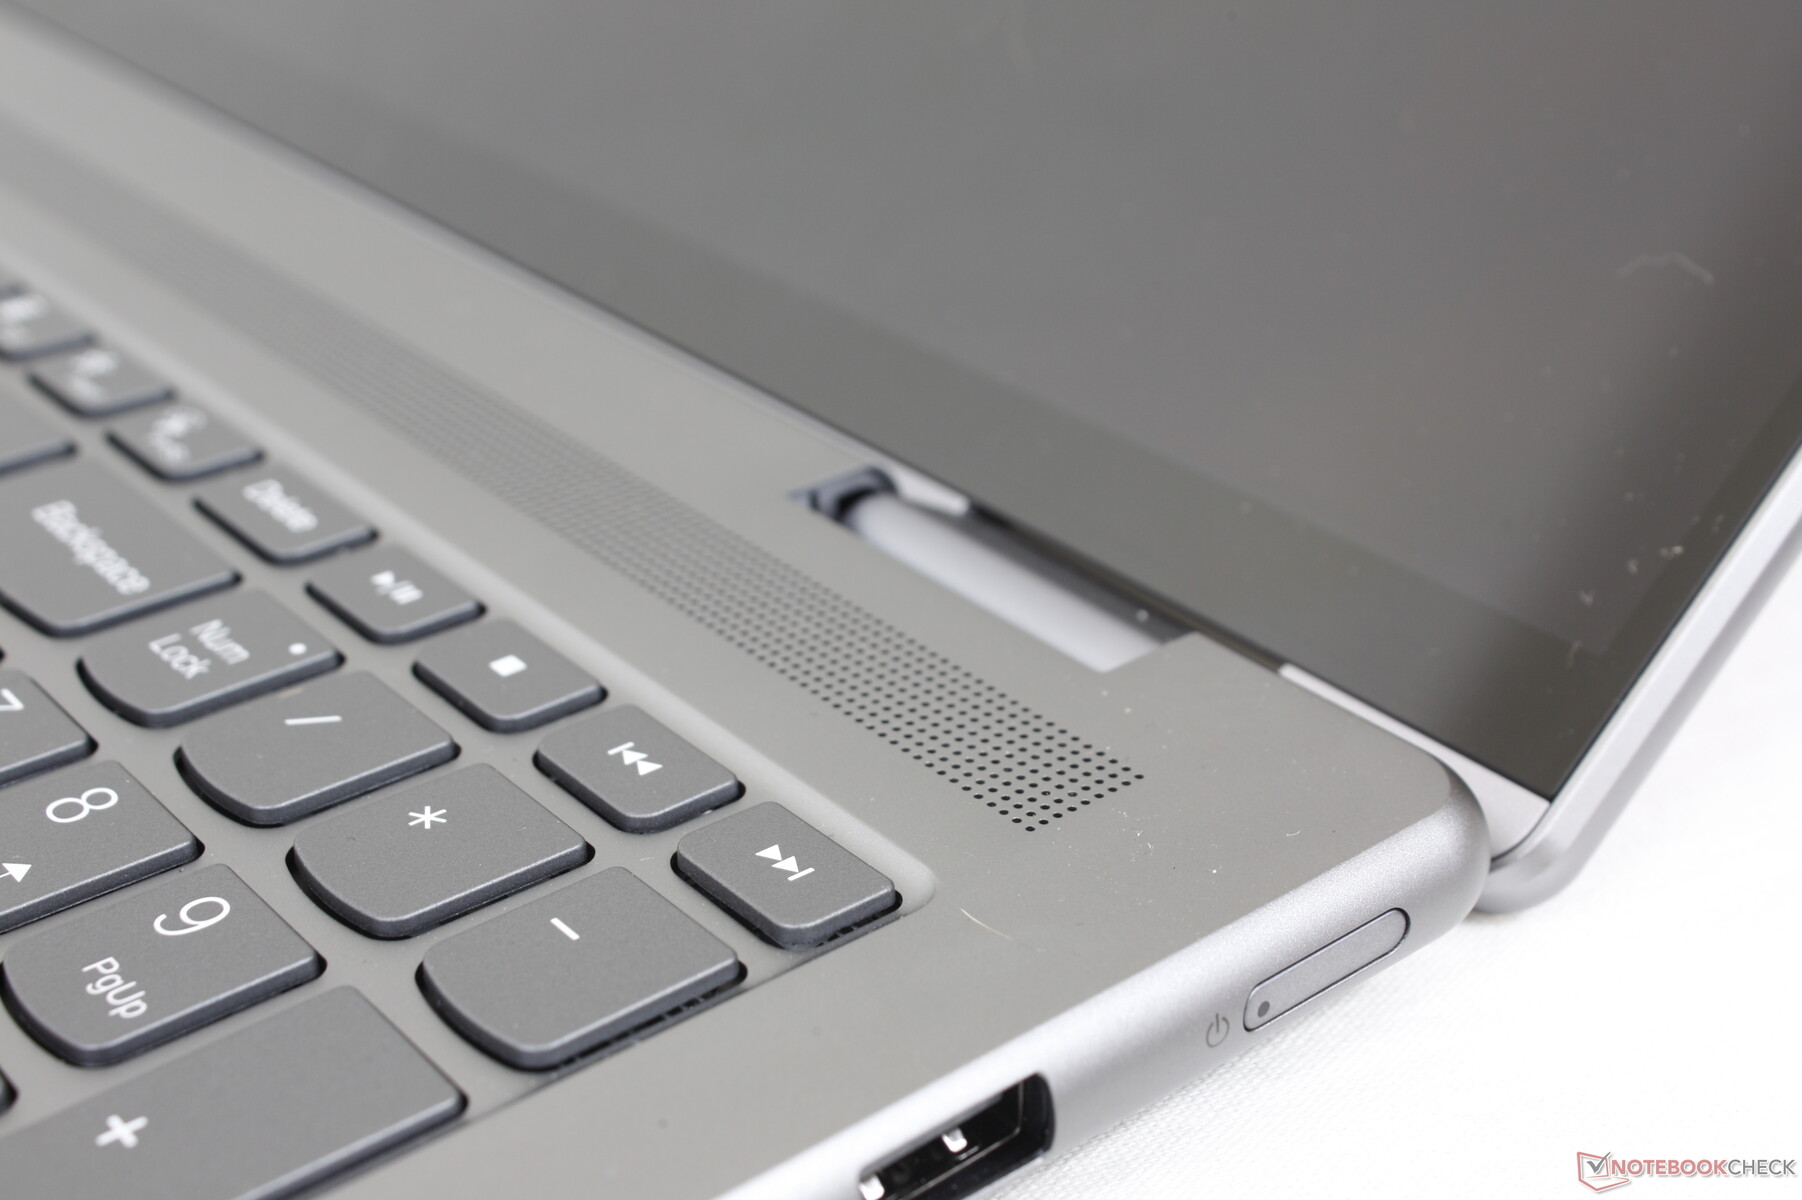
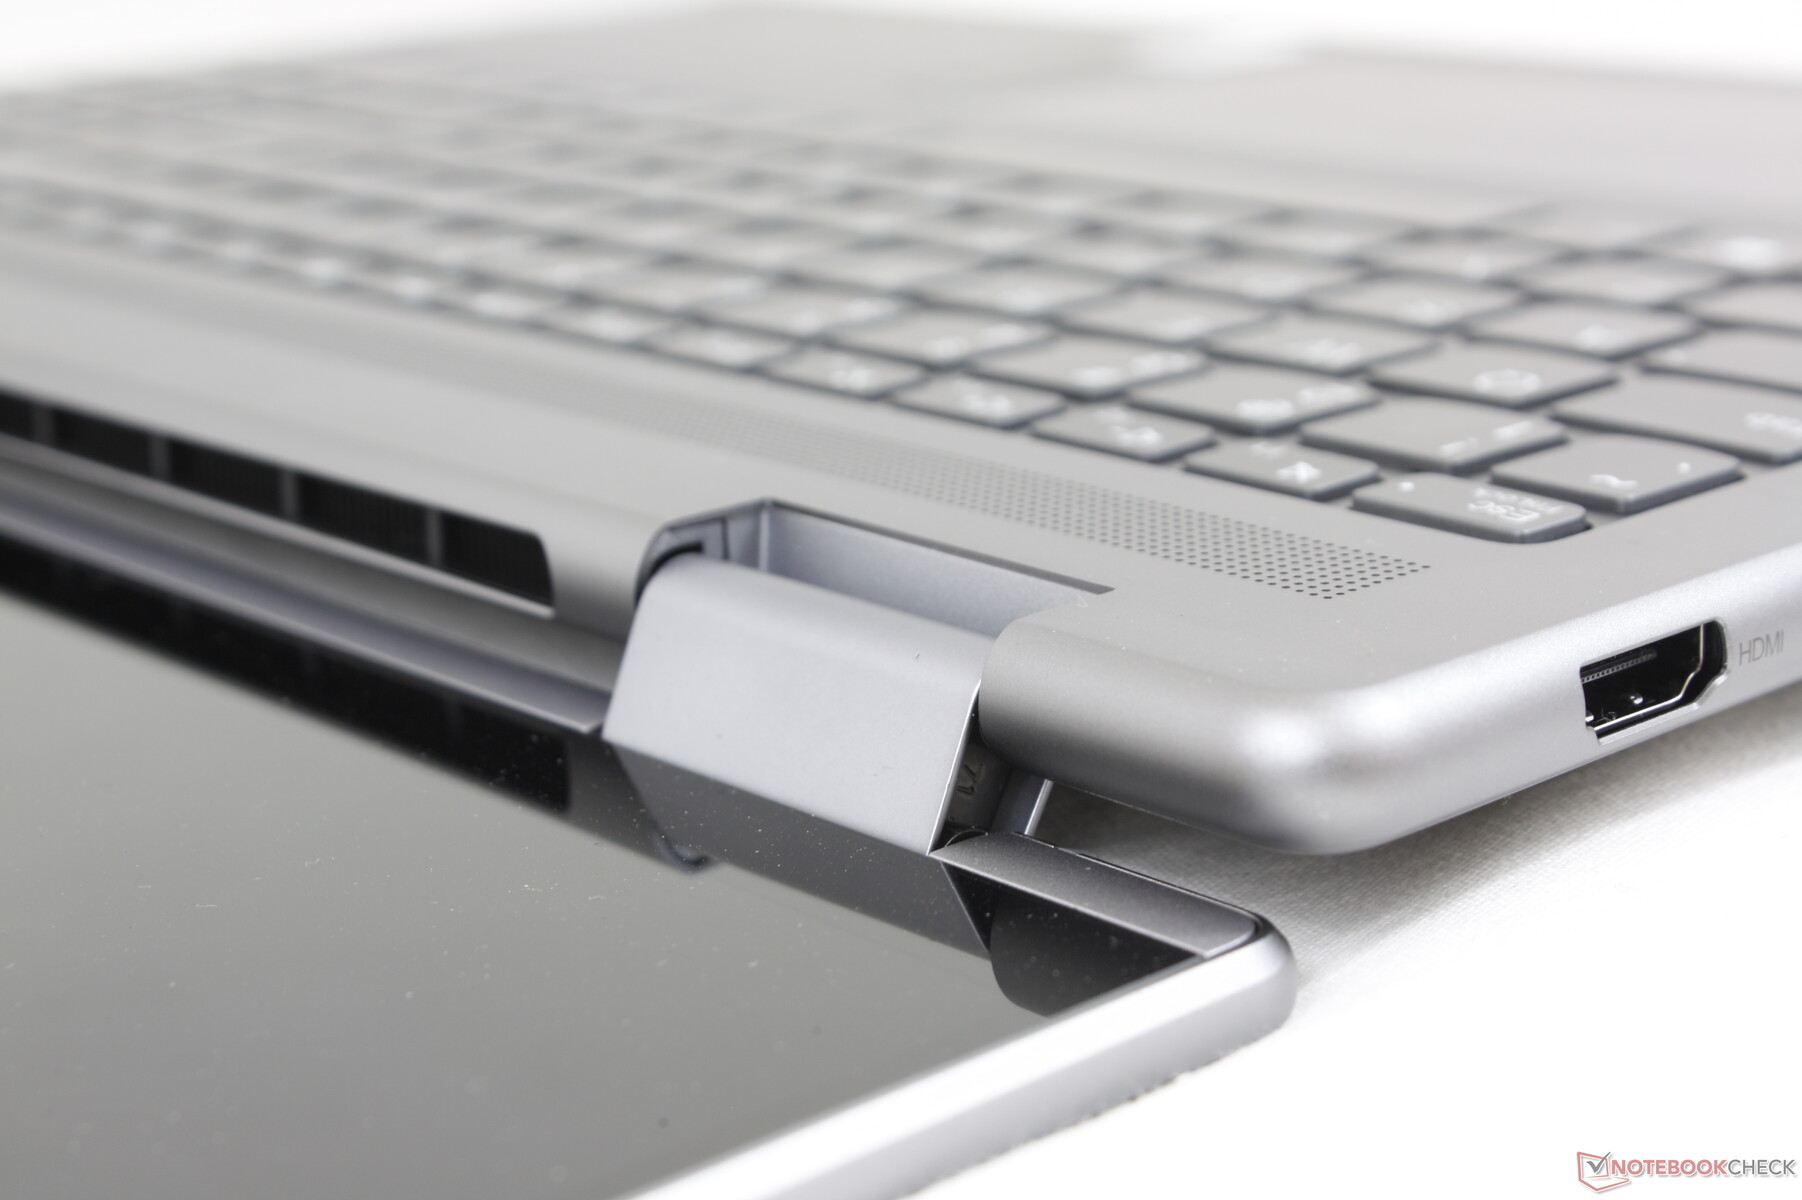
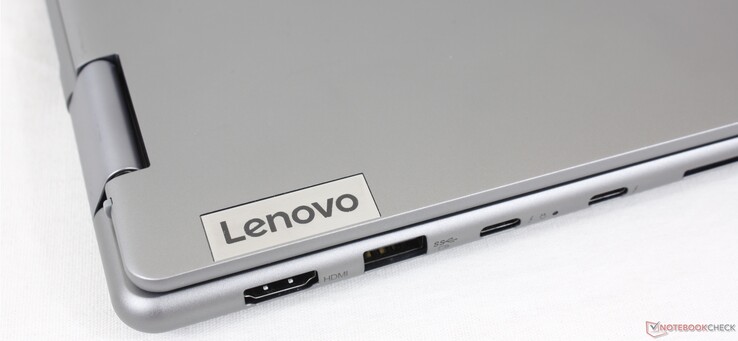
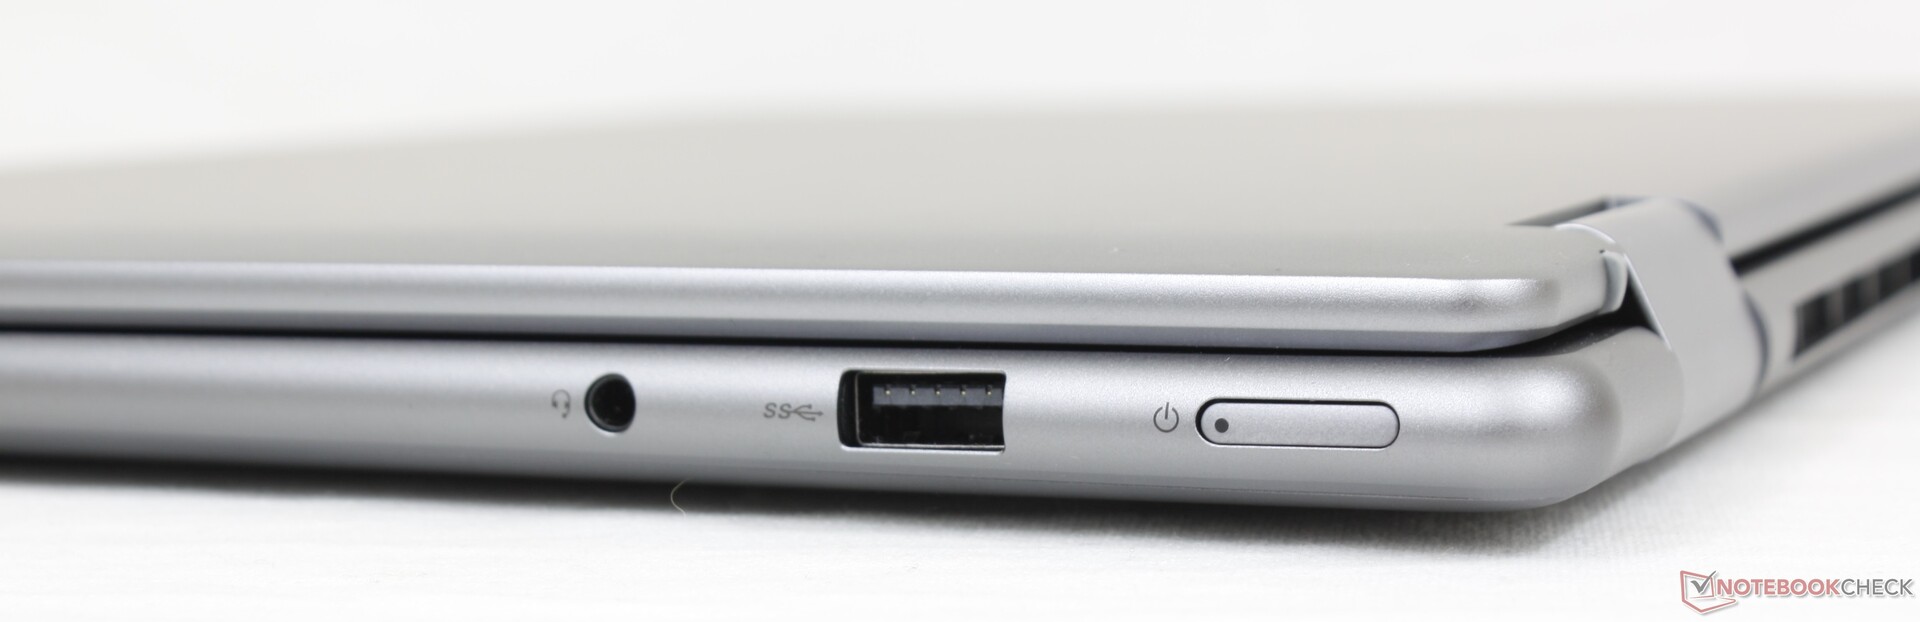
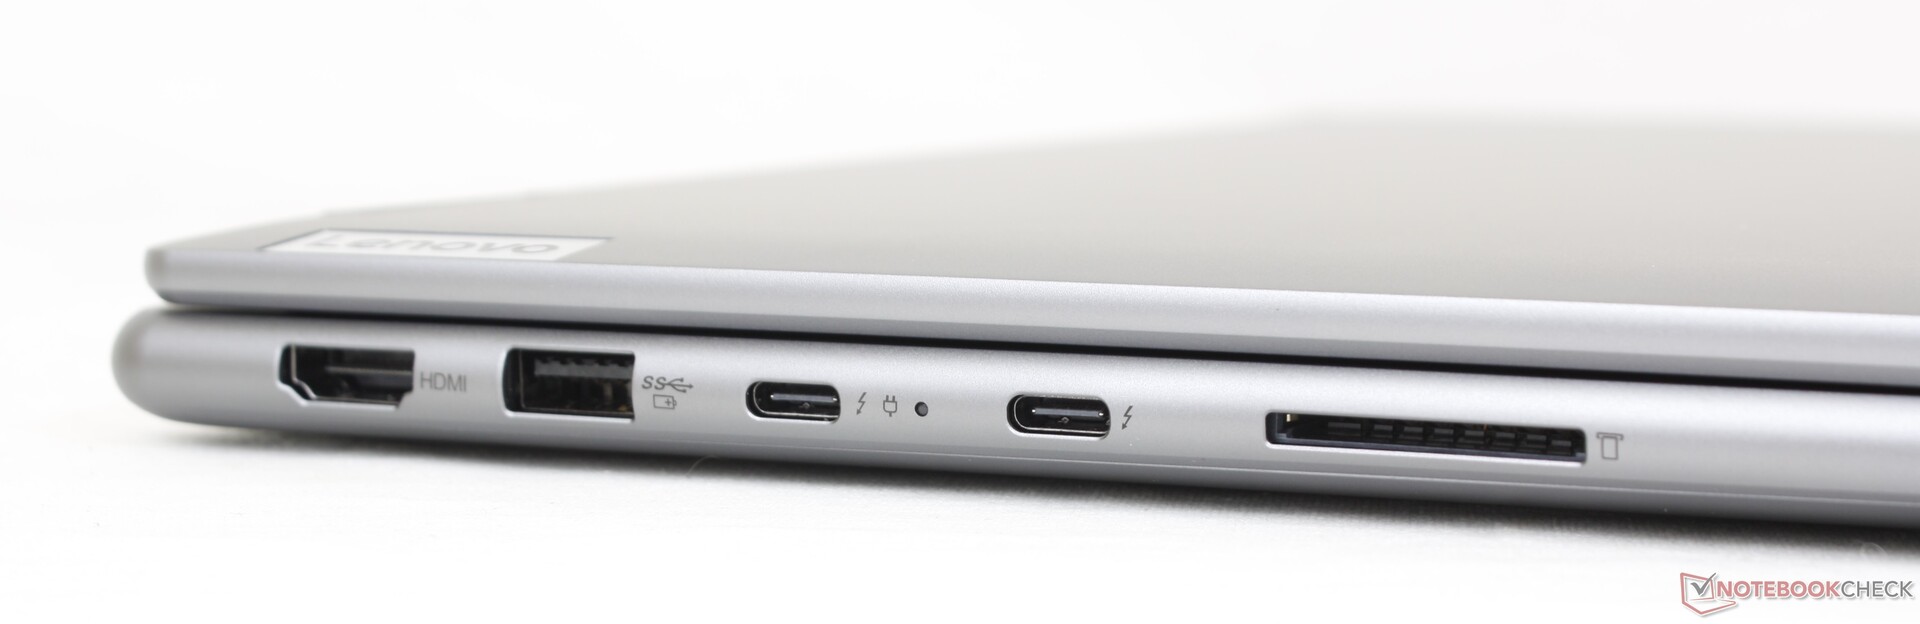
Connectivité - Support Thunderbolt 4
Les options de port sont exactement les mêmes que sur le Dell Inspiron 16 7620 2-en-1 ou le LG Gram 16. En fait, même le positionnement des ports est presque identique à celui du modèle Dell. Le MateBook D 16 intègre également les mêmes ports, mais sans le support Thunderbolt.
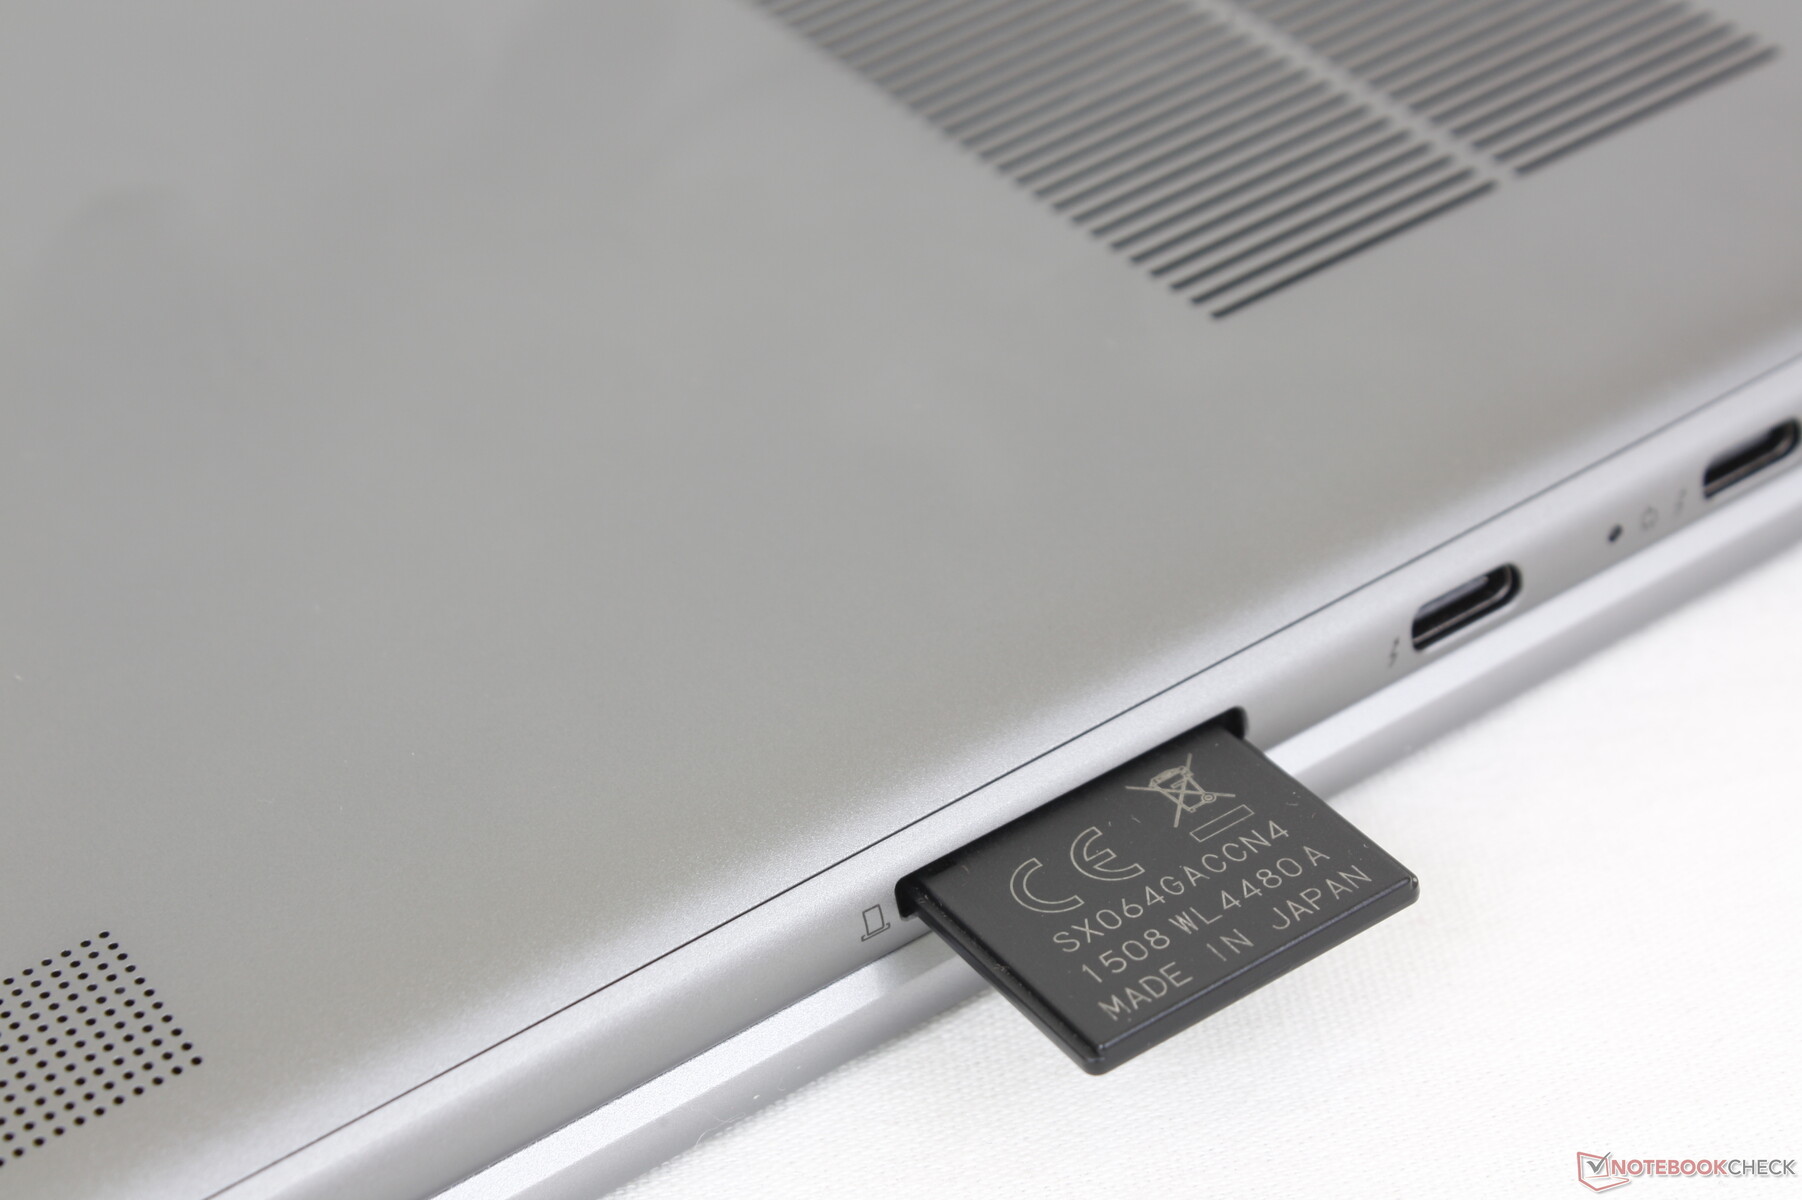
Lecteur de carte SD
Les taux de transfert avec le lecteur de carte SD intégré sont moyens, autour de 80 Mo/s. Le transfert de 1 Go de photos de notre carte de test UHS-II vers le bureau prend environ 12 secondes. Il convient de noter que le lecteur SD intégré n'est pas doté d'un ressort, contrairement à la plupart des autres ordinateurs portables.
| SD Card Reader | |
| average JPG Copy Test (av. of 3 runs) | |
| Lenovo Yoga 7 16IAP7 (Toshiba Exceria Pro SDXC 64 GB UHS-II) | |
| LG Gram 16 (2021) (Toshiba Exceria Pro M501 microSDXC 64GB) | |
| Lenovo IdeaPad 5 Pro 16ACH (AV PRO V60) | |
| Dell Inspiron 16 7620 2-in-1 (Toshiba Exceria Pro SDXC 64 GB UHS-II) | |
| maximum AS SSD Seq Read Test (1GB) | |
| LG Gram 16 (2021) (Toshiba Exceria Pro M501 microSDXC 64GB) | |
| Lenovo Yoga 7 16IAP7 (Toshiba Exceria Pro SDXC 64 GB UHS-II) | |
| Lenovo IdeaPad 5 Pro 16ACH (AV PRO V60) | |
| Dell Inspiron 16 7620 2-in-1 (Toshiba Exceria Pro SDXC 64 GB UHS-II) | |
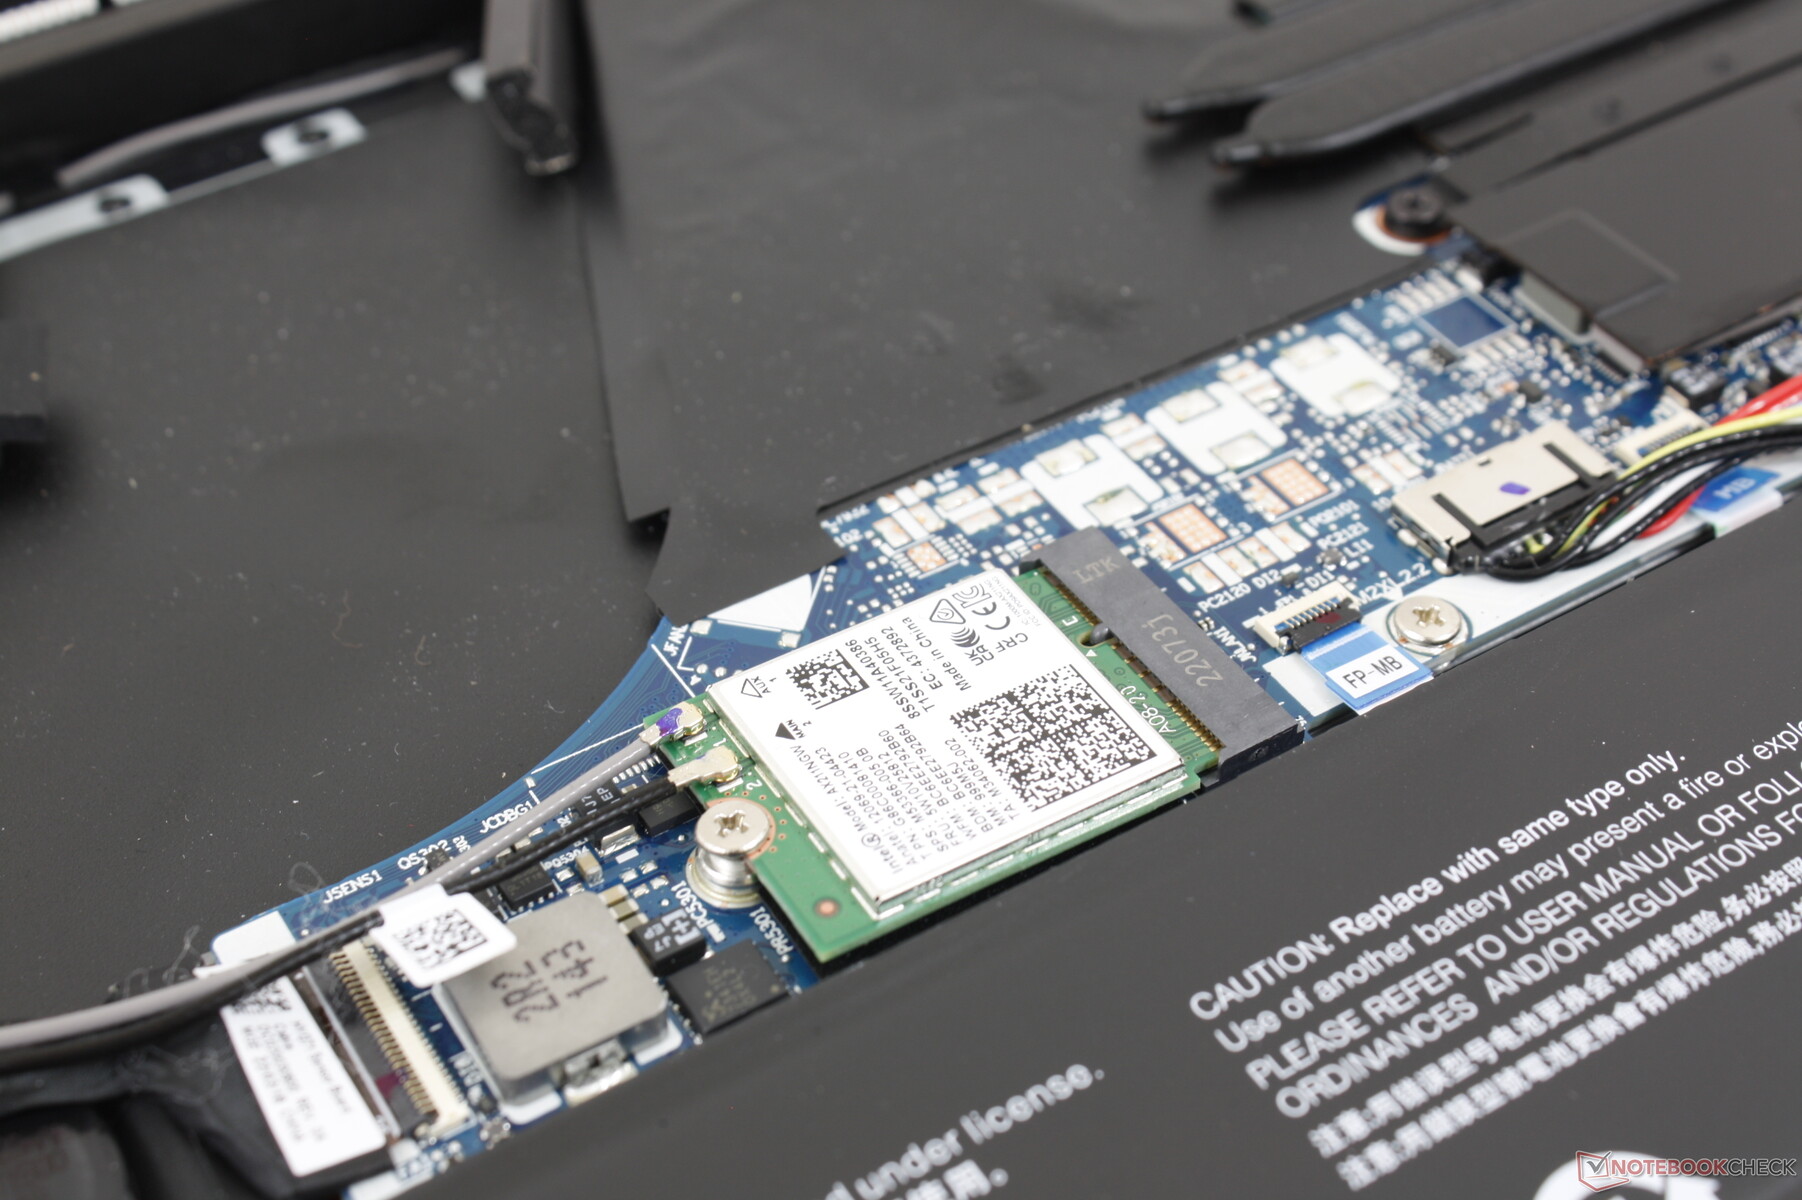
Communication - Support Wi-Fi 6E
Un Intel AX211 est fourni en standard pour la connectivité Wi-Fi 6E et Bluetooth 5.2. Nous avons constaté des taux de transfert stables lorsqu'il était couplé à notre réseau 6 GHz.
| Networking | |
| iperf3 transmit AX12 | |
| Acer Swift X SFX16-51G-5388 | |
| LG Gram 16 (2021) | |
| Lenovo IdeaPad 5 Pro 16ACH | |
| iperf3 receive AX12 | |
| Acer Swift X SFX16-51G-5388 | |
| LG Gram 16 (2021) | |
| Lenovo IdeaPad 5 Pro 16ACH | |
| iperf3 receive AXE11000 6GHz | |
| Lenovo Yoga 7 16IAP7 | |
| Dell Inspiron 16 7620 2-in-1 | |
| iperf3 transmit AXE11000 6GHz | |
| Dell Inspiron 16 7620 2-in-1 | |
| Lenovo Yoga 7 16IAP7 | |
Webcam
L'appareil photo de 2 mégapixels est plus net que sur la plupart des autres ordinateurs portables où le 1 mégapixel est encore la norme. Un obturateur de confidentialité physique est inclus et un capteur infrarouge est prévu pour la prise en charge de Windows Hello.


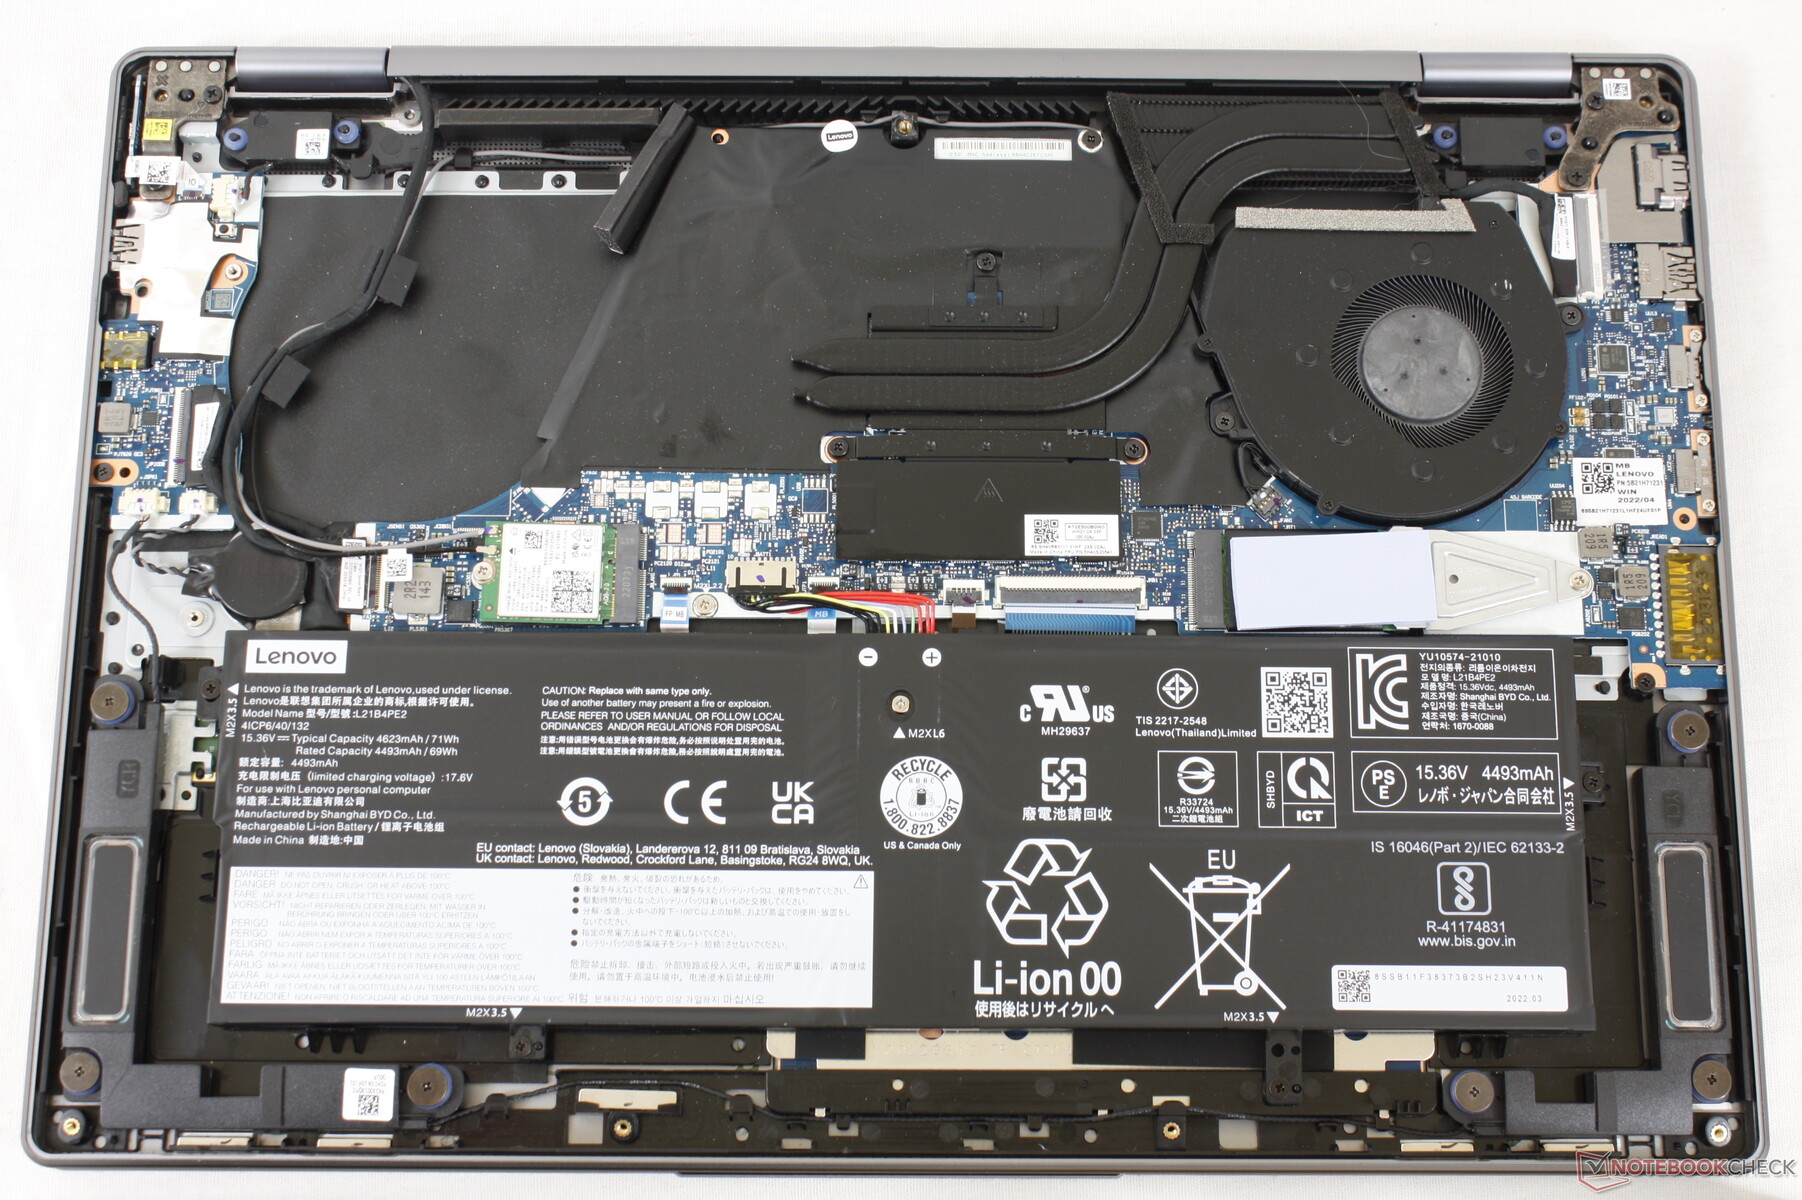
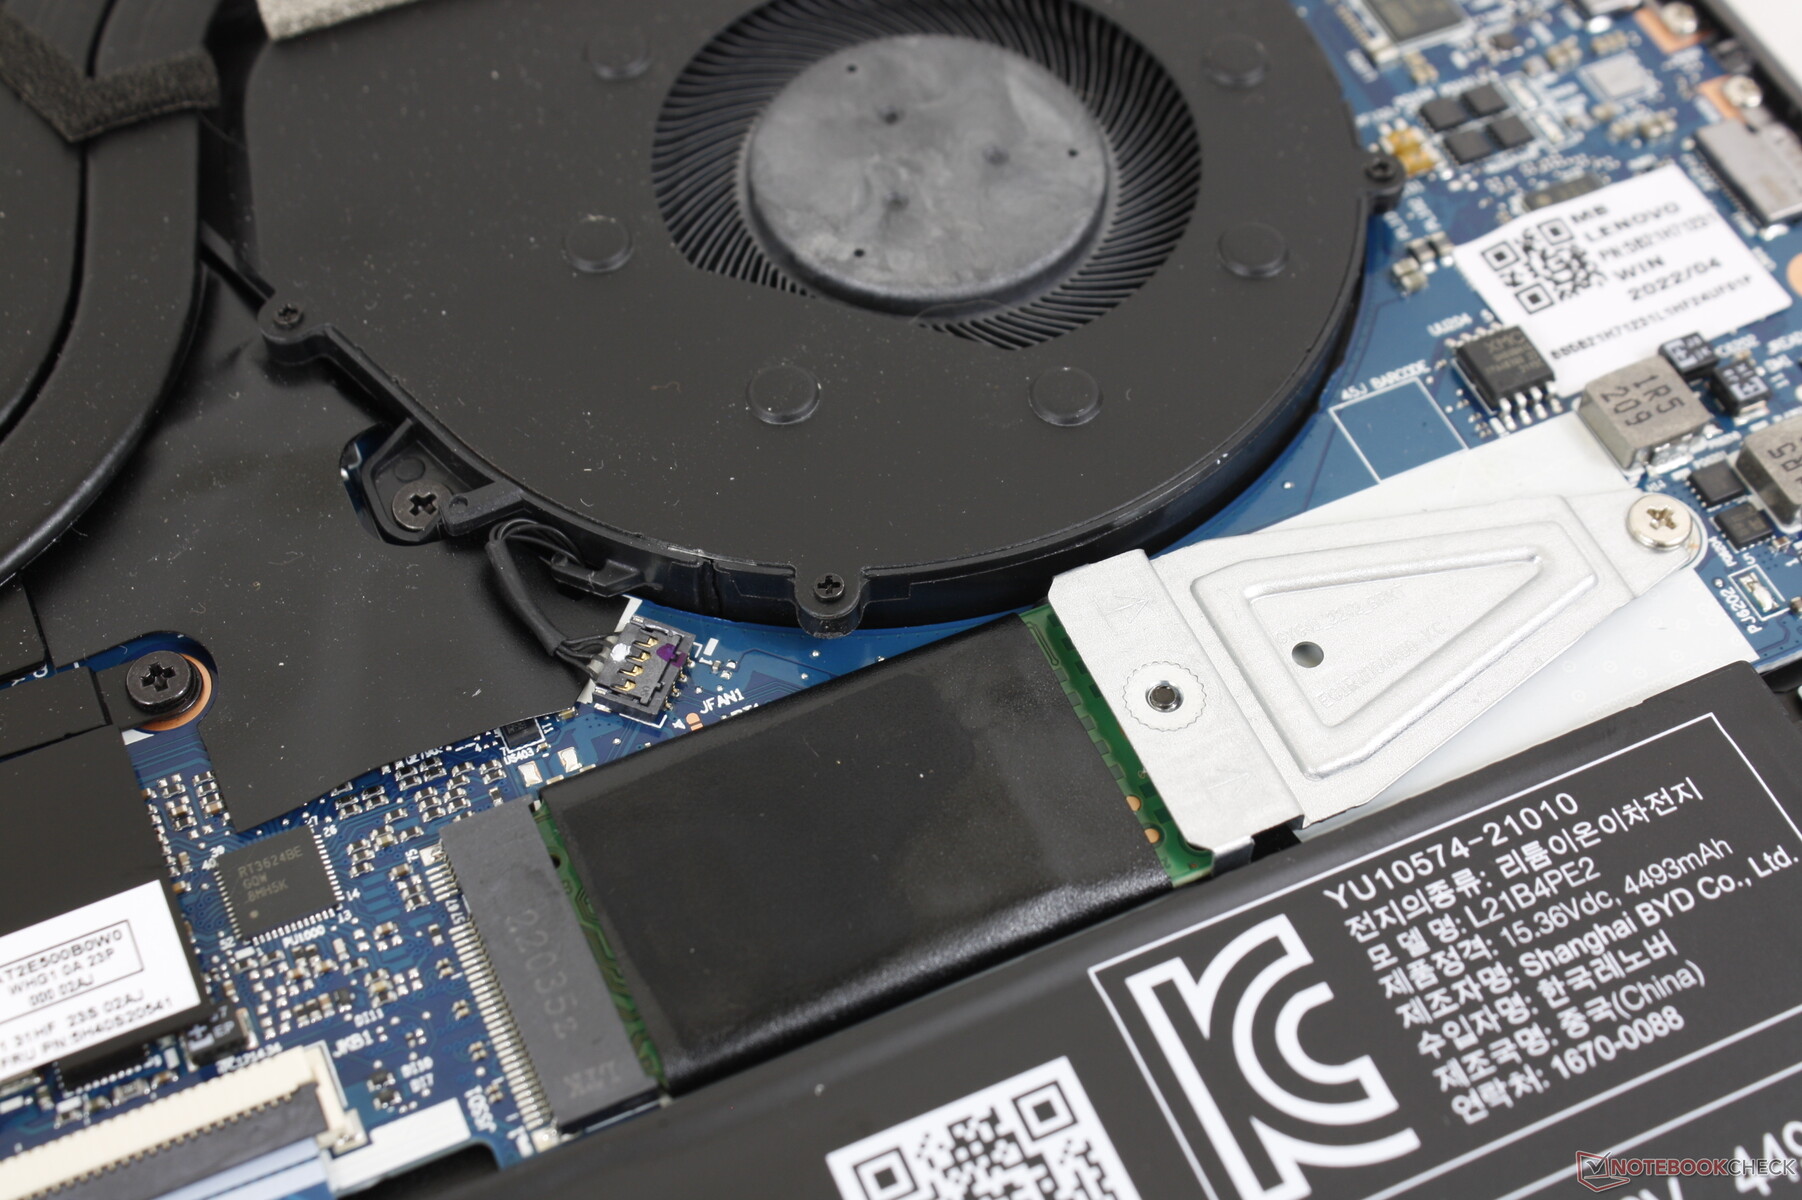
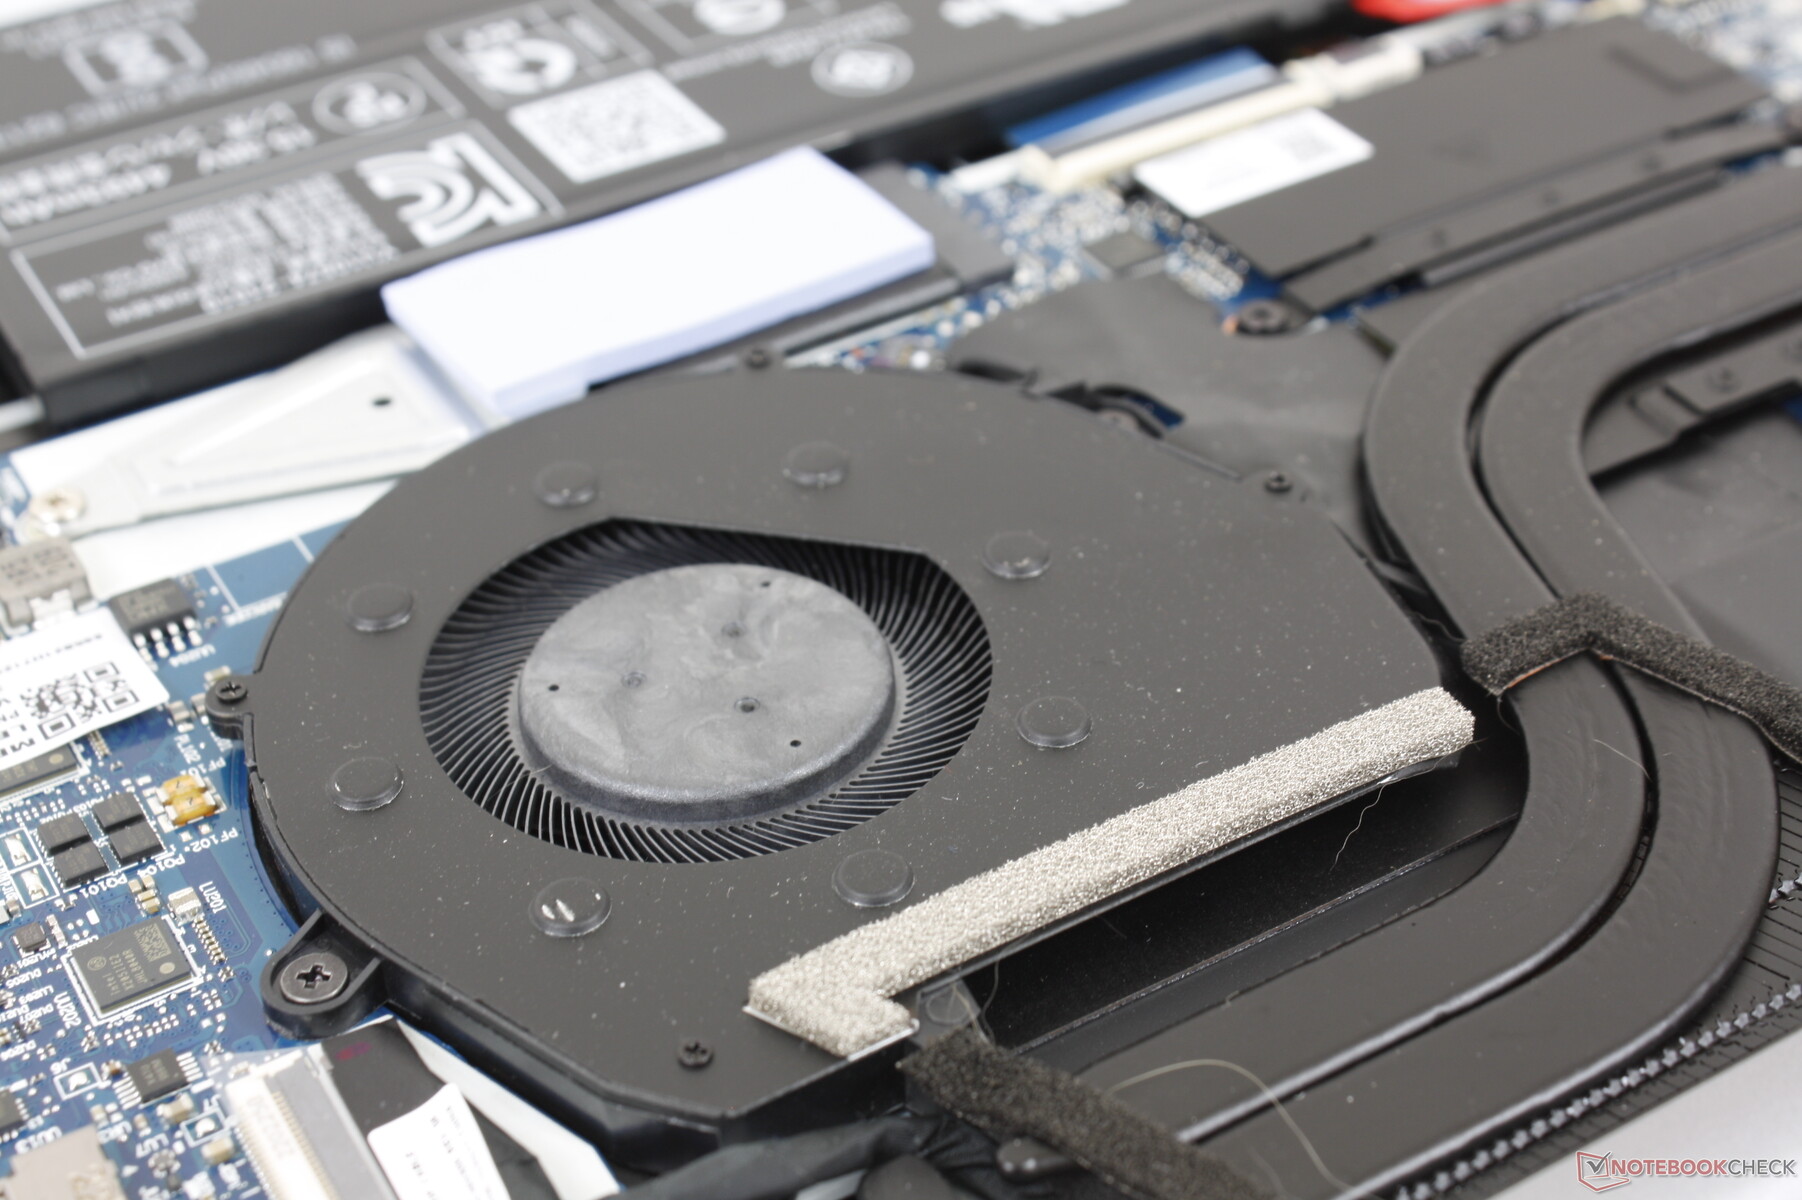
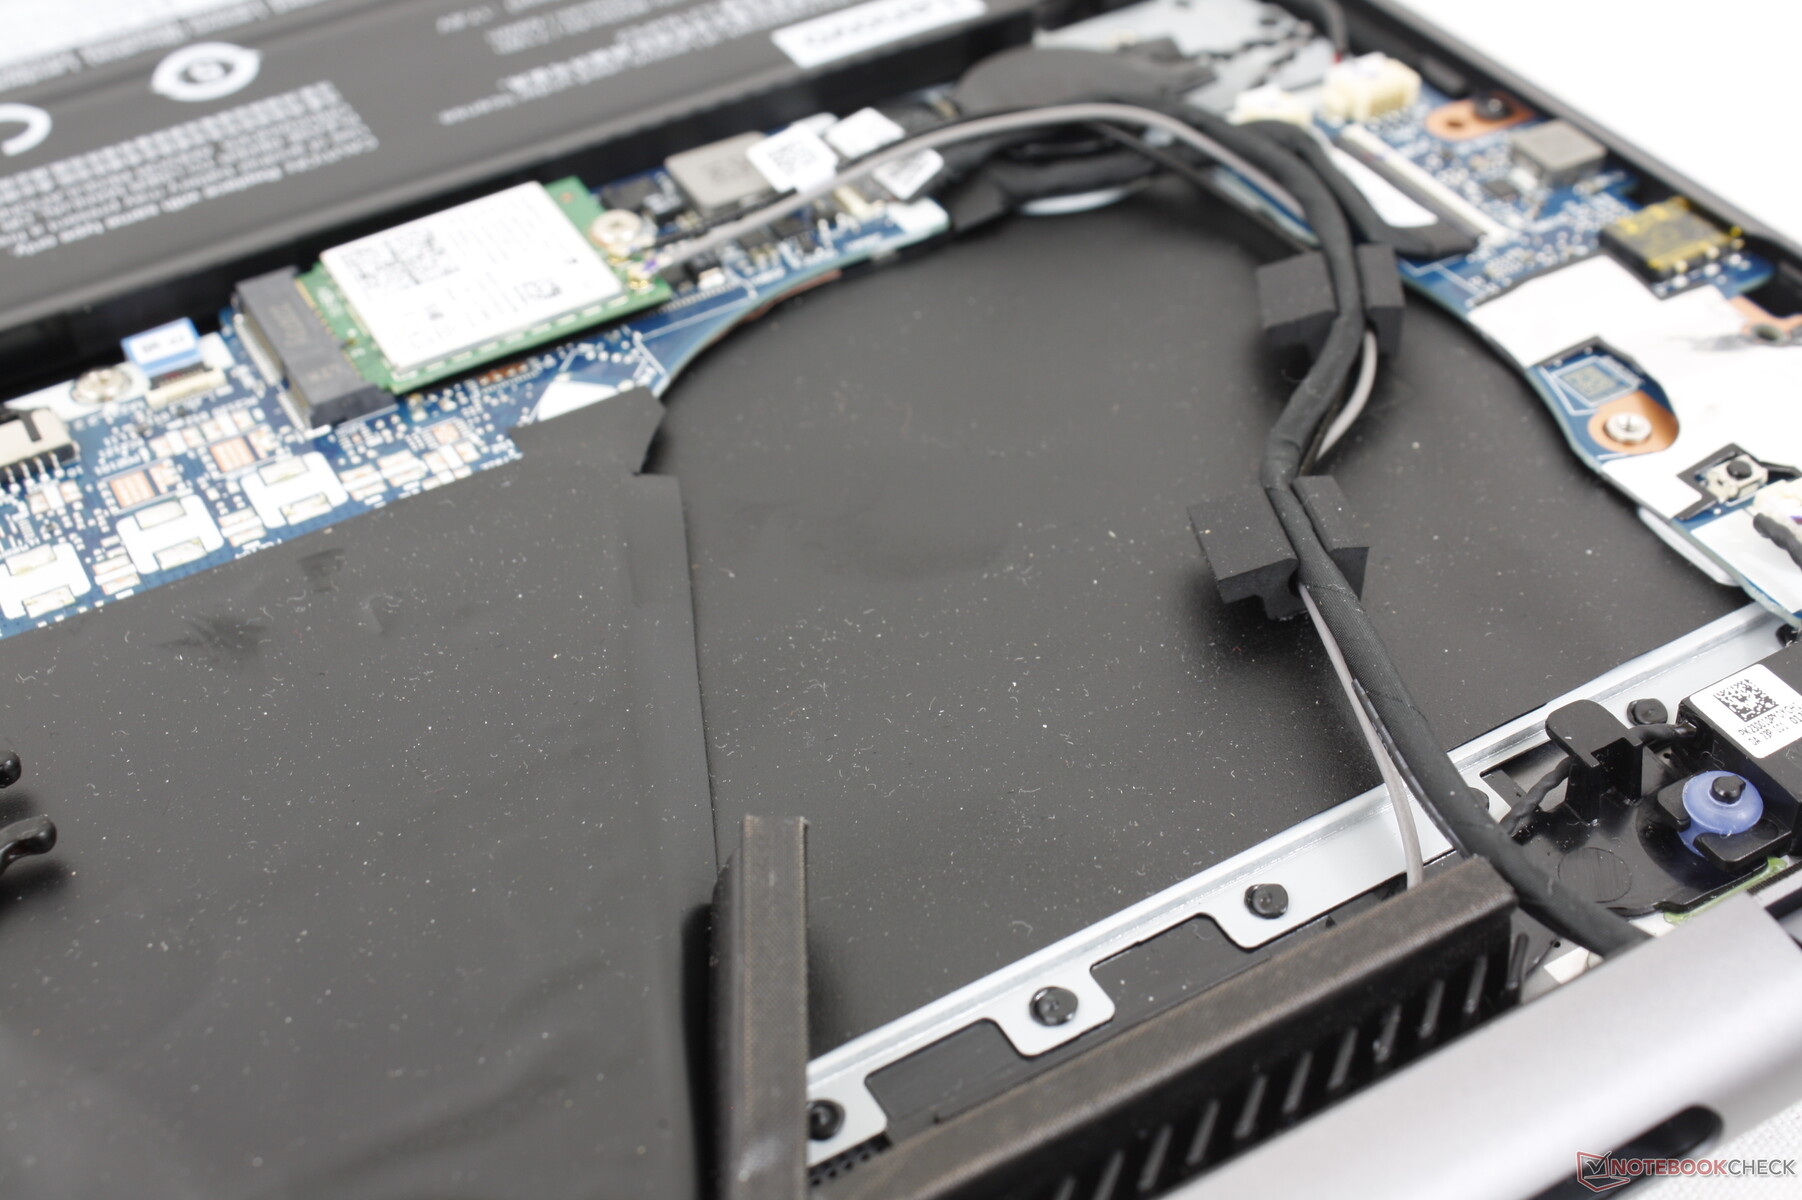
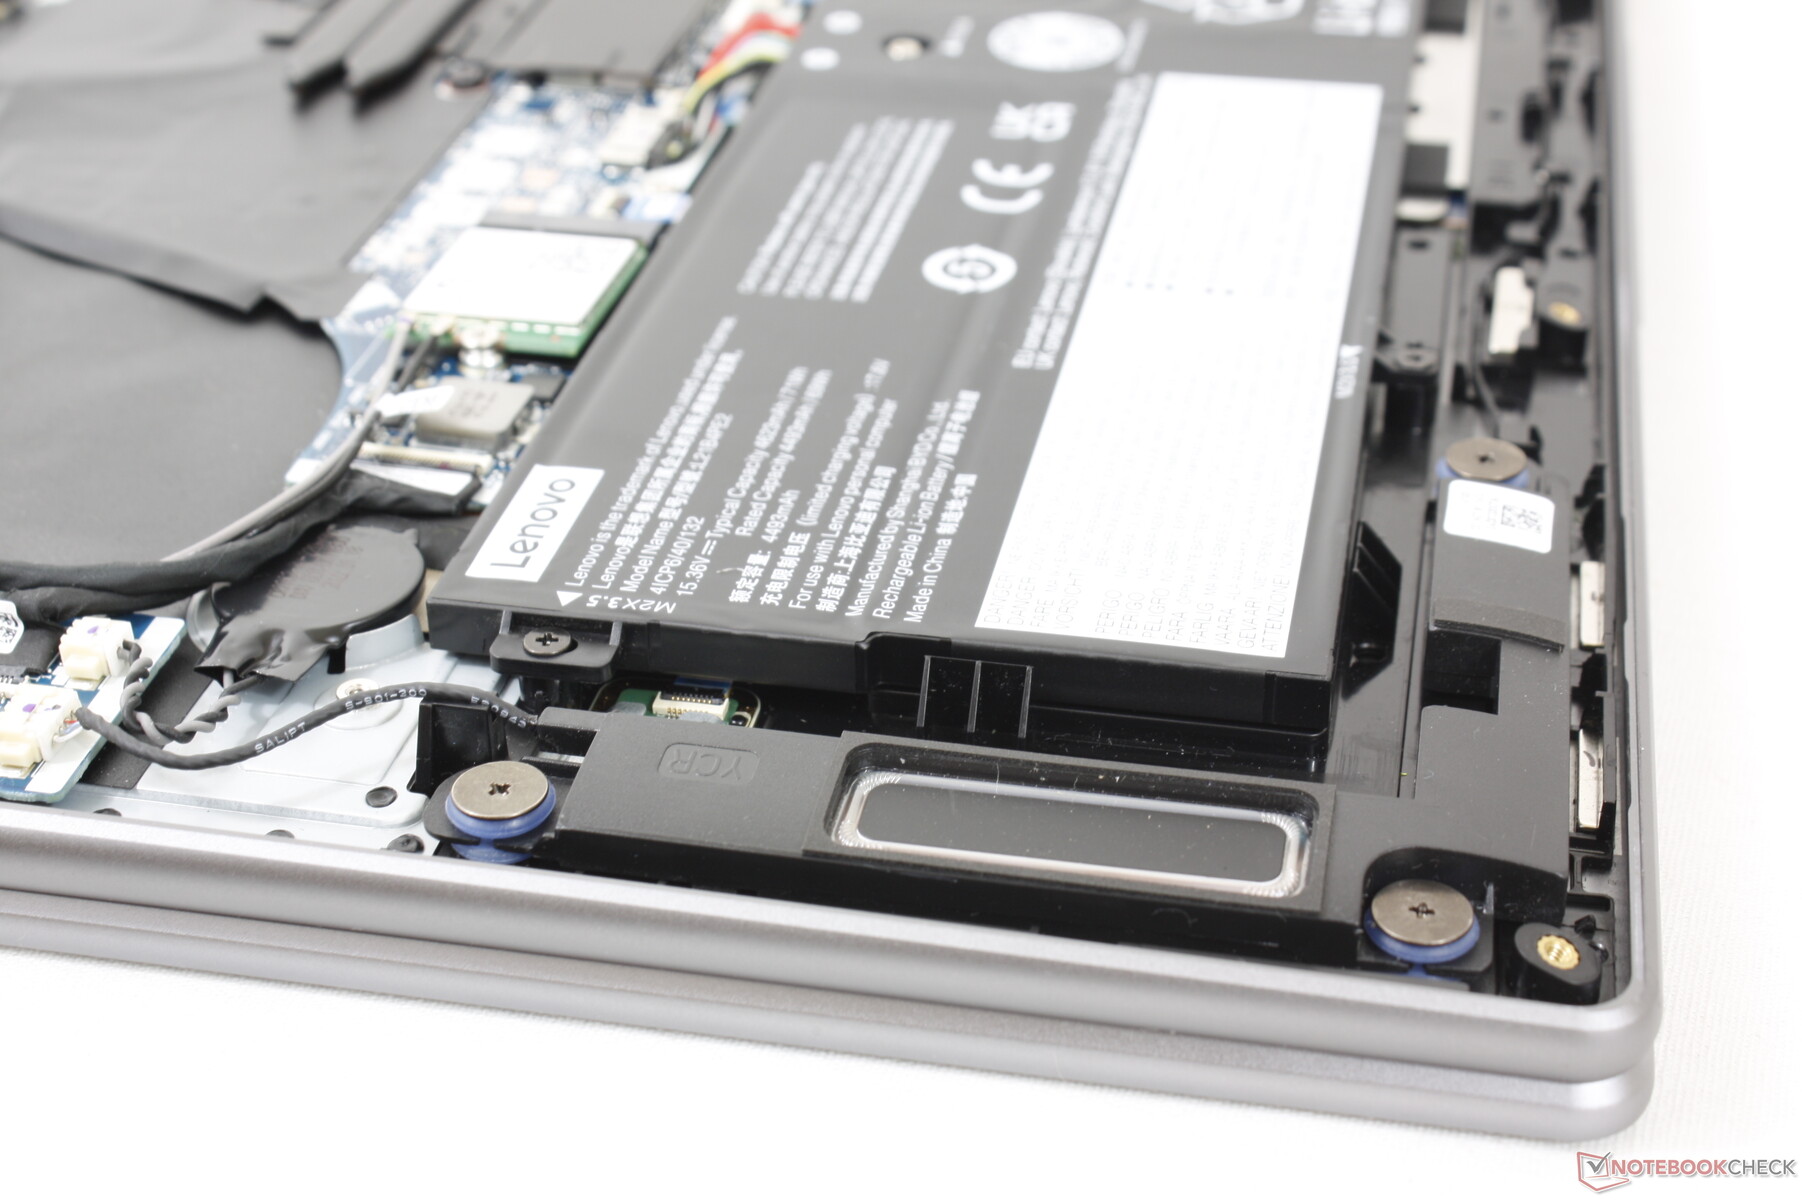
Maintenance
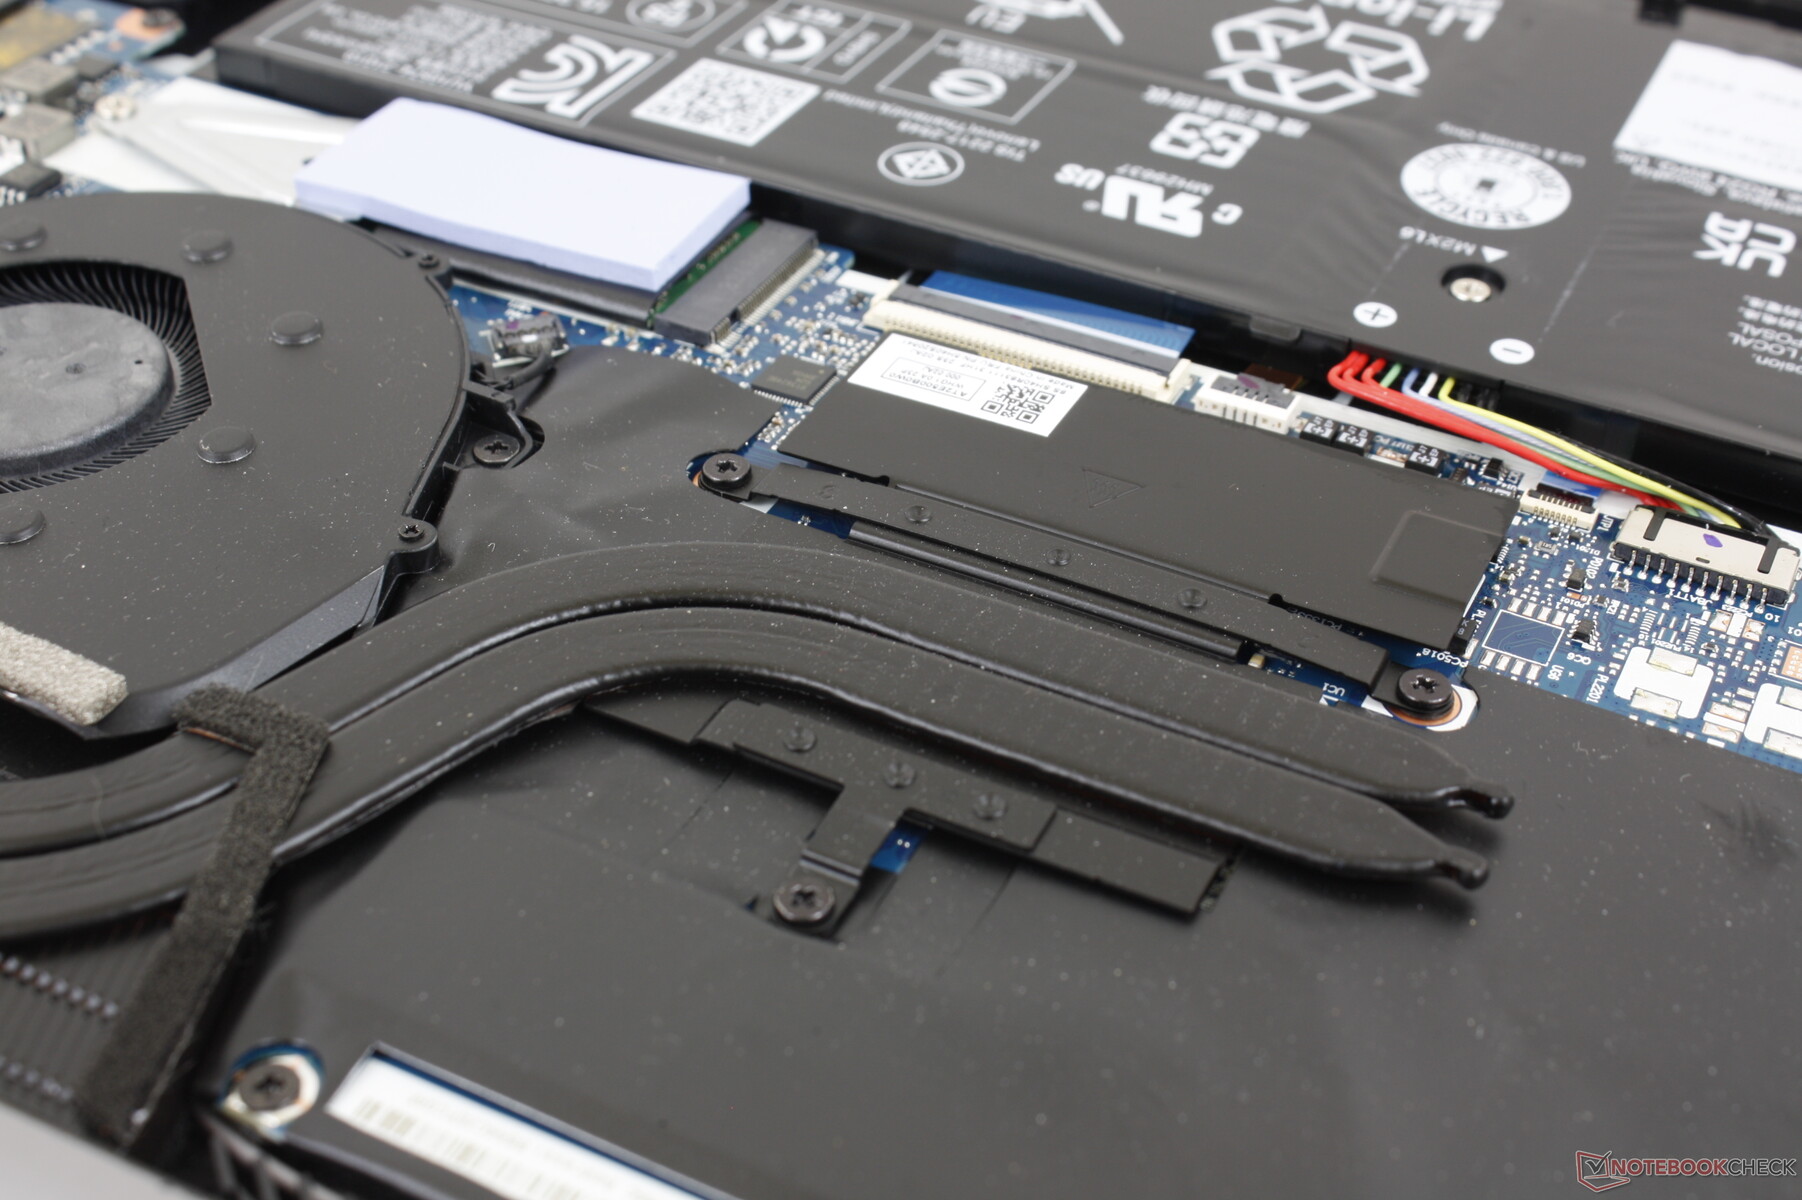
Le panneau inférieur se détache facilement après avoir retiré les sept vis Torx T5. Notez que la solution de refroidissement est plus petite sur notre configuration car elle est dépourvue du GPU Intel Arc discret. Ainsi, les utilisateurs qui configurent avec le GPU Intel peuvent s'attendre à un système encore plus lourd et potentiellement plus bruyant que ce que nous avons expérimenté sur notre unité particulière.
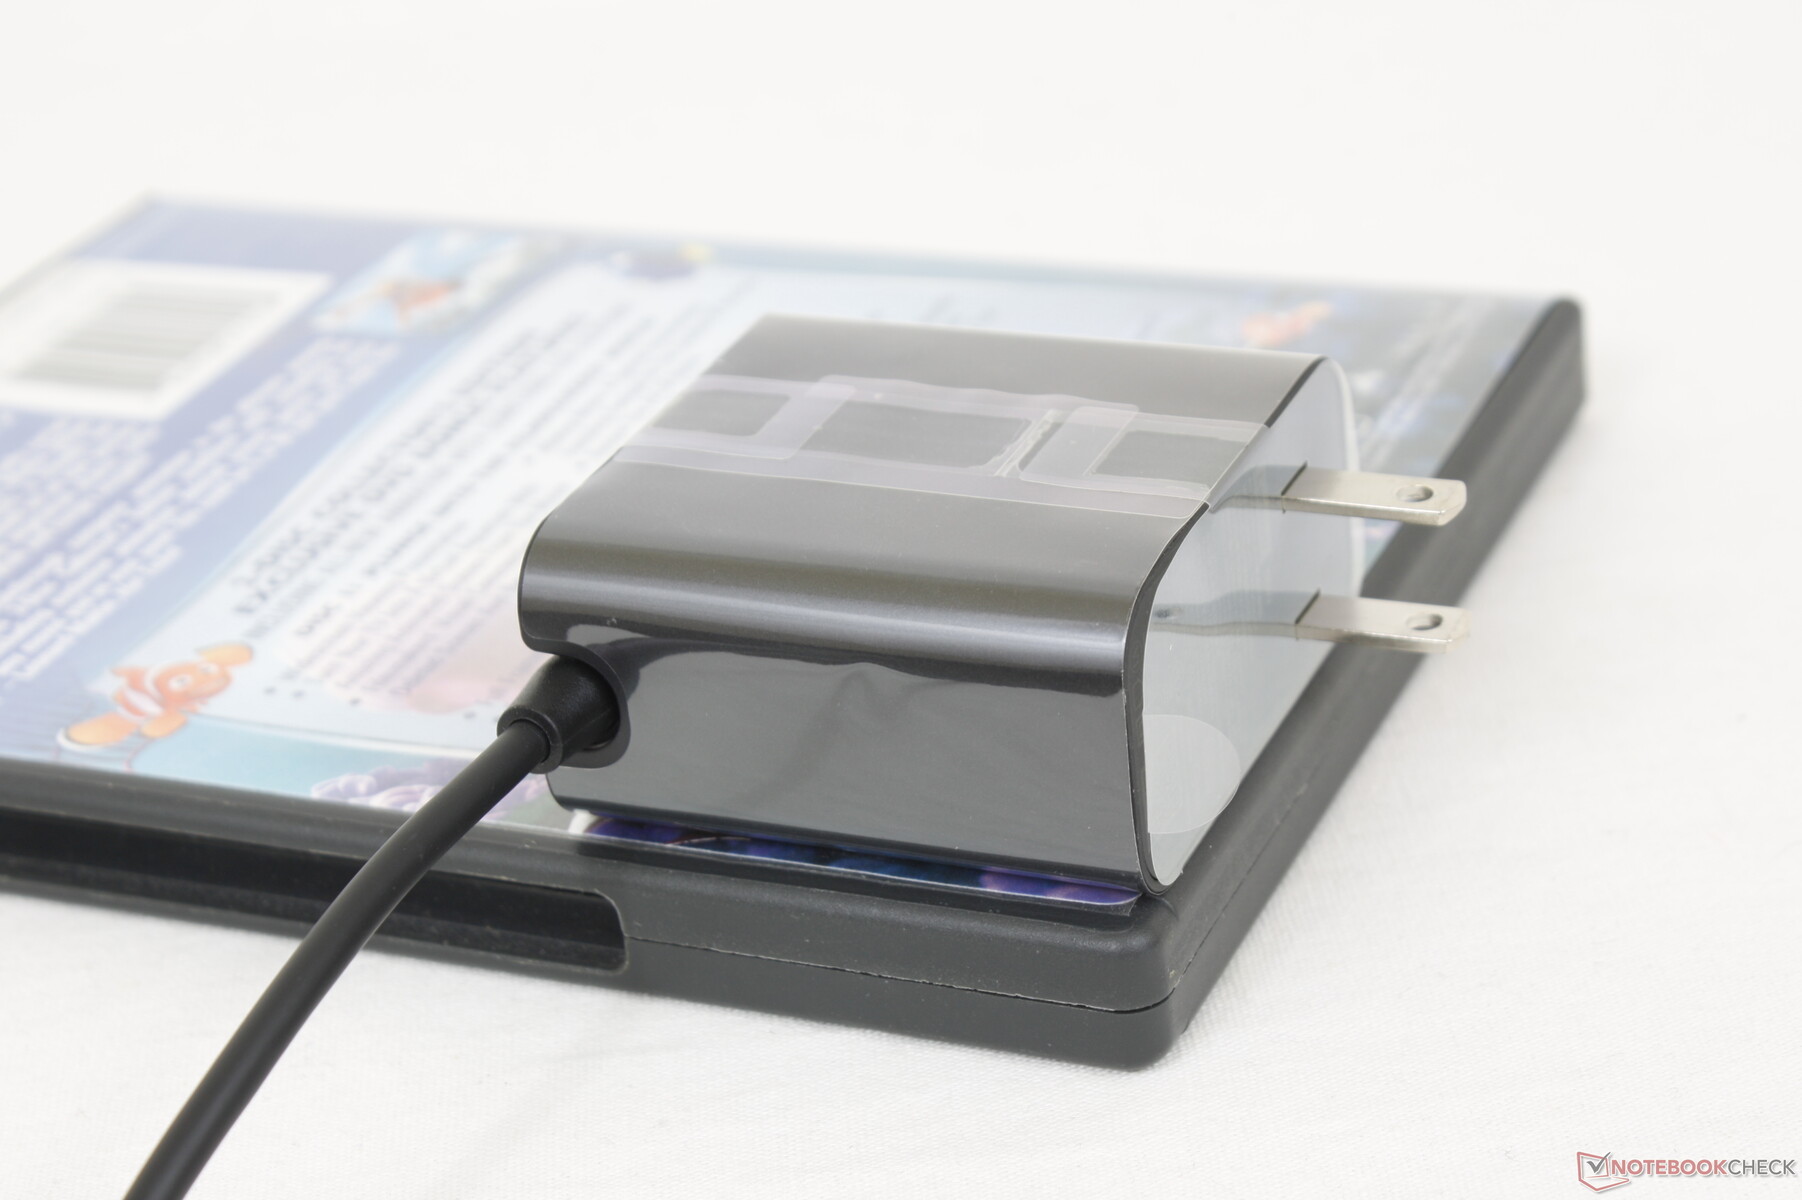
Accessoires et garantie
La boîte de détail ne comprend pas d'autres éléments que l'adaptateur secteur et la documentation. Nous aurions aimé voir un stylet actif inclus, surtout si l'on considère le prix élevé du Yoga 7 16.
Une garantie standard limitée d'un an par le fabricant s'applique si l'appareil est acheté aux États-Unis.
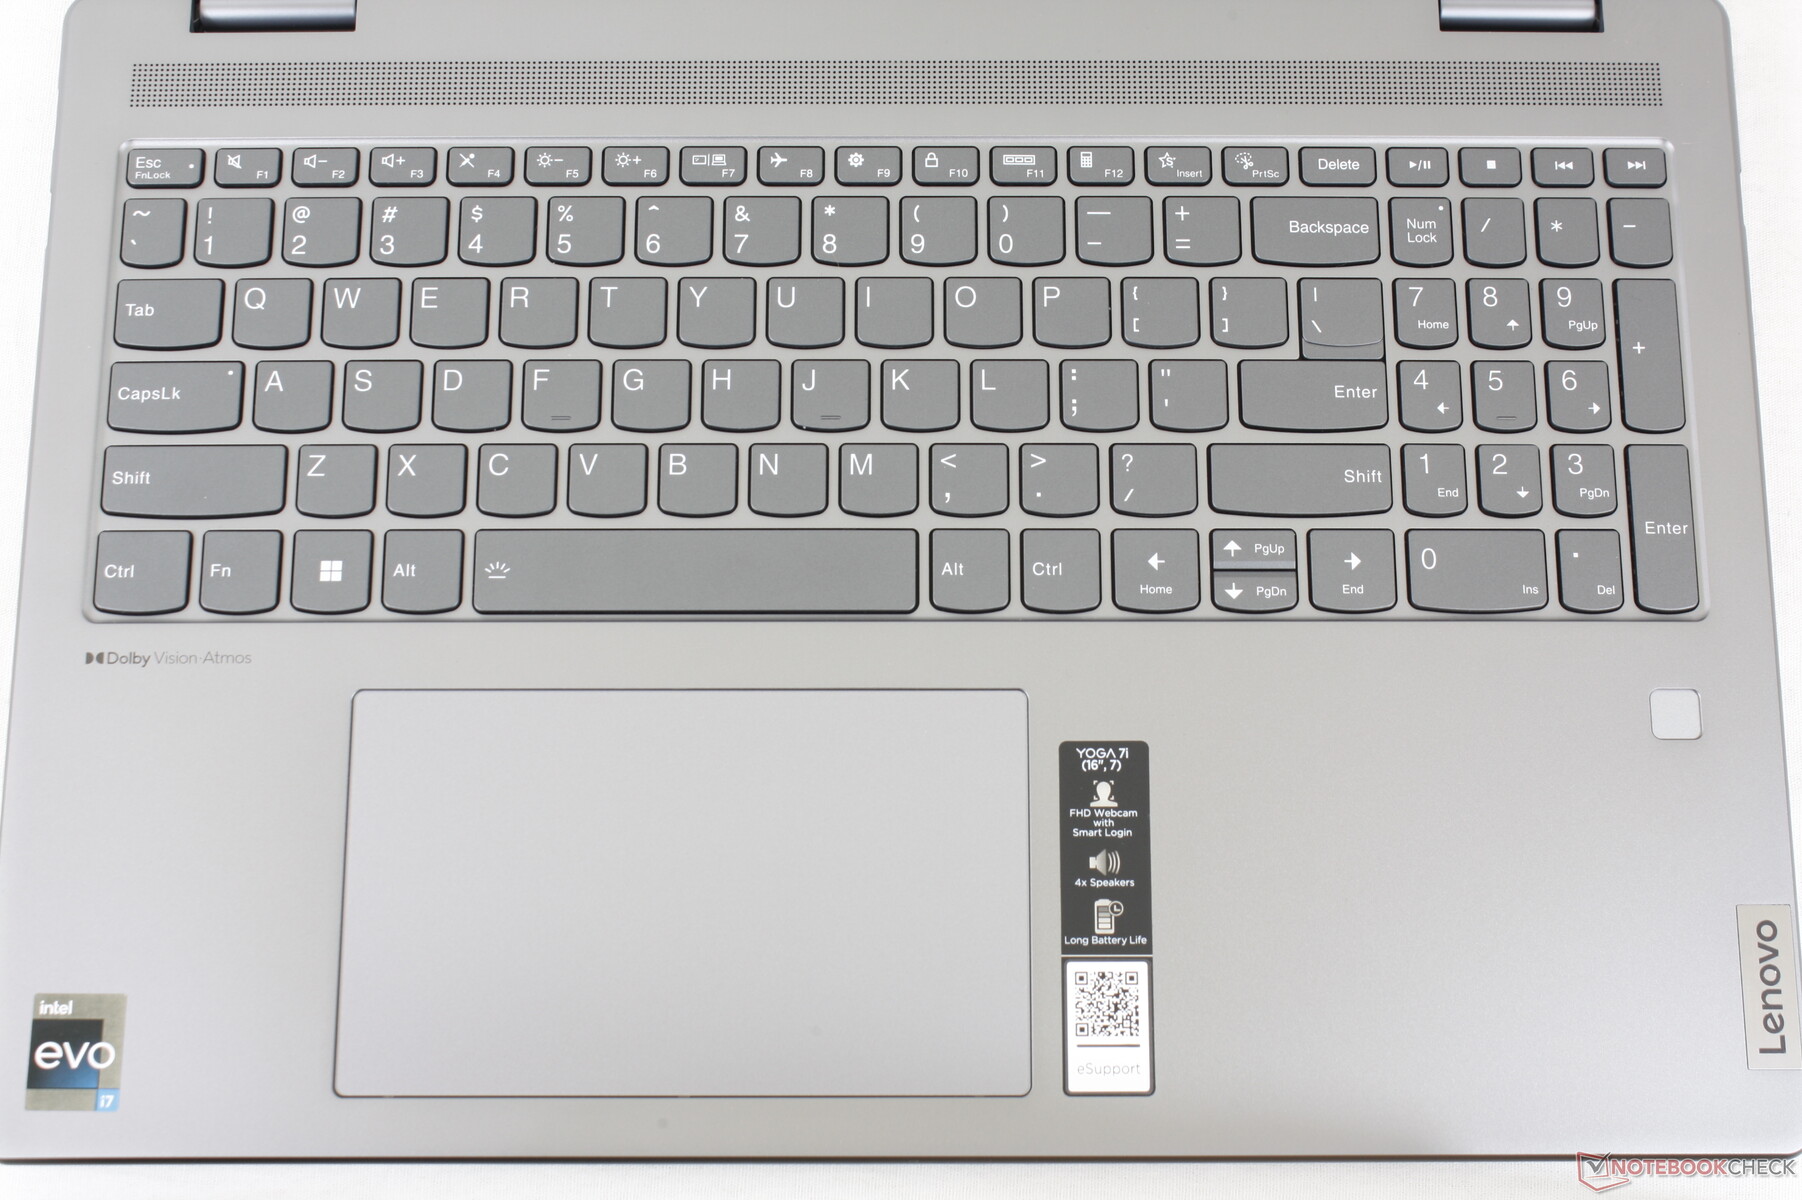
Périphériques d'entrée - Comme un IdeaPad
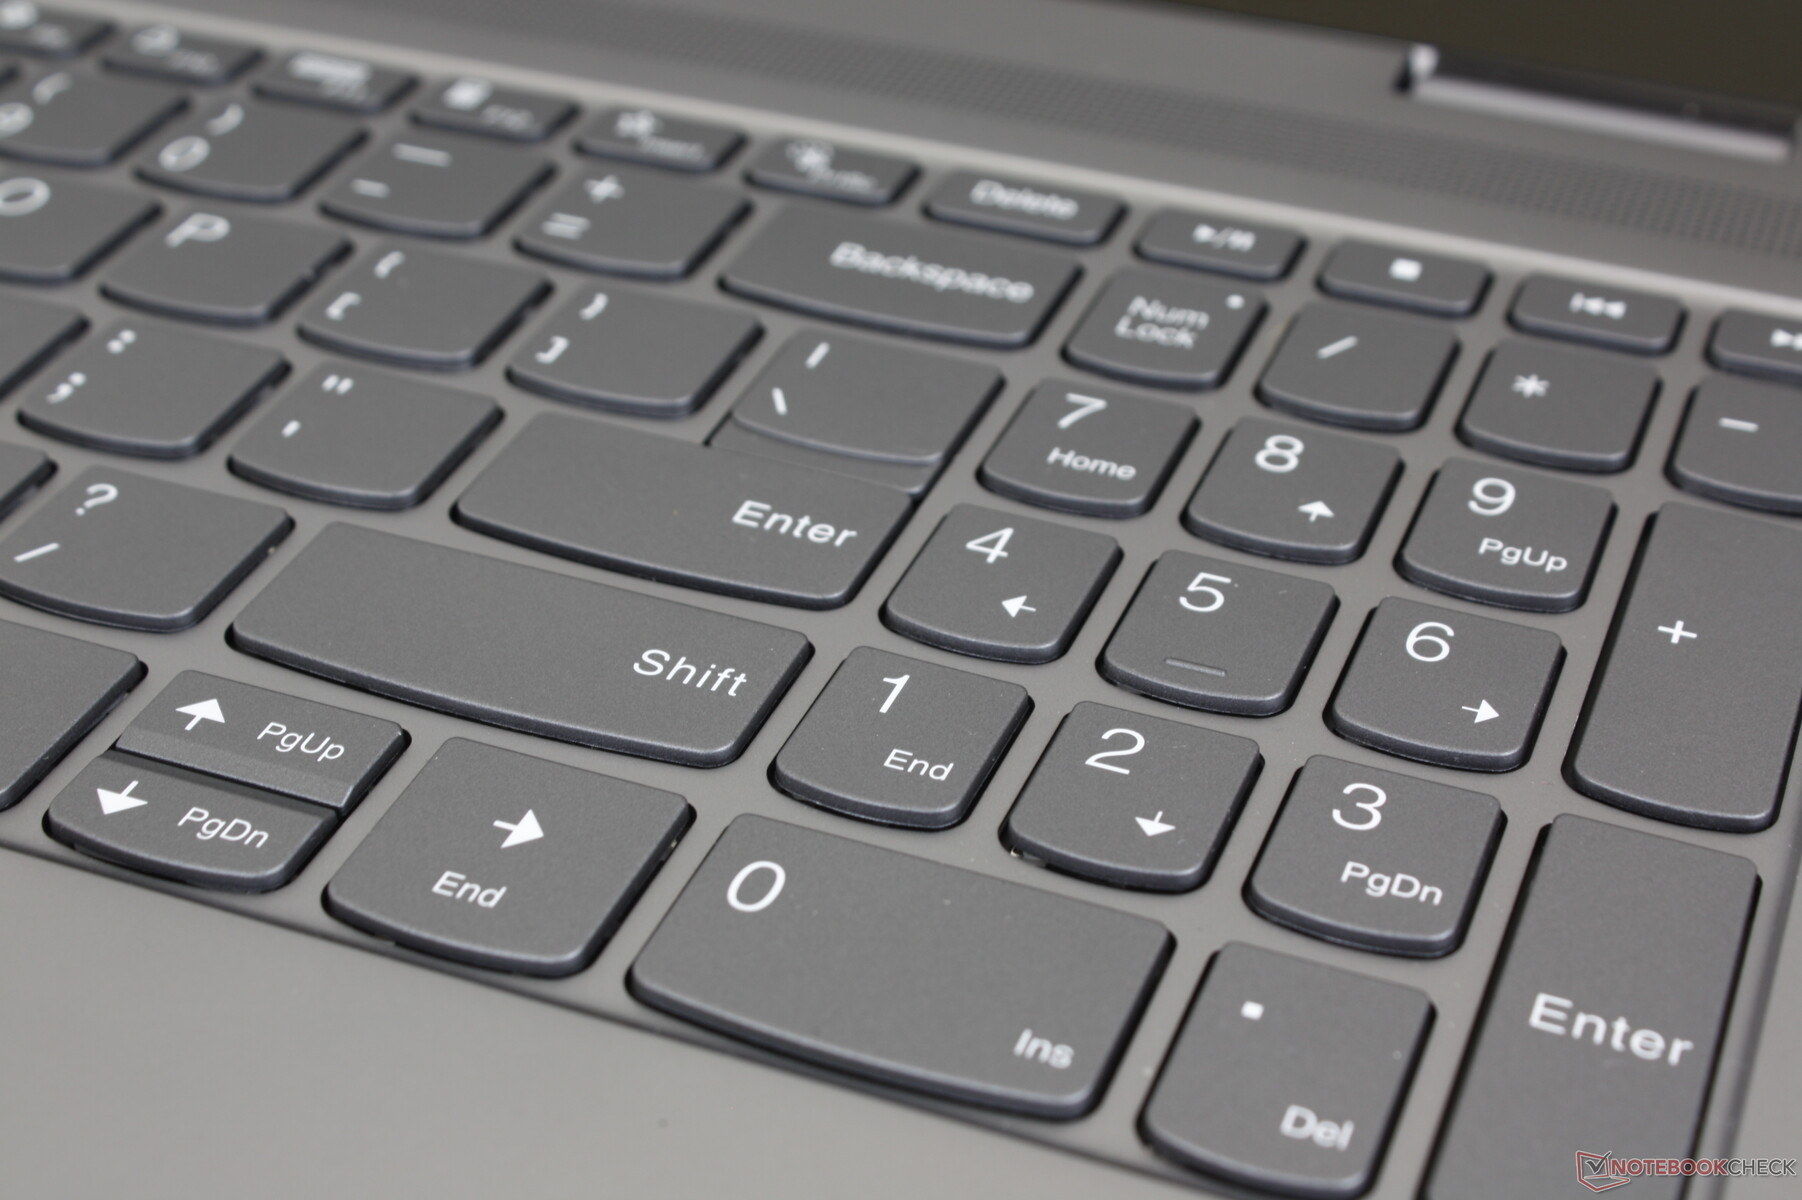
Clavier
Les claviers des modèles Yoga sont similaires à ceux des modèles IdeaPad. Ainsi, l'expérience de la frappe vous sera familière si vous avez déjà utilisé des ordinateurs portables IdeaPad ou Yoga. Les touches sont légères et relativement nettes, mais leur course est faible et le bruit est modérément fort. Les touches du HP Envy ou LG Gram sont plus profondes en comparaison.
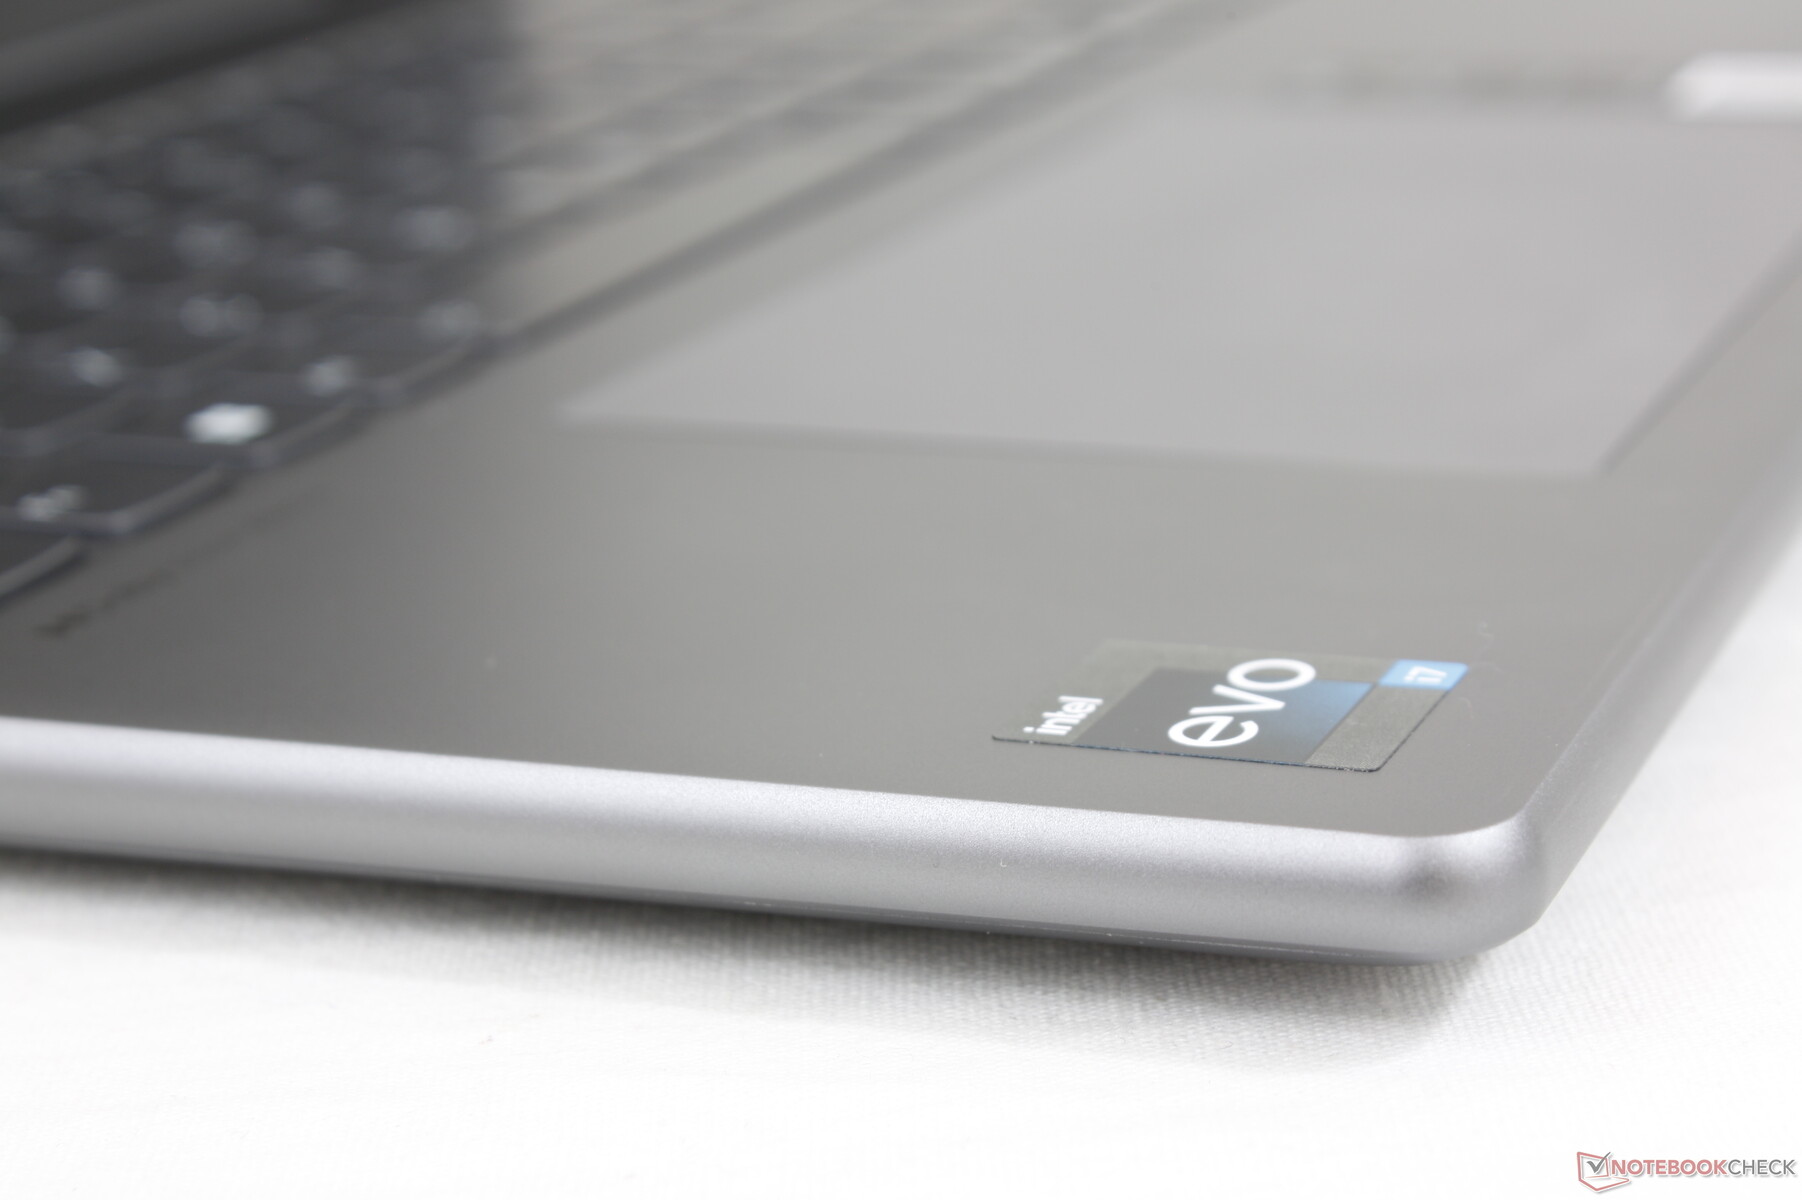
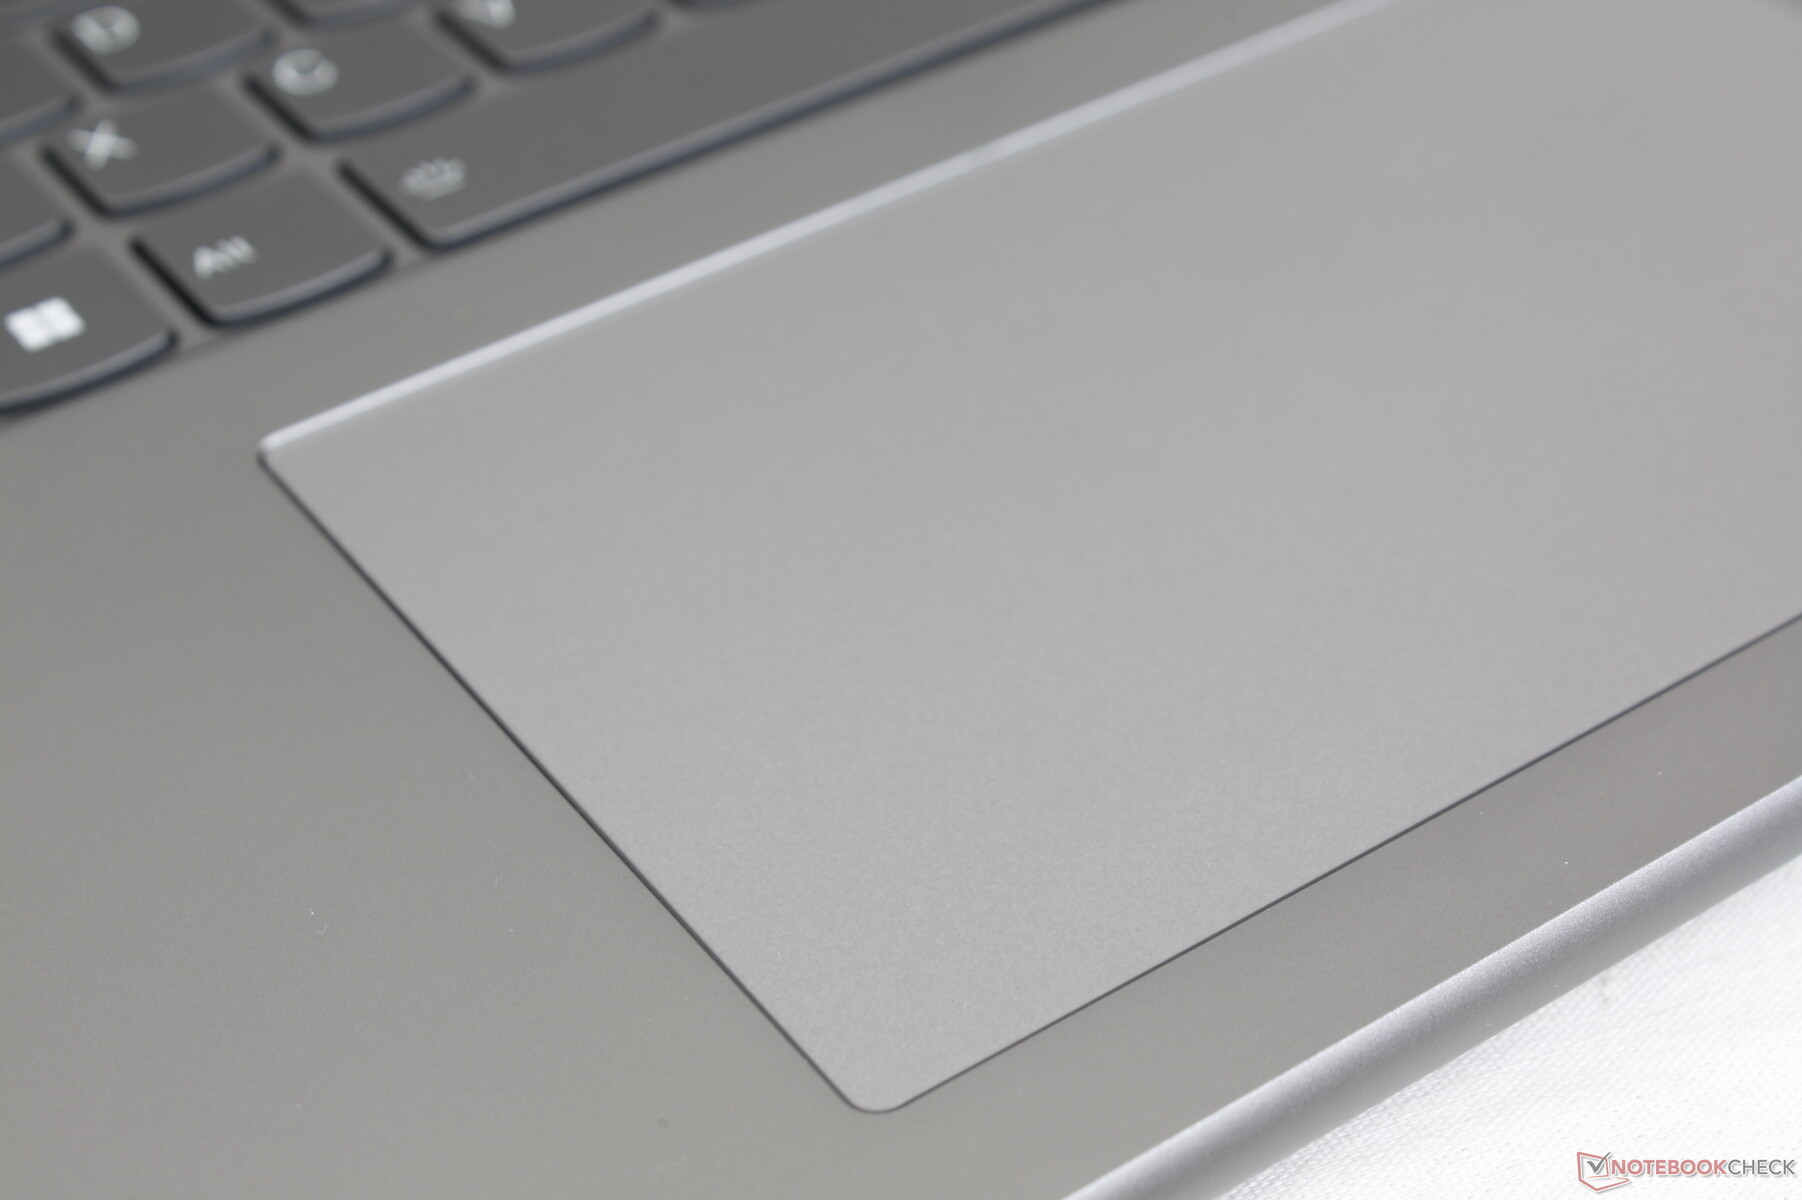
Pavé tactile
Avec ses 13,5 x 8 cm, le pavé tactile est légèrement plus petit que celui du Dell Inspiron 16 7620 2-en-1 (~13,3 x 9 cm) ou du LG Gram 16 2-en-1 (13,2 x 8,3 cm). Il est néanmoins spacieux et offre une glisse très douce pour des entrées multi-touch confortables et le défilement du curseur.
Les touches du pavé tactile intégré ont un retour décent lorsqu'elles sont pressées, mais le clic est fort, ce que certains utilisateurs pourraient ne pas préférer.

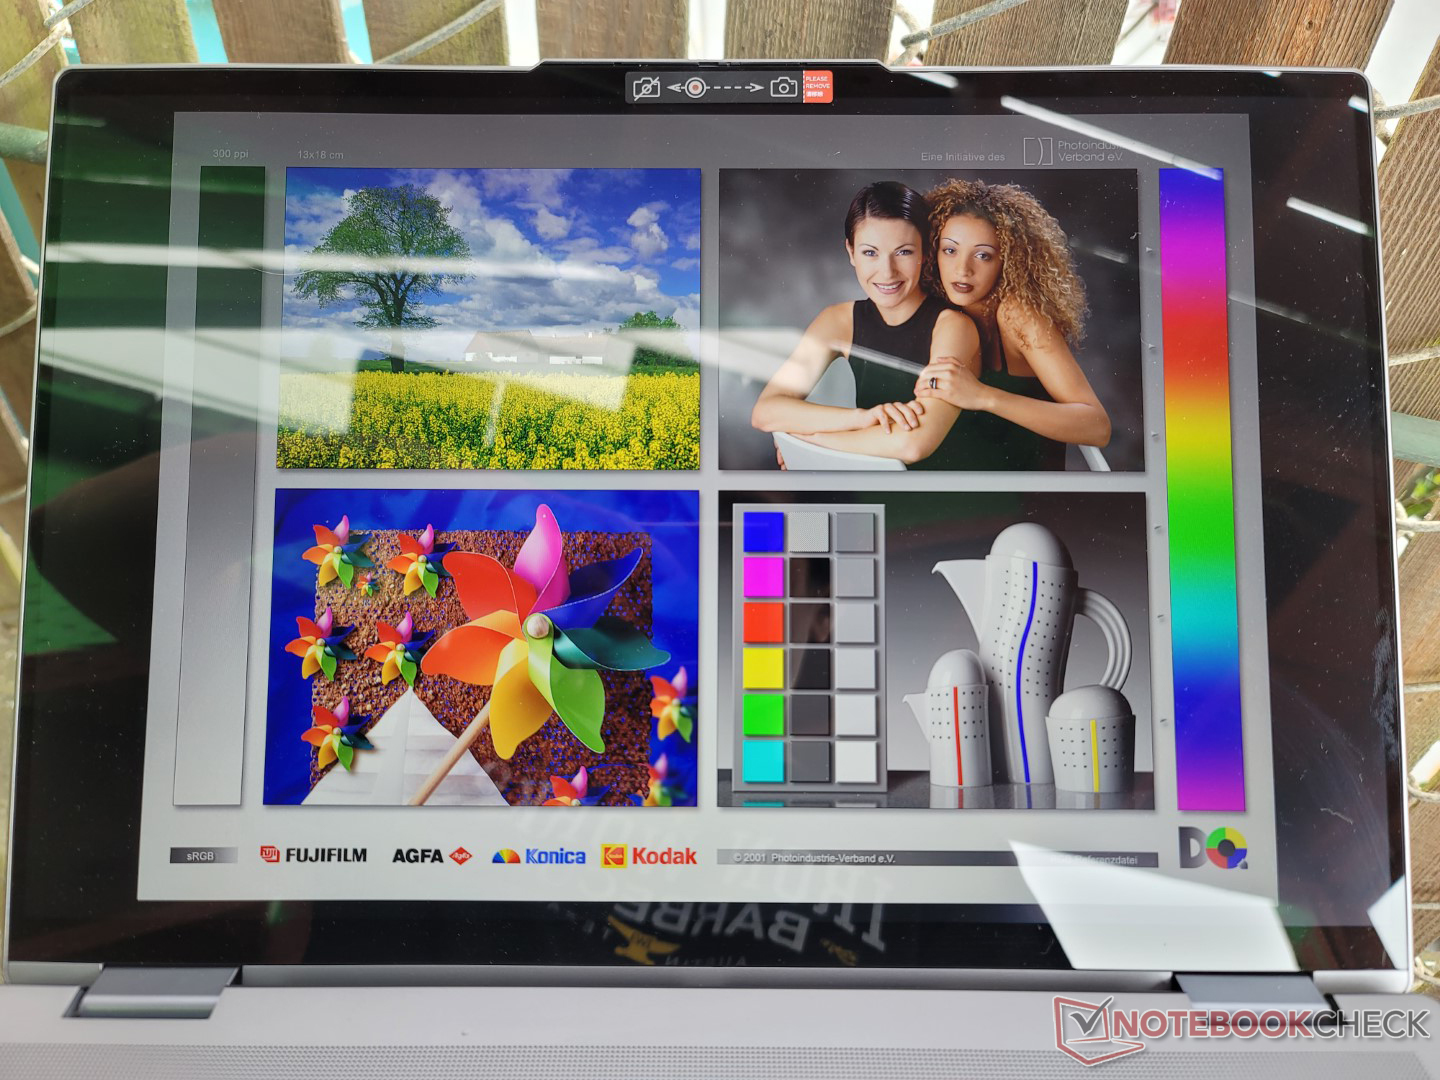
Affichage - Pas d'option 90 Hz ou 120 Hz
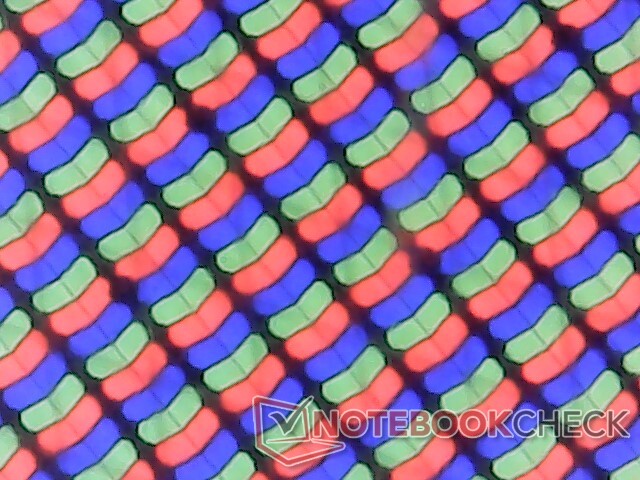
HWiNFO fait état d'une dalle IPS 16:10 LEN160WQXGA similaire à celle de l'IdeaPad 5 Pro 16IHU6 IdeaPad 5 Pro 16IHU6. En réalité, cependant, les écrans sont assez différents entre les deux. Tout d'abord, notre modèle Yoga est limité à un taux de rafraîchissement natif de 60 Hz, contre 120 Hz sur l'IdeaPad. Deuxièmement, les temps de réponse sont beaucoup plus lents sur notre Yoga. Les couleurs et le contraste sont autrement proches entre les deux modèles. Il est tout de même décevant de constater que l'écran d'un IdeaPad est supérieur à celui de notre Yoga, même si la série Yoga est censée être un cran au-dessus de la série IdeaPad.
| |||||||||||||||||||||||||
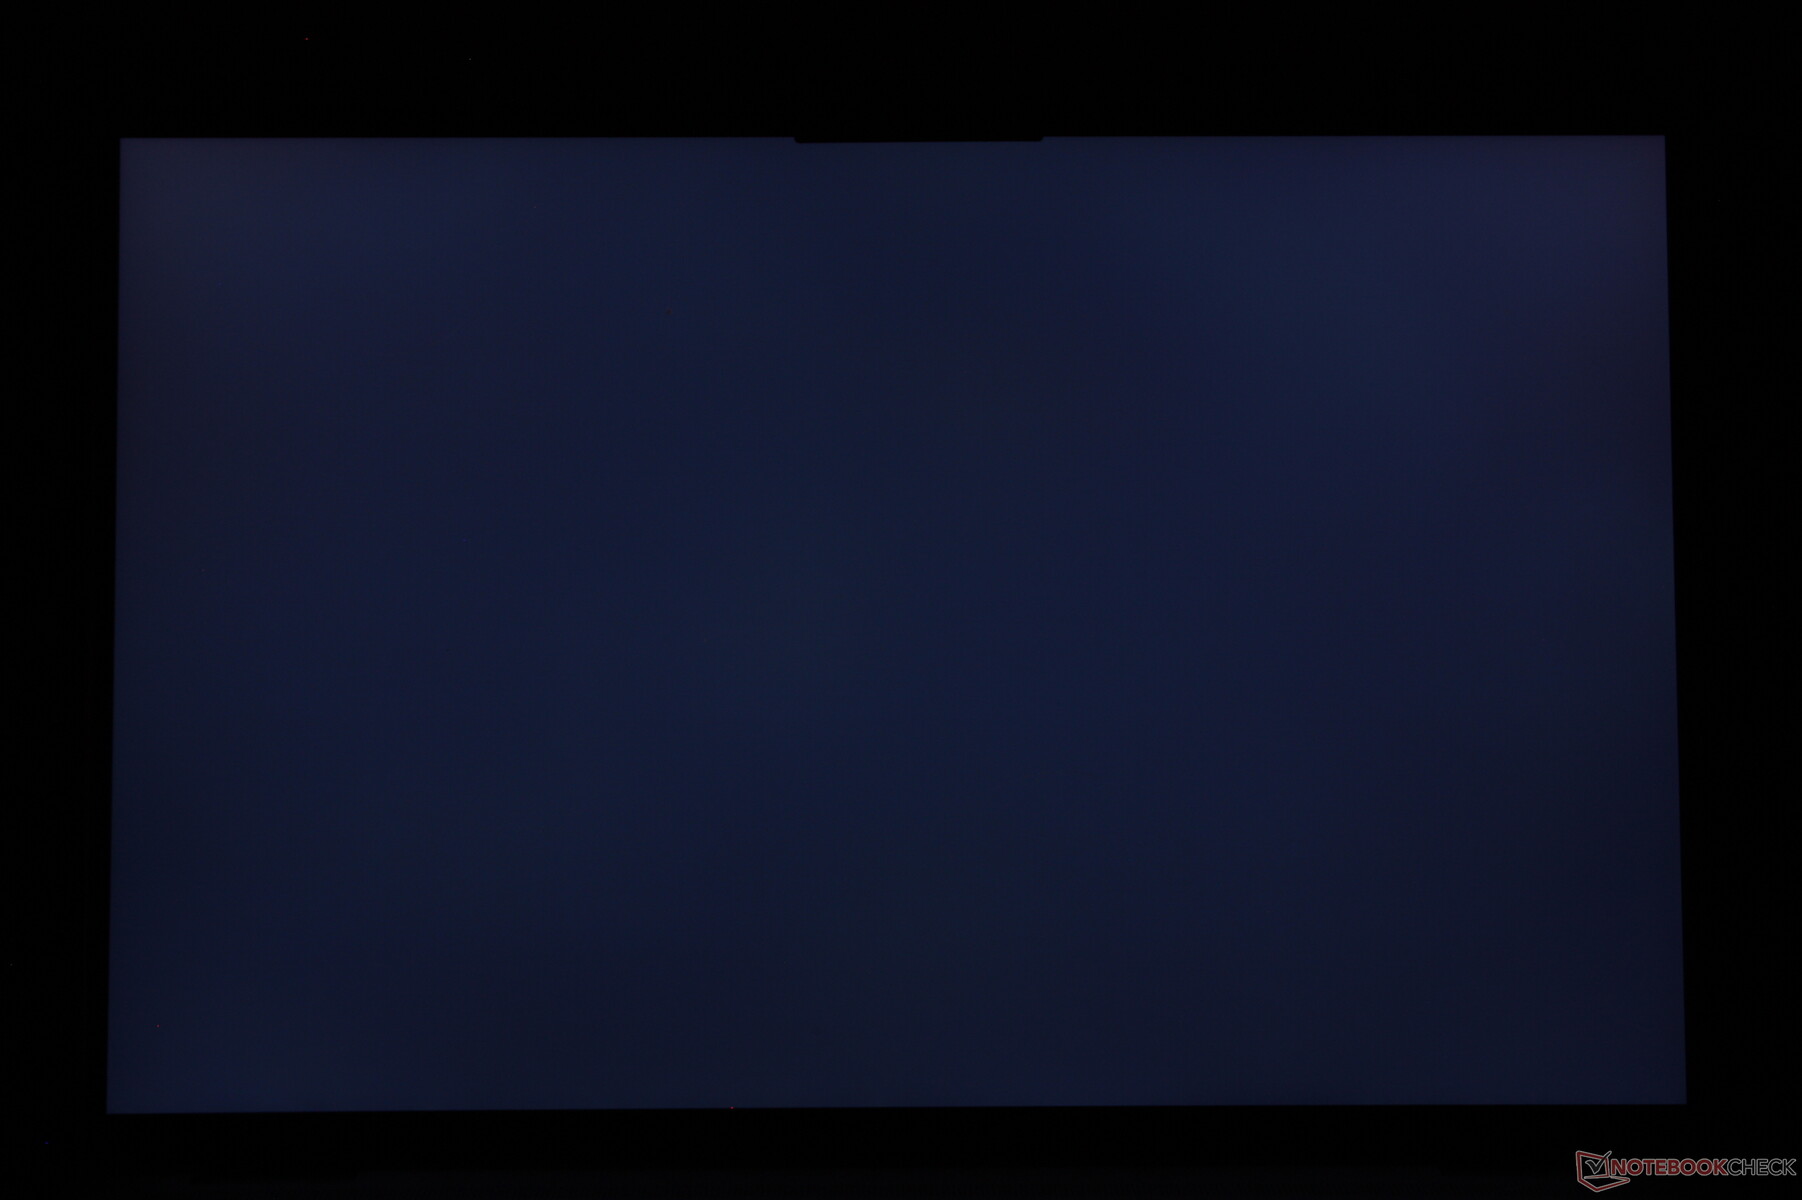
Homogénéité de la luminosité: 84 %
Valeur mesurée au centre, sur batterie: 393.7 cd/m²
Contraste: 1036:1 (Valeurs des noirs: 0.38 cd/m²)
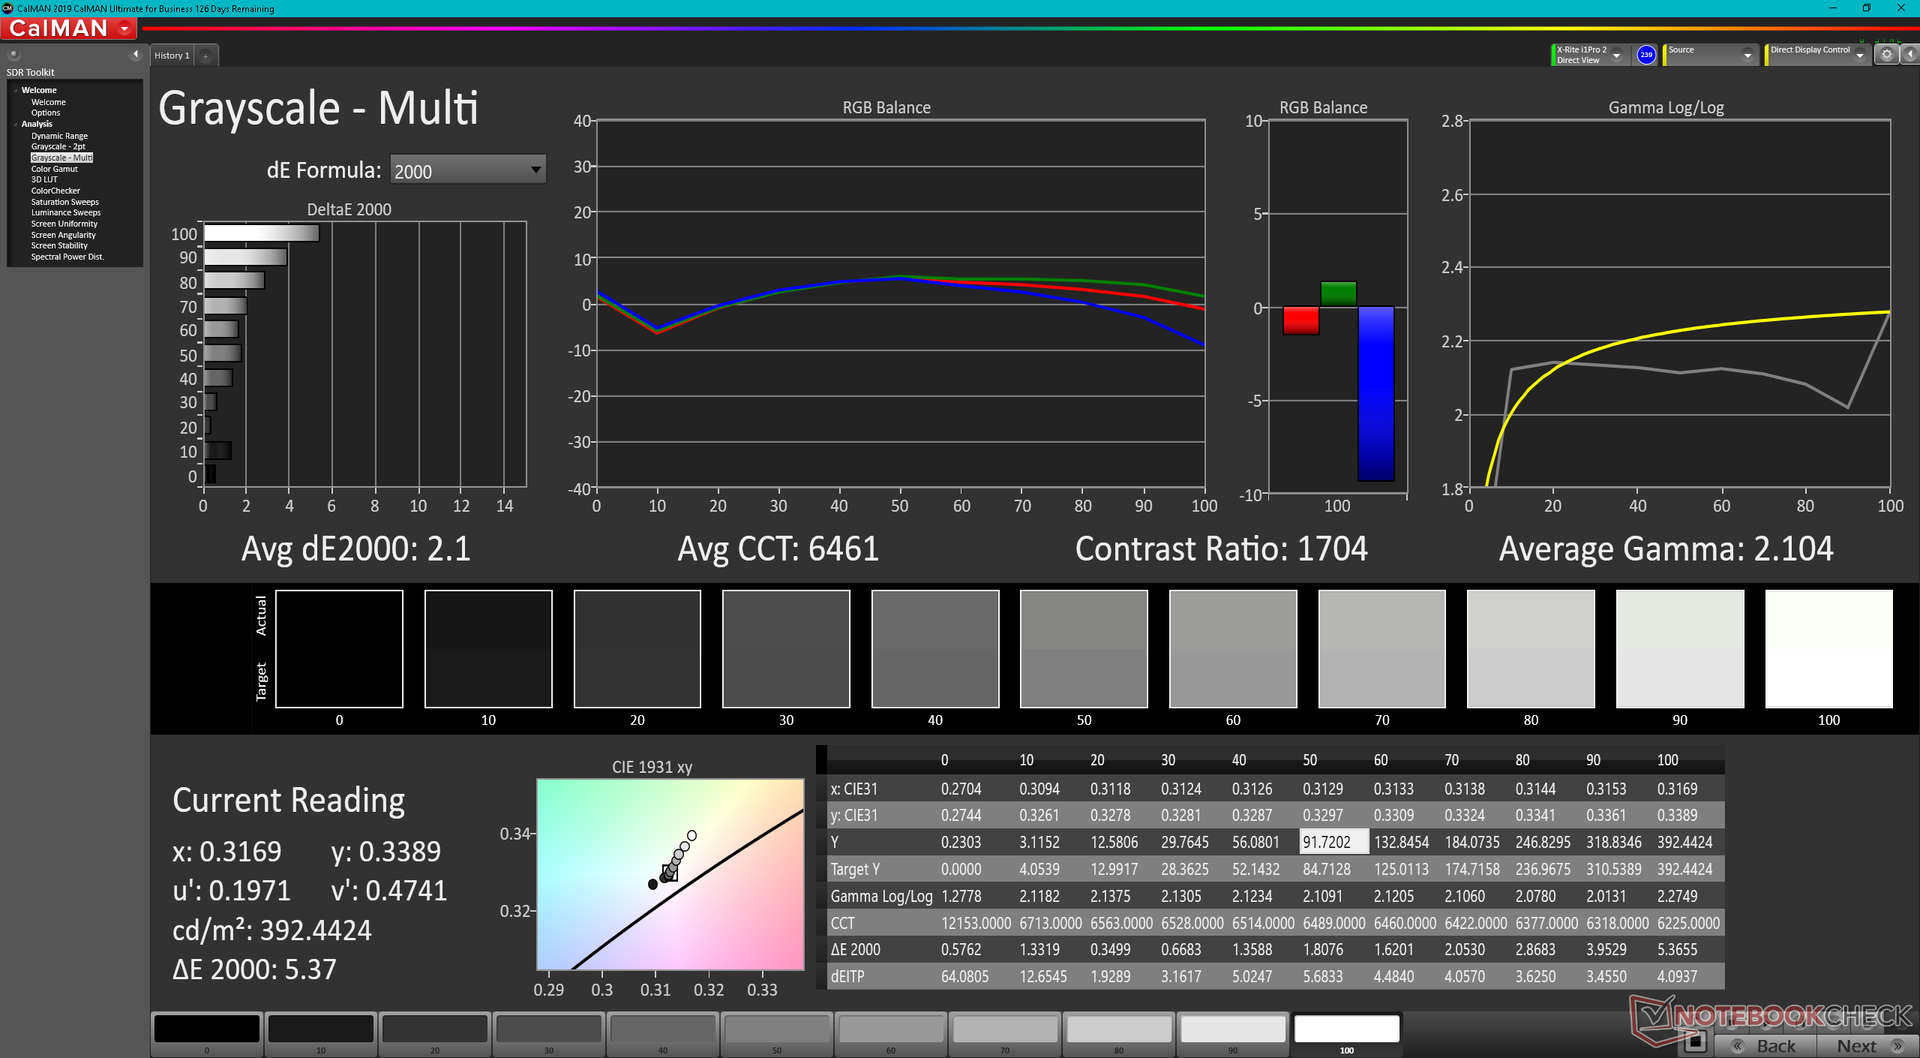
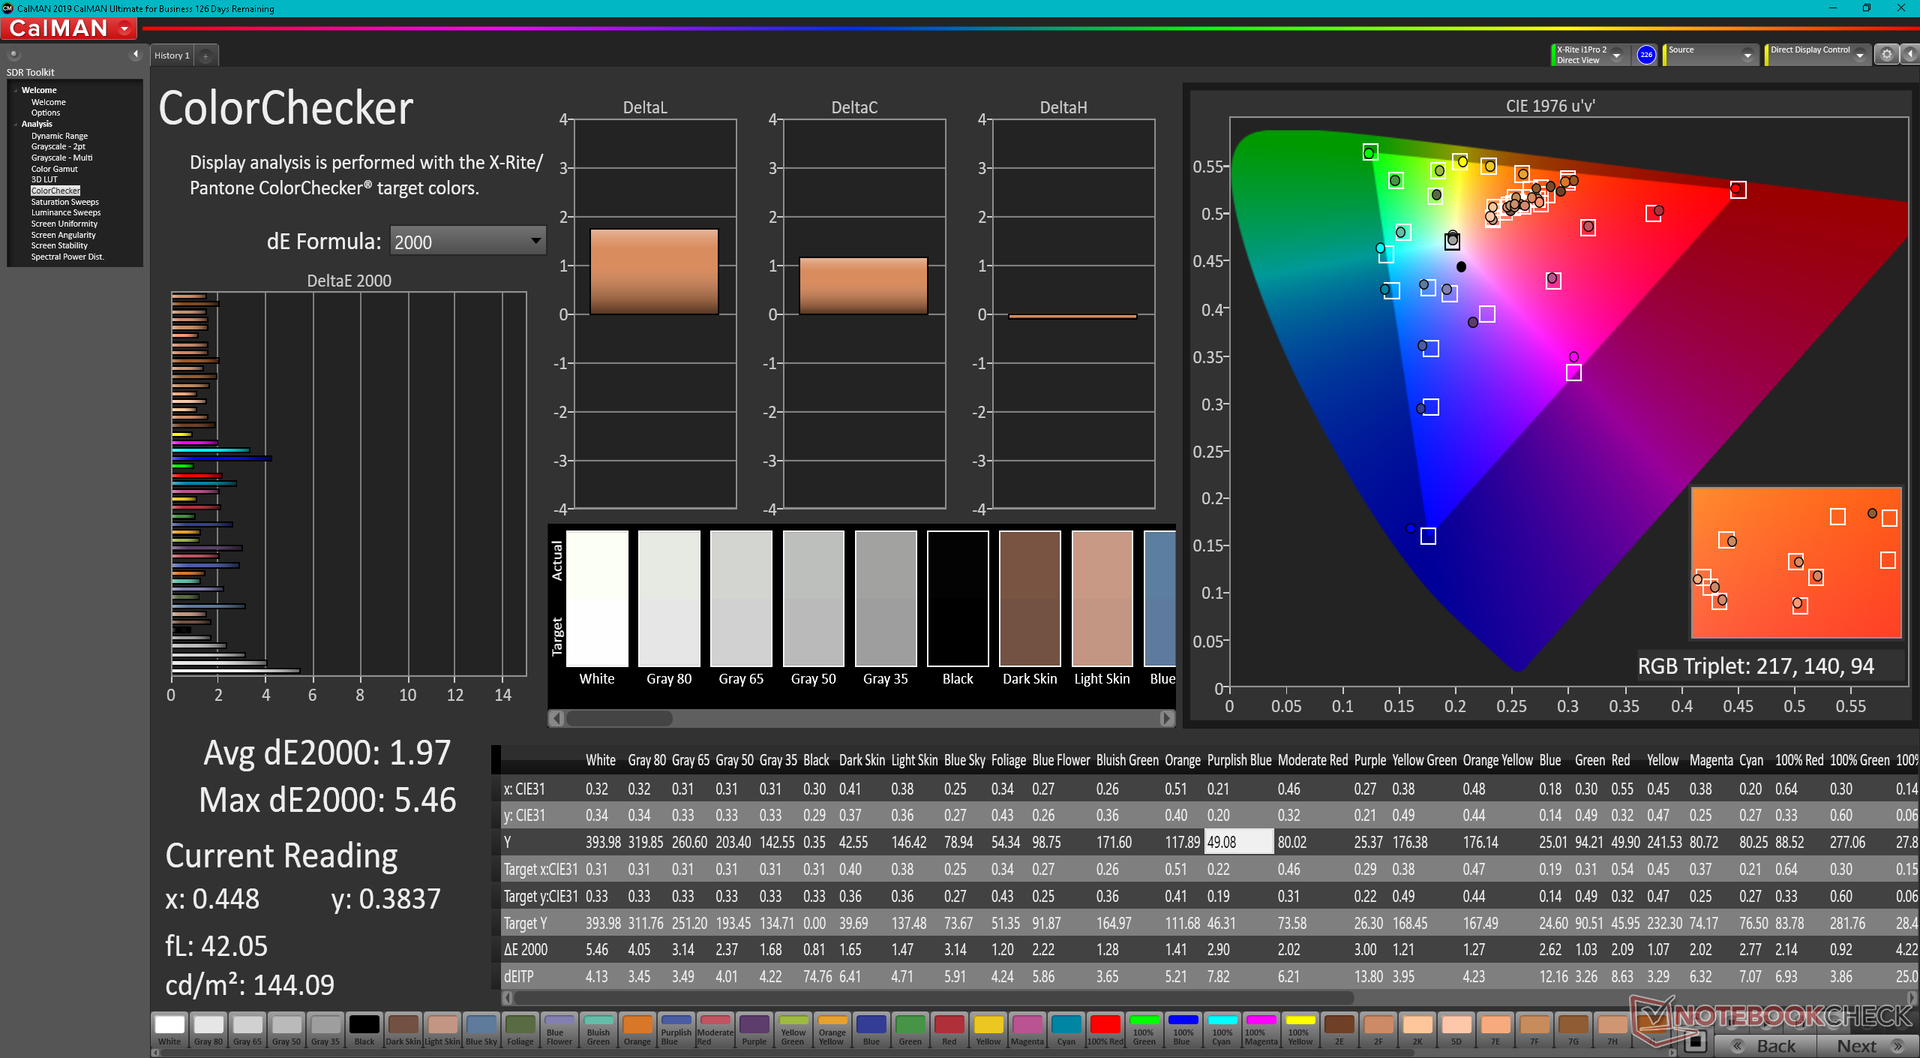
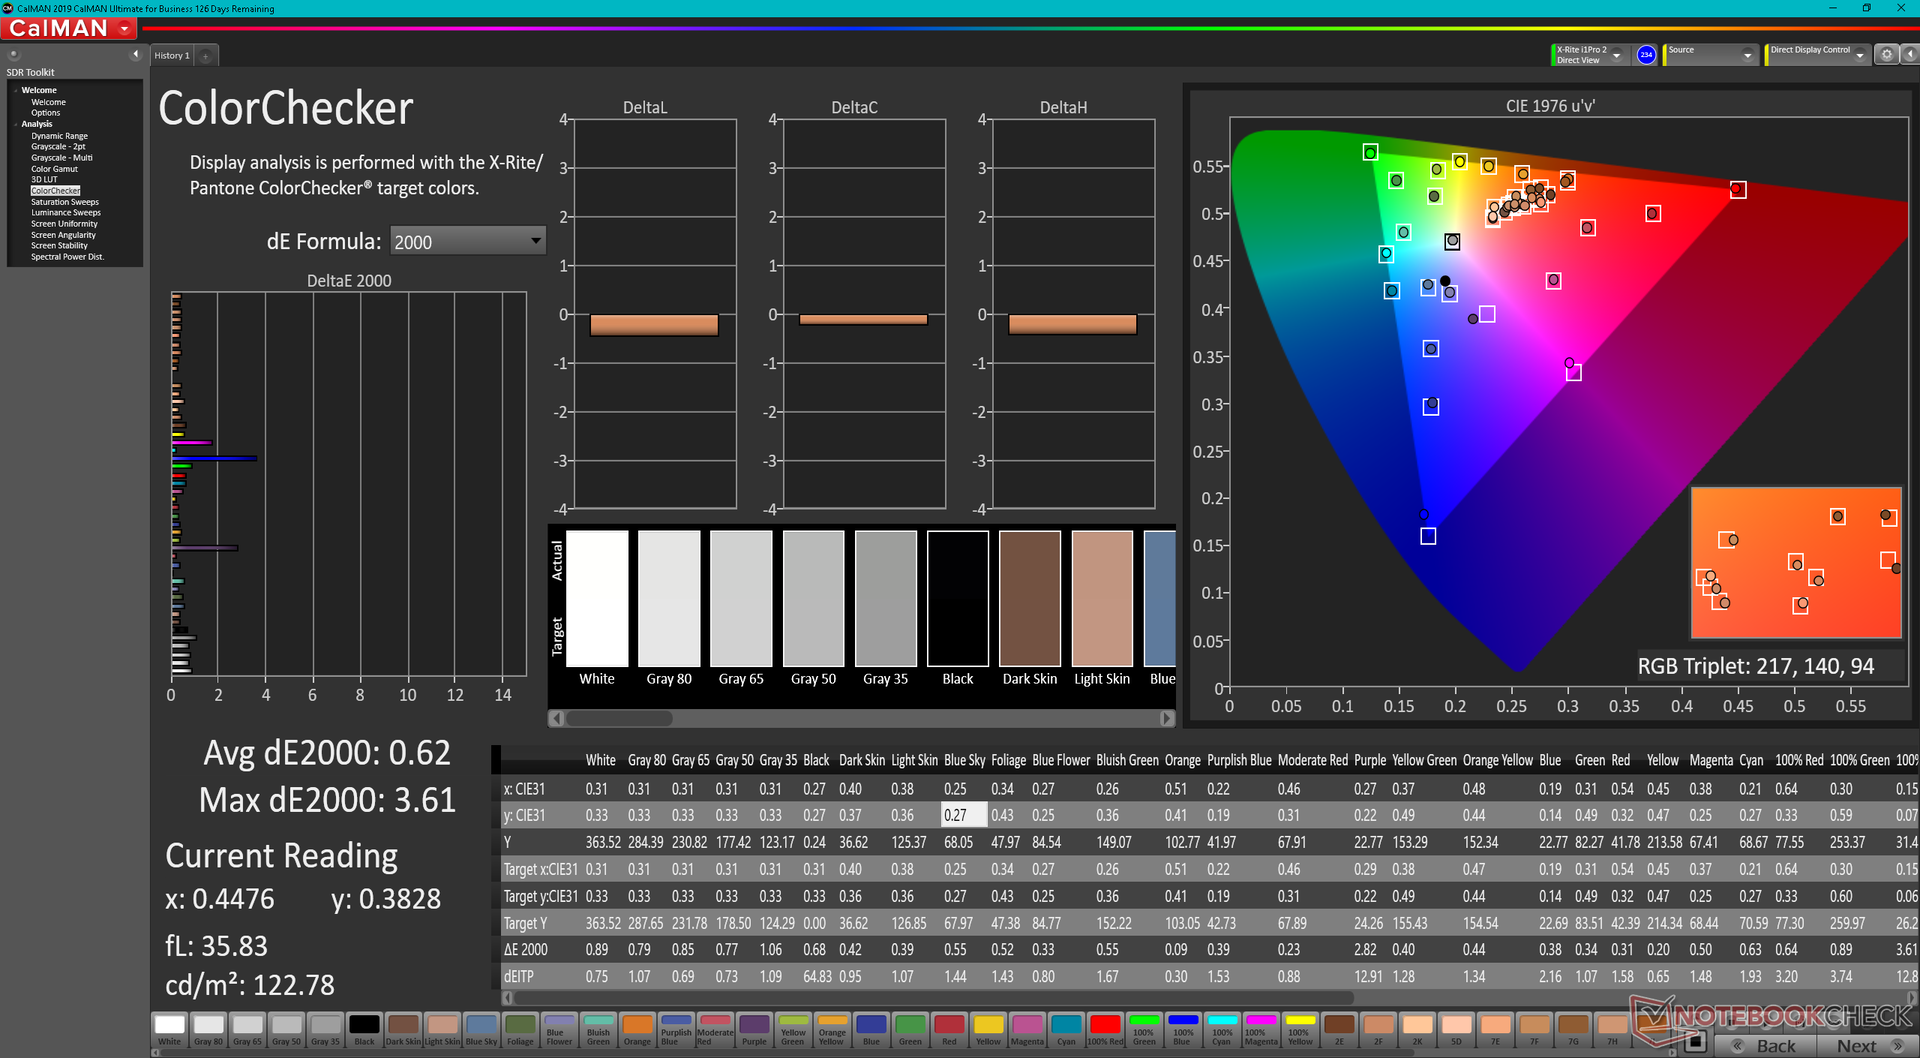
ΔE Color 1.97 | 0.5-29.43 Ø5, calibrated: 0.62
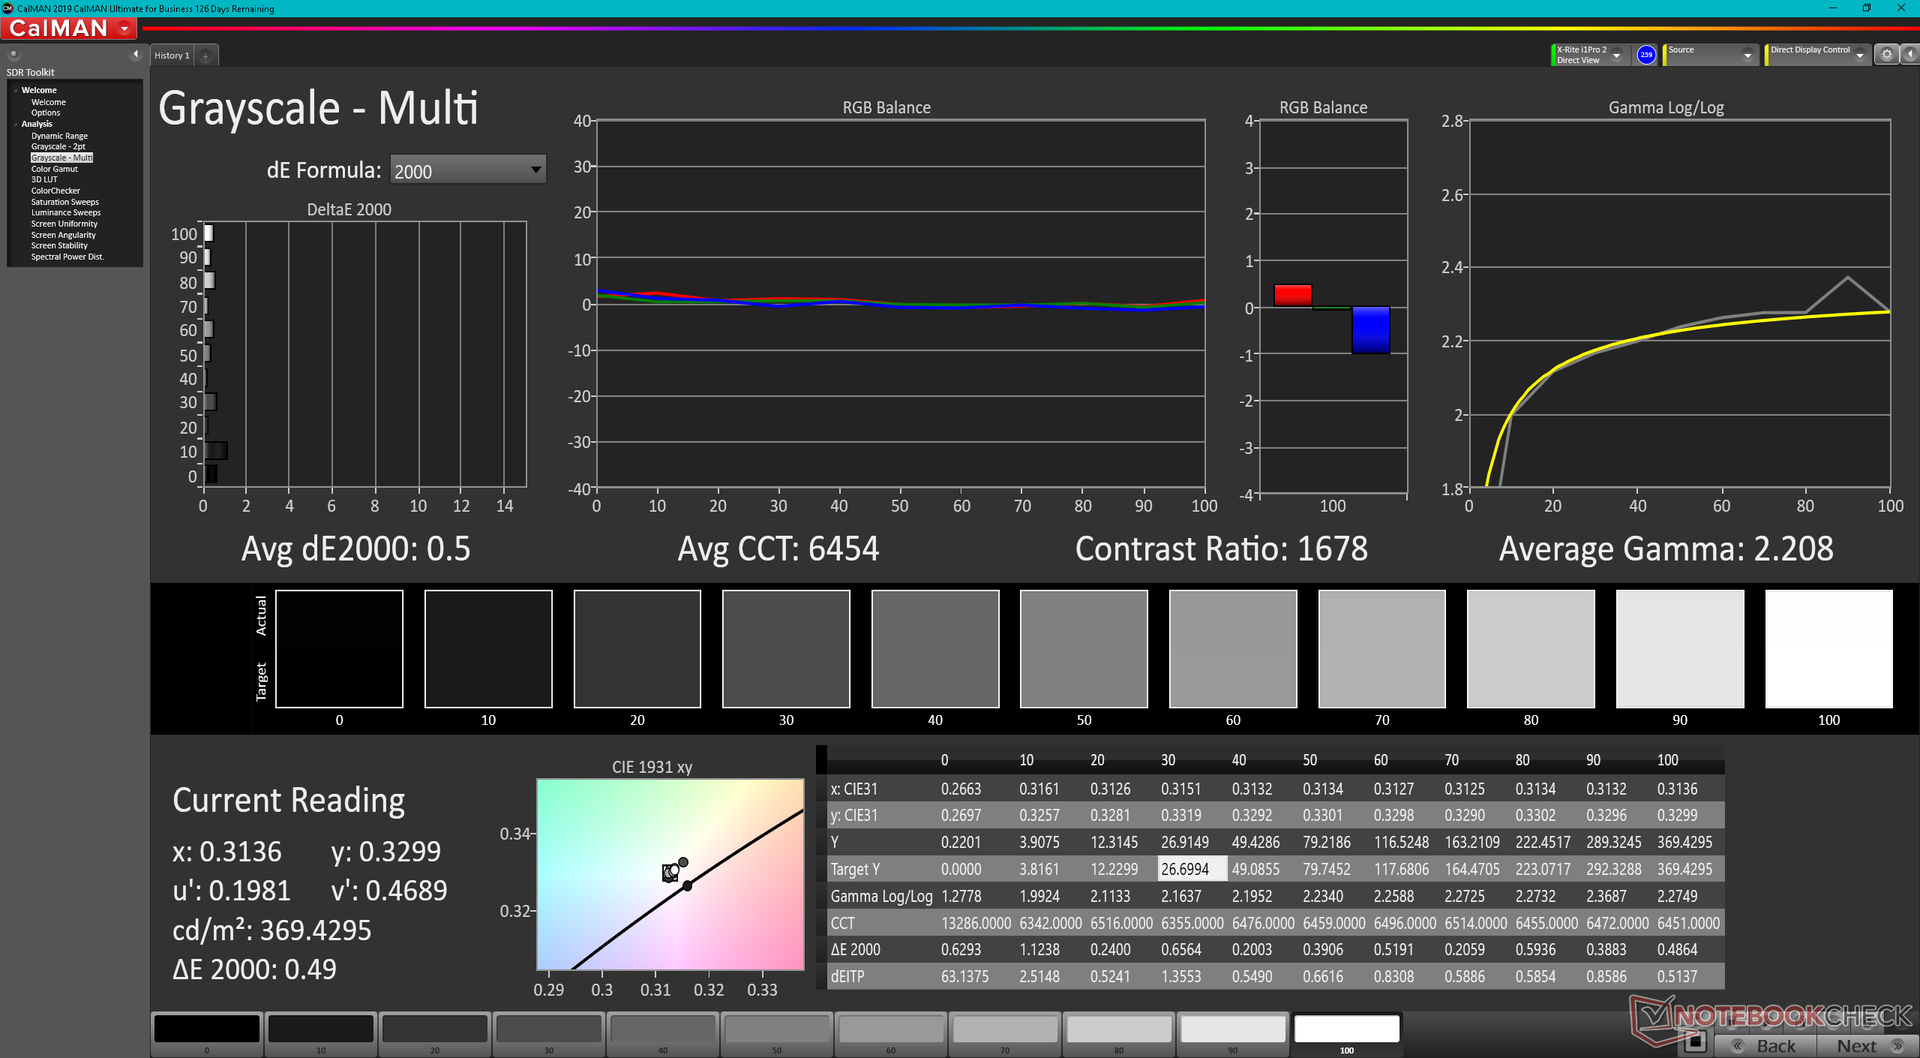
ΔE Greyscale 2.1 | 0.57-98 Ø5.3
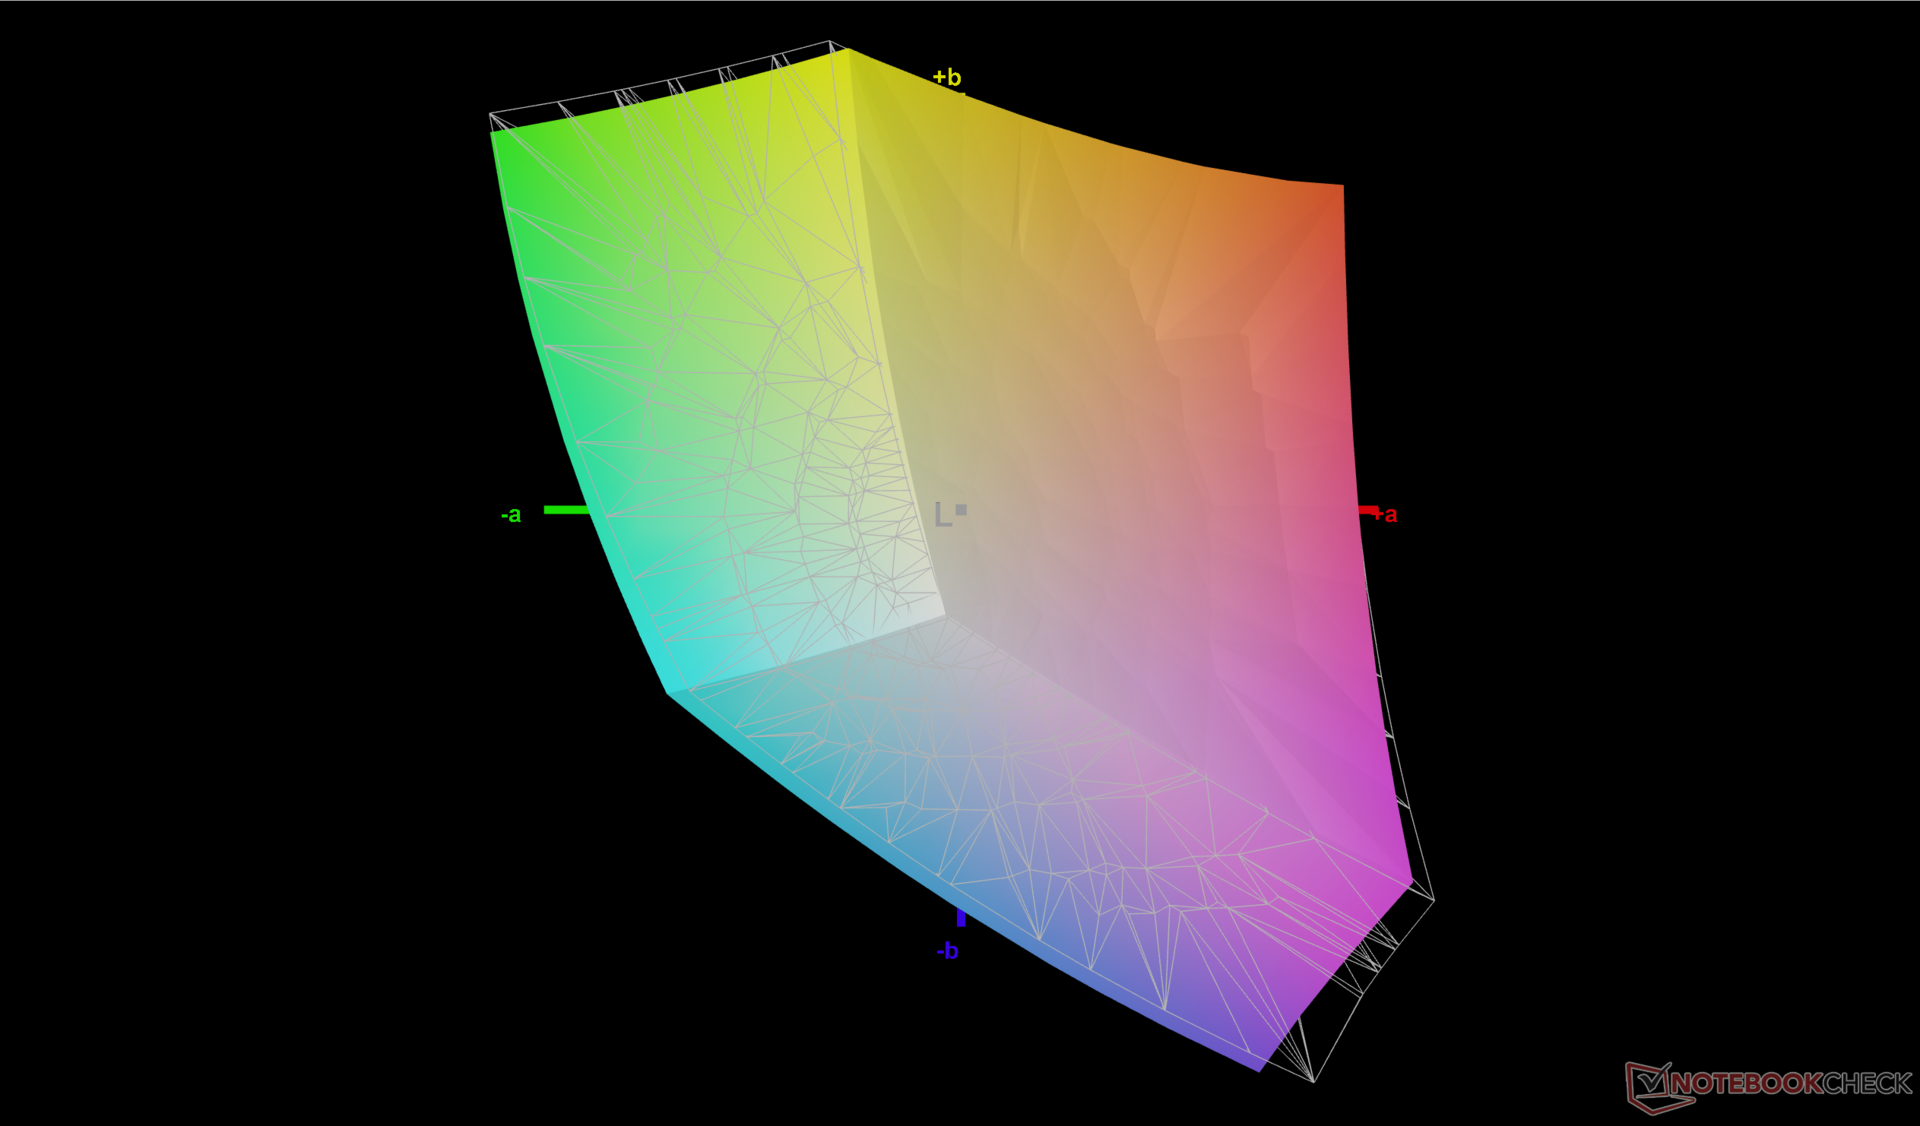
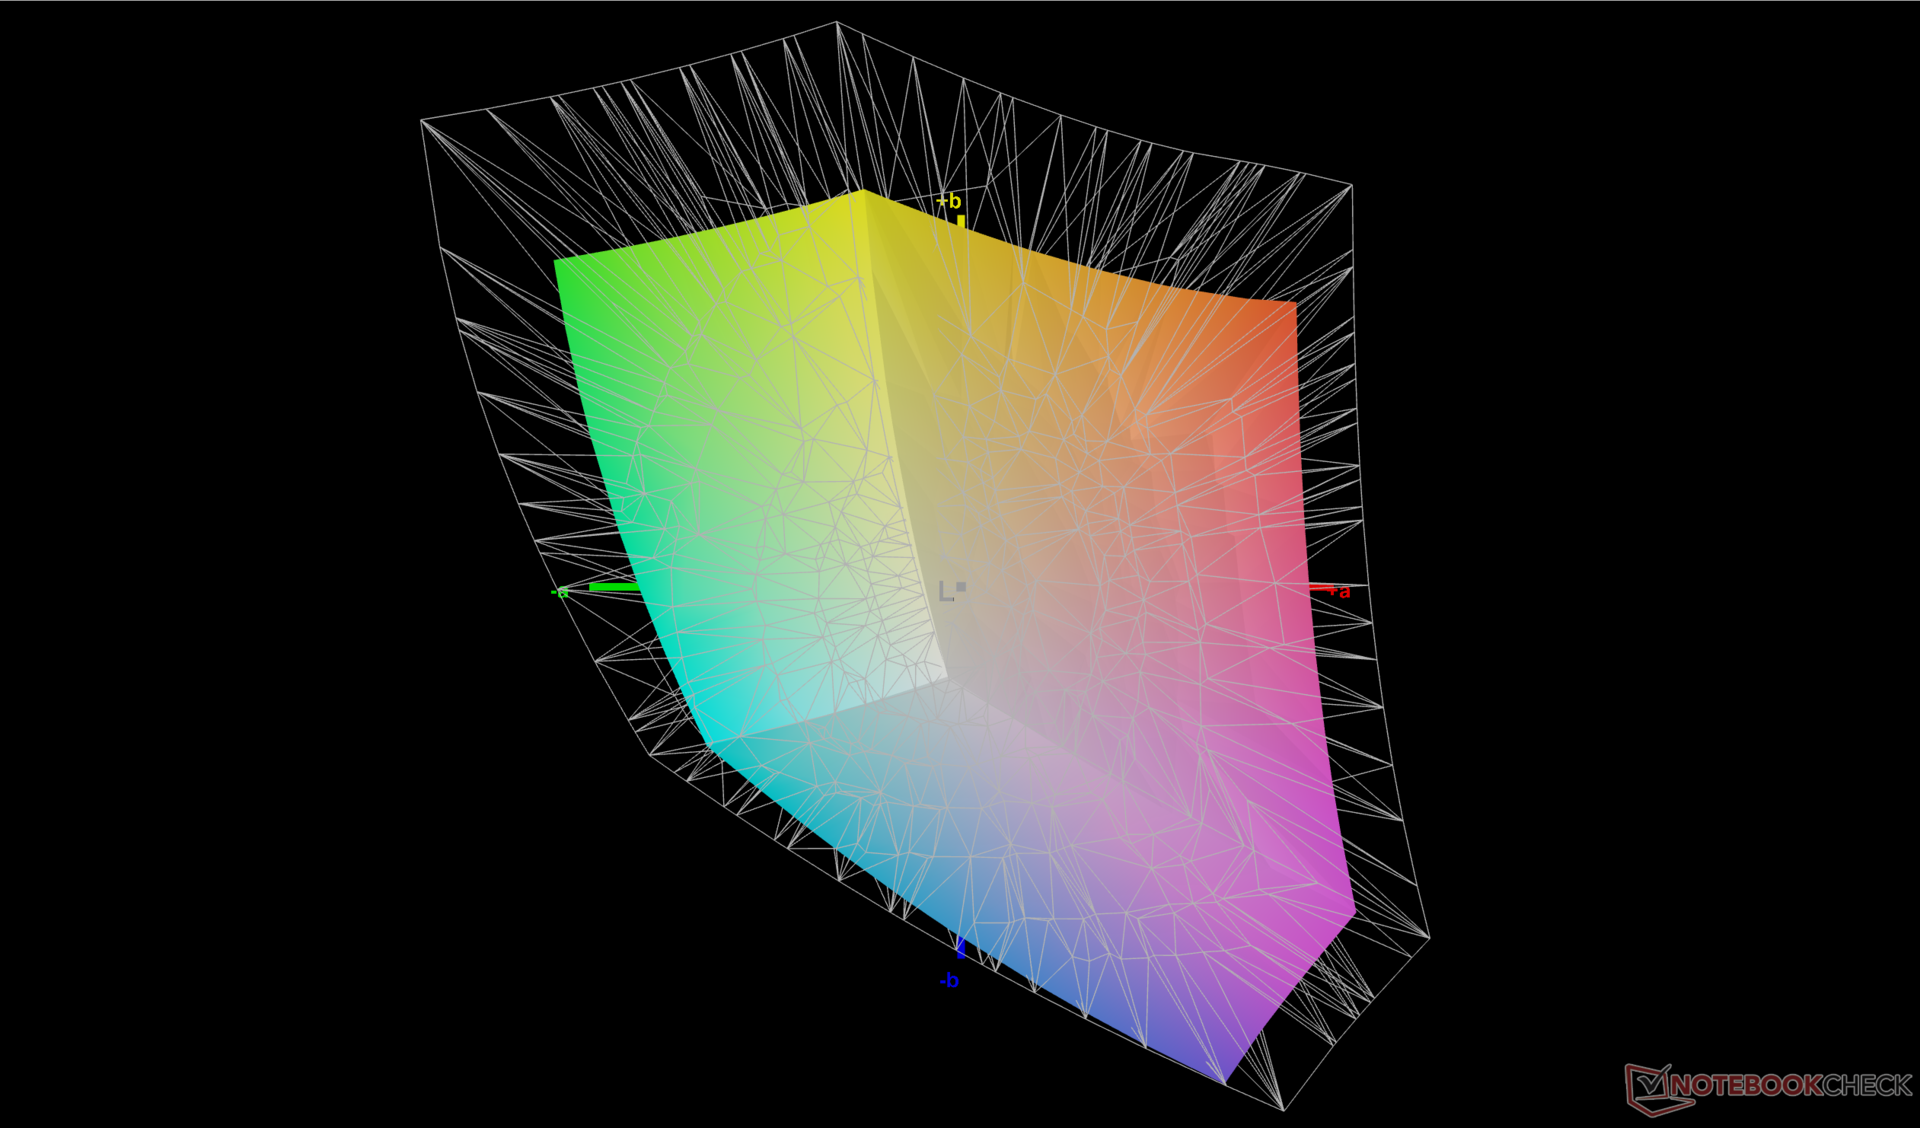
69.3% AdobeRGB 1998 (Argyll 2.2.0 3D)
95.7% sRGB (Argyll 2.2.0 3D)
67% Display P3 (Argyll 2.2.0 3D)
Gamma: 2.1
| Lenovo Yoga 7 16IAP7 Lenovo LEN160WQXGA, IPS, 2560x1600, 16.00 | Huawei MateBook D 16 2022 BOE NV160WUM-NH0, IPS, 1920x1200, 16.00 | Dell Inspiron 16 7620 2-in-1 BOE NV16N45, IPS, 1920x1200, 16.00 | Acer Swift X SFX16-51G-5388 Chi Mei N161HCA-EA3, , 1920x1080, 16.10 | LG Gram 16 (2021) LG Philips LP160WQ1-SPA1, IPS, 2560x1600, 16.00 | Lenovo IdeaPad 5 Pro 16ACH IPS LED, 2560x1600, 16.00 | |
|---|---|---|---|---|---|---|
| Display | -0% | 0% | -2% | 23% | 5% | |
| Display P3 Coverage | 67 | 66.2 -1% | 67 0% | 65.1 -3% | 95.8 43% | 71 6% |
| sRGB Coverage | 95.7 | 96.4 1% | 95.9 0% | 95.65 0% | 99.8 4% | 99 3% |
| AdobeRGB 1998 Coverage | 69.3 | 68.3 -1% | 69.3 0% | 66.75 -4% | 83.8 21% | 73.3 6% |
| Response Times | 20% | 14% | 18% | -2% | 60% | |
| Response Time Grey 50% / Grey 80% * | 36 ? | 30.5 ? 15% | 32 ? 11% | 30 ? 17% | 44 ? -22% | 16.4 ? 54% |
| Response Time Black / White * | 24.8 ? | 18.7 ? 25% | 20.8 ? 16% | 20 ? 19% | 20 ? 19% | 8.8 ? 65% |
| PWM Frequency | 24940 ? | |||||
| Screen | -30% | -48% | 8% | -88% | -14% | |
| Brightness middle | 393.7 | 319 -19% | 320.7 -19% | 276 -30% | 331 -16% | 395 0% |
| Brightness | 367 | 317 -14% | 309 -16% | 264 -28% | 309 -16% | 375 2% |
| Brightness Distribution | 84 | 90 7% | 90 7% | 85 1% | 88 5% | 90 7% |
| Black Level * | 0.38 | 0.23 39% | 0.36 5% | 0.16 58% | 0.22 42% | 0.32 16% |
| Contrast | 1036 | 1387 34% | 891 -14% | 1725 67% | 1505 45% | 1234 19% |
| Colorchecker dE 2000 * | 1.97 | 3.4 -73% | 4.18 -112% | 1.8 9% | 4.64 -136% | 2.6 -32% |
| Colorchecker dE 2000 max. * | 5.46 | 8.1 -48% | 8.48 -55% | 3.77 31% | 9.82 -80% | 5.4 1% |
| Colorchecker dE 2000 calibrated * | 0.62 | 0.8 -29% | 0.77 -24% | 0.63 -2% | 3.16 -410% | 1.1 -77% |
| Greyscale dE 2000 * | 2.1 | 5.7 -171% | 6.3 -200% | 2.76 -31% | 6.9 -229% | 3.4 -62% |
| Gamma | 2.1 105% | 2.1 105% | 2.21 100% | 2.37 93% | 2.34 94% | 2.12 104% |
| CCT | 6461 101% | 7433 87% | 6258 104% | 6564 99% | 7904 82% | 6140 106% |
| Color Space (Percent of AdobeRGB 1998) | 75.1 | |||||
| Color Space (Percent of sRGB) | 100 | |||||
| Moyenne finale (programmes/paramètres) | -3% /
-17% | -11% /
-29% | 8% /
7% | -22% /
-52% | 17% /
1% |
* ... Moindre est la valeur, meilleures sont les performances
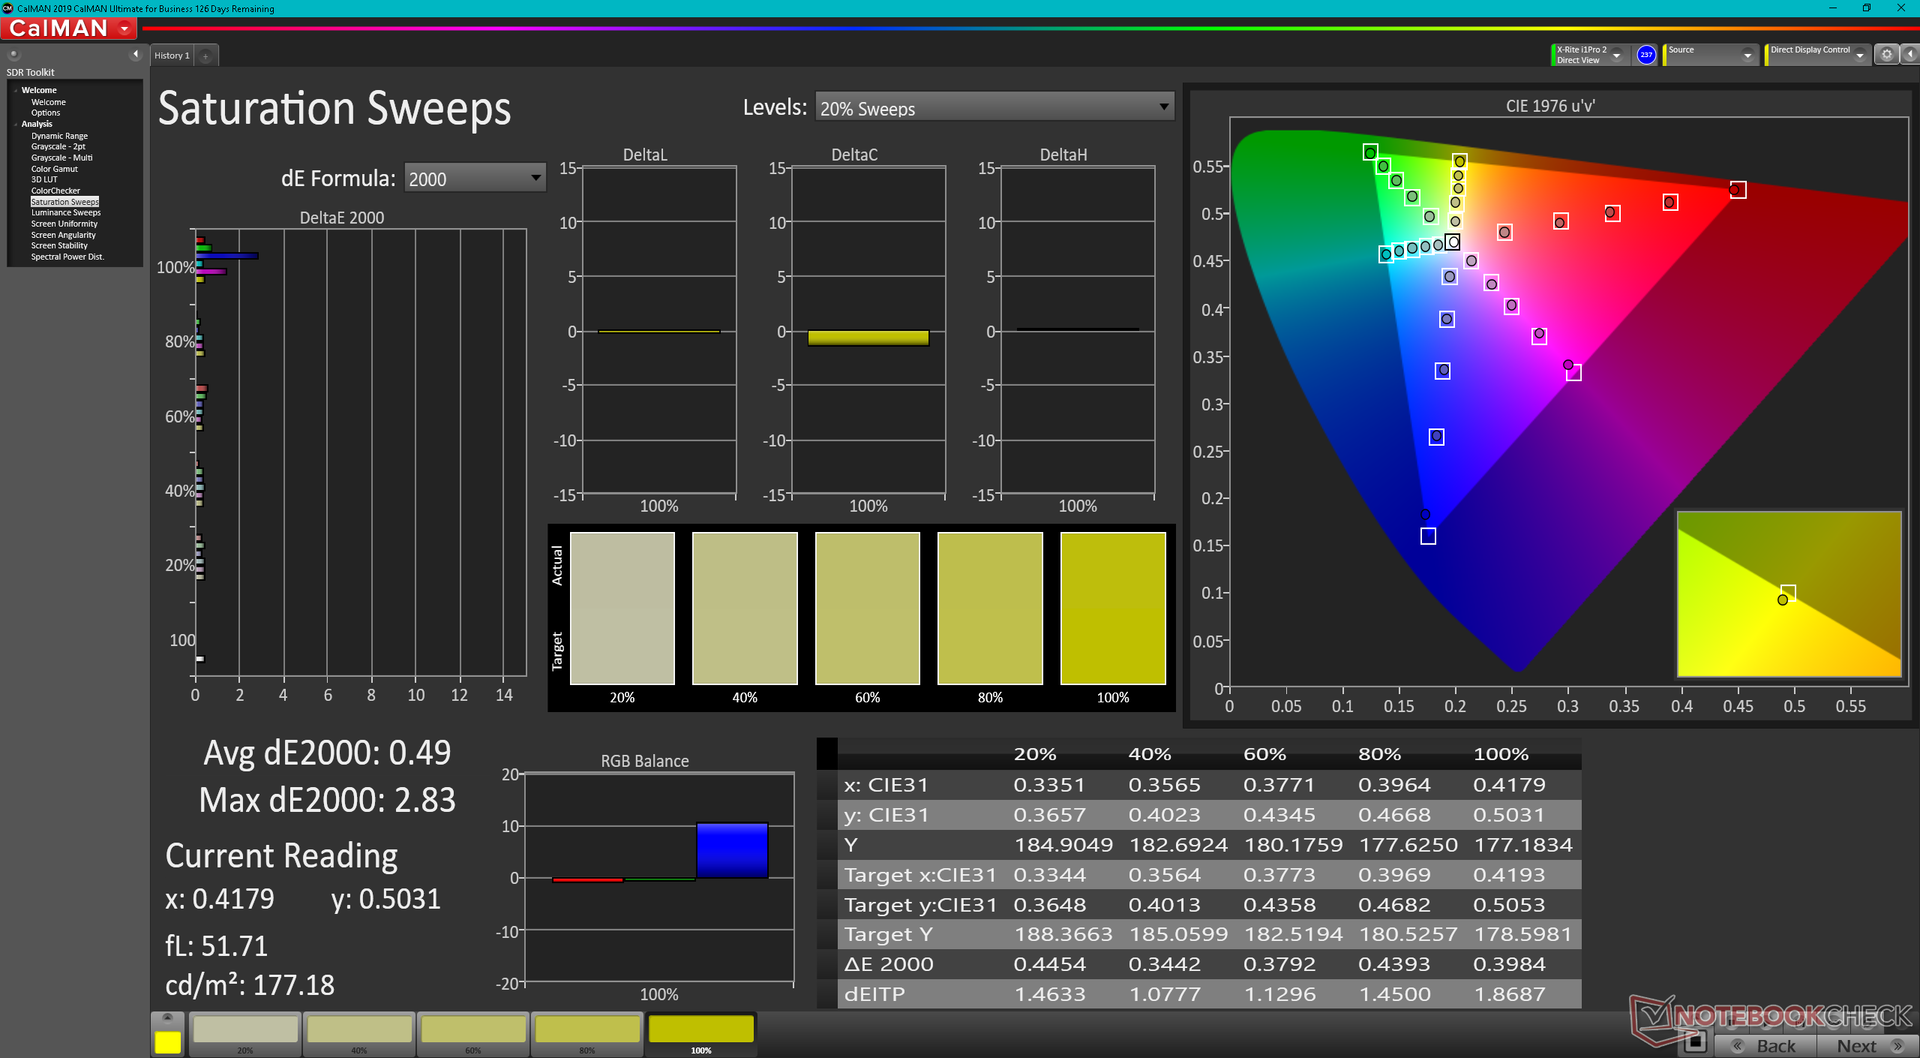
La dalle offre une couverture sRGB de >95 %, ce qui la rend comparable à la plupart des autres convertibles ou ordinateurs portables de 16 pouces de milieu de gamme. Le LG Gram 16 est l'une des rares alternatives à offrir un P3 encore plus large >95%.
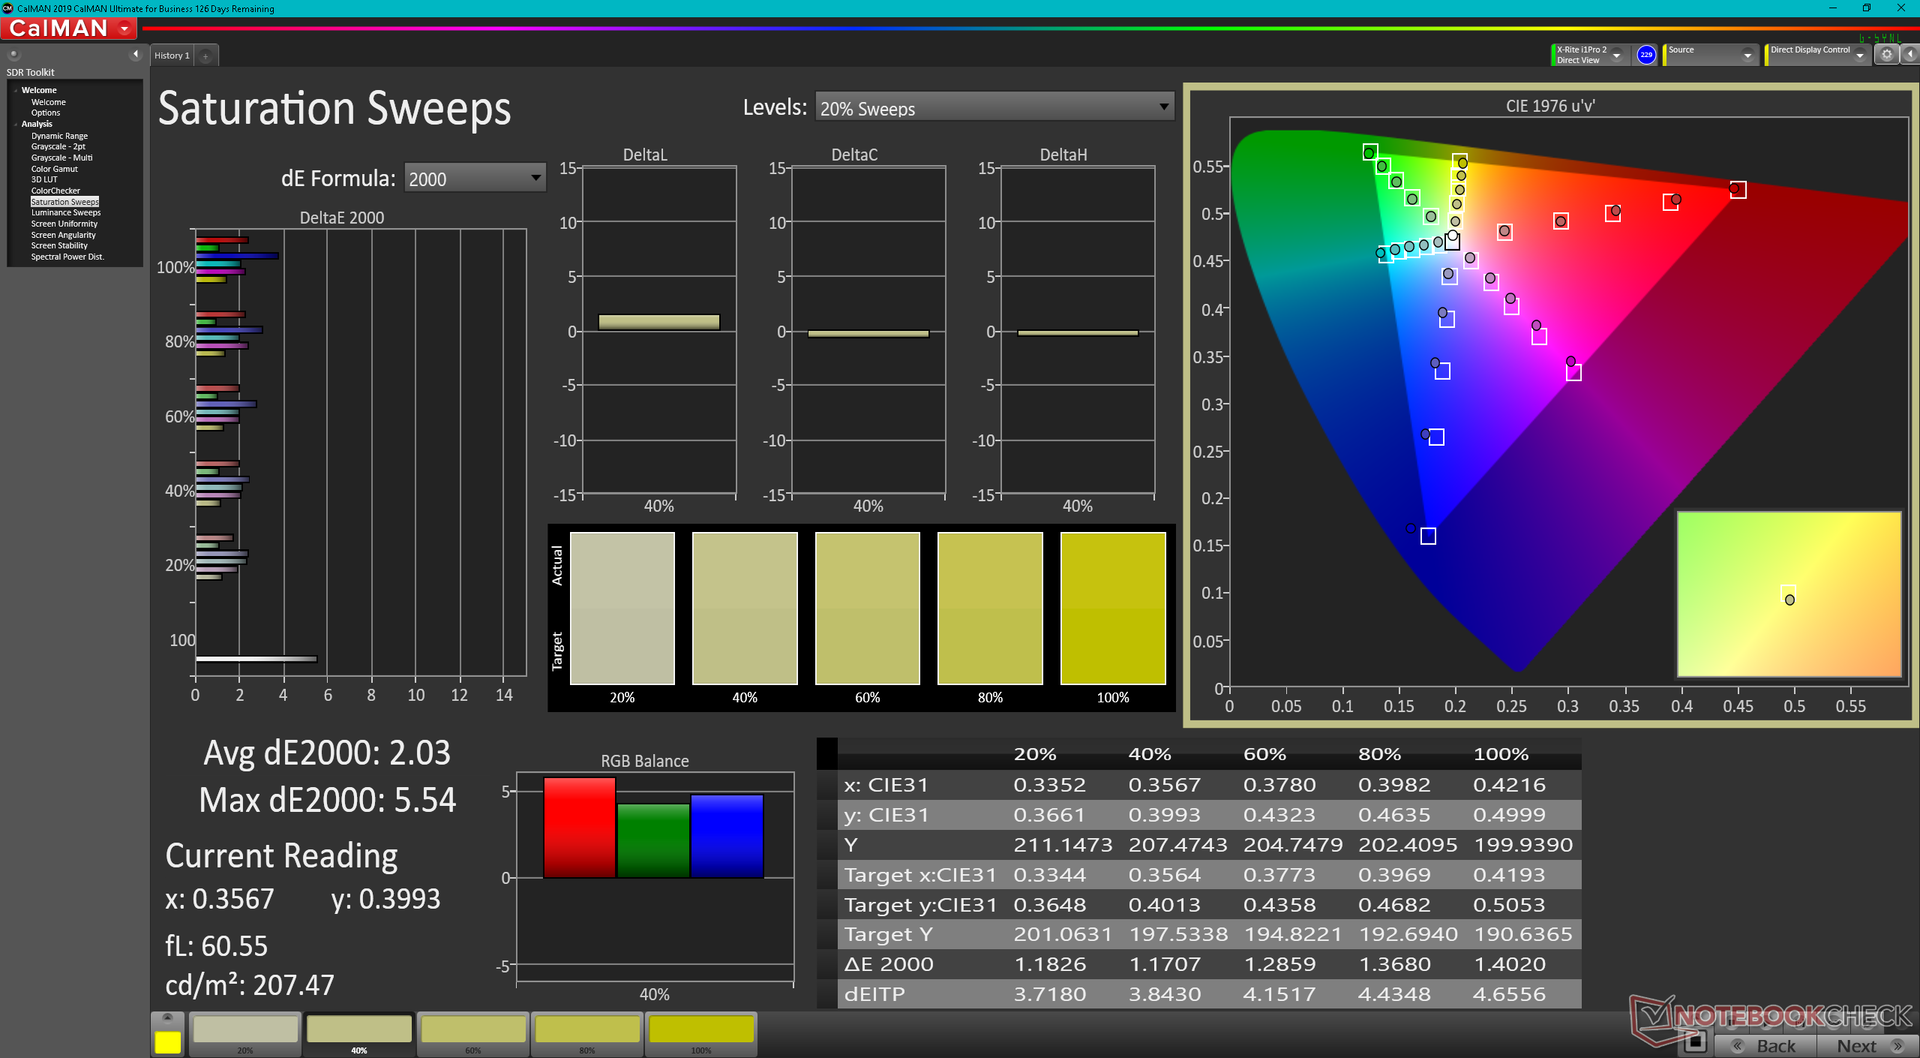
L'écran est déjà bien calibré dès sa sortie de l'emballage, avec des valeurs DeltaE moyennes pour les niveaux de gris et les couleurs de seulement 2,1 et 1,97, respectivement. Nous sommes en mesure d'aller encore plus loin avec notre propre calibration X-Rite pour réduire les valeurs DeltaE moyennes des niveaux de gris et des couleurs à seulement 0,5 et 0,62, respectivement. Malgré tout, un étalonnage pour l'utilisateur final n'est pas vraiment nécessaire puisque l'écran est déjà précis en termes de sRGB tel qu'il est livré.
Temps de réponse de l'écran
| ↔ Temps de réponse noir à blanc | ||
|---|---|---|
| 24.8 ms ... hausse ↗ et chute ↘ combinées | ↗ 12.4 ms hausse | 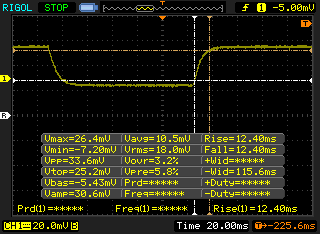 |
| ↘ 12.4 ms chute | ||
| L'écran montre de bons temps de réponse, mais insuffisant pour du jeu compétitif. En comparaison, tous les appareils testés affichent entre 0.1 (minimum) et 240 (maximum) ms. » 52 % des appareils testés affichent de meilleures performances. Cela signifie que les latences relevées sont moins bonnes que la moyenne (21.5 ms) de tous les appareils testés. | ||
| ↔ Temps de réponse gris 50% à gris 80% | ||
| 36 ms ... hausse ↗ et chute ↘ combinées | ↗ 18 ms hausse | 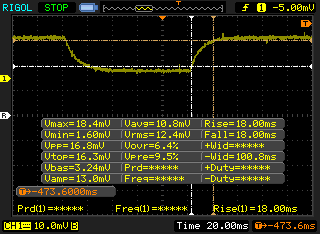 |
| ↘ 18 ms chute | ||
| L'écran souffre de latences très élevées, à éviter pour le jeu. En comparaison, tous les appareils testés affichent entre 0.2 (minimum) et 636 (maximum) ms. » 44 % des appareils testés affichent de meilleures performances. Cela signifie que les latences relevées sont similaires à la moyenne (33.7 ms) de tous les appareils testés. | ||
Scintillement / MLI (Modulation de largeur d'impulsion)
| Scintillement / MLI (Modulation de largeur d'impulsion) non décelé | 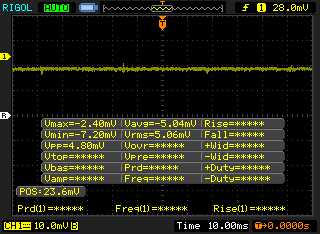 | ||
En comparaison, 53 % des appareils testés n'emploient pas MDI pour assombrir leur écran. Nous avons relevé une moyenne à 17924 (minimum : 5 - maximum : 3846000) Hz dans le cas où une MDI était active. | |||
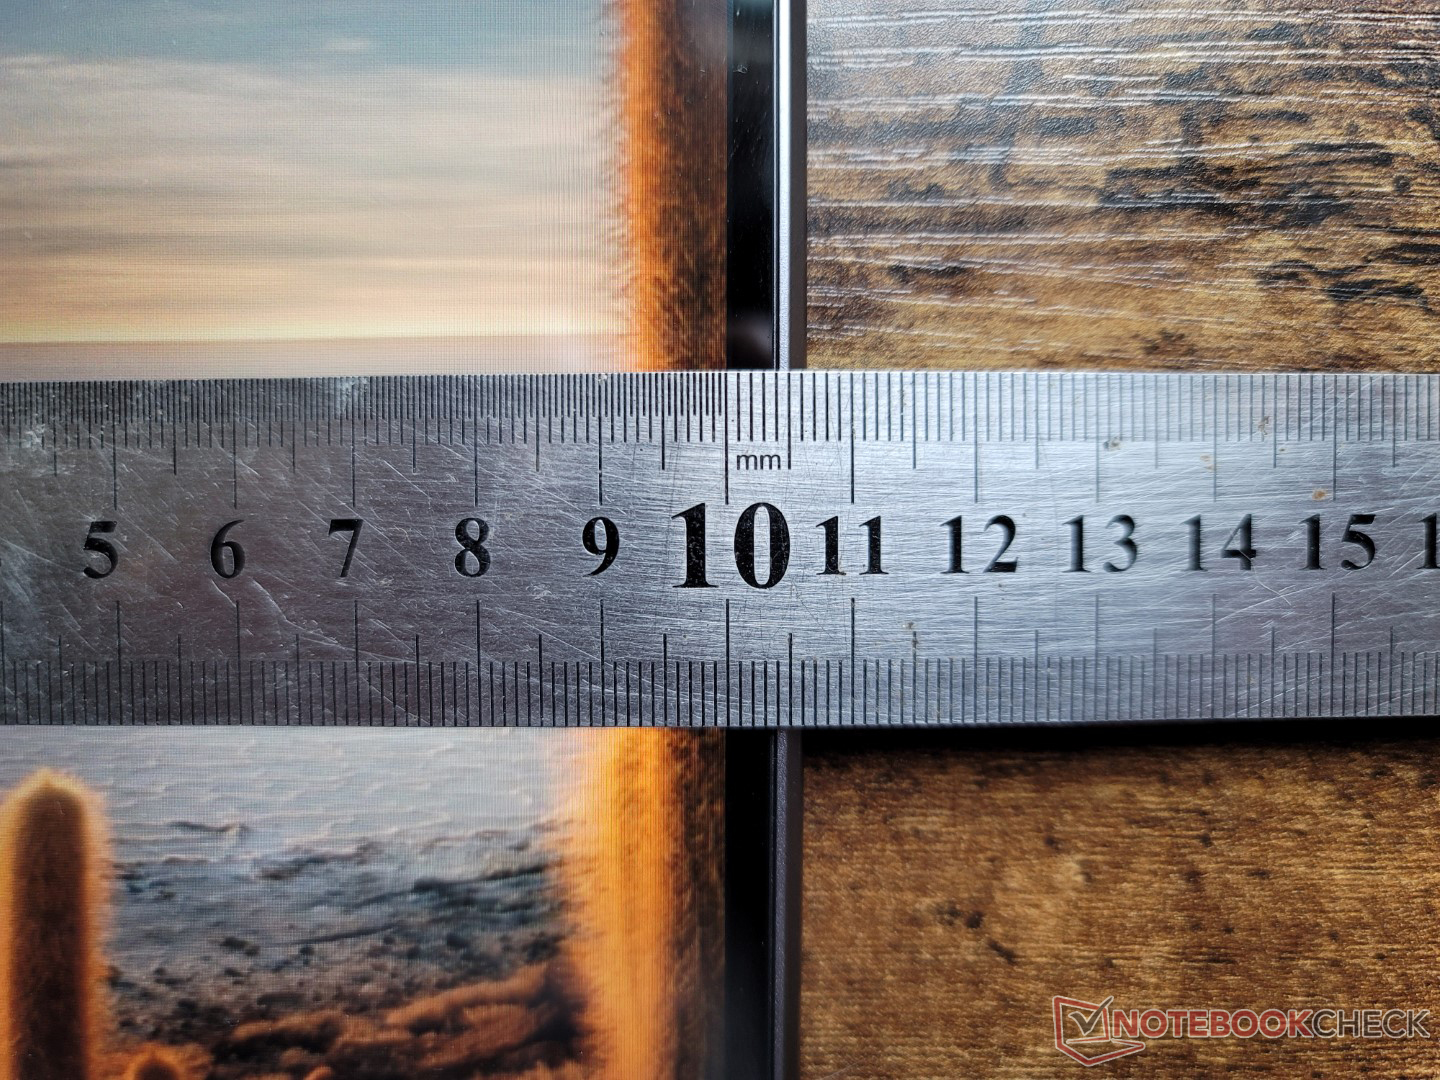
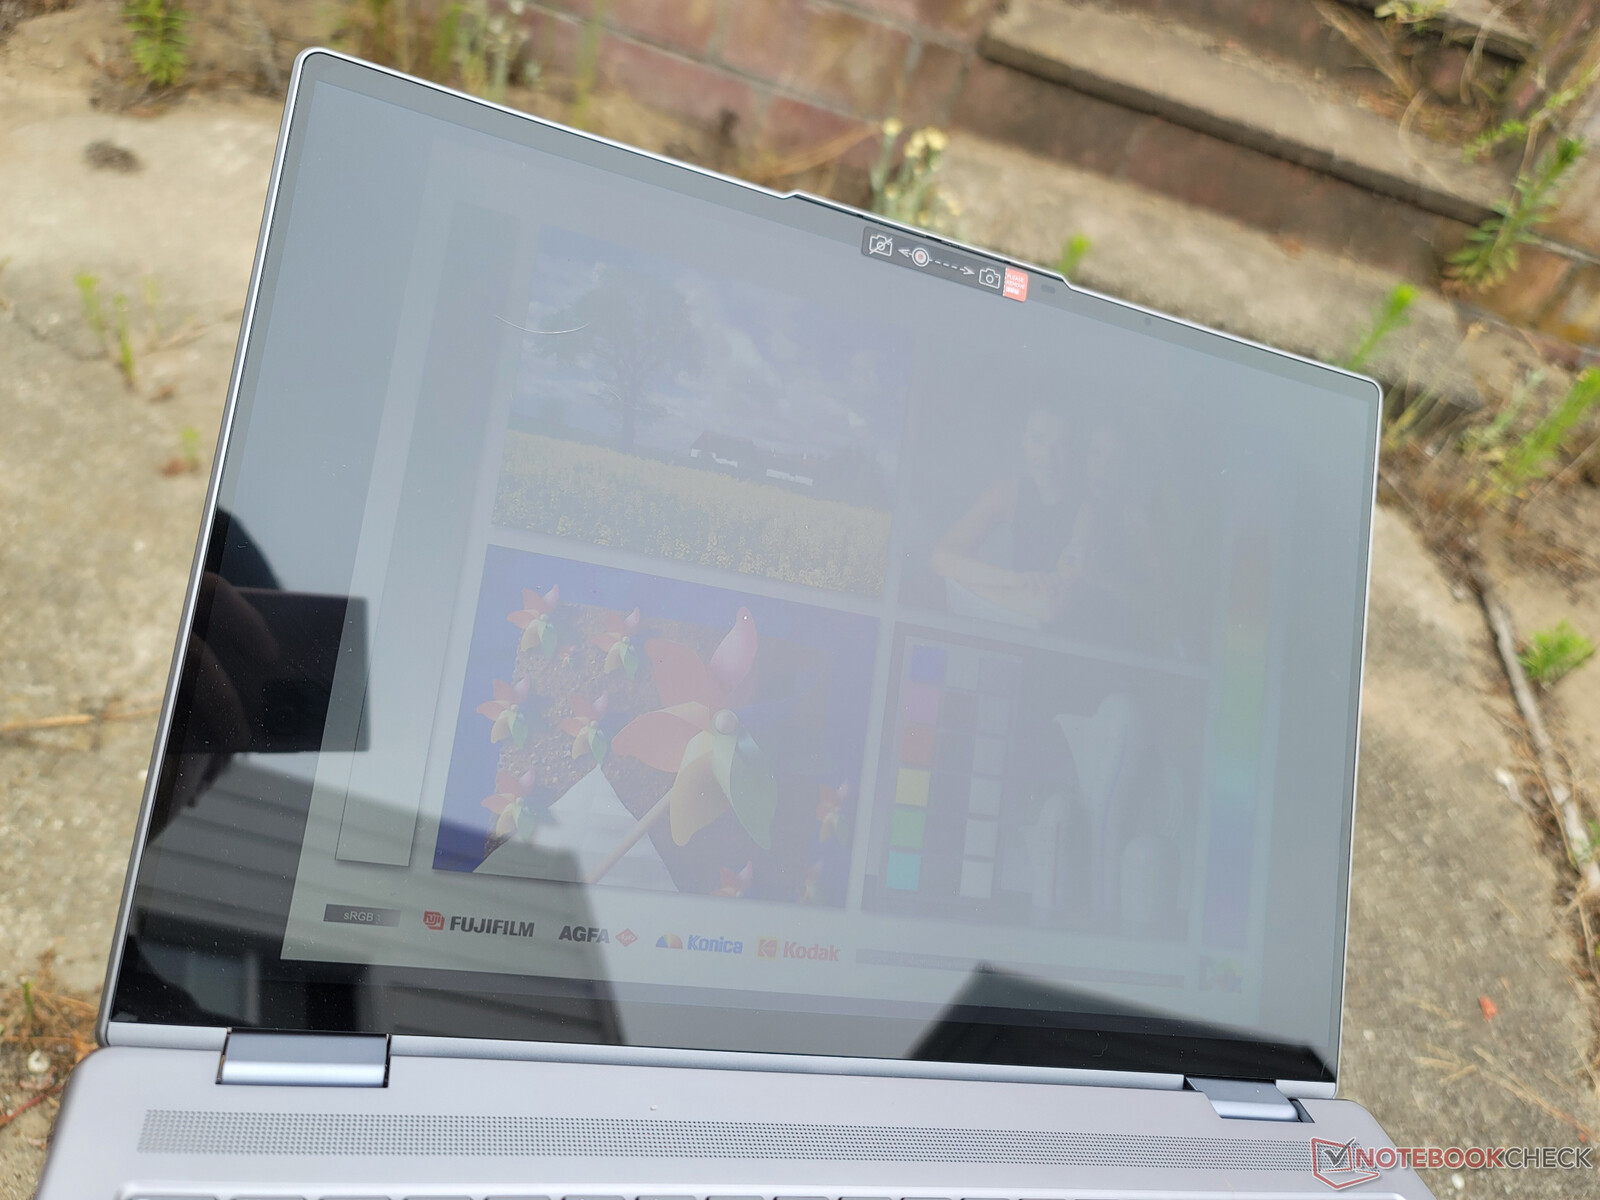
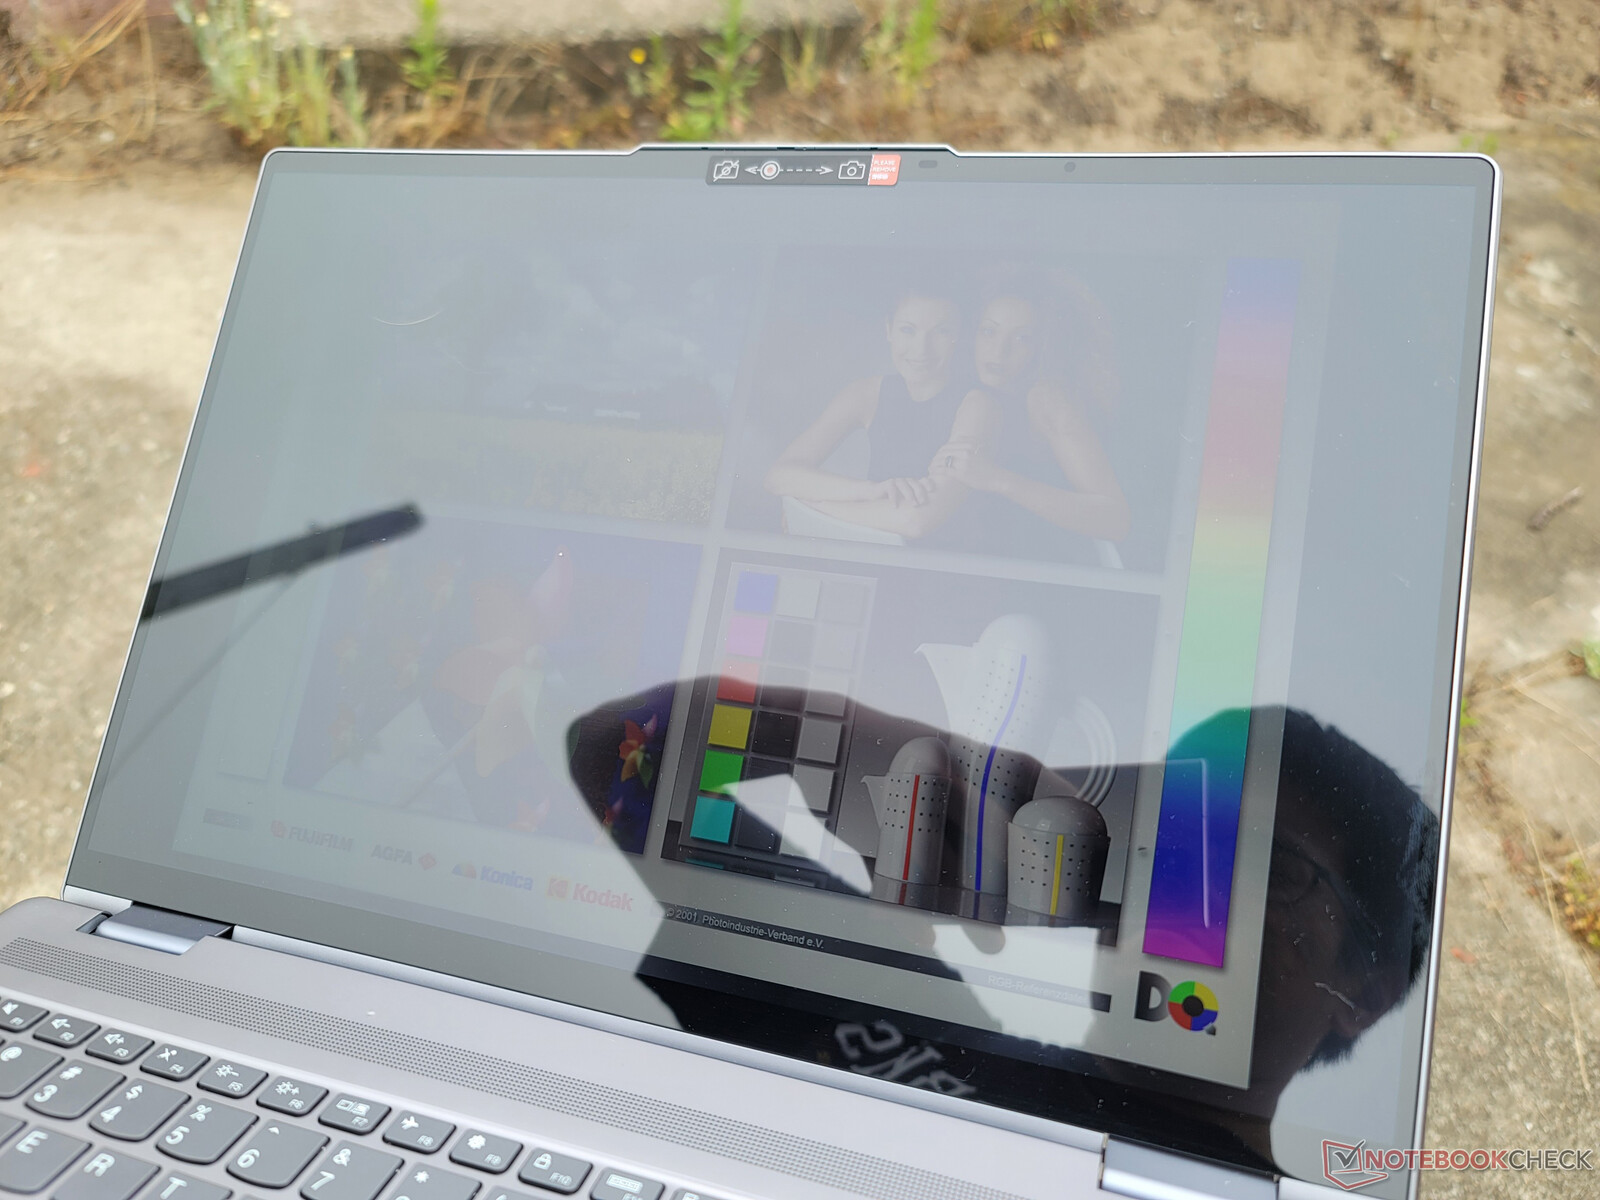
La visibilité en extérieur est légèrement meilleure que sur l'Inspiron 16 7620 2-en-1 ou le LG Gram 16 car l'écran Lenovo est plus lumineux. Cependant, les reflets sont toujours inévitables et la luminosité supplémentaire n'est pas suffisante pour faire une énorme différence dans la plupart des cas. Vous voudrez toujours travailler à l'ombre pour maximiser la lisibilité.
Performances - Intel 12e génération
Conditions d'essai
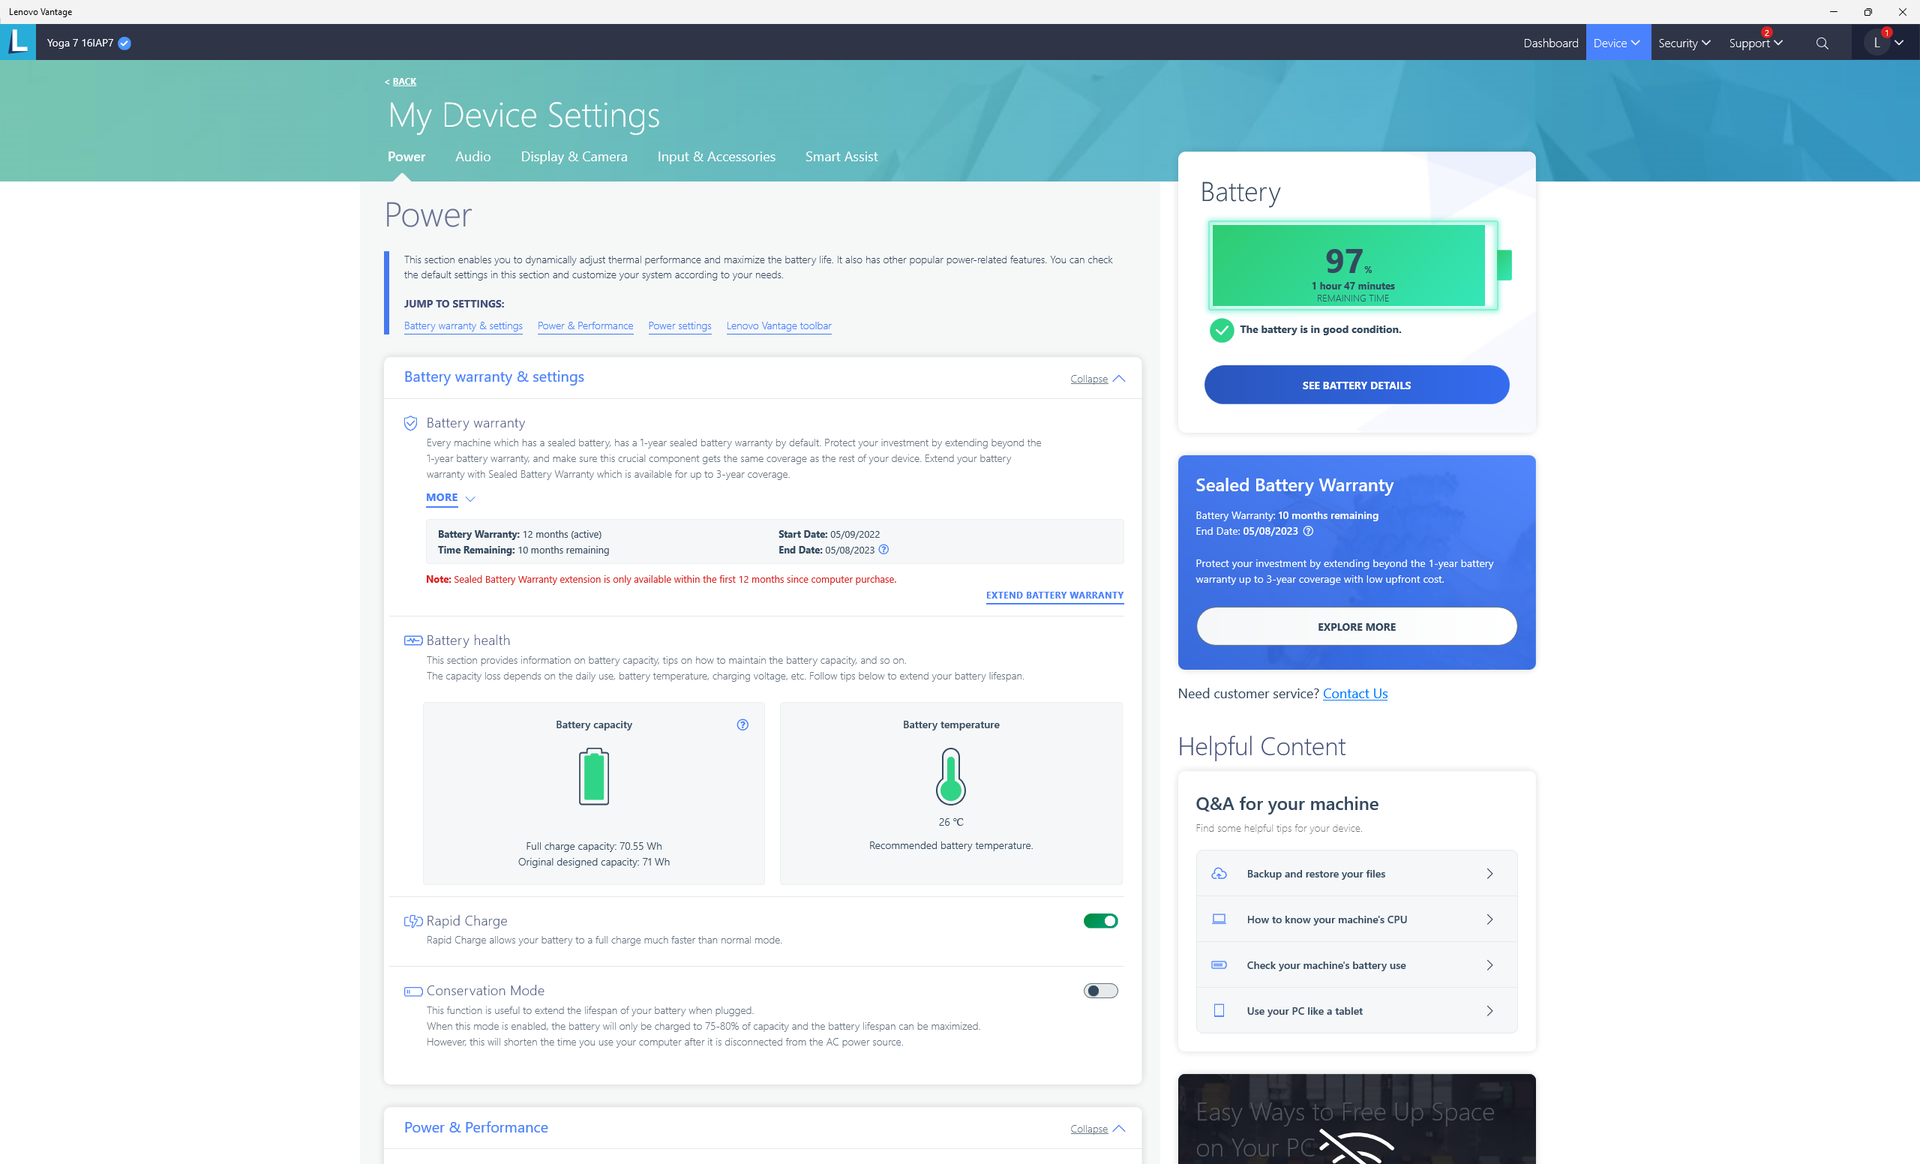
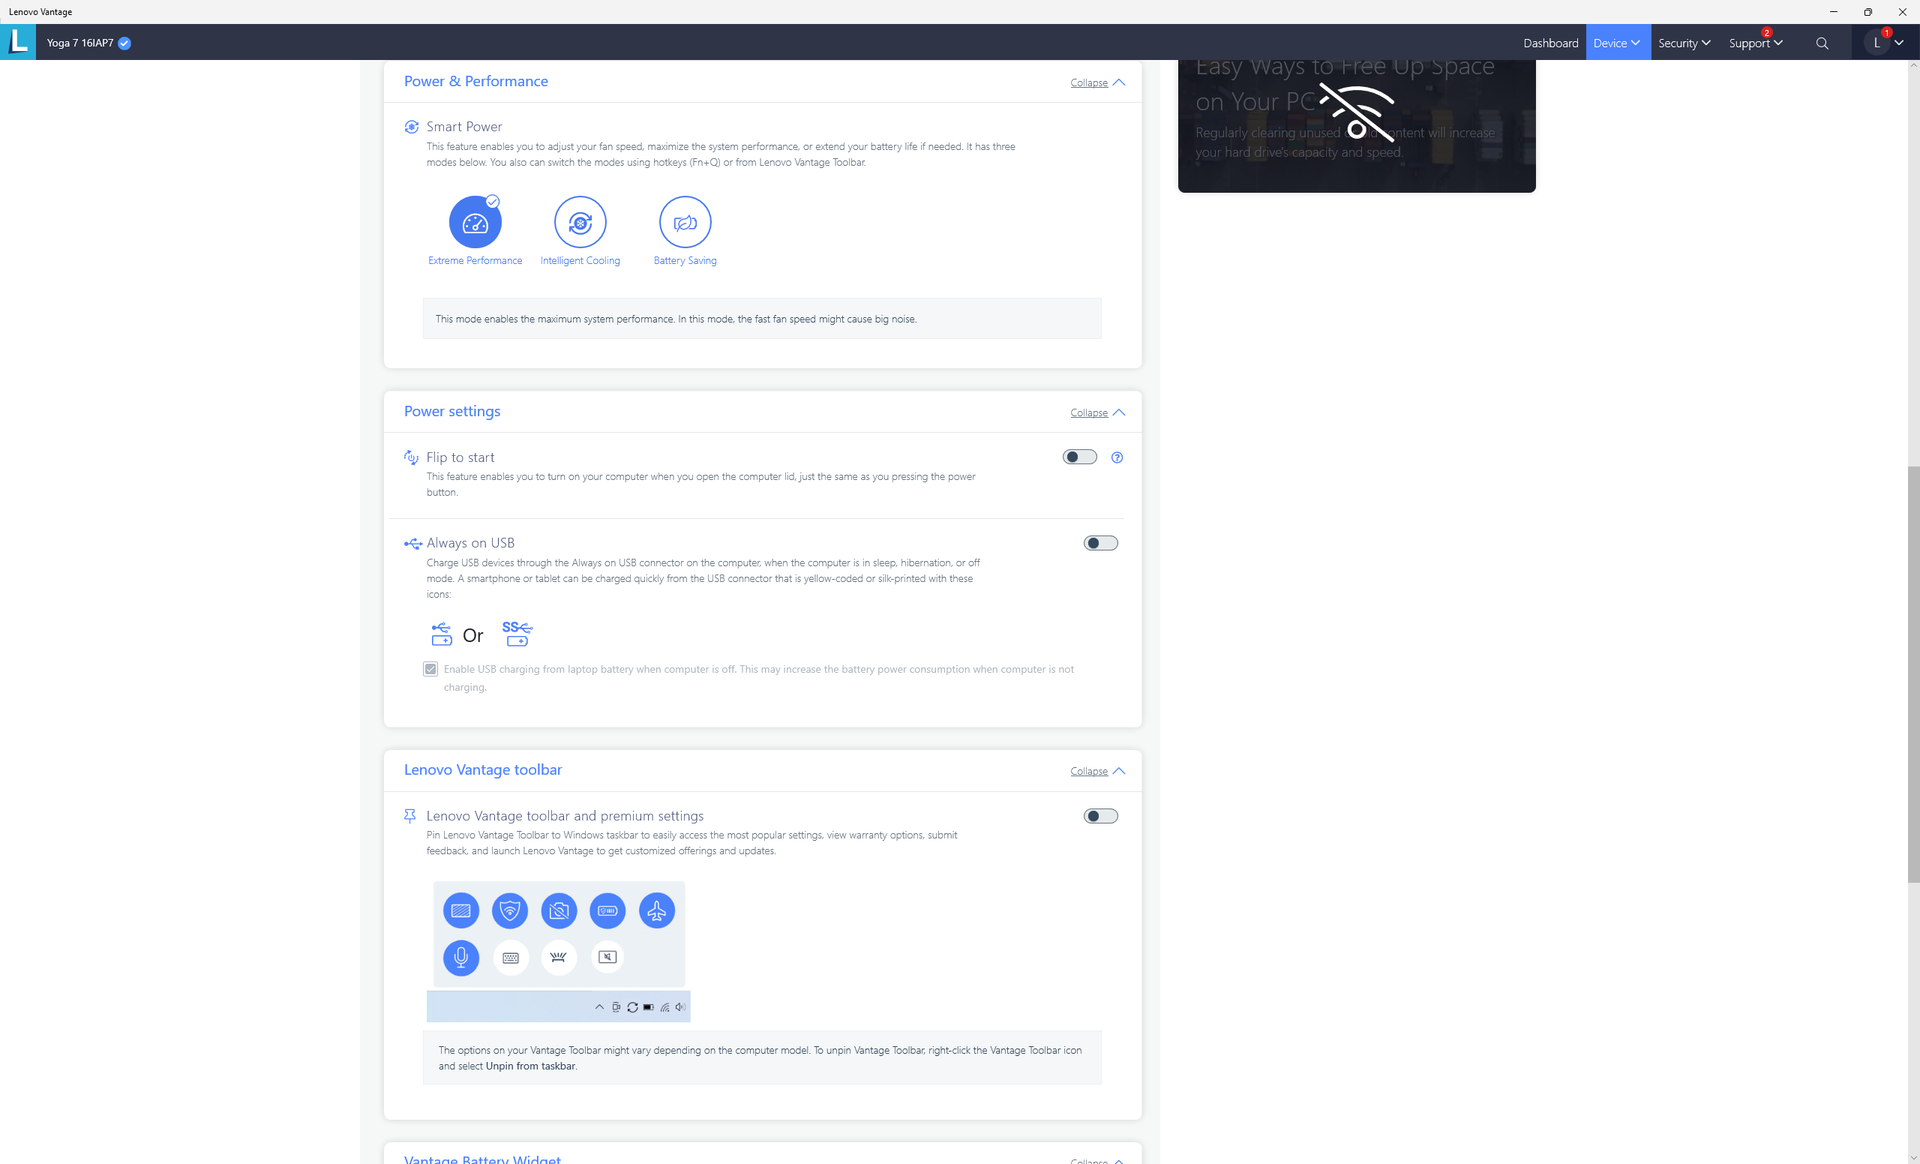
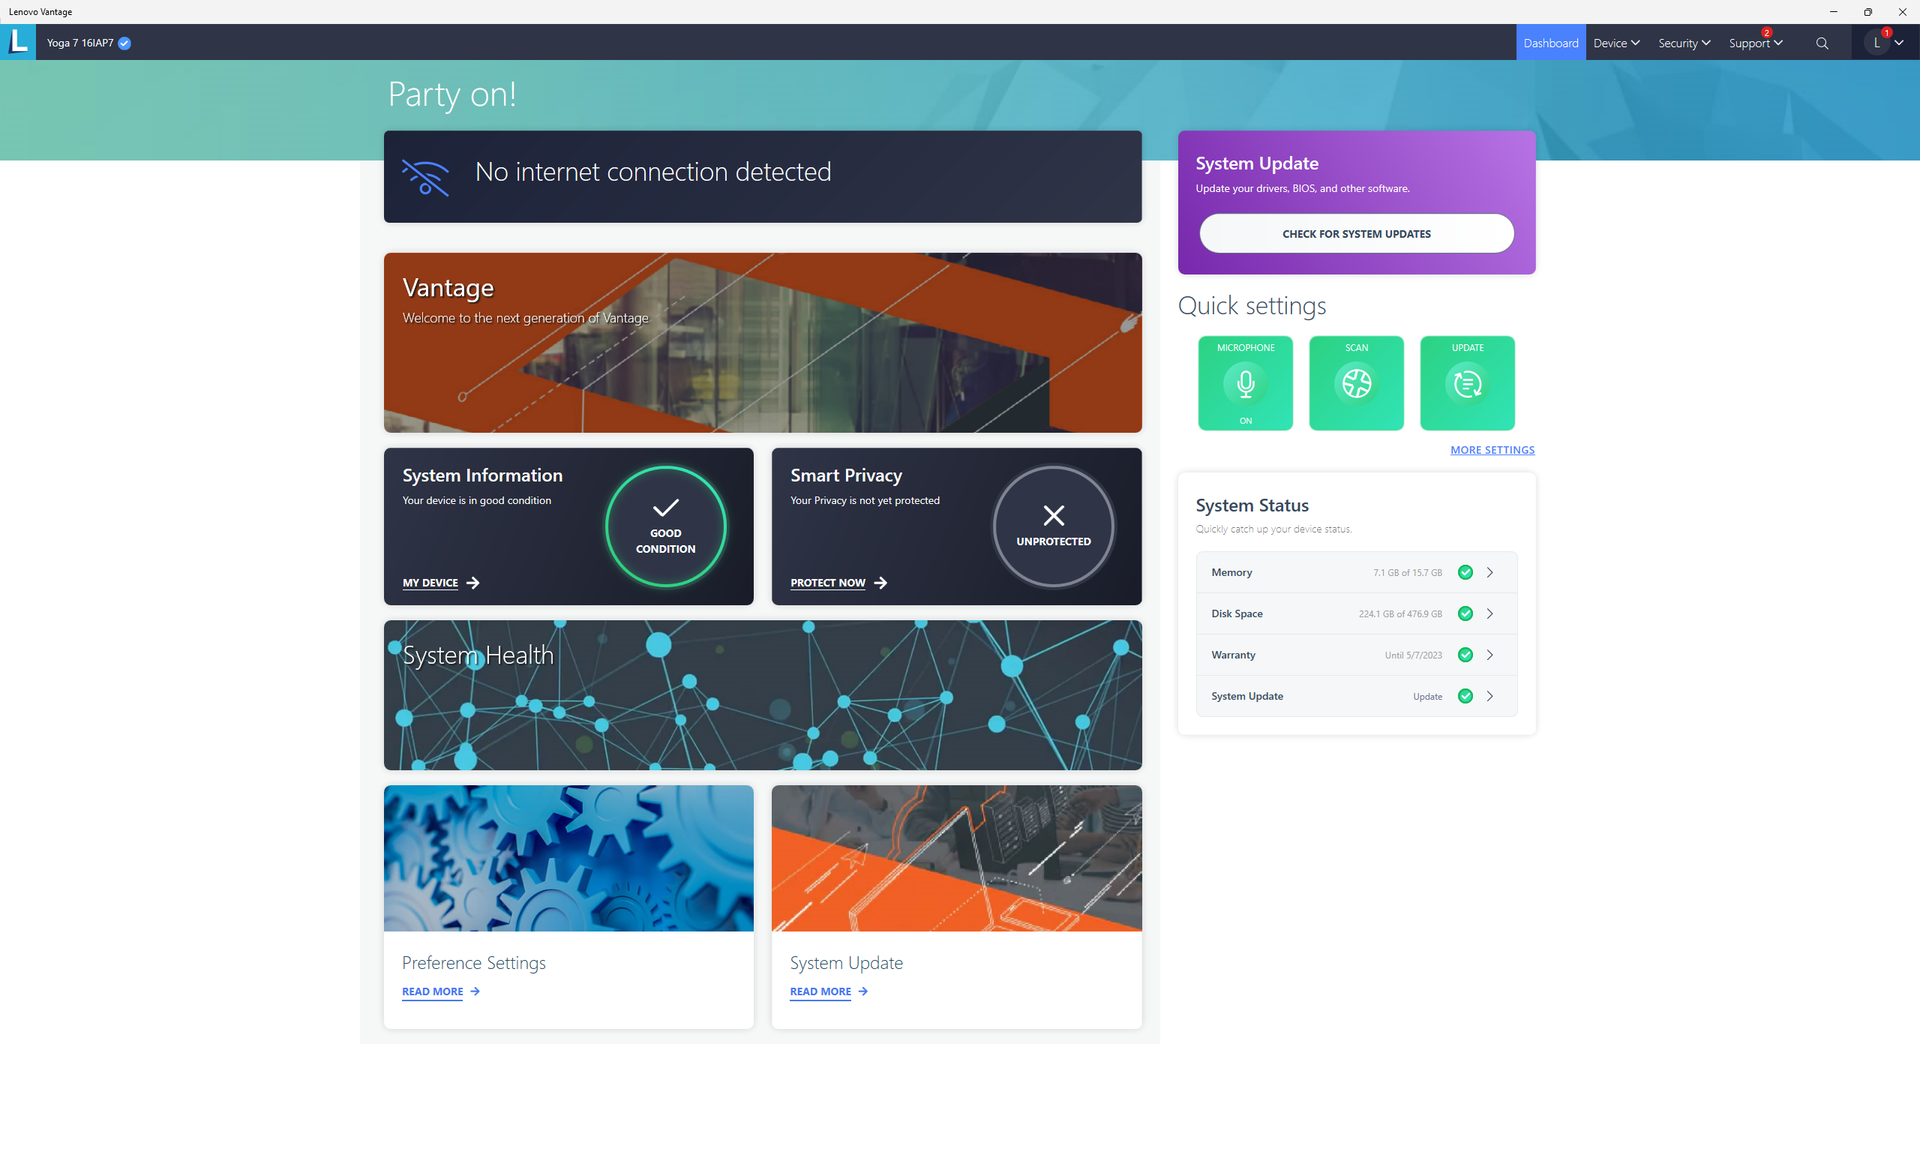
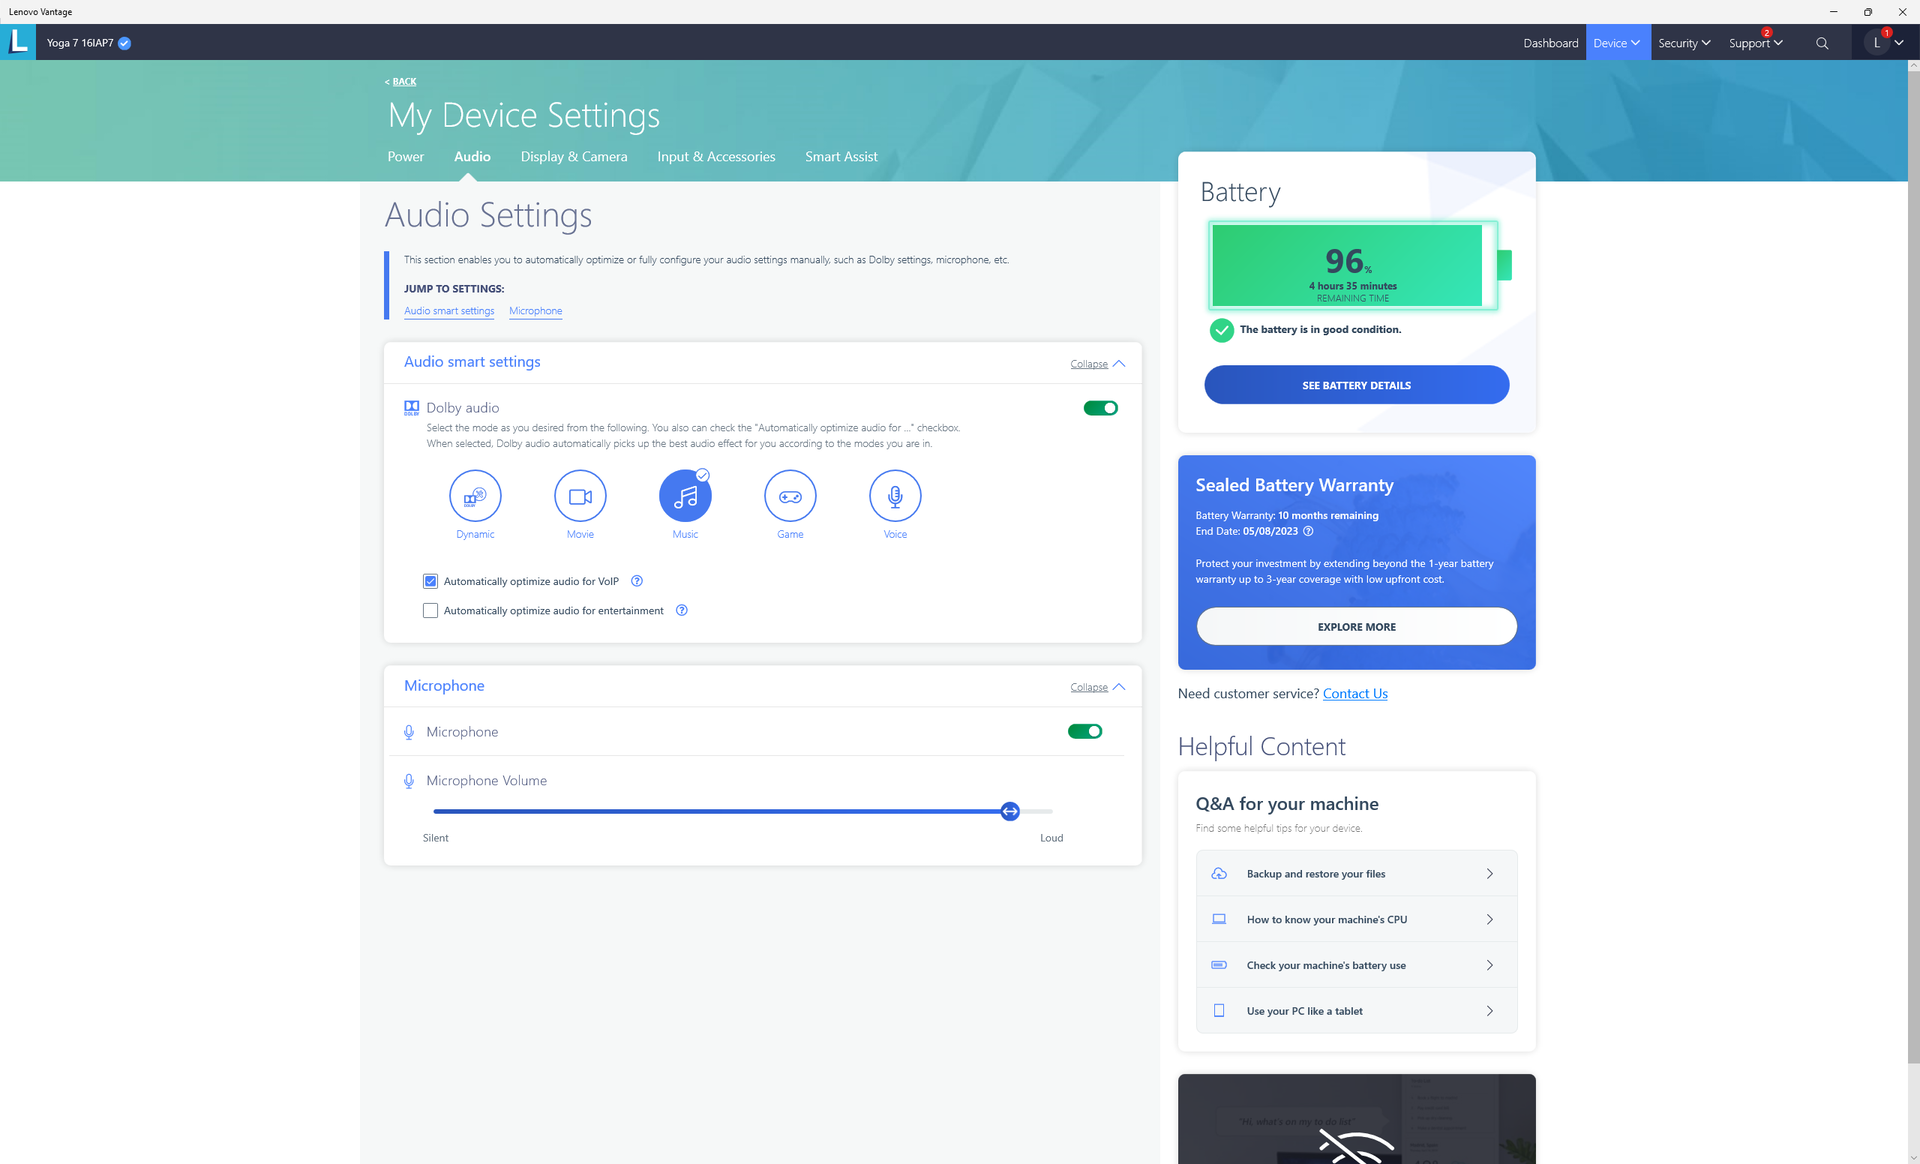
Nous avons réglé notre appareil en mode Performance extrême et en mode Performance via Lenovo Vantage et Windows, respectivement, avant d'effectuer les tests de référence ci-dessous. Il est recommandé aux utilisateurs de se familiariser avec le logiciel préinstallé Lenovo Vantage, car les paramètres clés et les correctifs spécifiques à Lenovo ne peuvent être trouvés qu'ici.
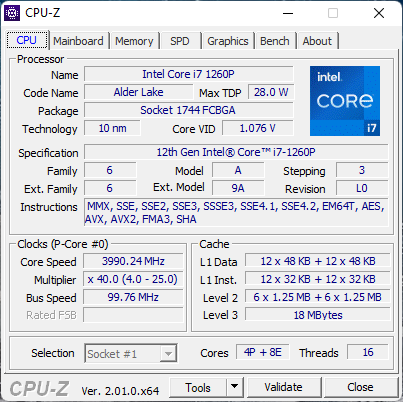
Processeur
Les performances du processeur sont excellentes si l'on considère uniquement les résultats de CineBench. Notre Core i7-1260P du Lenovo peut dépasser de 20 à 30 % les performances de l'ordinateur portable moyen de notre base de données équipé du même processeur. En réalité, cependant, le système Lenovo est incapable de maintenir des fréquences d'horloge Turbo Boost élevées pendant de longues périodes et cet avantage se réduit donc avec le temps, comme le montre notre graphique en boucle CineBench R15 xT ci-dessous. En comparaison avec le MSI Summit E14 Flip Evo avec le même processeur, par exemple, notre système Lenovo serait plus rapide d'environ 30 % au début du test en boucle de CineBench avant de finir plus lent d'environ 14 %. En d'autres termes, le système Lenovo excelle pendant les courtes périodes de charge élevée, mais il commence à perdre du terrain lorsqu'il est soumis à des charges élevées pendant de longues périodes.
Le "plus lent" Core i5-1240P plus lent, peut parfois être plus rapide que notre Core i7-1260P, selon les modèles concernés. En fait, en optant pour le Core i7-12700H au lieu du Core i7-1260P n'apportera qu'une très légère augmentation des performances du processeur, d'après notre expérience avec leHuawei MateBook D 16.
Cinebench R15 Multi Loop
Cinebench R23: Multi Core | Single Core
Cinebench R15: CPU Multi 64Bit | CPU Single 64Bit
Blender: v2.79 BMW27 CPU
7-Zip 18.03: 7z b 4 | 7z b 4 -mmt1
Geekbench 5.5: Multi-Core | Single-Core
HWBOT x265 Benchmark v2.2: 4k Preset
LibreOffice : 20 Documents To PDF
R Benchmark 2.5: Overall mean
* ... Moindre est la valeur, meilleures sont les performances
AIDA64: FP32 Ray-Trace | FPU Julia | CPU SHA3 | CPU Queen | FPU SinJulia | FPU Mandel | CPU AES | CPU ZLib | FP64 Ray-Trace | CPU PhotoWorxx
| Performance Rating | |
| Lenovo IdeaPad 5 Pro 16ACH | |
| Huawei MateBook D 16 2022 | |
| Lenovo Yoga 7 16IAP7 | |
| Moyenne Intel Core i7-1260P | |
| Dell Inspiron 16 7620 2-in-1 | |
| Acer Swift X SFX16-51G-5388 | |
| LG Gram 16 (2021) | |
| AIDA64 / FP32 Ray-Trace | |
| Lenovo IdeaPad 5 Pro 16ACH | |
| Huawei MateBook D 16 2022 | |
| Lenovo Yoga 7 16IAP7 | |
| Moyenne Intel Core i7-1260P (2176 - 10898, n=26) | |
| Acer Swift X SFX16-51G-5388 | |
| Dell Inspiron 16 7620 2-in-1 | |
| LG Gram 16 (2021) | |
| AIDA64 / FPU Julia | |
| Lenovo IdeaPad 5 Pro 16ACH | |
| Huawei MateBook D 16 2022 | |
| Lenovo Yoga 7 16IAP7 | |
| Moyenne Intel Core i7-1260P (11015 - 56906, n=26) | |
| Acer Swift X SFX16-51G-5388 | |
| Dell Inspiron 16 7620 2-in-1 | |
| LG Gram 16 (2021) | |
| AIDA64 / CPU SHA3 | |
| Lenovo IdeaPad 5 Pro 16ACH | |
| Huawei MateBook D 16 2022 | |
| Lenovo Yoga 7 16IAP7 | |
| Acer Swift X SFX16-51G-5388 | |
| Moyenne Intel Core i7-1260P (669 - 2709, n=26) | |
| Dell Inspiron 16 7620 2-in-1 | |
| LG Gram 16 (2021) | |
| AIDA64 / CPU Queen | |
| Huawei MateBook D 16 2022 | |
| Lenovo IdeaPad 5 Pro 16ACH | |
| Lenovo Yoga 7 16IAP7 | |
| Dell Inspiron 16 7620 2-in-1 | |
| Moyenne Intel Core i7-1260P (42571 - 82493, n=26) | |
| LG Gram 16 (2021) | |
| Acer Swift X SFX16-51G-5388 | |
| AIDA64 / FPU SinJulia | |
| Lenovo IdeaPad 5 Pro 16ACH | |
| Huawei MateBook D 16 2022 | |
| Dell Inspiron 16 7620 2-in-1 | |
| Moyenne Intel Core i7-1260P (2901 - 6975, n=26) | |
| Lenovo Yoga 7 16IAP7 | |
| Acer Swift X SFX16-51G-5388 | |
| LG Gram 16 (2021) | |
| AIDA64 / FPU Mandel | |
| Lenovo IdeaPad 5 Pro 16ACH | |
| Huawei MateBook D 16 2022 | |
| Lenovo Yoga 7 16IAP7 | |
| Acer Swift X SFX16-51G-5388 | |
| Moyenne Intel Core i7-1260P (5950 - 26376, n=26) | |
| Dell Inspiron 16 7620 2-in-1 | |
| LG Gram 16 (2021) | |
| AIDA64 / CPU AES | |
| Lenovo IdeaPad 5 Pro 16ACH | |
| Huawei MateBook D 16 2022 | |
| Acer Swift X SFX16-51G-5388 | |
| LG Gram 16 (2021) | |
| Moyenne Intel Core i7-1260P (16041 - 92356, n=26) | |
| Lenovo Yoga 7 16IAP7 | |
| Dell Inspiron 16 7620 2-in-1 | |
| AIDA64 / CPU ZLib | |
| Lenovo IdeaPad 5 Pro 16ACH | |
| Huawei MateBook D 16 2022 | |
| Dell Inspiron 16 7620 2-in-1 | |
| Lenovo Yoga 7 16IAP7 | |
| Moyenne Intel Core i7-1260P (259 - 771, n=26) | |
| Acer Swift X SFX16-51G-5388 | |
| LG Gram 16 (2021) | |
| AIDA64 / FP64 Ray-Trace | |
| Lenovo IdeaPad 5 Pro 16ACH | |
| Huawei MateBook D 16 2022 | |
| Lenovo Yoga 7 16IAP7 | |
| Moyenne Intel Core i7-1260P (1237 - 5858, n=26) | |
| Acer Swift X SFX16-51G-5388 | |
| Dell Inspiron 16 7620 2-in-1 | |
| LG Gram 16 (2021) | |
| AIDA64 / CPU PhotoWorxx | |
| LG Gram 16 (2021) | |
| Lenovo Yoga 7 16IAP7 | |
| Huawei MateBook D 16 2022 | |
| Acer Swift X SFX16-51G-5388 | |
| Moyenne Intel Core i7-1260P (13261 - 43652, n=26) | |
| Dell Inspiron 16 7620 2-in-1 | |
| Lenovo IdeaPad 5 Pro 16ACH | |
Performance du système
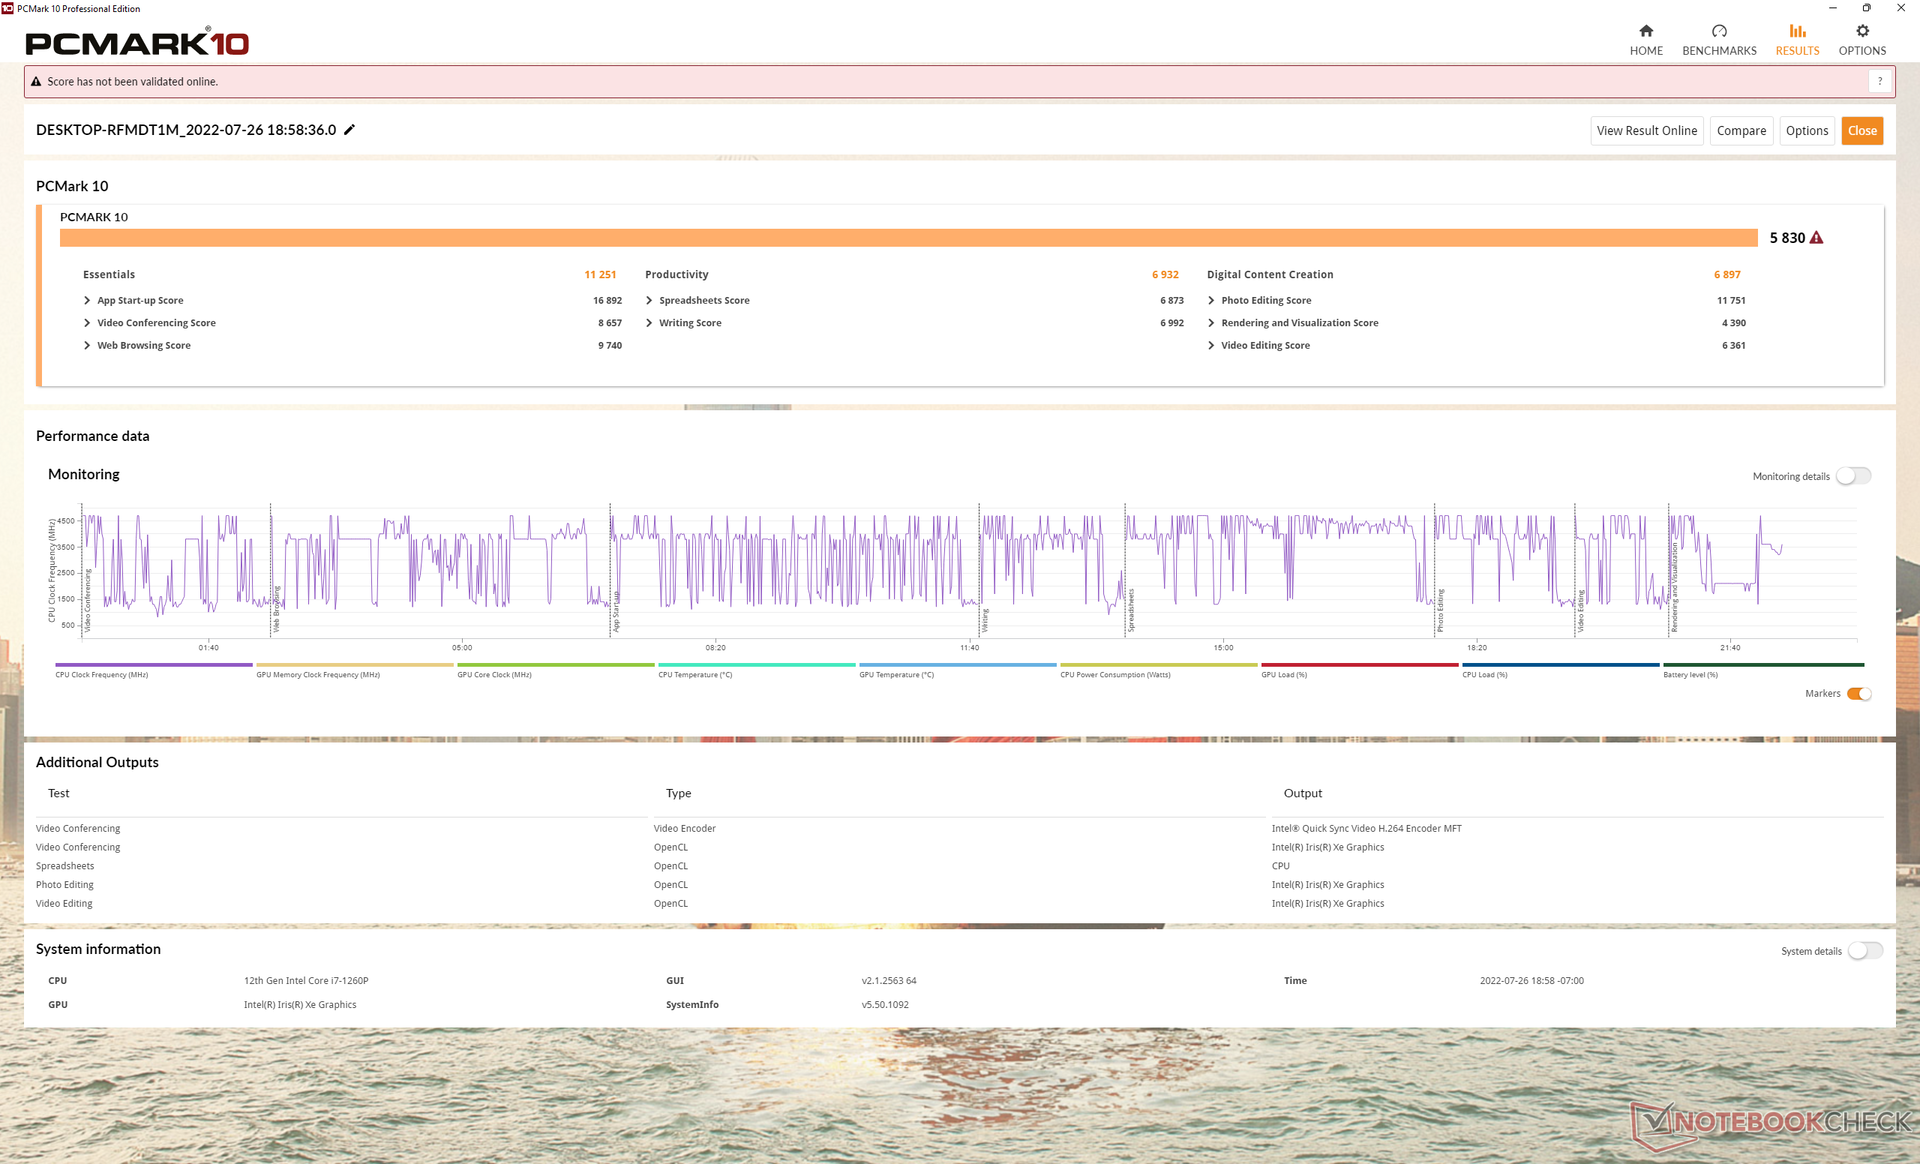
Les résultats de PCMark 10 sont excellents et proches de ce que nous avons enregistré sur le Huawei MateBook D 16 équipé du Core H ou le Ryzen H.Lenovo IdeaPad 5 Pro 16. Les scores sont sensiblement plus élevés que ceux du Dell Inspiron 16 7620, même s'ils sont tous deux équipés du même CPU Core i7-1260P, probablement parce que le modèle Dell est livré avec un SSD M.2 plus lent.
CrossMark: Overall | Productivity | Creativity | Responsiveness
| PCMark 10 / Score | |
| Huawei MateBook D 16 2022 | |
| Lenovo IdeaPad 5 Pro 16ACH | |
| Lenovo Yoga 7 16IAP7 | |
| Acer Swift X SFX16-51G-5388 | |
| Moyenne Intel Core i7-1260P, Intel Iris Xe Graphics G7 96EUs (4796 - 6068, n=17) | |
| Dell Inspiron 16 7620 2-in-1 | |
| LG Gram 16 (2021) | |
| PCMark 10 / Essentials | |
| Huawei MateBook D 16 2022 | |
| Lenovo Yoga 7 16IAP7 | |
| Moyenne Intel Core i7-1260P, Intel Iris Xe Graphics G7 96EUs (9260 - 11251, n=17) | |
| LG Gram 16 (2021) | |
| Lenovo IdeaPad 5 Pro 16ACH | |
| Dell Inspiron 16 7620 2-in-1 | |
| Acer Swift X SFX16-51G-5388 | |
| PCMark 10 / Productivity | |
| Acer Swift X SFX16-51G-5388 | |
| Lenovo IdeaPad 5 Pro 16ACH | |
| Huawei MateBook D 16 2022 | |
| Moyenne Intel Core i7-1260P, Intel Iris Xe Graphics G7 96EUs (6167 - 8629, n=17) | |
| Lenovo Yoga 7 16IAP7 | |
| LG Gram 16 (2021) | |
| Dell Inspiron 16 7620 2-in-1 | |
| PCMark 10 / Digital Content Creation | |
| Lenovo Yoga 7 16IAP7 | |
| Huawei MateBook D 16 2022 | |
| Lenovo IdeaPad 5 Pro 16ACH | |
| Acer Swift X SFX16-51G-5388 | |
| Moyenne Intel Core i7-1260P, Intel Iris Xe Graphics G7 96EUs (5231 - 6908, n=17) | |
| Dell Inspiron 16 7620 2-in-1 | |
| LG Gram 16 (2021) | |
| CrossMark / Overall | |
| Huawei MateBook D 16 2022 | |
| Lenovo Yoga 7 16IAP7 | |
| Moyenne Intel Core i7-1260P, Intel Iris Xe Graphics G7 96EUs (1484 - 1811, n=16) | |
| Dell Inspiron 16 7620 2-in-1 | |
| Acer Swift X SFX16-51G-5388 | |
| CrossMark / Productivity | |
| Huawei MateBook D 16 2022 | |
| Lenovo Yoga 7 16IAP7 | |
| Moyenne Intel Core i7-1260P, Intel Iris Xe Graphics G7 96EUs (1486 - 1755, n=16) | |
| Dell Inspiron 16 7620 2-in-1 | |
| Acer Swift X SFX16-51G-5388 | |
| CrossMark / Creativity | |
| Huawei MateBook D 16 2022 | |
| Lenovo Yoga 7 16IAP7 | |
| Moyenne Intel Core i7-1260P, Intel Iris Xe Graphics G7 96EUs (1451 - 1872, n=16) | |
| Dell Inspiron 16 7620 2-in-1 | |
| Acer Swift X SFX16-51G-5388 | |
| CrossMark / Responsiveness | |
| Huawei MateBook D 16 2022 | |
| Moyenne Intel Core i7-1260P, Intel Iris Xe Graphics G7 96EUs (1253 - 1807, n=16) | |
| Lenovo Yoga 7 16IAP7 | |
| Dell Inspiron 16 7620 2-in-1 | |
| Acer Swift X SFX16-51G-5388 | |
| PCMark 10 Score | 5830 points | |
Aide | ||
| AIDA64 / Memory Copy | |
| Lenovo Yoga 7 16IAP7 | |
| LG Gram 16 (2021) | |
| Huawei MateBook D 16 2022 | |
| Acer Swift X SFX16-51G-5388 | |
| Moyenne Intel Core i7-1260P (25125 - 71544, n=25) | |
| Lenovo IdeaPad 5 Pro 16ACH | |
| Dell Inspiron 16 7620 2-in-1 | |
| AIDA64 / Memory Read | |
| Lenovo Yoga 7 16IAP7 | |
| LG Gram 16 (2021) | |
| Huawei MateBook D 16 2022 | |
| Moyenne Intel Core i7-1260P (24983 - 72065, n=25) | |
| Acer Swift X SFX16-51G-5388 | |
| Lenovo IdeaPad 5 Pro 16ACH | |
| Dell Inspiron 16 7620 2-in-1 | |
| AIDA64 / Memory Write | |
| LG Gram 16 (2021) | |
| Acer Swift X SFX16-51G-5388 | |
| Lenovo Yoga 7 16IAP7 | |
| Huawei MateBook D 16 2022 | |
| Moyenne Intel Core i7-1260P (23512 - 66799, n=25) | |
| Dell Inspiron 16 7620 2-in-1 | |
| Lenovo IdeaPad 5 Pro 16ACH | |
| AIDA64 / Memory Latency | |
| Acer Swift X SFX16-51G-5388 | |
| Huawei MateBook D 16 2022 | |
| Lenovo Yoga 7 16IAP7 | |
| LG Gram 16 (2021) | |
| Lenovo IdeaPad 5 Pro 16ACH | |
| Moyenne Intel Core i7-1260P (77.9 - 118.4, n=21) | |
* ... Moindre est la valeur, meilleures sont les performances
Latence DPC
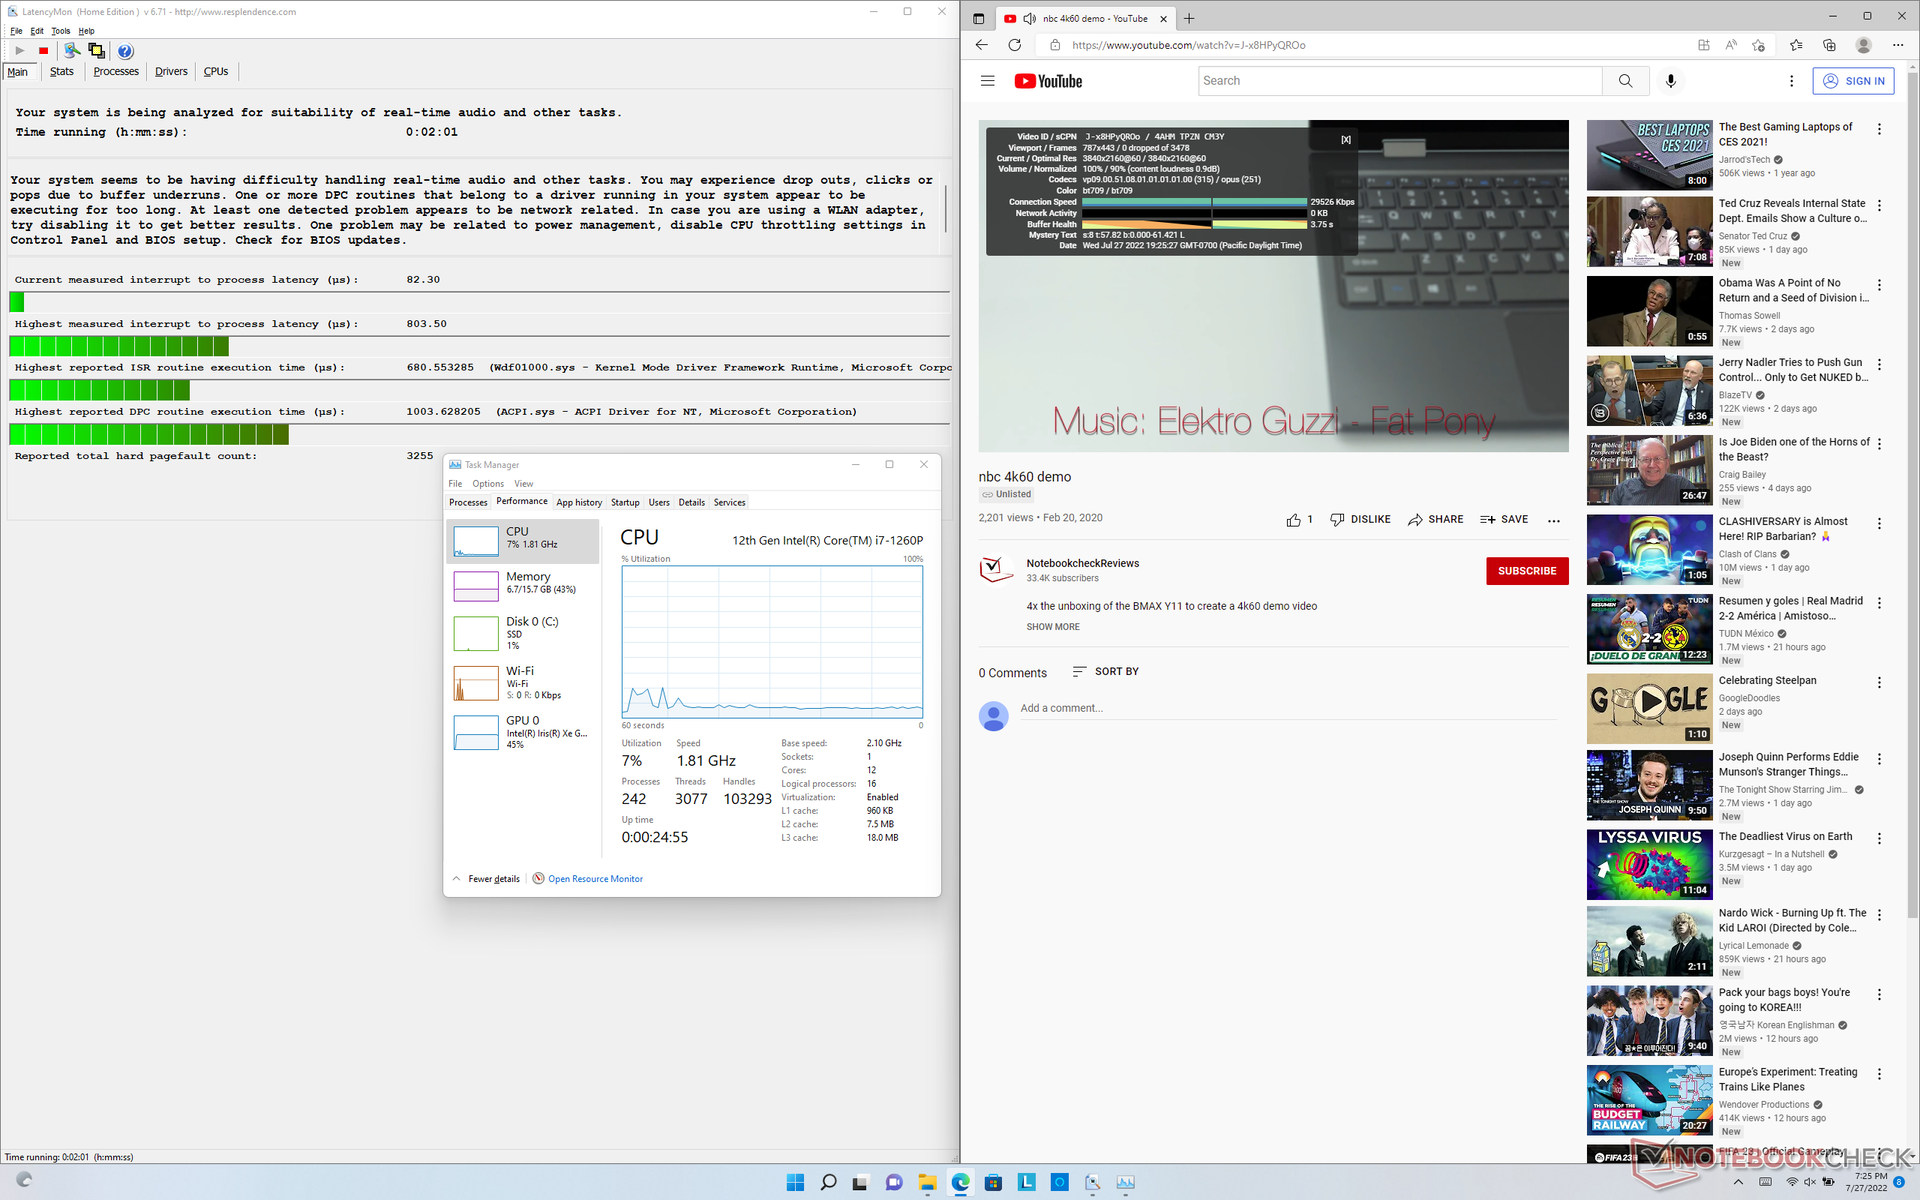
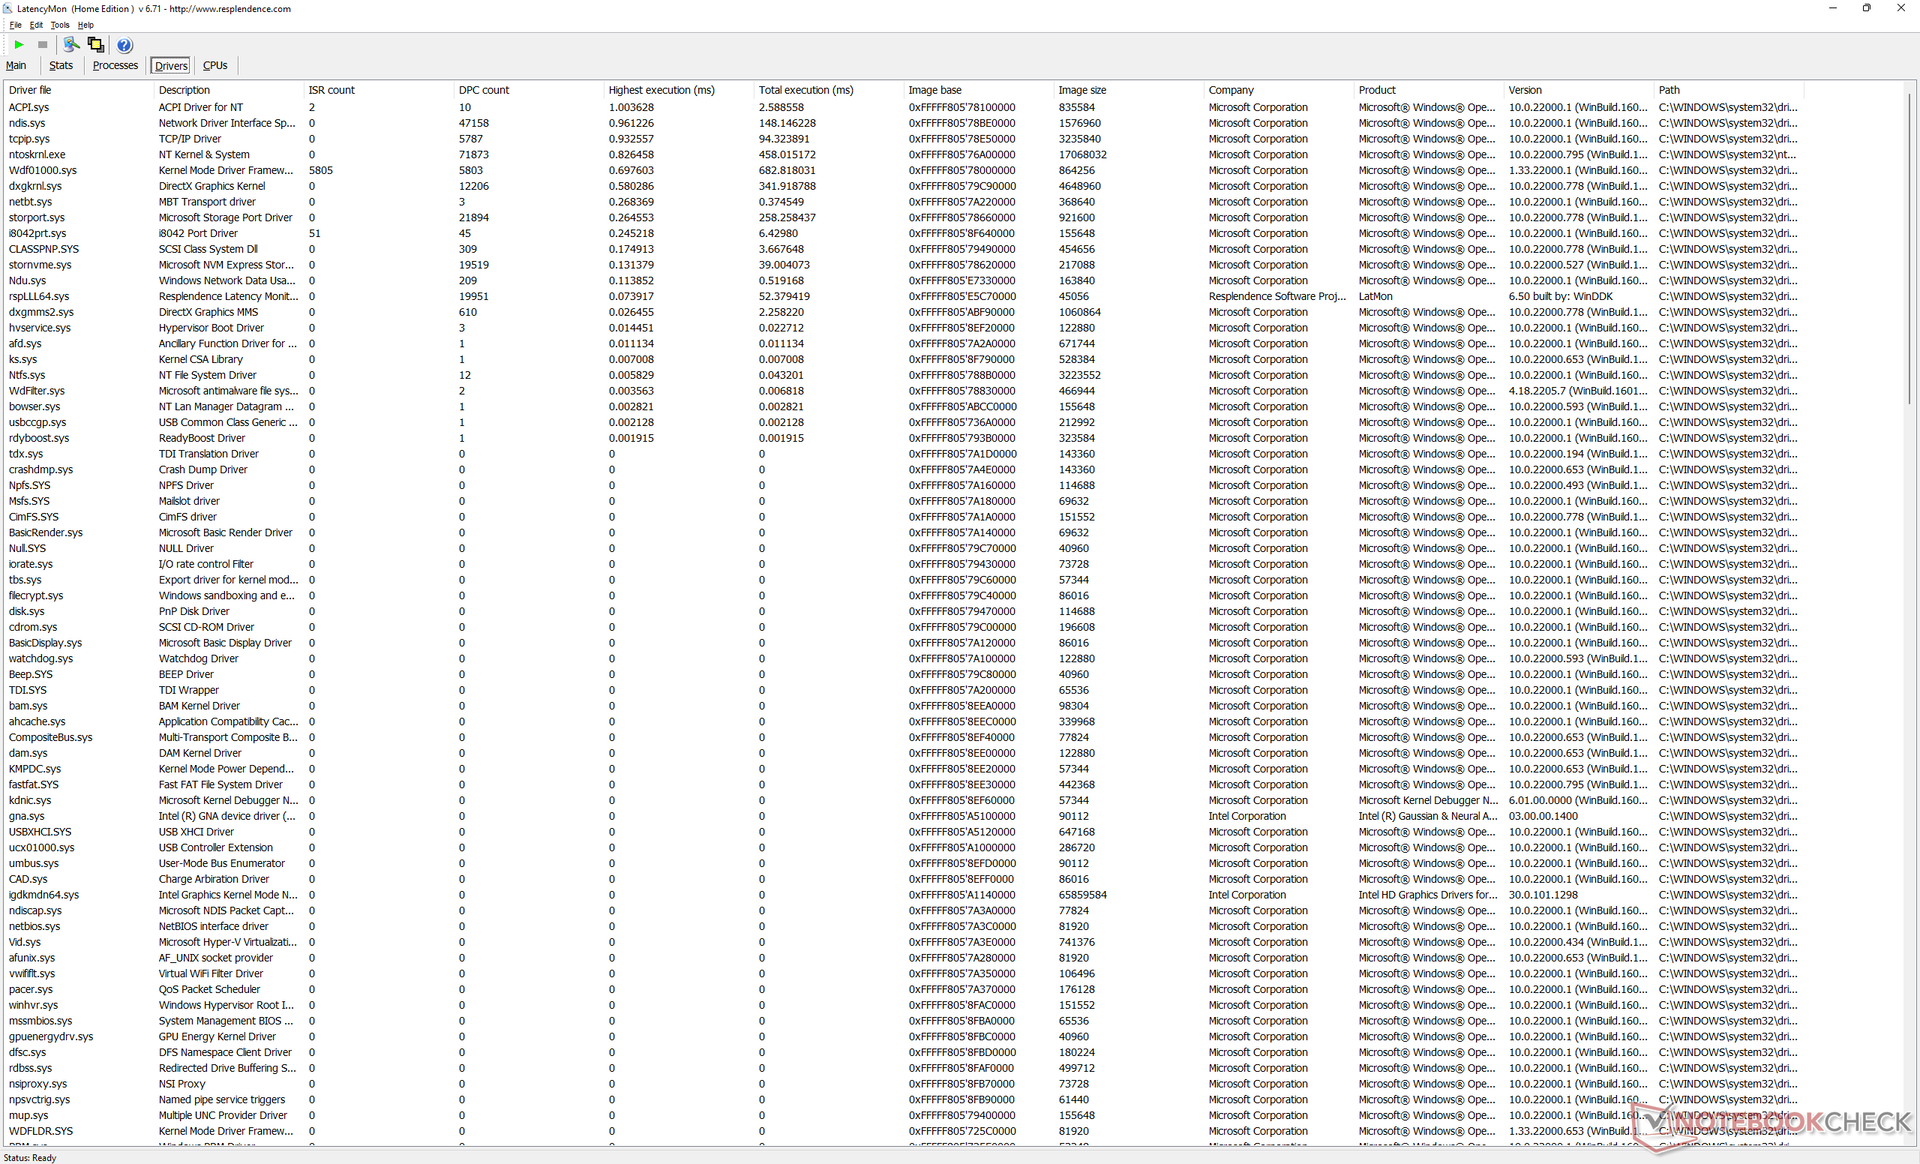
LatencyMon révèle des problèmes mineurs de CPD lors de l'ouverture de plusieurs onglets de navigateur sur notre page d'accueil. la lecture de vidéos 4K à 60 FPS est par ailleurs excellente et ne présente aucune perte d'images.
| DPC Latencies / LatencyMon - interrupt to process latency (max), Web, Youtube, Prime95 | |
| Huawei MateBook D 16 2022 | |
| Lenovo Yoga 7 16IAP7 | |
| Dell Inspiron 16 7620 2-in-1 | |
| Lenovo IdeaPad 5 Pro 16ACH | |
| LG Gram 16 (2021) | |
* ... Moindre est la valeur, meilleures sont les performances
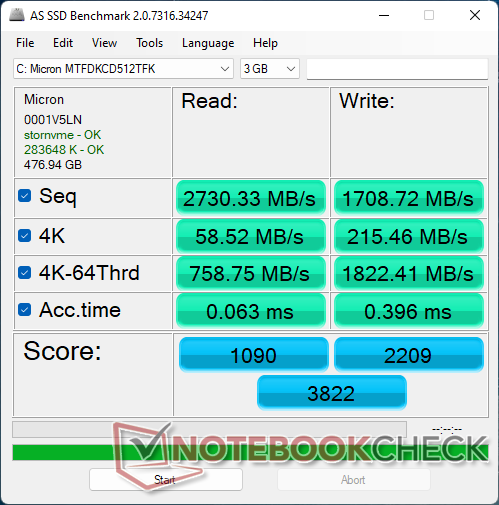
Périphériques de stockage - Un seul disque interne
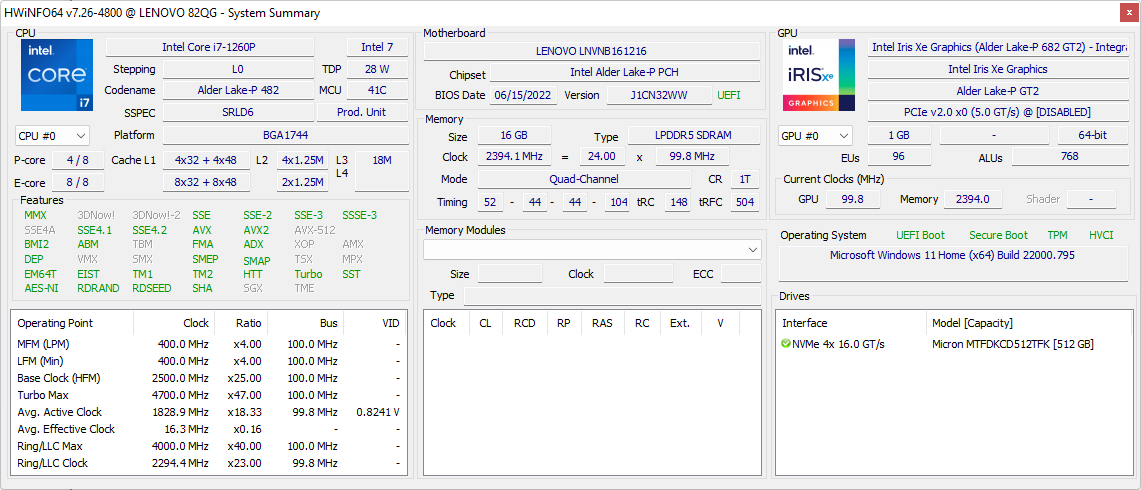
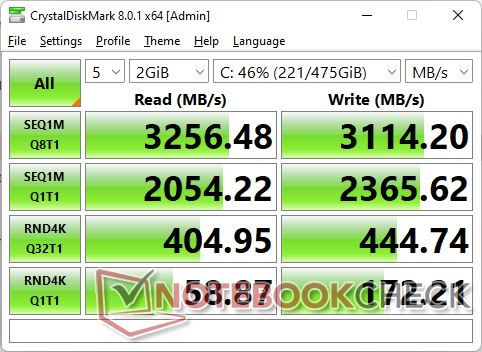
Notre unité est livrée avec un disque dur de 512 Go Micron MTFDKCD512TFK PCIe3 x4 NVMe SSD pour des taux de lecture et d'écriture séquentiels allant jusqu'à 3200 Mo/s et 3100 Mo/s, respectivement, qui sont similaires à ce que la plupart des disques PCIe3 haut de gamme ont à offrir. Cependant, les taux de lecture et d'écriture 4k q32 t16 sont beaucoup plus lents que prévu par rapport au Samsung PM981a.
Le disque de notre unité ne présente aucun problème d'étranglement des performances lors de l'exécution de DiskSpd en boucle.

| Drive Performance Rating - Percent | |
| LG Gram 16 (2021) | |
| Huawei MateBook D 16 2022 | |
| Lenovo Yoga 7 16IAP7 | |
| Lenovo IdeaPad 5 Pro 16ACH | |
| Acer Swift X SFX16-51G-5388 | |
| Dell Inspiron 16 7620 2-in-1 | |
* ... Moindre est la valeur, meilleures sont les performances
Disk Throttling: DiskSpd Read Loop, Queue Depth 8
Performances du GPU
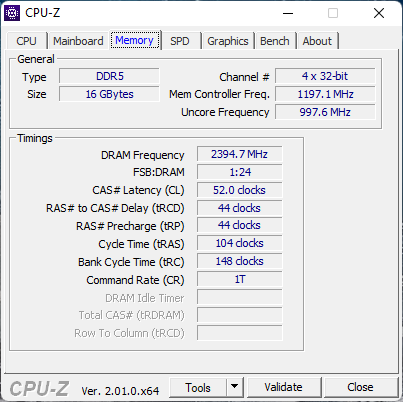
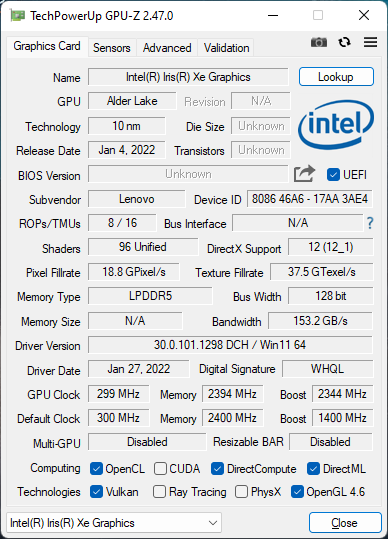
Les performances graphiques brutes sont légèrement supérieures à celles de l'ordinateur portable moyen de notre base de données équipé du même système intégré Iris Xe 96 EU intégrée. Cette amélioration est probablement due en partie à la RAM LPDDR5-4800 plus rapide, alors que la plupart des ordinateurs portables sont encore en DDR4-3200. Les avantages d'une année sur l'autre ne sont autrement que marginaux puisque l'architecture graphique de base n'a pas changé malgré toutes les différences de CPU entre la 11e génération Tiger Lake et la 12e génération Alder Lake.
La mise à niveau vers un Intel Arc A370M permettra aux utilisateurs d'obtenir des performances de GPU de 60 à 150 % supérieures à celles de nos Iris Xe 96 EU, d'après notre expérience avec l'Asus ZenBook Flip 15 Q5.Asus ZenBook Flip 15 Q539ZD.
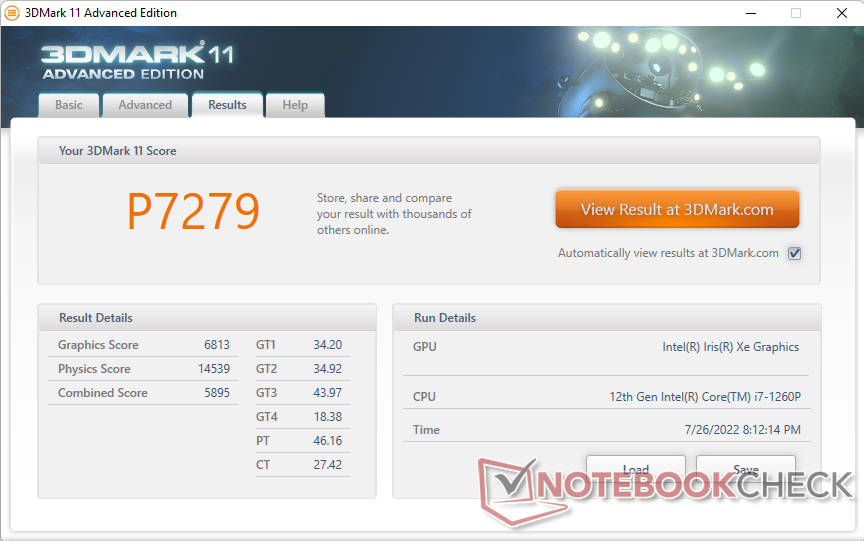

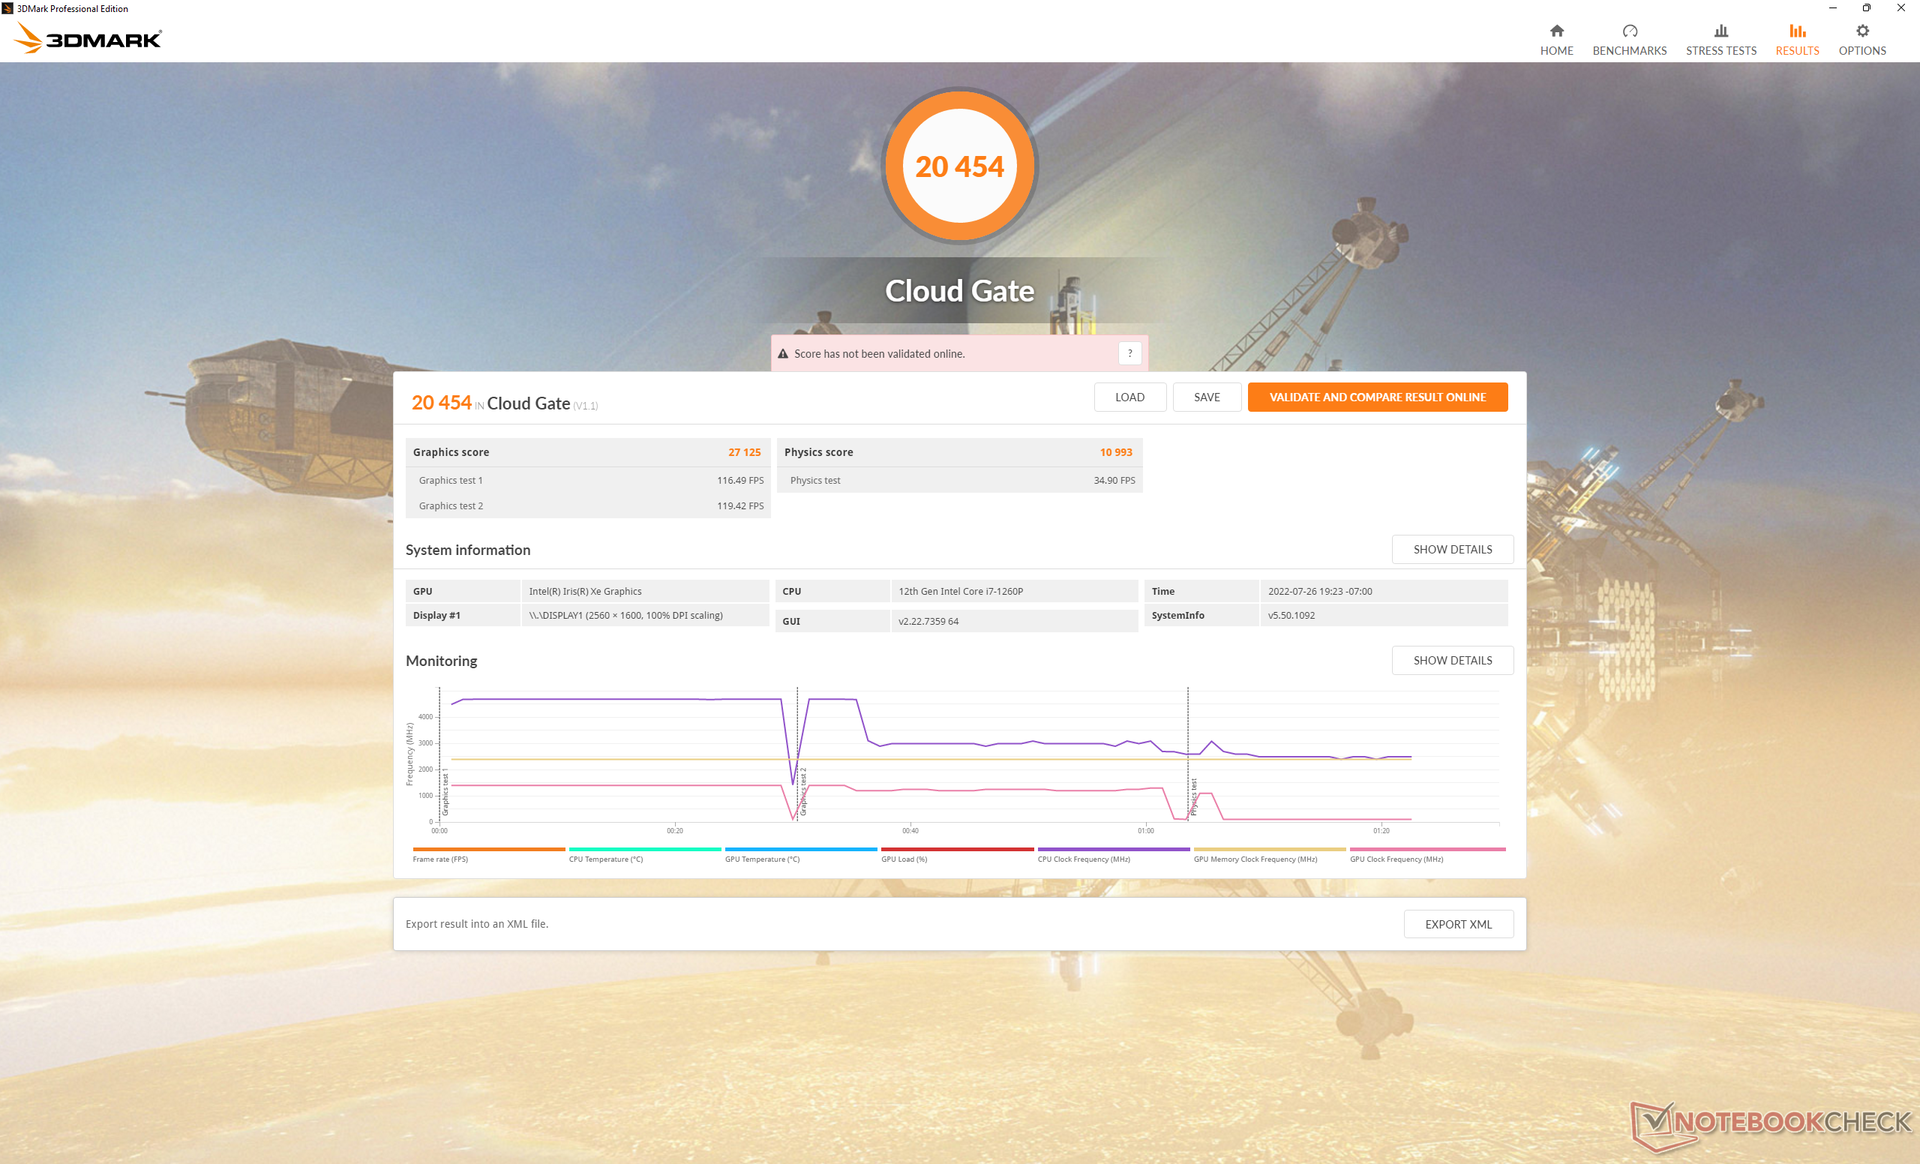
| 3DMark 11 Performance | 7279 points | |
| 3DMark Cloud Gate Standard Score | 20454 points | |
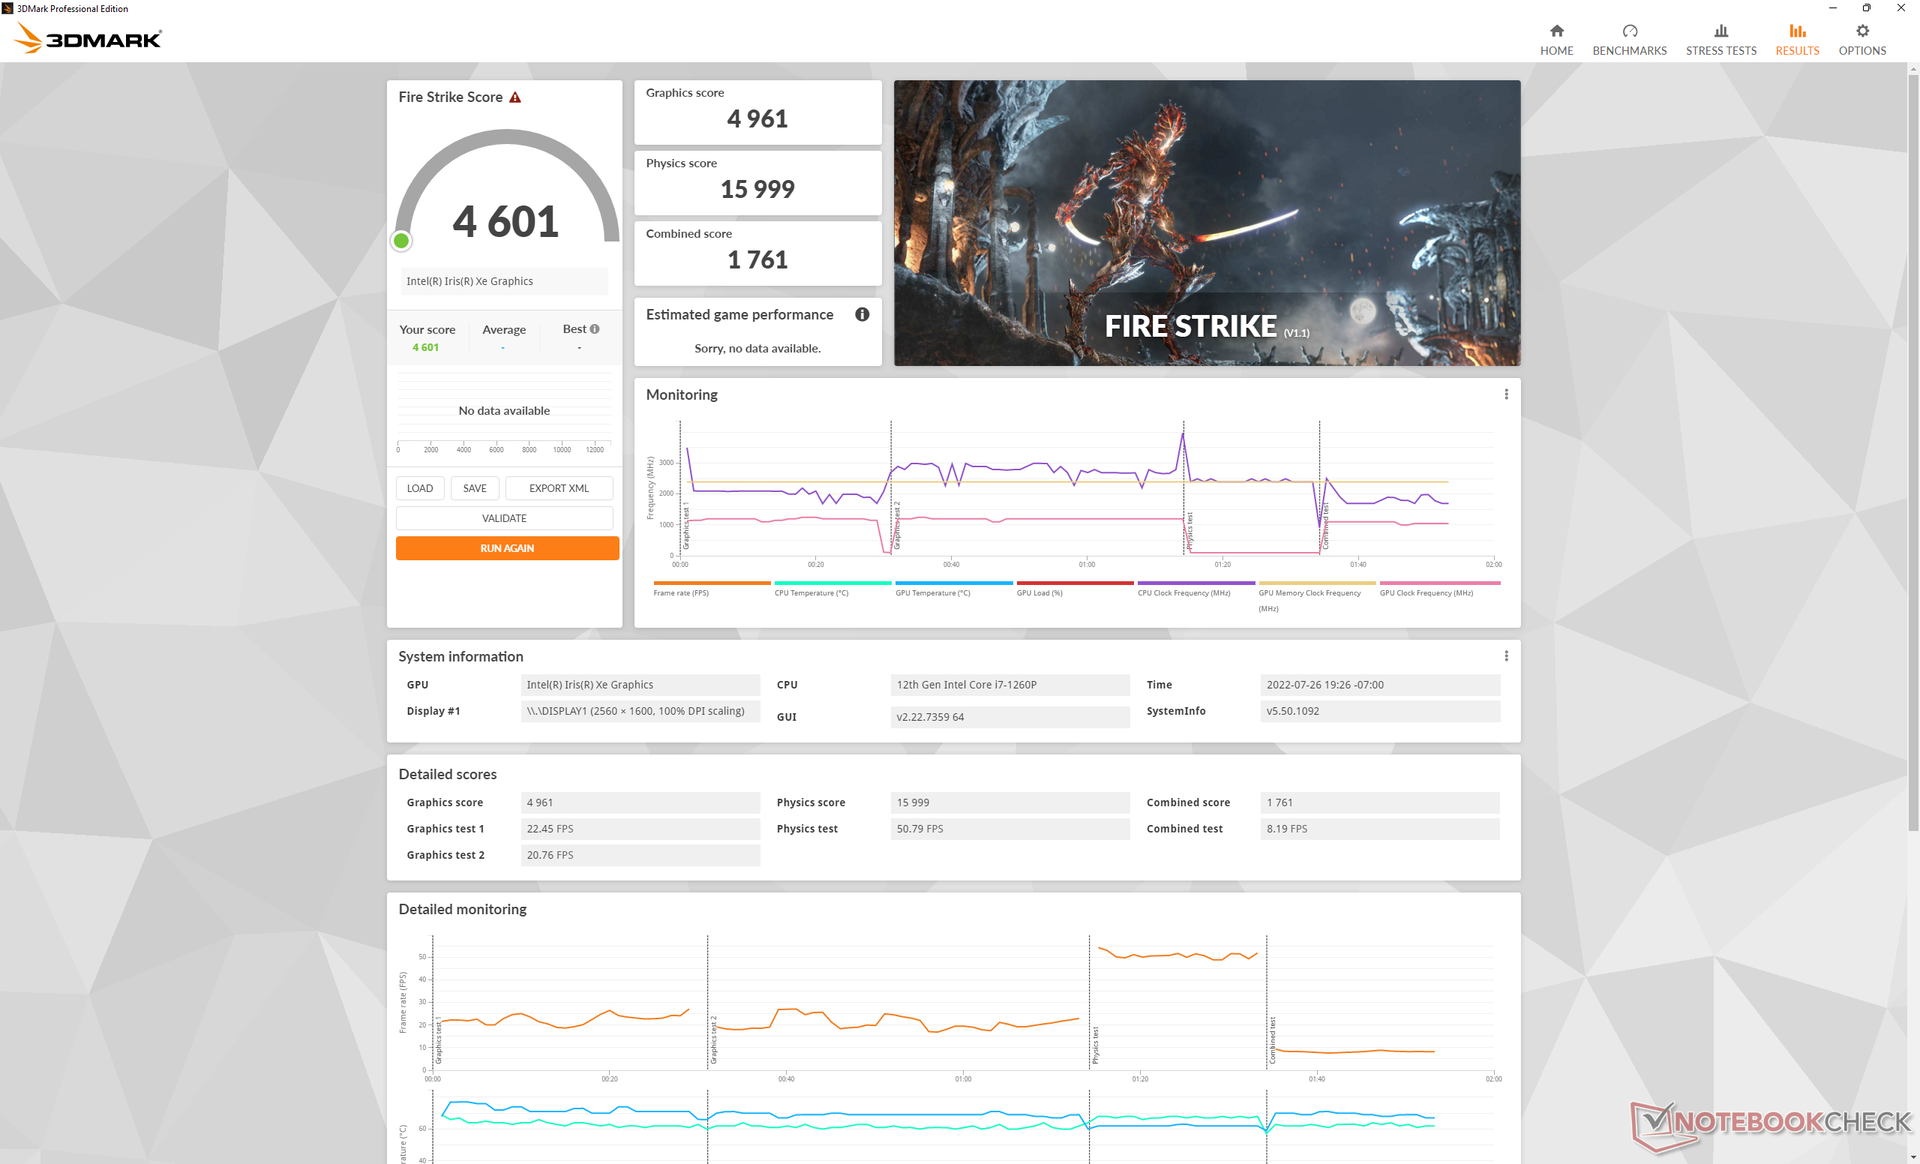
| 3DMark Fire Strike Score | 4601 points | |
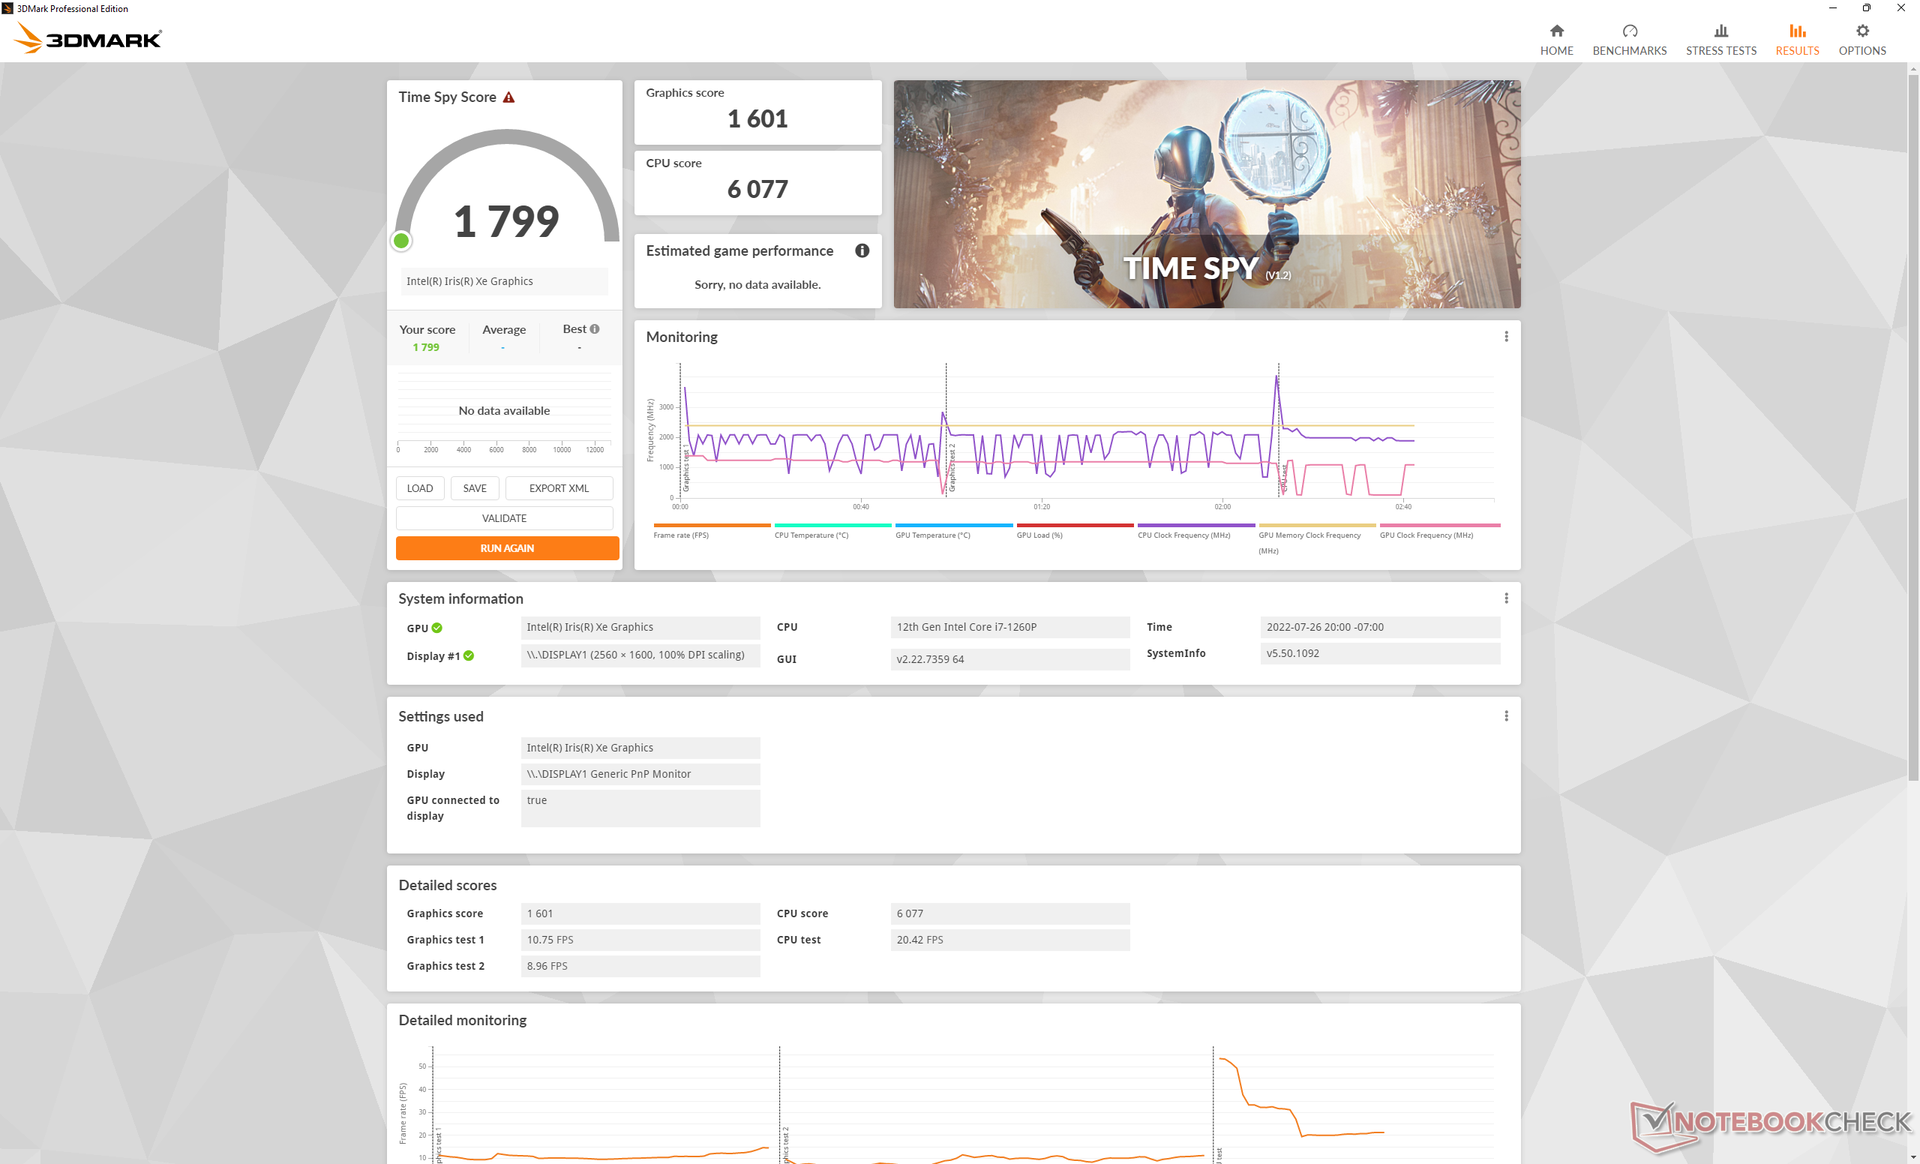
| 3DMark Time Spy Score | 1799 points | |
Aide | ||
Witcher 3 FPS Chart
| Bas | Moyen | Élevé | Ultra | |
| GTA V (2015) | 117.1 | 91 | 19.6 | 9.25 |
| The Witcher 3 (2015) | 78.3 | 51.4 | 29.1 | 13.7 |
| Dota 2 Reborn (2015) | 118.4 | 86.6 | 62.3 | 52.4 |
| Final Fantasy XV Benchmark (2018) | 40.4 | 22.6 | 16 | |
| X-Plane 11.11 (2018) | 42.6 | 30.1 | 29.1 | |
| Strange Brigade (2018) | 95.5 | 44.5 | 35.4 | 28.7 |
| Cyberpunk 2077 1.6 (2022) | 18.8 | 15.7 | 12 | 9.7 |
Émissions
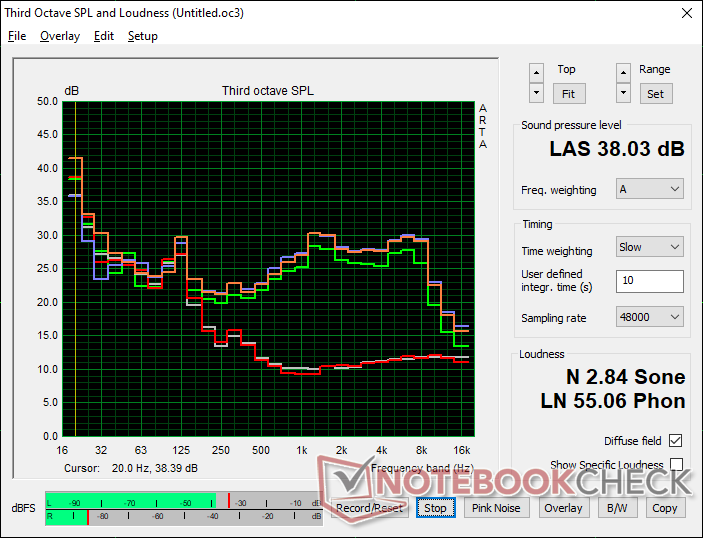
Bruit du système
Le bruit et le comportement du ventilateur dépendent des trois paramètres du profil d'alimentation Lenovo Vantage : Battery Saving, Intelligent Cooling et Extreme Performance. L'option Économie de batterie est recommandée pour la navigation ou la diffusion en continu, sinon le ventilateur interne se met rapidement en marche lorsque des charges plus importantes sont introduites. En exécutant Witcher 3 en mode Refroidissement intelligent et en mode Performances extrêmes, le niveau sonore du ventilateur est respectivement de 37,7 dB(A) et 40 dB(A), soit des niveaux légèrement plus élevés que ceux observés sur le Dell Inspiron 16 7620 2-en-1. Le système est par ailleurs raisonnablement silencieux, avec un niveau sonore bien inférieur à 30 dB(A) pour la plupart des tâches quotidiennes.
Degré de la nuisance sonore
| Au repos |
| 23.6 / 23.6 / 23.6 dB(A) |
| Fortement sollicité |
| 37.7 / 40.2 dB(A) |
 | ||
30 dB silencieux 40 dB(A) audible 50 dB(A) bruyant |
||
min: | ||
| Lenovo Yoga 7 16IAP7 Iris Xe G7 96EUs, i7-1260P, Micron 2450 512GB MTFDKCD512TFK | Huawei MateBook D 16 2022 Iris Xe G7 96EUs, i7-12700H, Silicon Motion PCIe-8 SSD | Dell Inspiron 16 7620 2-in-1 Iris Xe G7 96EUs, i7-1260P, Toshiba KBG40ZNS512G NVMe | Acer Swift X SFX16-51G-5388 GeForce RTX 3050 4GB Laptop GPU, i5-11320H, Samsung PM991 MZVLQ512HBLU | LG Gram 16 (2021) Iris Xe G7 96EUs, i7-1165G7, SK Hynix PC601 1TB HFS001TD9TNG | Lenovo IdeaPad 5 Pro 16ACH GeForce GTX 1650 Mobile, R7 5800H, Micron 2300 512GB MTFDHBA512TDV | |
|---|---|---|---|---|---|---|
| Noise | -7% | 5% | -11% | 0% | -10% | |
| off / environment * | 23.6 | 24.2 -3% | 23.2 2% | 25.4 -8% | 26 -10% | 24.04 -2% |
| Idle Minimum * | 23.6 | 24.2 -3% | 23.5 -0% | 25.4 -8% | 26 -10% | 24.04 -2% |
| Idle Average * | 23.6 | 25.8 -9% | 23.5 -0% | 25.4 -8% | 26 -10% | 24.04 -2% |
| Idle Maximum * | 23.6 | 30.5 -29% | 23.5 -0% | 27.8 -18% | 26 -10% | 24.04 -2% |
| Load Average * | 37.7 | 39.8 -6% | 29.4 22% | 41 -9% | 30.8 18% | 41.3 -10% |
| Witcher 3 ultra * | 40 | 39.8 -0% | 35.6 11% | 49.21 -23% | ||
| Load Maximum * | 40.2 | 39.8 1% | 39.7 1% | 47 -17% | 31.1 23% | 52.93 -32% |
* ... Moindre est la valeur, meilleures sont les performances
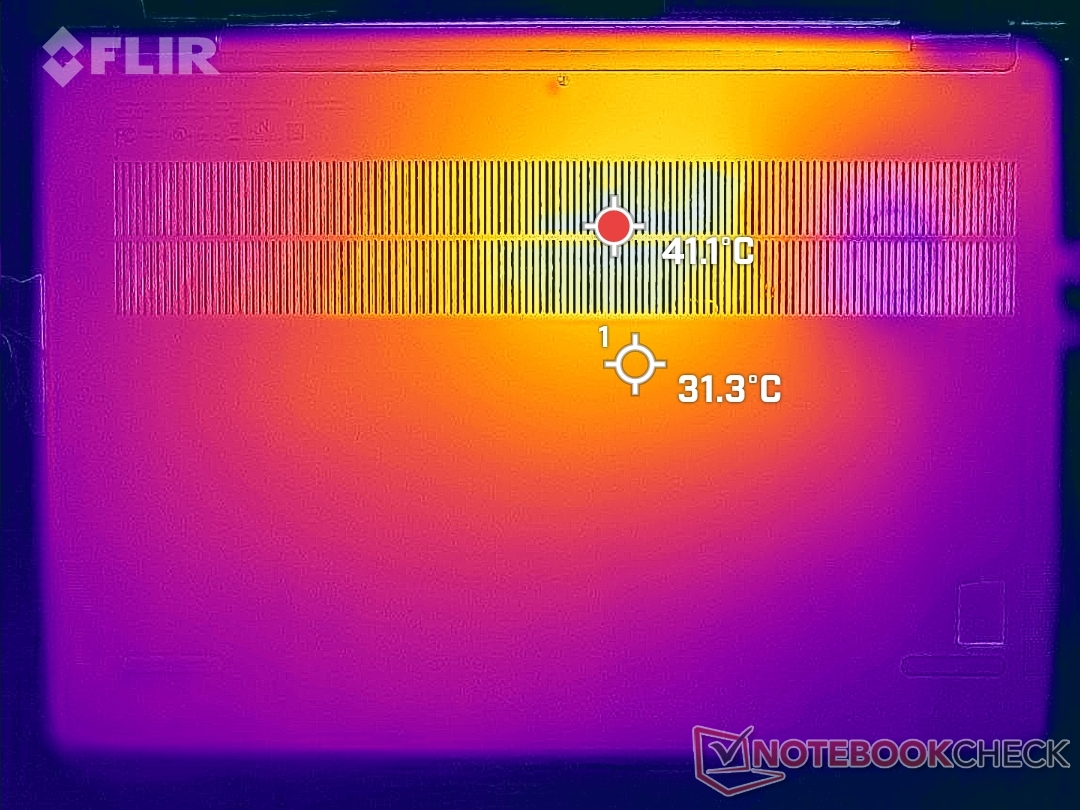
Température - Plutôt cool
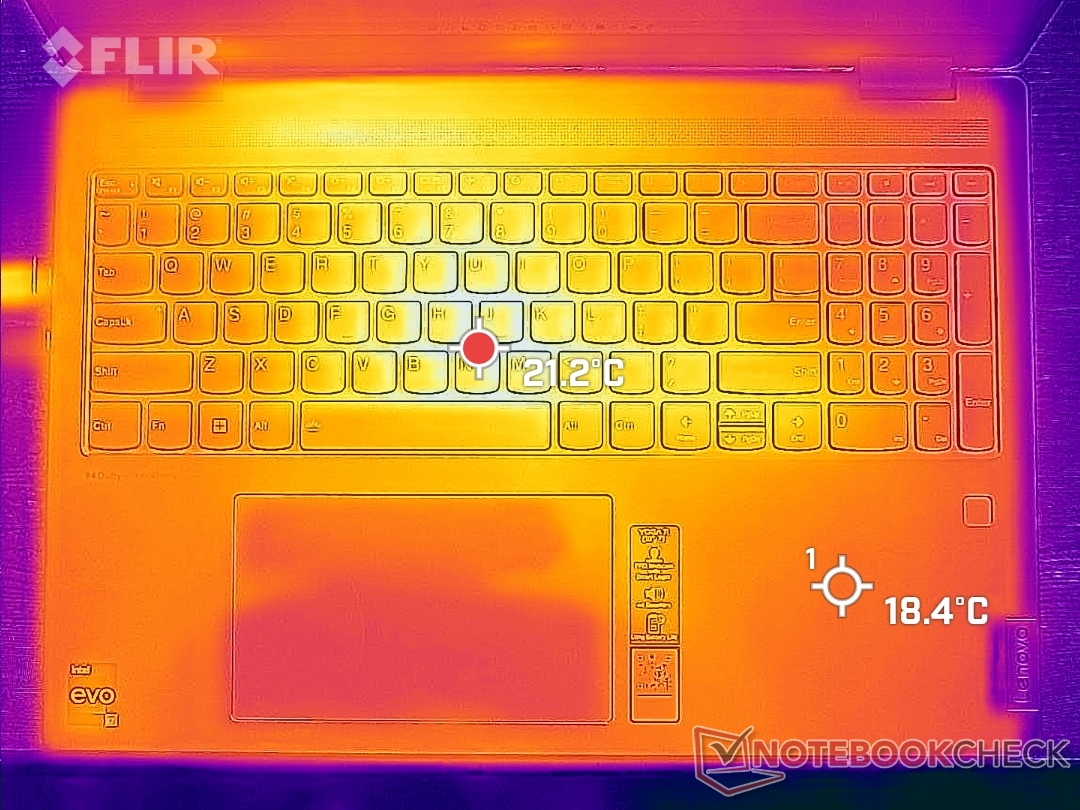
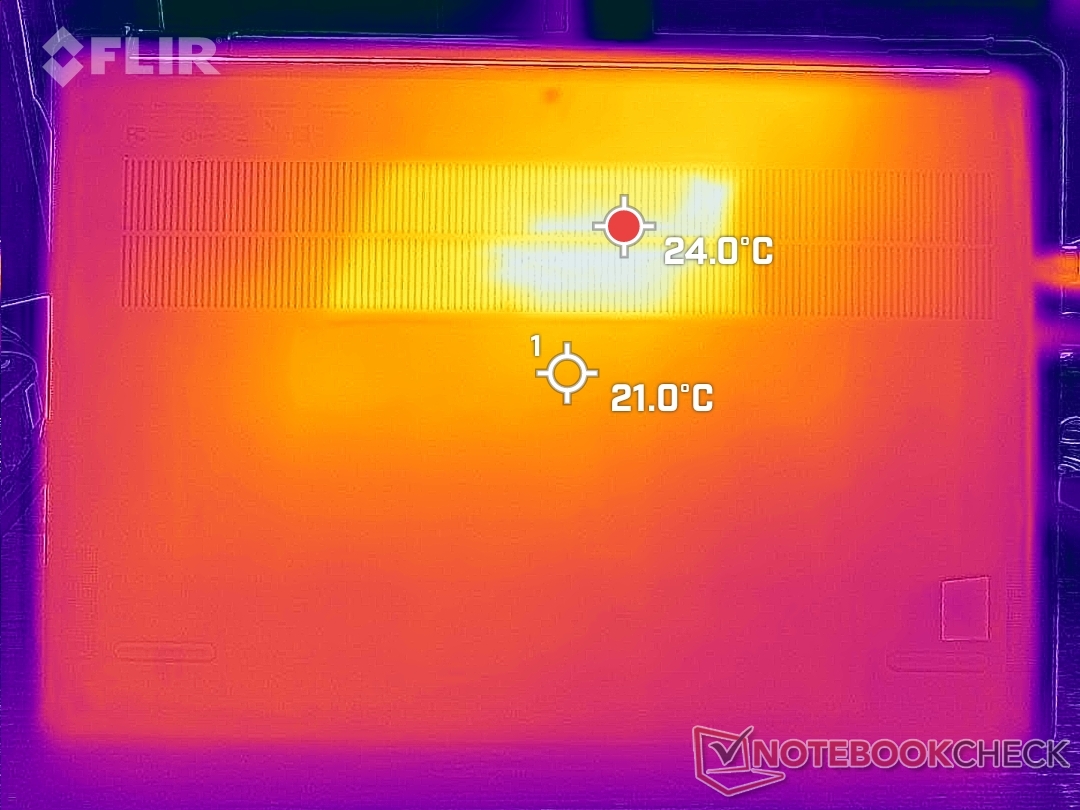
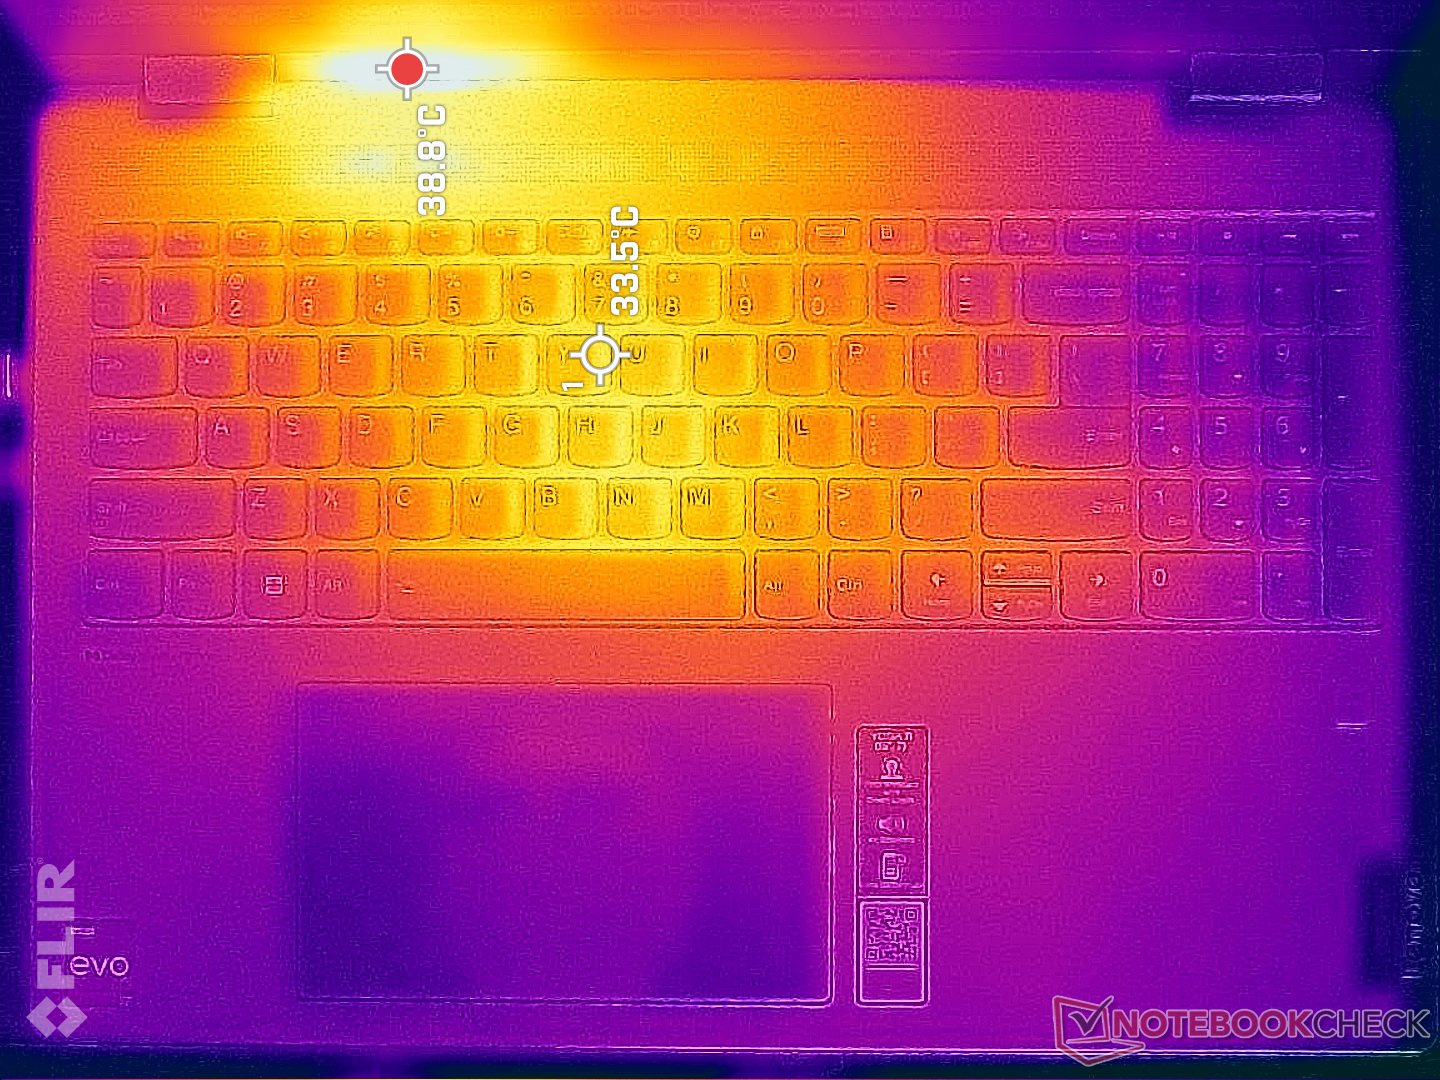
Les températures de surface ne sont pas si élevées, même en cas de charges exigeantes. Les points chauds sur le dessus et le dessous peuvent atteindre 39 C et 35 C, respectivement, contre 41 C à 48 C sur l'ordinateur Huawei MateBook D 16 2022 ou 45 C à 47 C sur le LG Gram 16. Ces points chauds se trouvent vers l'arrière du châssis, laissant les repose-paumes plus frais.
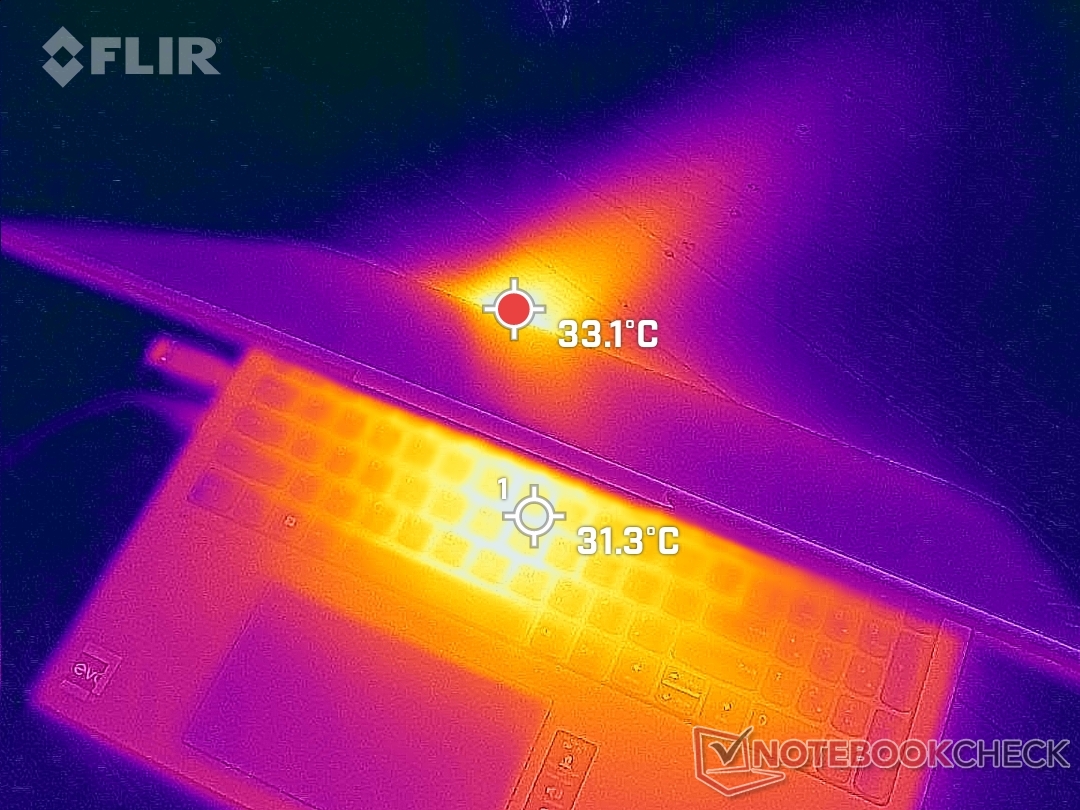
(+) La température maximale du côté supérieur est de 39 °C / 102 F, par rapport à la moyenne de 35.3 °C / 96 F, allant de 19.6 à 55.7 °C pour la classe Convertible.
(+) Le fond chauffe jusqu'à un maximum de 34.2 °C / 94 F, contre une moyenne de 36.8 °C / 98 F
(+) En utilisation inactive, la température moyenne du côté supérieur est de 19.3 °C / 67 F, par rapport à la moyenne du dispositif de 30.2 °C / 86 F.
(+) Les repose-poignets et le pavé tactile sont plus froids que la température de la peau avec un maximum de 23.4 °C / 74.1 F et sont donc froids au toucher.
(+) La température moyenne de la zone de l'appui-paume de dispositifs similaires était de 28.1 °C / 82.6 F (+4.7 °C / #8.5 F).
| Lenovo Yoga 7 16IAP7 Intel Core i7-1260P, Intel Iris Xe Graphics G7 96EUs | Huawei MateBook D 16 2022 Intel Core i7-12700H, Intel Iris Xe Graphics G7 96EUs | Dell Inspiron 16 7620 2-in-1 Intel Core i7-1260P, Intel Iris Xe Graphics G7 96EUs | Acer Swift X SFX16-51G-5388 Intel Core i5-11320H, NVIDIA GeForce RTX 3050 4GB Laptop GPU | LG Gram 16 (2021) Intel Core i7-1165G7, Intel Iris Xe Graphics G7 96EUs | Lenovo IdeaPad 5 Pro 16ACH AMD Ryzen 7 5800H, NVIDIA GeForce GTX 1650 Mobile | |
|---|---|---|---|---|---|---|
| Heat | -30% | -39% | -41% | -22% | -36% | |
| Maximum Upper Side * | 39 | 41.8 -7% | 42.2 -8% | 52.4 -34% | 46.9 -20% | 51.9 -33% |
| Maximum Bottom * | 34.2 | 47.3 -38% | 47.4 -39% | 50 -46% | 45.1 -32% | 51.5 -51% |
| Idle Upper Side * | 21.2 | 28.3 -33% | 32.2 -52% | 30.3 -43% | 26.4 -25% | 27.2 -28% |
| Idle Bottom * | 21.6 | 30.2 -40% | 33.6 -56% | 30.4 -41% | 24.1 -12% | 28.5 -32% |
* ... Moindre est la valeur, meilleures sont les performances
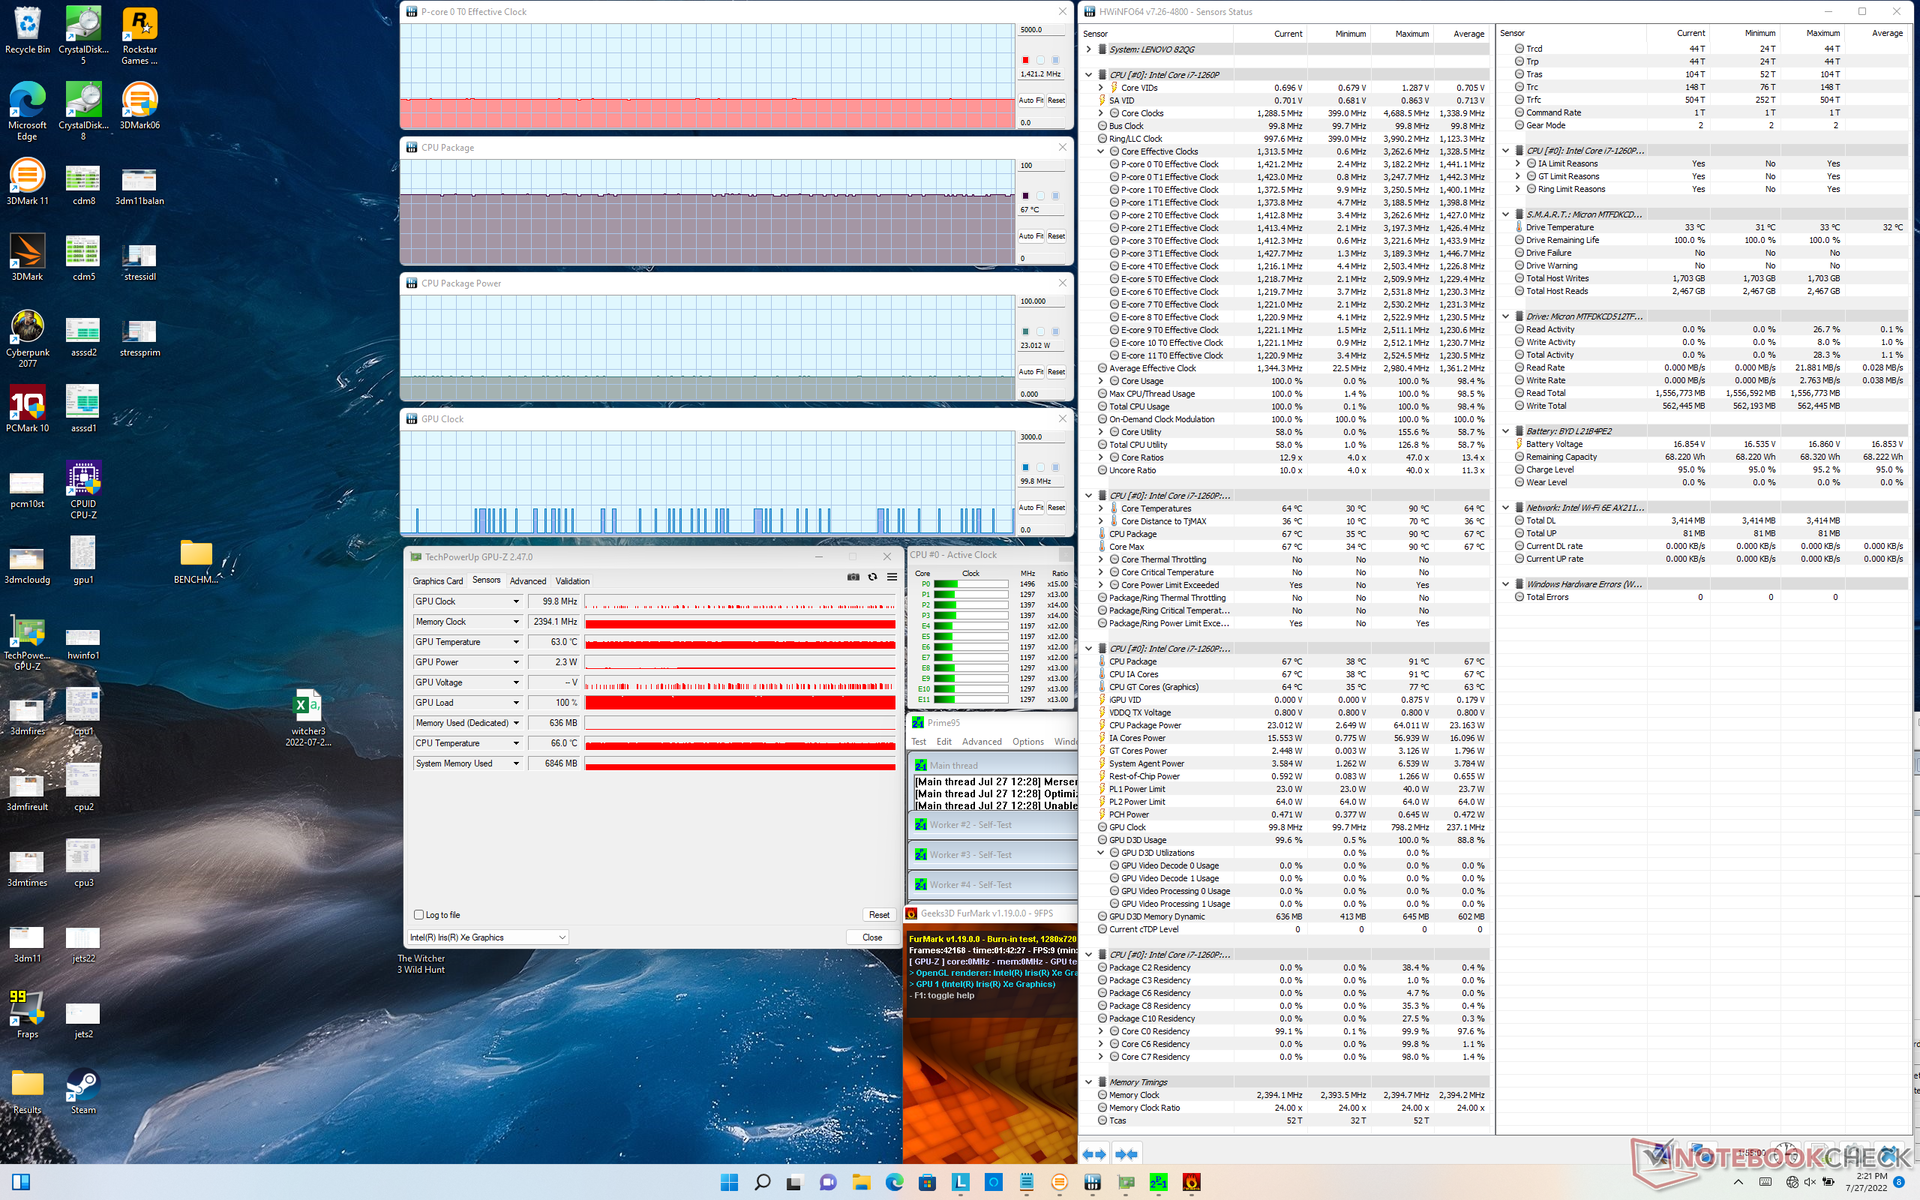
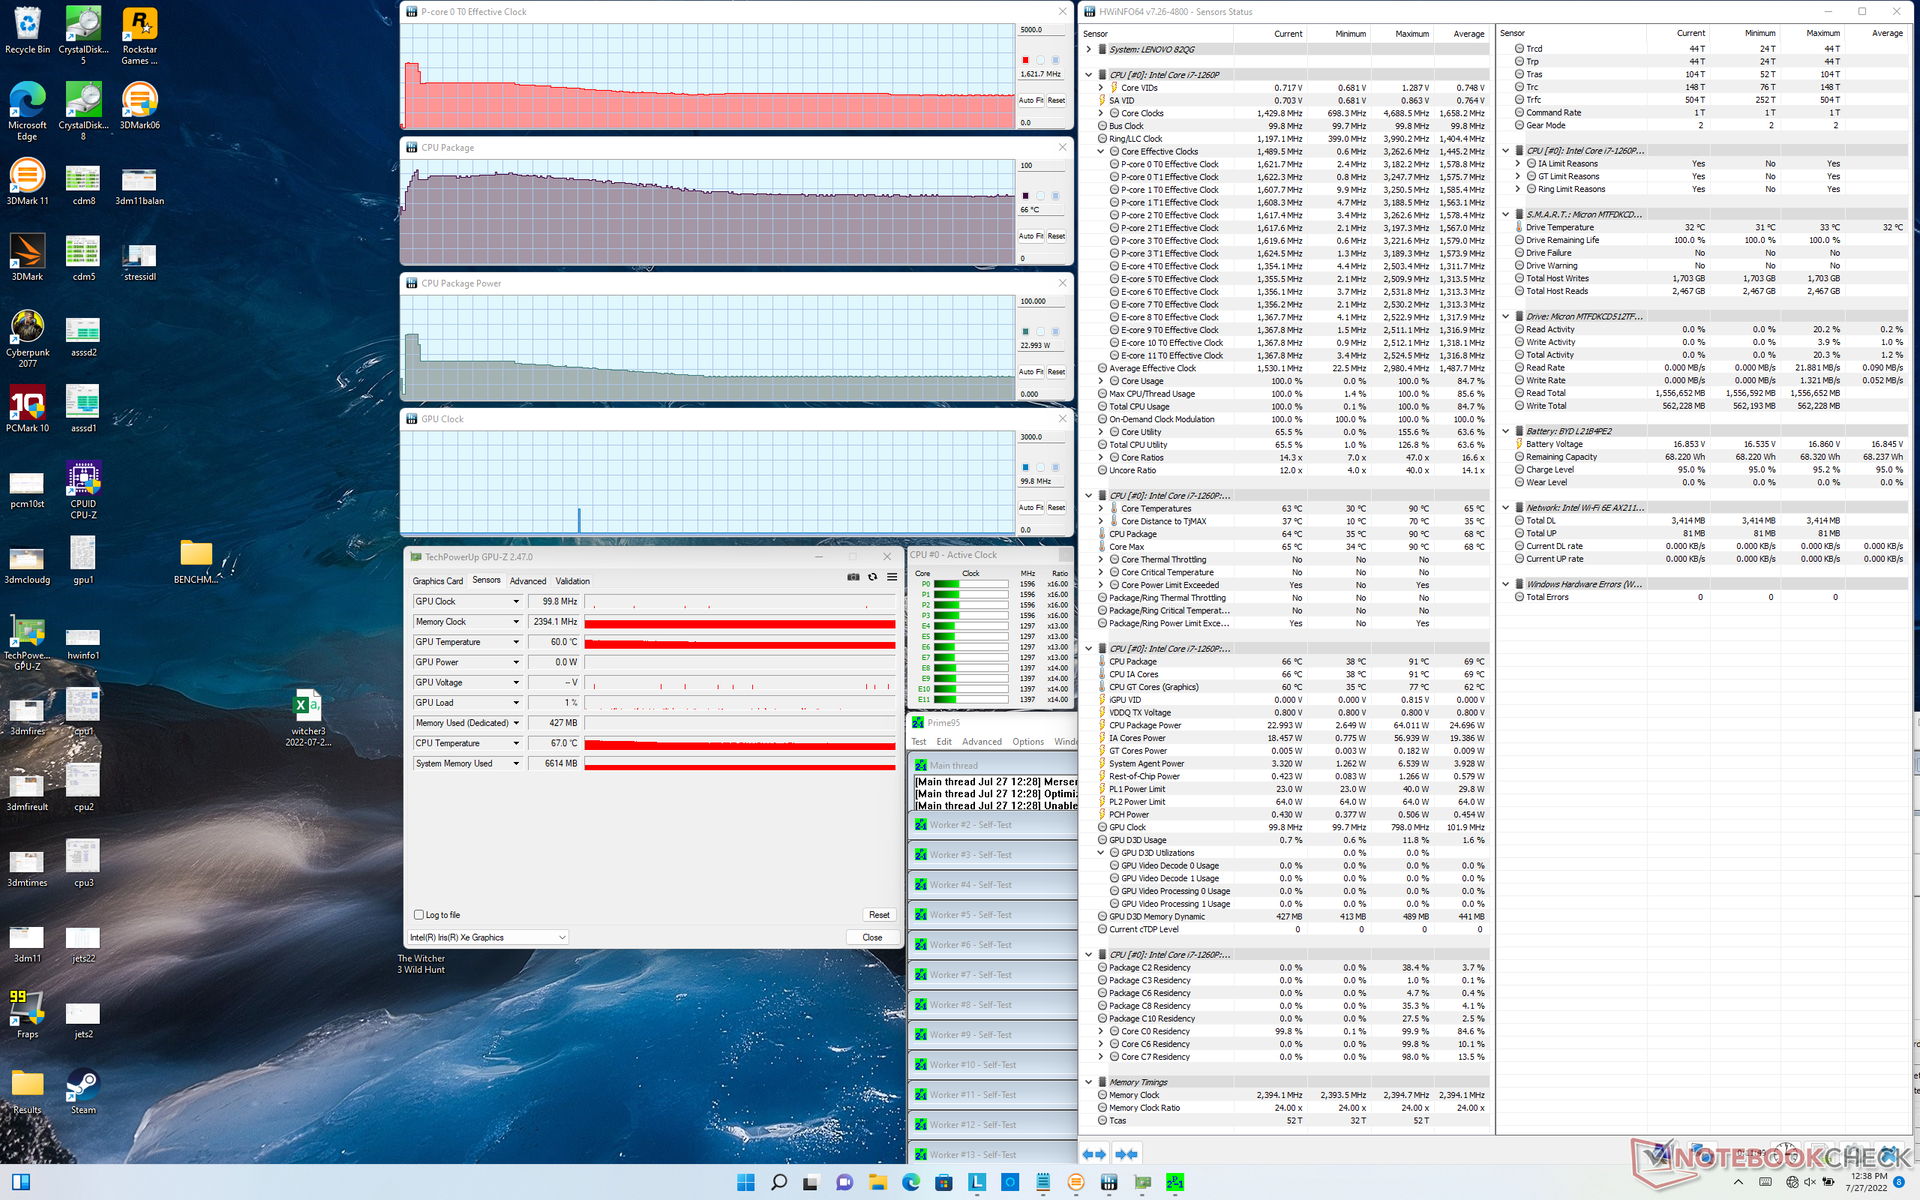
Test de stress
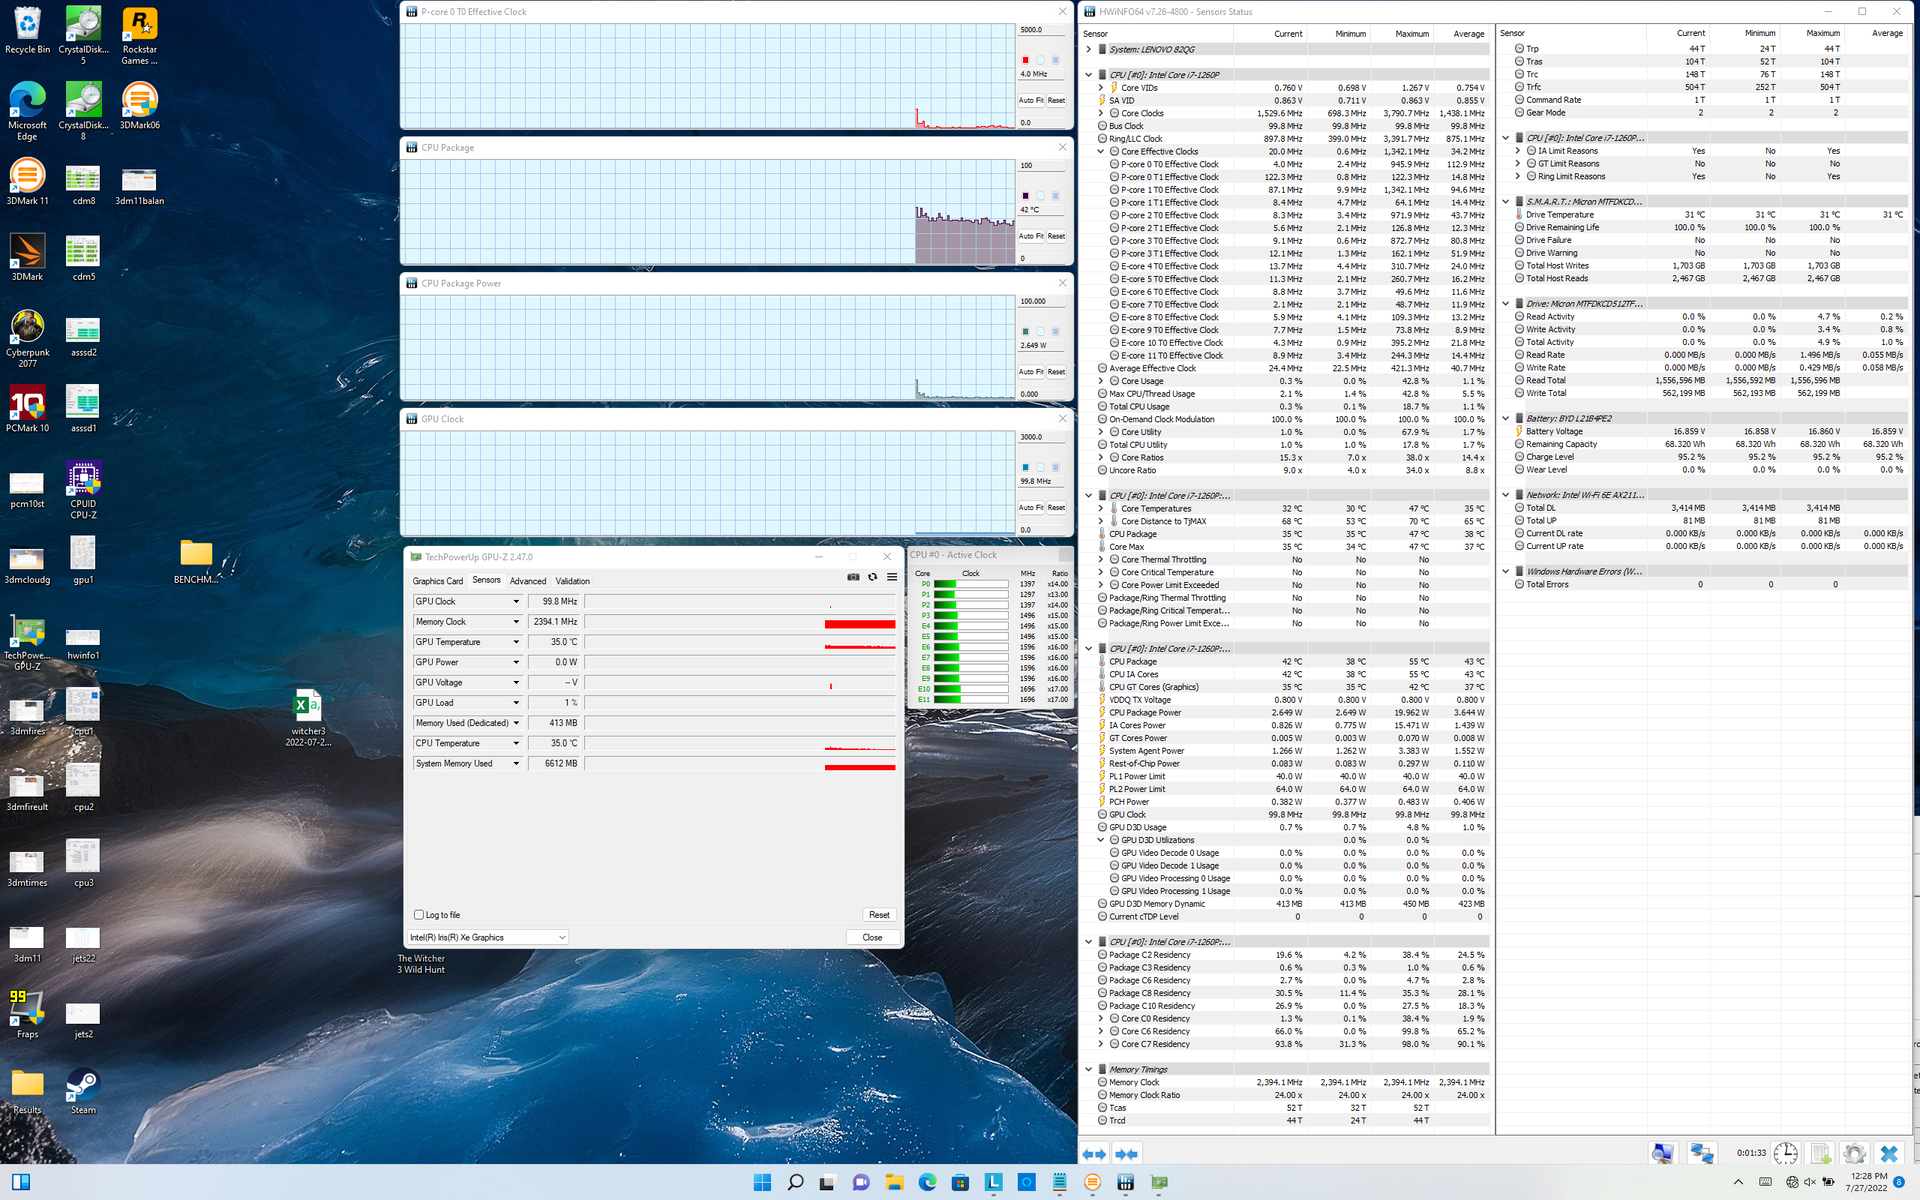
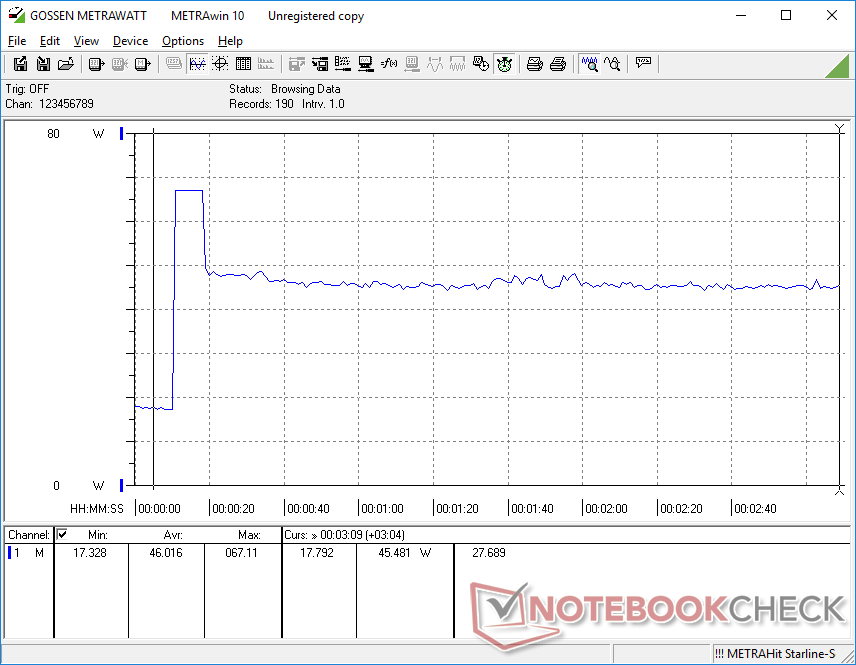
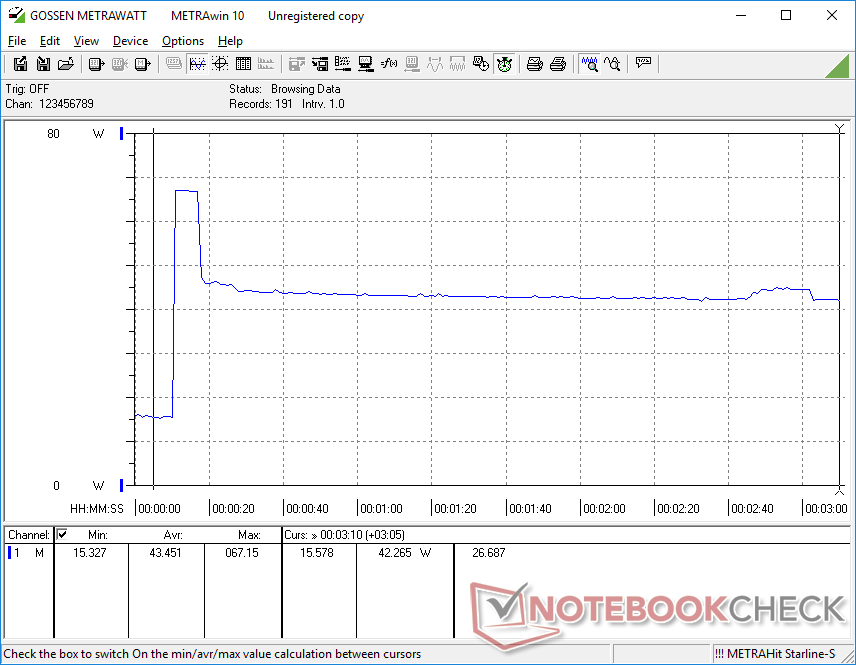
Lorsqu'il est soumis à Prime95, les fréquences d'horloge et la consommation d'énergie du boîtier de la carte CPU atteignent respectivement 3,2 GHz et 64 W, pendant quelques secondes seulement, jusqu'à ce que la température du cœur atteigne 91 C. Ensuite, le CPU chute à 2,2 GHz et 38 W avant de se stabiliser à environ 1,6 GHz, 23 W et 66 C. Le déclin régulier des performances au fil du temps correspond aux résultats de notre test en boucle CineBench R15 xT mentionné ci-dessus. L'exécution de ce même test sur le MSI Summit E14 Flip Evo avec le même processeur montre des fréquences d'horloge stables légèrement plus élevées et une consommation d'énergie du processeur de 1,9 GHz et 28 W, respectivement, bien qu'avec une température du cœur plus élevée de 82 C.
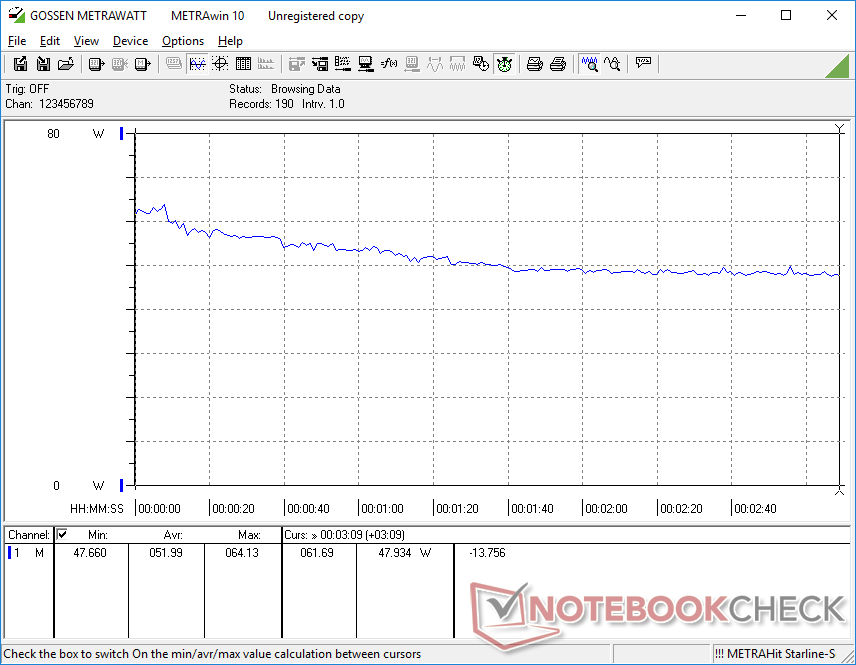
Les fréquences d'horloge et la température du GPU se stabilisent à 998 MHz et 67 C, respectivement, lorsqu'il fonctionne en mode Extreme Performance Witcher 3 en mode Extreme Performance. En répétant ce même test en mode Intelligent Cooling, les fréquences d'horloge du CPU et du GPU sont légèrement inférieures et la température centrale est plus basse, comme le montre le tableau ci-dessous. L'exécution de ce même test sur l'ordinateur Dell Inspiron 16 7620 2-en-1 entraînerait des fréquences d'horloge du GPU plus élevées et une température de 1296 MHz et 82 °C, respectivement. Les températures centrales comparativement plus basses du Lenovo peuvent être responsables des températures de surface plus basses mentionnées ci-dessus.
Le fonctionnement sur batterie ne limite pas les performances. Un test 3DMark 11 sur batterie donne essentiellement les mêmes résultats en physique et en graphique que sur secteur.
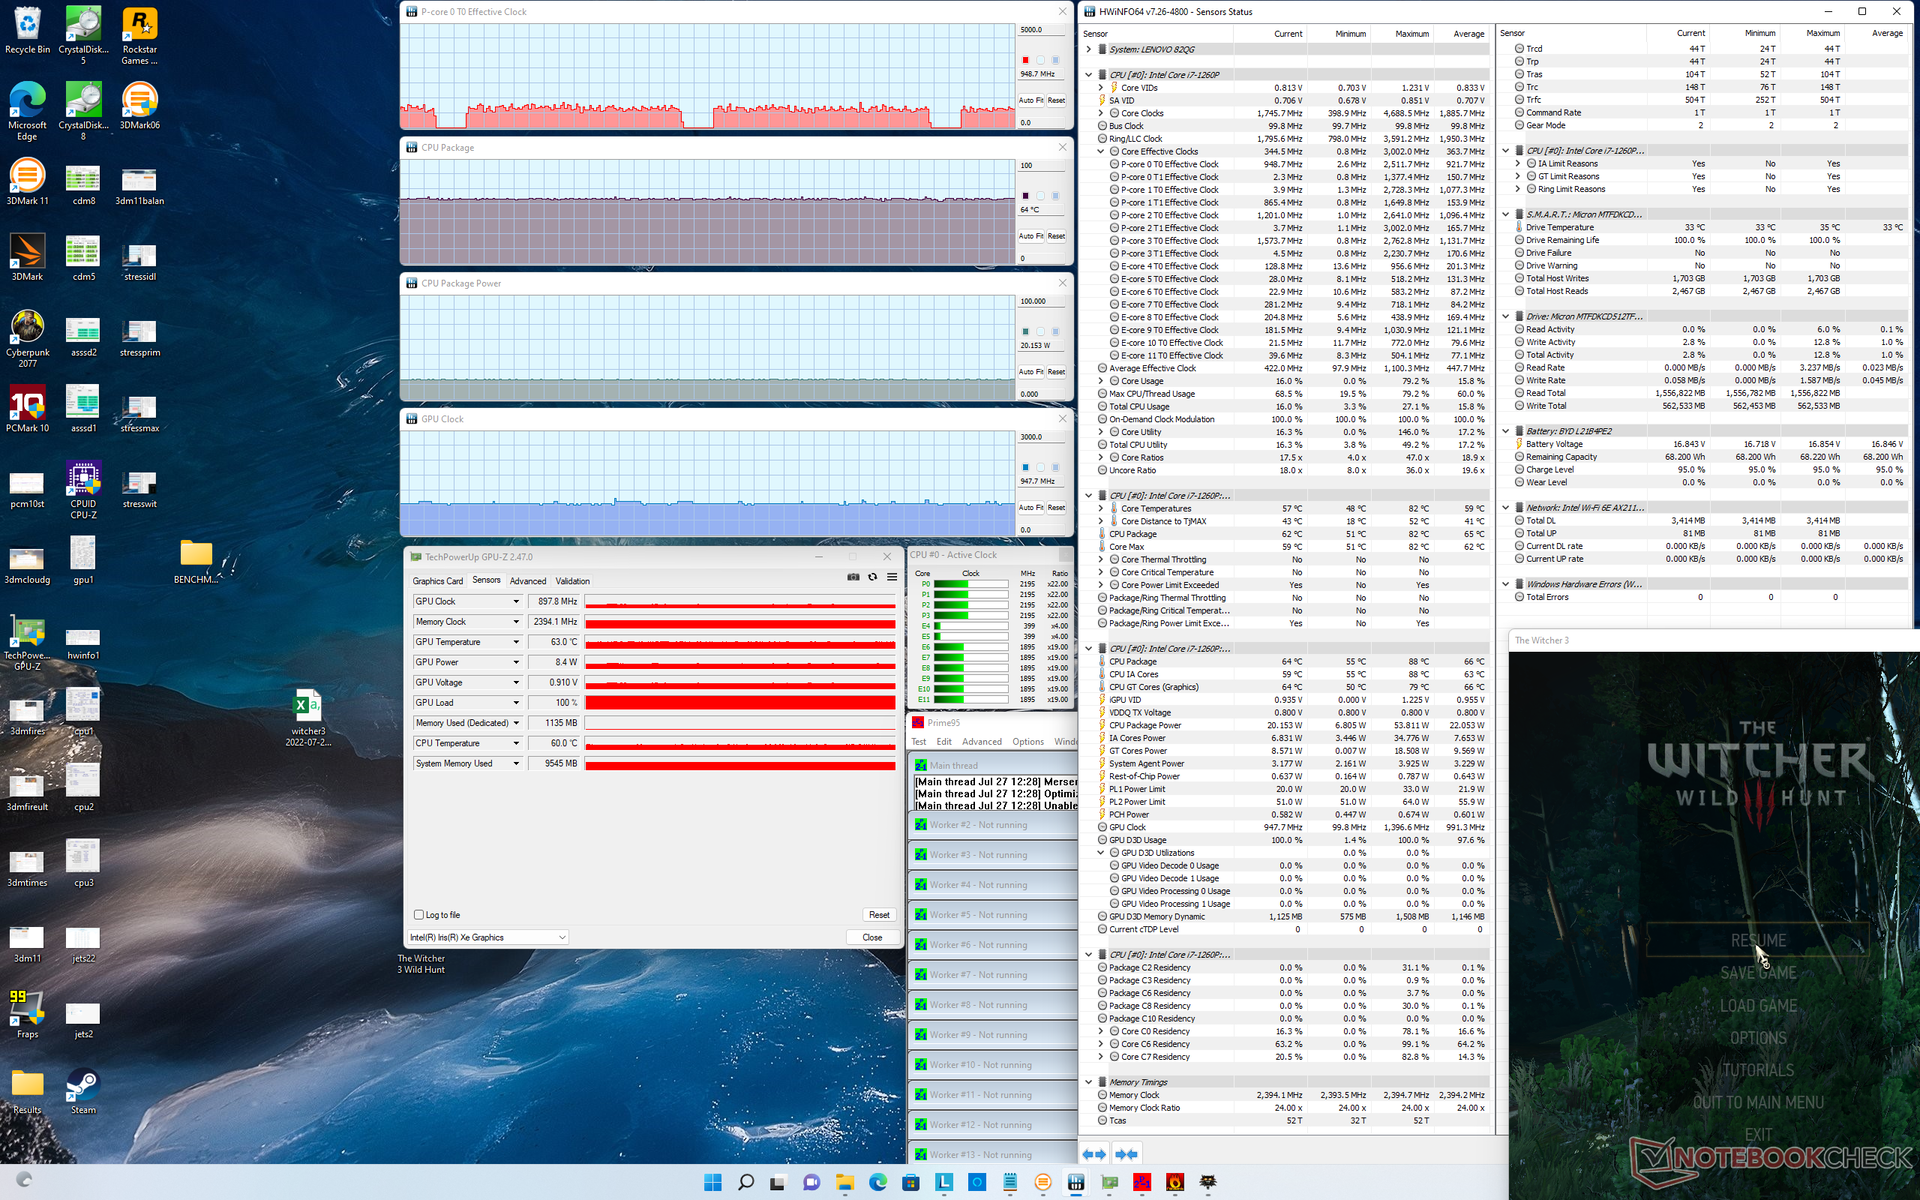
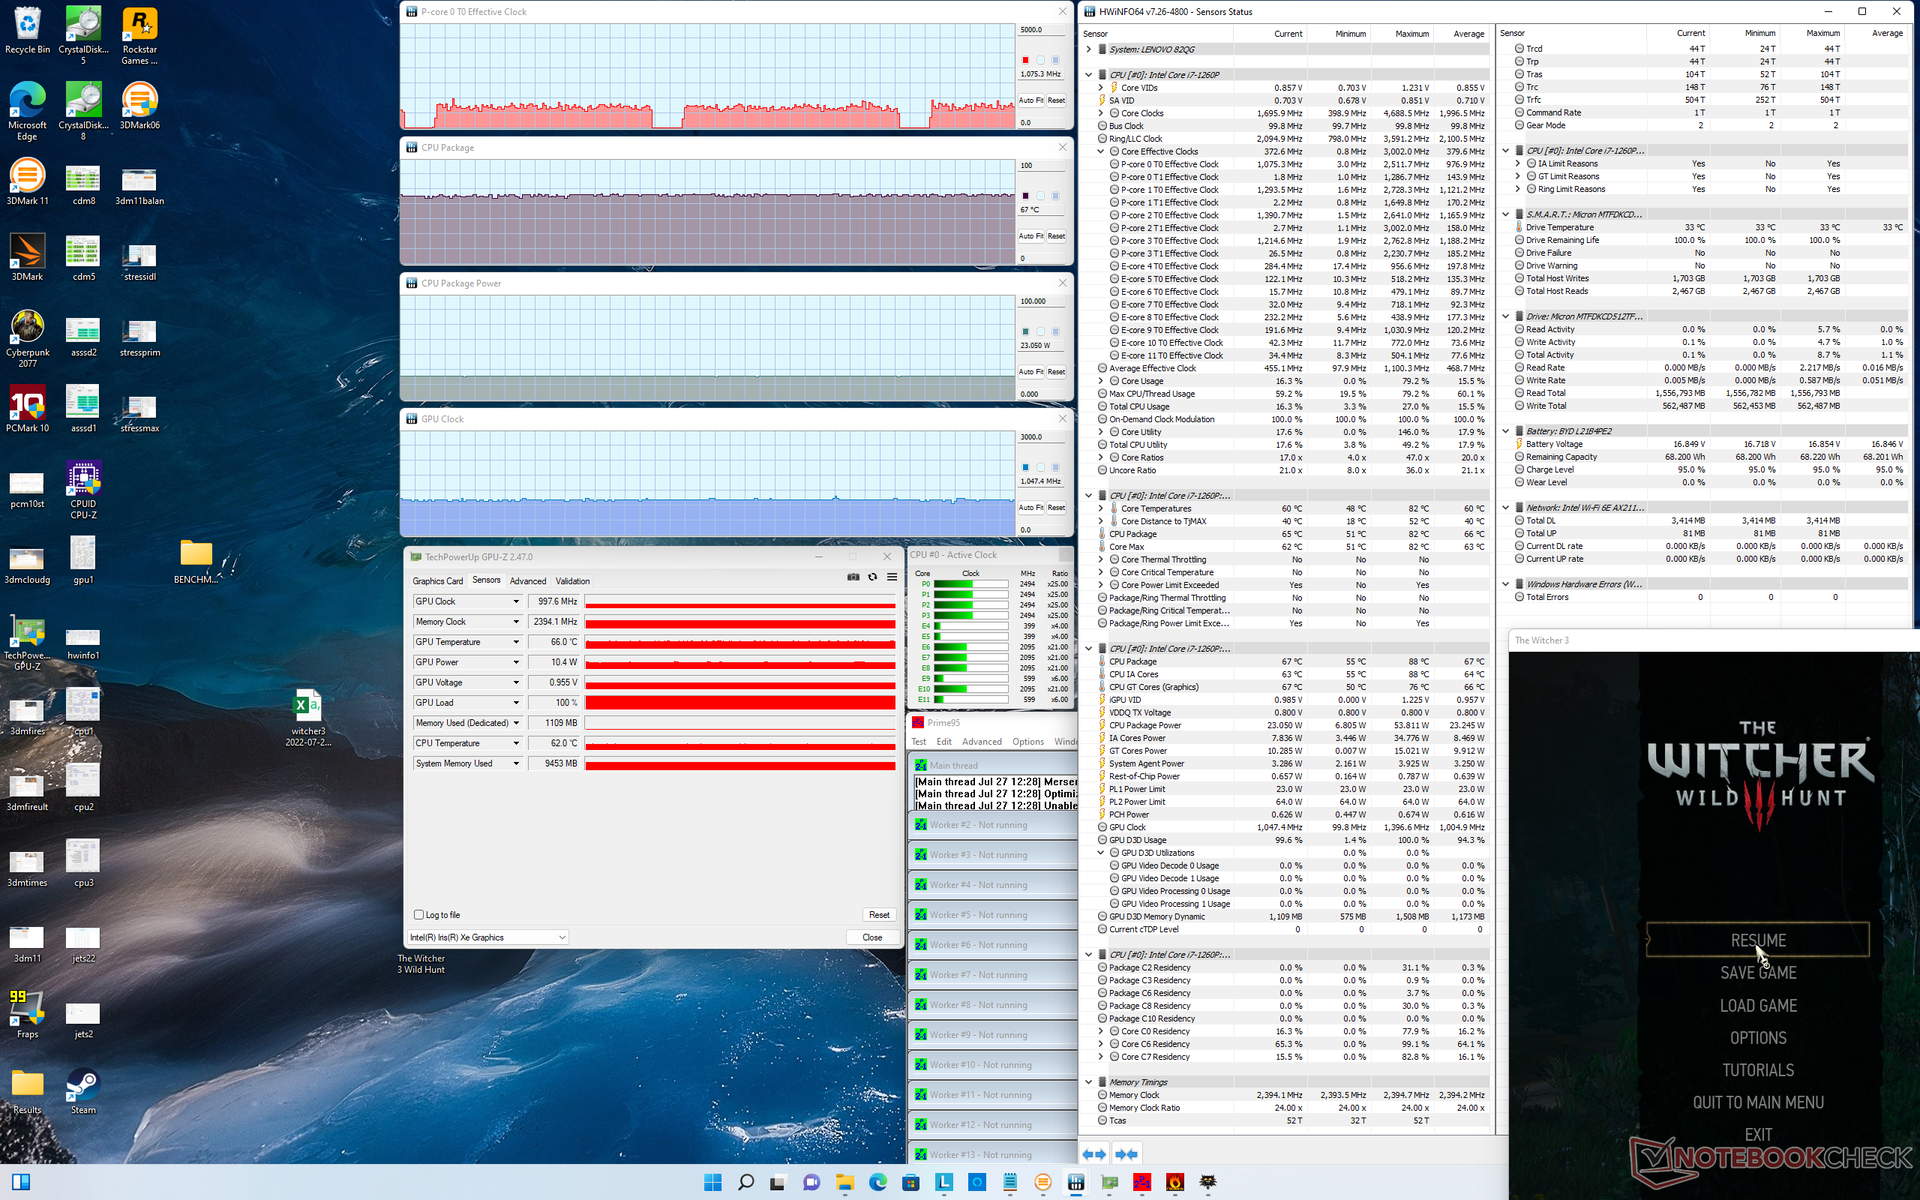
| Fréquence du CPU (GHz) | Fréquence du GPU (MHz) | Température moyenne du CPU (°C) | |
| Système au repos | -- | -- | 42 |
| Prime95 Stress | 1.6 | -- | 66 |
| Prime95 + FurMark Stress | 1.4 | 100 | 67 |
| Witcher 3 Stress (mode Refroidissement Intelligent) | 0.95 | 898 | 64 |
| Witcher 3 Stress (mode Performance Extrême) | 1.1 | 998 | 67 |
Haut-parleurs
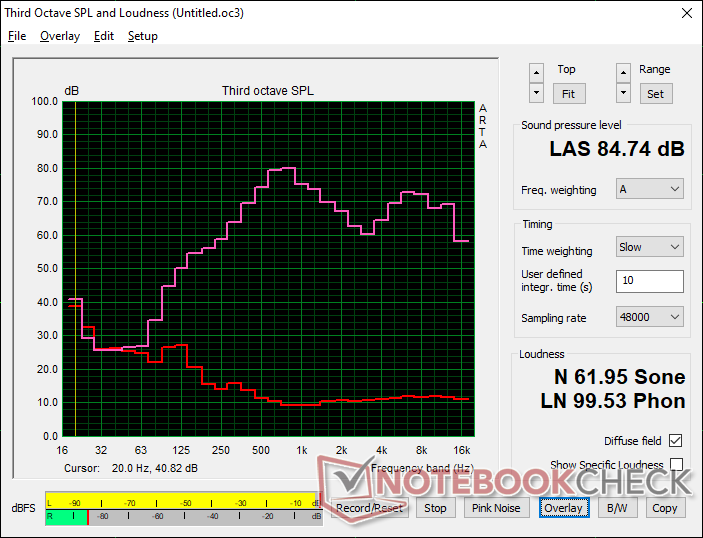
Lenovo Yoga 7 16IAP7 analyse audio
(+) | les haut-parleurs peuvent jouer relativement fort (84.7# dB)
Bass 100 - 315 Hz
(±) | basse réduite - en moyenne 13.4% inférieure à la médiane
(±) | la linéarité des basses est moyenne (8.6% delta à la fréquence précédente)
Mids 400 - 2000 Hz
(±) | médiane supérieure - en moyenne 5.7% supérieure à la médiane
(+) | les médiums sont linéaires (6.4% delta à la fréquence précédente)
Aiguës 2 - 16 kHz
(+) | des sommets équilibrés - à seulement 3.9% de la médiane
(+) | les aigus sont linéaires (6% delta à la fréquence précédente)
Overall 100 - 16.000 Hz
(+) | le son global est linéaire (13.2% différence à la médiane)
Par rapport à la même classe
» 14% de tous les appareils testés de cette catégorie étaient meilleurs, 2% similaires, 84% pires
» Le meilleur avait un delta de 6%, la moyenne était de 21%, le pire était de 57%.
Par rapport à tous les appareils testés
» 10% de tous les appareils testés étaient meilleurs, 3% similaires, 87% pires
» Le meilleur avait un delta de 4%, la moyenne était de 25%, le pire était de 134%.
Apple MacBook Pro 16 2021 M1 Pro analyse audio
(+) | les haut-parleurs peuvent jouer relativement fort (84.7# dB)
Bass 100 - 315 Hz
(+) | bonne basse - seulement 3.8% loin de la médiane
(+) | les basses sont linéaires (5.2% delta à la fréquence précédente)
Mids 400 - 2000 Hz
(+) | médiane équilibrée - seulement 1.3% de la médiane
(+) | les médiums sont linéaires (2.1% delta à la fréquence précédente)
Aiguës 2 - 16 kHz
(+) | des sommets équilibrés - à seulement 1.9% de la médiane
(+) | les aigus sont linéaires (2.7% delta à la fréquence précédente)
Overall 100 - 16.000 Hz
(+) | le son global est linéaire (4.6% différence à la médiane)
Par rapport à la même classe
» 0% de tous les appareils testés de cette catégorie étaient meilleurs, 0% similaires, 100% pires
» Le meilleur avait un delta de 5%, la moyenne était de 18%, le pire était de 45%.
Par rapport à tous les appareils testés
» 0% de tous les appareils testés étaient meilleurs, 0% similaires, 100% pires
» Le meilleur avait un delta de 4%, la moyenne était de 25%, le pire était de 134%.
Gestion de l'énergie
Consommation d'énergie - Un système 16 pouces exigeant
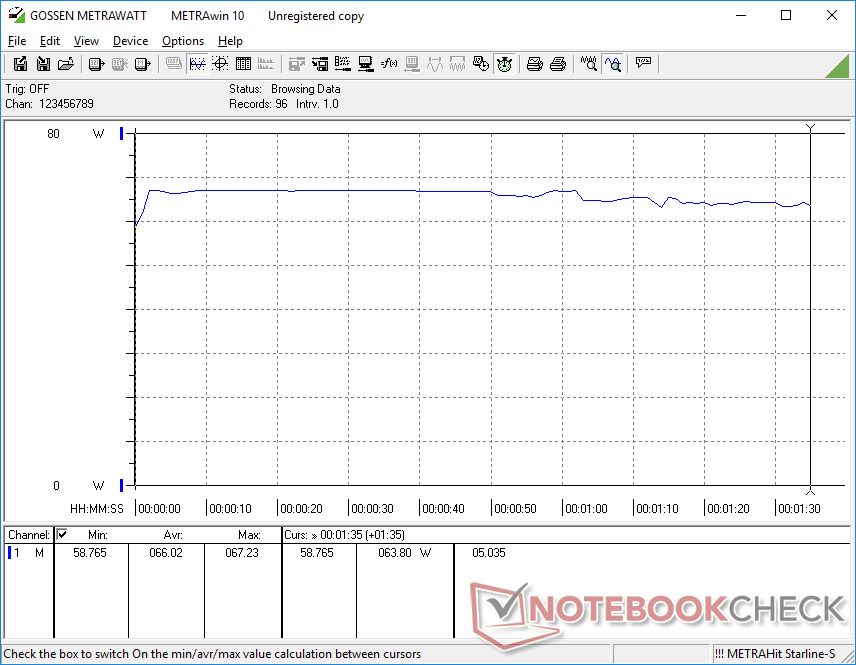
Le Lenovo demande légèrement plus d'énergie que l'Inspiron 16 7620 2-en-1 probablement en raison de la résolution native plus élevée de notre Lenovo (1600p contre 1200p) et des performances graphiques légèrement plus rapides du GPU Iris Xe intégré. La consommation est relativement élevée à environ 60 W en jeu pour être comparable à celle du plus puissantAcer Swift X plus puissant, ou deux fois celle du LG Gram 16 équipé de l'ancien Core i7-1165G7 de 11e génération.
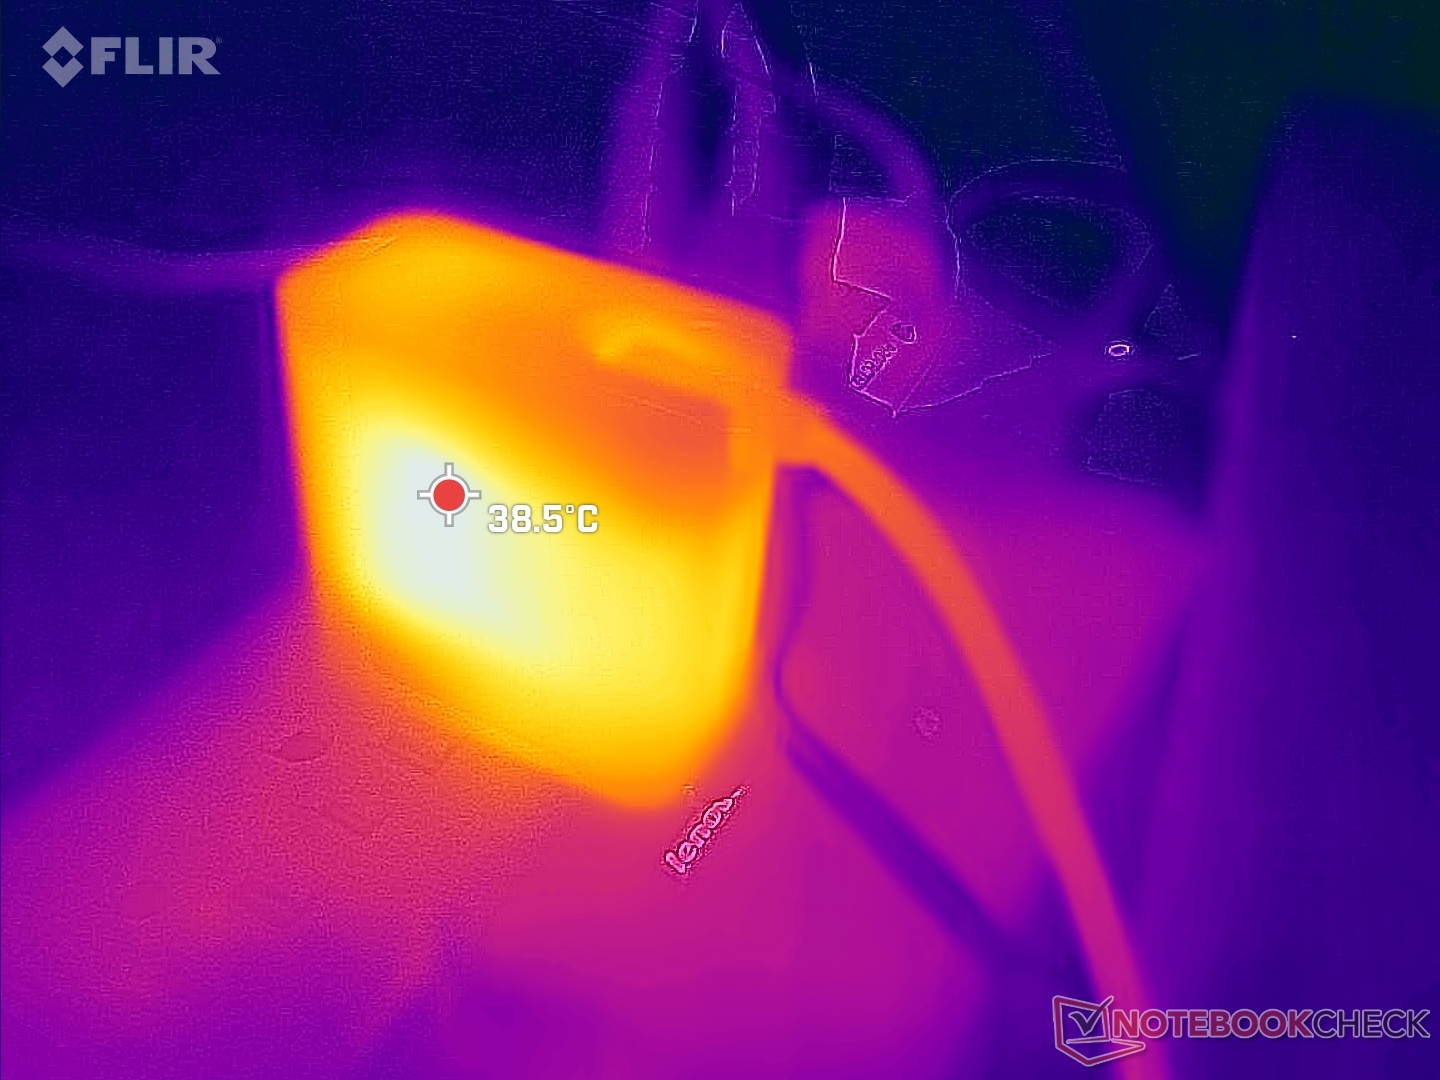
Nous sommes en mesure de mesurer un prélèvement maximal de 67 W sur le petit adaptateur secteur USB-C de 65 W (5,6 x 5,6 x 2,9 cm). Ce taux n'est que temporaire avant de chuter de pas moins de 25 W comme indiqué ci-dessous en raison du potentiel Turbo Boost limité du système.
| Éteint/en veille | |
| Au repos | |
| Fortement sollicité |
|
| Lenovo Yoga 7 16IAP7 i7-1260P, Iris Xe G7 96EUs, Micron 2450 512GB MTFDKCD512TFK, IPS, 2560x1600, 16.00 | Huawei MateBook D 16 2022 i7-12700H, Iris Xe G7 96EUs, Silicon Motion PCIe-8 SSD, IPS, 1920x1200, 16.00 | Dell Inspiron 16 7620 2-in-1 i7-1260P, Iris Xe G7 96EUs, Toshiba KBG40ZNS512G NVMe, IPS, 1920x1200, 16.00 | Acer Swift X SFX16-51G-5388 i5-11320H, GeForce RTX 3050 4GB Laptop GPU, Samsung PM991 MZVLQ512HBLU, , 1920x1080, 16.10 | LG Gram 16 (2021) i7-1165G7, Iris Xe G7 96EUs, SK Hynix PC601 1TB HFS001TD9TNG, IPS, 2560x1600, 16.00 | Lenovo IdeaPad 5 Pro 16ACH R7 5800H, GeForce GTX 1650 Mobile, Micron 2300 512GB MTFDHBA512TDV, IPS LED, 2560x1600, 16.00 | |
|---|---|---|---|---|---|---|
| Power Consumption | -9% | 9% | -23% | 20% | -35% | |
| Idle Minimum * | 6.6 | 6.1 8% | 5.3 20% | 7 -6% | 3.8 42% | 5.7 14% |
| Idle Average * | 8.3 | 10.6 -28% | 8.3 -0% | 10.1 -22% | 9 -8% | 9.3 -12% |
| Idle Maximum * | 9.8 | 11.5 -17% | 9.6 2% | 15 -53% | 11.3 -15% | 11 -12% |
| Load Average * | 66 | 65.5 1% | 54.3 18% | 63.3 4% | 35.2 47% | 83.4 -26% |
| Witcher 3 ultra * | 52 | 61.2 -18% | 43.9 16% | 63.3 -22% | 94.4 -82% | |
| Load Maximum * | 67.1 | 68.4 -2% | 70 -4% | 94 -40% | 43.5 35% | 128.7 -92% |
* ... Moindre est la valeur, meilleures sont les performances
Power Consumption Witcher 3 / Stresstest
Power Consumption external Monitor
Autonomie de la batterie
Nous sommes en mesure d'enregistrer un peu moins de 8 heures d'utilisation réelle du WLAN à partir de la batterie interne de 71 Wh, alors que l'Inspiron 16 7620 ou le LG Gram 16 peuvent tenir plusieurs heures de plus. Il est intéressant de noter que les Yoga 7 16 SKUs avec l'option Intel Arc discrète ont une batterie beaucoup plus grande de 99 Wh. une autonomie de 8 heures devrait néanmoins être gérable pour la plupart des utilisateurs.
Le chargement d'une batterie vide à sa pleine capacité prend environ 90 minutes.
| Lenovo Yoga 7 16IAP7 i7-1260P, Iris Xe G7 96EUs, 71 Wh | Huawei MateBook D 16 2022 i7-12700H, Iris Xe G7 96EUs, 60 Wh | Dell Inspiron 16 7620 2-in-1 i7-1260P, Iris Xe G7 96EUs, 87 Wh | Acer Swift X SFX16-51G-5388 i5-11320H, GeForce RTX 3050 4GB Laptop GPU, 58.7 Wh | LG Gram 16 (2021) i7-1165G7, Iris Xe G7 96EUs, 80 Wh | Lenovo IdeaPad 5 Pro 16ACH R7 5800H, GeForce GTX 1650 Mobile, 75 Wh | |
|---|---|---|---|---|---|---|
| Autonomie de la batterie | -11% | 65% | -9% | 120% | 24% | |
| Reader / Idle | 734 | 1020 39% | 1713 133% | |||
| WiFi v1.3 | 475 | 424 -11% | 876 84% | 484 2% | 943 99% | 754 59% |
| Load | 113 | 193 71% | 90 -20% | 258 128% | 101 -11% | |
| H.264 | 506 | 1204 | 623 | |||
| Gaming | 68 |
Points positifs
Points négatifs
Verdict : un cabriolet de qualité si le poids ne vous dérange pas
Les trois convertibles de 16 pouces parmi lesquels vous pouvez choisir pour le moment sont le Lenovo Yoga 7 16 Gen 7, Dell Inspiron 16 7620 2-en-1et le LG Gram 16 2-en-1. La particularité du Lenovo est qu'il offre des graphiques discrets Intel Arc A370M tandis que le Dell offre des graphiques discrets GeForce MX550. Si vos charges de travail peuvent bénéficier de la puissance graphique supplémentaire, alors le Lenovo et le Dell sont essentiellement au coude à coude. Les plus petites différences, comme la RAM (soudée ou évolutive sur le Dell) ou l'écran tactile (1600p à 400 nits contre 1200p à 300 nits ou 2400p à 400 nits sur le Dell), relèvent des préférences des utilisateurs. Il est dommage qu'aucun des deux modèles ne dispose des options d'affichage 90 Hz ou 120 Hz qui peuvent faire toute la différence en termes de réactivité et de fluidité de l'interface utilisateur.
Le Lenovo Yoga 7 16 Gen 7 est solide et doté de nombreuses fonctionnalités, notamment les graphiques Intel Arc en option. Toutefois, son poids élevé de 2 kg rend le mode tablette plus encombrant dans la plupart des situations que le LG Gram 16 2-en-1, plus léger.
Si vous pouvez vous passer de la carte graphique Iris Xe intégrée, alors une grande partie de l'attrait du Lenovo disparaît, car le LG Gram 16 2-en-1 est 28 % plus léger, tout en offrant la même résolution d'écran tactile et les mêmes 2 ports Thunderbolt 4. Il offre même des couleurs plus profondes, une meilleure autonomie, la prise en charge de deux disques SSD internes et un stylet actif inclus gratuitement. Le Lenovo est certainement plus solide, mais les économies de poids et les avantages dont bénéficie le modèle LG valent la peine d'être examinés de près si vous envisagez de choisir le Lenovo.
Prix et disponibilité
Le Lenovo Yoga 7 16IAP7 est maintenant disponible sur Best Buy avec le processeur Core i7-1260P à partir de 1430 USD. Les utilisateurs peuvent également acheter directement auprès de Lenovo où plus de SKUs sont disponibles, y compris le GPU Intel Arc A370M pour $1400.
Lenovo Yoga 7 16IAP7
-
08/03/2022 v7
Allen Ngo
Pricecompare

