 Deutsch
 English
 Español
 Français
 Italiano
 Nederlands
 Polski
 Português
 Русский
 Türkçe
 Svenska
 Chinese
 Magyar
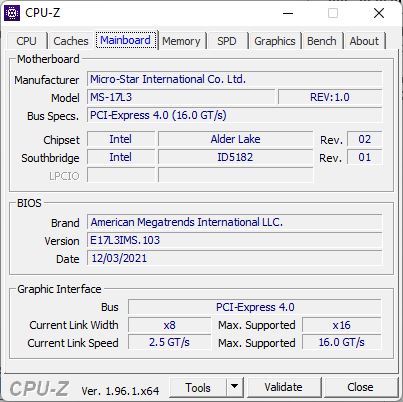
Test du MSI Katana GF76 12UGS : l'un des PC portables RTX 3070 Ti les plus abordables vaut-il le coup ?
Sur les portails de comparaison, le MSI Katana est répertorié comme l'un des ordinateurs portables de jeu les plus abordables. Le premier est le modèle 17 pouces Alder Lake à 1199 Euros (~$1249) pour la version avec une RTX 3050 Ti. Le modèle avec un RTX 3060 commence à partir de 1349 euros (~$1406), et notre configuration de test avec le RTX 3070 Ti vous coûtera 1949 euros (~$2031). Après l'Acer Nitro 5 et son petit frère de 15 pouces, notre modèle de 17 pouces est l'ordinateur portable le plus abordable avec une RTX 3070 Ti.
L'année dernière, nous avons testé le prédécesseur avec un CPU Tiger Lake et une RTX 3060aujourd'hui, il est passé à Alder Lake et aux GPU Ti.
Puisque notre base de données manque actuellement d'ordinateurs portables de 17 pouces abordables avec des GPU RTX 3070 Ti, nous comparons le nouveau Katana en plus de son prédécesseur également avec le nettement plus cher Razer Blade 17le top dog, lAorus 17 XE4et les modèles 15 et 16 pouces Lenovo Legion 5 Pro 16 G7et MSI Vector GP66 12UGSmodèles.
Comparaison avec les concurrents potentiels
Note | Date | Modèle | Poids | Épaisseur | Taille | Résolution | Meilleur prix |
|---|---|---|---|---|---|---|---|
| 82.6 % | 05/22 | MSI Katana GF76 12UGS i7-12700H, GeForce RTX 3070 Ti Laptop GPU | 2.7 kg | 25.2 mm | 17.30" | 1920x1080 | |
| 80.4 % | 06/21 | MSI Katana GF76 11UE i7-11800H, GeForce RTX 3060 Laptop GPU | 2.7 kg | 25.2 mm | 17.30" | 1920x1080 | |
| 85.2 % | 04/22 | Aorus 17 XE4 i7-12700H, GeForce RTX 3070 Ti Laptop GPU | 2.6 kg | 27 mm | 17.30" | 1920x1080 | |
| 90.1 % | 05/22 | Razer Blade 17 (i7-12800H, RTX 3070 Ti) i7-12800H, GeForce RTX 3070 Ti Laptop GPU | 2.8 kg | 19.9 mm | 17.30" | 2560x1440 | |
| 88 % | 03/22 | Lenovo Legion 5 Pro 16 G7 i7 RTX 3070Ti i7-12700H, GeForce RTX 3070 Ti Laptop GPU | 2.6 kg | 26.6 mm | 16.00" | 2560x1600 | |
| 86.9 % | 03/22 | MSI Vector GP66 12UGS i9-12900H, GeForce RTX 3070 Ti Laptop GPU | 2.3 kg | 23.4 mm | 15.60" | 1920x1080 |
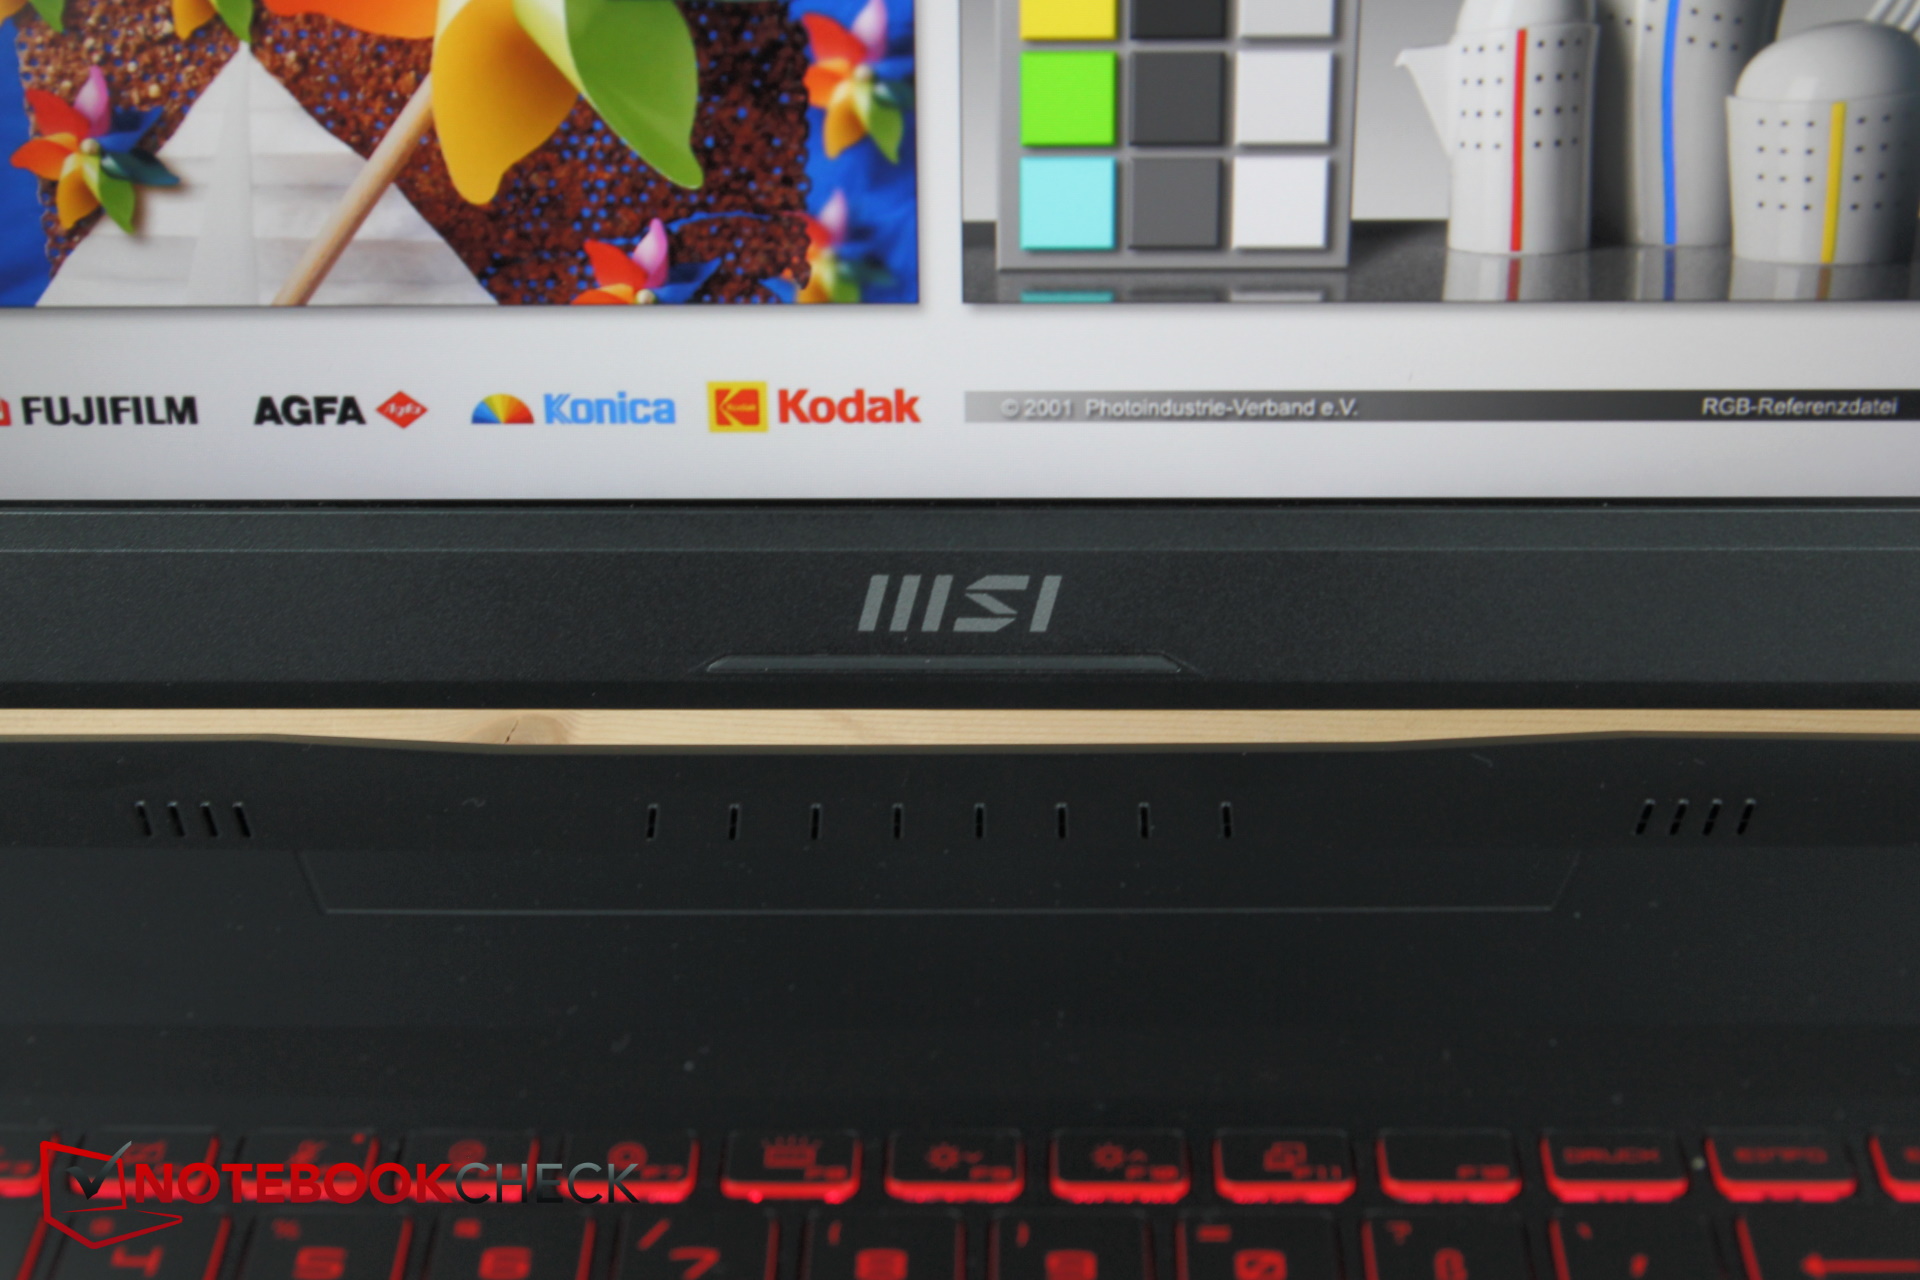
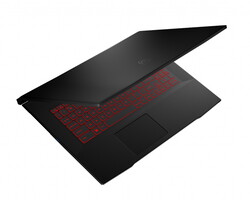
Mallette - Une épée en plastique
Les matériaux utilisés dans le boîtier du Katana sont uniquement en plastique. L'écran et son cadre produisent des grincements puissants même si on ne le déforme que légèrement, notamment dans les coins supérieurs, et on commence immédiatement à s'inquiéter pour le panneau. La base, en revanche, donne une impression de robustesse. Sinon, la fabrication semble être bonne et nous ne remarquons pas de lacunes évidentes.
Les charnières sont capables d'ouvrir l'écran jusqu'à 180 degrés. Elles ne sont que légèrement faibles dans le dernier tiers de la plage d'ouverture, mais sinon, elles maintiennent l'écran en place assez bien.
Le design reste assez simple, mis à part l'éclairage coloré du clavier et le lettrage stylisé sur les touches. Il y a une grande encoche à l'avant de la base, ce qui vous permet d'ouvrir facilement l'ordinateur portable d'une seule main.
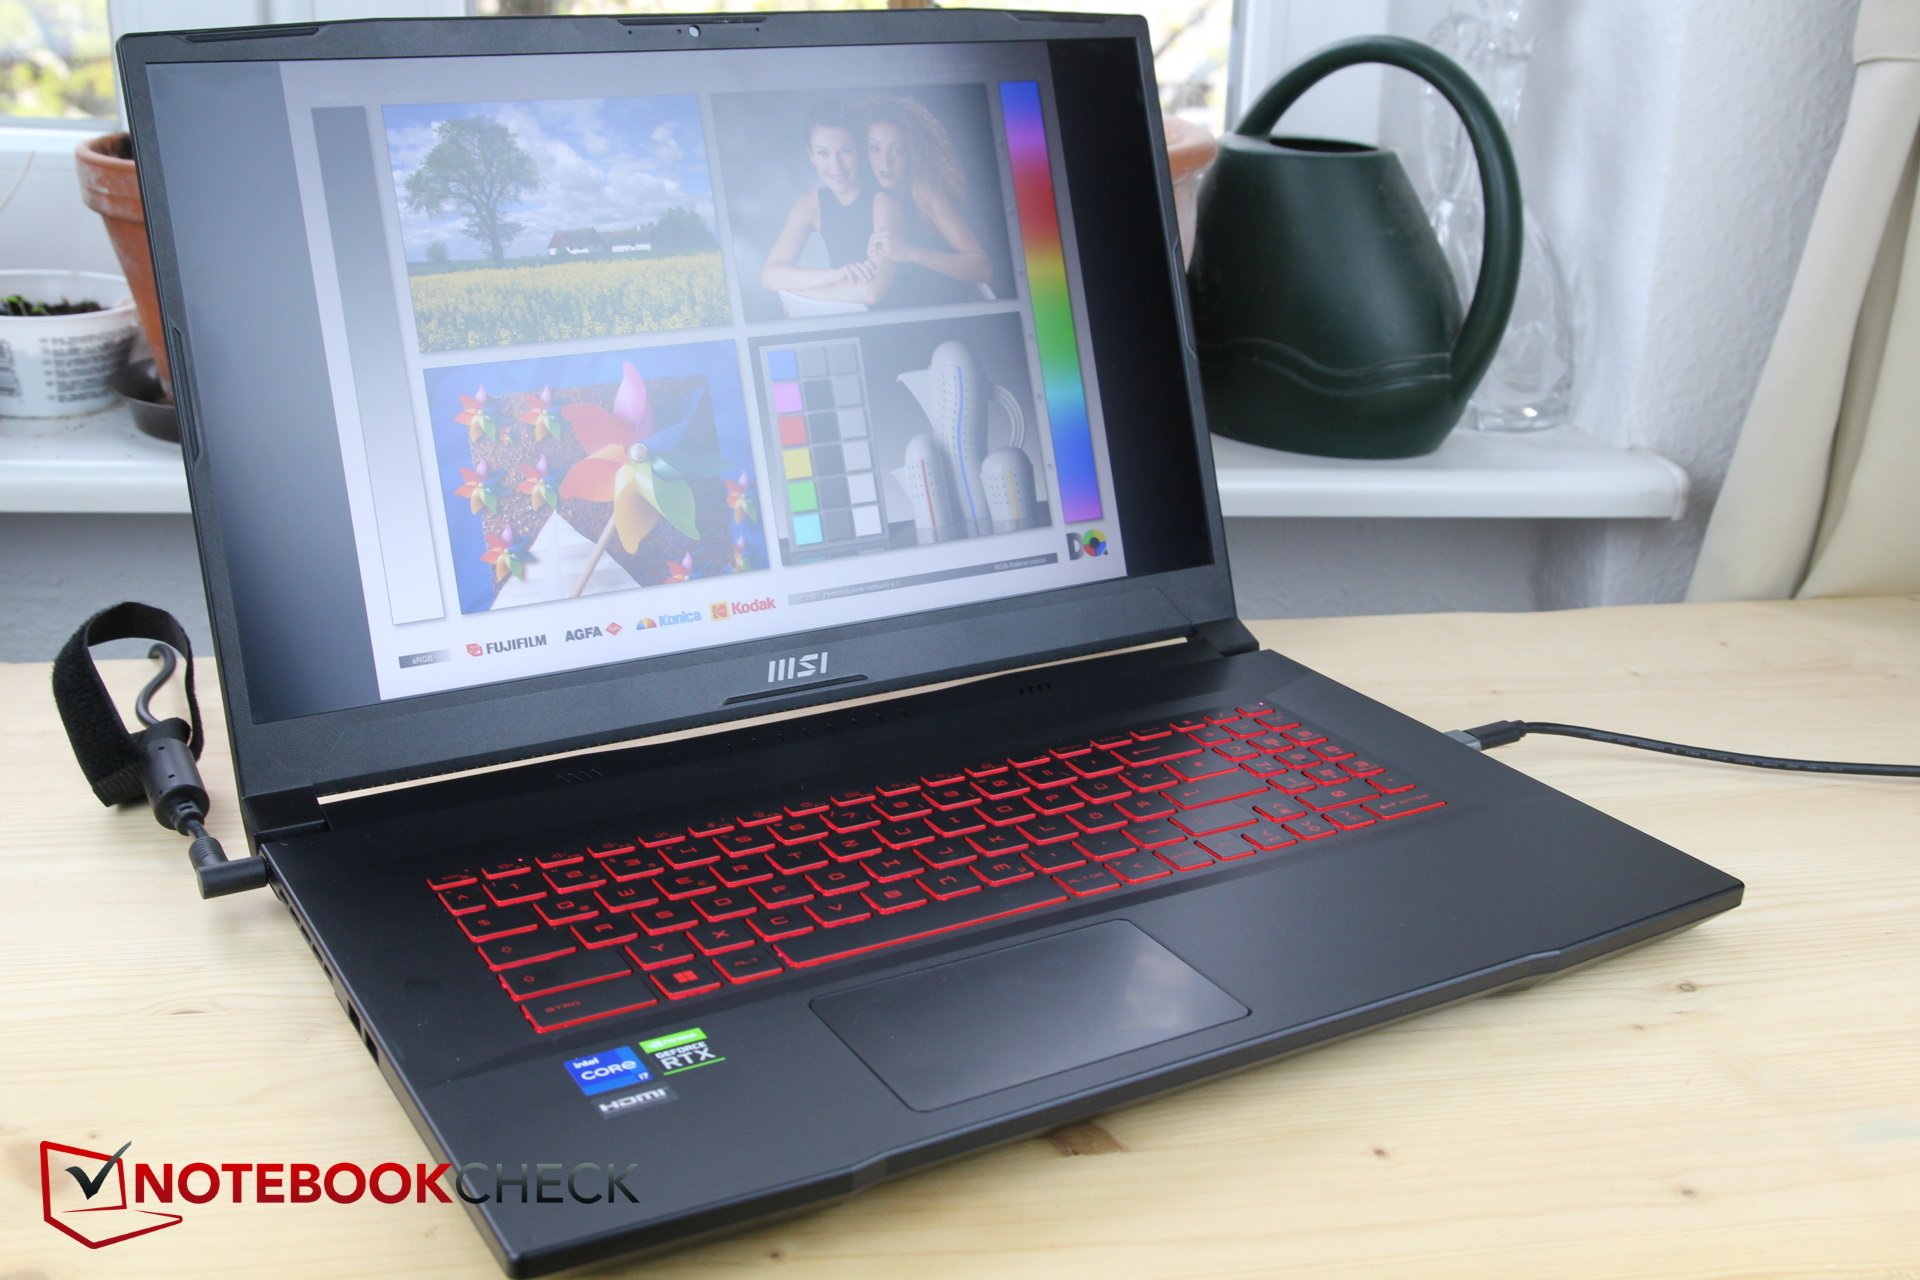
Compte tenu du matériel inclus, le Katana est assez compact, et le boîtier en plastique le fait paraître plus léger que le Blade 17, même si la différence n'est que d'environ 100 g (~3,5 oz). Bien que l Aorus est un peu plus épais, il est presque 20 mm (~0,8 in) moins profond. Le siteBlade 17 est plus fin et également plus petit dans l'ensemble. Bien que le Katana soit plutôt l'un des ordinateurs portables de jeu les plus grands, il ne s'est pas avéré trop épais pour autant.
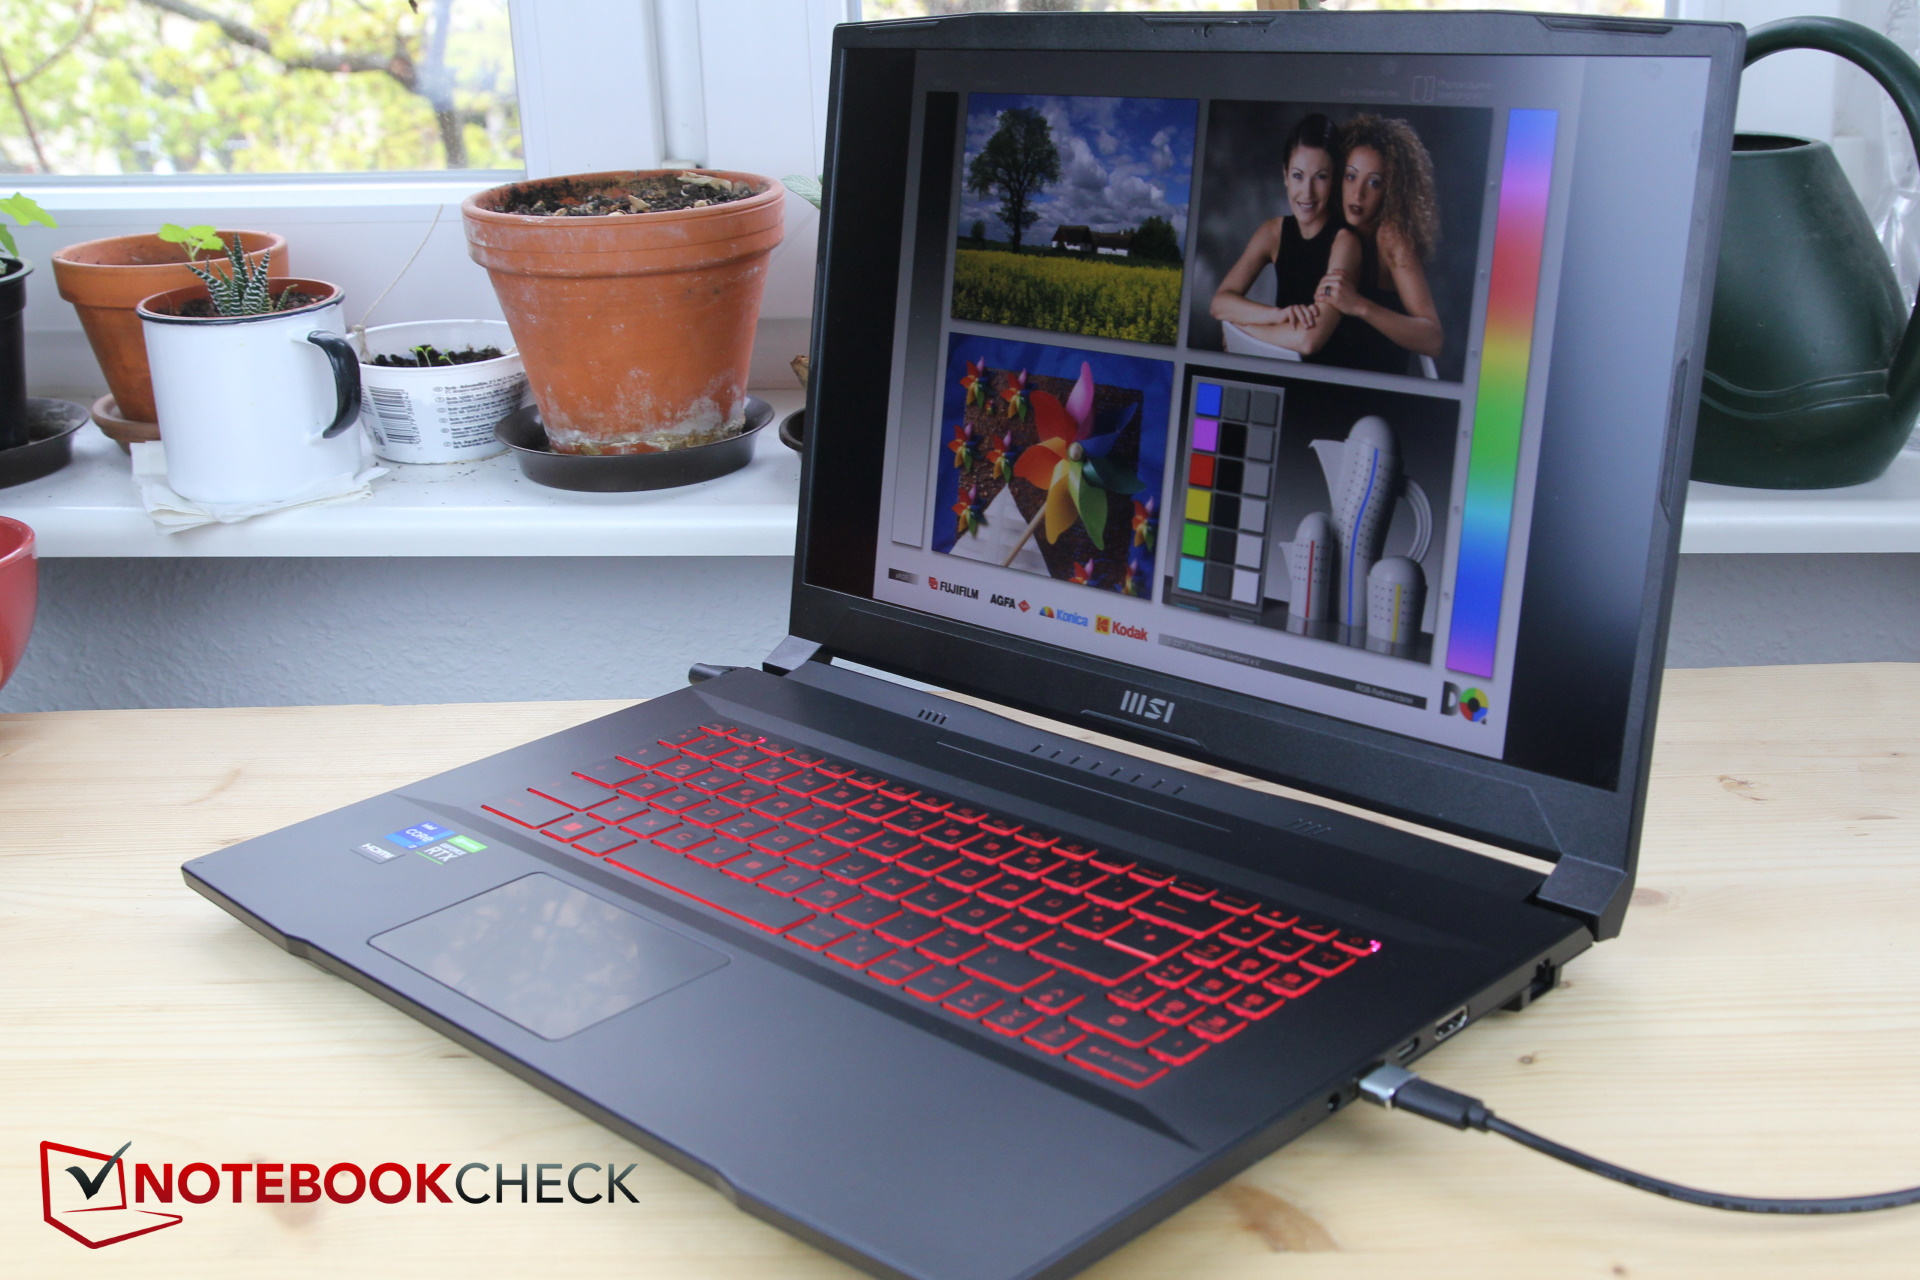
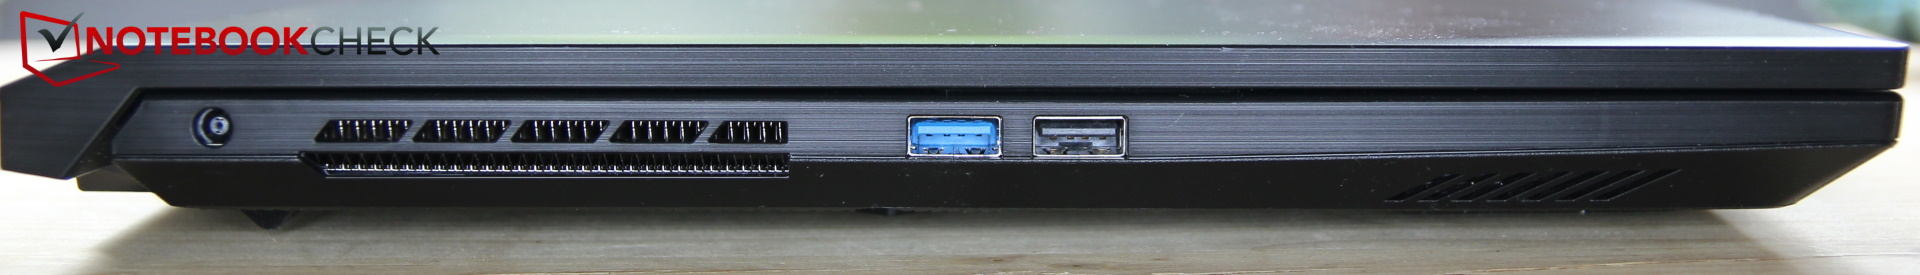
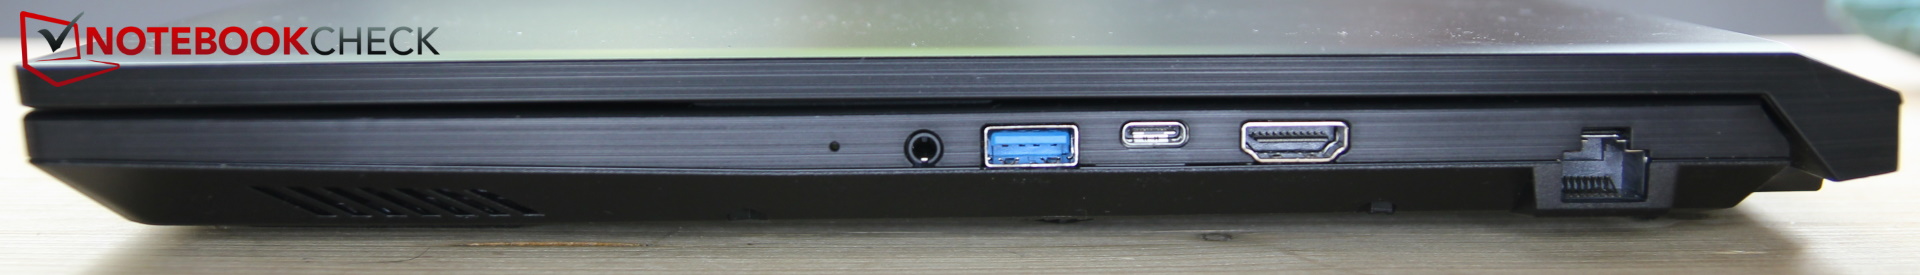
Équipement - Veuillez mettre à jour
Même en 2022, MSI continue à équiper le Katana d'un port USB-A 2.0, et il continue également à renoncer à Thunderbolt et à un lecteur de carte SD. Le port USB-C ne fonctionne qu'à la vitesse de l'USB-3.0 et, bien sûr, ne propose pas de Power Delivery.
La fiche d'alimentation ne s'adapte pas très bien à notre modèle et peut également glisser lentement lors du déplacement de l'ordinateur portable. L'ajustement de certains périphériques USB-C n'est pas optimal dans le port correspondant.
Le boîtier M.2 externe connecté en USB-C de l'auteur a quelques problèmes avec plusieurs ordinateurs portables comme le MSI Katana ou aussi le MSI Pulse GL66 mais fonctionne bien avec d'autres ordinateurs portables. Apparemment, certaines fiches ne peuvent pas être insérées assez profondément dans les ports, ce qui fait que le SSD est alimenté mais n'est pas reconnu de manière fiable par Windows et se déconnecte continuellement. L'auteur a dû utiliser un adaptateur USB-C vers A et faire fonctionner le SSD via un port USB-A.
Le fait que les ports pour les câbles potentiellement épais et rigides tels que HDMI et LAN se trouvent sur le côté droit, où une souris pourrait également être utilisée, n'est pas non plus optimal.
Communication
Un module Intel Wi-Fi 6 AX201 est utilisé pour la communication WLAN. En combinaison avec notre routeur de test Asus ROG GT-AXE11000, le module atteint des taux de transfert convenablement bons, et la connexion est également assez stable.
Webcam
En guise de webcam, une caméra standard 720p est utilisée. Si la qualité de l'image ne contribue pas à transformer l'utilisateur en star de YouTube, les écarts de couleur restent tout de même dans les limites.


Accessoires et garantie
Compte tenu du faible prix, le manque d'accessoires inclus ne devrait pas être surprenant. Comme d'habitude avec MSI, la période de garantie est de deux ans.
Maintenance
Le fond du boîtier est fixé par 13 vis. Comme la dernière est placée sous un sceau autocollant, nous ne voulons pas la casser parce que notre unité de test est un prêt. Malheureusement, MSI continue d'utiliser des scellés autocollants et se réserve donc la possibilité de limiter la garantie après une ouverture inappropriée de l'appareil par des utilisateurs non qualifiés.
Cependant, il ne devrait pas y avoir trop de changements par rapport au prédécesseur, et vous pouvez trouver une image du Katana ouvert dans le revue du prédécesseur.
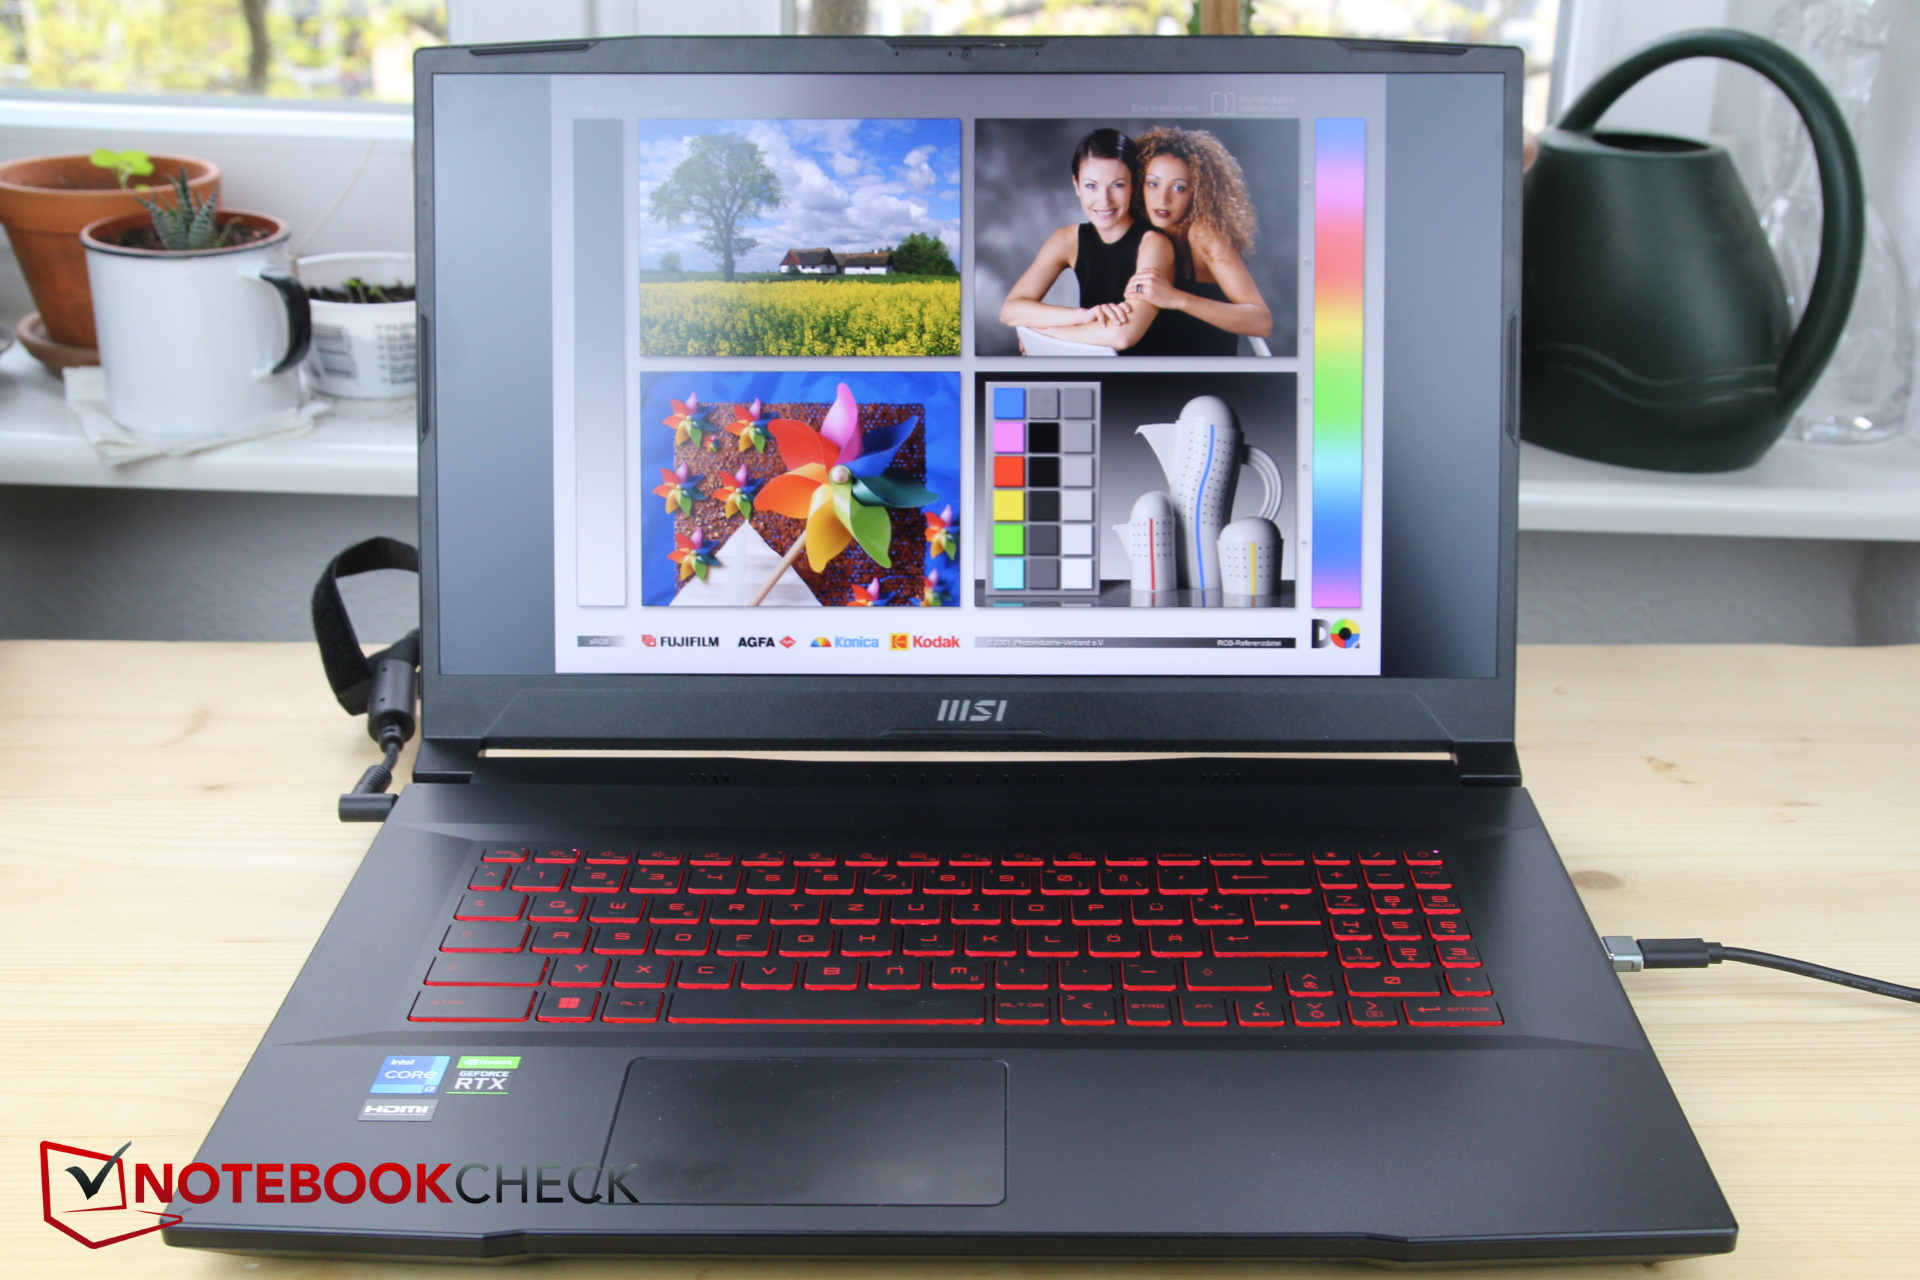
Périphériques d'entrée - Pourquoi tout est si petit malgré les 17 pouces ?
Clavier
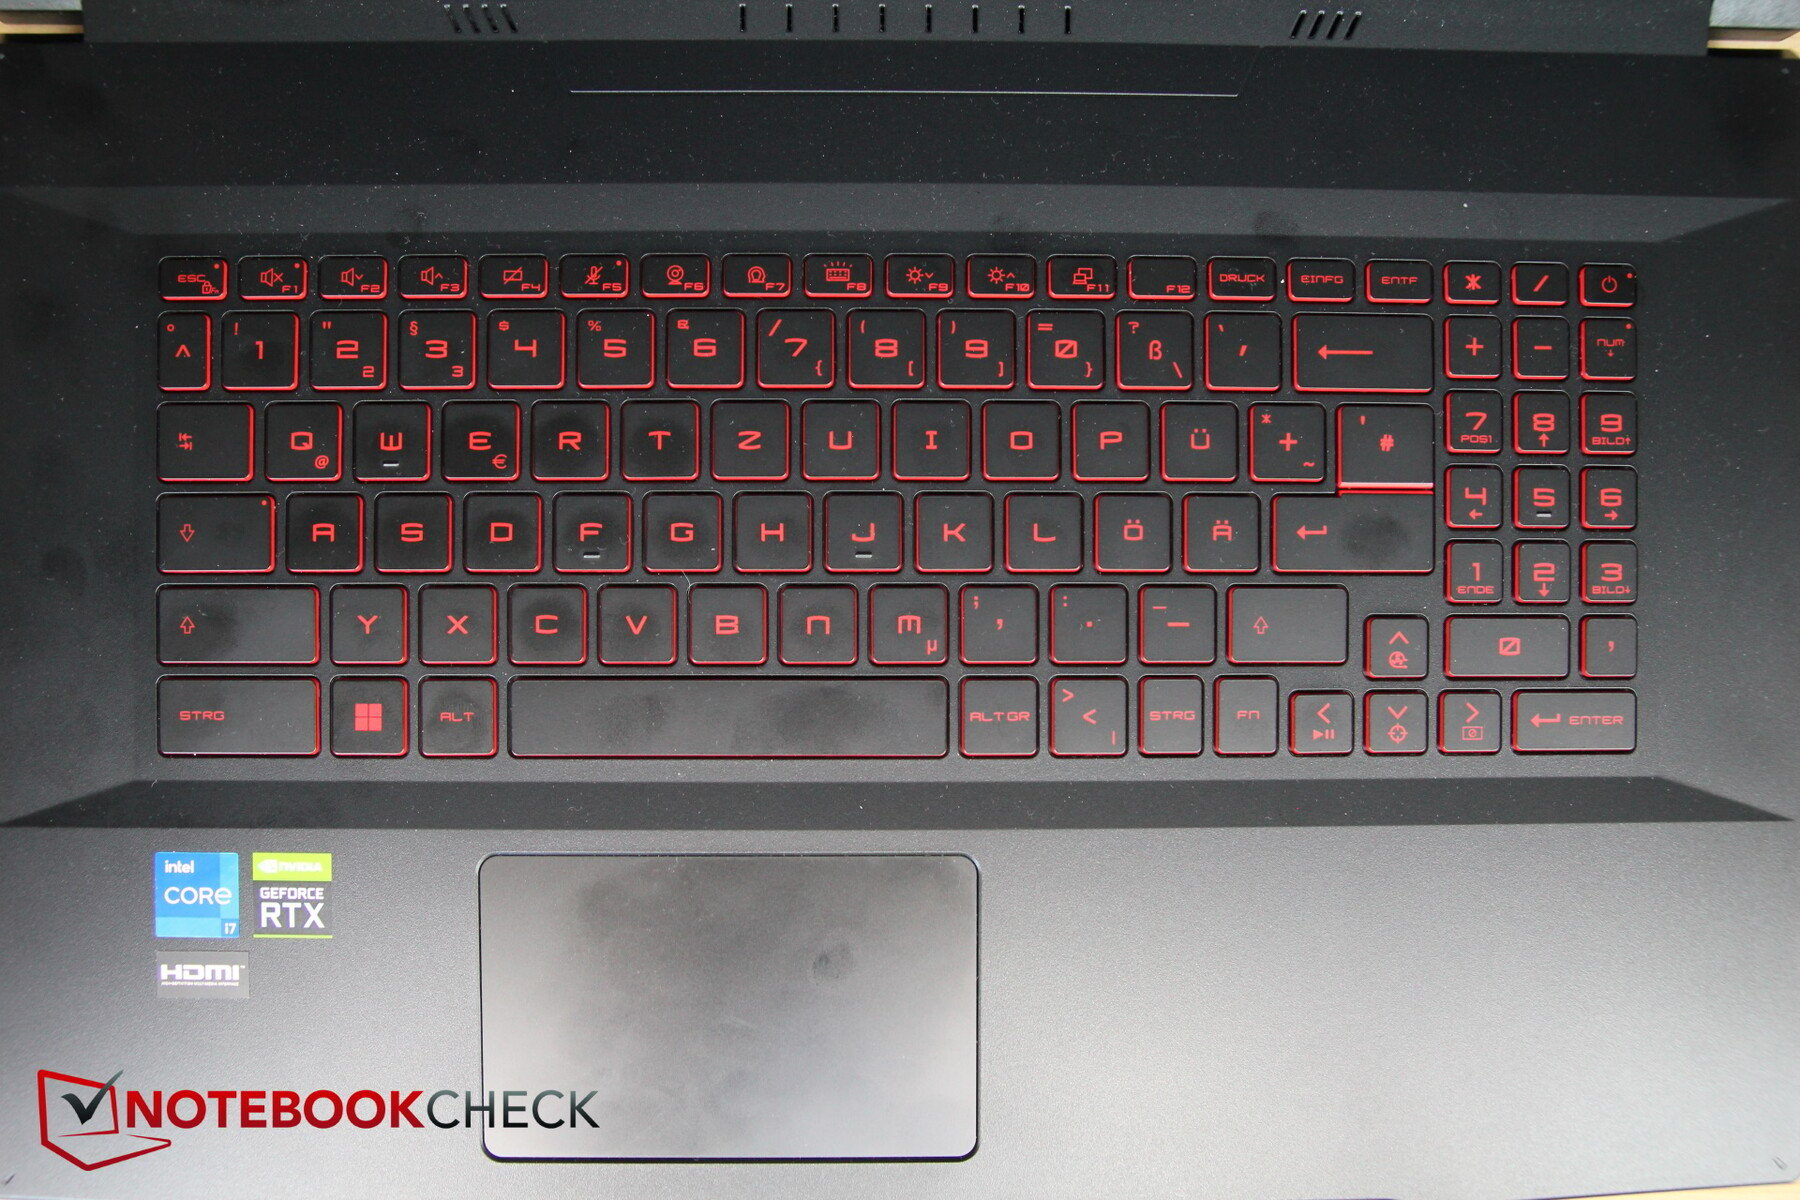
Pour un portable de 17 pouces, les touches s'avèrent plutôt petites, et serré sur le côté droit de la base est également un numpad avec des touches incroyablement minuscules. Bien qu'il y ait encore suffisamment d'espace sur les côtés gauche et droit du clavier, MSI ne l'utilise pas pour augmenter la taille des touches. Dans la rangée supérieure des touches de fonction, les touches sont deux fois moins hautes. Le bouton d'alimentation est placé comme une touche normale dans le coin supérieur droit du pavé numérique.
Comme d'habitude chez MSI, la touche Fn est placée sur le côté droit, mais vous pouvez changer sa fonction avec la touche Windows sur la gauche.
La course des touches est relativement courte, mais le retour d'information est perceptible. Cependant, les touches restent légèrement spongieuses, et l'utilisateur a l'impression que les touches ne sont vraiment fixées qu'au milieu et peuvent facilement basculer vers les côtés. En revanche, les tâches de frappe réussissent toujours assez rapidement et facilement. Le bruit de la frappe est modéré
Les lettres des touches sont facilement visibles, mais leur police est un peu inhabituelle, ce qui est probablement censé attirer les joueurs. Dans un environnement sombre, l'éclairage du clavier est utile. Bien qu'il n'y ait qu'une seule zone, la lumière peut être atténuée en trois étapes. Le clavier n'est éclairé qu'en rouge.
Pavé tactile
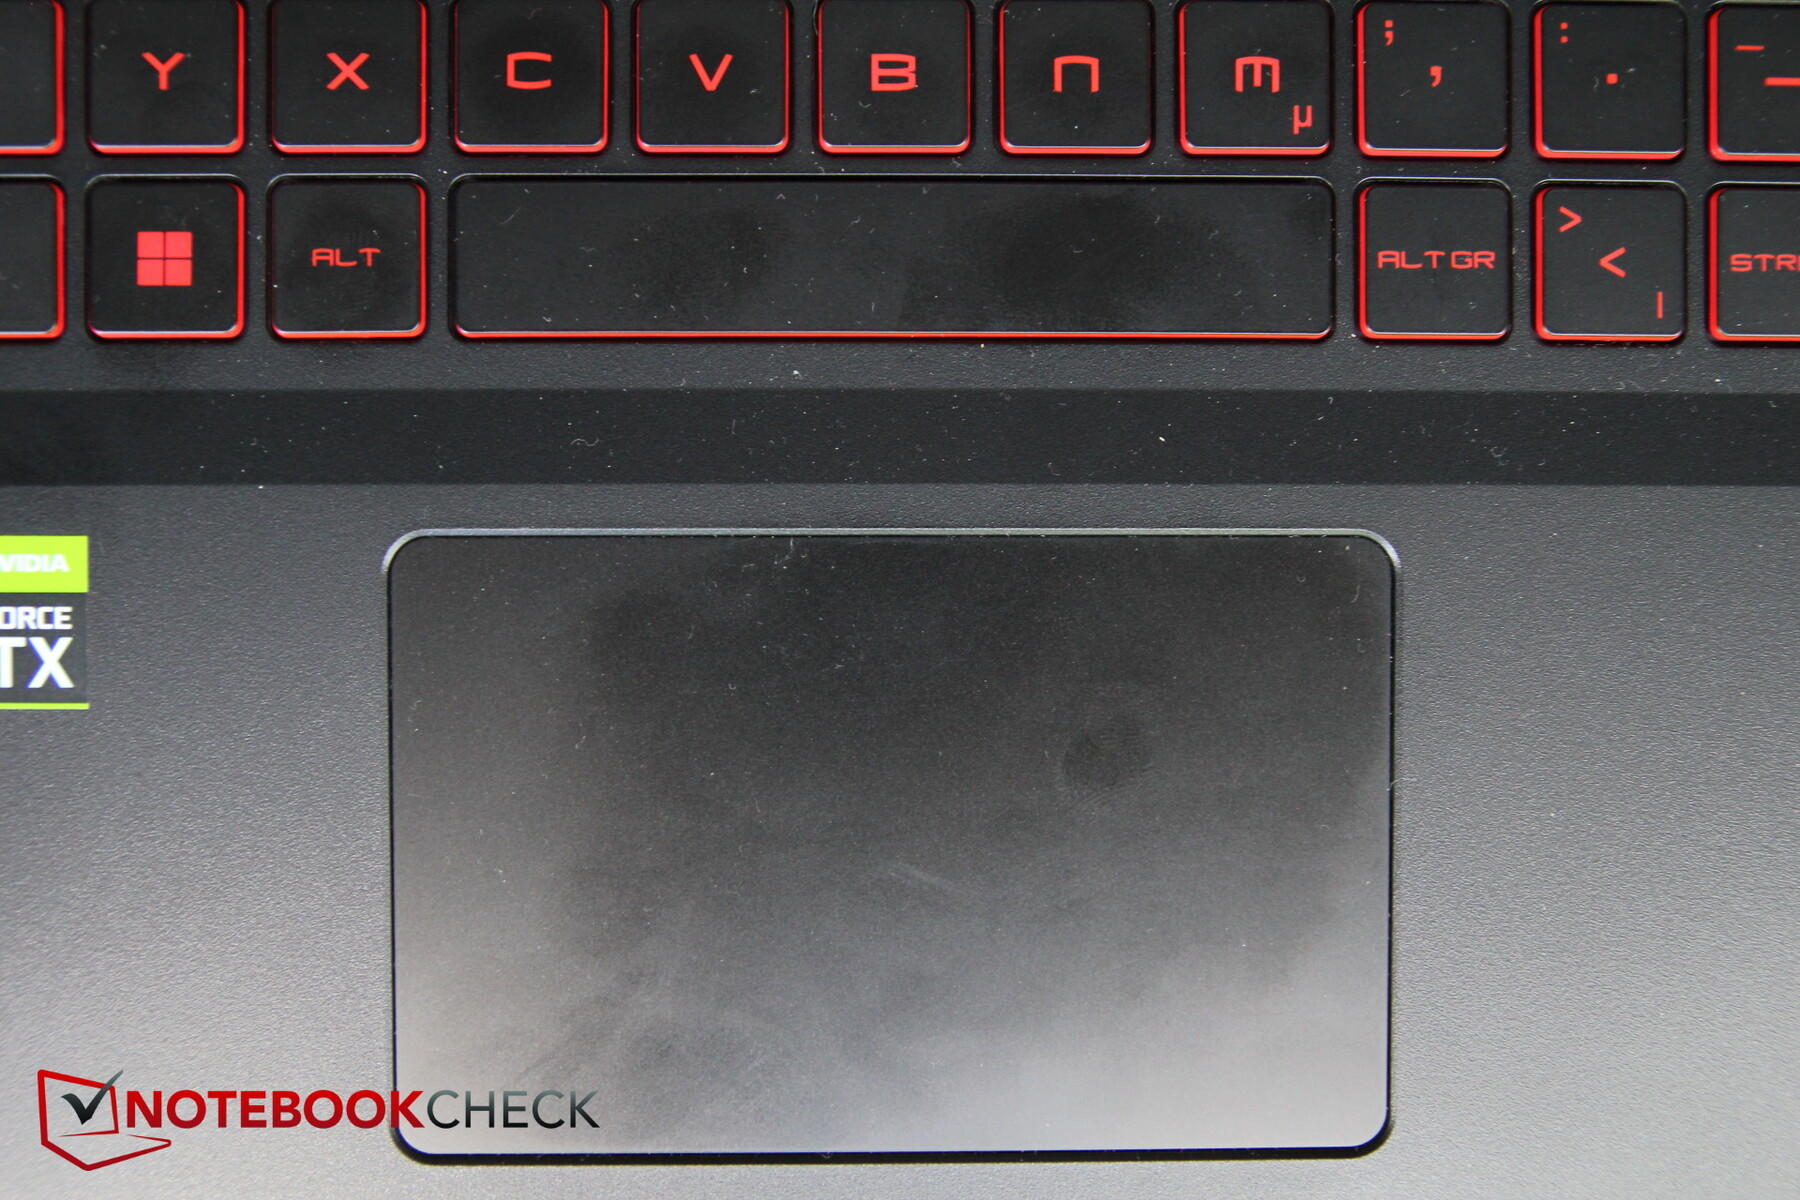
Le pavé tactile est suffisant mais pas très grand pour un appareil de 17 pouces (~10,5 x 6,5 cm, ~4,1 x 2,6 in). La surface facilite le glissement des doigts, et ceux-ci ne se coincent que lors de mouvements très lents ou si les doigts sont mouillés.
Les touches intégrées fonctionnent également de manière assez précise, mais elles ont une course extrêmement courte et semblent très nettes. Les bruits de la gâchette ne sont pas vraiment silencieux.
Affichage - 144 Hz mais pas encore un joueur
MSI a décidé d'utiliser le même écran Full-HD d'AU Optronics que sur son prédécesseur. Même si celui-ci peut supporter 144 Hz, avec une moyenne de 264 nits, la luminosité n'est pas très élevée. Les temps de réponse sont vraiment faibles pour un gamer, notamment les plus de 40 ms de gris à gris. À 88 %, la répartition de la luminosité reste relativement homogène.
Au moins, l'écran a une valeur de noir assez basse, ce qui conduit à un bon contraste.
| |||||||||||||||||||||||||
Homogénéité de la luminosité: 88 %
Valeur mesurée au centre, sur batterie: 283 cd/m²
Contraste: 1405:1 (Valeurs des noirs: 0.2 cd/m²)
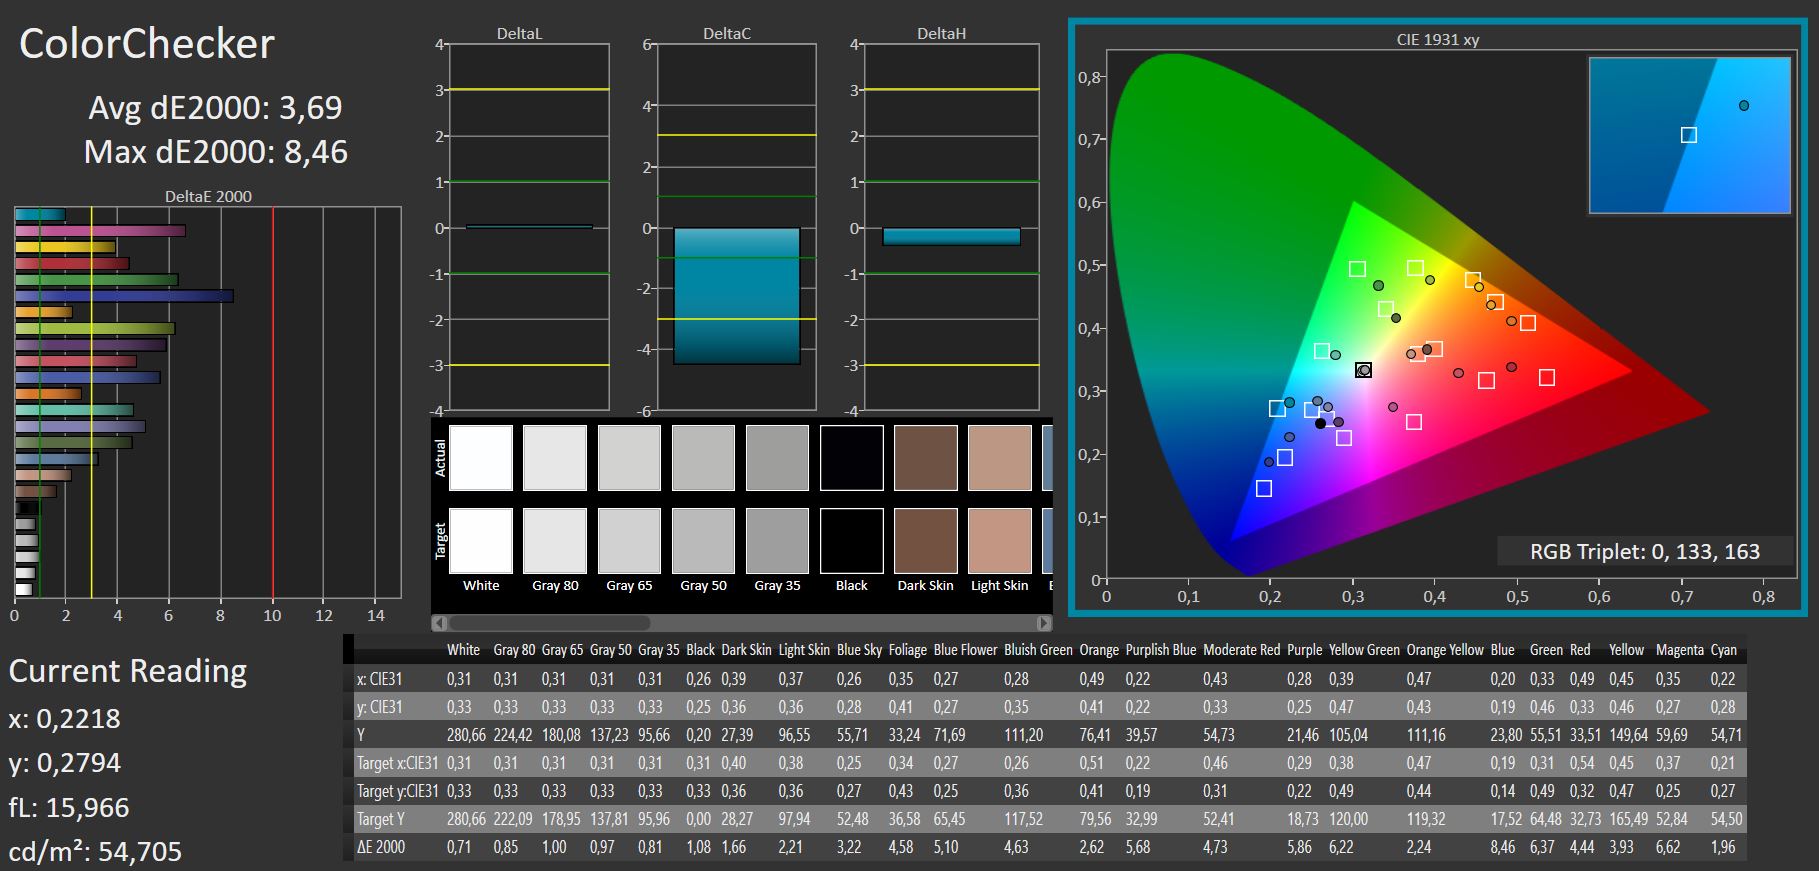
ΔE Color 3.69 | 0.5-29.43 Ø5, calibrated: 3.61
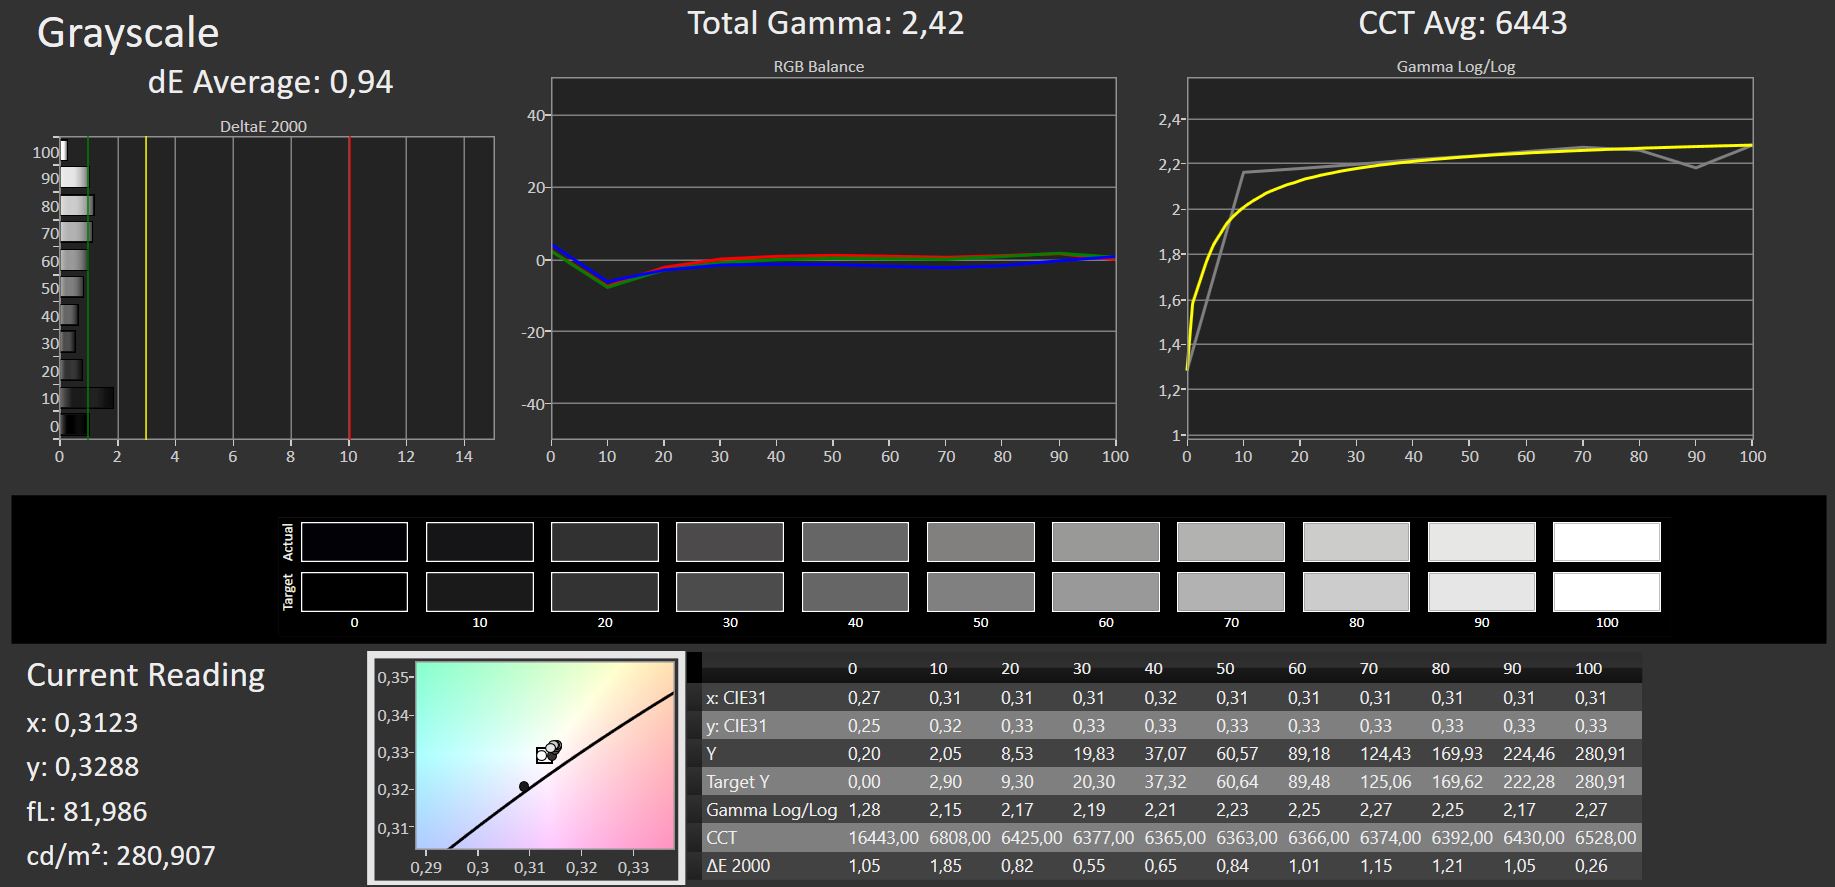
ΔE Greyscale 0.94 | 0.57-98 Ø5.3
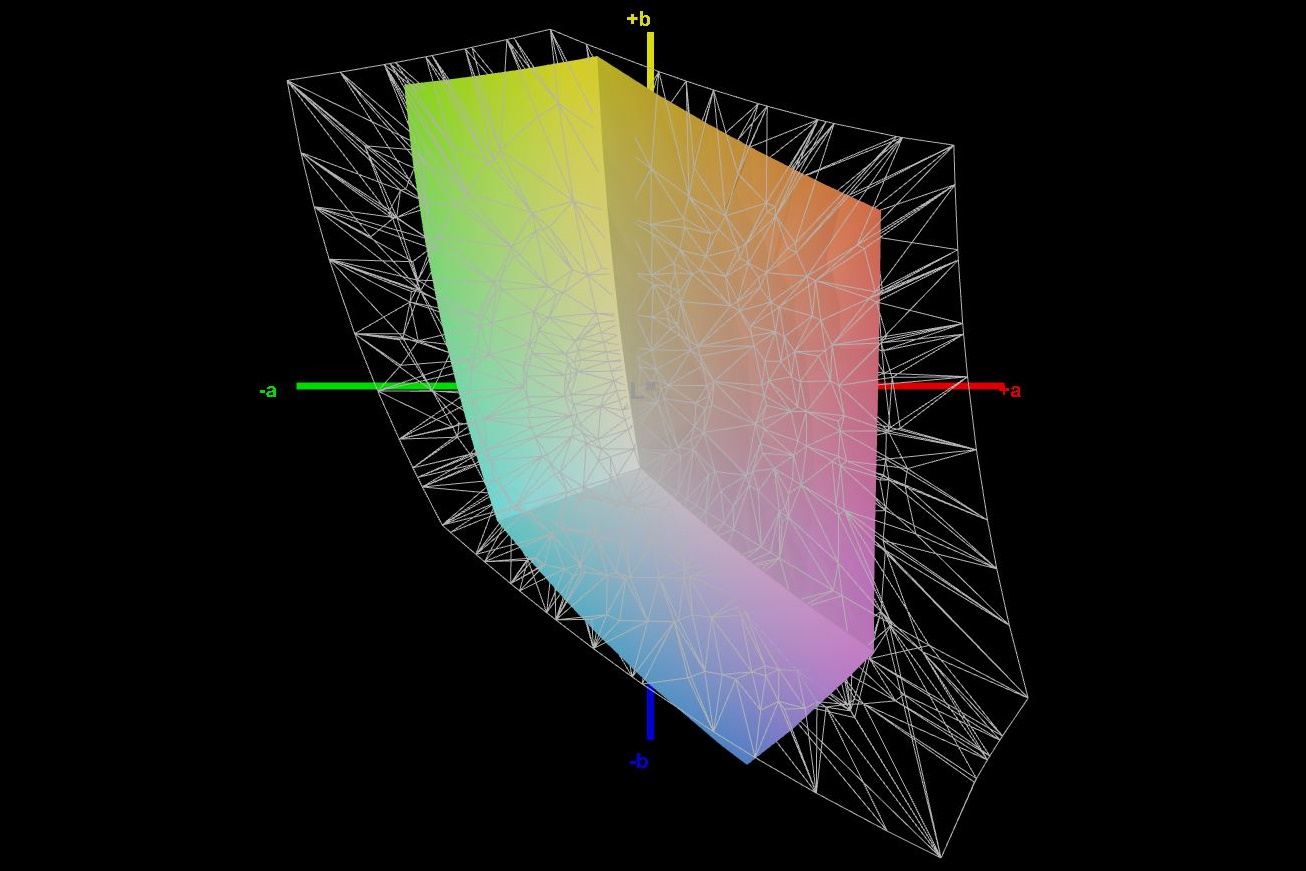
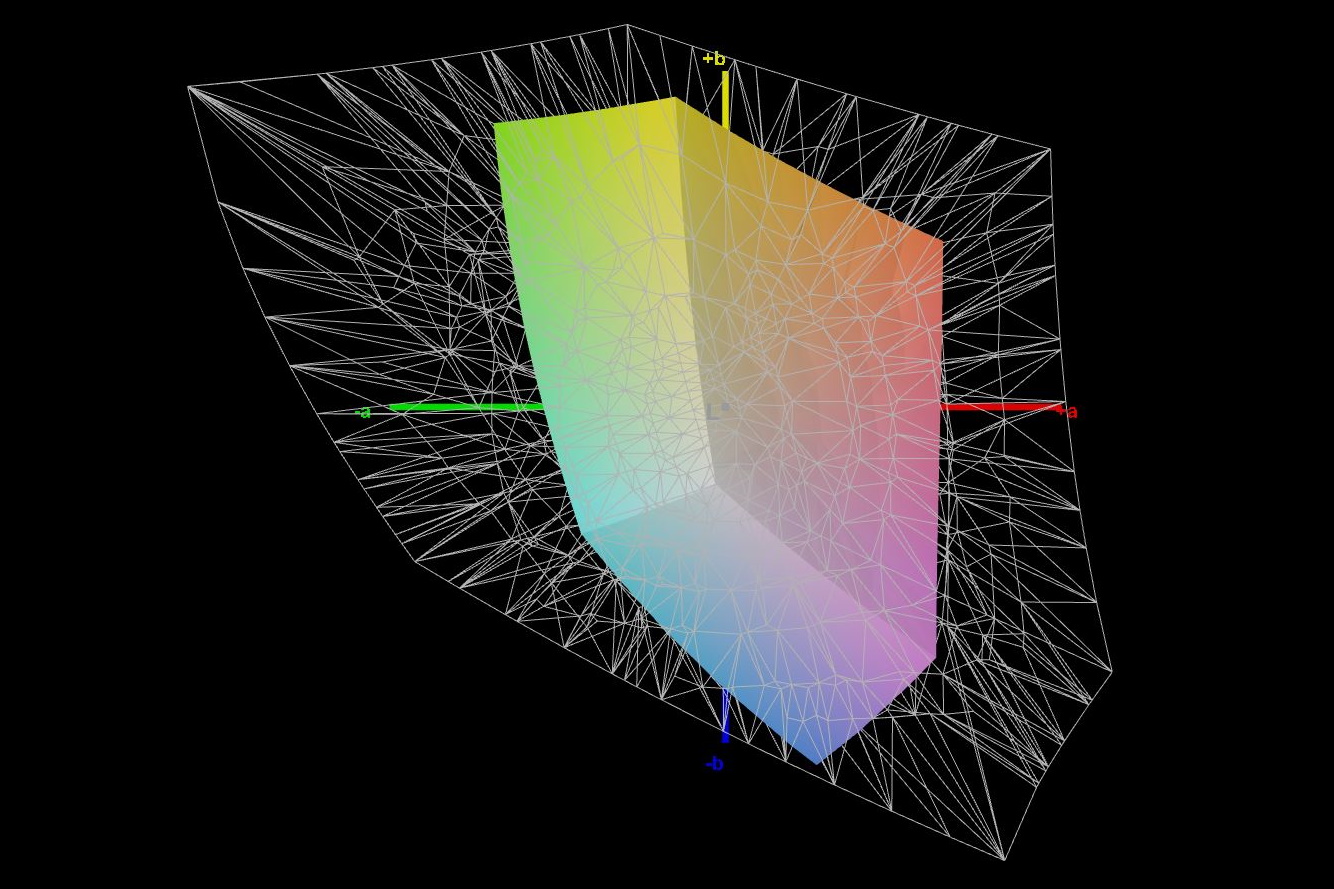
39.8% AdobeRGB 1998 (Argyll 2.2.0 3D)
57.8% sRGB (Argyll 2.2.0 3D)
38.5% Display P3 (Argyll 2.2.0 3D)
Gamma: 2.42
| MSI Katana GF76 12UGS AU Optronics B173HAN04.9, IPS, 1920x1080, 17.30 | MSI Katana GF76 11UE AU Optronics B173HAN04.9, IPS, 1920x1080, 17.30 | Aorus 17 XE4 Sharp LQ173M1JW12, IPS, 1920x1080, 17.30 | Razer Blade 17 (i7-12800H, RTX 3070 Ti) BOE CQ NE173QHM-NZ1 (BOE09F9), IPS, 2560x1440, 17.30 | Lenovo Legion 5 Pro 16 G7 i7 RTX 3070Ti NE160QDM-NY1, IPS, 2560x1600, 16.00 | MSI Vector GP66 12UGS BOE NE156FHM-NZ3, IPS, 1920x1080, 15.60 | |
|---|---|---|---|---|---|---|
| Display | 3% | 77% | 114% | 75% | 78% | |
| Display P3 Coverage | 38.5 | 39.8 3% | 69 79% | 97.9 154% | 68.7 78% | 70.1 82% |
| sRGB Coverage | 57.8 | 59.5 3% | 99.4 72% | 99.9 73% | 97.6 69% | 99.5 72% |
| AdobeRGB 1998 Coverage | 39.8 | 41.12 3% | 71.2 79% | 85.5 115% | 70.9 78% | 72.1 81% |
| Response Times | 6% | 61% | 61% | 64% | 75% | |
| Response Time Grey 50% / Grey 80% * | 40.6 ? | 36.8 ? 9% | 15.2 ? 63% | 15.2 ? 63% | 17.6 ? 57% | 5.8 ? 86% |
| Response Time Black / White * | 26.4 ? | 26 ? 2% | 11.2 ? 58% | 11.2 ? 58% | 7.6 ? 71% | 9.6 ? 64% |
| PWM Frequency | ||||||
| Screen | -33% | -12% | -64% | 3% | -28% | |
| Brightness middle | 281 | 260 -7% | 274 -2% | 341 21% | 502 79% | 353.1 26% |
| Brightness | 264 | 251 -5% | 267 1% | 308 17% | 491 86% | 325 23% |
| Brightness Distribution | 88 | 85 -3% | 82 -7% | 82 -7% | 91 3% | 85 -3% |
| Black Level * | 0.2 | 0.26 -30% | 0.25 -25% | 0.45 -125% | 0.37 -85% | 0.38 -90% |
| Contrast | 1405 | 1000 -29% | 1096 -22% | 758 -46% | 1357 -3% | 929 -34% |
| Colorchecker dE 2000 * | 3.69 | 3.9 -6% | 2.07 44% | 4.16 -13% | 2.7 27% | 2.24 39% |
| Colorchecker dE 2000 max. * | 8.46 | 20.64 -144% | 4.89 42% | 8.14 4% | 4.5 47% | 5 41% |
| Colorchecker dE 2000 calibrated * | 3.61 | 3.71 -3% | 0.83 77% | 3 17% | 1.4 61% | 1.02 72% |
| Greyscale dE 2000 * | 0.94 | 1.6 -70% | 3 -219% | 5.09 -441% | 2.7 -187% | 4 -326% |
| Gamma | 2.42 91% | 2.068 106% | 2.207 100% | 2.48 89% | 2.44 90% | 2.24 98% |
| CCT | 6443 101% | 6511 100% | 6999 93% | 6884 94% | 6326 103% | 6864 95% |
| Moyenne finale (programmes/paramètres) | -8% /
-20% | 42% /
17% | 37% /
-8% | 47% /
27% | 42% /
10% |
* ... Moindre est la valeur, meilleures sont les performances
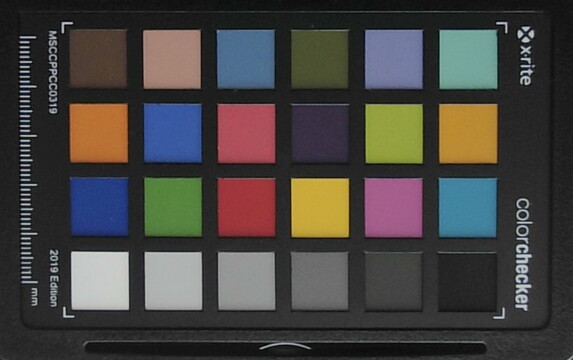
Les professionnels de l'édition d'images et de vidéos doivent utiliser un moniteur externe, car l'espace colorimétrique affiché est plutôt étroit. Seuls environ 40 % d'AdobeRGB sont reproduits, et moins de 60 % de sRGB.
Dans l'état de livraison, les écarts de niveaux de gris sont déjà inférieurs à 1. Cependant, les écarts de couleurs sont plus élevés, mais malheureusement, ils ne s'améliorent pas de manière significative par un calibrage manuel à l'aide de notre appareil de mesure des couleurs X-Rite (Portrait Displays Calman Color Calibration).

Temps de réponse de l'écran
| ↔ Temps de réponse noir à blanc | ||
|---|---|---|
| 26.4 ms ... hausse ↗ et chute ↘ combinées | ↗ 13.8 ms hausse | 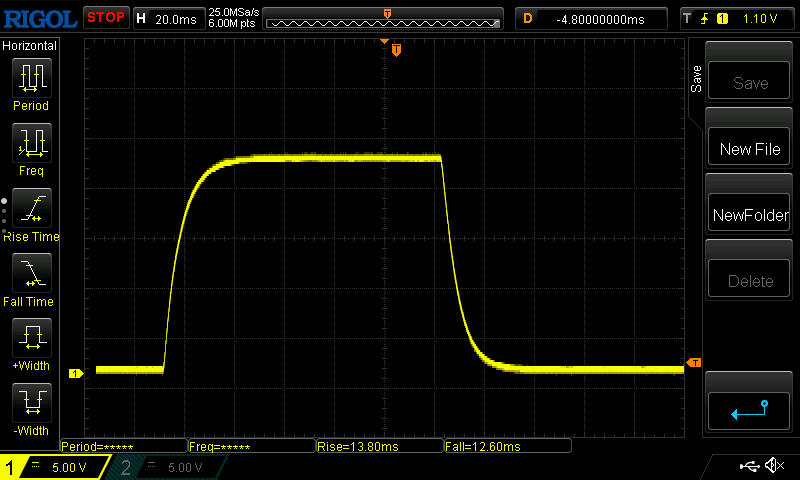 |
| ↘ 12.6 ms chute | ||
| L'écran souffre de latences relativement élevées, insuffisant pour le jeu. En comparaison, tous les appareils testés affichent entre 0.1 (minimum) et 240 (maximum) ms. » 61 % des appareils testés affichent de meilleures performances. Cela signifie que les latences relevées sont moins bonnes que la moyenne (21.5 ms) de tous les appareils testés. | ||
| ↔ Temps de réponse gris 50% à gris 80% | ||
| 40.6 ms ... hausse ↗ et chute ↘ combinées | ↗ 18.8 ms hausse | |
| ↘ 21.8 ms chute | ||
| L'écran souffre de latences très élevées, à éviter pour le jeu. En comparaison, tous les appareils testés affichent entre 0.2 (minimum) et 636 (maximum) ms. » 59 % des appareils testés affichent de meilleures performances. Cela signifie que les latences relevées sont moins bonnes que la moyenne (33.7 ms) de tous les appareils testés. | ||
Scintillement / MLI (Modulation de largeur d'impulsion)
| Scintillement / MLI (Modulation de largeur d'impulsion) non décelé | 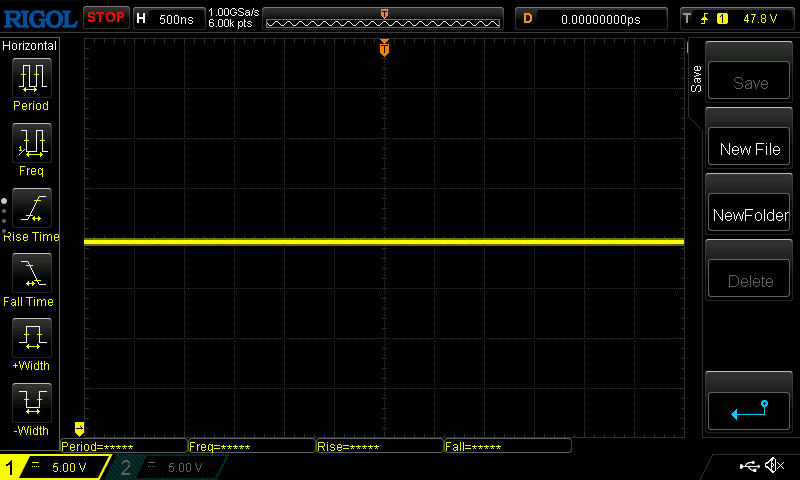 | ||
En comparaison, 53 % des appareils testés n'emploient pas MDI pour assombrir leur écran. Nous avons relevé une moyenne à 17915 (minimum : 5 - maximum : 3846000) Hz dans le cas où une MDI était active. | |||
Bien que la surface mate empêche de nombreux reflets, la faible luminosité et la stabilité de l'angle de vision plutôt faible entraînent une utilisation limitée en extérieur.
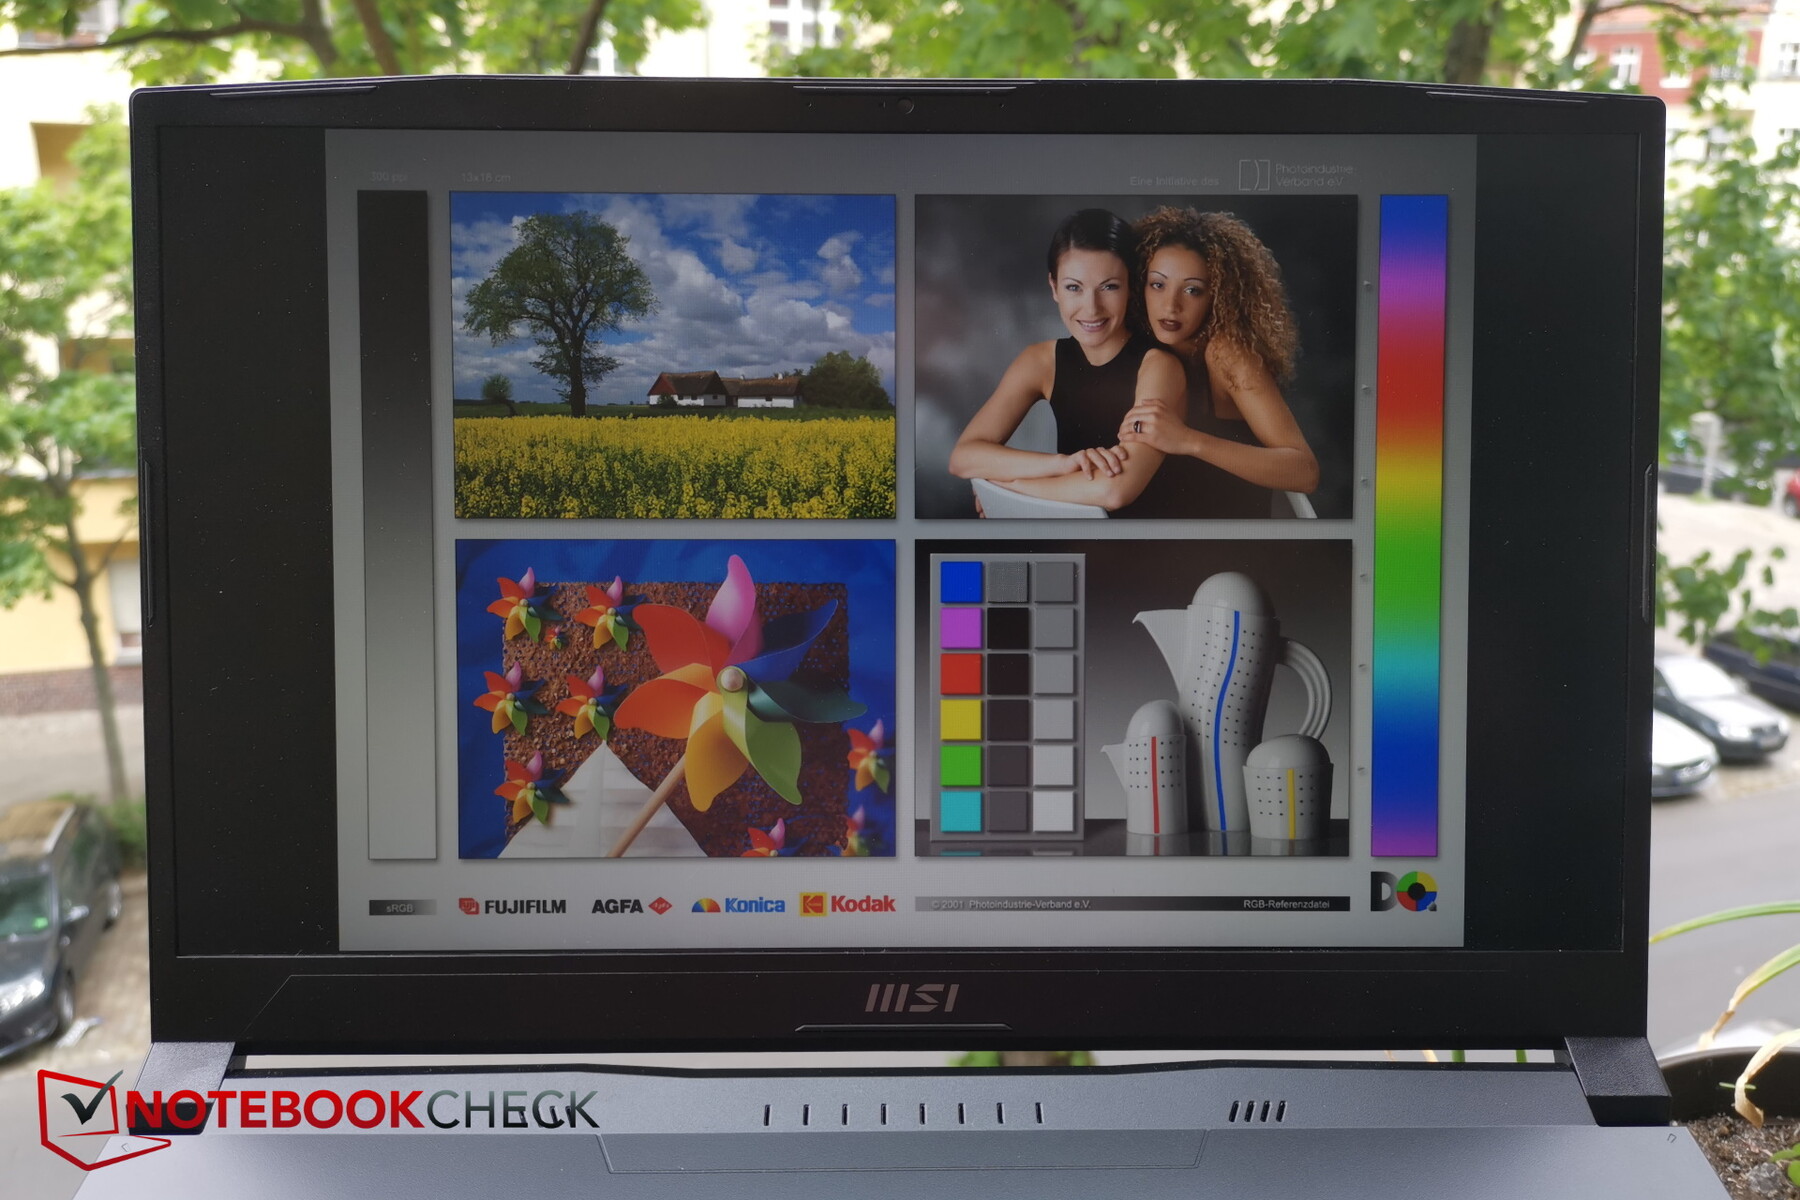
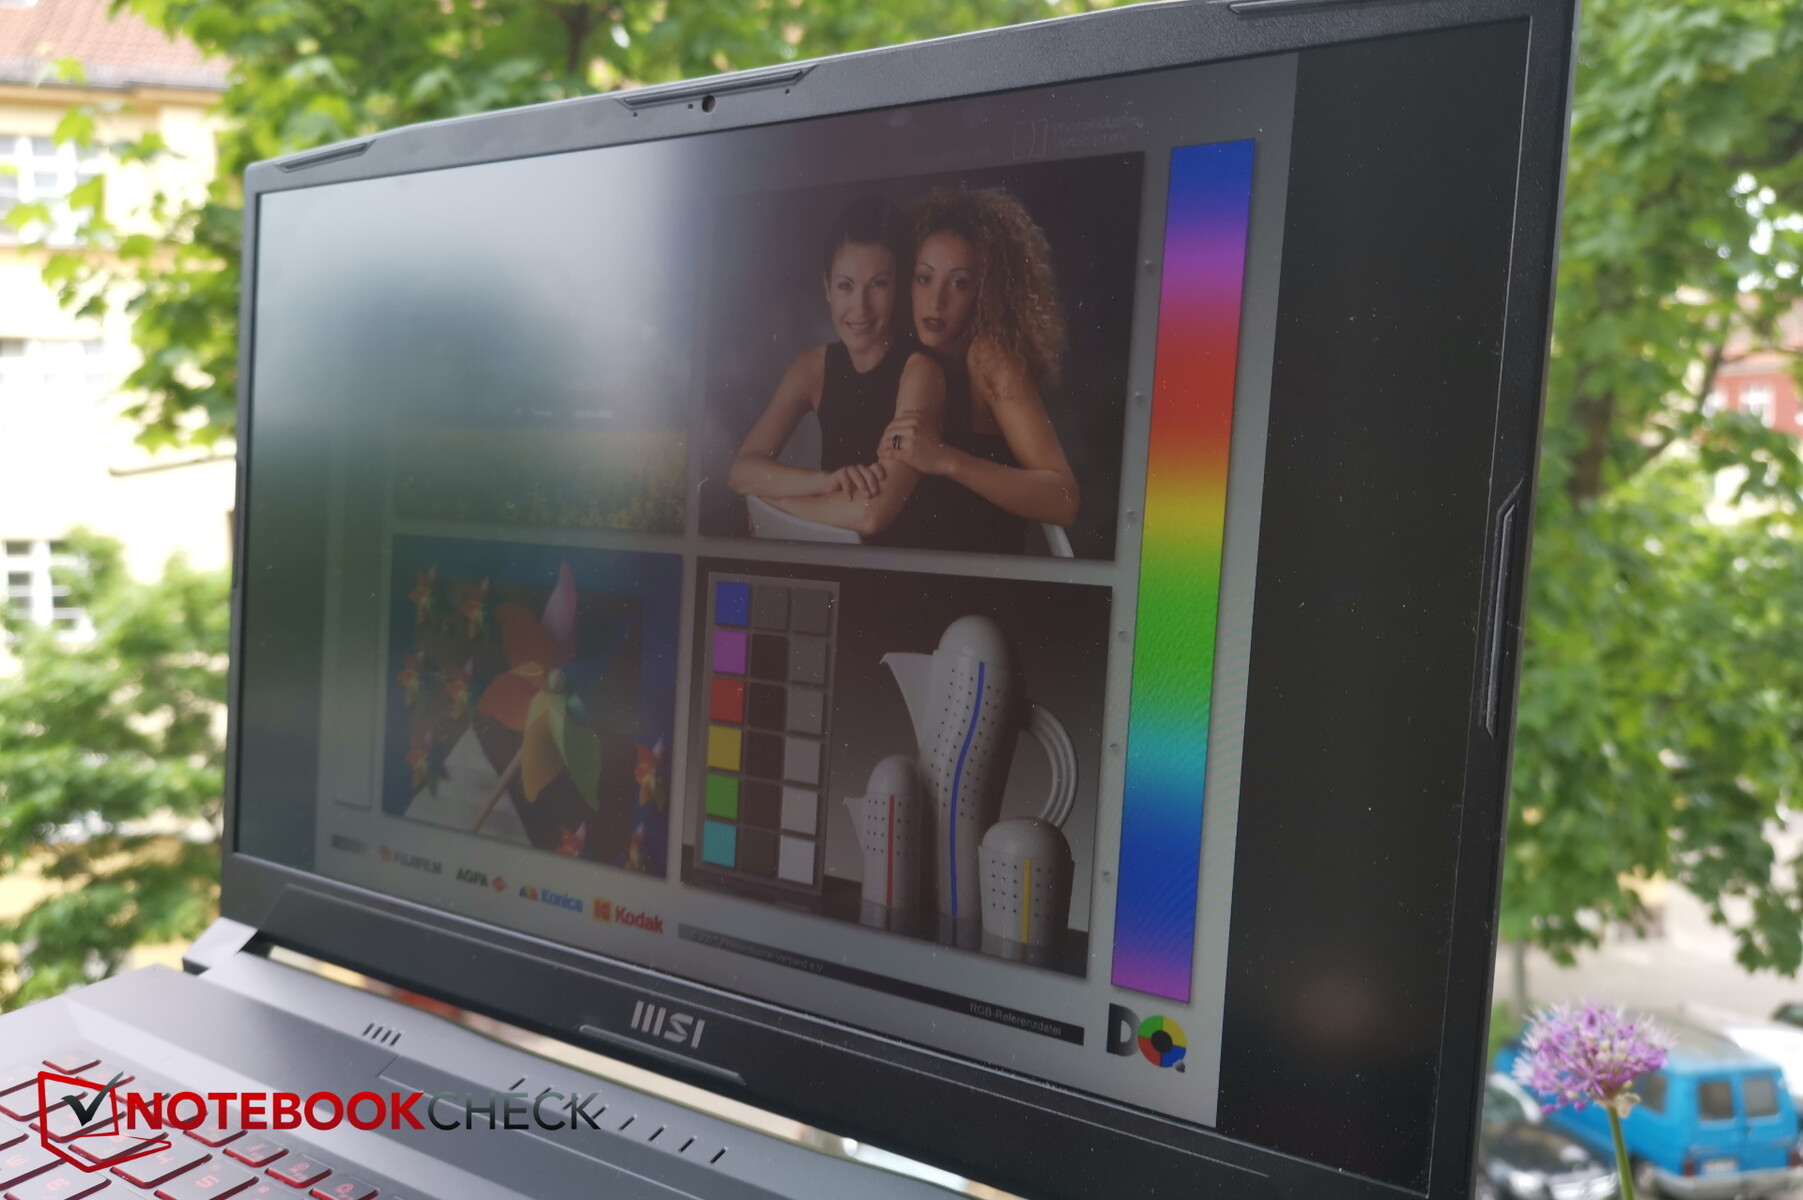
Alors qu'habituellement, les panneaux IPS brillent par la stabilité de leur angle de vision, ce n'est pas le cas de l'écran du Katana. À partir d'angles de vue extrêmes, la luminosité et les couleurs diminuent sensiblement en intensité.

Performances - RTX 3070 Ti avec une limite de 100 watts
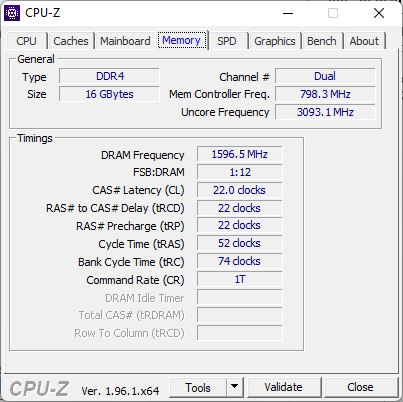
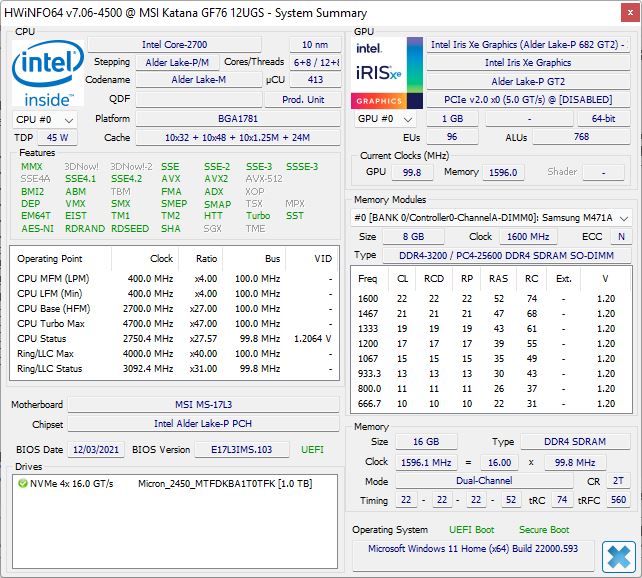
Le Katana GF76 12U est disponible dans un total de neuf configurations. Huit d'entre elles utilisent un Core i7-12700Het un seul modèle est équipé d'un processeuri5-12500Hles versions de GPU vont duRTX 3050jusqu'à laRTX 3070 Tiincluant tous les modèles RTX actuellement disponibles de Nvidia. L'écran et la RAM (2x 8 GB DDR4, également 16 GB) sont les mêmes pour tous les modèles. En ce qui concerne la taille du SSD, 1 To ou 512 Go sont disponibles.
Notre configuration représente le haut de gamme avec une RTX 3070 Ti et un SSD de 1 To. Elle devrait être capable de jouer à tous les jeux actuels dans la résolution native FHD de manière fluide, même au niveau de détail maximal.
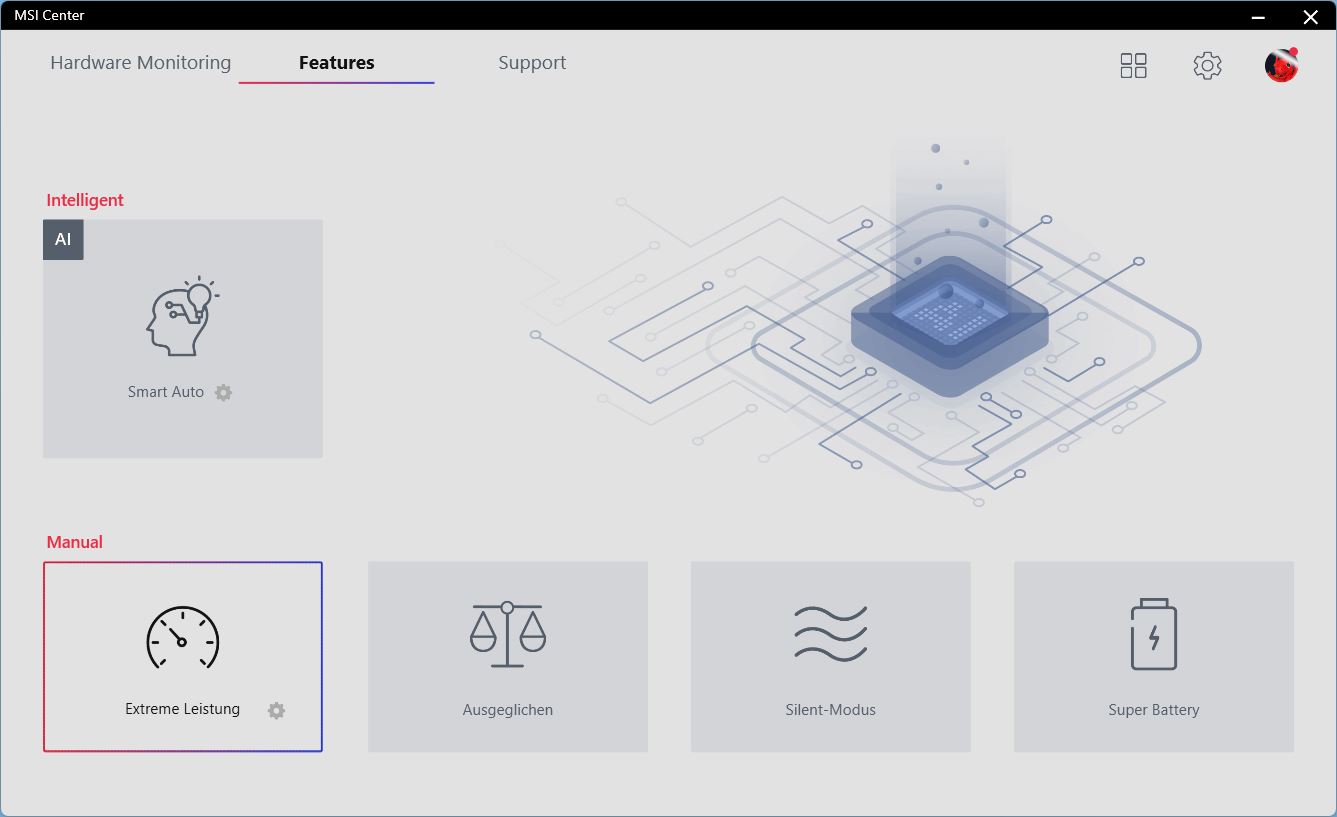
Conditions d'essai
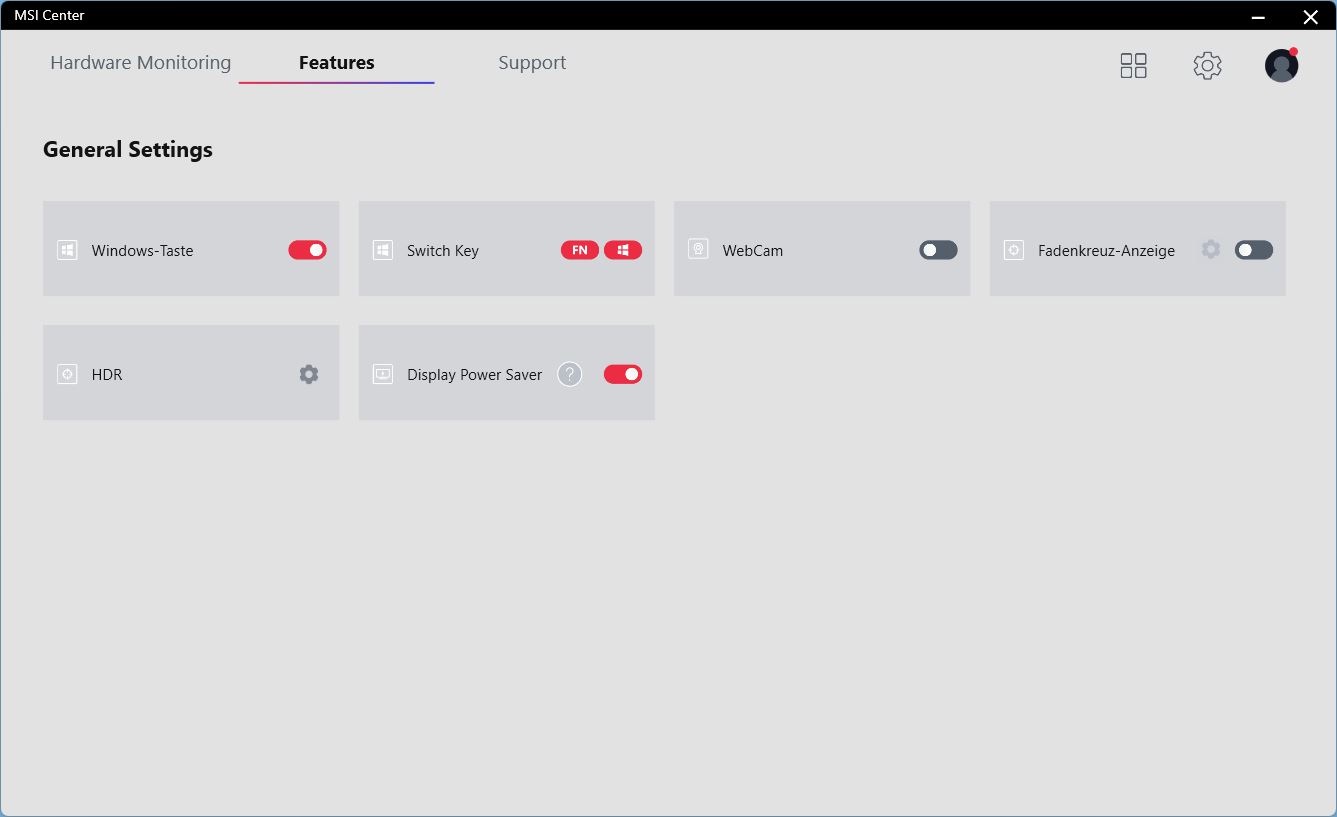
Pour obtenir les meilleurs résultats de benchmark, nous utilisons le mode "Extreme Performance" dans le MSI Center. Bien que ce logiciel vous permette de régler divers paramètres importants du système, lors de son premier démarrage, vous devez accepter une déclaration de confidentialité des données qui demande l'envoi de données anonymes sur l'utilisateur. Les paramètres de réglage comprennent les profils d'utilisateur, les modes de contrôle des ventilateurs, mais aussi des paramètres généraux tels que la commutation des touches Fn et Windows. Il permet également de rechercher des mises à jour de pilotes, mais malheureusement elles ne s'installent pas automatiquement après le téléchargement
Le Centre MSI est trop long à charger à notre goût, et il est arrivé à plusieurs reprises que le profil du ventilateur revienne à "Balanced" sans aucune raison discernable après le redémarrage du logiciel.
Processeur
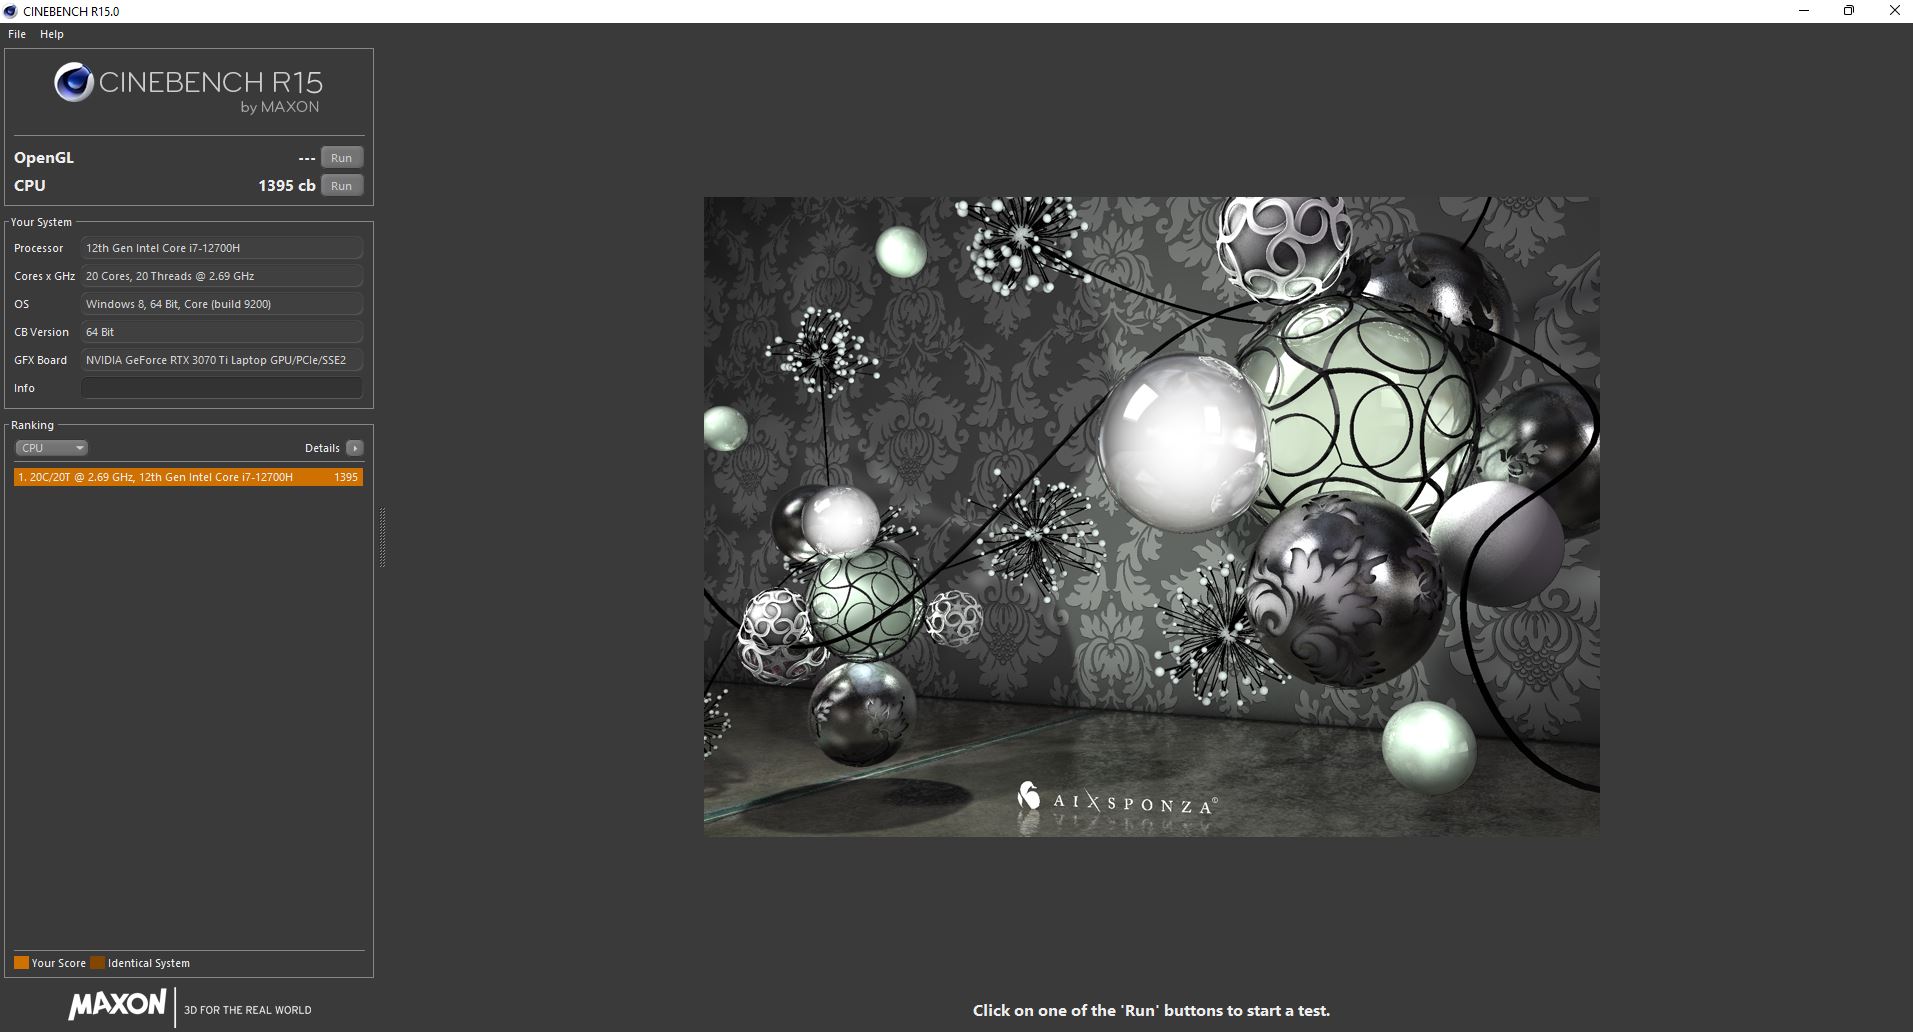
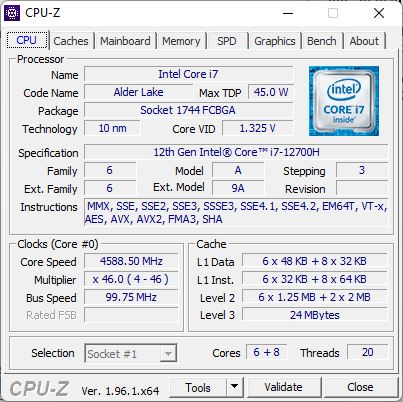
MSI utilise un Intel Core i7-12700Hqui, en plus de la version légèrement meilleure i7-12800H représente l'un des processeurs standard pour les ordinateurs portables de jeu actuels, tant que vous recherchez un processeur Intel et non AMD. Il possède un total de 14 cœurs et est capable de fonctionner sur 20 threads simultanément. Chacun de ses six cœurs P est capable de fonctionner jusqu'à 4,7 GHz en Turbo Boost, et leur vitesse d'horloge de base est de 1,7 (cœurs E) et 2,4 GHz (cœurs P).
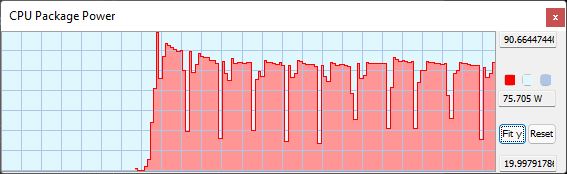
Alors que le processeur de 45 watts devrait vraiment être capable de consommer jusqu'à 115 watts pendant une courte période, notre unité de test n'atteint que 105 watts pendant une très courte période lors de la première exécution. Dans les exécutions suivantes, il atteint encore 70 à 76 watts, qu'il est capable de maintenir relativement bien dans une exécution.
Avec cela, le Katane se situe au même niveau que les concurrents, qui sont également bons. Le précédent Katane est dépassé d'environ 30%.
Dans le test Cinebench R15, les performances sont réduites d'environ 40% en fonctionnement sur batterie.
Cinebench R15 Multi Constant Load Test
Cinebench R23: Multi Core | Single Core
Cinebench R20: CPU (Multi Core) | CPU (Single Core)
Cinebench R15: CPU Multi 64Bit | CPU Single 64Bit
Blender: v2.79 BMW27 CPU
7-Zip 18.03: 7z b 4 | 7z b 4 -mmt1
Geekbench 5.5: Multi-Core | Single-Core
HWBOT x265 Benchmark v2.2: 4k Preset
LibreOffice : 20 Documents To PDF
R Benchmark 2.5: Overall mean
| CPU Performance Rating | |
| Moyenne de la classe Gaming | |
| Lenovo Legion 5 Pro 16 G7 i7 RTX 3070Ti | |
| MSI Vector GP66 12UGS | |
| Aorus 17 XE4 | |
| MSI Katana GF76 12UGS | |
| Razer Blade 17 (i7-12800H, RTX 3070 Ti) | |
| Moyenne Intel Core i7-12700H | |
| MSI Katana GF76 11UE | |
| Cinebench R23 / Multi Core | |
| Moyenne de la classe Gaming (2435 - 34613, n=229, 2 dernières années) | |
| Lenovo Legion 5 Pro 16 G7 i7 RTX 3070Ti | |
| MSI Katana GF76 12UGS | |
| MSI Vector GP66 12UGS | |
| Aorus 17 XE4 | |
| Moyenne Intel Core i7-12700H (4032 - 19330, n=63) | |
| Razer Blade 17 (i7-12800H, RTX 3070 Ti) | |
| MSI Katana GF76 11UE | |
| Cinebench R23 / Single Core | |
| MSI Vector GP66 12UGS | |
| Razer Blade 17 (i7-12800H, RTX 3070 Ti) | |
| Lenovo Legion 5 Pro 16 G7 i7 RTX 3070Ti | |
| Moyenne de la classe Gaming (527 - 2235, n=227, 2 dernières années) | |
| Aorus 17 XE4 | |
| MSI Katana GF76 12UGS | |
| Moyenne Intel Core i7-12700H (778 - 1826, n=62) | |
| MSI Katana GF76 11UE | |
| Cinebench R20 / CPU (Multi Core) | |
| Moyenne de la classe Gaming (930 - 13769, n=227, 2 dernières années) | |
| Lenovo Legion 5 Pro 16 G7 i7 RTX 3070Ti | |
| MSI Vector GP66 12UGS | |
| Aorus 17 XE4 | |
| MSI Katana GF76 12UGS | |
| Moyenne Intel Core i7-12700H (1576 - 7407, n=63) | |
| Razer Blade 17 (i7-12800H, RTX 3070 Ti) | |
| MSI Katana GF76 11UE | |
| Cinebench R20 / CPU (Single Core) | |
| MSI Vector GP66 12UGS | |
| Razer Blade 17 (i7-12800H, RTX 3070 Ti) | |
| Moyenne de la classe Gaming (169 - 855, n=227, 2 dernières années) | |
| MSI Katana GF76 12UGS | |
| Lenovo Legion 5 Pro 16 G7 i7 RTX 3070Ti | |
| Aorus 17 XE4 | |
| Moyenne Intel Core i7-12700H (300 - 704, n=63) | |
| MSI Katana GF76 11UE | |
| Cinebench R15 / CPU Multi 64Bit | |
| Moyenne de la classe Gaming (400 - 5663, n=231, 2 dernières années) | |
| Lenovo Legion 5 Pro 16 G7 i7 RTX 3070Ti | |
| Razer Blade 17 (i7-12800H, RTX 3070 Ti) | |
| MSI Katana GF76 12UGS | |
| Aorus 17 XE4 | |
| Moyenne Intel Core i7-12700H (1379 - 2916, n=69) | |
| MSI Vector GP66 12UGS | |
| MSI Katana GF76 11UE | |
| Cinebench R15 / CPU Single 64Bit | |
| MSI Vector GP66 12UGS | |
| Moyenne de la classe Gaming (79.2 - 318, n=230, 2 dernières années) | |
| Razer Blade 17 (i7-12800H, RTX 3070 Ti) | |
| Lenovo Legion 5 Pro 16 G7 i7 RTX 3070Ti | |
| Aorus 17 XE4 | |
| MSI Katana GF76 12UGS | |
| Moyenne Intel Core i7-12700H (113 - 263, n=64) | |
| MSI Katana GF76 11UE | |
| Blender / v2.79 BMW27 CPU | |
| MSI Katana GF76 11UE | |
| Aorus 17 XE4 | |
| Moyenne Intel Core i7-12700H (168 - 732, n=62) | |
| Razer Blade 17 (i7-12800H, RTX 3070 Ti) | |
| Moyenne de la classe Gaming (87 - 1259, n=225, 2 dernières années) | |
| MSI Vector GP66 12UGS | |
| MSI Katana GF76 12UGS | |
| Lenovo Legion 5 Pro 16 G7 i7 RTX 3070Ti | |
| 7-Zip 18.03 / 7z b 4 | |
| Moyenne de la classe Gaming (11386 - 140932, n=226, 2 dernières années) | |
| Lenovo Legion 5 Pro 16 G7 i7 RTX 3070Ti | |
| MSI Vector GP66 12UGS | |
| Razer Blade 17 (i7-12800H, RTX 3070 Ti) | |
| MSI Katana GF76 12UGS | |
| Moyenne Intel Core i7-12700H (22844 - 73067, n=62) | |
| Aorus 17 XE4 | |
| MSI Katana GF76 11UE | |
| 7-Zip 18.03 / 7z b 4 -mmt1 | |
| Moyenne de la classe Gaming (2685 - 7581, n=226, 2 dernières années) | |
| MSI Vector GP66 12UGS | |
| Aorus 17 XE4 | |
| Lenovo Legion 5 Pro 16 G7 i7 RTX 3070Ti | |
| MSI Katana GF76 12UGS | |
| Razer Blade 17 (i7-12800H, RTX 3070 Ti) | |
| Moyenne Intel Core i7-12700H (2743 - 5972, n=62) | |
| MSI Katana GF76 11UE | |
| Geekbench 5.5 / Multi-Core | |
| Moyenne de la classe Gaming (1946 - 22200, n=231, 2 dernières années) | |
| Lenovo Legion 5 Pro 16 G7 i7 RTX 3070Ti | |
| MSI Vector GP66 12UGS | |
| Aorus 17 XE4 | |
| Razer Blade 17 (i7-12800H, RTX 3070 Ti) | |
| Moyenne Intel Core i7-12700H (5144 - 13745, n=63) | |
| MSI Katana GF76 12UGS | |
| MSI Katana GF76 11UE | |
| Geekbench 5.5 / Single-Core | |
| MSI Vector GP66 12UGS | |
| Moyenne de la classe Gaming (158 - 2210, n=231, 2 dernières années) | |
| MSI Katana GF76 12UGS | |
| Aorus 17 XE4 | |
| Razer Blade 17 (i7-12800H, RTX 3070 Ti) | |
| Lenovo Legion 5 Pro 16 G7 i7 RTX 3070Ti | |
| Moyenne Intel Core i7-12700H (803 - 1851, n=63) | |
| MSI Katana GF76 11UE | |
| HWBOT x265 Benchmark v2.2 / 4k Preset | |
| Lenovo Legion 5 Pro 16 G7 i7 RTX 3070Ti | |
| Moyenne de la classe Gaming (3 - 37.6, n=229, 2 dernières années) | |
| MSI Vector GP66 12UGS | |
| Moyenne Intel Core i7-12700H (4.67 - 21.8, n=63) | |
| Aorus 17 XE4 | |
| Razer Blade 17 (i7-12800H, RTX 3070 Ti) | |
| MSI Katana GF76 12UGS | |
| MSI Katana GF76 11UE | |
| LibreOffice / 20 Documents To PDF | |
| MSI Katana GF76 11UE | |
| Moyenne de la classe Gaming (32.8 - 332, n=223, 2 dernières années) | |
| Moyenne Intel Core i7-12700H (34.2 - 95.3, n=62) | |
| Lenovo Legion 5 Pro 16 G7 i7 RTX 3070Ti | |
| Razer Blade 17 (i7-12800H, RTX 3070 Ti) | |
| MSI Katana GF76 12UGS | |
| MSI Vector GP66 12UGS | |
| Aorus 17 XE4 | |
| R Benchmark 2.5 / Overall mean | |
| MSI Katana GF76 11UE | |
| Moyenne Intel Core i7-12700H (0.4441 - 1.052, n=62) | |
| Moyenne de la classe Gaming (0.3609 - 4.47, n=226, 2 dernières années) | |
| Razer Blade 17 (i7-12800H, RTX 3070 Ti) | |
| Aorus 17 XE4 | |
| MSI Katana GF76 12UGS | |
| Lenovo Legion 5 Pro 16 G7 i7 RTX 3070Ti | |
| MSI Vector GP66 12UGS | |
* ... Moindre est la valeur, meilleures sont les performances
AIDA64: FP32 Ray-Trace | FPU Julia | CPU SHA3 | CPU Queen | FPU SinJulia | FPU Mandel | CPU AES | CPU ZLib | FP64 Ray-Trace | CPU PhotoWorxx
| Performance Rating | |
| Moyenne de la classe Gaming | |
| Lenovo Legion 5 Pro 16 G7 i7 RTX 3070Ti | |
| Moyenne Intel Core i7-12700H | |
| MSI Vector GP66 12UGS | |
| MSI Katana GF76 12UGS | |
| Razer Blade 17 (i7-12800H, RTX 3070 Ti) | |
| Aorus 17 XE4 | |
| MSI Katana GF76 11UE -9! | |
| AIDA64 / FP32 Ray-Trace | |
| Moyenne de la classe Gaming (3069 - 60169, n=222, 2 dernières années) | |
| Moyenne Intel Core i7-12700H (2585 - 17957, n=62) | |
| Lenovo Legion 5 Pro 16 G7 i7 RTX 3070Ti | |
| MSI Katana GF76 12UGS | |
| MSI Vector GP66 12UGS | |
| Razer Blade 17 (i7-12800H, RTX 3070 Ti) | |
| Aorus 17 XE4 | |
| AIDA64 / FPU Julia | |
| Moyenne de la classe Gaming (18567 - 252486, n=222, 2 dernières années) | |
| Moyenne Intel Core i7-12700H (12439 - 90760, n=62) | |
| Lenovo Legion 5 Pro 16 G7 i7 RTX 3070Ti | |
| MSI Vector GP66 12UGS | |
| MSI Katana GF76 12UGS | |
| Razer Blade 17 (i7-12800H, RTX 3070 Ti) | |
| Aorus 17 XE4 | |
| AIDA64 / CPU SHA3 | |
| Moyenne de la classe Gaming (629 - 10389, n=222, 2 dernières années) | |
| Lenovo Legion 5 Pro 16 G7 i7 RTX 3070Ti | |
| MSI Katana GF76 12UGS | |
| Moyenne Intel Core i7-12700H (833 - 4242, n=62) | |
| MSI Vector GP66 12UGS | |
| Razer Blade 17 (i7-12800H, RTX 3070 Ti) | |
| Aorus 17 XE4 | |
| AIDA64 / CPU Queen | |
| Moyenne de la classe Gaming (15371 - 200651, n=222, 2 dernières années) | |
| MSI Vector GP66 12UGS | |
| Aorus 17 XE4 | |
| Lenovo Legion 5 Pro 16 G7 i7 RTX 3070Ti | |
| MSI Katana GF76 12UGS | |
| Moyenne Intel Core i7-12700H (57923 - 103202, n=62) | |
| Razer Blade 17 (i7-12800H, RTX 3070 Ti) | |
| AIDA64 / FPU SinJulia | |
| Moyenne de la classe Gaming (2137 - 32988, n=222, 2 dernières années) | |
| Lenovo Legion 5 Pro 16 G7 i7 RTX 3070Ti | |
| MSI Vector GP66 12UGS | |
| MSI Katana GF76 12UGS | |
| Razer Blade 17 (i7-12800H, RTX 3070 Ti) | |
| Moyenne Intel Core i7-12700H (3249 - 9939, n=62) | |
| Aorus 17 XE4 | |
| AIDA64 / FPU Mandel | |
| Moyenne de la classe Gaming (10291 - 134044, n=222, 2 dernières années) | |
| Moyenne Intel Core i7-12700H (7135 - 44760, n=62) | |
| Lenovo Legion 5 Pro 16 G7 i7 RTX 3070Ti | |
| MSI Katana GF76 12UGS | |
| MSI Vector GP66 12UGS | |
| Razer Blade 17 (i7-12800H, RTX 3070 Ti) | |
| Aorus 17 XE4 | |
| AIDA64 / CPU AES | |
| Moyenne de la classe Gaming (19065 - 328679, n=222, 2 dernières années) | |
| Lenovo Legion 5 Pro 16 G7 i7 RTX 3070Ti | |
| MSI Vector GP66 12UGS | |
| MSI Katana GF76 12UGS | |
| Moyenne Intel Core i7-12700H (31839 - 144360, n=62) | |
| Aorus 17 XE4 | |
| Razer Blade 17 (i7-12800H, RTX 3070 Ti) | |
| AIDA64 / CPU ZLib | |
| Moyenne de la classe Gaming (150.9 - 2409, n=222, 2 dernières années) | |
| Lenovo Legion 5 Pro 16 G7 i7 RTX 3070Ti | |
| MSI Vector GP66 12UGS | |
| MSI Katana GF76 12UGS | |
| Razer Blade 17 (i7-12800H, RTX 3070 Ti) | |
| Moyenne Intel Core i7-12700H (305 - 1171, n=62) | |
| Aorus 17 XE4 | |
| MSI Katana GF76 11UE | |
| AIDA64 / FP64 Ray-Trace | |
| Moyenne de la classe Gaming (1518 - 31796, n=222, 2 dernières années) | |
| Moyenne Intel Core i7-12700H (1437 - 9692, n=62) | |
| Lenovo Legion 5 Pro 16 G7 i7 RTX 3070Ti | |
| MSI Katana GF76 12UGS | |
| MSI Vector GP66 12UGS | |
| Razer Blade 17 (i7-12800H, RTX 3070 Ti) | |
| Aorus 17 XE4 | |
| AIDA64 / CPU PhotoWorxx | |
| Moyenne de la classe Gaming (10805 - 60161, n=223, 2 dernières années) | |
| Lenovo Legion 5 Pro 16 G7 i7 RTX 3070Ti | |
| Moyenne Intel Core i7-12700H (12863 - 52207, n=62) | |
| Razer Blade 17 (i7-12800H, RTX 3070 Ti) | |
| MSI Vector GP66 12UGS | |
| MSI Katana GF76 12UGS | |
| Aorus 17 XE4 | |
Performance du système
Dans PCMark 10, le Katana fait du bon travail, se classant deuxième la plupart du temps. Ce n'est que dans le segment de la création de contenu numérique que les performances baissent légèrement.

CrossMark: Overall | Productivity | Creativity | Responsiveness
| PCMark 10 / Score | |
| MSI Vector GP66 12UGS | |
| Aorus 17 XE4 | |
| MSI Katana GF76 12UGS | |
| Moyenne de la classe Gaming (5235 - 9852, n=197, 2 dernières années) | |
| Lenovo Legion 5 Pro 16 G7 i7 RTX 3070Ti | |
| Moyenne Intel Core i7-12700H, NVIDIA GeForce RTX 3070 Ti Laptop GPU (6941 - 7947, n=11) | |
| Razer Blade 17 (i7-12800H, RTX 3070 Ti) | |
| MSI Katana GF76 11UE | |
| PCMark 10 / Essentials | |
| MSI Vector GP66 12UGS | |
| MSI Katana GF76 12UGS | |
| Aorus 17 XE4 | |
| Moyenne de la classe Gaming (8300 - 12334, n=196, 2 dernières années) | |
| Moyenne Intel Core i7-12700H, NVIDIA GeForce RTX 3070 Ti Laptop GPU (9892 - 10935, n=11) | |
| Razer Blade 17 (i7-12800H, RTX 3070 Ti) | |
| Lenovo Legion 5 Pro 16 G7 i7 RTX 3070Ti | |
| MSI Katana GF76 11UE | |
| PCMark 10 / Productivity | |
| MSI Vector GP66 12UGS | |
| MSI Katana GF76 12UGS | |
| Lenovo Legion 5 Pro 16 G7 i7 RTX 3070Ti | |
| Aorus 17 XE4 | |
| Moyenne Intel Core i7-12700H, NVIDIA GeForce RTX 3070 Ti Laptop GPU (9024 - 10638, n=11) | |
| Moyenne de la classe Gaming (6662 - 11833, n=196, 2 dernières années) | |
| Razer Blade 17 (i7-12800H, RTX 3070 Ti) | |
| MSI Katana GF76 11UE | |
| PCMark 10 / Digital Content Creation | |
| MSI Vector GP66 12UGS | |
| Lenovo Legion 5 Pro 16 G7 i7 RTX 3070Ti | |
| Aorus 17 XE4 | |
| Moyenne de la classe Gaming (6462 - 18475, n=196, 2 dernières années) | |
| Moyenne Intel Core i7-12700H, NVIDIA GeForce RTX 3070 Ti Laptop GPU (10165 - 12546, n=11) | |
| Razer Blade 17 (i7-12800H, RTX 3070 Ti) | |
| MSI Katana GF76 12UGS | |
| MSI Katana GF76 11UE | |
| CrossMark / Overall | |
| Aorus 17 XE4 | |
| Lenovo Legion 5 Pro 16 G7 i7 RTX 3070Ti | |
| MSI Katana GF76 12UGS | |
| Moyenne de la classe Gaming (1247 - 2334, n=168, 2 dernières années) | |
| Moyenne Intel Core i7-12700H, NVIDIA GeForce RTX 3070 Ti Laptop GPU (974 - 2000, n=12) | |
| Razer Blade 17 (i7-12800H, RTX 3070 Ti) | |
| CrossMark / Productivity | |
| Aorus 17 XE4 | |
| MSI Katana GF76 12UGS | |
| Lenovo Legion 5 Pro 16 G7 i7 RTX 3070Ti | |
| Moyenne de la classe Gaming (1299 - 2204, n=168, 2 dernières années) | |
| Moyenne Intel Core i7-12700H, NVIDIA GeForce RTX 3070 Ti Laptop GPU (907 - 1962, n=12) | |
| Razer Blade 17 (i7-12800H, RTX 3070 Ti) | |
| CrossMark / Creativity | |
| Lenovo Legion 5 Pro 16 G7 i7 RTX 3070Ti | |
| Moyenne de la classe Gaming (1275 - 2514, n=168, 2 dernières années) | |
| Aorus 17 XE4 | |
| Razer Blade 17 (i7-12800H, RTX 3070 Ti) | |
| Moyenne Intel Core i7-12700H, NVIDIA GeForce RTX 3070 Ti Laptop GPU (1027 - 2057, n=12) | |
| MSI Katana GF76 12UGS | |
| CrossMark / Responsiveness | |
| Aorus 17 XE4 | |
| MSI Katana GF76 12UGS | |
| Lenovo Legion 5 Pro 16 G7 i7 RTX 3070Ti | |
| Moyenne Intel Core i7-12700H, NVIDIA GeForce RTX 3070 Ti Laptop GPU (1029 - 2142, n=12) | |
| Moyenne de la classe Gaming (1030 - 2330, n=168, 2 dernières années) | |
| Razer Blade 17 (i7-12800H, RTX 3070 Ti) | |
| PCMark 10 Score | 7637 points | |
Aide | ||
| AIDA64 / Memory Copy | |
| Moyenne de la classe Gaming (21842 - 92565, n=222, 2 dernières années) | |
| Moyenne Intel Core i7-12700H (25615 - 80511, n=62) | |
| Lenovo Legion 5 Pro 16 G7 i7 RTX 3070Ti | |
| Razer Blade 17 (i7-12800H, RTX 3070 Ti) | |
| MSI Katana GF76 12UGS | |
| MSI Vector GP66 12UGS | |
| Aorus 17 XE4 | |
| AIDA64 / Memory Read | |
| Moyenne de la classe Gaming (24879 - 90647, n=222, 2 dernières années) | |
| Lenovo Legion 5 Pro 16 G7 i7 RTX 3070Ti | |
| Moyenne Intel Core i7-12700H (25586 - 79442, n=62) | |
| Razer Blade 17 (i7-12800H, RTX 3070 Ti) | |
| MSI Katana GF76 12UGS | |
| MSI Vector GP66 12UGS | |
| Aorus 17 XE4 | |
| AIDA64 / Memory Write | |
| Moyenne de la classe Gaming (21619 - 103259, n=222, 2 dernières années) | |
| Lenovo Legion 5 Pro 16 G7 i7 RTX 3070Ti | |
| Moyenne Intel Core i7-12700H (23679 - 88660, n=62) | |
| Razer Blade 17 (i7-12800H, RTX 3070 Ti) | |
| MSI Katana GF76 12UGS | |
| MSI Vector GP66 12UGS | |
| Aorus 17 XE4 | |
| AIDA64 / Memory Latency | |
| Lenovo Legion 5 Pro 16 G7 i7 RTX 3070Ti | |
| MSI Katana GF76 12UGS | |
| Aorus 17 XE4 | |
| MSI Vector GP66 12UGS | |
| Moyenne de la classe Gaming (59.5 - 152.5, n=219, 2 dernières années) | |
| Moyenne Intel Core i7-12700H (76.2 - 133.9, n=60) | |
| MSI Katana GF76 11UE | |
| Razer Blade 17 (i7-12800H, RTX 3070 Ti) | |
* ... Moindre est la valeur, meilleures sont les performances
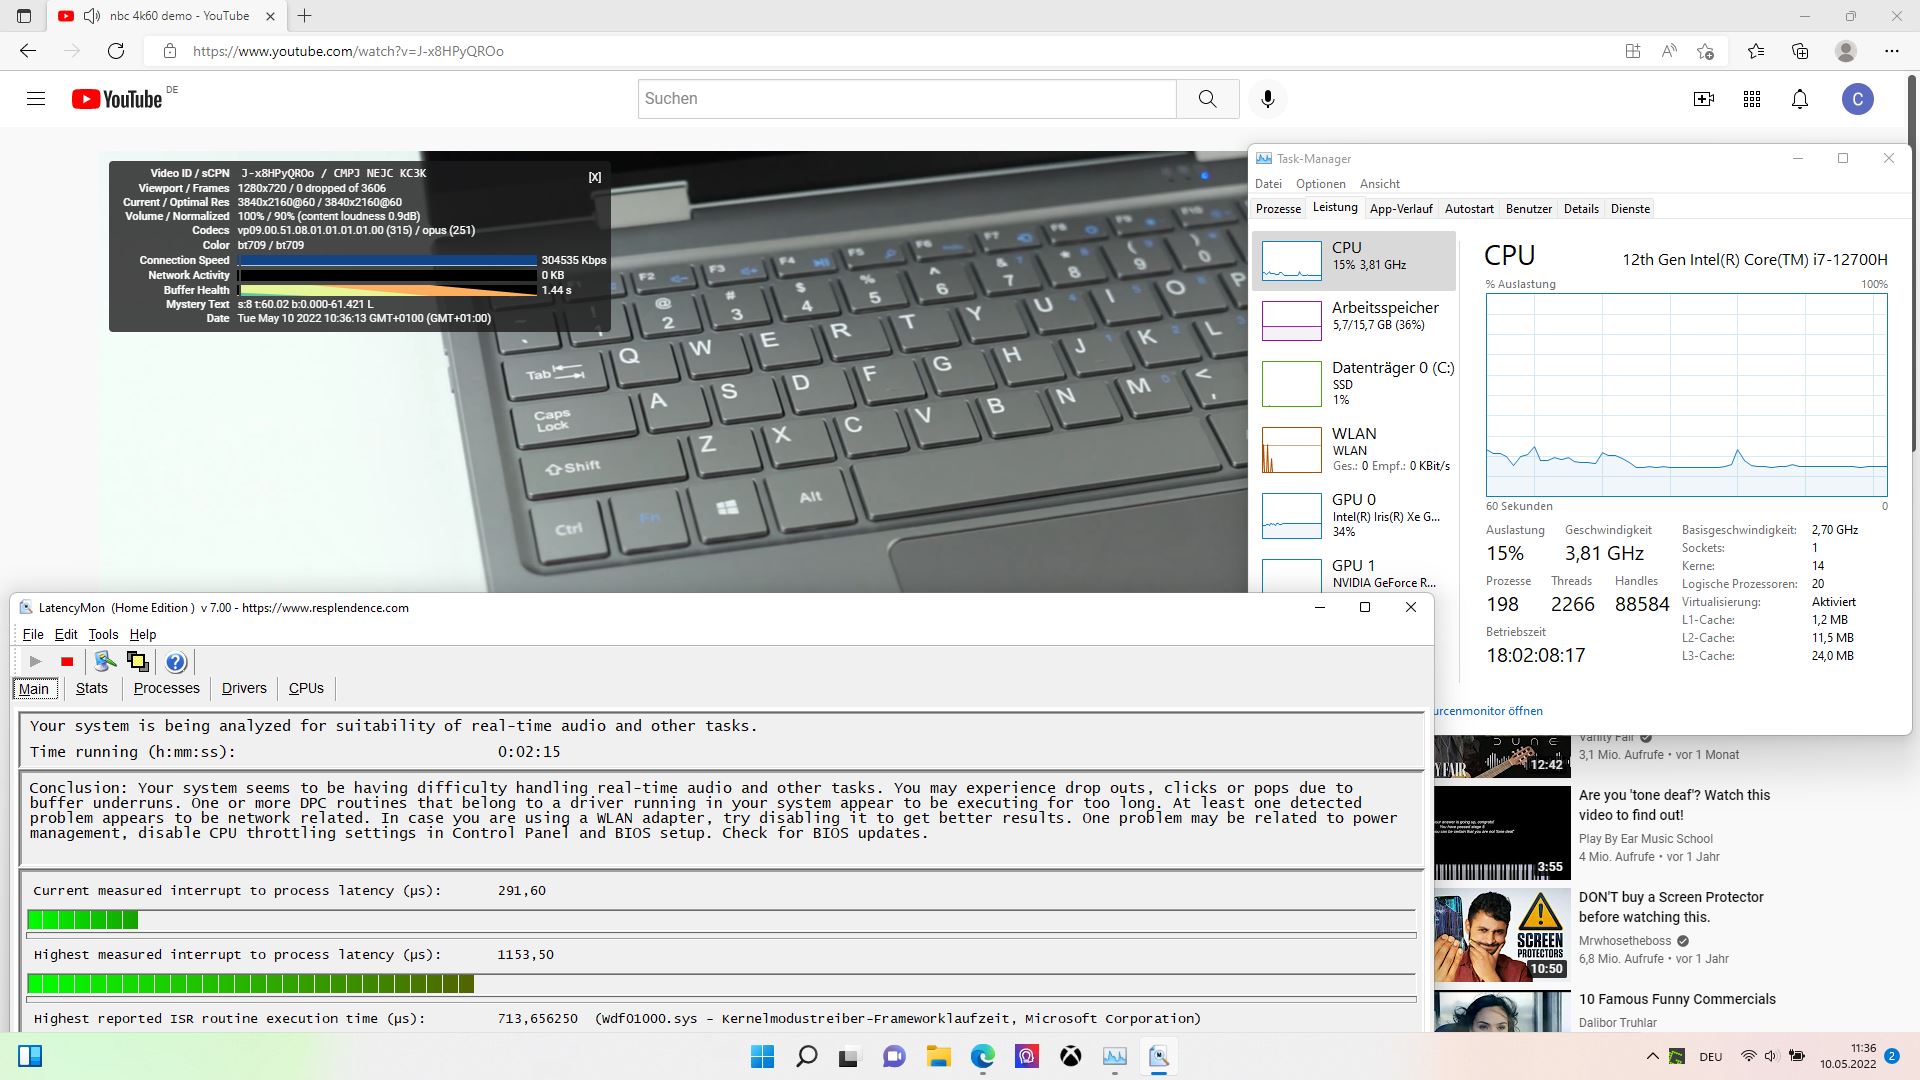
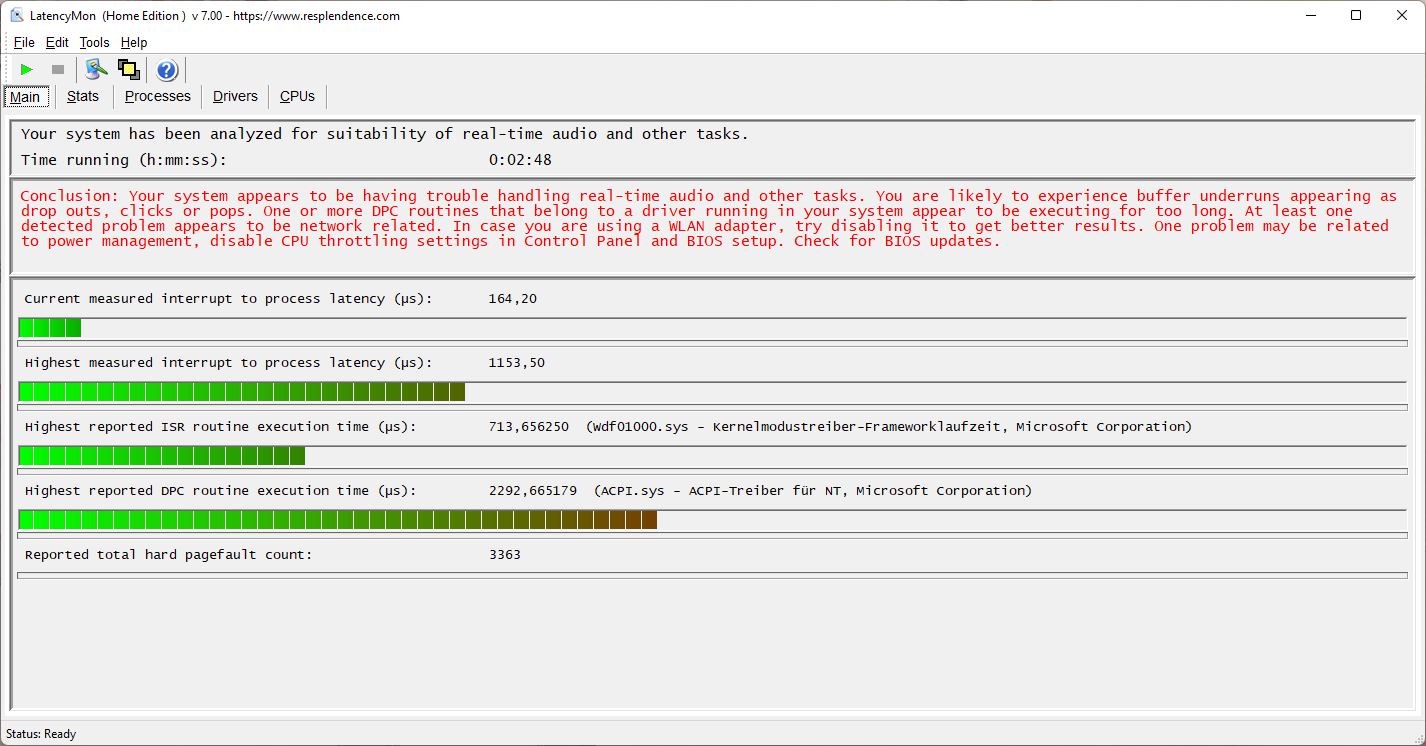
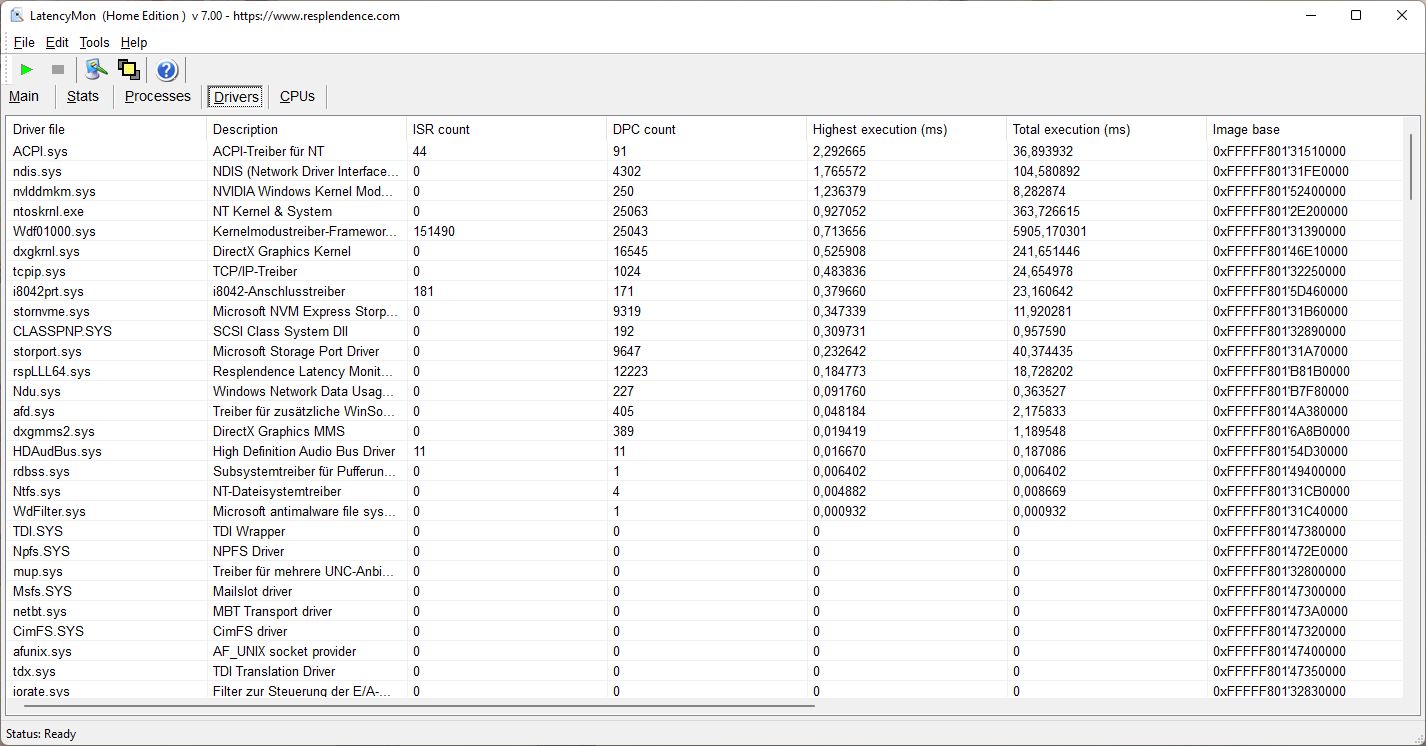
Latences DPC
Ni l'ouverture du navigateur, ni plusieurs onglets ouverts sur notre Homepage ne créent de problèmes pour le Katana. Cependant, l'outil LatencyMon montre quelques retards lors de la lecture de notre vidéo de test YouTube 4K/60-fps, mais il n'y a toujours pas d'images perdues pendant la reproduction.
| DPC Latencies / LatencyMon - interrupt to process latency (max), Web, Youtube, Prime95 | |
| MSI Katana GF76 11UE | |
| MSI Vector GP66 12UGS | |
| Aorus 17 XE4 | |
| MSI Katana GF76 12UGS | |
| Razer Blade 17 (i7-12800H, RTX 3070 Ti) | |
| Lenovo Legion 5 Pro 16 G7 i7 RTX 3070Ti | |
* ... Moindre est la valeur, meilleures sont les performances
Solution de stockage
MSI utilise un SSD NVMe de Micron de 1 To. Bien que le stockage soit déjà connecté via PCIe 4.0, la vitesse est encore plus à un niveau élevé PCIe 3.0, de sorte que les modèles des concurrents plus chers sont souvent plus rapides. En revanche, les performances constantes sont très bonnes, terminant à une bonne 12e place dans notre liste des meilleurs périphériques de stockage.

* ... Moindre est la valeur, meilleures sont les performances
Constant Performance Reading: DiskSpd Read Loop, Queue Depth 8
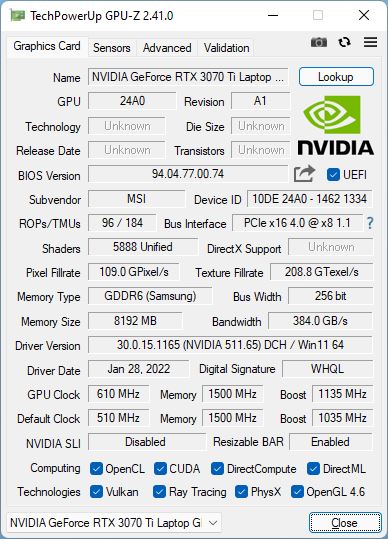
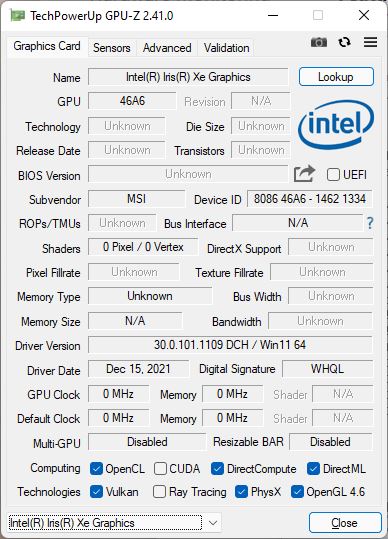
Carte graphique
Le Nvidia Geforce RTX 3070 Ti est l'un des GPU mobiles les plus puissants et devrait vraiment être capable de jouer à tous les jeux actuels sans problème. Cependant, dans le Katana, son TGP est limité à seulement 100 watts, alors que certains de ses concurrents atteignent ici 150 watts. Les performances graphiques devraient s'en trouver réduites d'autant.
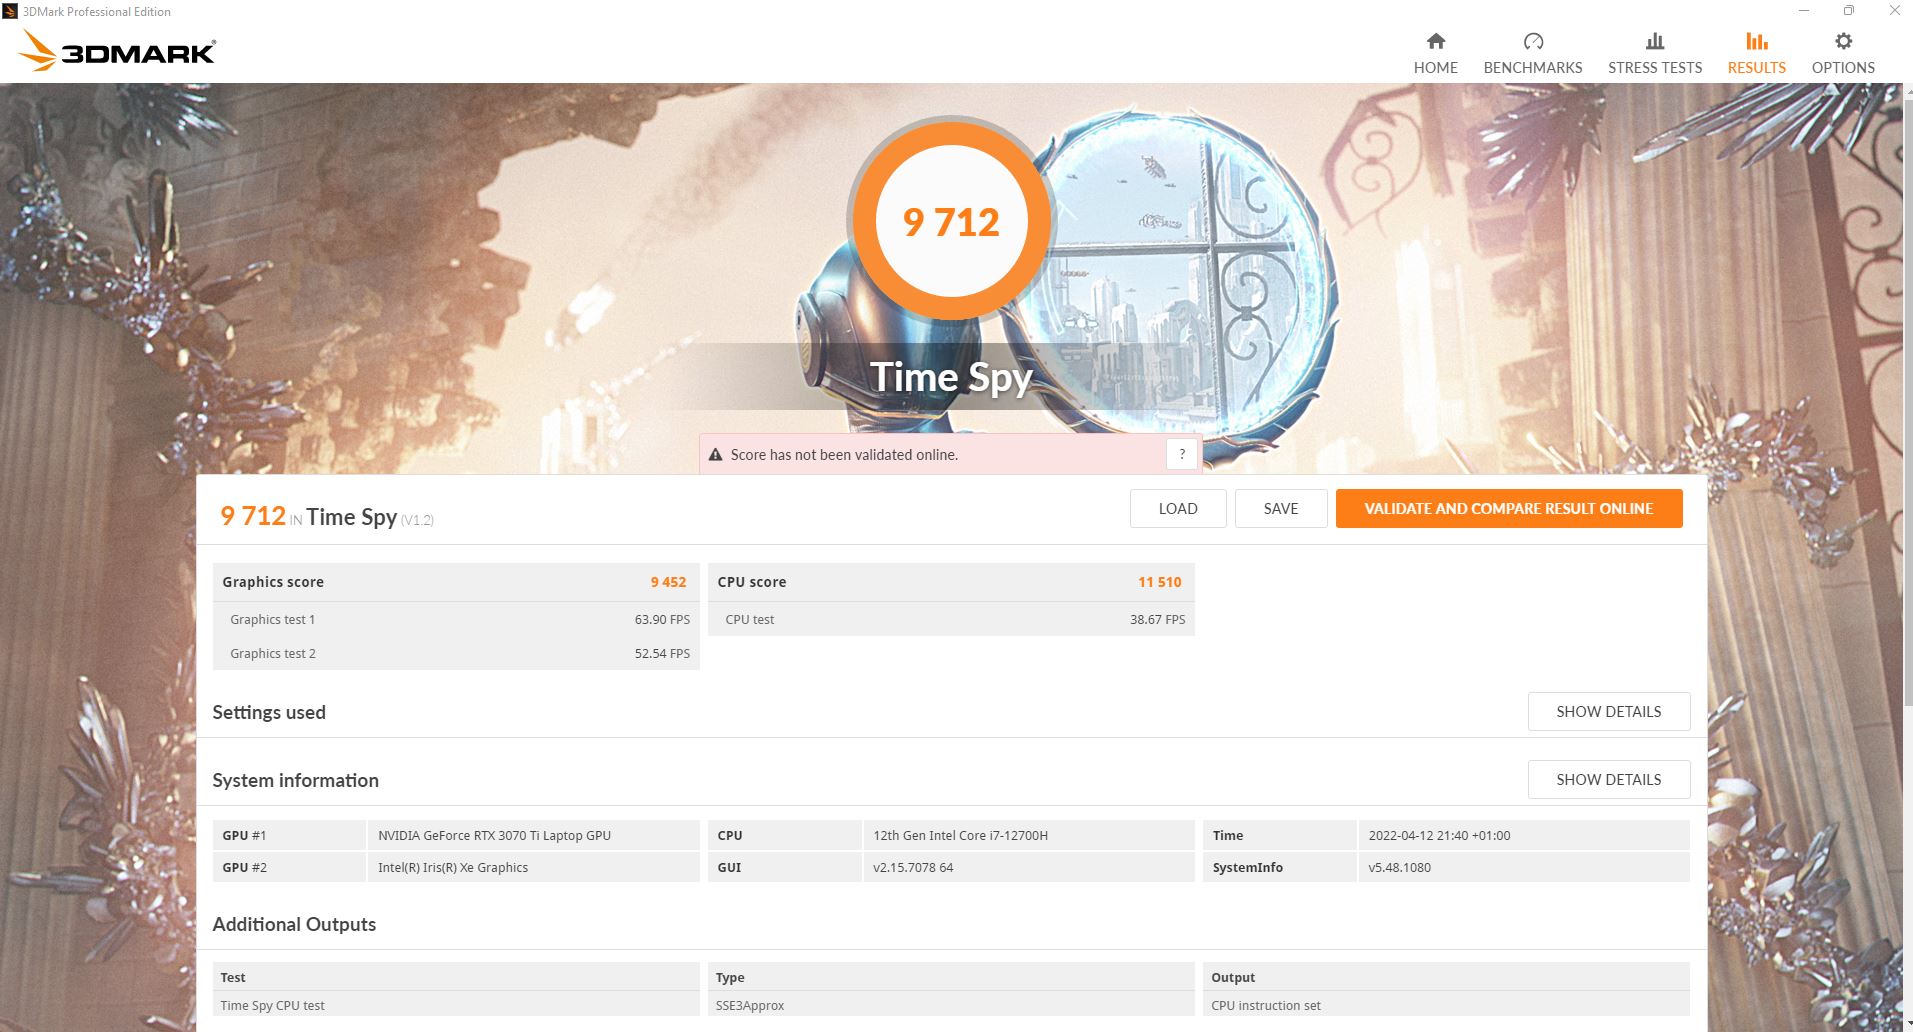
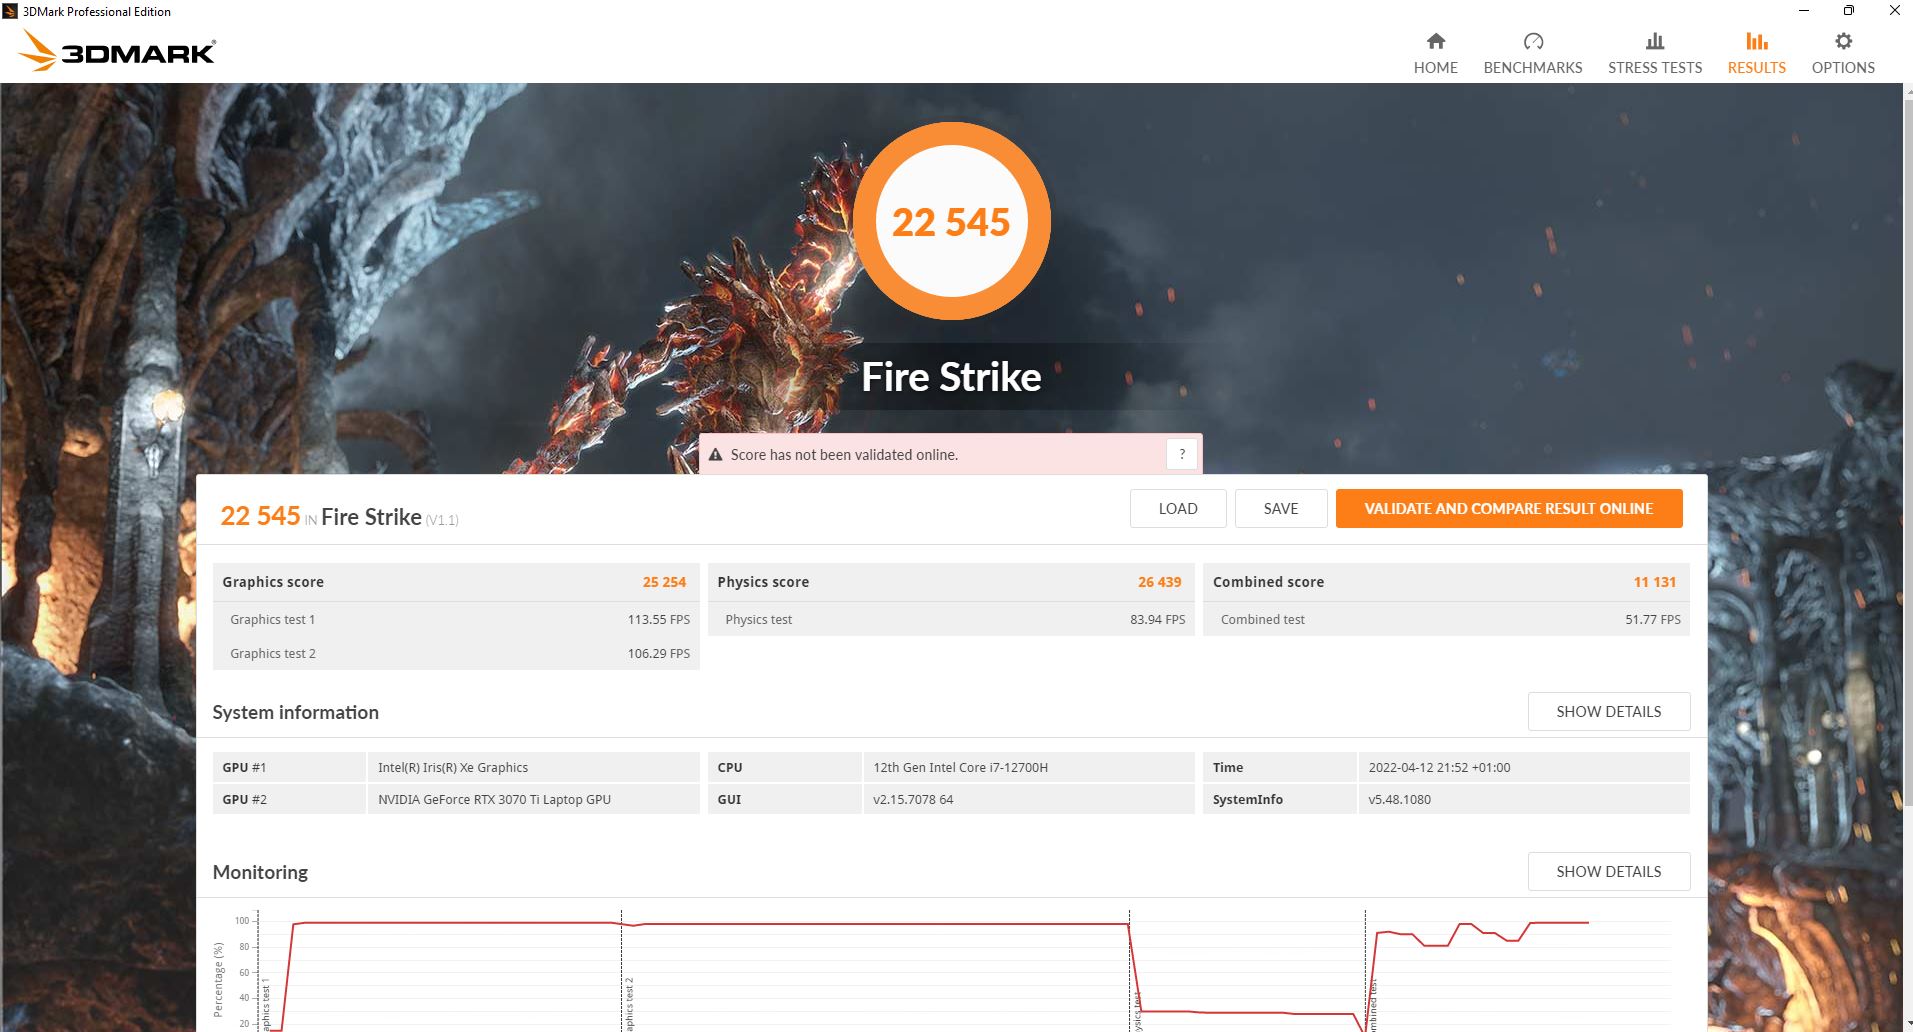
Dans les tests synthétiques 3DMark, la Katana termine légèrement en dessous de la moyenne, environ 7 à 10% derrière une RTX 3070 Ti moyenne, ce qui devrait être dû à la TGP inférieure.
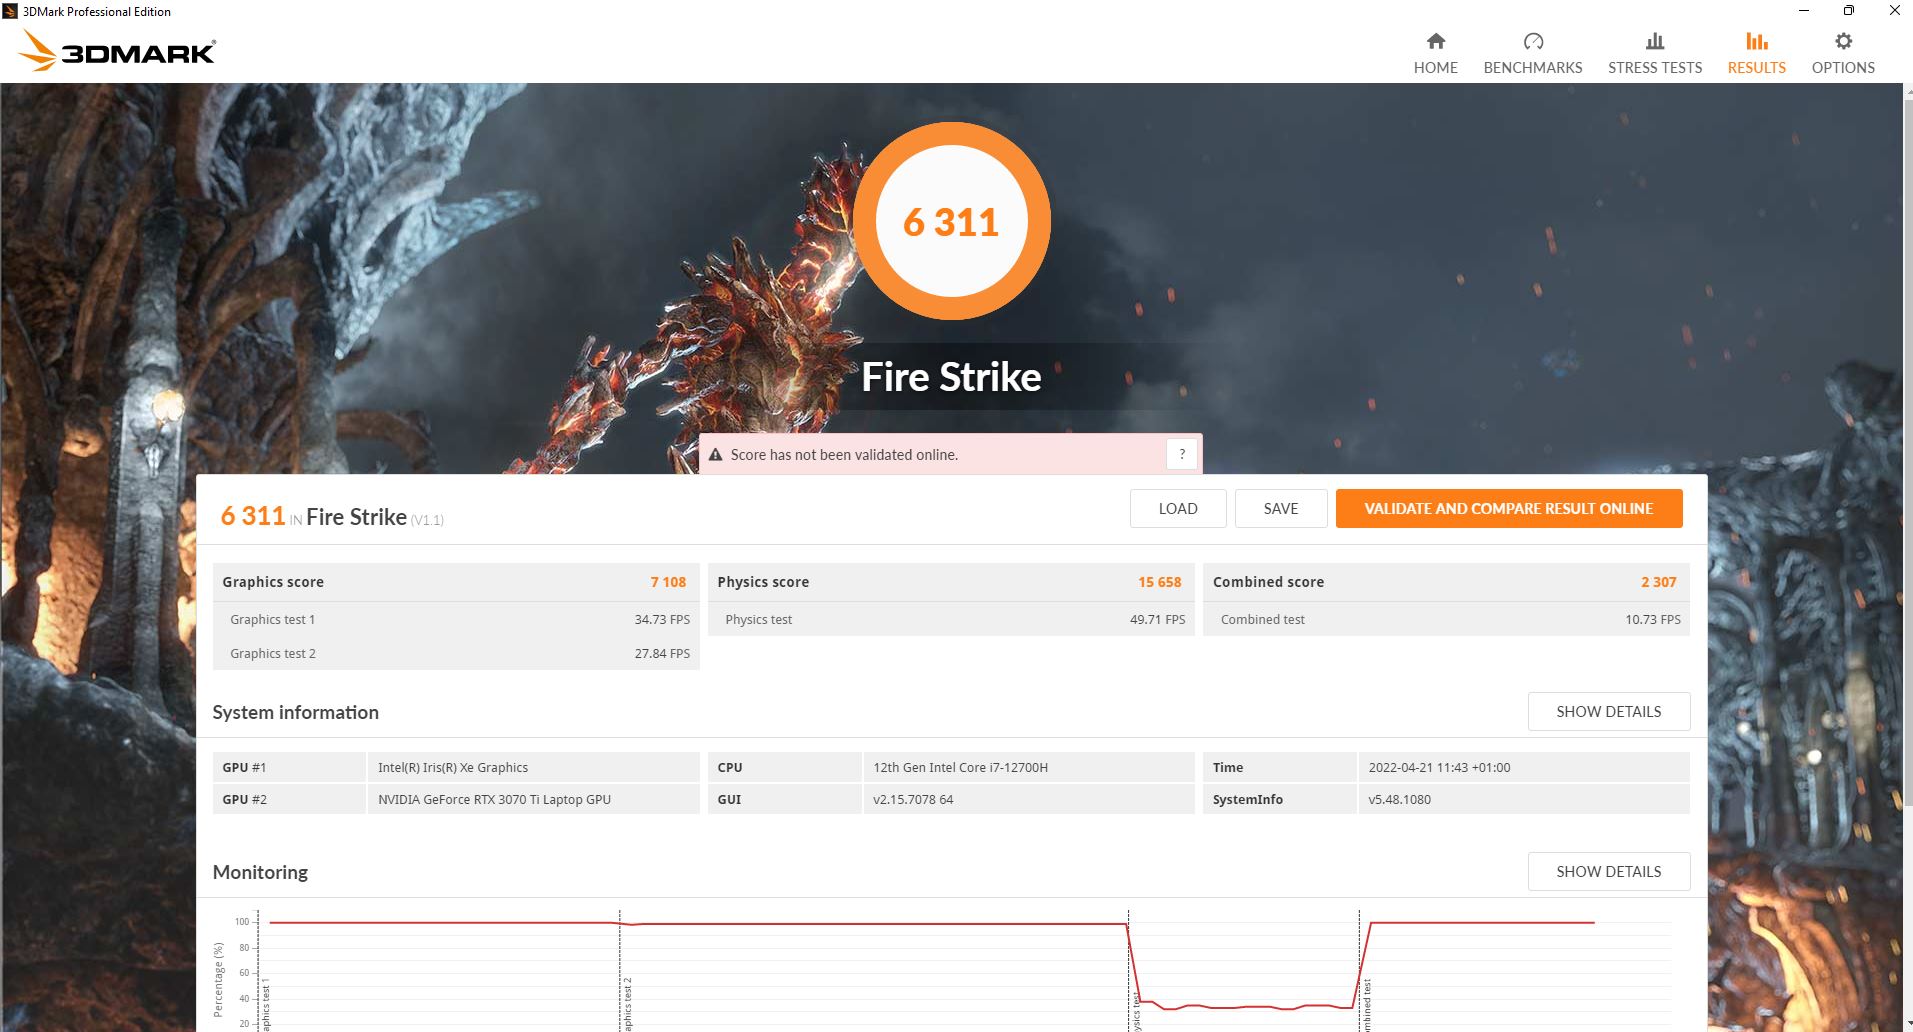
En mode batterie, les performances 3D sont réduites de plus de 70%, comme le montre une autre exécution de Fire Strike.
| 3DMark 11 Performance | 14168 points | |
| 3DMark Cloud Gate Standard Score | 28010 points | |
| 3DMark Fire Strike Score | 22545 points | |
| 3DMark Time Spy Score | 9712 points | |
Aide | ||
Performances en matière de jeux
Dans la résolution native FHD, presque tous les jeux sont également reproduits sans problème avec les paramètres de détail maximum. Cependant, dans"Cyberpunk 2077 1.5", les choses peuvent déjà devenir serrées par moments pour les effets de raytracing, et le taux de trame tombe d'environ 48,5 fps à seulement 28,5 fps avec Raytracing Ultra activé
Dans l'ensemble, la RTX 3070 Ti du Katana a des performances inférieures d'environ 10% à la moyenne de tous les ordinateurs portables équipés du même GPU dans notre base de données. Compte tenu des performances d'une RTX 3070 Ti, la plupart des utilisateurs devraient pouvoir s'en accommoder, mais les amateurs de performances pourraient vouloir jeter un coup d'œil aux ordinateurs portables qui ne limitent pas leur GPU à 100 watts. De cette façon, les concurrents directs sont surtout plus rapides. Le prédécesseur avec RTX 3060 est battu de "seulement" 15 à 20%. La plupart du temps, le MSI Vector est le premier en termes de performances 3D.
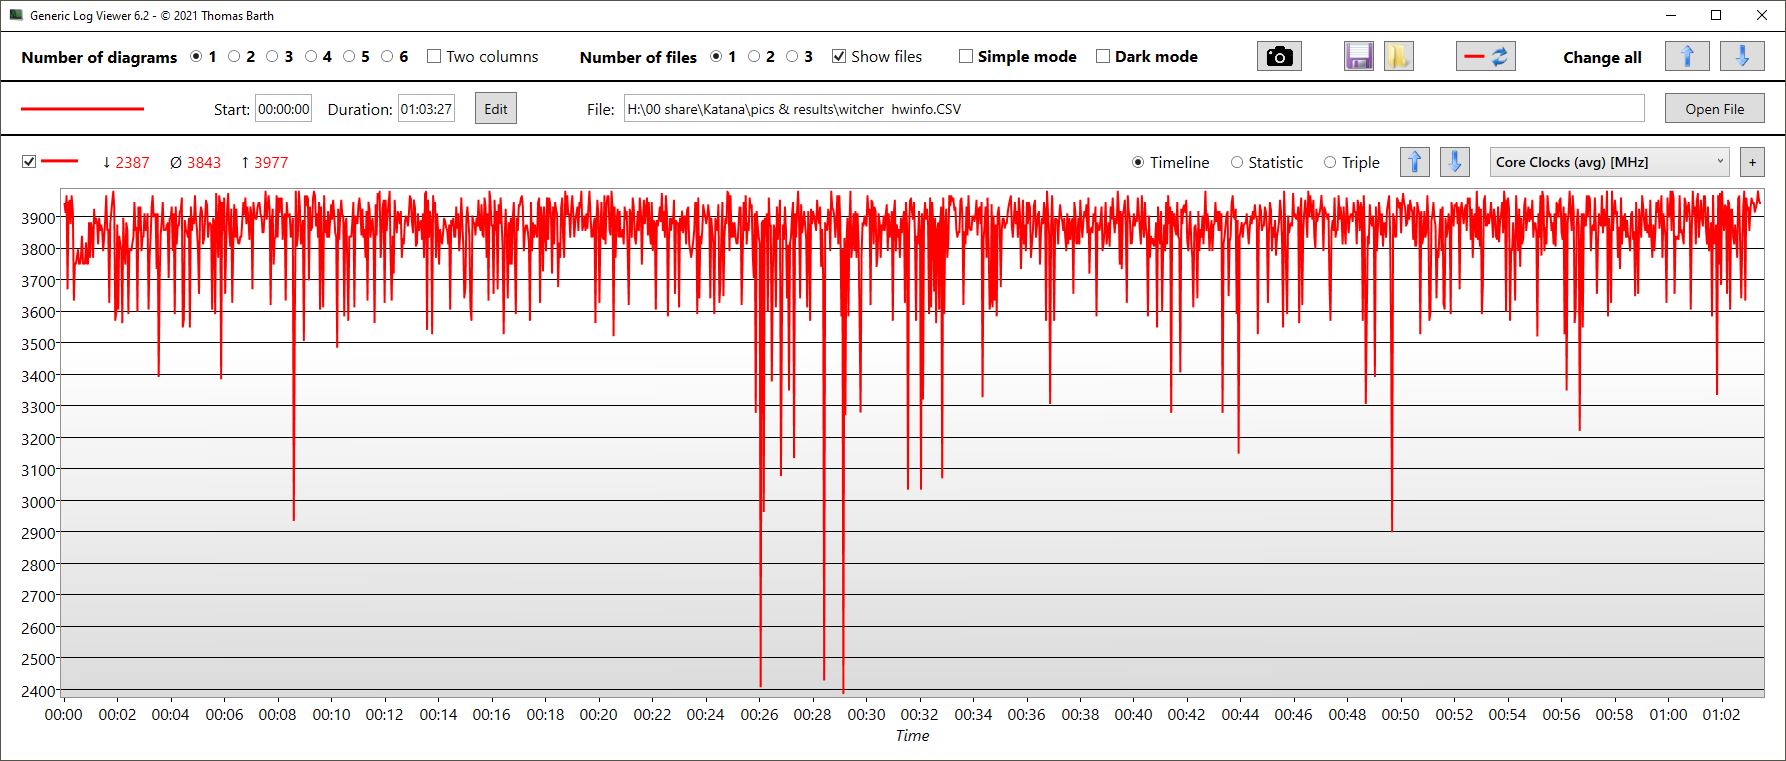
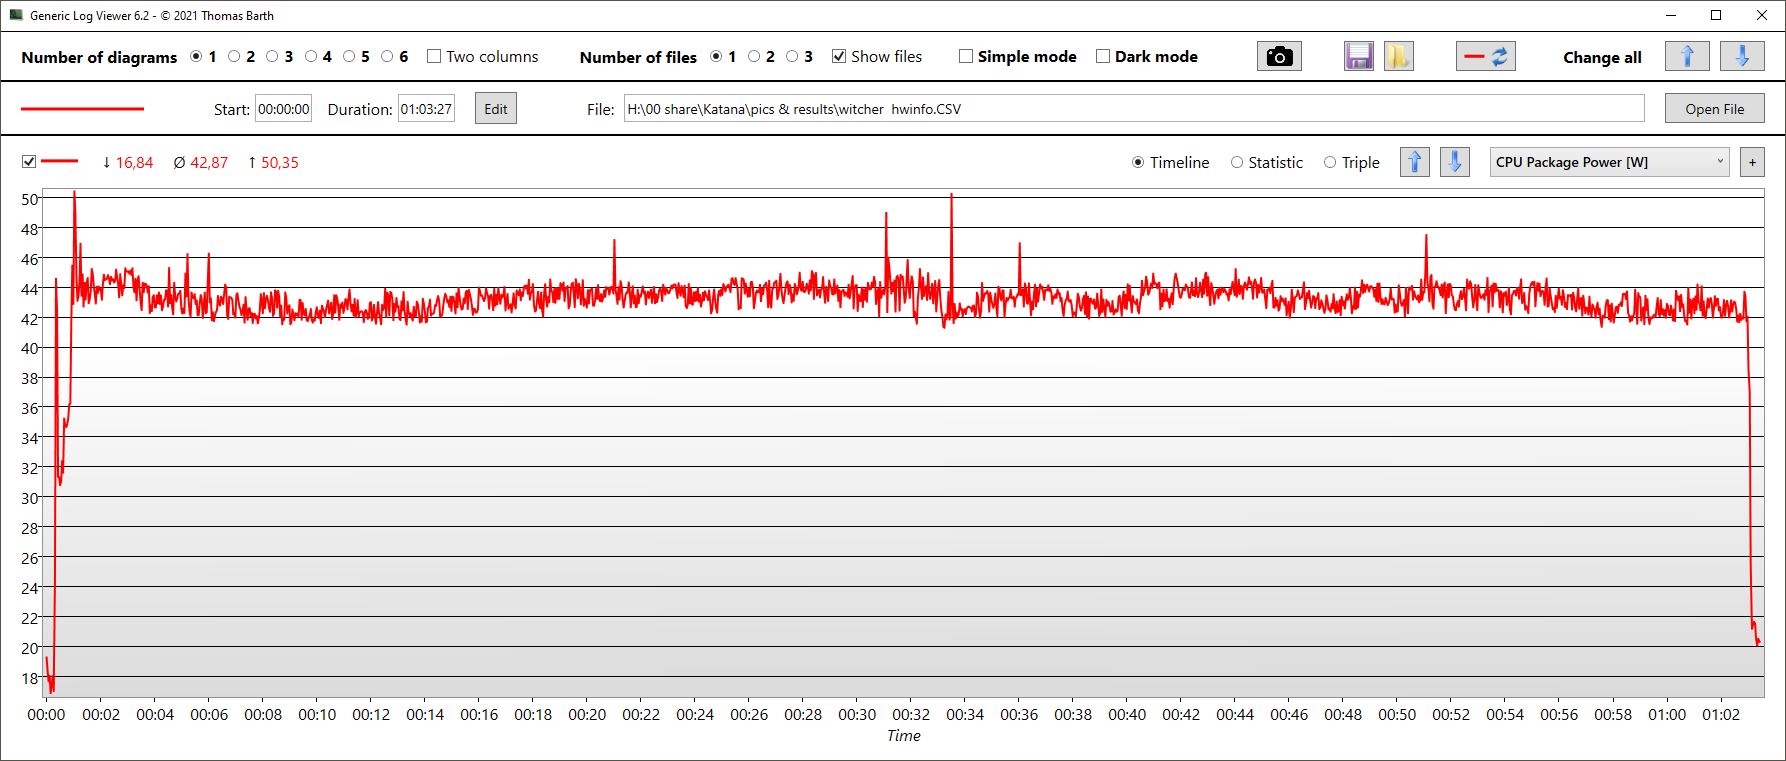
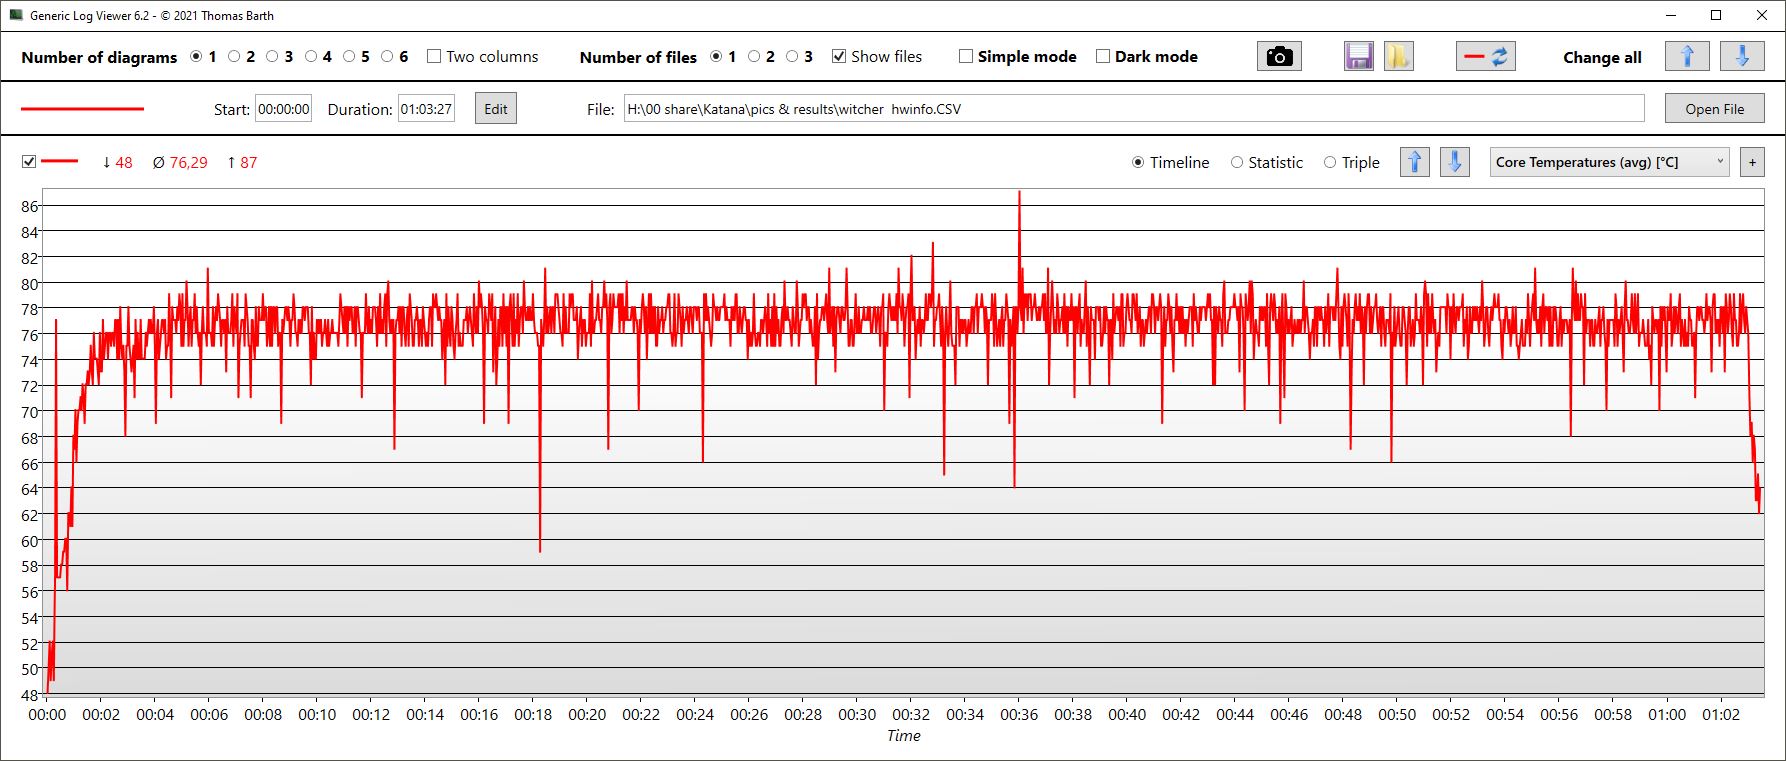
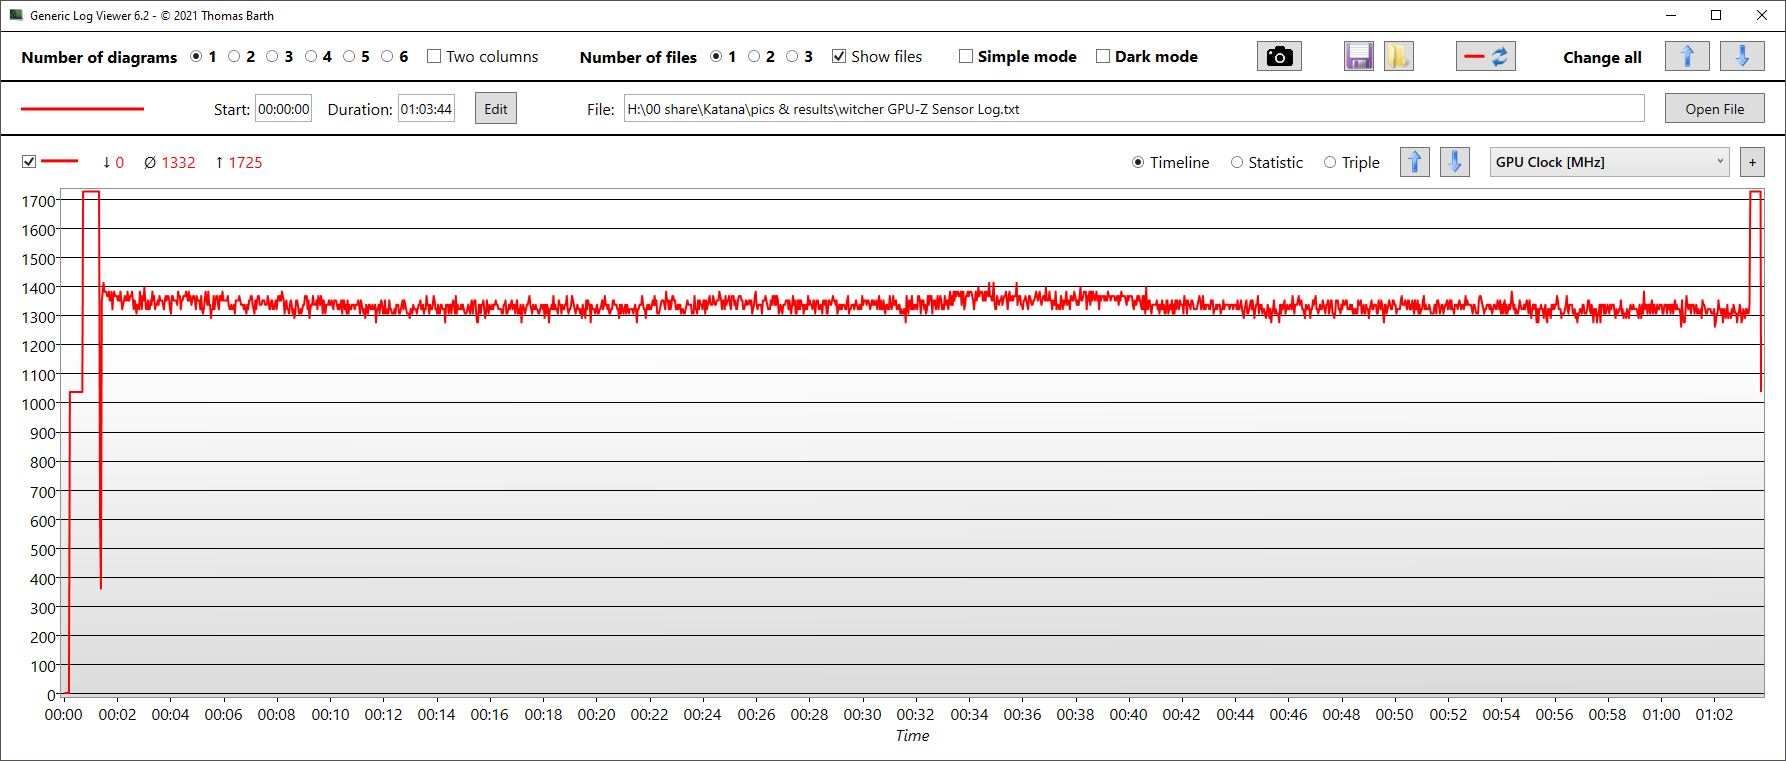
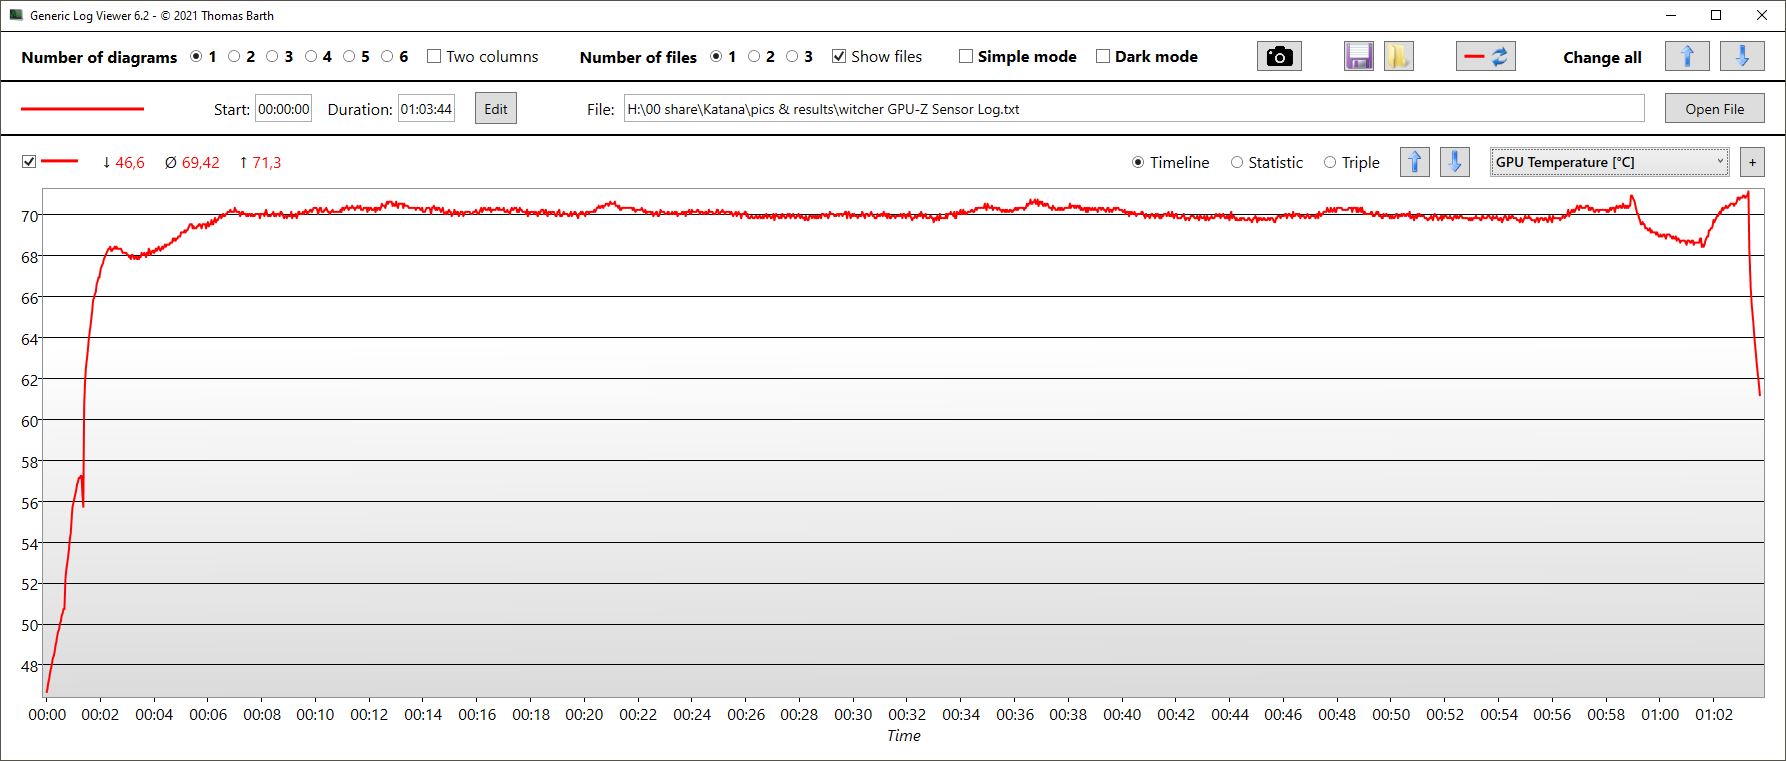
La fréquence d'images pendant l'exécution de"The Witcher 3" pendant une heure reste assez constante. Les cœurs du CPU atteignent une vitesse d'horloge de 3,8 GHz (76 °C, ~169 °F) en moyenne, et le GPU, d'environ 1,3 GHz (~70 °C, ~158 °F).
The Witcher 3 FPS Chart
| Bas | Moyen | Élevé | Ultra | |
| GTA V (2015) | 184.6 | 174.4 | 156 | 97.7 |
| The Witcher 3 (2015) | 388 | 267 | 165 | 91.5 |
| Dota 2 Reborn (2015) | 172.1 | 153.6 | 142.6 | 135.8 |
| Final Fantasy XV Benchmark (2018) | 141.1 | 119.2 | 89.7 | |
| X-Plane 11.11 (2018) | 135.9 | 115.2 | 95 | |
| Far Cry 5 (2018) | 154 | 123 | 118 | 112 |
| Strange Brigade (2018) | 425 | 224 | 183.1 | 159.5 |
| Cyberpunk 2077 1.6 (2022) | 117.5 | 98.9 | 65 | 48.5 |
Émissions - Les ventilateurs fonctionnent également au ralenti
Émissions sonores
Le système de refroidissement n'est pas réglé de manière optimale en termes de niveau sonore. Les ventilateurs s'allument même en mode veille, sans charge, en mode équilibré ou même en mode silencieux. Ils sont actifs presque constamment, variant également leur vitesse. Cela ne semble pas nécessaire et c'est ennuyeux.Blade 17par exemple, reste pratiquement silencieux en mode veille, même dans le mode de performance le plus élevé.
Le système de refroidissement plutôt sous-optimal est probablement aussi la raison pour laquelle le GPU est limité à 100 watts. Dans 3DMark06, le Katana est le modèle le plus bruyant de notre comparaison, et pendant les jeux et en termes de volume maximum, il n'est dépassé que par le Vector, qui vient également de MSI.
Degré de la nuisance sonore
| Au repos |
| 28.41 / 28.41 / 36.71 dB(A) |
| Fortement sollicité |
| 53.04 / 54.38 dB(A) |
 | ||
30 dB silencieux 40 dB(A) audible 50 dB(A) bruyant |
||
min: | ||
| MSI Katana GF76 12UGS GeForce RTX 3070 Ti Laptop GPU, i7-12700H, Micron 2450 1TB MTFDKBK1T0TFK | MSI Katana GF76 11UE GeForce RTX 3060 Laptop GPU, i7-11800H, Kingston OM8PCP3512F-AB | Aorus 17 XE4 GeForce RTX 3070 Ti Laptop GPU, i7-12700H, Gigabyte AG470S1TB-SI B10 | Razer Blade 17 (i7-12800H, RTX 3070 Ti) GeForce RTX 3070 Ti Laptop GPU, i7-12800H, Samsung PM9A1 MZVL21T0HCLR | Lenovo Legion 5 Pro 16 G7 i7 RTX 3070Ti GeForce RTX 3070 Ti Laptop GPU, i7-12700H, Samsung PM9A1 MZVL21T0HCLR | MSI Vector GP66 12UGS GeForce RTX 3070 Ti Laptop GPU, i9-12900H | |
|---|---|---|---|---|---|---|
| Noise | -5% | 3% | 17% | 4% | 11% | |
| off / environment * | 23 | 25 -9% | 24 -4% | 23 -0% | 24.6 -7% | 22.9 -0% |
| Idle Minimum * | 28.41 | 33 -16% | 30 -6% | 23 19% | 28.4 -0% | 23.4 18% |
| Idle Average * | 28.41 | 34 -20% | 31 -9% | 23 19% | 28.4 -0% | 23.4 18% |
| Idle Maximum * | 36.71 | 35 5% | 34 7% | 23 37% | 28.4 23% | 27.4 25% |
| Load Average * | 53.04 | 53 -0% | 44 17% | 36.92 30% | 49.4 7% | 36 32% |
| Witcher 3 ultra * | 54.22 | 49 10% | 51 6% | 50 8% | 49.4 9% | 58.2 -7% |
| Load Maximum * | 54.38 | 57 -5% | 49 10% | 50 8% | 54.7 -1% | 58 -7% |
* ... Moindre est la valeur, meilleures sont les performances
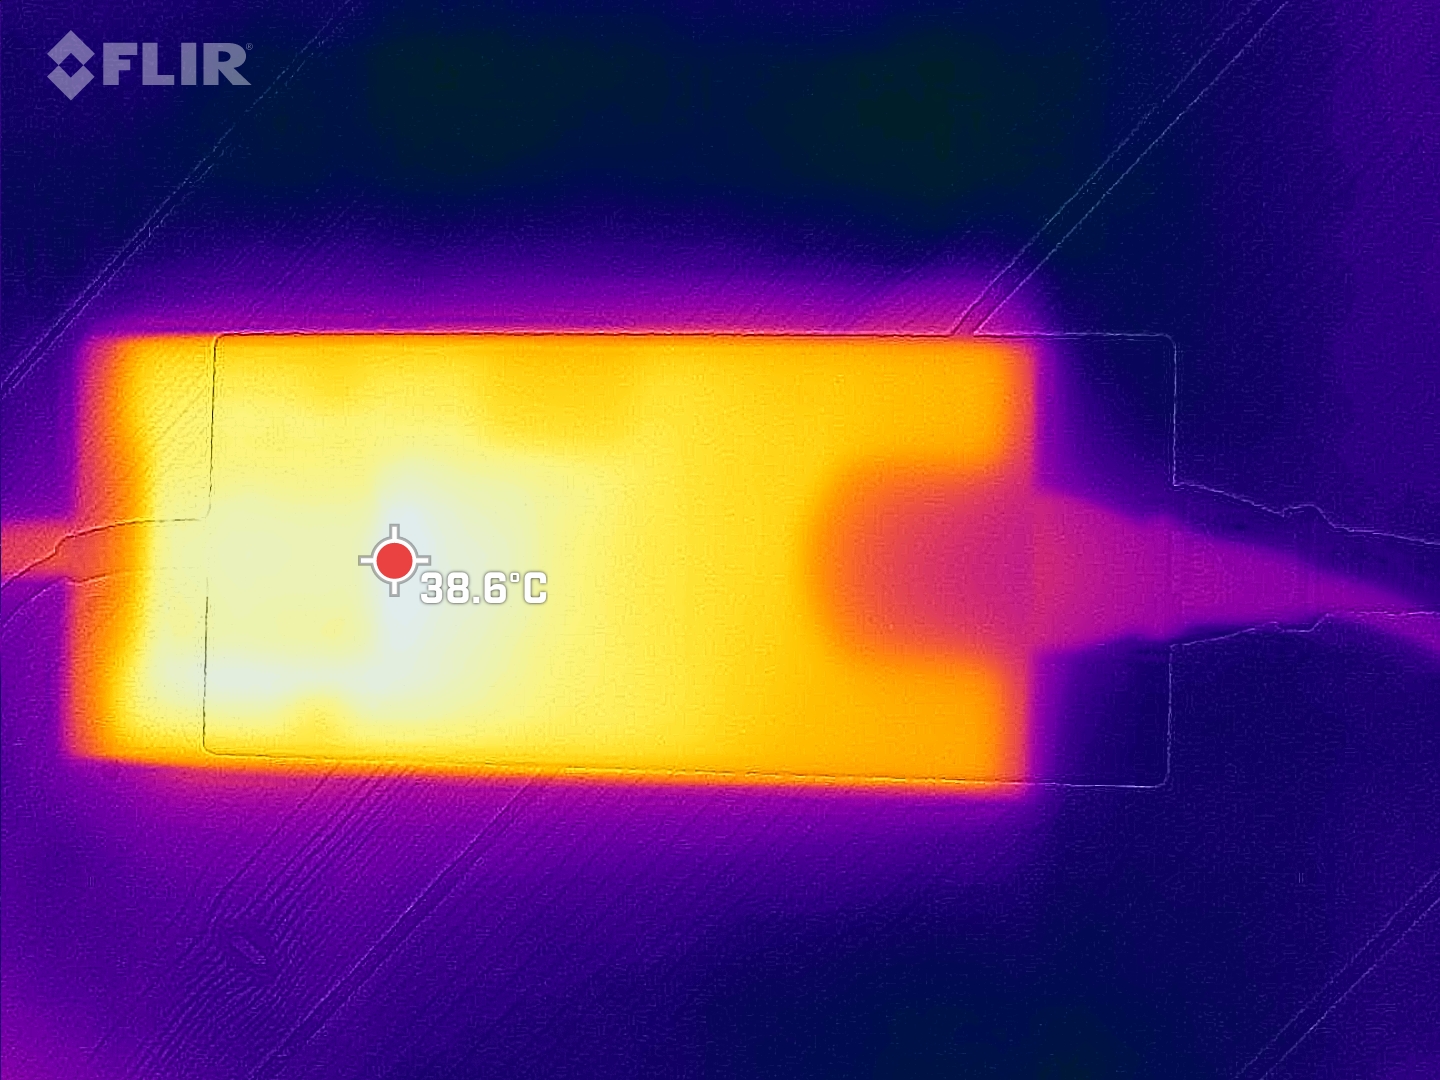
Température
Malgré le fait que les ventilateurs s'allument sporadiquement, le Katana est déjà plus chaud que ses concurrents en mode ralenti, jusqu'à 37 °C (~99 °F). En charge, la Blade 17 et la MSI Vector restent plus froides que la Katana, malgré leurs performances supérieures. L'Aorus et le Legion sont tout aussi chauds.
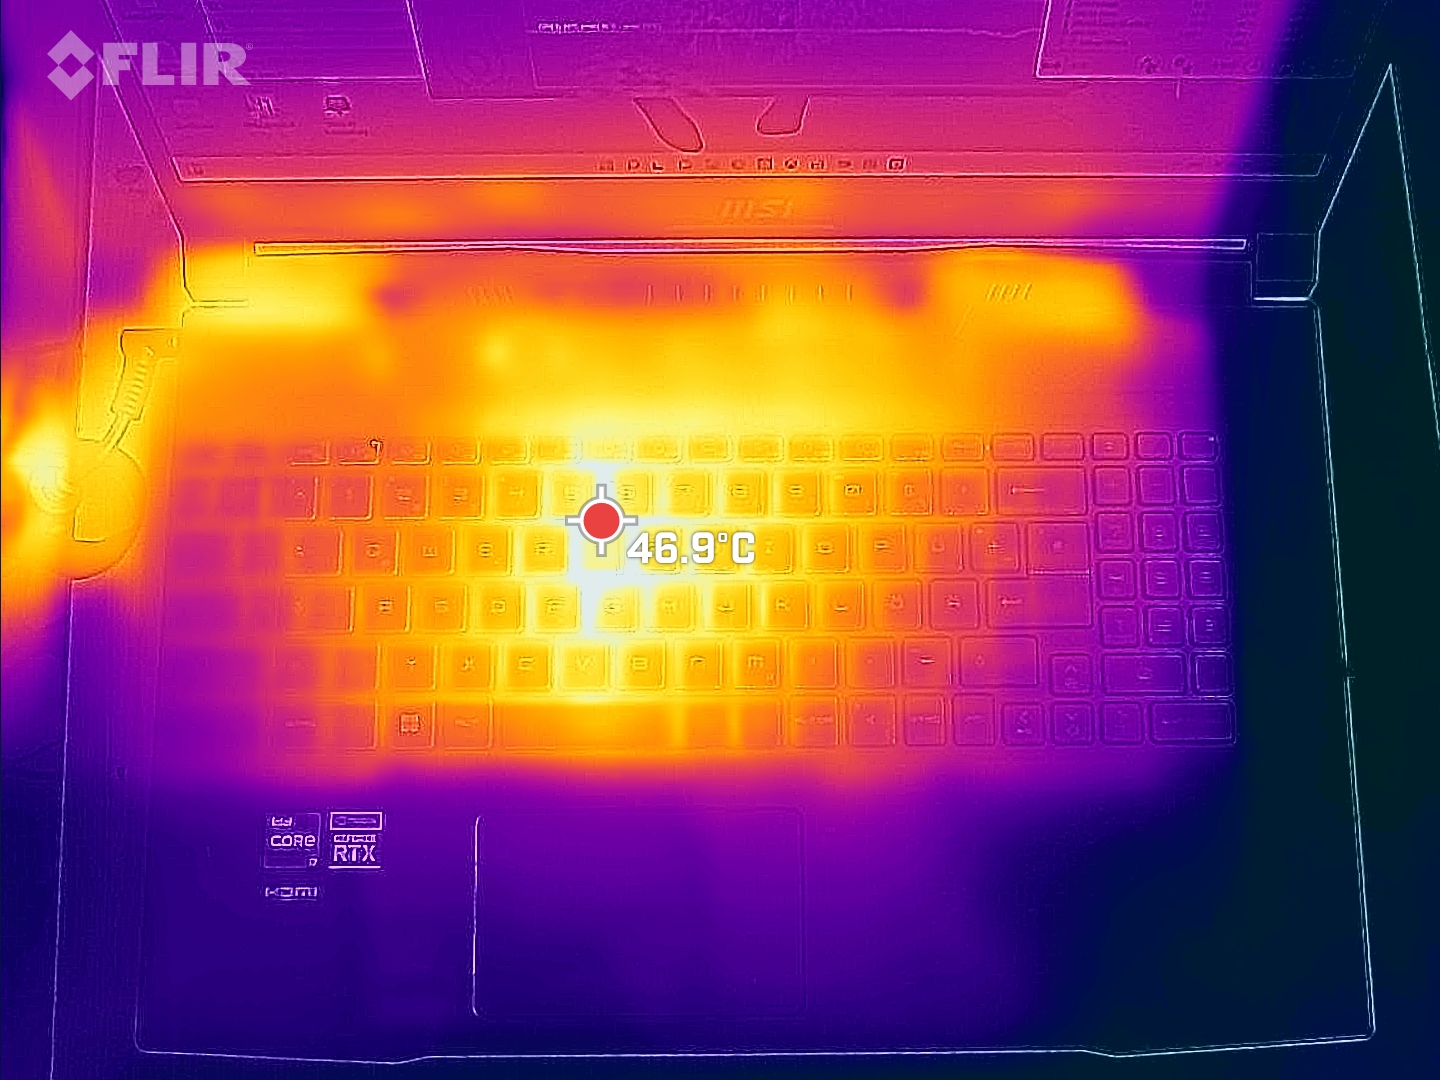
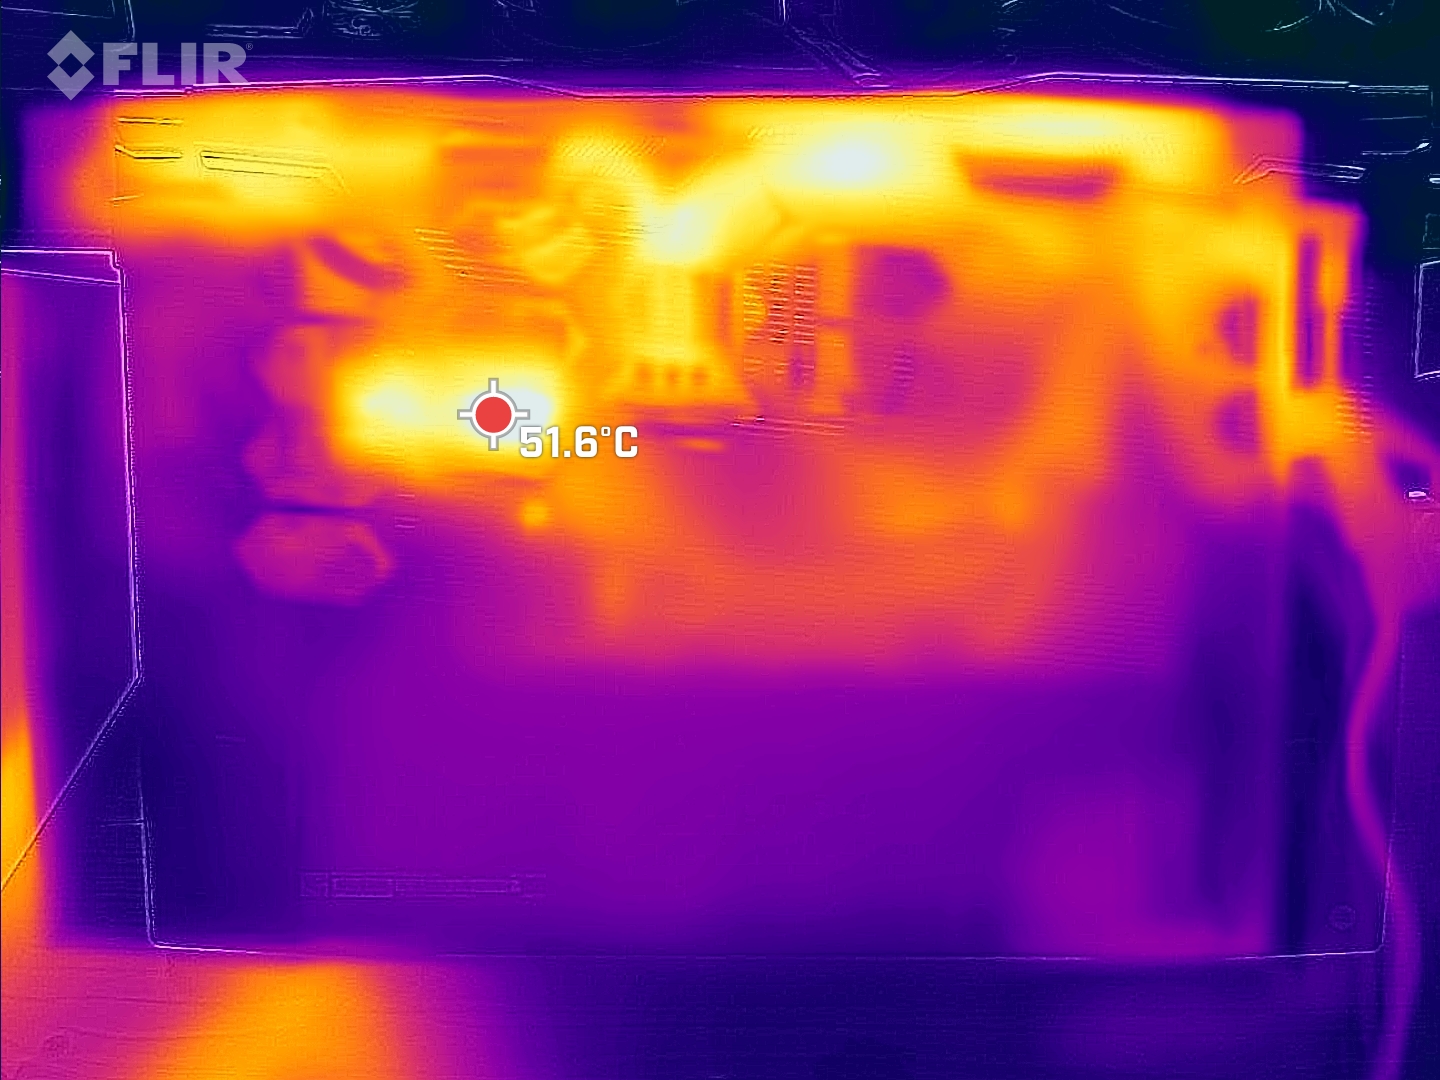
Les points chauds, qui sont situés au centre ainsi que vers l'écran, peuvent atteindre jusqu'à 55 °C (131 °F).
(-) La température maximale du côté supérieur est de 51 °C / 124 F, par rapport à la moyenne de 40.4 °C / 105 F, allant de 21.2 à 68.8 °C pour la classe Gaming.
(-) Le fond chauffe jusqu'à un maximum de 55 °C / 131 F, contre une moyenne de 43.2 °C / 110 F
(+) En utilisation inactive, la température moyenne du côté supérieur est de 30.7 °C / 87 F, par rapport à la moyenne du dispositif de 33.8 °C / 93 F.
(+) Les repose-poignets et le pavé tactile sont plus froids que la température de la peau avec un maximum de 26 °C / 78.8 F et sont donc froids au toucher.
(+) La température moyenne de la zone de l'appui-paume de dispositifs similaires était de 28.9 °C / 84 F (+2.9 °C / #5.2 F).
| MSI Katana GF76 12UGS Intel Core i7-12700H, NVIDIA GeForce RTX 3070 Ti Laptop GPU | MSI Katana GF76 11UE Intel Core i7-11800H, NVIDIA GeForce RTX 3060 Laptop GPU | Aorus 17 XE4 Intel Core i7-12700H, NVIDIA GeForce RTX 3070 Ti Laptop GPU | Razer Blade 17 (i7-12800H, RTX 3070 Ti) Intel Core i7-12800H, NVIDIA GeForce RTX 3070 Ti Laptop GPU | Lenovo Legion 5 Pro 16 G7 i7 RTX 3070Ti Intel Core i7-12700H, NVIDIA GeForce RTX 3070 Ti Laptop GPU | MSI Vector GP66 12UGS Intel Core i9-12900H, NVIDIA GeForce RTX 3070 Ti Laptop GPU | |
|---|---|---|---|---|---|---|
| Heat | 11% | 8% | 15% | 10% | 13% | |
| Maximum Upper Side * | 51 | 51 -0% | 50 2% | 43 16% | 45.3 11% | 40.2 21% |
| Maximum Bottom * | 55 | 52 5% | 58 -5% | 44 20% | 61.2 -11% | 43.8 20% |
| Idle Upper Side * | 37 | 32 14% | 30 19% | 32 14% | 28.6 23% | 34.8 6% |
| Idle Bottom * | 38 | 29 24% | 32 16% | 34 11% | 31.4 17% | 37 3% |
* ... Moindre est la valeur, meilleures sont les performances
Test de stress
Les cœurs du CPU démarrent notre test de stress à environ 4 GHz. Cependant, ils ne le maintiennent que très brièvement, car après quelques secondes, les cœurs dépassent déjà la limite thermique à plus de 90 °C (194 °F), ce qui fait chuter la vitesse d'horloge par la suite, pour finalement se stabiliser entre 2 et 2,4 GHz. Les températures se situent en moyenne autour de 81 °C (178 °F).
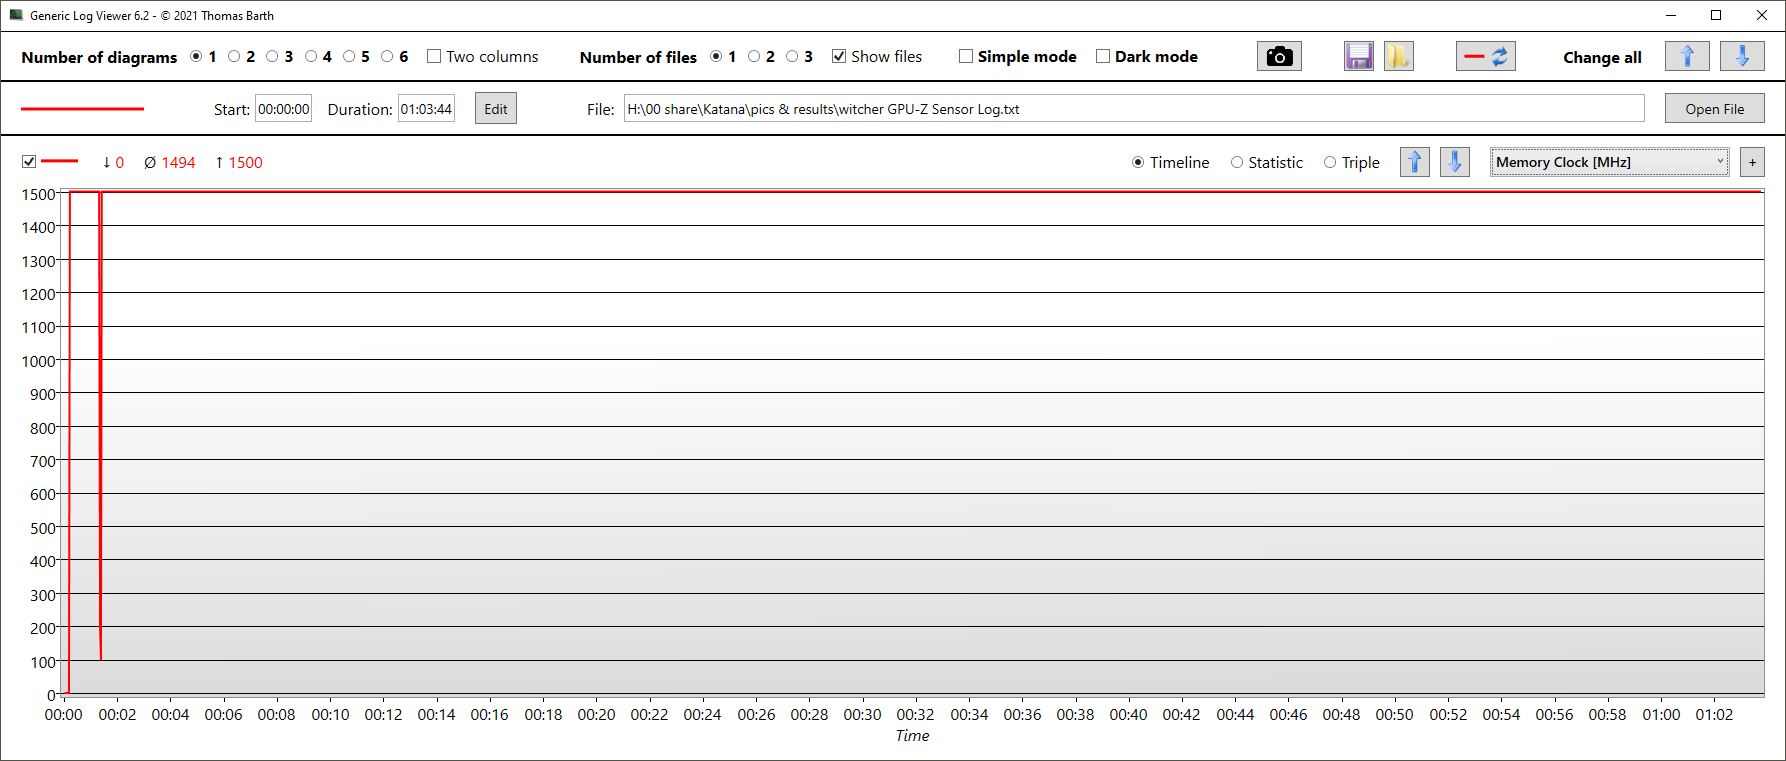
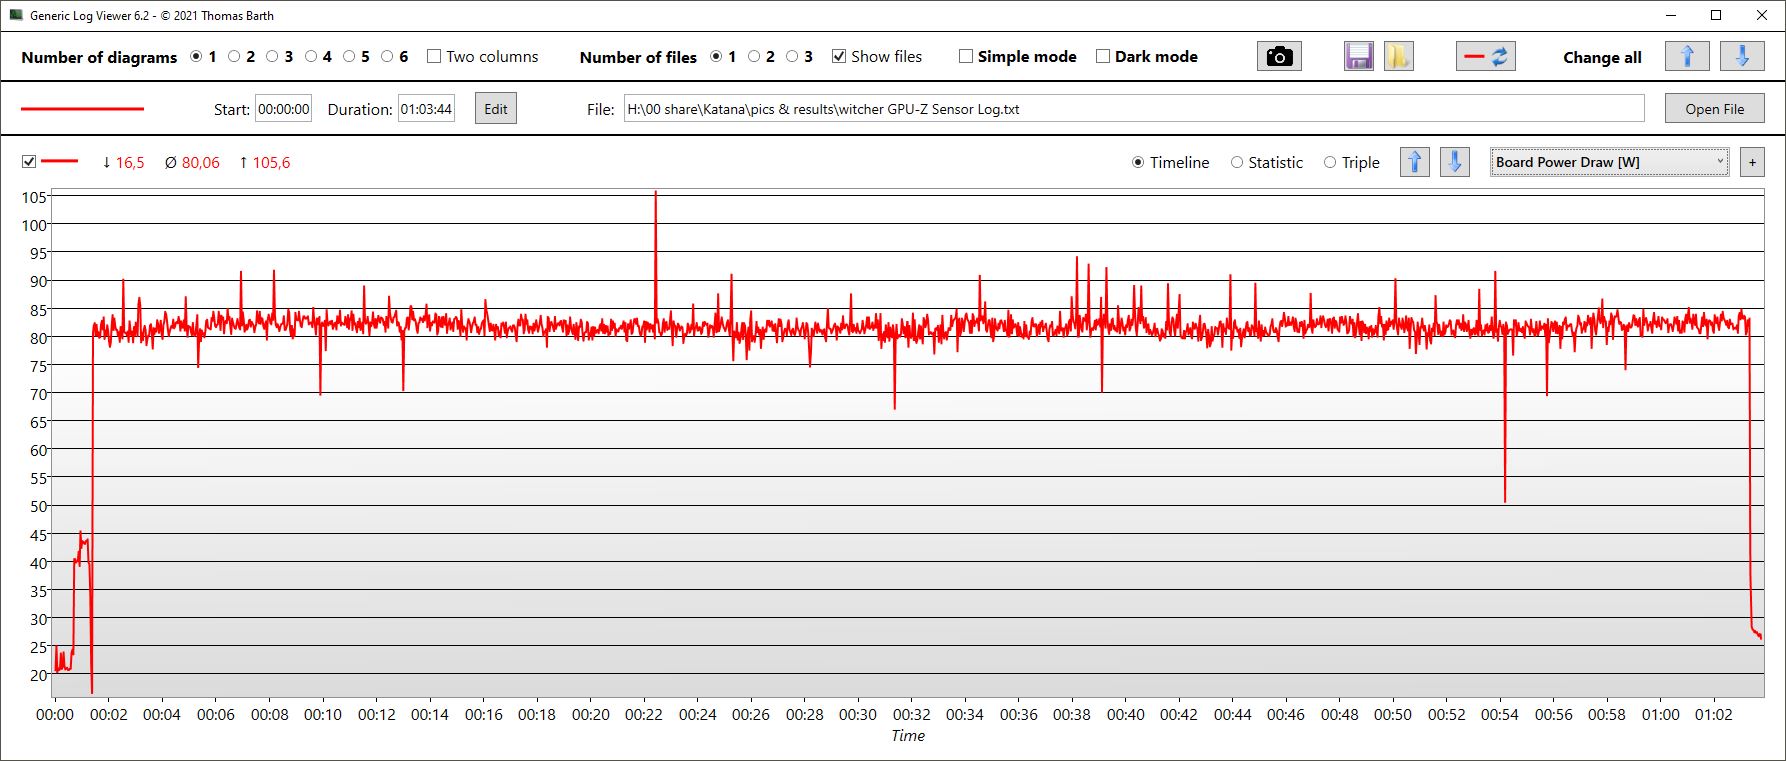
D'autre part, pendant toute la durée du test, la vitesse d'horloge du GPU varie continuellement entre 800 et 1600 MHz, et la vitesse de stockage, seulement entre 1,4 et 1,5 GHz. Les températures du noyau tournent autour de 70 °C (158 °F). La carte graphique consomme environ 71 watts en moyenne, n'atteignant les 100 watts spécifiés que sporadiquement dans le meilleur des cas.
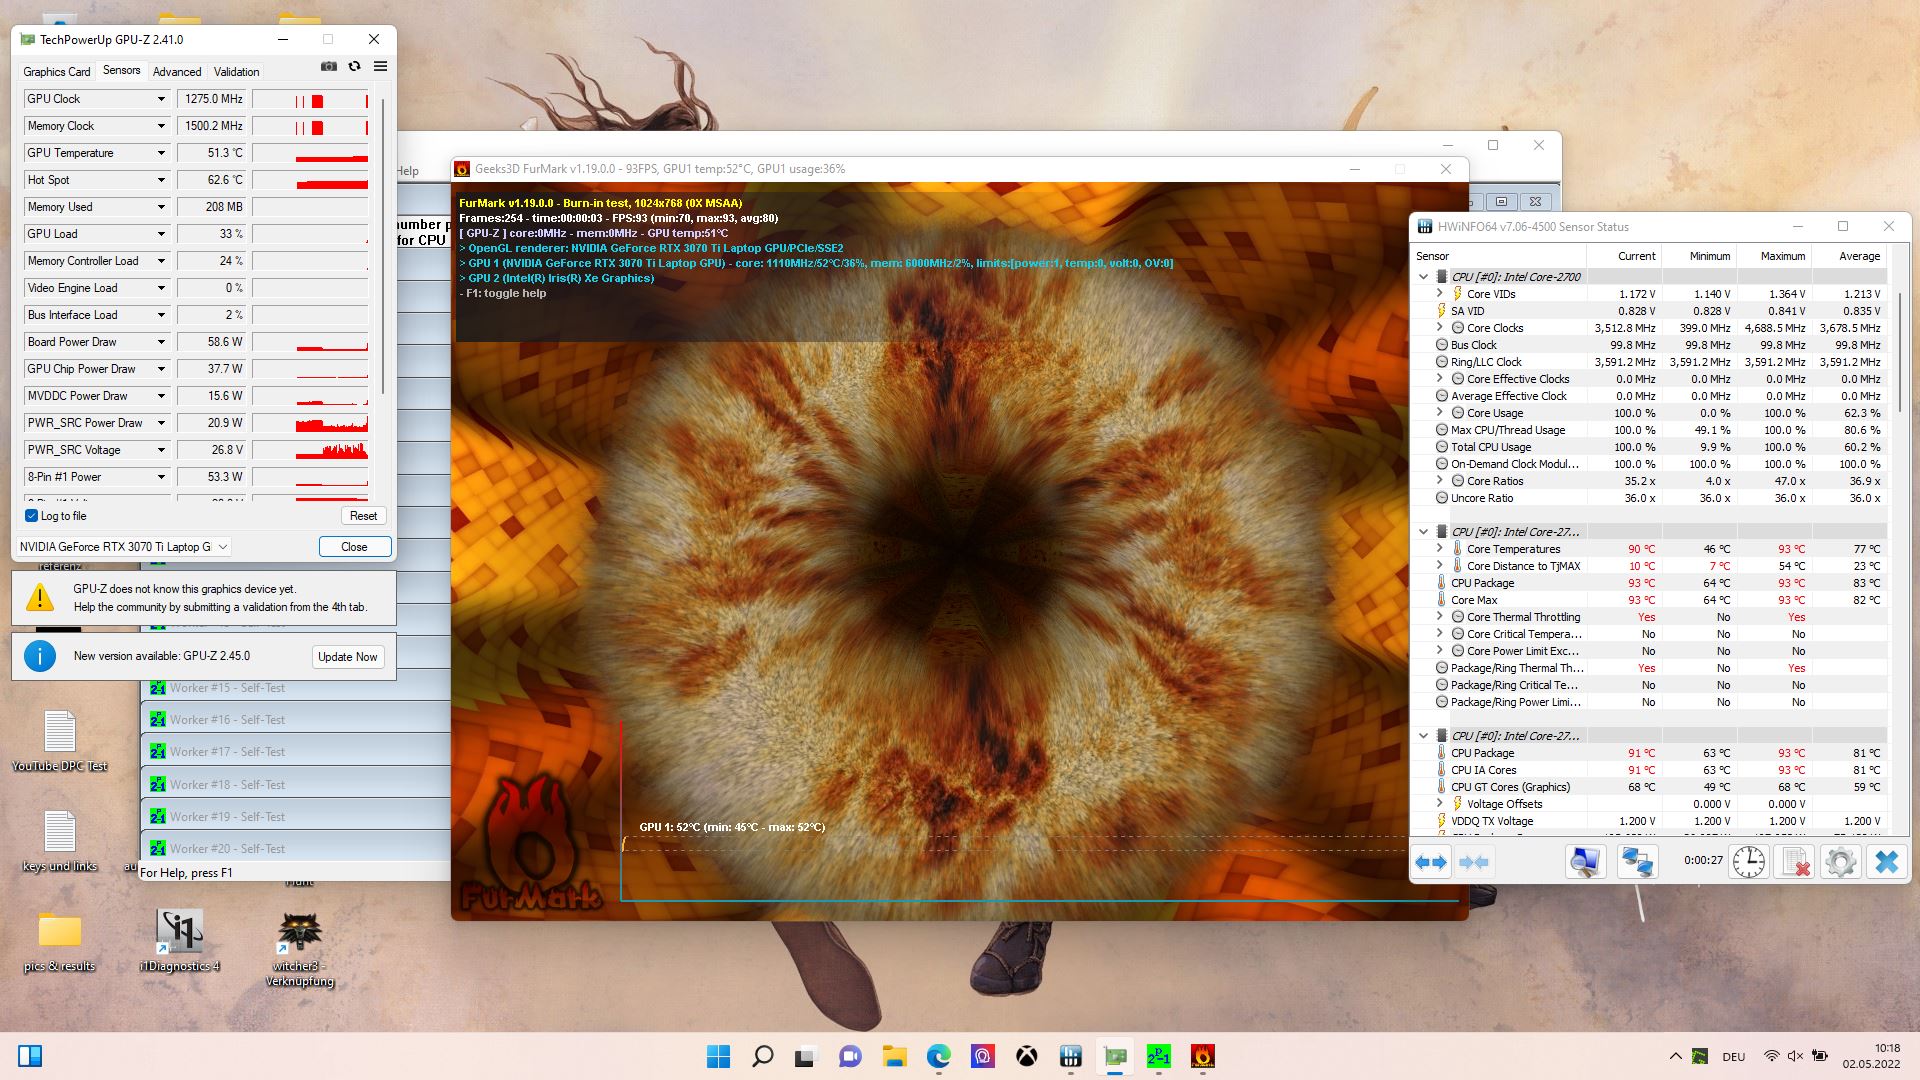
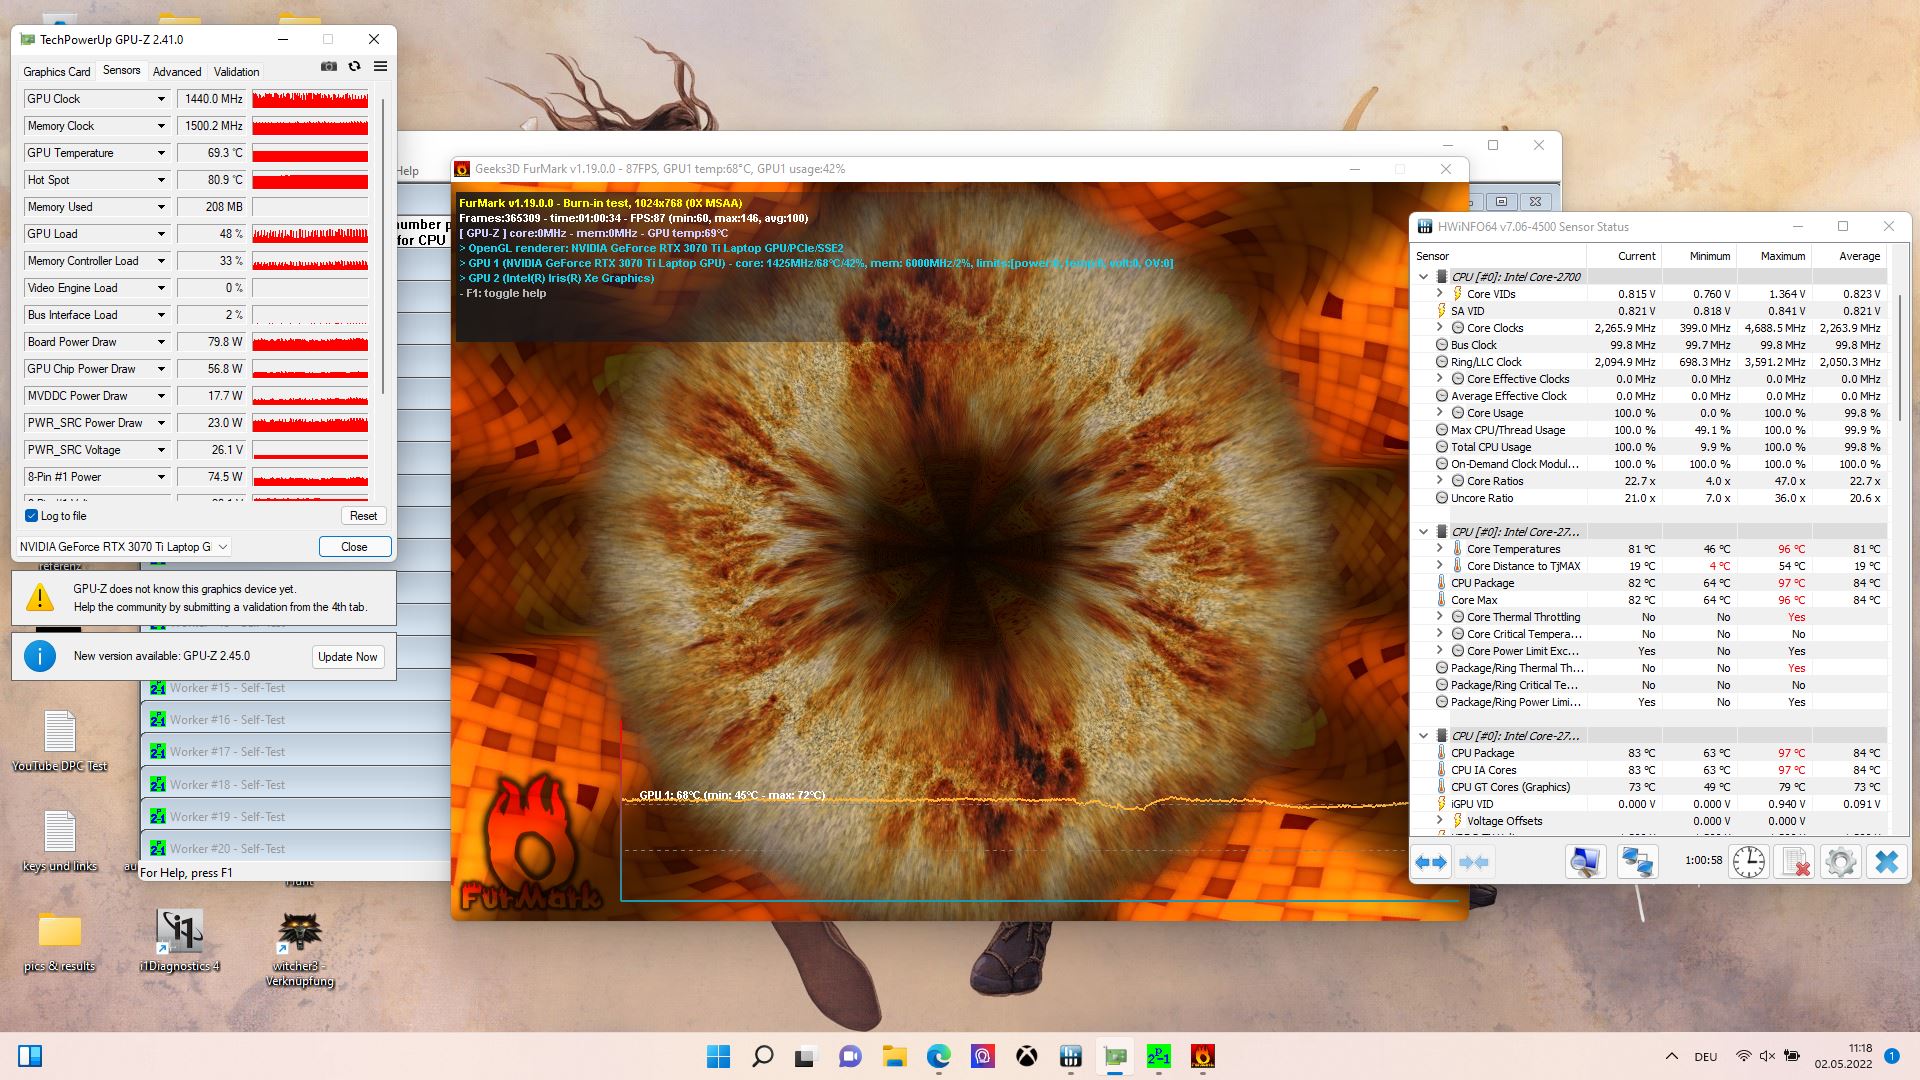
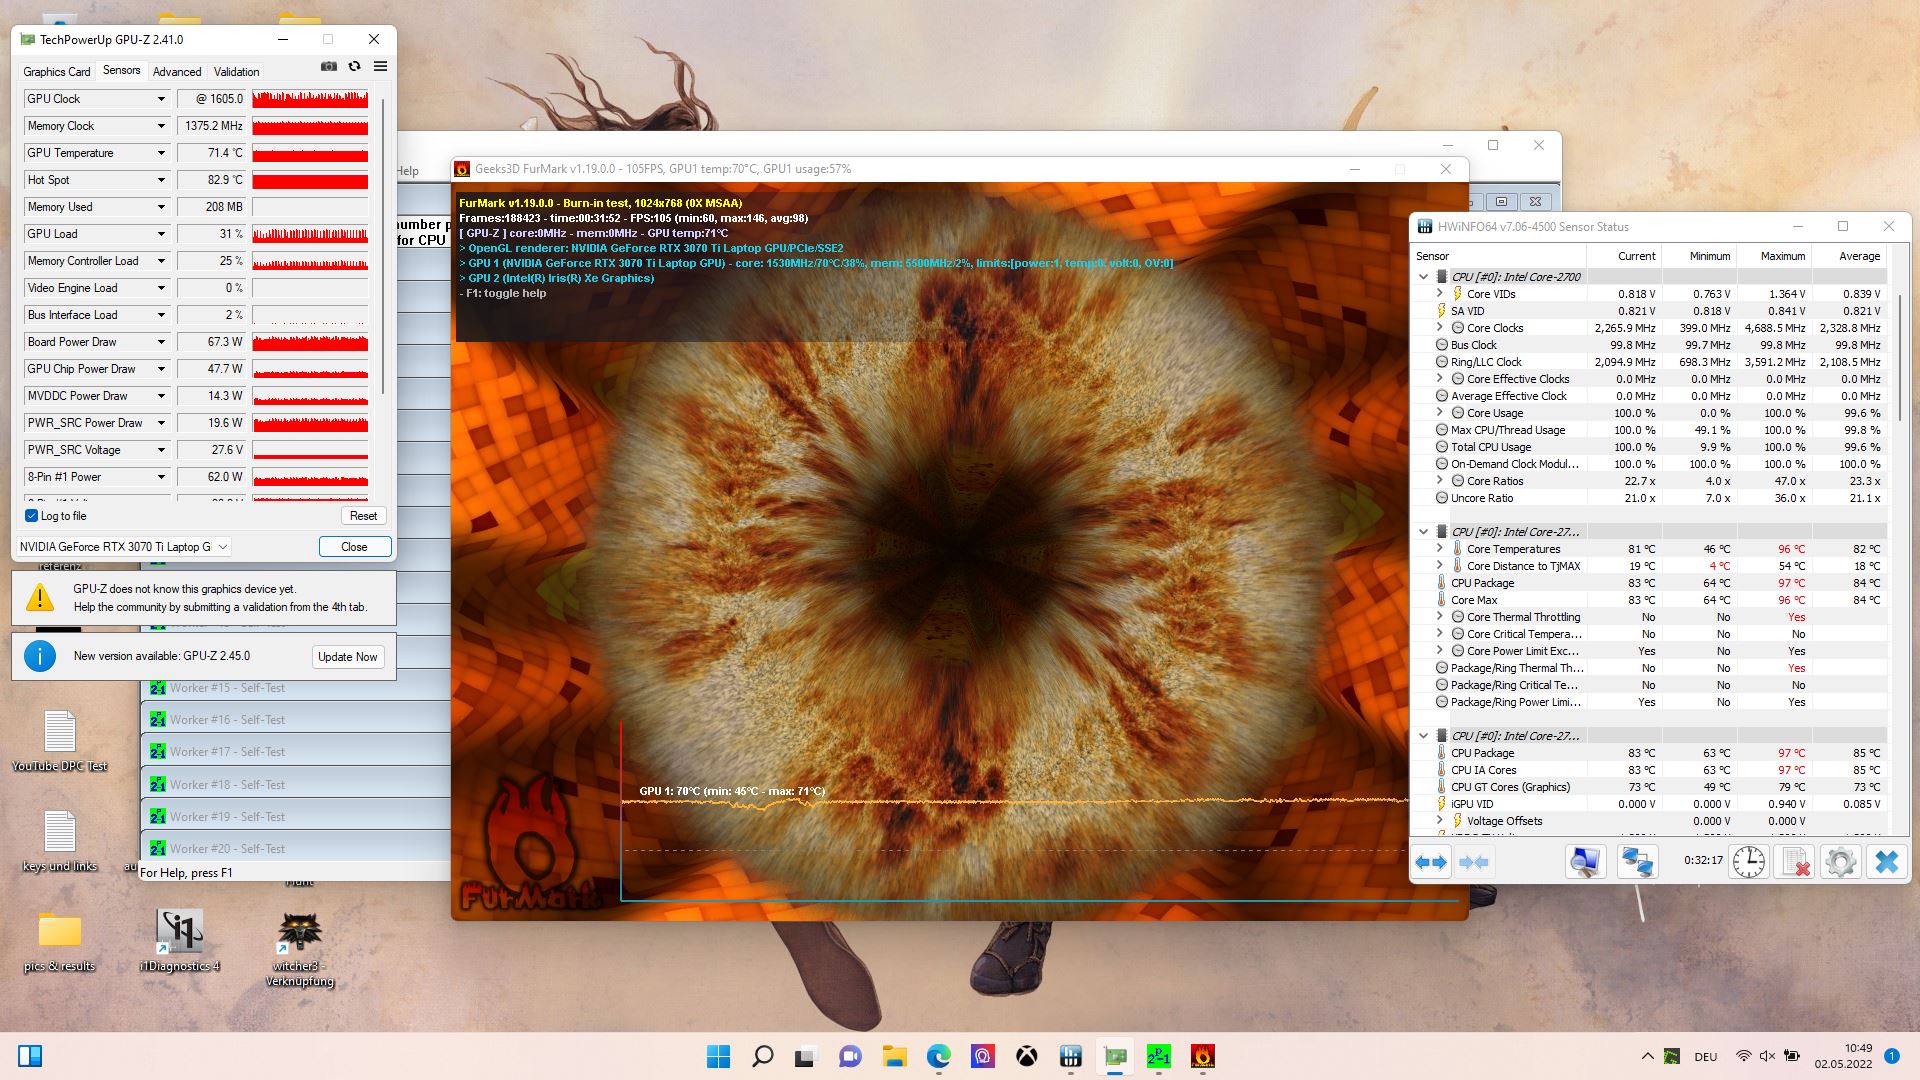
| Fréquence CPU (GHz) | Fréquence GPU (MHz) | Température CPU moyenne (°C) | Température GPU moyenne (°C) | |
| Prime95 + FurMark Stress | 2,3 | 1,254 | 81 | 70 |
| Witcher 3 Stress | 3,8 | 1.332 | 76 | 70 |
Haut-parleurs
Les enceintes ne sont pas très fortes et manquent clairement de basses. Mais au moins, les médiums sont assez équilibrés. Nous vous recommandons de connecter des périphériques audio externes. Pour ce faire, un port casque combiné de 3,5 mm est disponible.
MSI Katana GF76 12UGS analyse audio
(±) | le niveau sonore du haut-parleur est moyen mais bon (81.81# dB)
Bass 100 - 315 Hz
(-) | presque aucune basse - en moyenne 18.2% plus bas que la médiane
(±) | la linéarité des basses est moyenne (11% delta à la fréquence précédente)
Mids 400 - 2000 Hz
(+) | médiane équilibrée - seulement 3.8% de la médiane
(+) | les médiums sont linéaires (4.8% delta à la fréquence précédente)
Aiguës 2 - 16 kHz
(+) | des sommets équilibrés - à seulement 4.2% de la médiane
(±) | la linéarité des aigus est moyenne (7.1% delta à la fréquence précédente)
Overall 100 - 16.000 Hz
(±) | la linéarité du son global est moyenne (15.2% de différence avec la médiane)
Par rapport à la même classe
» 30% de tous les appareils testés de cette catégorie étaient meilleurs, 6% similaires, 64% pires
» Le meilleur avait un delta de 6%, la moyenne était de 18%, le pire était de 132%.
Par rapport à tous les appareils testés
» 17% de tous les appareils testés étaient meilleurs, 4% similaires, 79% pires
» Le meilleur avait un delta de 4%, la moyenne était de 25%, le pire était de 134%.
Aorus 17 XE4 analyse audio
(+) | les haut-parleurs peuvent jouer relativement fort (84# dB)
Bass 100 - 315 Hz
(-) | presque aucune basse - en moyenne 25.3% plus bas que la médiane
(±) | la linéarité des basses est moyenne (12.5% delta à la fréquence précédente)
Mids 400 - 2000 Hz
(+) | médiane équilibrée - seulement 3.9% de la médiane
(+) | les médiums sont linéaires (4.8% delta à la fréquence précédente)
Aiguës 2 - 16 kHz
(+) | des sommets équilibrés - à seulement 4.4% de la médiane
(±) | la linéarité des aigus est moyenne (7.3% delta à la fréquence précédente)
Overall 100 - 16.000 Hz
(±) | la linéarité du son global est moyenne (17.5% de différence avec la médiane)
Par rapport à la même classe
» 45% de tous les appareils testés de cette catégorie étaient meilleurs, 12% similaires, 43% pires
» Le meilleur avait un delta de 6%, la moyenne était de 18%, le pire était de 132%.
Par rapport à tous les appareils testés
» 28% de tous les appareils testés étaient meilleurs, 8% similaires, 63% pires
» Le meilleur avait un delta de 4%, la moyenne était de 25%, le pire était de 134%.
Gestion de l'alimentation - Relativement efficace
Consommation d'énergie
En mode veille, le Katana consomme à peu près autant ou peu d'énergie que le Razer Blade 17. En charge, comme dans les jeux, il devient alors l'un des appareils les plus efficaces de notre comparaison, en raison de la consommation limitée de son GPU. Par exemple, dans"The Witcher 3", il ne consomme que 6 % de plus que son prédécesseur avec la RTX 3060, tout en offrant des performances jusqu'à 26 % supérieures.
Nous mesurons une brève consommation maximale de 219 watts, que l'alimentation de 240 watts devrait pouvoir gérer sans problème.
| Au repos | |
| Fortement sollicité |
|
| MSI Katana GF76 12UGS i7-12700H, GeForce RTX 3070 Ti Laptop GPU, Micron 2450 1TB MTFDKBK1T0TFK, IPS, 1920x1080, 17.30 | MSI Katana GF76 11UE i7-11800H, GeForce RTX 3060 Laptop GPU, Kingston OM8PCP3512F-AB, IPS, 1920x1080, 17.30 | Aorus 17 XE4 i7-12700H, GeForce RTX 3070 Ti Laptop GPU, Gigabyte AG470S1TB-SI B10, IPS, 1920x1080, 17.30 | Razer Blade 17 (i7-12800H, RTX 3070 Ti) i7-12800H, GeForce RTX 3070 Ti Laptop GPU, Samsung PM9A1 MZVL21T0HCLR, IPS, 2560x1440, 17.30 | Lenovo Legion 5 Pro 16 G7 i7 RTX 3070Ti i7-12700H, GeForce RTX 3070 Ti Laptop GPU, Samsung PM9A1 MZVL21T0HCLR, IPS, 2560x1600, 16.00 | MSI Vector GP66 12UGS i9-12900H, GeForce RTX 3070 Ti Laptop GPU, , IPS, 1920x1080, 15.60 | Moyenne NVIDIA GeForce RTX 3070 Ti Laptop GPU | Moyenne de la classe Gaming | |
|---|---|---|---|---|---|---|---|---|
| Power Consumption | 15% | -26% | -14% | -6% | -38% | -14% | -11% | |
| Idle Minimum * | 14.2 | 9 37% | 20 -41% | 14.4 -1% | 8.6 39% | 17.5 -23% | 14.2 ? -0% | 13.8 ? 3% |
| Idle Average * | 18 | 13 28% | 23 -28% | 20 -11% | 17.6 2% | 20.1 -12% | 19.9 ? -11% | 19.2 ? -7% |
| Idle Maximum * | 22 | 20 9% | 28 -27% | 21.5 2% | 18.5 16% | 47.3 -115% | 26.2 ? -19% | 26.9 ? -22% |
| Load Average * | 98 | 102 -4% | 120 -22% | 119 -21% | 110 -12% | 107.3 -9% | 125.8 ? -28% | 111.1 ? -13% |
| Witcher 3 ultra * | 159 | 149 6% | 196 -23% | 218 -37% | 227 -43% | 225 -42% | ||
| Load Maximum * | 219 | 187 15% | 257 -17% | 248 -13% | 294.6 -35% | 277.7 -27% | 248 ? -13% | 251 ? -15% |
* ... Moindre est la valeur, meilleures sont les performances
Power Consumption The Witcher 3 / Stress Test
Power Consumption with External Monitor
Autonomie de la batterie
Le Katana possède une batterie de 53,5 Wh. Si elle n'est pas différente de celle de son prédécesseur, elle est aussi nettement plus petite que celle des concurrents, dont certains offrent presque le double de capacité (Aorus 17). En conséquence, l'autonomie de la batterie ne s'avère pas très impressionnante, notamment en charge.
Dans notre test vidéo, l'ordinateur portable ne tient que moins de 3 heures. Selon la luminosité réglée, vous pouvez surfer loin de la prise de courant entre 1:47 heures et 3:47 heures.
| MSI Katana GF76 12UGS i7-12700H, GeForce RTX 3070 Ti Laptop GPU, 53.5 Wh | MSI Katana GF76 11UE i7-11800H, GeForce RTX 3060 Laptop GPU, 53 Wh | Aorus 17 XE4 i7-12700H, GeForce RTX 3070 Ti Laptop GPU, 99 Wh | Razer Blade 17 (i7-12800H, RTX 3070 Ti) i7-12800H, GeForce RTX 3070 Ti Laptop GPU, 82 Wh | Lenovo Legion 5 Pro 16 G7 i7 RTX 3070Ti i7-12700H, GeForce RTX 3070 Ti Laptop GPU, 80 Wh | MSI Vector GP66 12UGS i9-12900H, GeForce RTX 3070 Ti Laptop GPU, 65 Wh | Moyenne de la classe Gaming | |
|---|---|---|---|---|---|---|---|
| Autonomie de la batterie | 0% | 41% | 40% | 26% | 9% | 53% | |
| H.264 | 195 | 232 19% | 366 88% | 295 51% | 377 93% | 399 ? 105% | |
| WiFi v1.3 | 222 | 220 -1% | 308 39% | 353 59% | 326 47% | 342 54% | 368 ? 66% |
| Load | 97 | 80 -18% | 94 -3% | 108 11% | 37 -62% | 61 -37% | 84.4 ? -13% |
| Reader / Idle | 286 | 513 | 473 | 544 ? | |||
| Witcher 3 ultra | 50 | 81.6 ? |
Points positifs
Points négatifs
Verdict - Un gamer abordable
Le MSI Katana GF76 12U est l'un des ordinateurs portables de jeu les plus abordables, avec tous les avantages et les inconvénients que cela comporte. L'aspect positif est que le Katana est capable de reproduire la quasi-totalité des jeux modernes de manière fluide, même avec les paramètres de détail maximum. Ceux pour qui cela est suffisant obtiendront avec le Katana un ordinateur portable de jeu abordable, dont le fonctionnement est également relativement efficace.
Bien sûr, le faible prix présente aussi quelques inconvénients. L'écran forme plutôt le plus bas niveau de qualité IPS, la batterie est petite, et l'autonomie, courte. Les connexions ne sont pas très modernes, le système de refroidissement a besoin d'une optimisation urgente, et la RTX 3070 Ti est limitée à 100 watts, ce qui signifie que ses performances ne sont même pas capables de s'approcher de son potentiel.
Le MSI Katana GF76 est l'un des ordinateurs portables de jeu les plus abordables. Si les acheteurs intéressés disposant d'un budget limité devraient être en mesure de jouer à tous les jeux actuels en douceur, les nombreux petits inconvénients appellent à un budget plus élevé.
Parmi les concurrents, le Gigabyte Aorus 17, qui offre également Thunderbolt et des performances supérieures tout en étant légèrement plus cher que le Katana, vaut la peine d'être examiné. L'Asus TUF Gaming F17 pourrait également valoir la peine d'être considéré avec ses performances plus élevées, mais sa version la plus abordable a un écran qui est encore pire dans certaines parties. En raison de l'importante limitation du TGP, il serait bon de se tourner vers un modèle doté d'une RTX 3060 et d'un TGP plus élevé.
Prix et disponibilité
Le 2022 MSI Katana GF76 est disponible par exemple sur Amazon à partir de 1499 $.
MSI Katana GF76 12UGS
-
05/13/2022 v7
Christian Hintze
Pricecompare

