Courte critique du PC portable Lenovo ThinkPad X1 Carbon 2017 (Core i5, Full HD)


| SD Card Reader | |
| average JPG Copy Test (av. of 3 runs) | |
| Lenovo ThinkPad T470-20HD002HGE | |
| Fujitsu LifeBook U747 | |
| Lenovo ThinkPad X1 Carbon 2017-20HR0021GE | |
| Lenovo ThinkPad X1 Carbon 2017-20HQS03P00 | |
| maximum AS SSD Seq Read Test (1GB) | |
| Lenovo ThinkPad T470-20HD002HGE | |
| Lenovo ThinkPad X1 Carbon 2017-20HR0021GE | |
| Fujitsu LifeBook U747 | |
| Lenovo ThinkPad X1 Carbon 2017-20HQS03P00 | |
| Networking | |
| iperf3 transmit AX12 | |
| Lenovo ThinkPad X1 Carbon 2017-20HR0021GE | |
| Lenovo ThinkPad X1 Carbon 2017-20HQS03P00 | |
| Fujitsu LifeBook U747 | |
| Lenovo ThinkPad T470s-20HGS00V00 | |
| iperf3 receive AX12 | |
| Fujitsu LifeBook U747 | |
| Lenovo ThinkPad X1 Carbon 2017-20HQS03P00 | |
| Lenovo ThinkPad T470s-20HGS00V00 | |
| Lenovo ThinkPad X1 Carbon 2017-20HR0021GE | |
| |||||||||||||||||||||||||
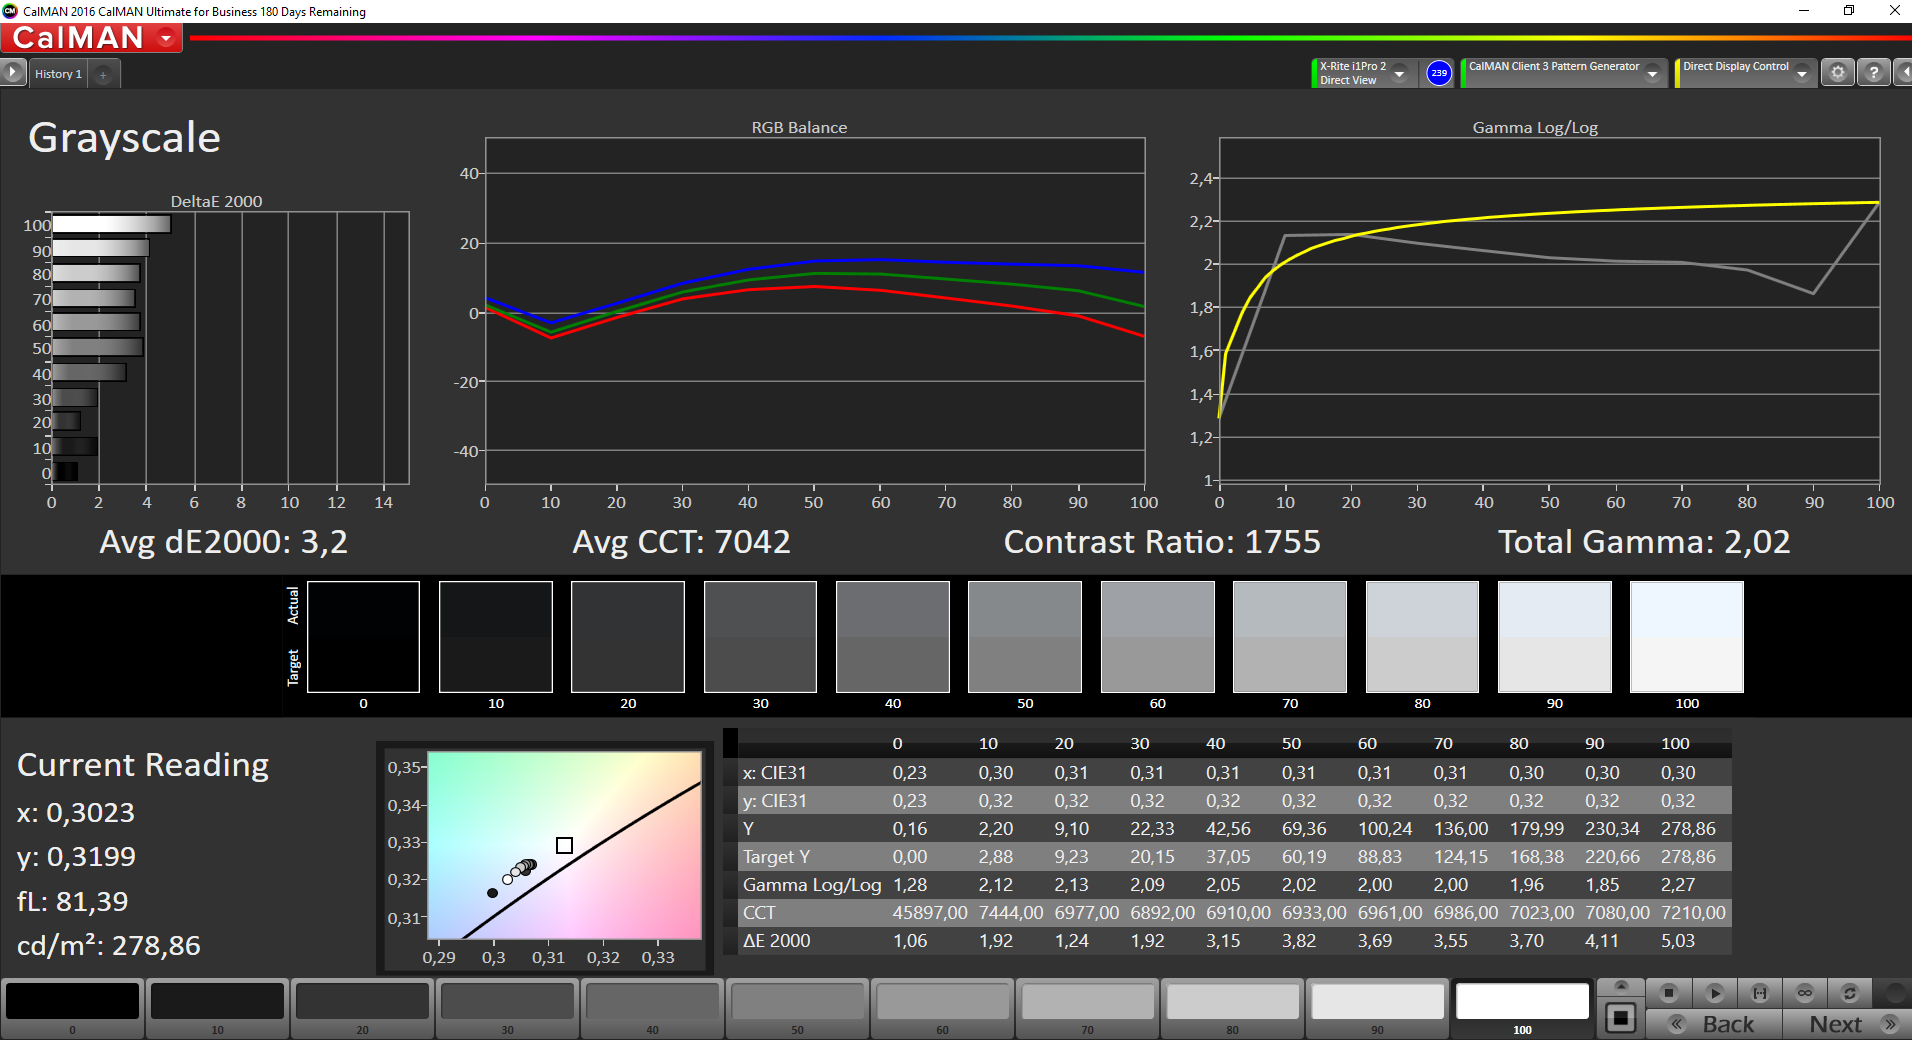
Homogénéité de la luminosité: 91 %
Valeur mesurée au centre, sur batterie: 277 cd/m²
Contraste: 1738:1 (Valeurs des noirs: 0.16 cd/m²)
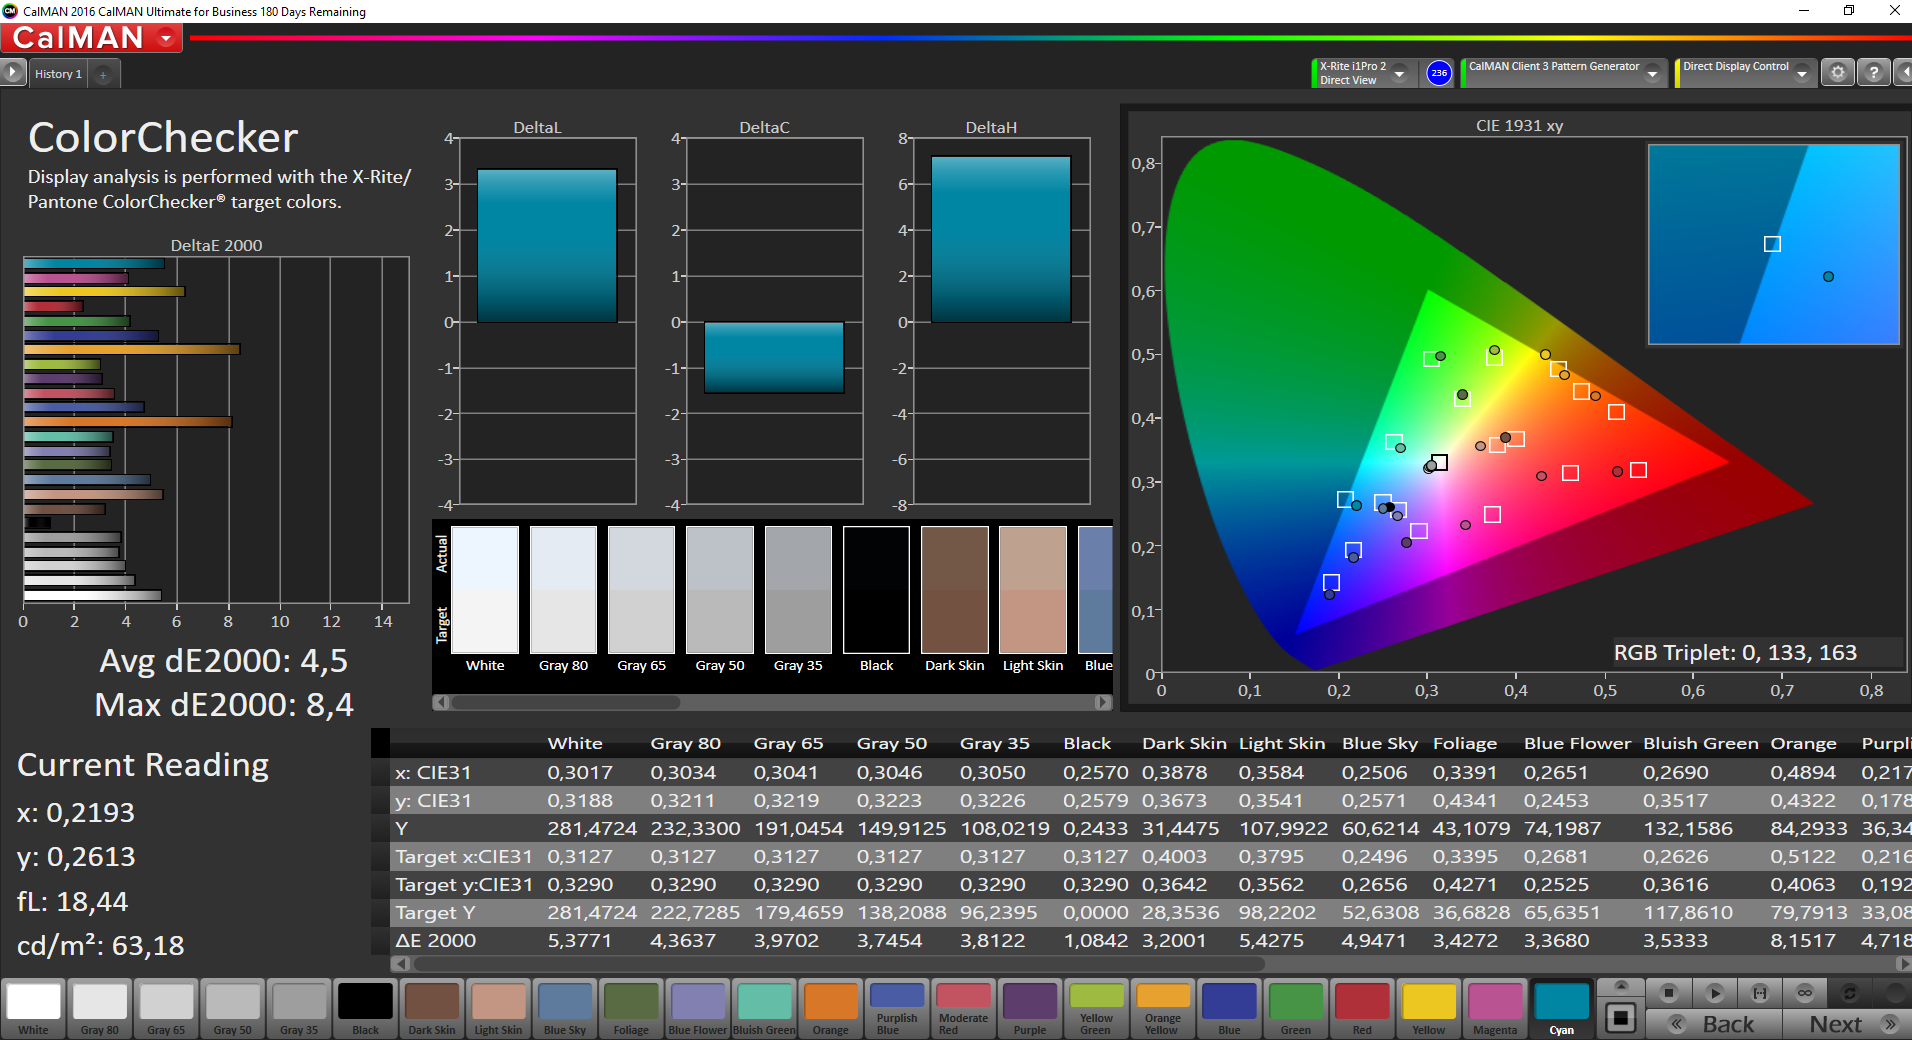
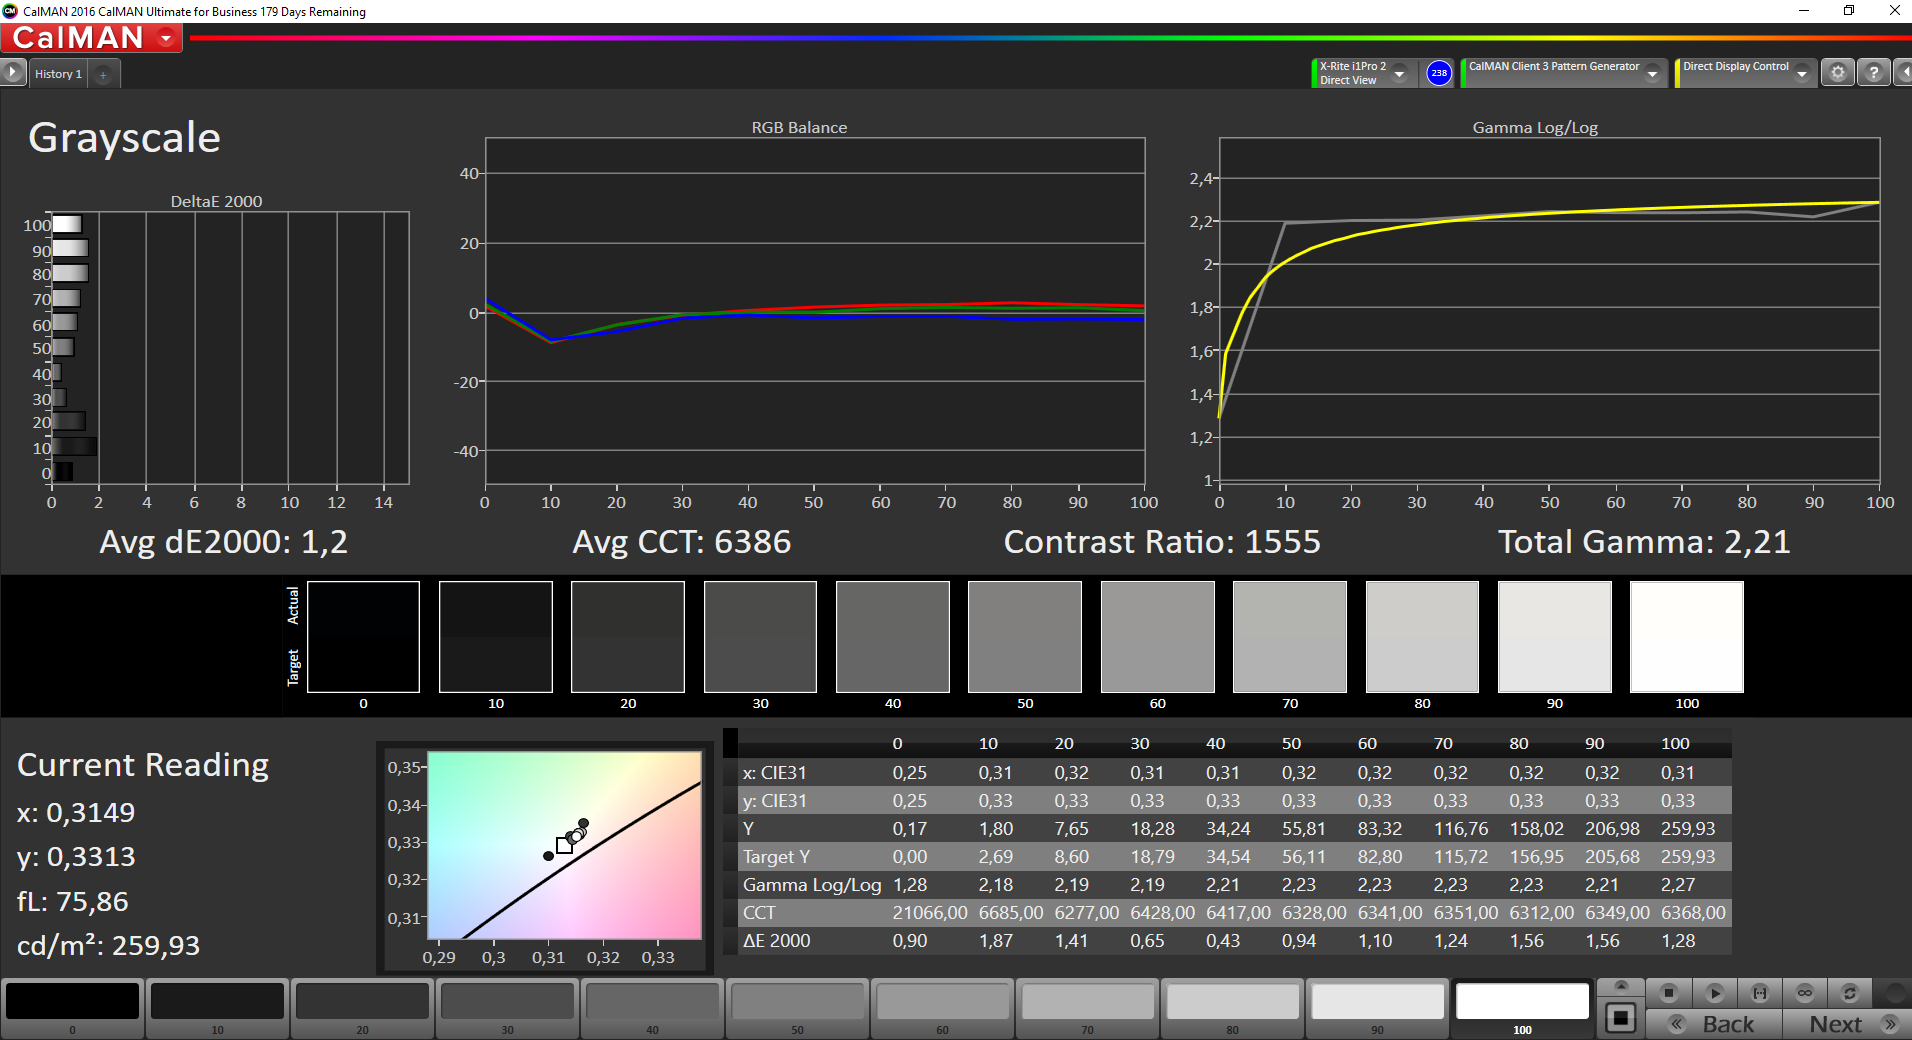
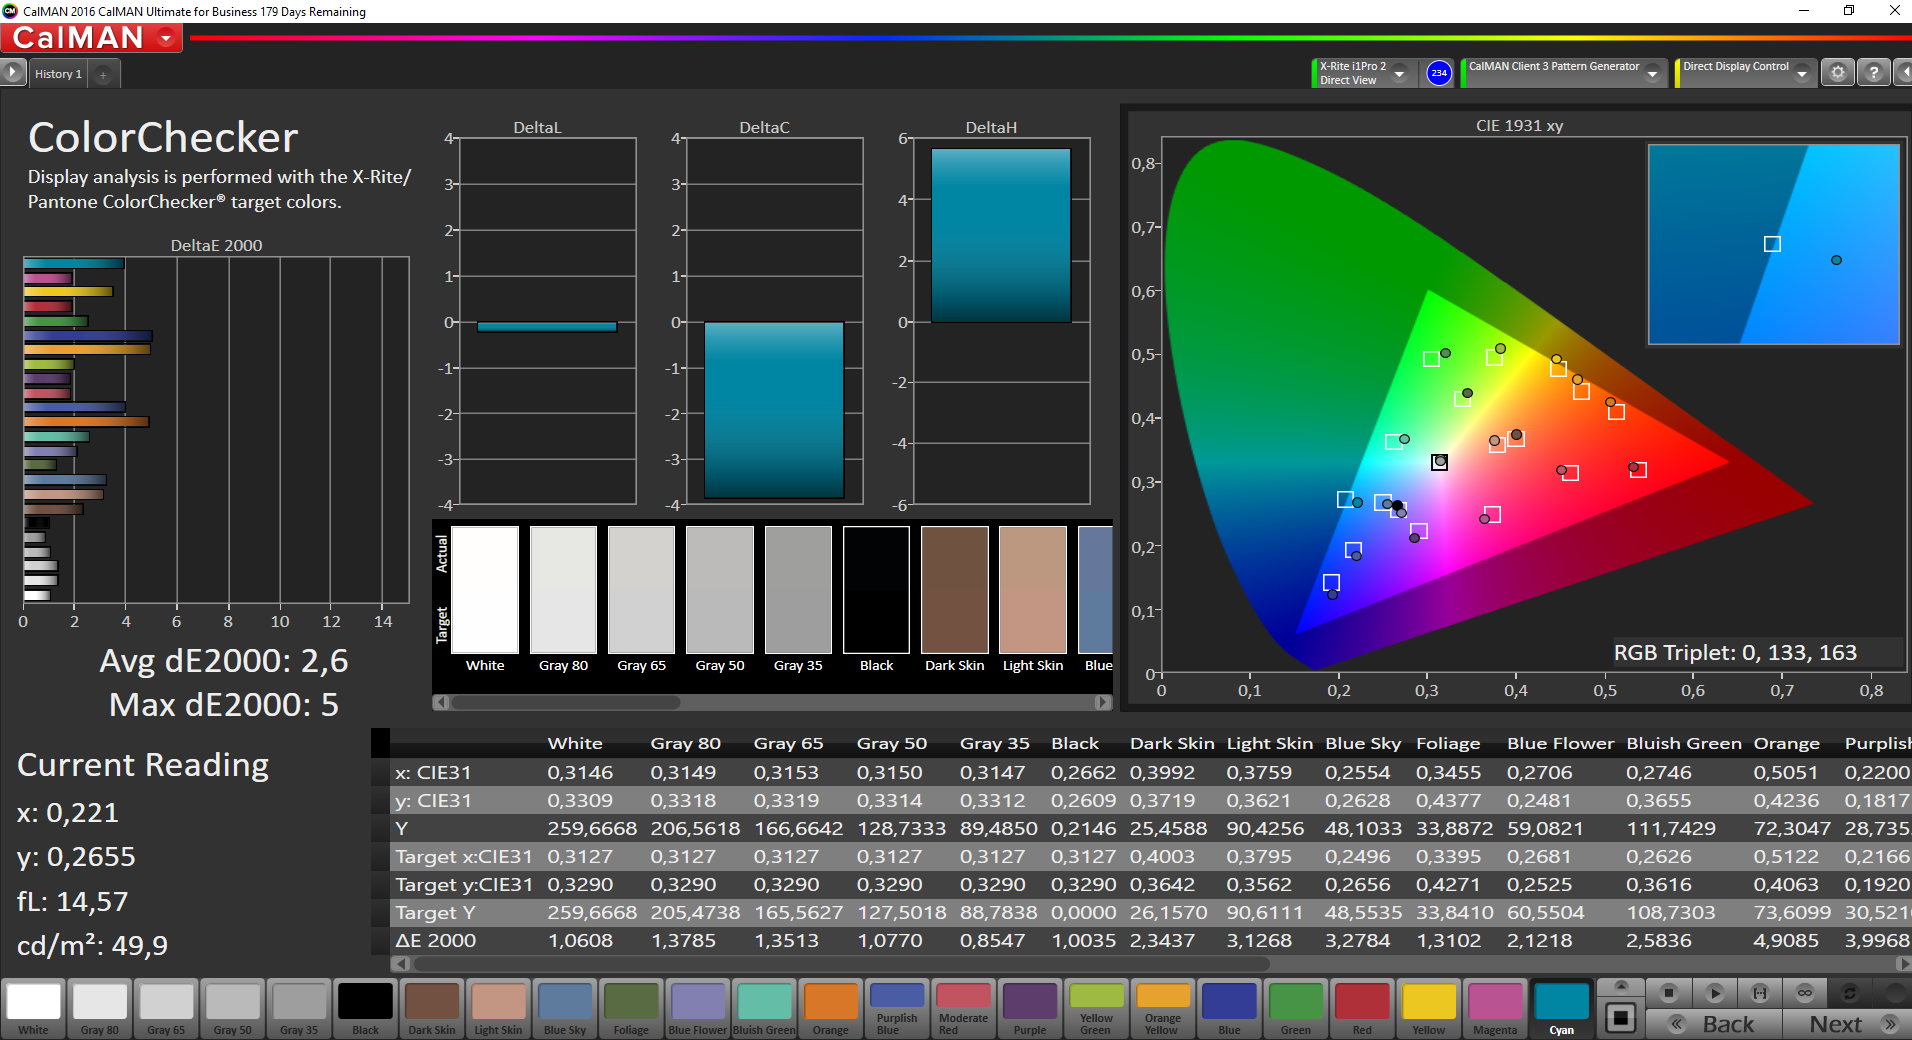
ΔE ColorChecker Calman: 4.5 | ∀{0.5-29.43 Ø4.71}
ΔE Greyscale Calman: 3.2 | ∀{0.09-98 Ø4.96}
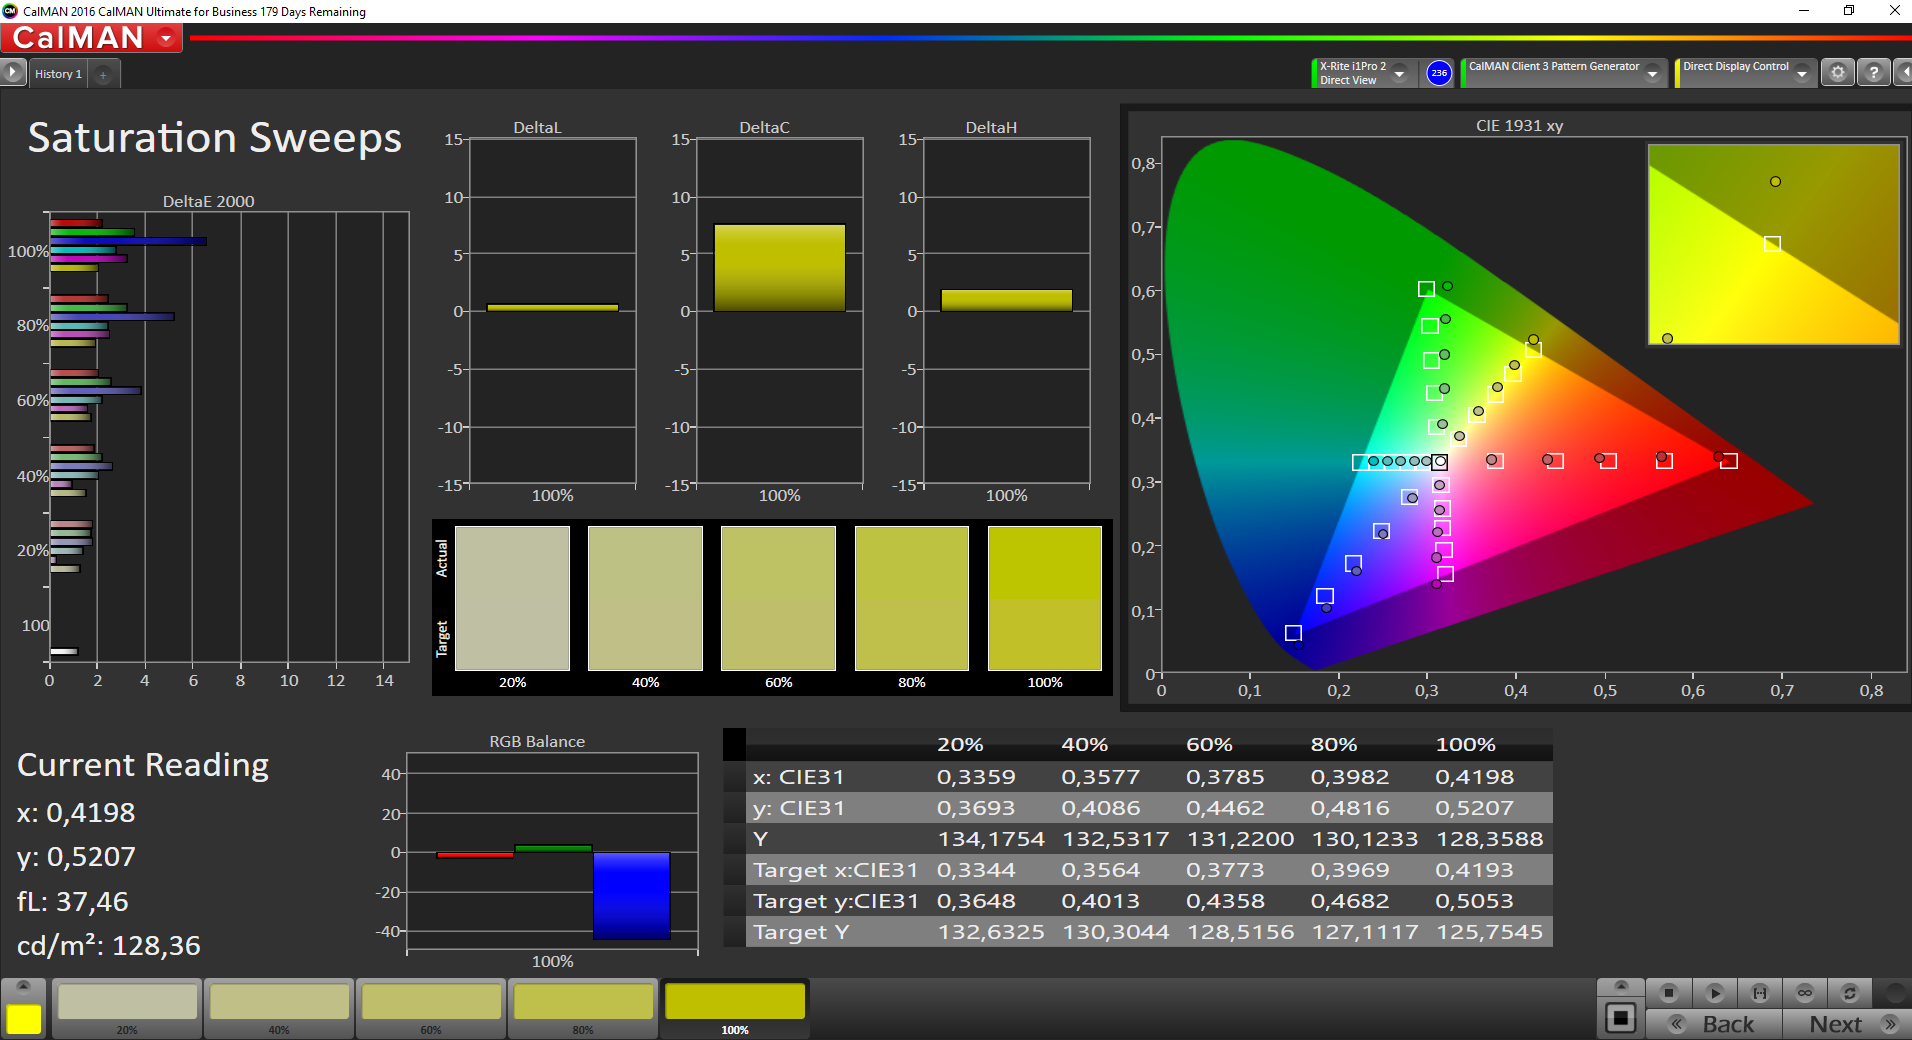
87.5% sRGB (Argyll 1.6.3 3D)
57% AdobeRGB 1998 (Argyll 1.6.3 3D)
62.6% AdobeRGB 1998 (Argyll 3D)
87.6% sRGB (Argyll 3D)
61.6% Display P3 (Argyll 3D)
Gamma: 2.02
CCT: 7042 K
| Lenovo ThinkPad X1 Carbon 2017-20HR0021GE B140HAN03_1, , 1920x1080, 14" | Lenovo ThinkPad X1 Carbon 2017-20HQS03P00 B140HAN03_1, , 1920x1080, 14" | Lenovo ThinkPad X1 Carbon 20FB-005XUS 1920x1080, 14" | Lenovo ThinkPad X1 Carbon 20FB003RGE VVX14T058J00, , 2560x1440, 14" | Lenovo ThinkPad T470s-20HGS00V00 B140QAN01.5, , 2560x1440, 14" | HP EliteBook Folio 1040 G3 AUO1136, , 2560x1440, 14" | Fujitsu LifeBook U747 LG LP140WF3, , 1920x1080, 14" | |
|---|---|---|---|---|---|---|---|
| Display | -1% | -4% | 8% | 11% | 11% | 1% | |
| Display P3 Coverage (%) | 61.6 | 61.4 0% | 58.9 -4% | 66.7 8% | 69 12% | 67.9 10% | 66.1 7% |
| sRGB Coverage (%) | 87.6 | 85.9 -2% | 83.1 -5% | 94.7 8% | 95.1 9% | 96.8 11% | 84.8 -3% |
| AdobeRGB 1998 Coverage (%) | 62.6 | 62.4 0% | 60.3 -4% | 68.4 9% | 69.6 11% | 70 12% | 62 -1% |
| Response Times | 5% | 6% | 15% | 4% | 8% | 25% | |
| Response Time Grey 50% / Grey 80% * (ms) | 48 ? | 41.6 ? 13% | 47.2 ? 2% | 44 ? 8% | 46.4 ? 3% | 46.4 ? 3% | 36 ? 25% |
| Response Time Black / White * (ms) | 30.4 ? | 31.6 ? -4% | 27.6 ? 9% | 24 ? 21% | 28.8 ? 5% | 26.4 ? 13% | 23.2 ? 24% |
| PWM Frequency (Hz) | 220 ? | ||||||
| Screen | -19% | -7% | -7% | -29% | -15% | -17% | |
| Brightness middle (cd/m²) | 278 | 311 12% | 321.7 16% | 272 -2% | 327 18% | 327 18% | 291 5% |
| Brightness (cd/m²) | 271 | 288 6% | 301 11% | 268 -1% | 311 15% | 316 17% | 296 9% |
| Brightness Distribution (%) | 91 | 85 -7% | 89 -2% | 95 4% | 88 -3% | 87 -4% | 84 -8% |
| Black Level * (cd/m²) | 0.16 | 0.24 -50% | 0.294 -84% | 0.32 -100% | 0.25 -56% | 0.35 -119% | 0.32 -100% |
| Contrast (:1) | 1738 | 1296 -25% | 1094 -37% | 850 -51% | 1308 -25% | 934 -46% | 909 -48% |
| Colorchecker dE 2000 * | 4.5 | 5.5 -22% | 3.96 12% | 2.61 42% | 6.1 -36% | 4.39 2% | 4.3 4% |
| Colorchecker dE 2000 max. * | 8.4 | 9 -7% | 6.69 20% | 6.43 23% | 12.2 -45% | 7.27 13% | 7.5 11% |
| Greyscale dE 2000 * | 3.2 | 6.2 -94% | 3.15 2% | 3.31 -3% | 8.8 -175% | 4.69 -47% | 4.3 -34% |
| Gamma | 2.02 109% | 2.02 109% | 2.34 94% | 2.35 94% | 2.18 101% | 2.15 102% | 2.31 95% |
| CCT | 7042 92% | 5950 109% | 7082 92% | 6360 102% | 6172 105% | 7101 92% | 6529 100% |
| Color Space (Percent of AdobeRGB 1998) (%) | 57 | 55.96 -2% | 53.8 -6% | 63 11% | 61.56 8% | 62.52 10% | 55.46 -3% |
| Color Space (Percent of sRGB) (%) | 87.5 | 85.77 -2% | 82.7 -5% | 95 9% | 94.88 8% | 96.71 11% | 84.77 -3% |
| Moyenne finale (programmes/paramètres) | -5% /
-12% | -2% /
-5% | 5% /
-1% | -5% /
-17% | 1% /
-6% | 3% /
-8% |
* ... Moindre est la valeur, meilleures sont les performances
Temps de réponse de l'écran
| ↔ Temps de réponse noir à blanc | ||
|---|---|---|
| 30.4 ms ... hausse ↗ et chute ↘ combinées | ↗ 18.8 ms hausse | 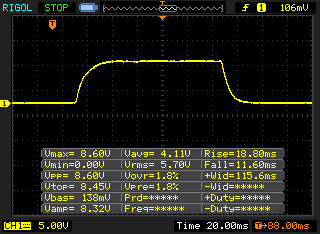 |
| ↘ 11.6 ms chute | ||
| L'écran souffre de latences très élevées, à éviter pour le jeu. En comparaison, tous les appareils testés affichent entre 0.1 (minimum) et 240 (maximum) ms. » 82 % des appareils testés affichent de meilleures performances. Cela signifie que les latences relevées sont moins bonnes que la moyenne (19.8 ms) de tous les appareils testés. | ||
| ↔ Temps de réponse gris 50% à gris 80% | ||
| 48 ms ... hausse ↗ et chute ↘ combinées | ↗ 22 ms hausse | 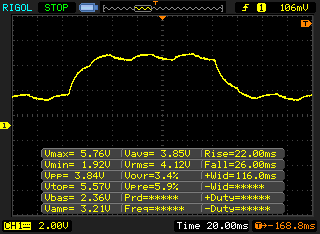 |
| ↘ 26 ms chute | ||
| L'écran souffre de latences très élevées, à éviter pour le jeu. En comparaison, tous les appareils testés affichent entre 0.165 (minimum) et 636 (maximum) ms. » 82 % des appareils testés affichent de meilleures performances. Cela signifie que les latences relevées sont moins bonnes que la moyenne (31 ms) de tous les appareils testés. | ||
Scintillement / MLI (Modulation de largeur d'impulsion)
| Scintillement / MLI (Modulation de largeur d'impulsion) non décelé | 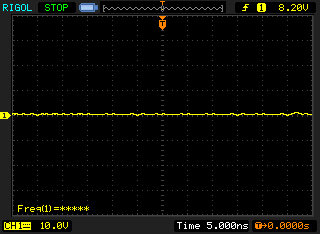 | ||
En comparaison, 52 % des appareils testés n'emploient pas MDI pour assombrir leur écran. Nous avons relevé une moyenne à 7754 (minimum : 5 - maximum : 343500) Hz dans le cas où une MDI était active. | |||

| Cinebench R15 | |
| CPU Single 64Bit | |
| Lenovo ThinkPad T470s-20HGS00V00 | |
| Lenovo ThinkPad X1 Carbon 2017-20HQS03P00 | |
| Fujitsu LifeBook U747 | |
| Lenovo ThinkPad X1 Carbon 20FB003RGE | |
| Lenovo ThinkPad X1 Carbon 2017-20HR0021GE | |
| HP EliteBook Folio 1040 G3 | |
| Lenovo ThinkPad X1 Carbon 20FB-005XUS | |
| CPU Multi 64Bit | |
| Lenovo ThinkPad T470s-20HGS00V00 | |
| Lenovo ThinkPad X1 Carbon 2017-20HQS03P00 | |
| Fujitsu LifeBook U747 | |
| Lenovo ThinkPad X1 Carbon 2017-20HR0021GE | |
| Lenovo ThinkPad X1 Carbon 20FB003RGE | |
| HP EliteBook Folio 1040 G3 | |
| Lenovo ThinkPad X1 Carbon 20FB-005XUS | |
| Cinebench R11.5 | |
| CPU Single 64Bit | |
| Lenovo ThinkPad T470s-20HGS00V00 | |
| Lenovo ThinkPad X1 Carbon 20FB003RGE | |
| Lenovo ThinkPad X1 Carbon 2017-20HR0021GE | |
| Lenovo ThinkPad X1 Carbon 20FB-005XUS | |
| CPU Multi 64Bit | |
| Lenovo ThinkPad T470s-20HGS00V00 | |
| Lenovo ThinkPad X1 Carbon 2017-20HR0021GE | |
| Lenovo ThinkPad X1 Carbon 20FB003RGE | |
| Lenovo ThinkPad X1 Carbon 20FB-005XUS | |
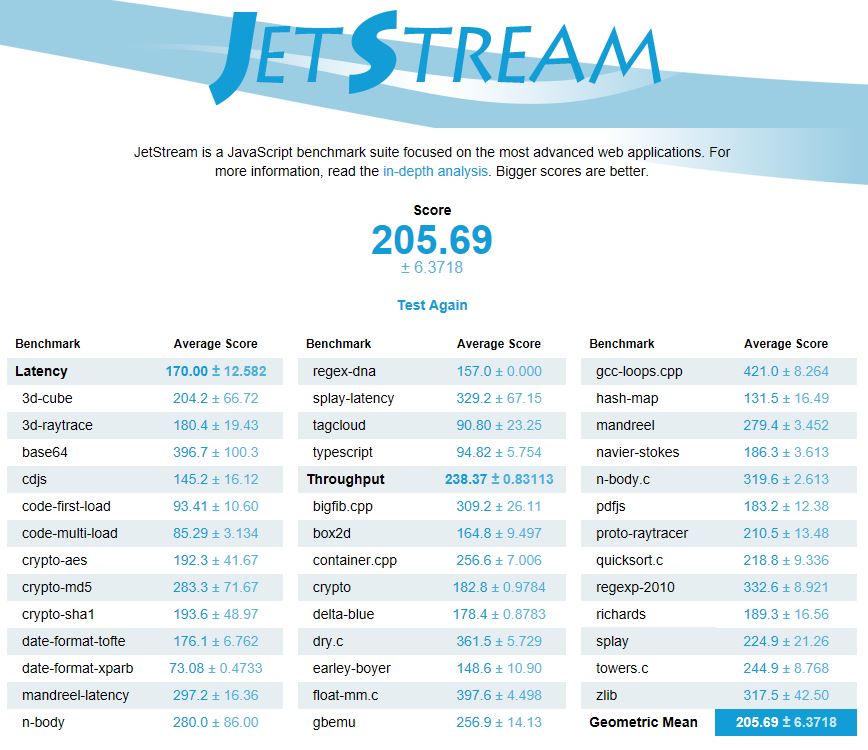
| JetStream 1.1 - 1.1 Total | |
| Lenovo ThinkPad T470s-20HGS00V00 | |
| Lenovo ThinkPad X1 Carbon 2017-20HQS03P00 | |
| Lenovo ThinkPad X1 Carbon 20FB003RGE | |
| Lenovo ThinkPad X1 Carbon 2017-20HR0021GE | |
| HP EliteBook Folio 1040 G3 | |
| Fujitsu LifeBook U747 | |
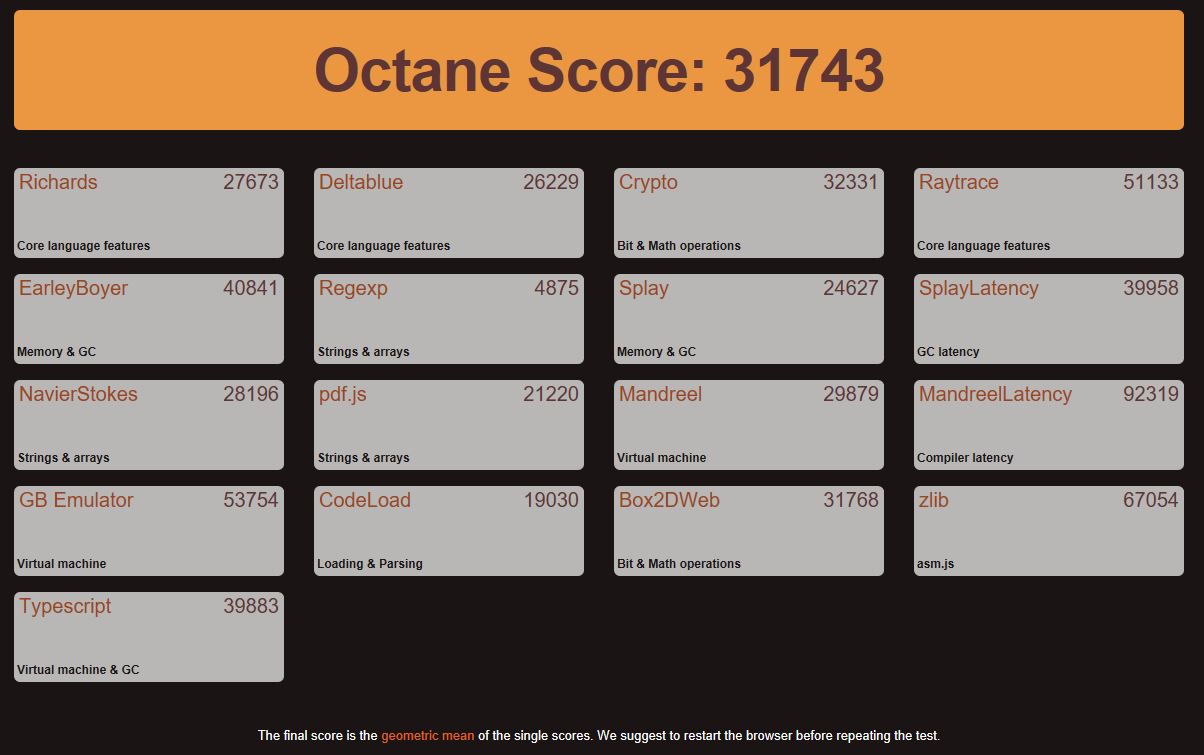
| Octane V2 - Total Score | |
| Lenovo ThinkPad T470s-20HGS00V00 | |
| Lenovo ThinkPad X1 Carbon 2017-20HQS03P00 | |
| Lenovo ThinkPad X1 Carbon 20FB003RGE | |
| Lenovo ThinkPad X1 Carbon 2017-20HR0021GE | |
| HP EliteBook Folio 1040 G3 | |
| Fujitsu LifeBook U747 | |
| Mozilla Kraken 1.1 - Total | |
| Fujitsu LifeBook U747 | |
| Lenovo ThinkPad X1 Carbon 2017-20HR0021GE | |
| HP EliteBook Folio 1040 G3 | |
| Lenovo ThinkPad X1 Carbon 20FB003RGE | |
| Lenovo ThinkPad X1 Carbon 2017-20HQS03P00 | |
| Lenovo ThinkPad T470s-20HGS00V00 | |
* ... Moindre est la valeur, meilleures sont les performances

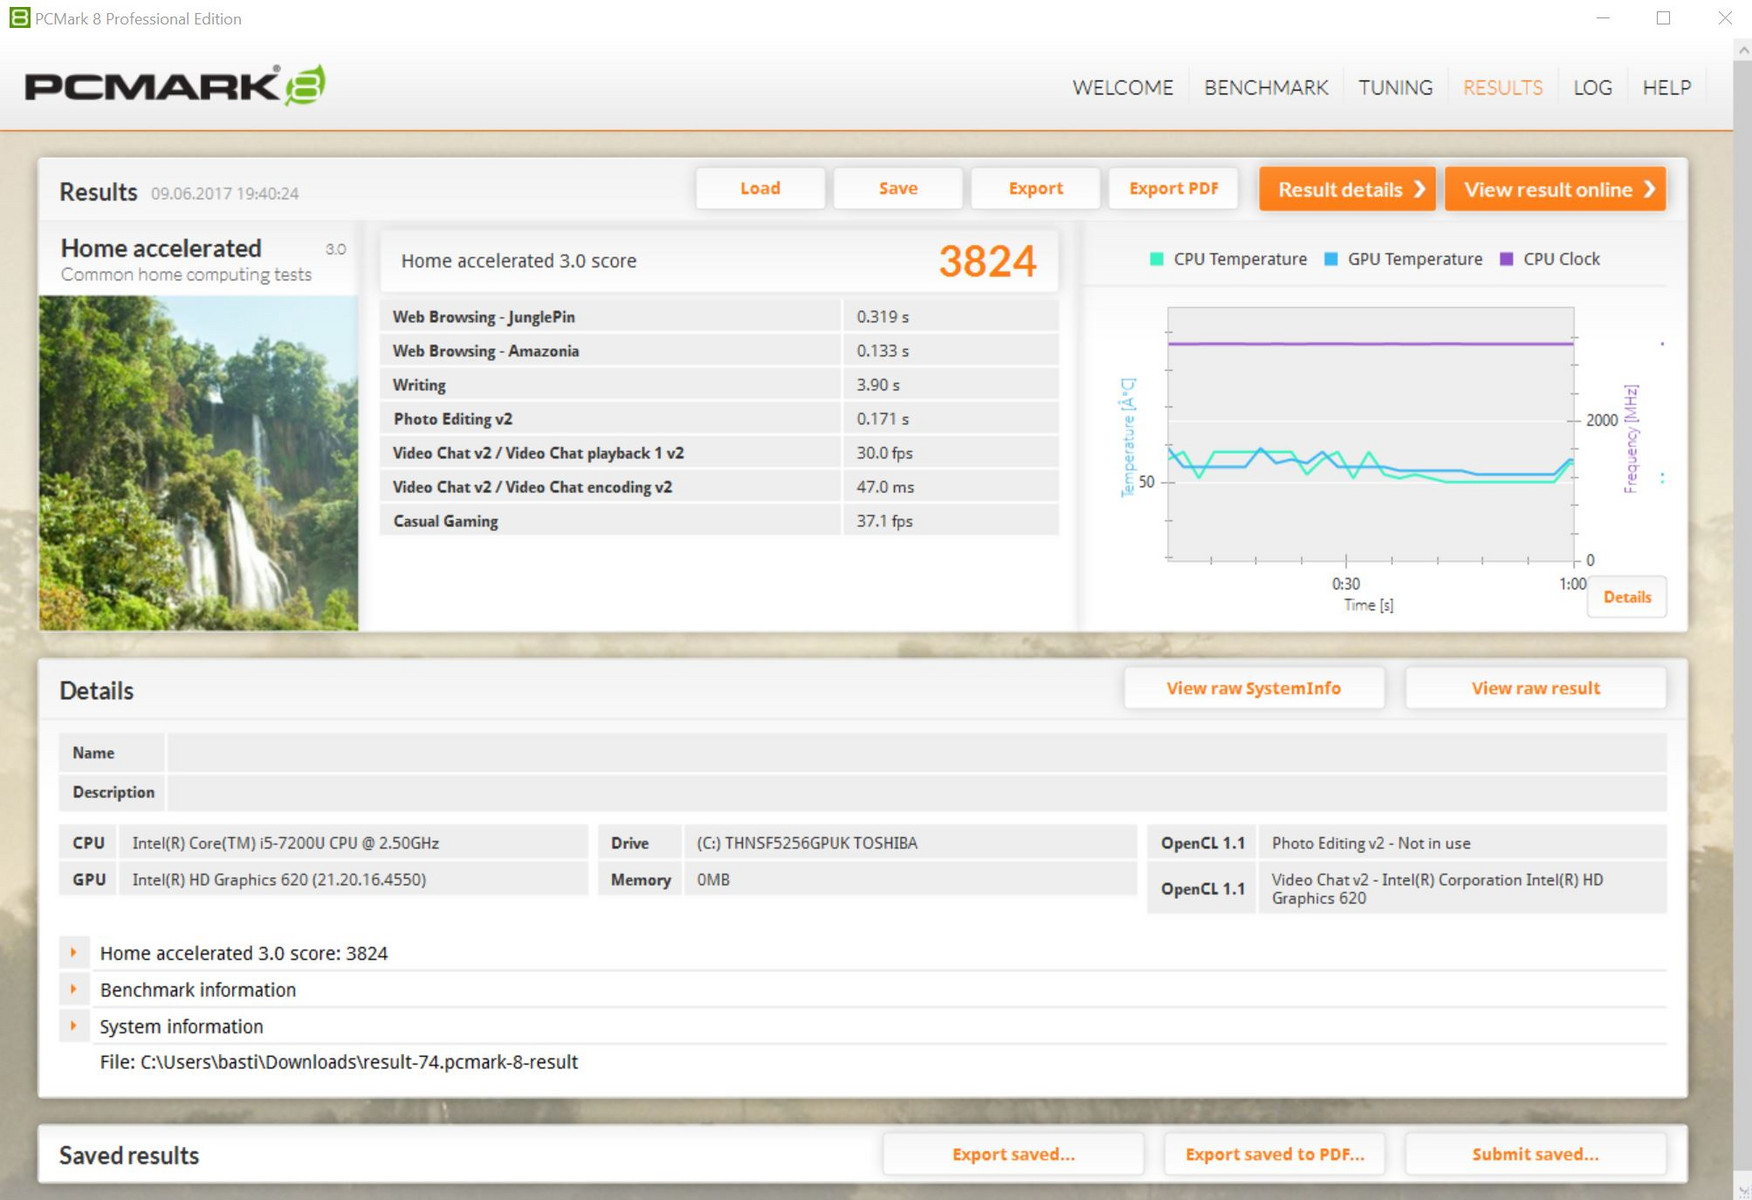

| PCMark 8 | |
| Home Score Accelerated v2 | |
| Lenovo ThinkPad X1 Carbon 2017-20HQS03P00 | |
| Lenovo ThinkPad T470s-20HGS00V00 | |
| Lenovo ThinkPad X1 Carbon 2017-20HR0021GE | |
| Fujitsu LifeBook U747 | |
| Lenovo ThinkPad X1 Carbon 20FB003RGE | |
| HP EliteBook Folio 1040 G3 | |
| Lenovo ThinkPad X1 Carbon 20FB-005XUS | |
| Work Score Accelerated v2 | |
| Lenovo ThinkPad X1 Carbon 2017-20HQS03P00 | |
| Lenovo ThinkPad T470s-20HGS00V00 | |
| Fujitsu LifeBook U747 | |
| Lenovo ThinkPad X1 Carbon 2017-20HR0021GE | |
| Lenovo ThinkPad X1 Carbon 20FB003RGE | |
| HP EliteBook Folio 1040 G3 | |
| Lenovo ThinkPad X1 Carbon 20FB-005XUS | |
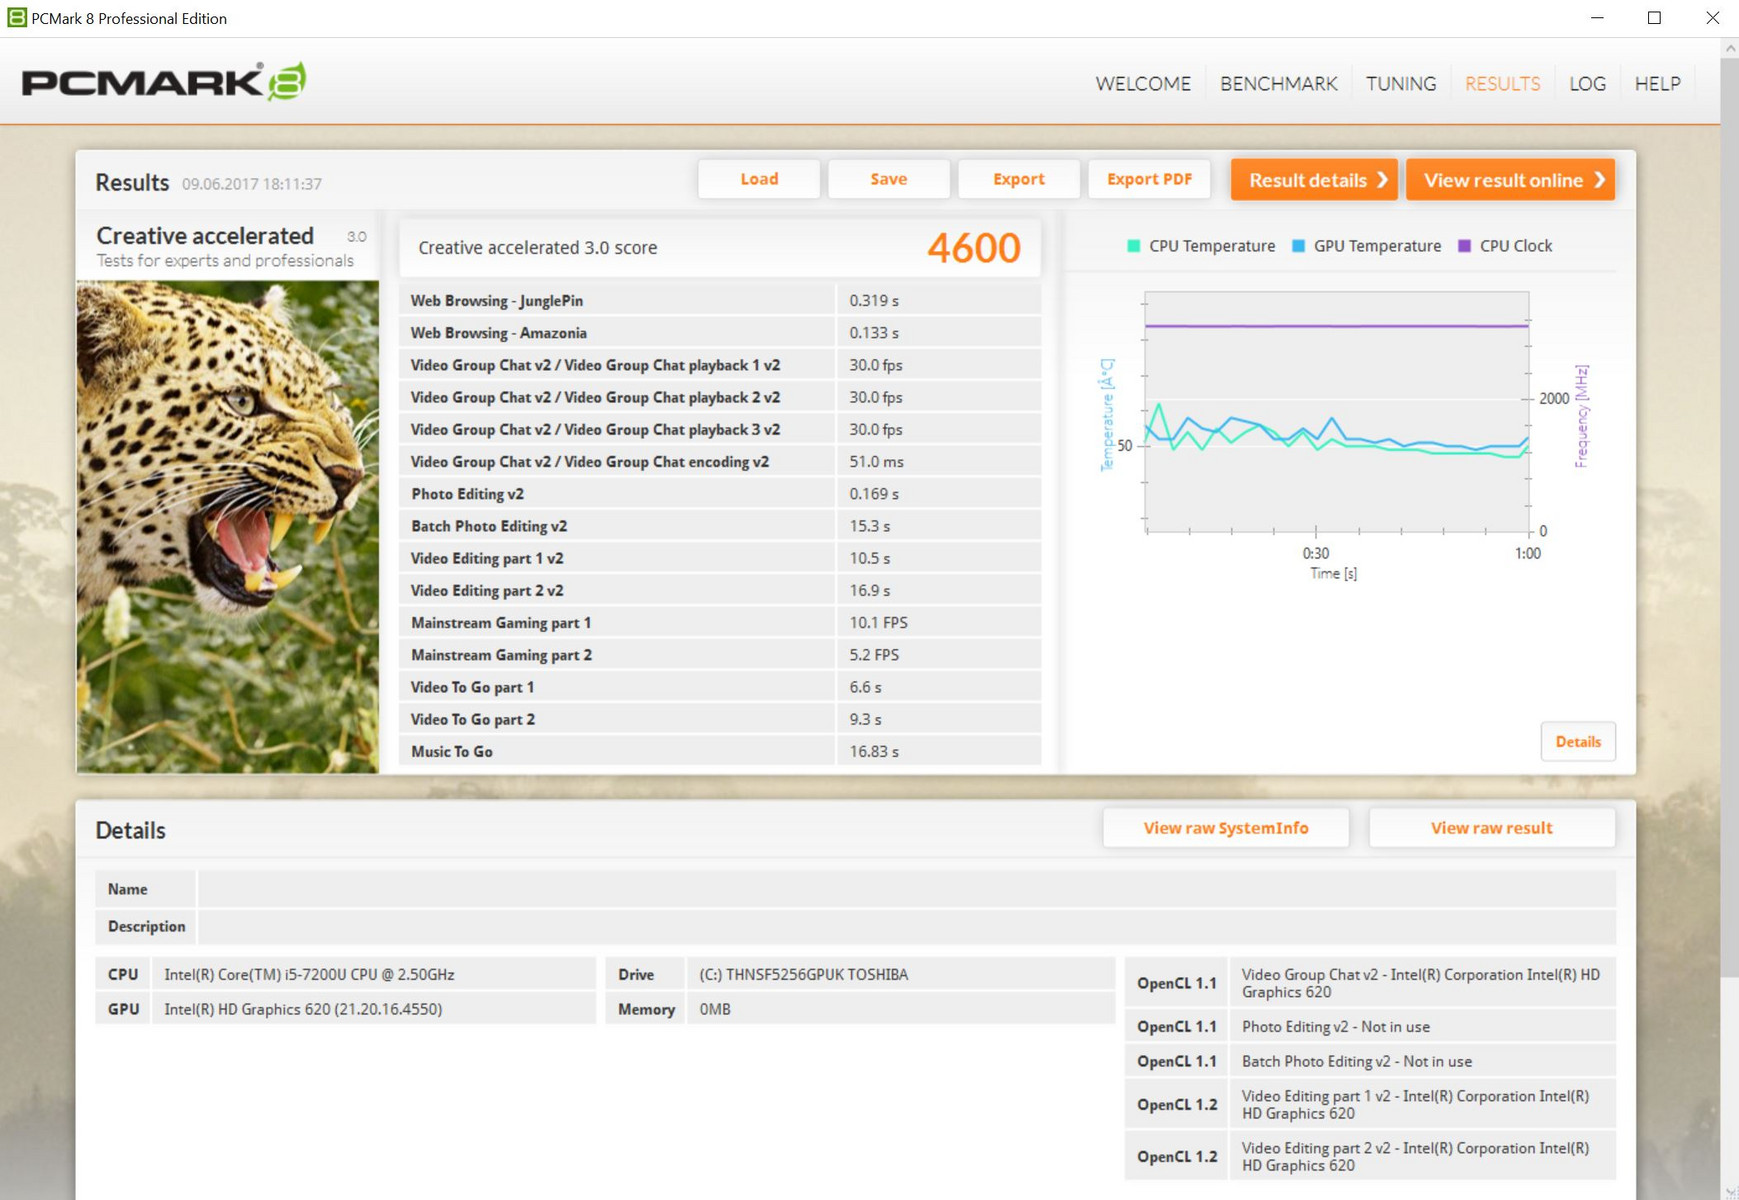
| Creative Score Accelerated v2 | |
| Lenovo ThinkPad T470s-20HGS00V00 | |
| Lenovo ThinkPad X1 Carbon 2017-20HQS03P00 | |
| Lenovo ThinkPad X1 Carbon 2017-20HR0021GE | |
| Lenovo ThinkPad X1 Carbon 20FB003RGE | |
| HP EliteBook Folio 1040 G3 | |
| Lenovo ThinkPad X1 Carbon 20FB-005XUS | |
| PCMark 8 Home Score Accelerated v2 | 3824 points | |
| PCMark 8 Creative Score Accelerated v2 | 4600 points | |
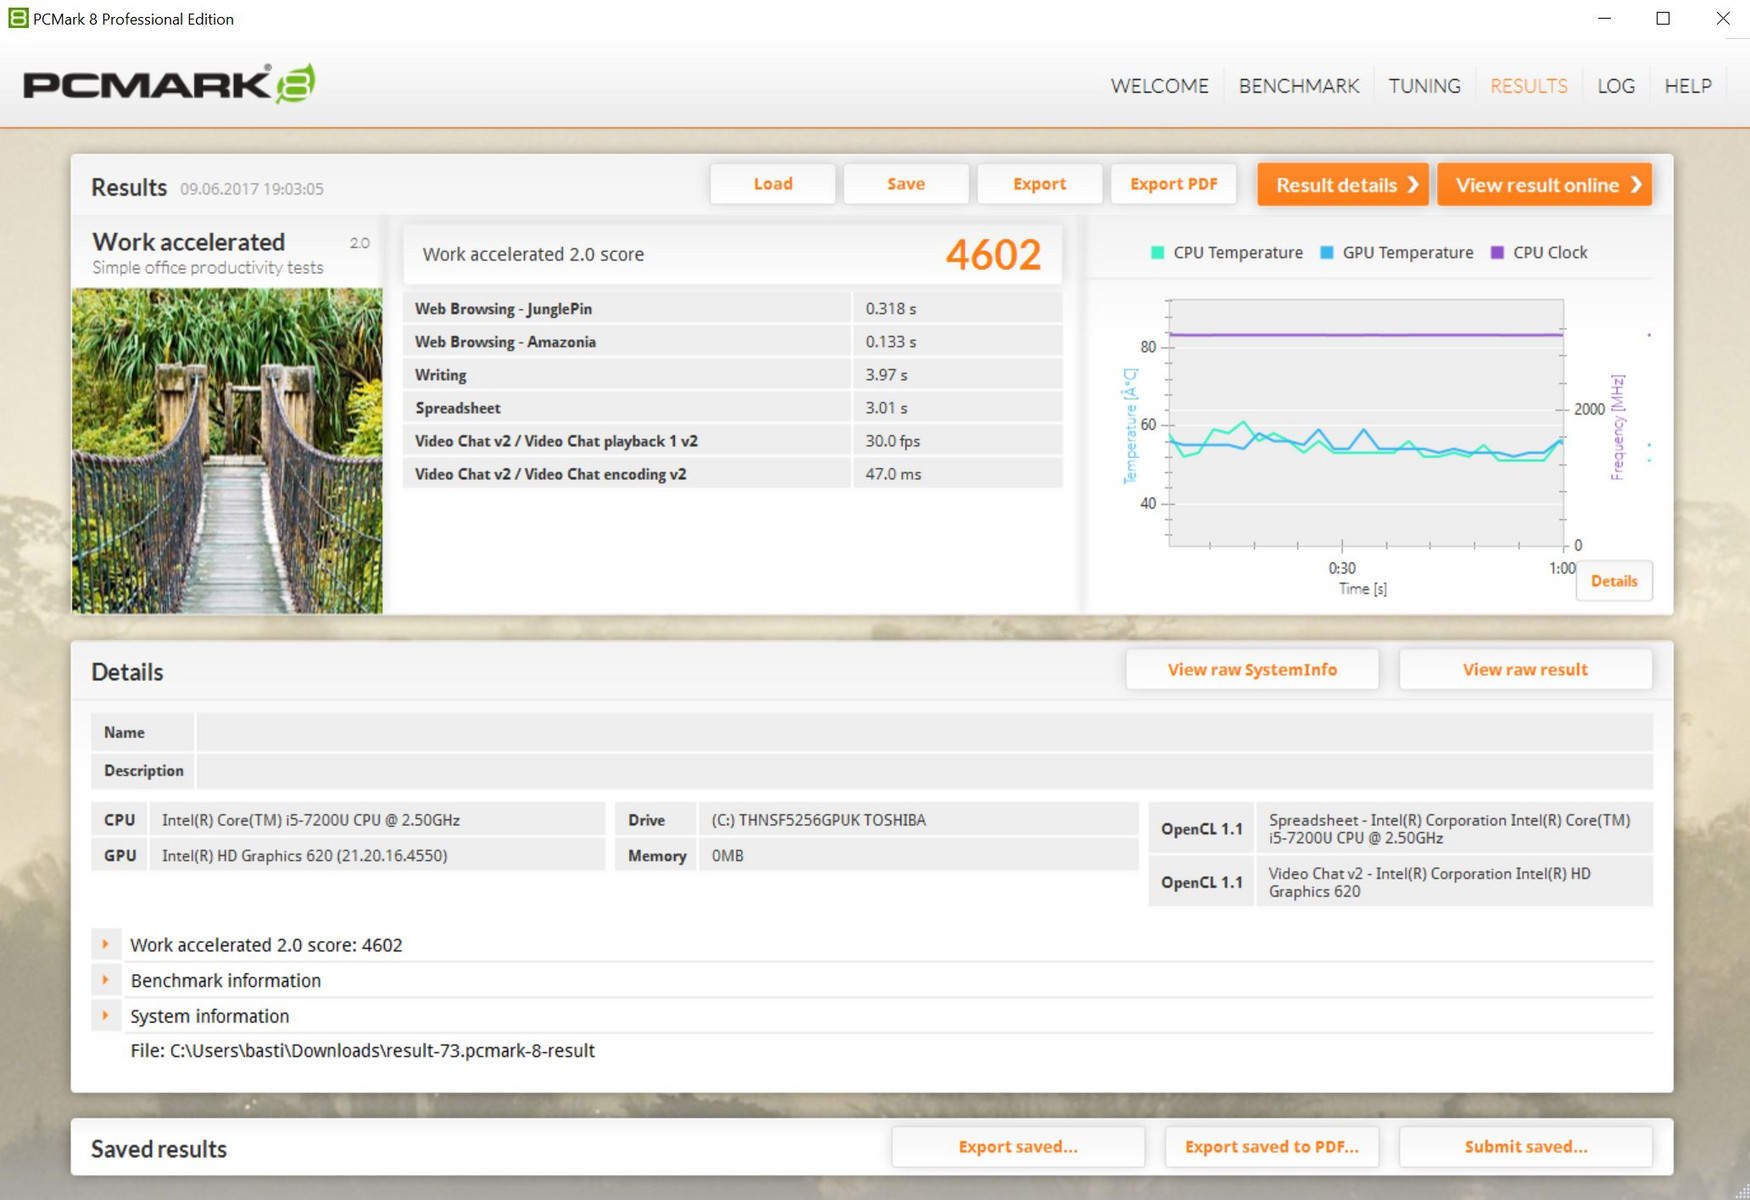
| PCMark 8 Work Score Accelerated v2 | 4602 points | |
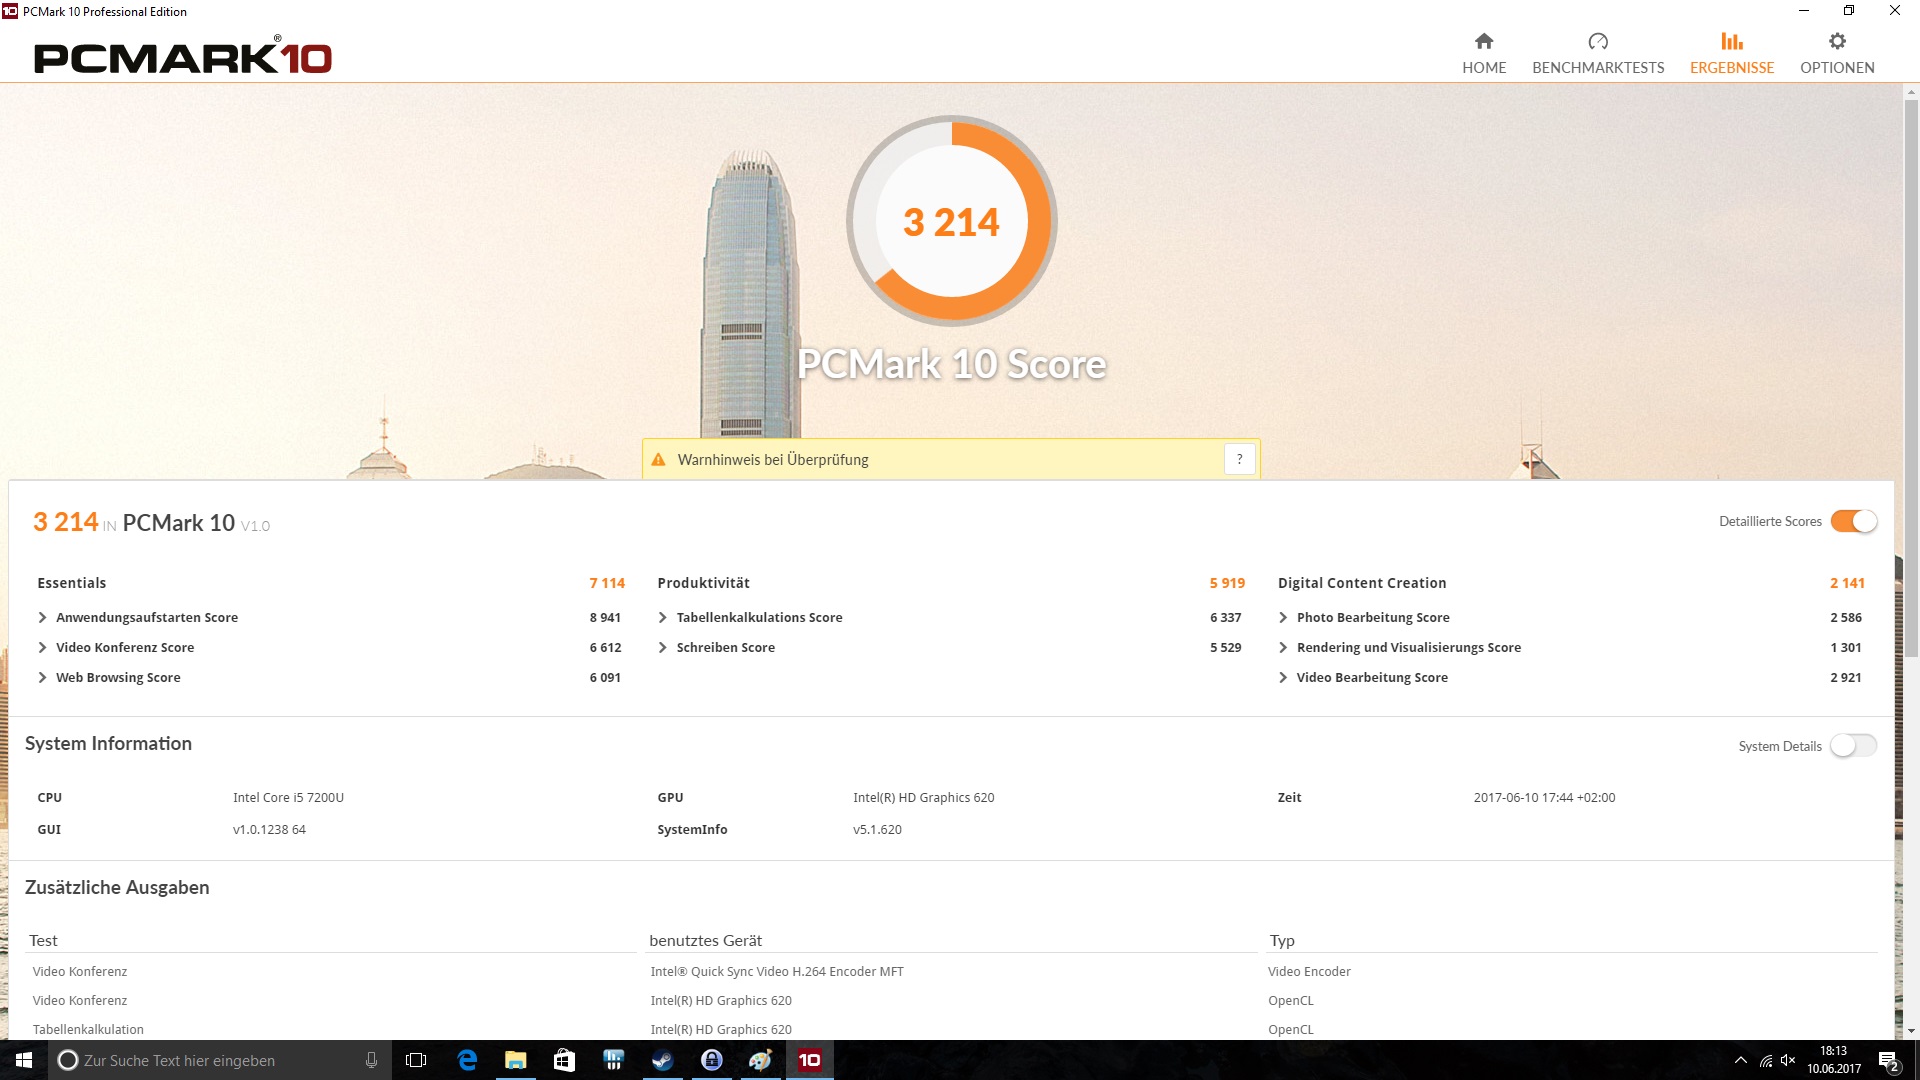
| PCMark 10 Score | 3214 points | |
Aide | ||
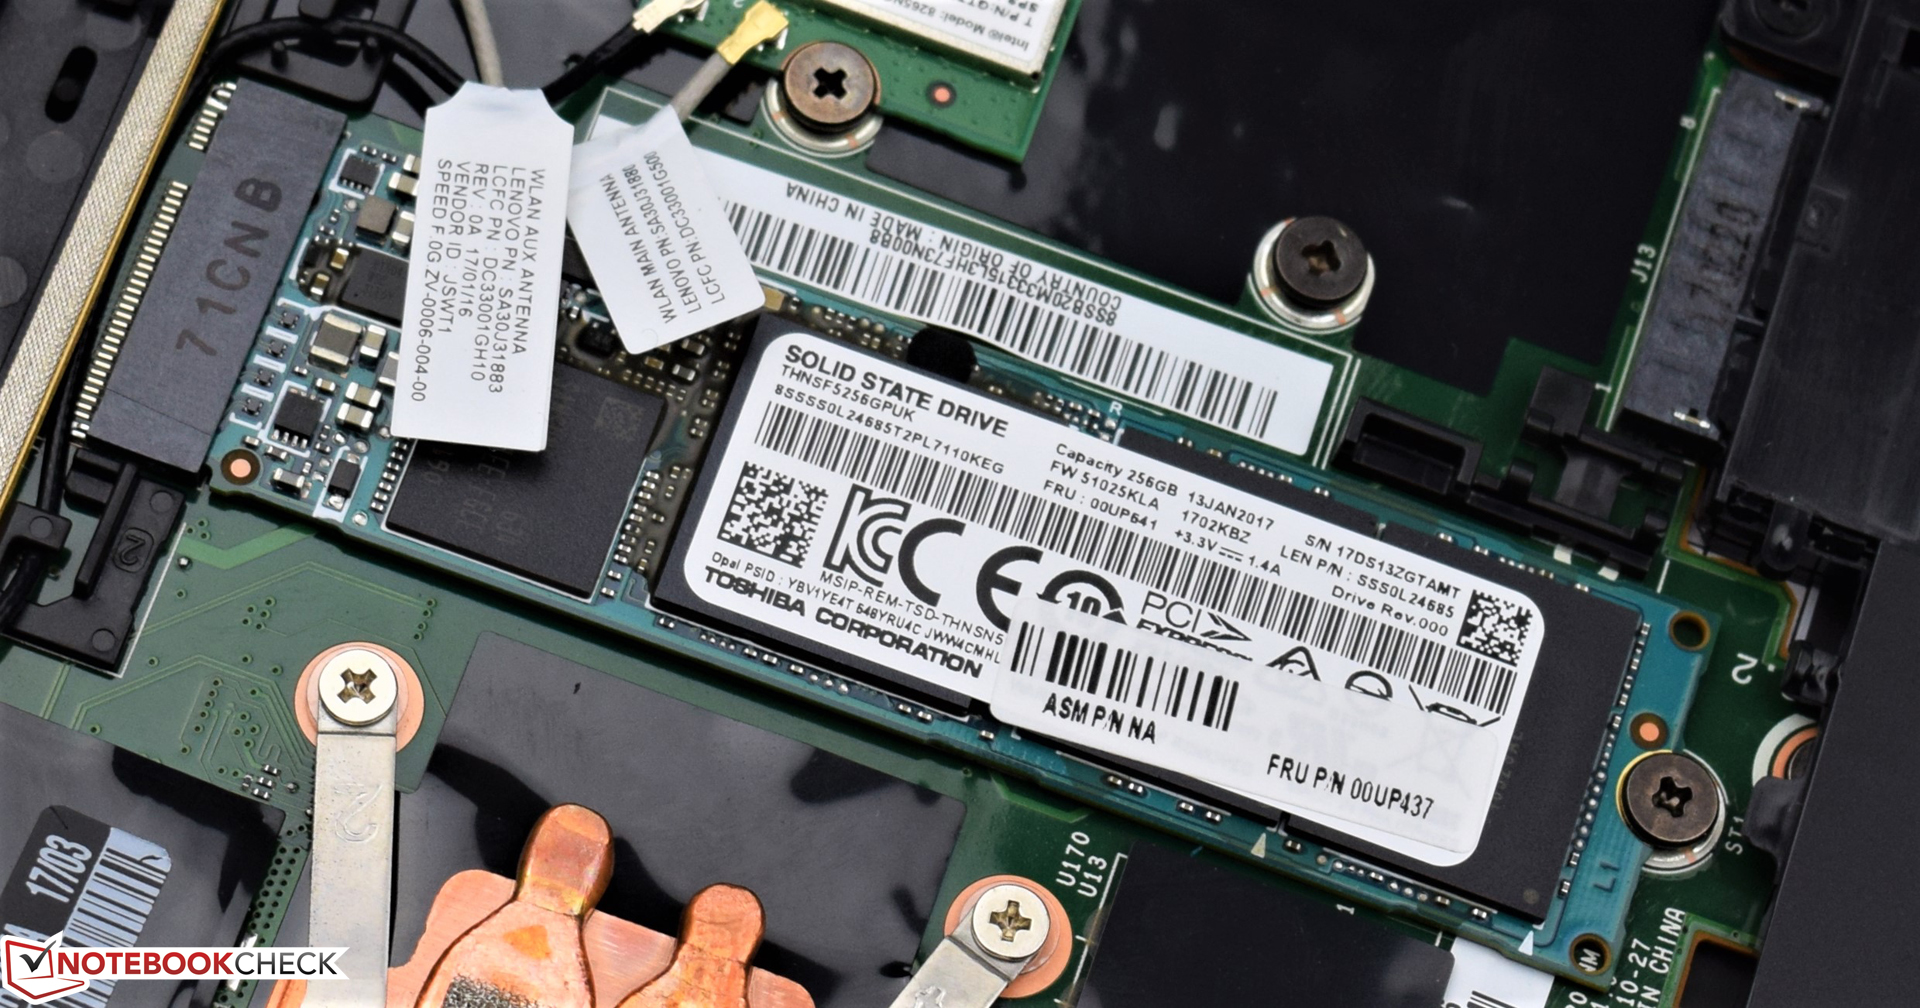
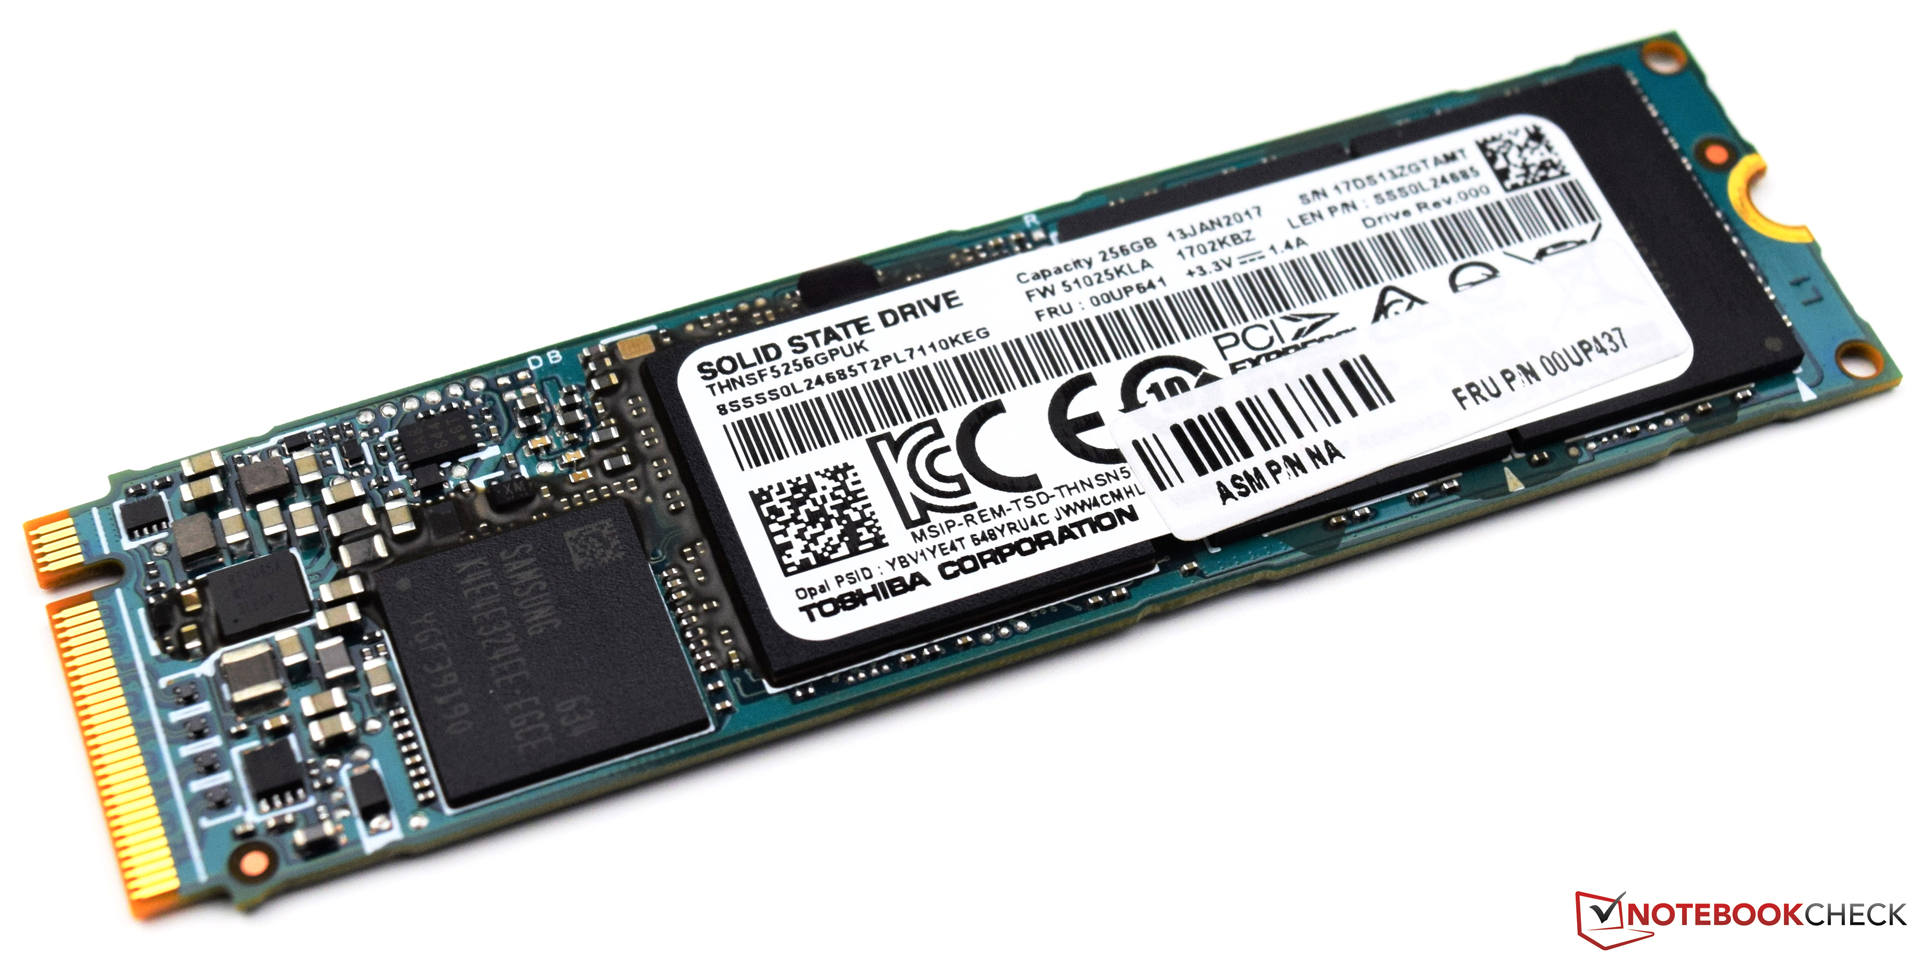
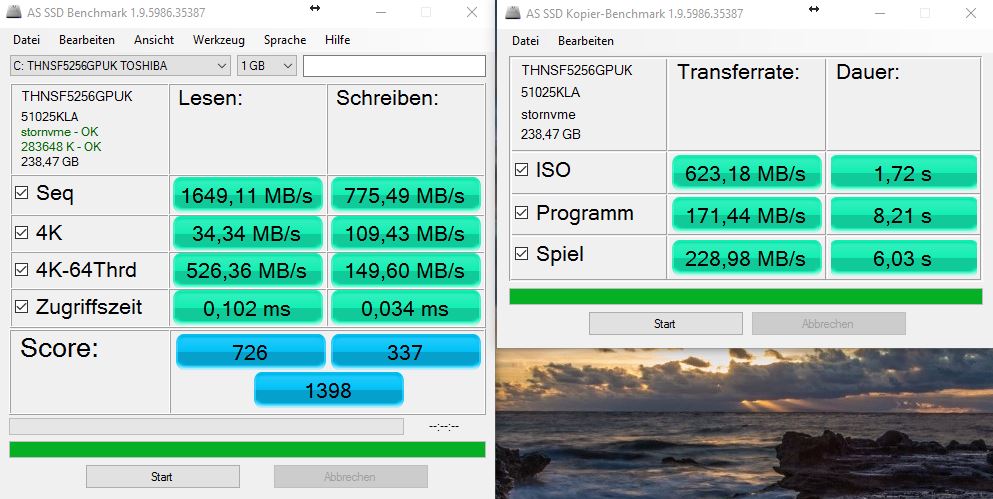
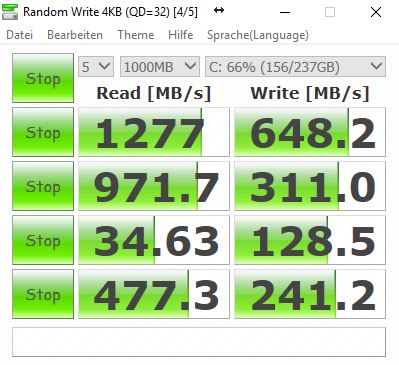
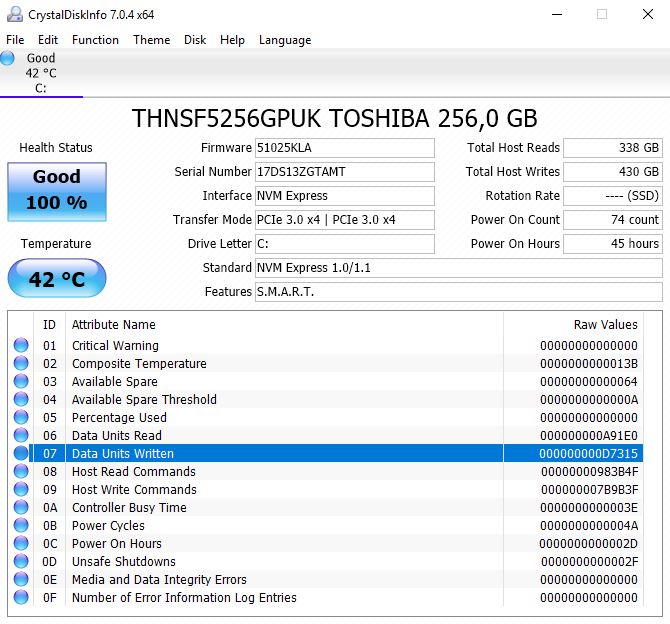
| Lenovo ThinkPad X1 Carbon 2017-20HR0021GE Toshiba THNSF5256GPUK | Lenovo ThinkPad X1 Carbon 2017-20HQS03P00 Samsung PM961 NVMe MZVLW512HMJP | Lenovo ThinkPad X1 Carbon 20FB-005XUS Samsung SM951 MZVPV256 m.2 | Lenovo ThinkPad X1 Carbon 20FB003RGE Samsung SSD PM871 MZNLN256HCHP | Lenovo ThinkPad T470s-20HGS00V00 Samsung SSD PM961 1TB M.2 PCIe 3.0 x4 NVMe (MZVLW1T0) | HP EliteBook Folio 1040 G3 Samsung SM951 MZVPV256HDGL m.2 PCI-e | Fujitsu LifeBook U747 Samsung MZYTY256HDHP | |
|---|---|---|---|---|---|---|---|
| CrystalDiskMark 3.0 | 79% | 68% | -30% | 83% | 76% | -24% | |
| Read Seq (MB/s) | 1277 | 1827 43% | 1720 35% | 439.3 -66% | 1760 38% | 1649 29% | 504 -61% |
| Write Seq (MB/s) | 648 | 1383 113% | 1263 95% | 308.1 -52% | 1666 157% | 1265 95% | 497.8 -23% |
| Read 512 (MB/s) | 972 | 814 -16% | 1223 26% | 299.5 -69% | 832 -14% | 1252 29% | 396.7 -59% |
| Write 512 (MB/s) | 311 | 1098 253% | 1249 302% | 304.2 -2% | 1064 242% | 1244 300% | 283.4 -9% |
| Read 4k (MB/s) | 34.63 | 61 76% | 49.65 43% | 34.05 -2% | 53.2 54% | 53.3 54% | 35.73 3% |
| Write 4k (MB/s) | 128.5 | 172.2 34% | 123 -4% | 86.5 -33% | 167.4 30% | 159.9 24% | 87.8 -32% |
| Read 4k QD32 (MB/s) | 477.3 | 601 26% | 464.6 -3% | 339.6 -29% | 630 32% | 559 17% | 399.1 -16% |
| Write 4k QD32 (MB/s) | 241.2 | 495.6 105% | 354.7 47% | 279.2 16% | 533 121% | 376.7 56% | 249.7 4% |

| 3DMark | |
| 1280x720 Cloud Gate Standard Graphics | |
| Lenovo ThinkPad T470s-20HGS00V00 | |
| Lenovo ThinkPad X1 Carbon 2017-20HQS03P00 | |
| Lenovo ThinkPad X1 Carbon 2017-20HR0021GE | |
| Lenovo ThinkPad X1 Carbon 20FB003RGE | |
| Lenovo ThinkPad X1 Carbon 20FB-005XUS | |
| Fujitsu LifeBook U747 | |
| HP EliteBook Folio 1040 G3 | |
| 1920x1080 Fire Strike Graphics | |
| Lenovo ThinkPad T470s-20HGS00V00 | |
| Lenovo ThinkPad X1 Carbon 2017-20HQS03P00 | |
| Lenovo ThinkPad X1 Carbon 2017-20HR0021GE | |
| Lenovo ThinkPad X1 Carbon 20FB003RGE | |
| HP EliteBook Folio 1040 G3 | |
| Lenovo ThinkPad X1 Carbon 20FB-005XUS | |
| Fujitsu LifeBook U747 | |
| 3DMark 11 - 1280x720 Performance GPU | |
| Lenovo ThinkPad T470s-20HGS00V00 | |
| Lenovo ThinkPad X1 Carbon 2017-20HQS03P00 | |
| Lenovo ThinkPad X1 Carbon 2017-20HR0021GE | |
| Fujitsu LifeBook U747 | |
| Lenovo ThinkPad X1 Carbon 20FB003RGE | |
| HP EliteBook Folio 1040 G3 | |
| Lenovo ThinkPad X1 Carbon 20FB-005XUS | |
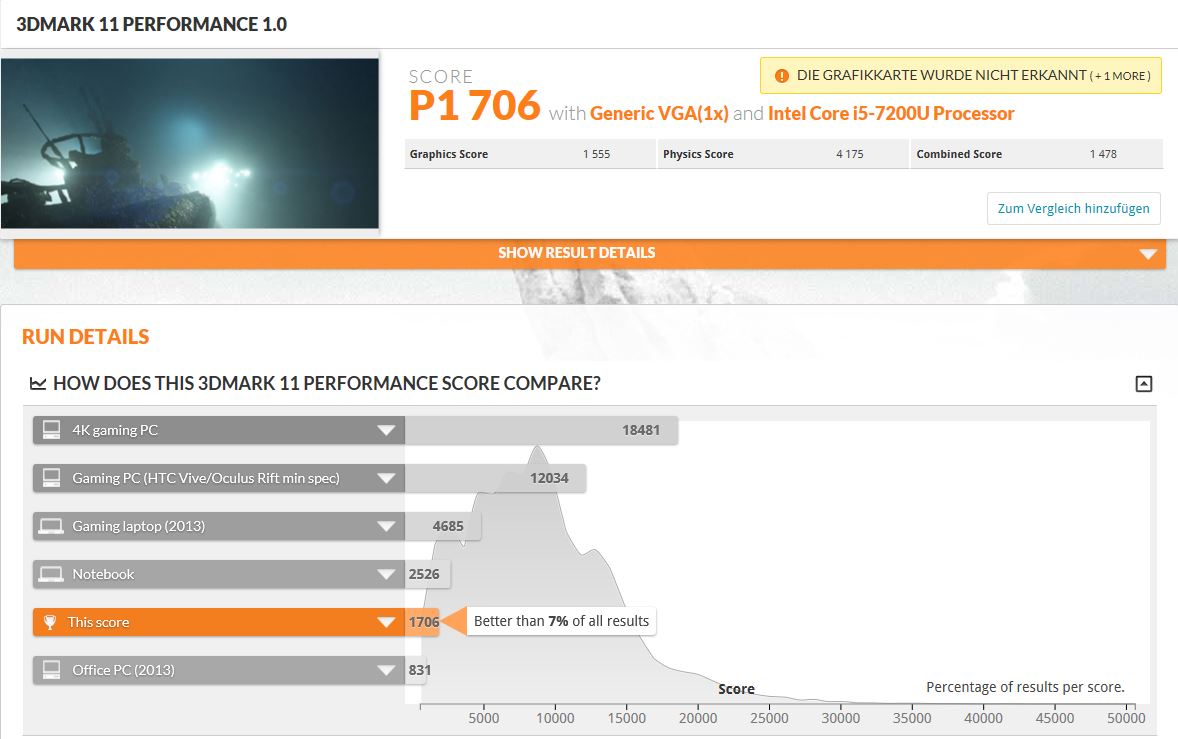
| 3DMark 11 Performance | 1706 points | |
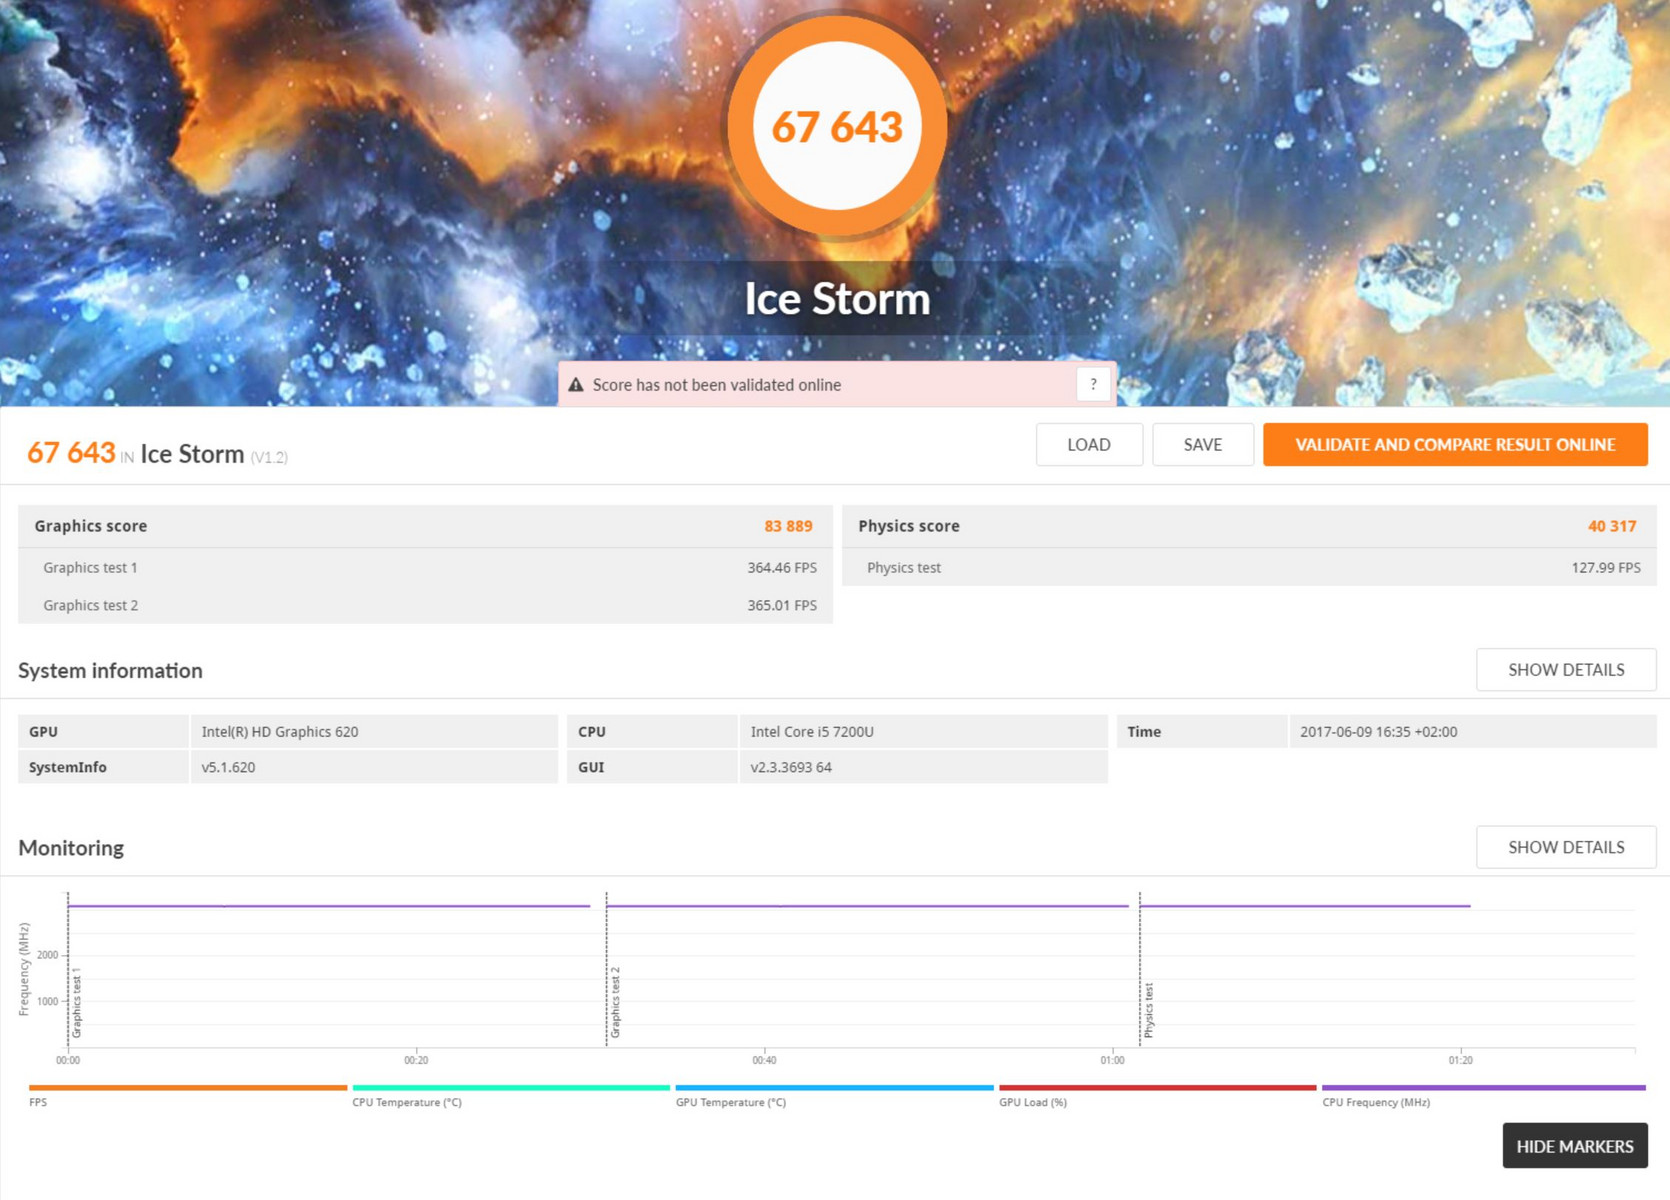
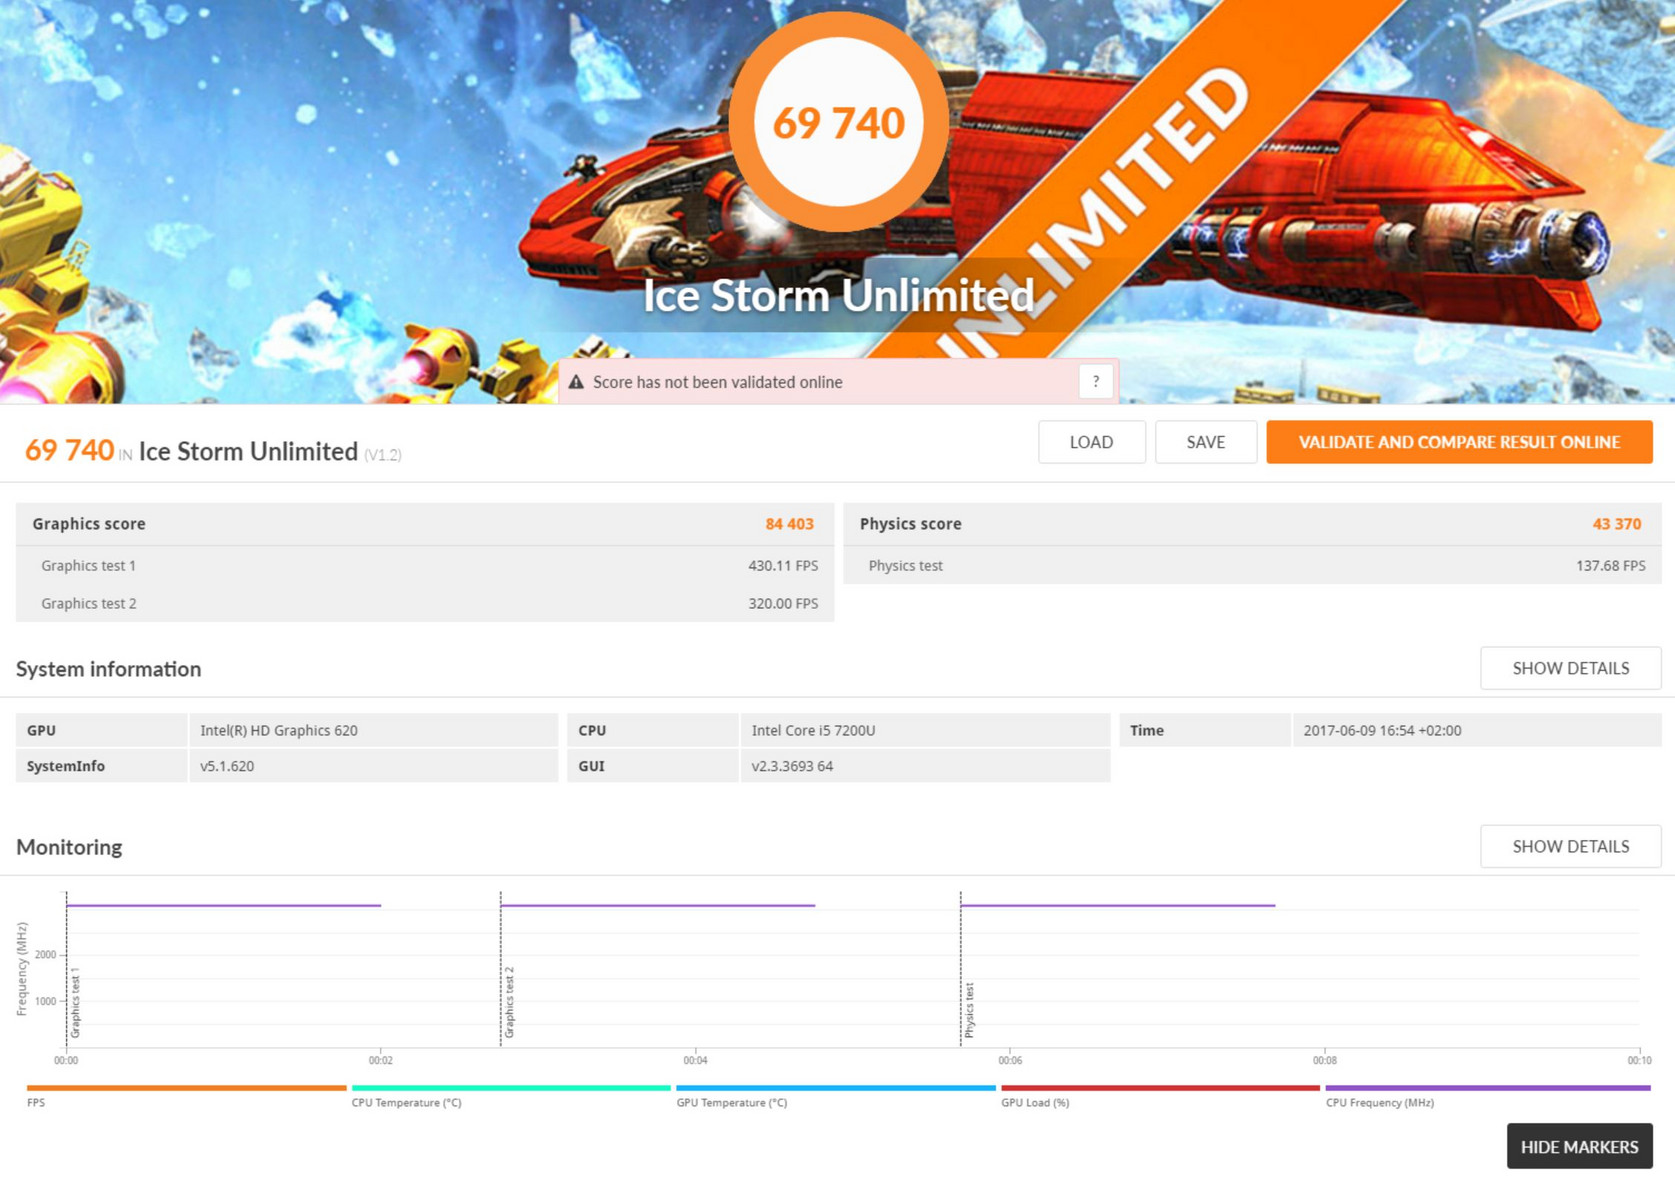
| 3DMark Ice Storm Standard Score | 67643 points | |
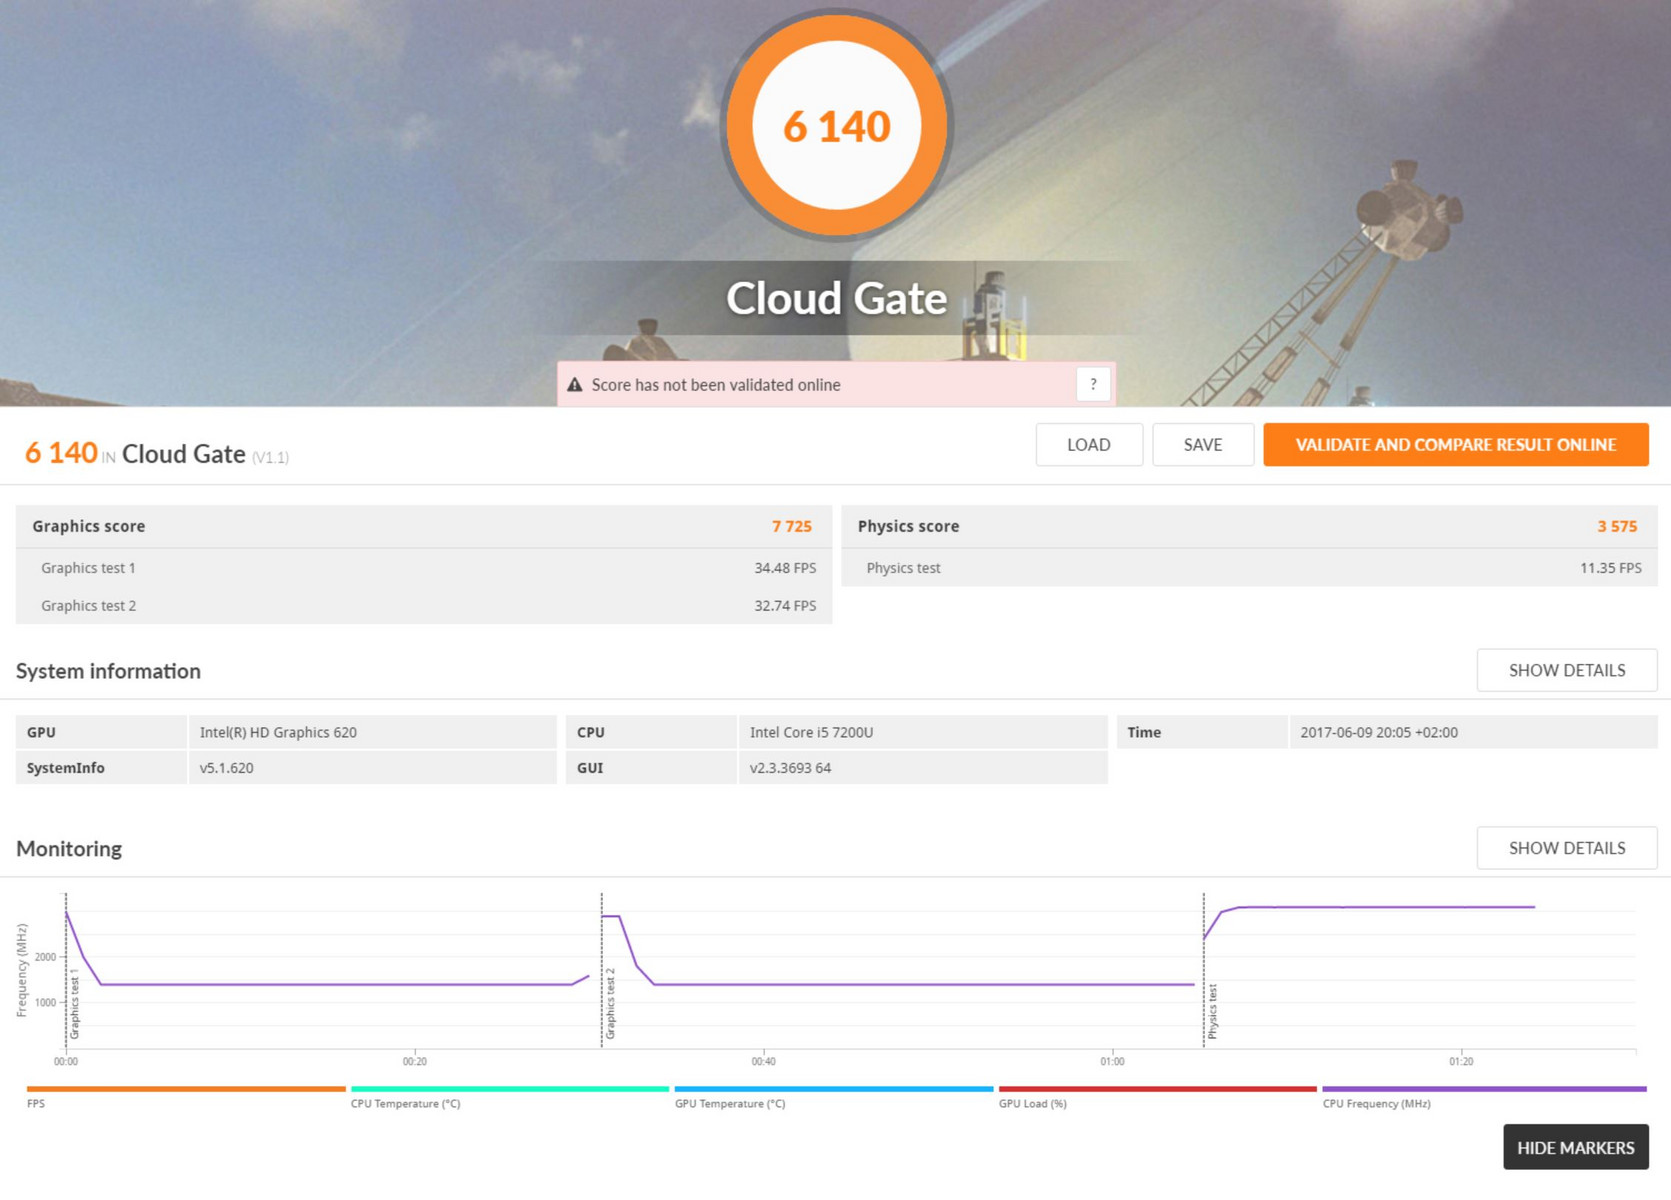
| 3DMark Cloud Gate Standard Score | 6140 points | |
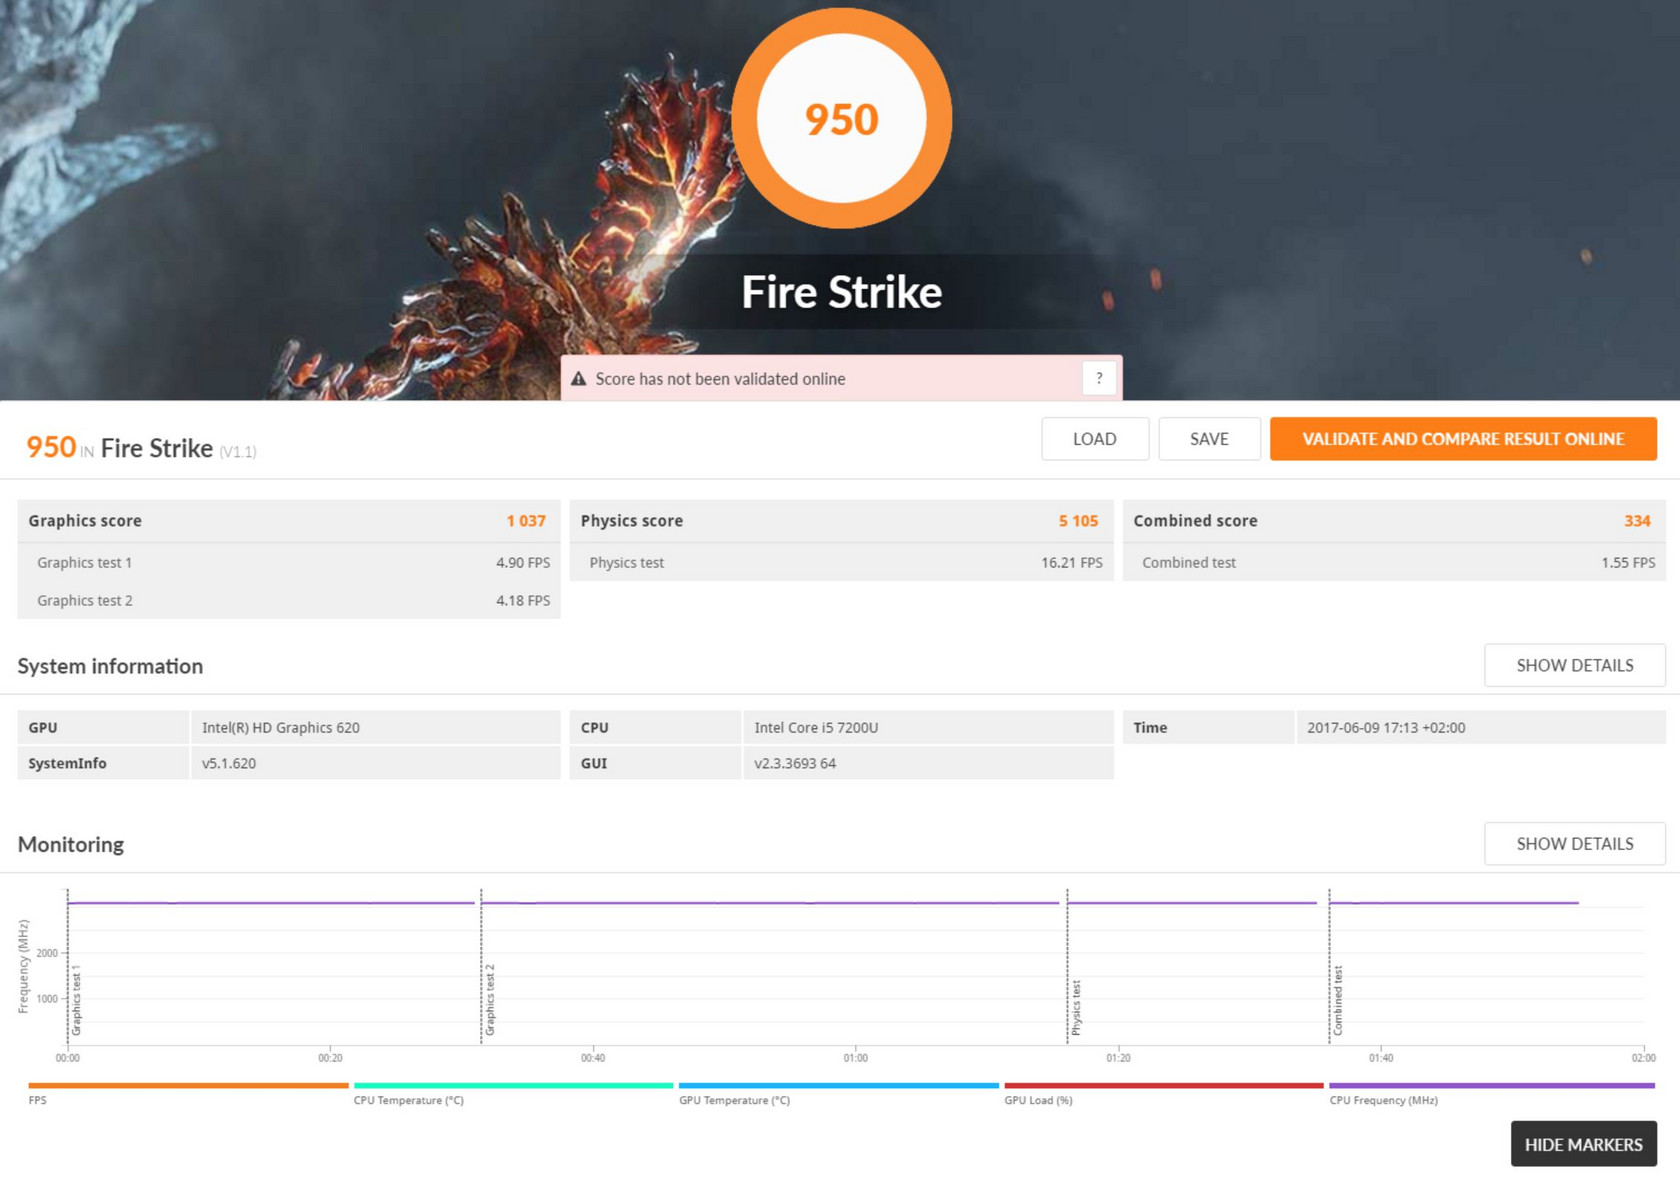
| 3DMark Fire Strike Score | 950 points | |
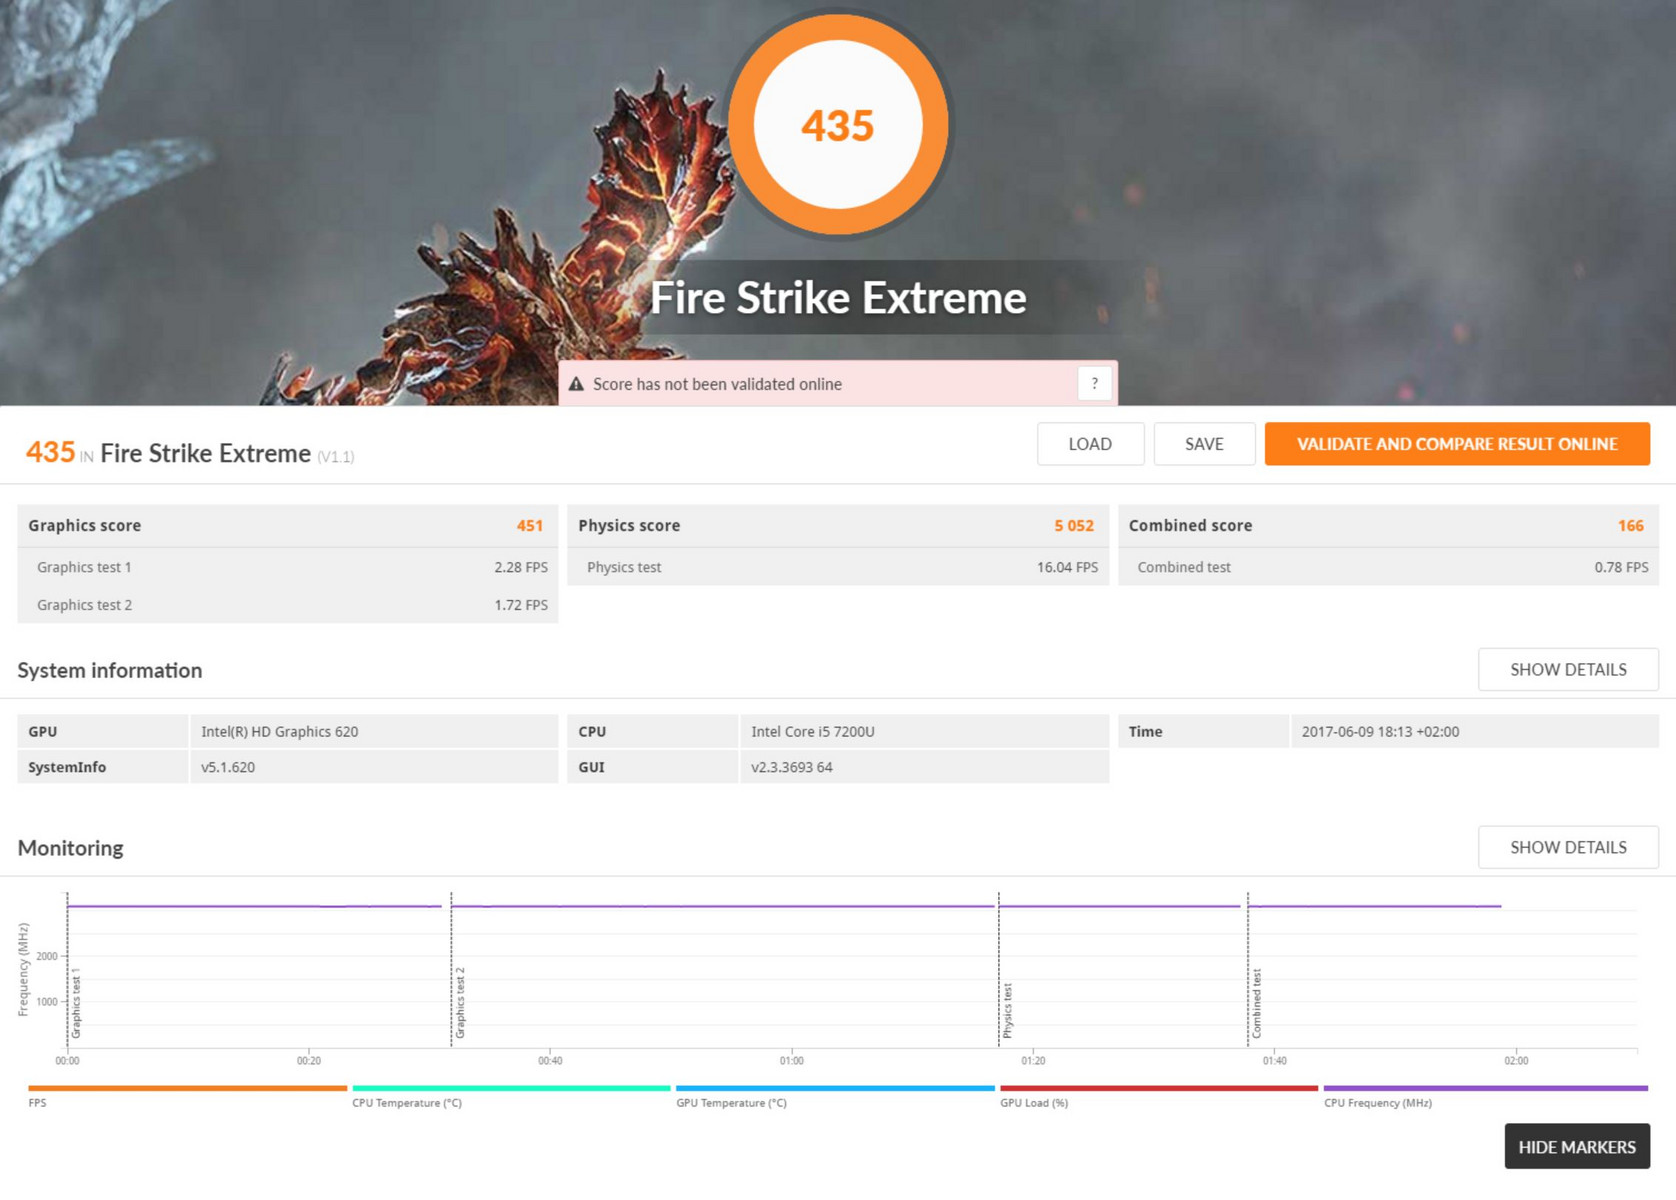
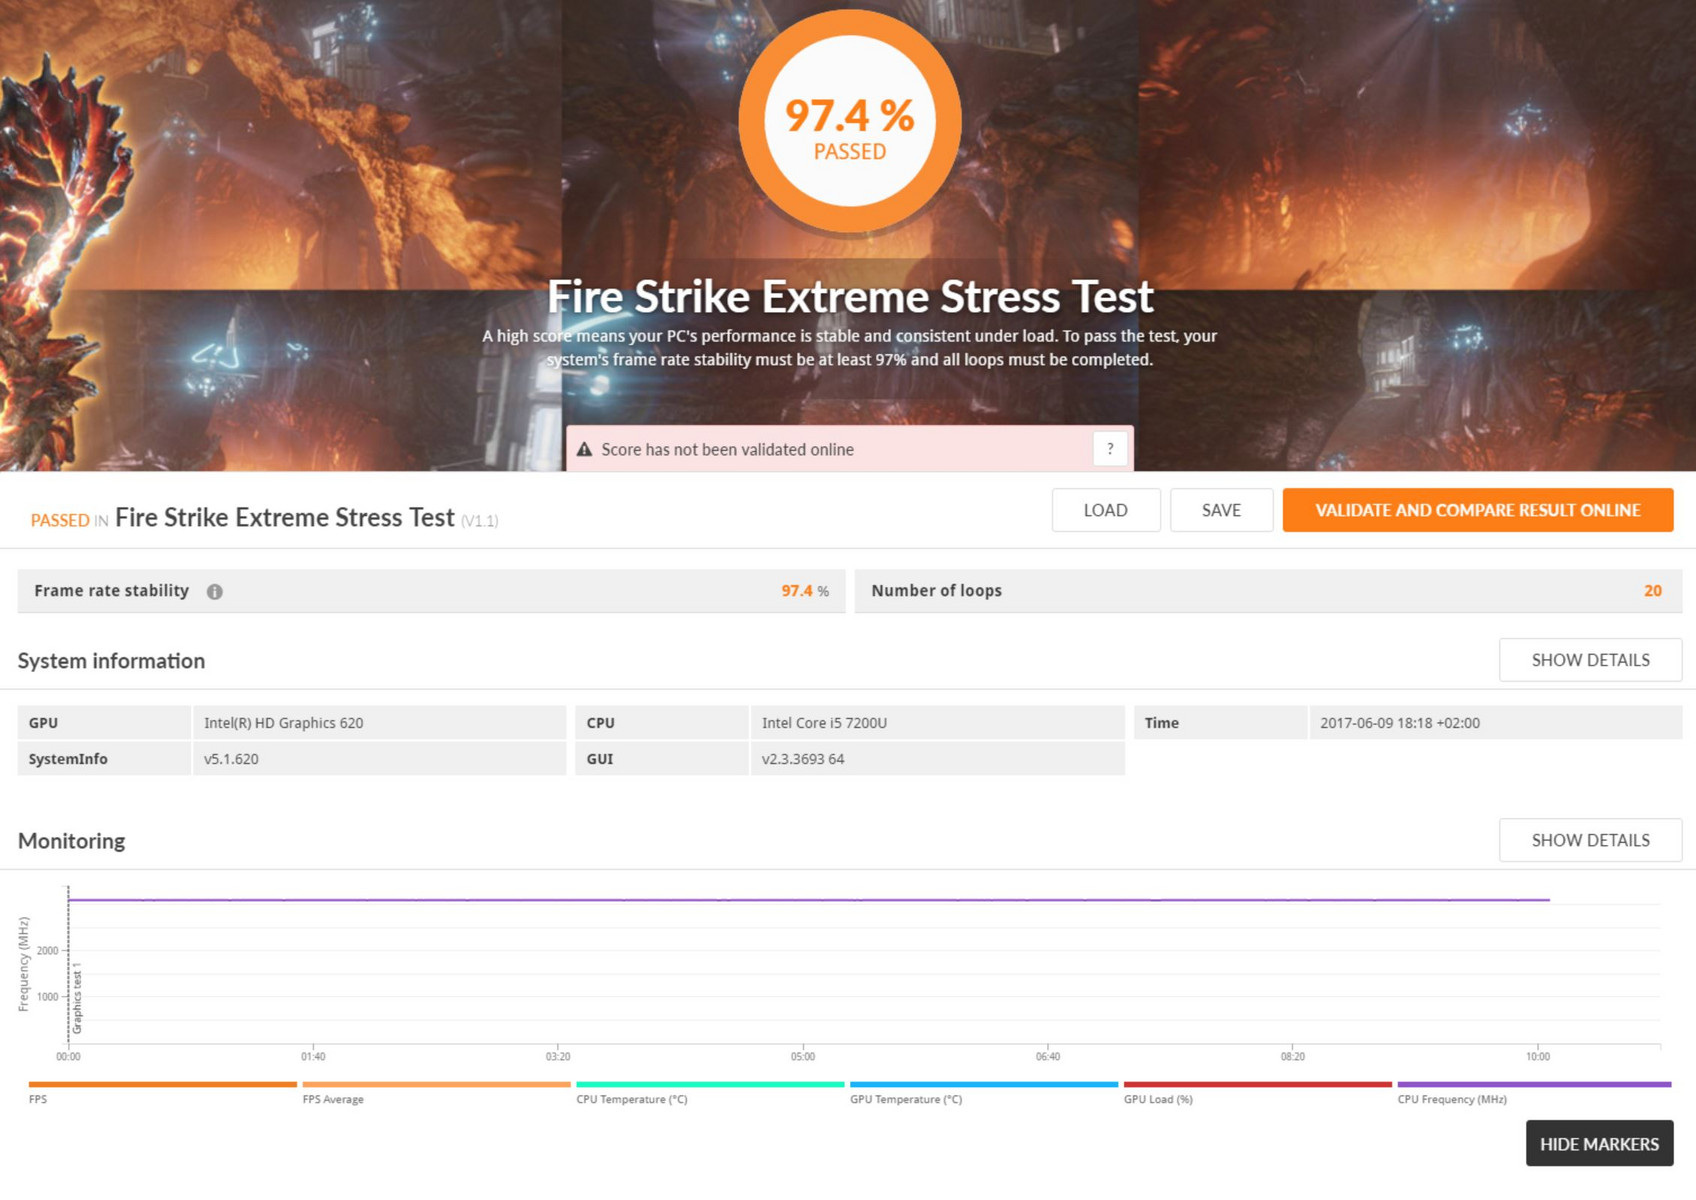
| 3DMark Fire Strike Extreme Score | 435 points | |
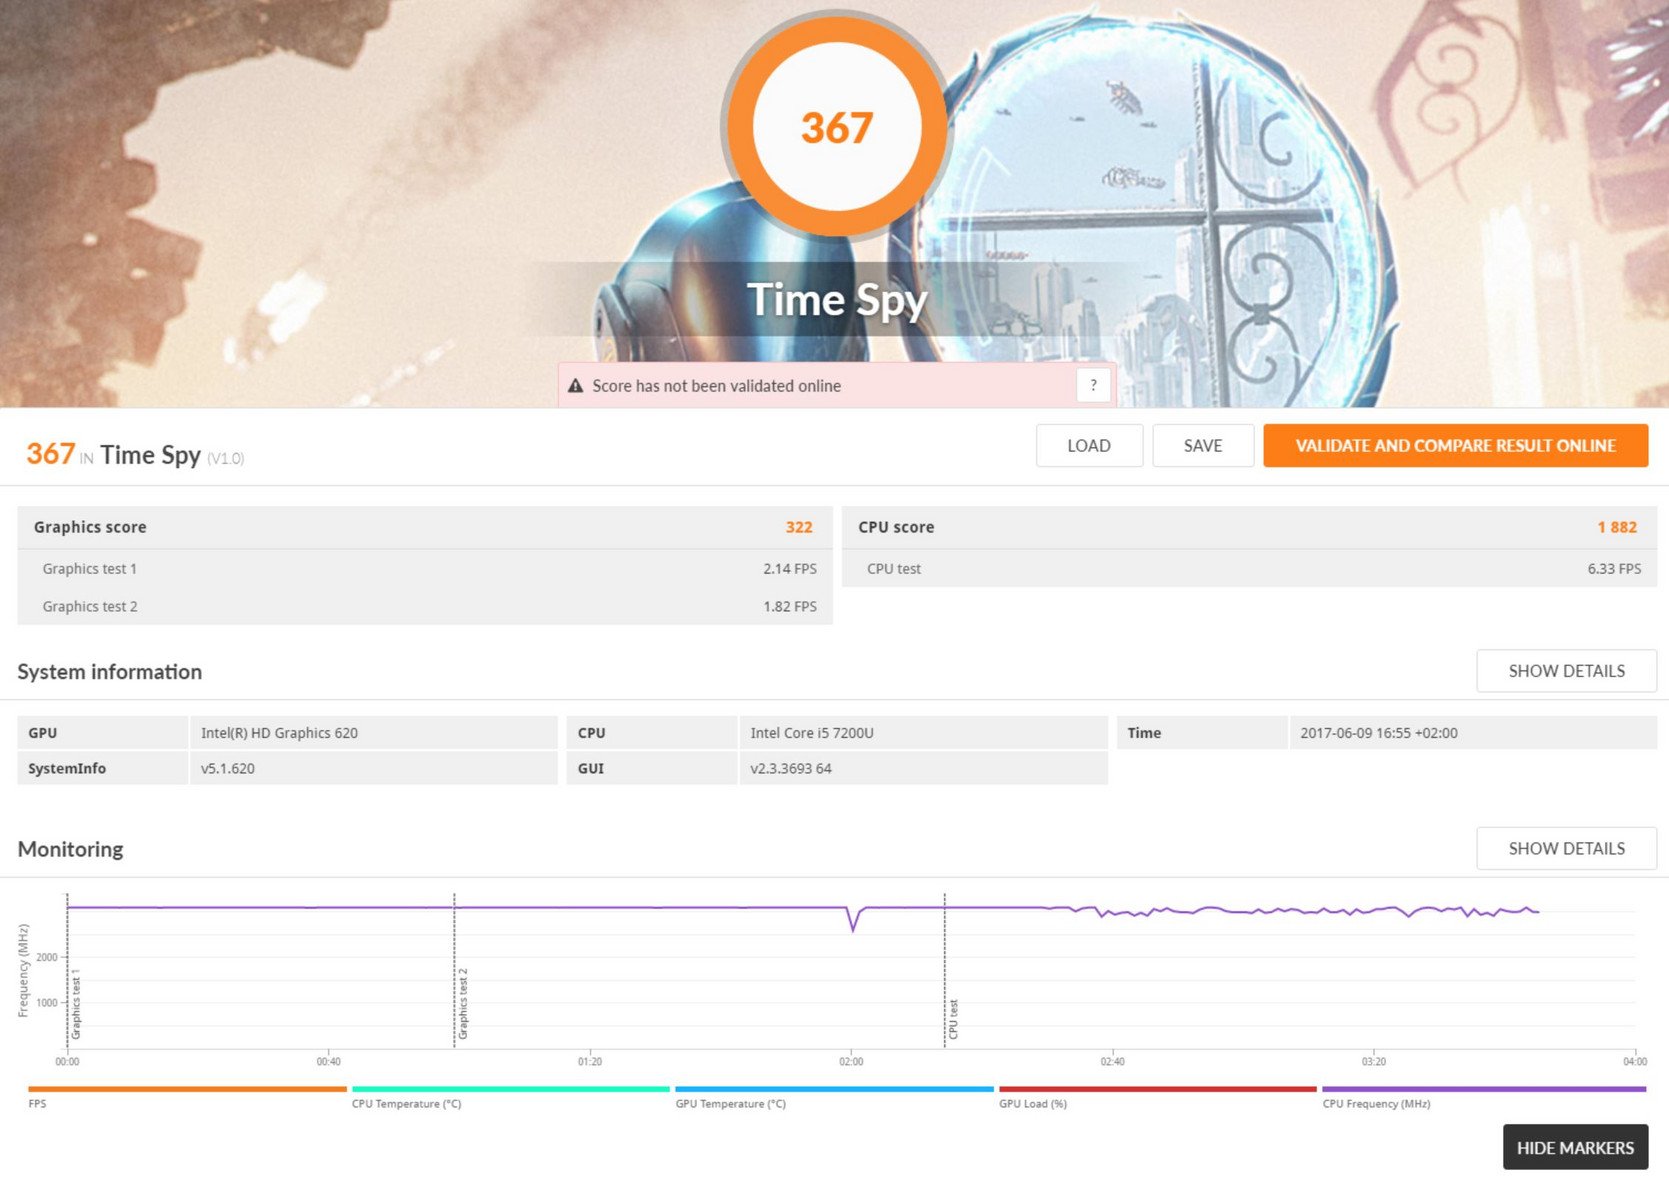
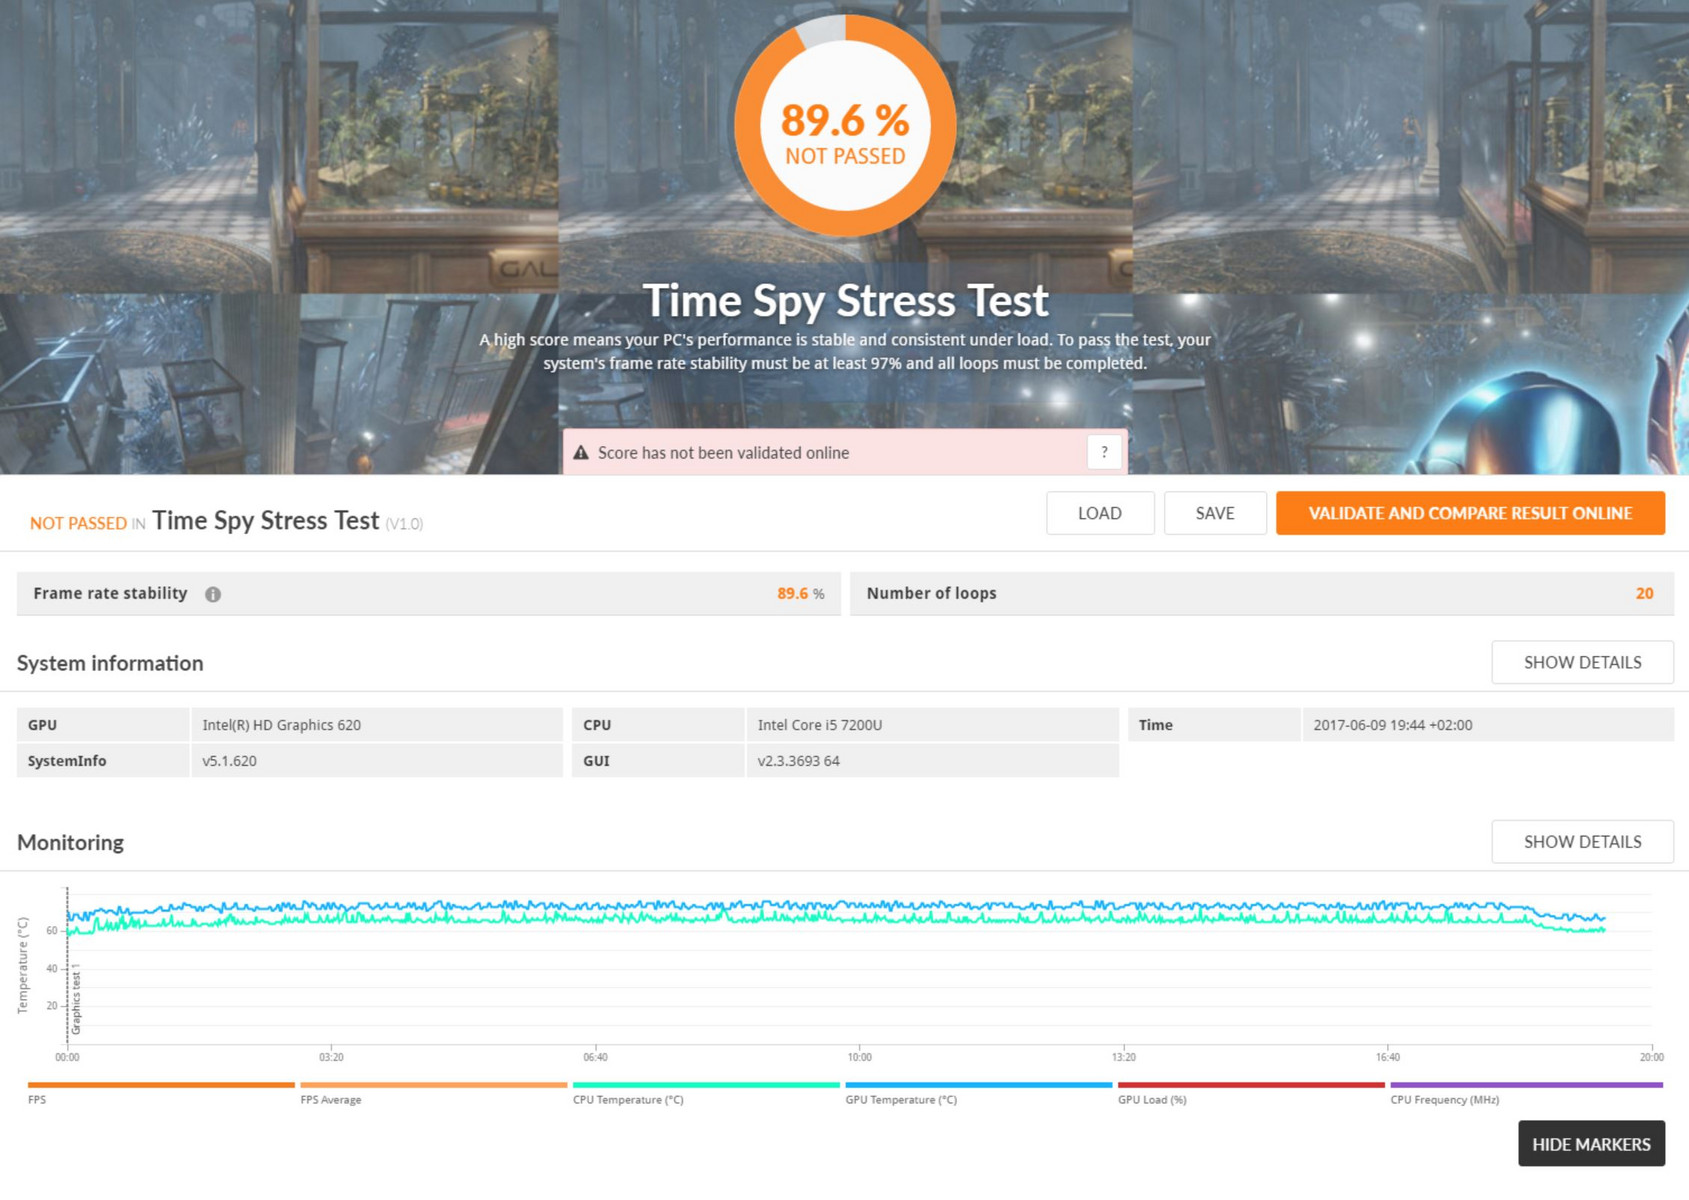
| 3DMark Time Spy Score | 367 points | |
Aide | ||
| Bas | Moyen | Élevé | Ultra | |
|---|---|---|---|---|
| BioShock Infinite (2013) | 46.1 | 28.6 | 27.7 | 8.5 |
| Battlefield 4 (2013) | 36.2 | 27.6 | 18.5 | 6.1 |
| The Witcher 3 (2015) | 11.1 | |||
| Rise of the Tomb Raider (2016) | 16.9 | 8.7 |
Degré de la nuisance sonore
| Au repos |
| 29.6 / 29.6 / 32.2 dB(A) |
| Fortement sollicité |
| 34.2 / 36.1 dB(A) |
 | ||
30 dB silencieux 40 dB(A) audible 50 dB(A) bruyant |
||
min: | ||
| Lenovo ThinkPad X1 Carbon 2017-20HR0021GE HD Graphics 620, i5-7200U, Toshiba THNSF5256GPUK | Lenovo ThinkPad X1 Carbon 2017-20HQS03P00 HD Graphics 620, i7-7500U, Samsung PM961 NVMe MZVLW512HMJP | Lenovo ThinkPad X1 Carbon 20FB-005XUS HD Graphics 520, 6300U, Samsung SM951 MZVPV256 m.2 | Lenovo ThinkPad X1 Carbon 20FB003RGE HD Graphics 520, 6500U, Samsung SSD PM871 MZNLN256HCHP | Lenovo ThinkPad T470s-20HGS00V00 HD Graphics 620, i7-7600U, Samsung SSD PM961 1TB M.2 PCIe 3.0 x4 NVMe (MZVLW1T0) | HP EliteBook Folio 1040 G3 HD Graphics 520, 6300U, Samsung SM951 MZVPV256HDGL m.2 PCI-e | Fujitsu LifeBook U747 HD Graphics 620, i5-7200U, Samsung MZYTY256HDHP | |
|---|---|---|---|---|---|---|---|
| Noise | -1% | 3% | 1% | -2% | 3% | 8% | |
| arrêt / environnement * (dB) | 29.6 | 29.3 1% | 28.8 3% | 29.1 2% | 28.9 2% | 29.1 2% | 28.2 5% |
| Idle Minimum * (dB) | 29.6 | 29.3 1% | 28.8 3% | 29.1 2% | 28.9 2% | 29.1 2% | 28.2 5% |
| Idle Average * (dB) | 29.6 | 29.3 1% | 28.9 2% | 29.1 2% | 28.9 2% | 29.1 2% | 28.2 5% |
| Idle Maximum * (dB) | 32.2 | 32.2 -0% | 28.9 10% | 29.1 10% | 30.1 7% | 29.1 10% | 28.2 12% |
| Load Average * (dB) | 34.2 | 34.3 -0% | 35 -2% | 35.6 -4% | 39.2 -15% | 32.6 5% | 31.2 9% |
| Load Maximum * (dB) | 36.1 | 39.3 -9% | 35.8 1% | 38.1 -6% | 39.2 -9% | 37.8 -5% | 33 9% |
* ... Moindre est la valeur, meilleures sont les performances
| Lenovo ThinkPad X1 Carbon 2017-20HR0021GE HD Graphics 620, i5-7200U, Toshiba THNSF5256GPUK | Lenovo ThinkPad X1 Carbon 2017-20HQS03P00 HD Graphics 620, i7-7500U, Samsung PM961 NVMe MZVLW512HMJP | Lenovo ThinkPad X1 Carbon 20FB-005XUS HD Graphics 520, 6300U, Samsung SM951 MZVPV256 m.2 | Lenovo ThinkPad X1 Carbon 20FB003RGE HD Graphics 520, 6500U, Samsung SSD PM871 MZNLN256HCHP | Lenovo ThinkPad T470s-20HGS00V00 HD Graphics 620, i7-7600U, Samsung SSD PM961 1TB M.2 PCIe 3.0 x4 NVMe (MZVLW1T0) | HP EliteBook Folio 1040 G3 HD Graphics 520, 6300U, Samsung SM951 MZVPV256HDGL m.2 PCI-e | Fujitsu LifeBook U747 HD Graphics 620, i5-7200U, Samsung MZYTY256HDHP | |
|---|---|---|---|---|---|---|---|
| Heat | 9% | 8% | -1% | 9% | -3% | 15% | |
| Maximum Upper Side * (°C) | 48.5 | 48 1% | 40 18% | 43.2 11% | 43.5 10% | 43.2 11% | 42.6 12% |
| Maximum Bottom * (°C) | 46.1 | 47.2 -2% | 42.8 7% | 45 2% | 46.1 -0% | 47.1 -2% | 34.4 25% |
| Idle Upper Side * (°C) | 28.5 | 23.5 18% | 26.6 7% | 30.2 -6% | 24.7 13% | 30.5 -7% | 25.1 12% |
| Idle Bottom * (°C) | 27.8 | 22.6 19% | 27.4 1% | 30.6 -10% | 24.3 13% | 31.5 -13% | 24.6 12% |
* ... Moindre est la valeur, meilleures sont les performances
(-) La température maximale du côté supérieur est de 48.5 °C / 119 F, par rapport à la moyenne de 34.3 °C / 94 F, allant de 21.2 à 62.5 °C pour la classe Office.
(-) Le fond chauffe jusqu'à un maximum de 46.1 °C / 115 F, contre une moyenne de 36.8 °C / 98 F
(+) En utilisation inactive, la température moyenne du côté supérieur est de 27 °C / 81 F, par rapport à la moyenne du dispositif de 29.5 °C / 85 F.
(+) Les repose-poignets et le pavé tactile atteignent la température maximale de la peau (33.9 °C / 93 F) et ne sont donc pas chauds.
(-) La température moyenne de la zone de l'appui-paume de dispositifs similaires était de 27.5 °C / 81.5 F (-6.4 °C / #-11.5 F).
| Éteint/en veille | |
| Au repos | |
| Fortement sollicité |
|
Légende:
min: | |
| Lenovo ThinkPad X1 Carbon 2017-20HR0021GE i5-7200U, HD Graphics 620, Toshiba THNSF5256GPUK, IPS, 1920x1080, 14" | Lenovo ThinkPad X1 Carbon 2017-20HQS03P00 i7-7500U, HD Graphics 620, Samsung PM961 NVMe MZVLW512HMJP, IPS, 1920x1080, 14" | Lenovo ThinkPad X1 Carbon 20FB-005XUS 6300U, HD Graphics 520, Samsung SM951 MZVPV256 m.2, IPS, 1920x1080, 14" | Lenovo ThinkPad X1 Carbon 20FB003RGE 6500U, HD Graphics 520, Samsung SSD PM871 MZNLN256HCHP, IPS, 2560x1440, 14" | Lenovo ThinkPad T470s-20HGS00V00 i7-7600U, HD Graphics 620, Samsung SSD PM961 1TB M.2 PCIe 3.0 x4 NVMe (MZVLW1T0), IPS, 2560x1440, 14" | HP EliteBook Folio 1040 G3 6300U, HD Graphics 520, Samsung SM951 MZVPV256HDGL m.2 PCI-e, IPS, 2560x1440, 14" | Fujitsu LifeBook U747 i5-7200U, HD Graphics 620, Samsung MZYTY256HDHP, IPS LED, 1920x1080, 14" | |
|---|---|---|---|---|---|---|---|
| Power Consumption | -6% | -17% | 3% | -18% | -26% | 3% | |
| Idle Minimum * (Watt) | 3.8 | 3.84 -1% | 7.6 -100% | 3.8 -0% | 4.64 -22% | 6.3 -66% | 4.11 -8% |
| Idle Average * (Watt) | 7.1 | 6.3 11% | 9 -27% | 7.1 -0% | 8.93 -26% | 9.4 -32% | 7.87 -11% |
| Idle Maximum * (Watt) | 8.3 | 8.6 -4% | 9.6 -16% | 7.7 7% | 9.12 -10% | 10.1 -22% | 8.74 -5% |
| Load Average * (Watt) | 34.2 | 41.9 -23% | 24.5 28% | 30.2 12% | 42.2 -23% | 33.3 3% | 30.2 12% |
| Load Maximum * (Watt) | 43.3 | 48.7 -12% | 30.3 30% | 44.7 -3% | 47.3 -9% | 49.5 -14% | 32.4 25% |
* ... Moindre est la valeur, meilleures sont les performances


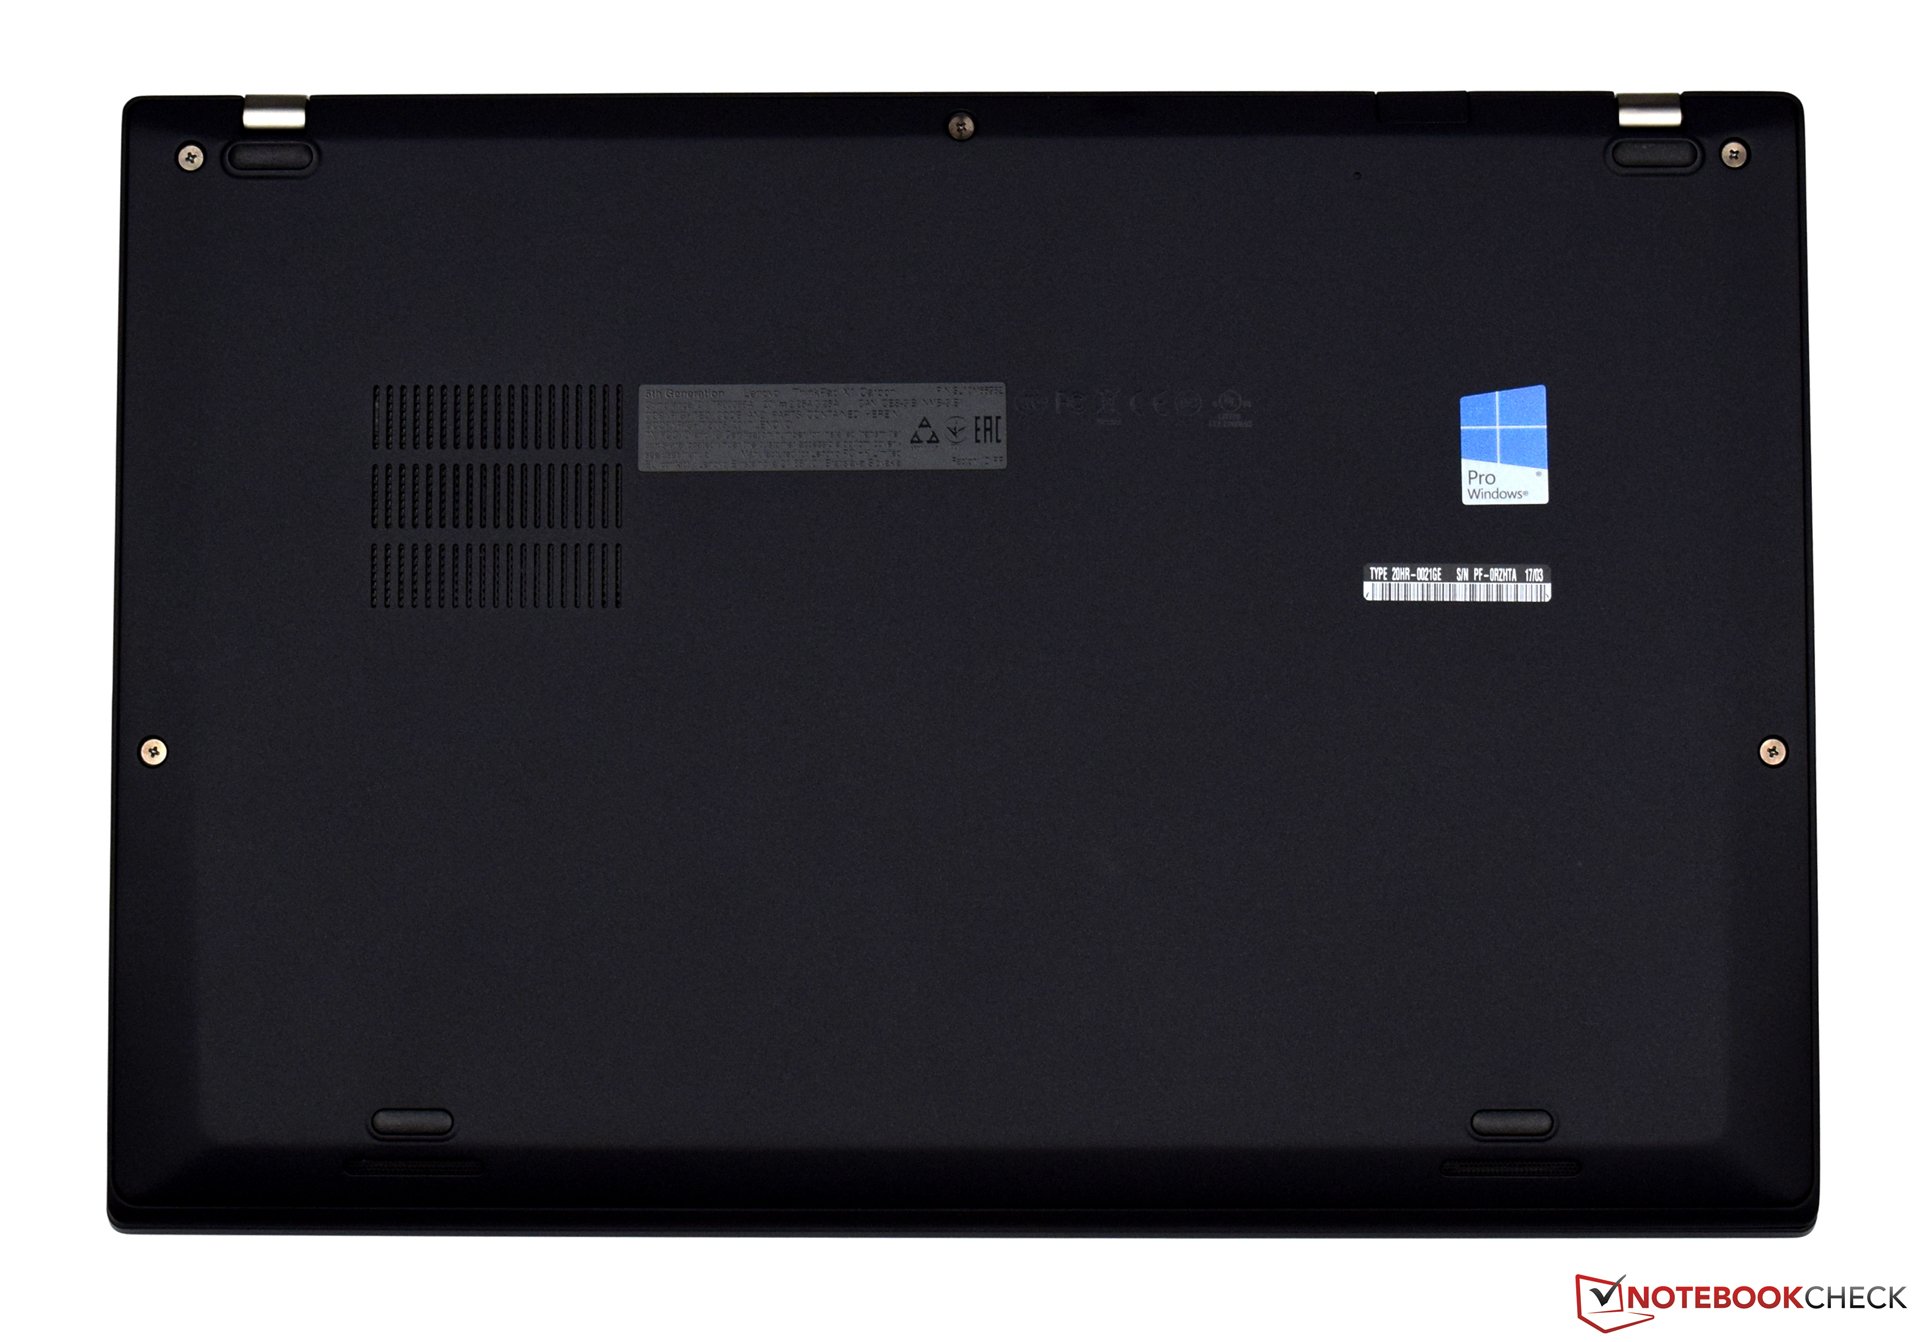
| Lenovo ThinkPad X1 Carbon 2017-20HR0021GE i5-7200U, HD Graphics 620, 57 Wh | Lenovo ThinkPad X1 Carbon 2017-20HQS03P00 i7-7500U, HD Graphics 620, 57 Wh | Lenovo ThinkPad X1 Carbon 20FB-005XUS 6300U, HD Graphics 520, 52 Wh | Lenovo ThinkPad X1 Carbon 20FB003RGE 6500U, HD Graphics 520, 52 Wh | Lenovo ThinkPad T470-20HD002HGE i5-7200U, HD Graphics 620, 48 Wh | HP EliteBook Folio 1040 G3 6300U, HD Graphics 520, 45.6 Wh | Fujitsu LifeBook U747 i5-7200U, HD Graphics 620, 50 Wh | |
|---|---|---|---|---|---|---|---|
| Autonomie de la batterie | 15% | -8% | -6% | -7% | -28% | -10% | |
| Reader / Idle (h) | 13.7 | 20.9 53% | 12.9 -6% | 15.7 15% | 8.8 -36% | 13 -5% | |
| H.264 (h) | 9.6 | 11.9 24% | 8.5 -11% | 10.4 8% | 5.7 -41% | 8.2 -15% | |
| WiFi v1.3 (h) | 9.1 | 8.3 -9% | 6.9 -24% | 7.2 -21% | 7.3 -20% | 5.2 -43% | 7.2 -21% |
| Load (h) | 2 | 1.8 -10% | 2.1 5% | 1.9 -5% | 1.8 -10% | 2.2 10% | 2 0% |
Points positifs
Points négatifs

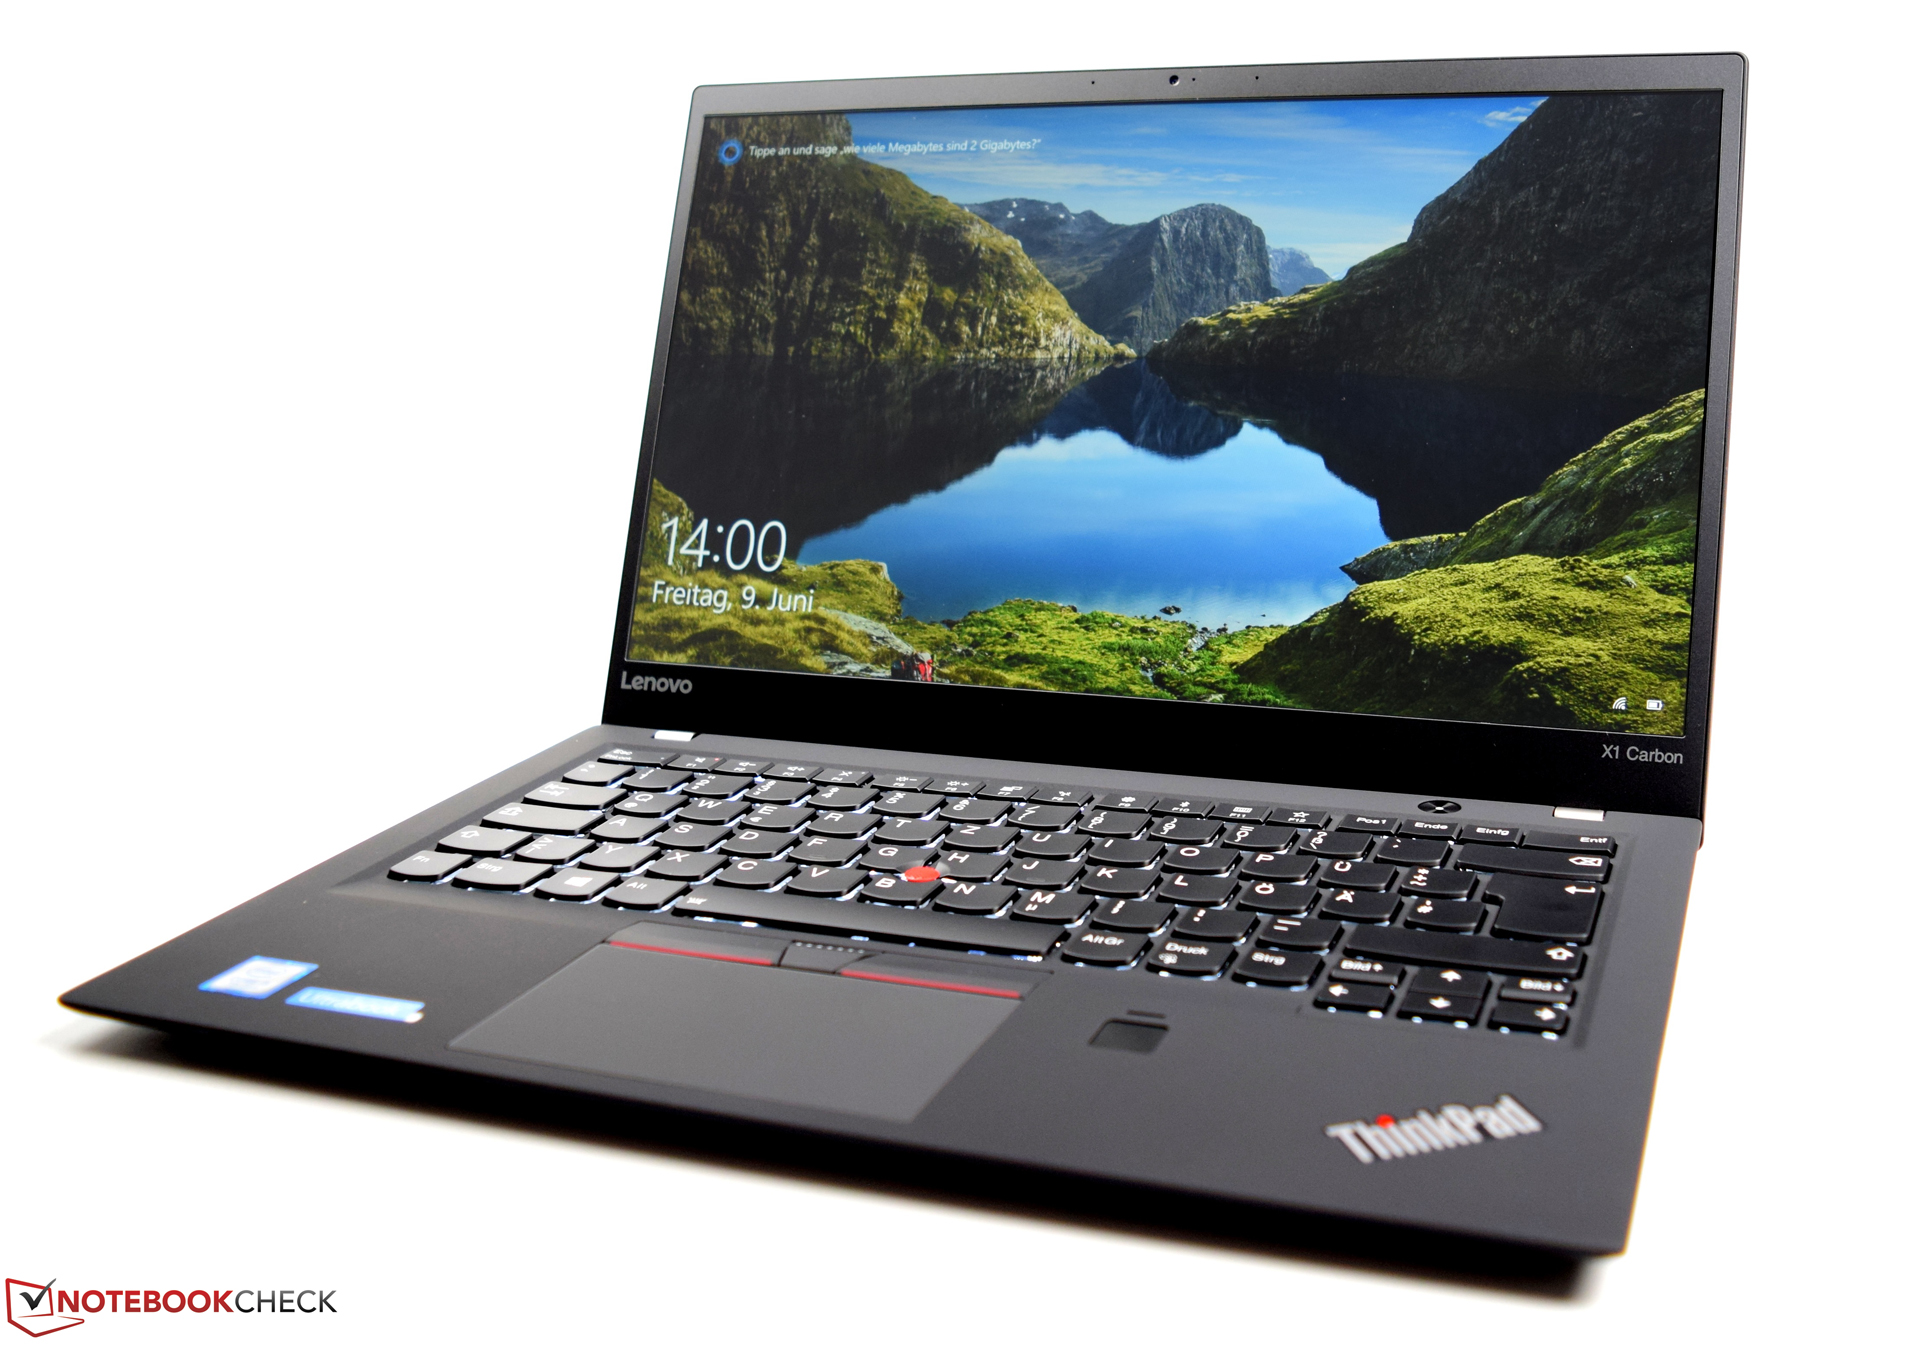
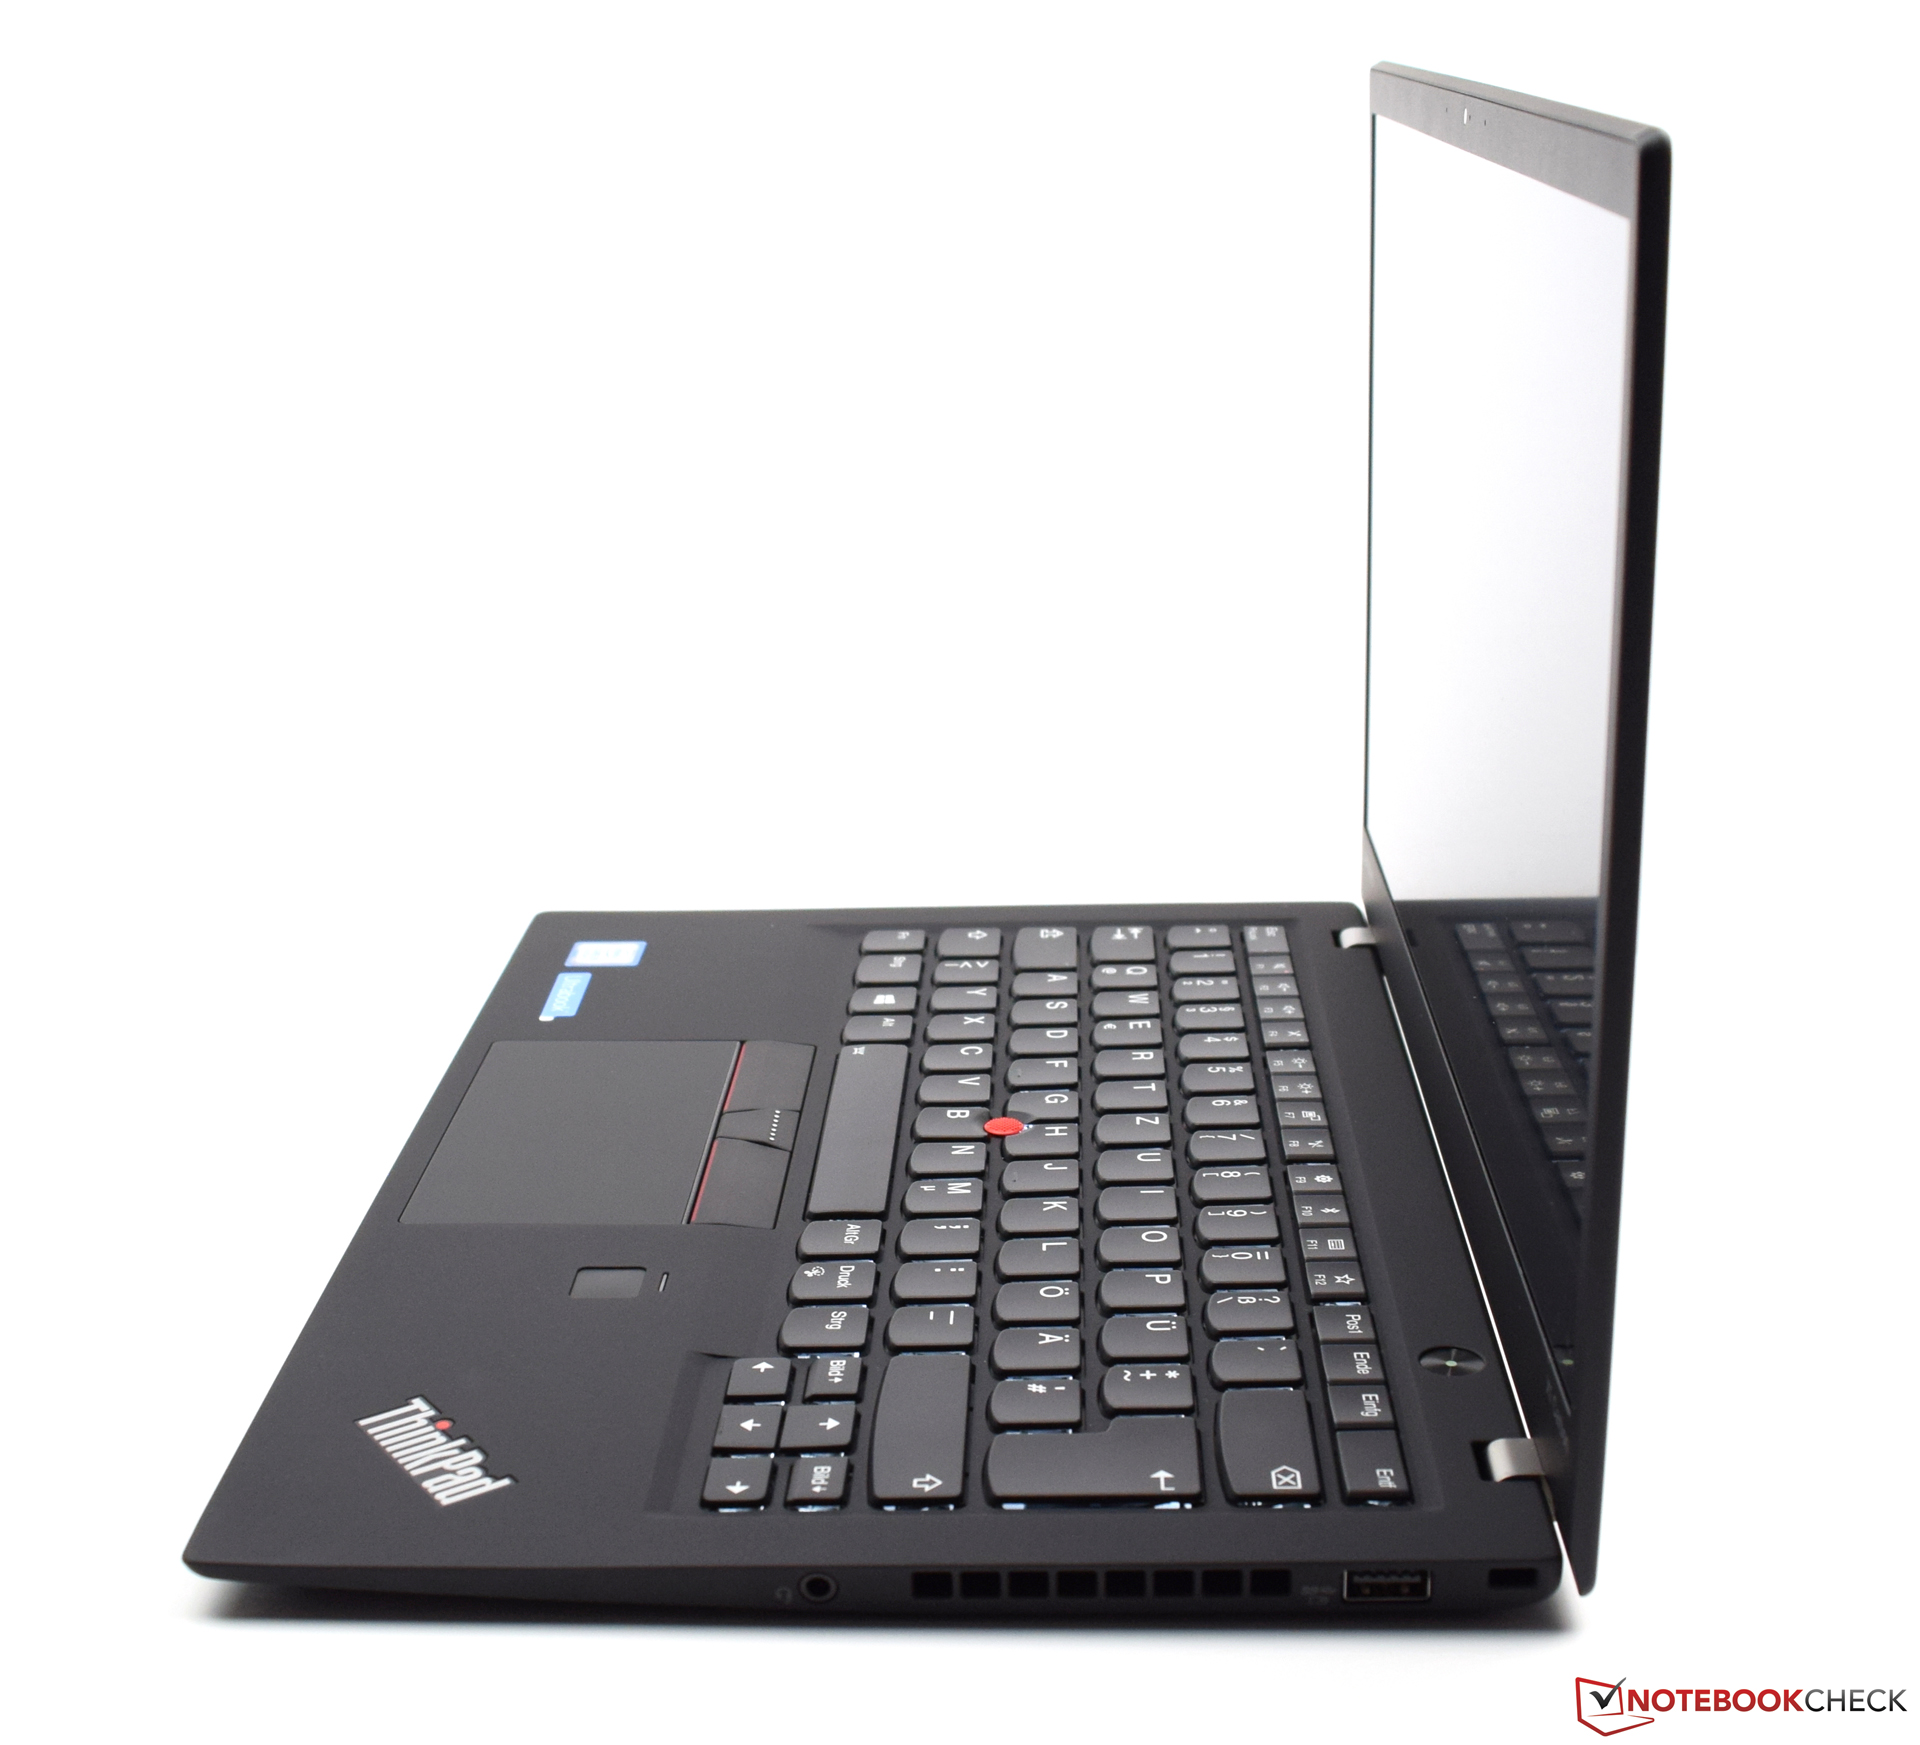
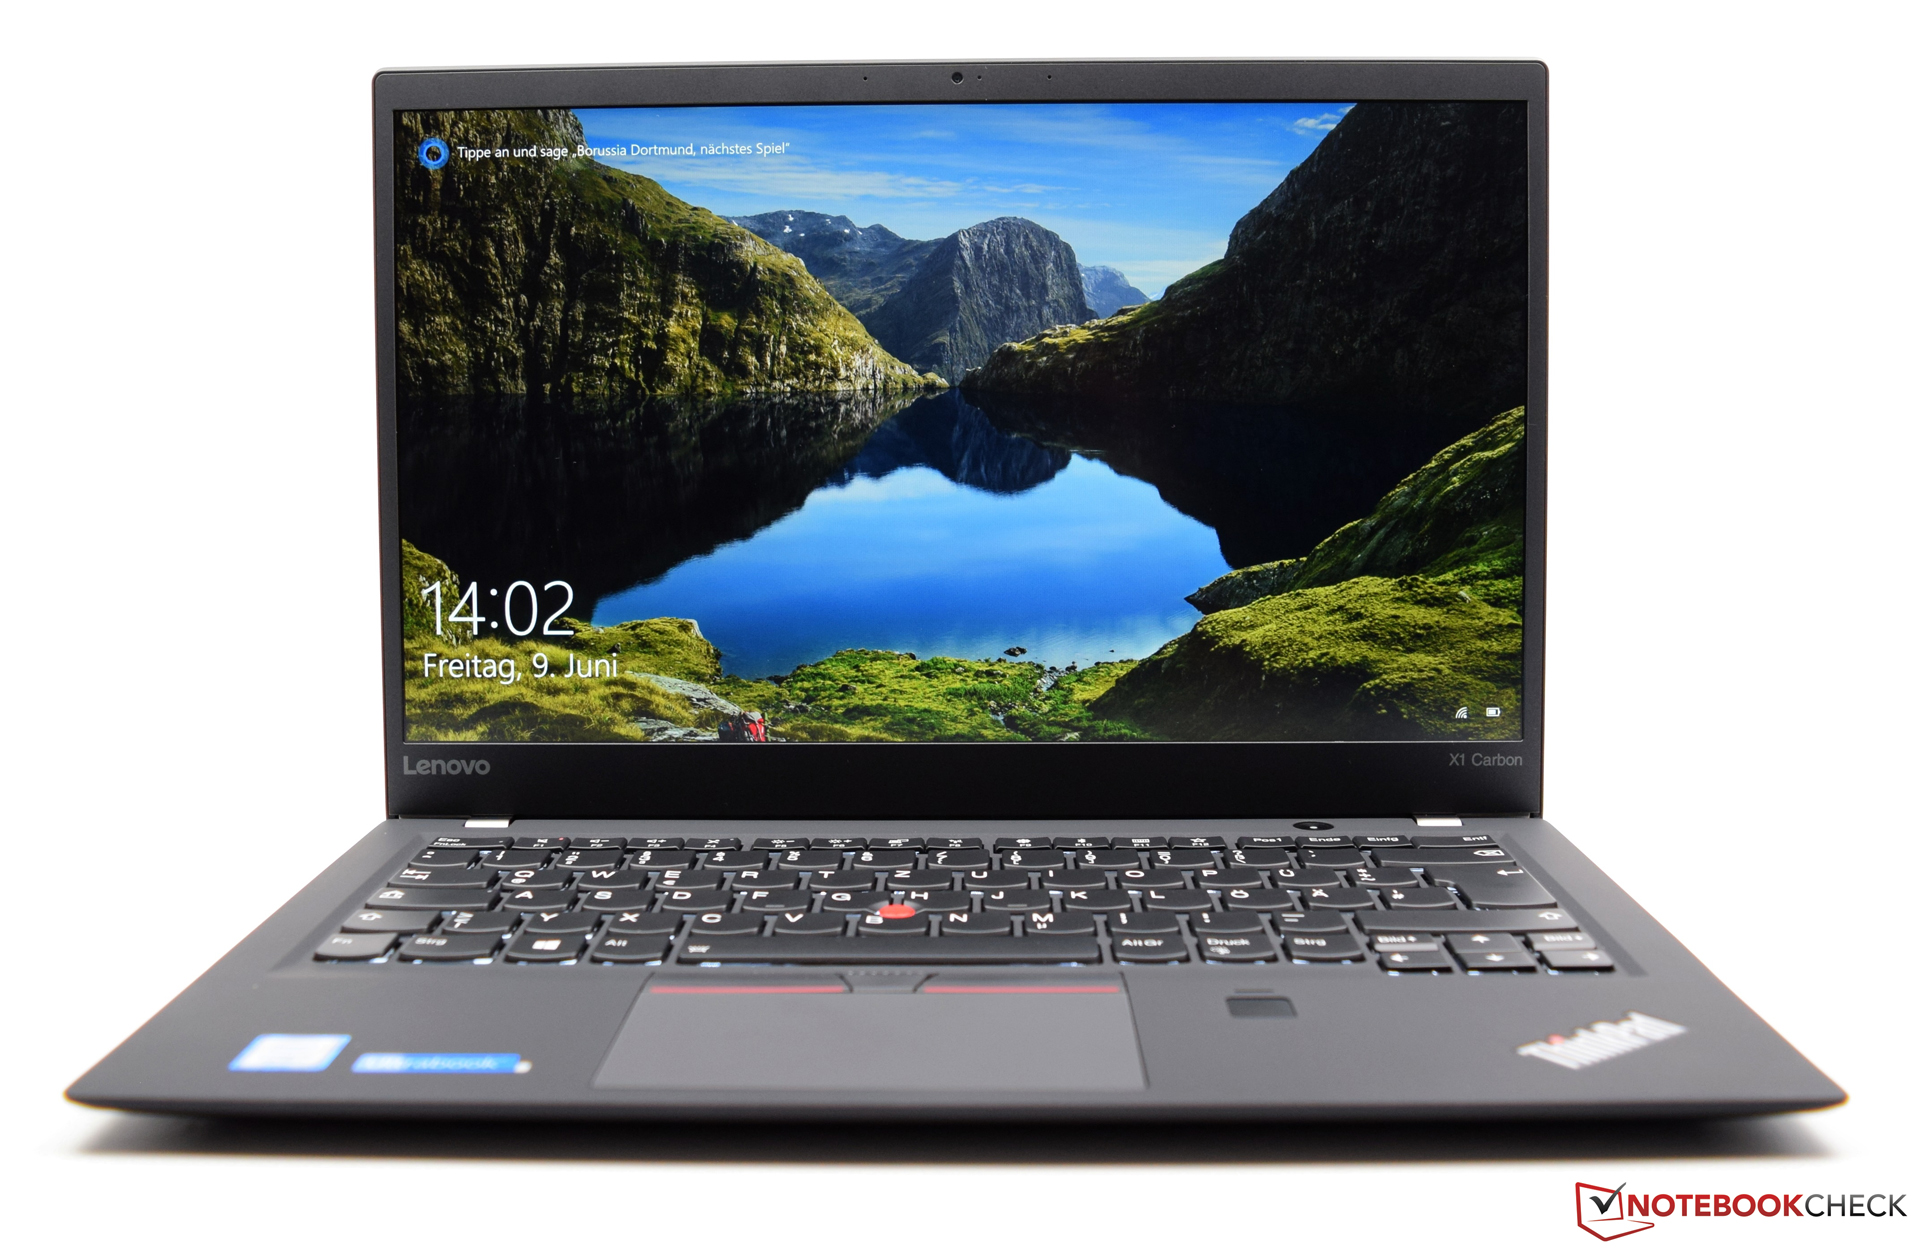
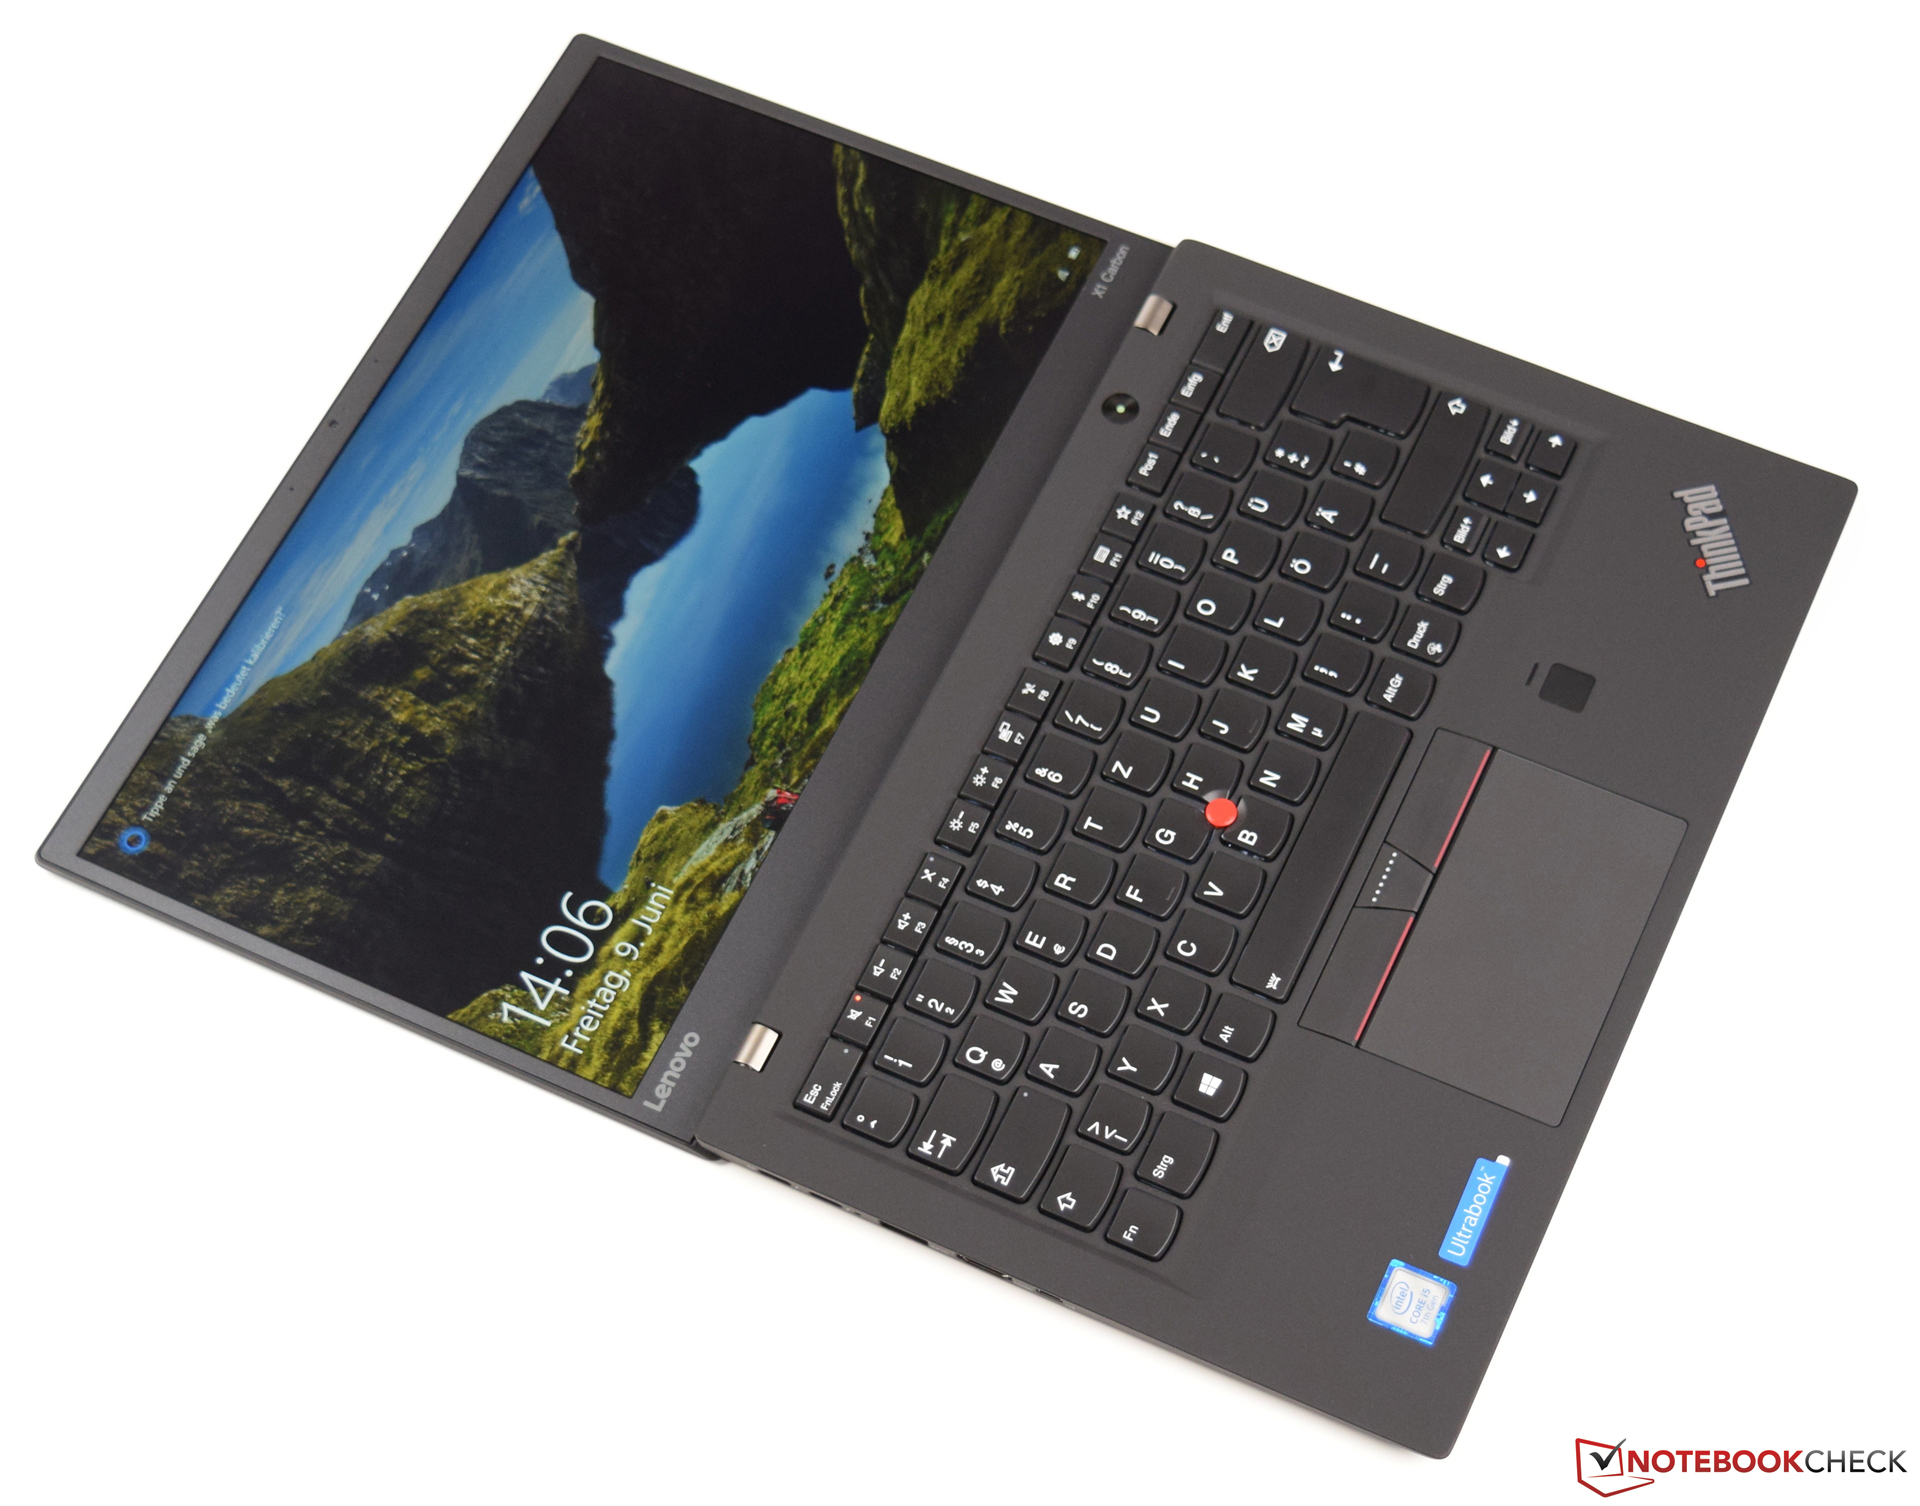
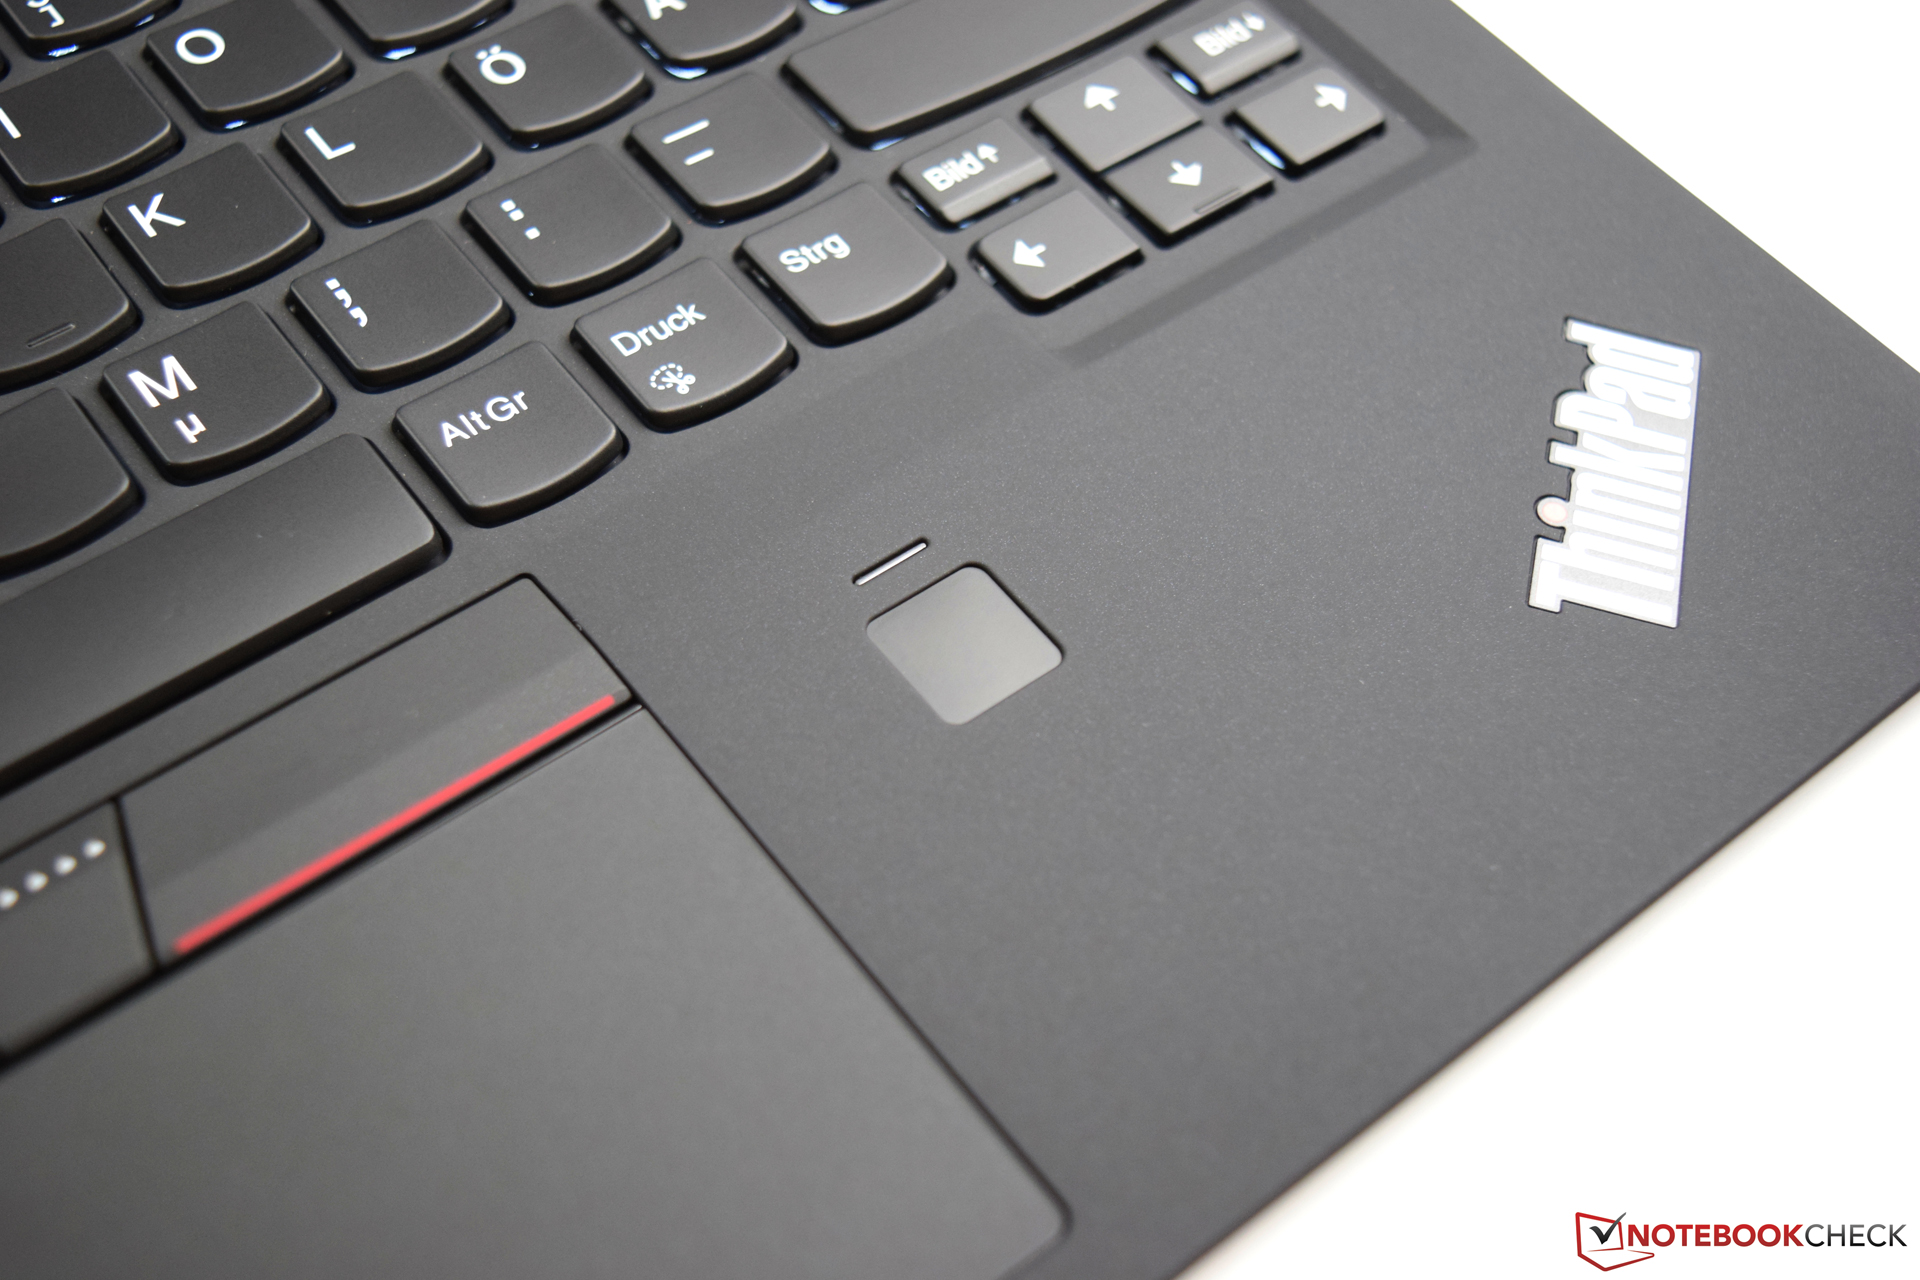
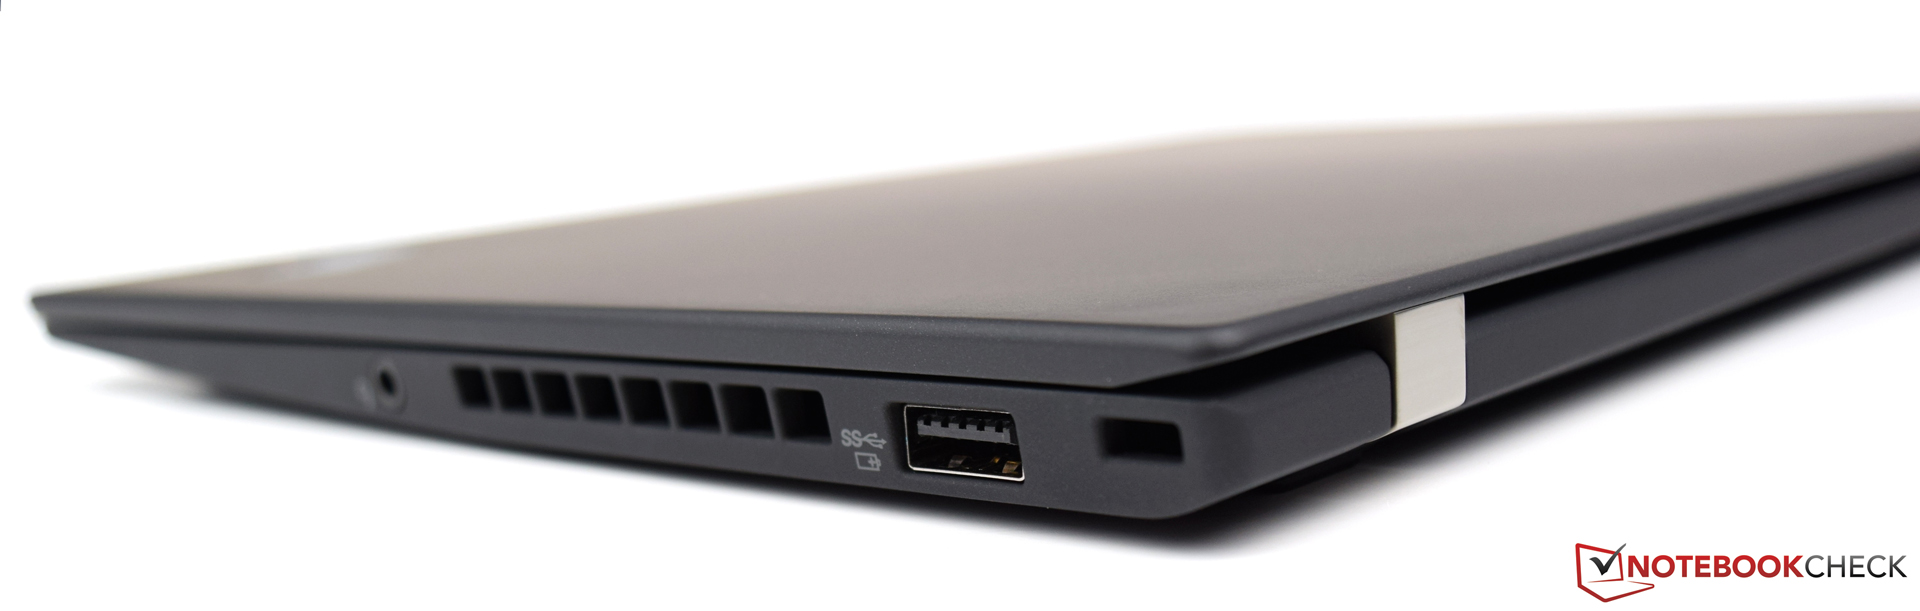
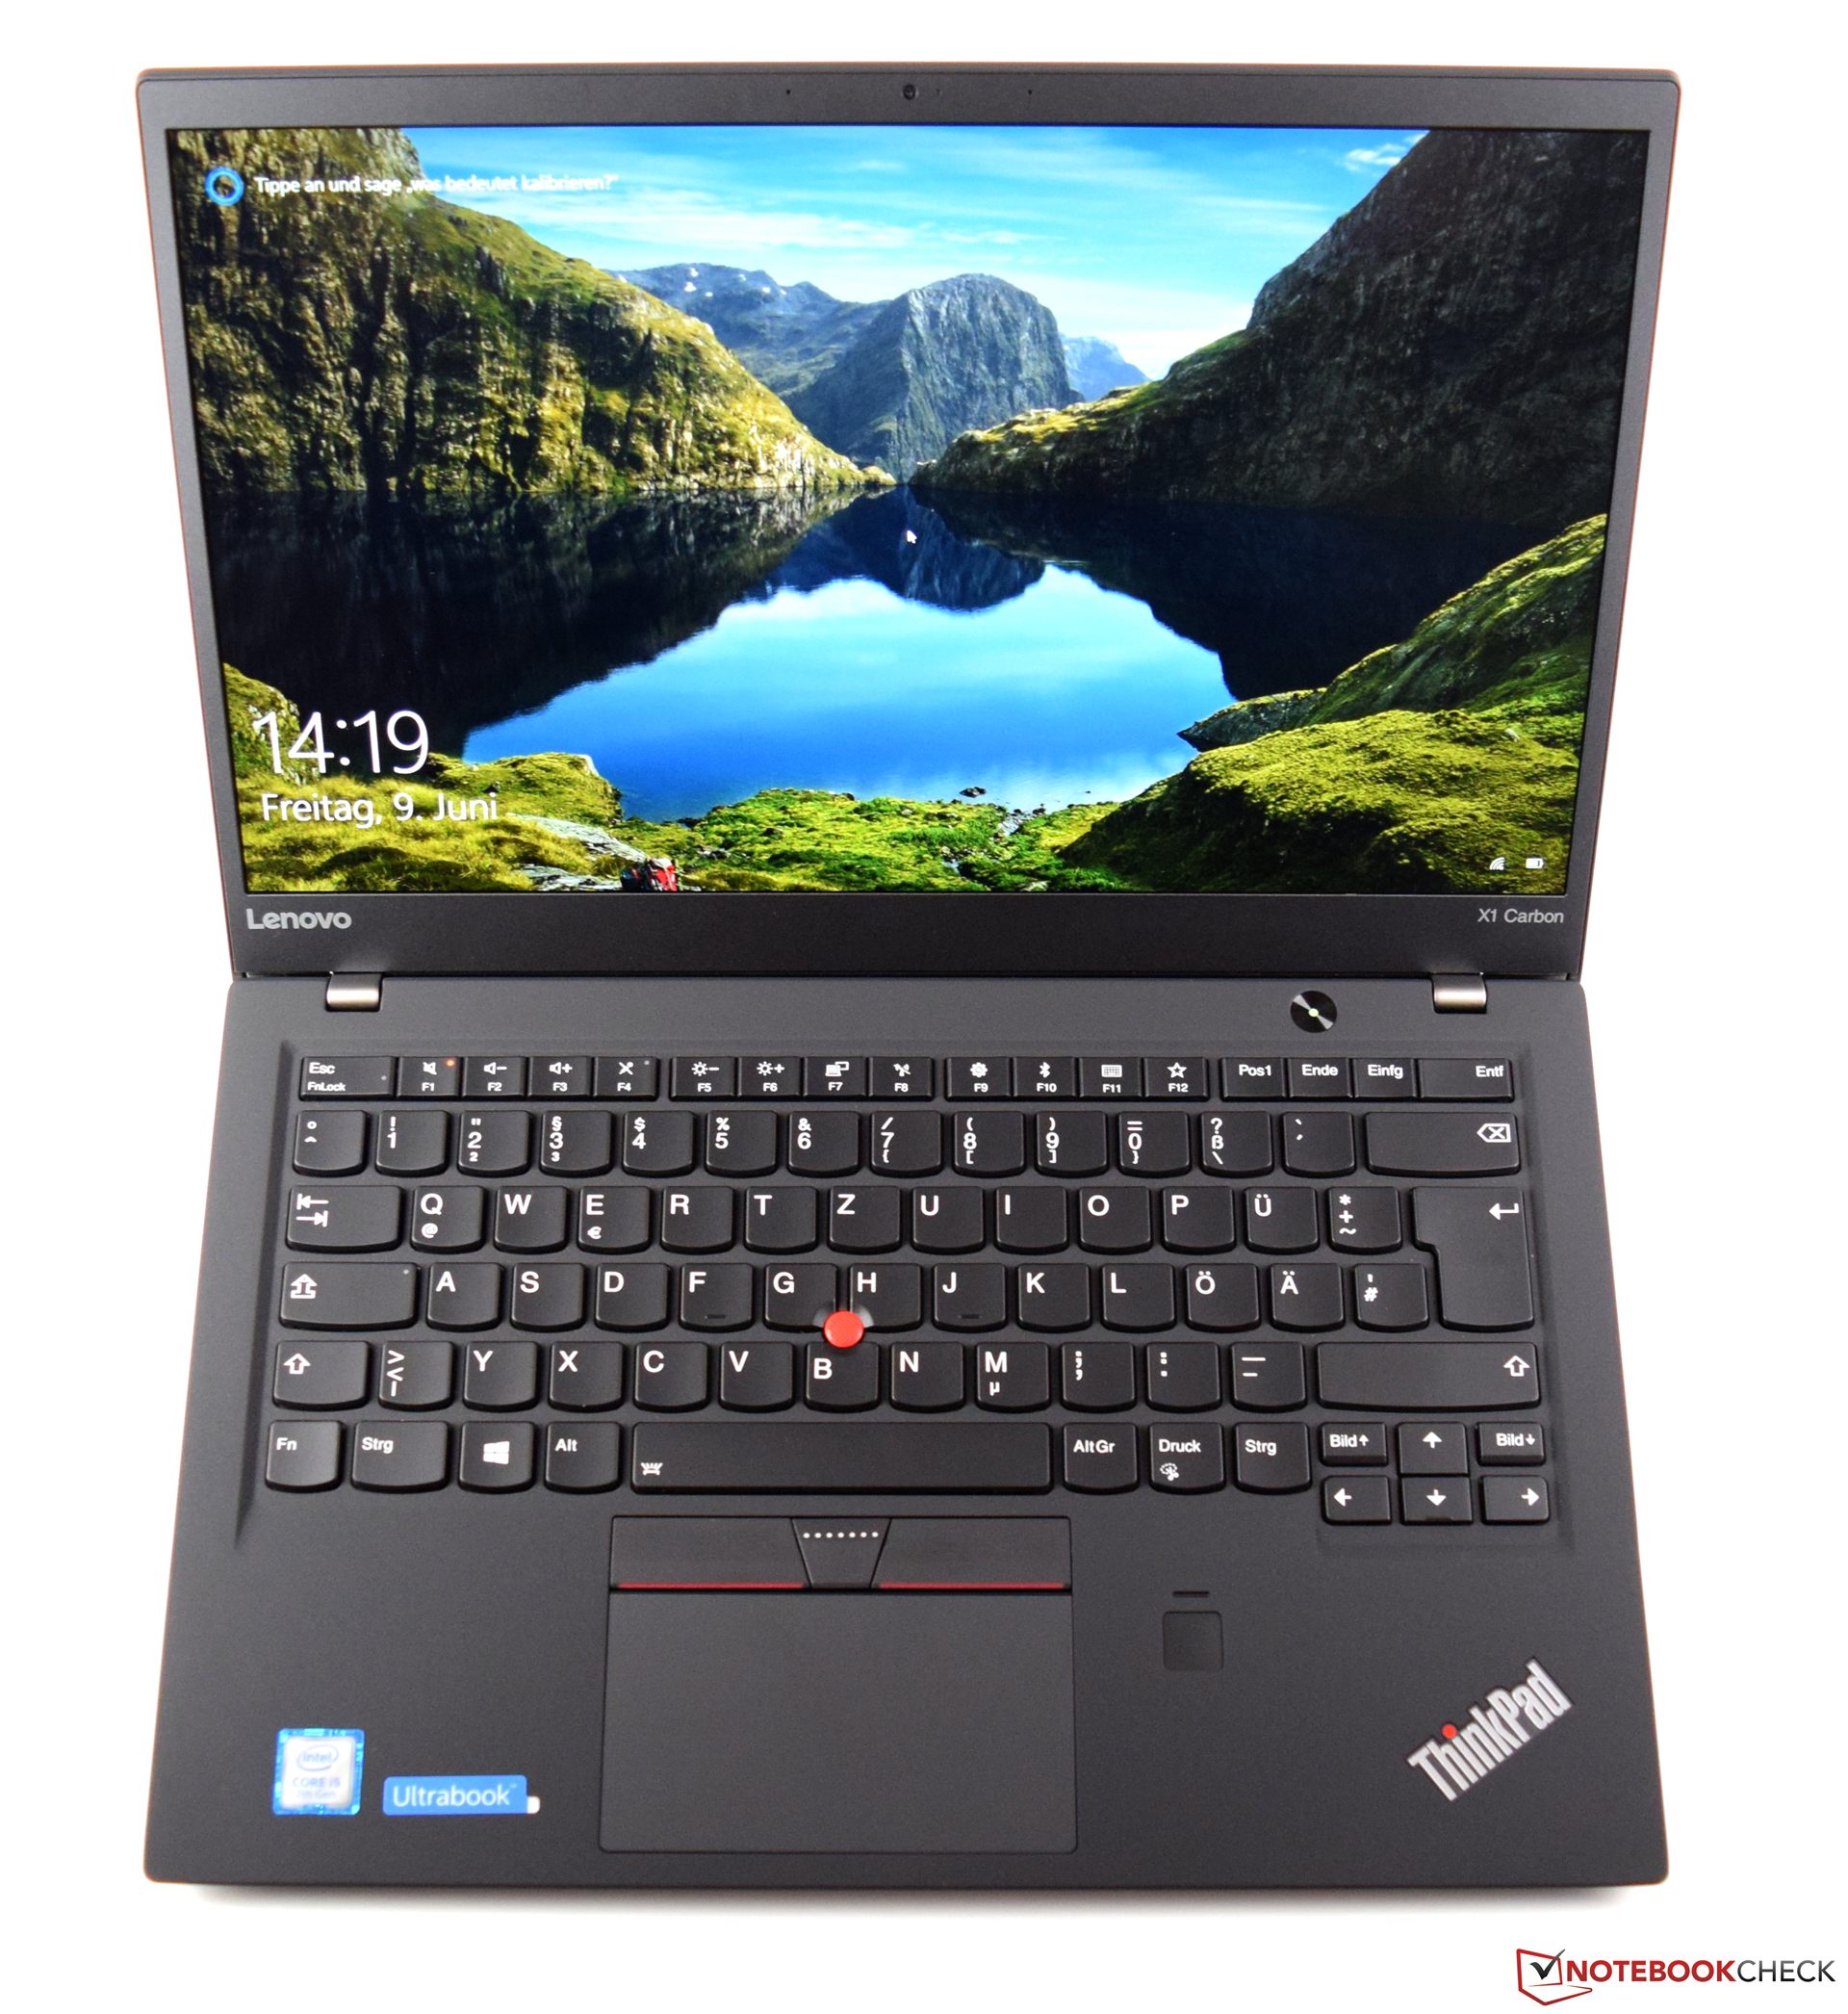
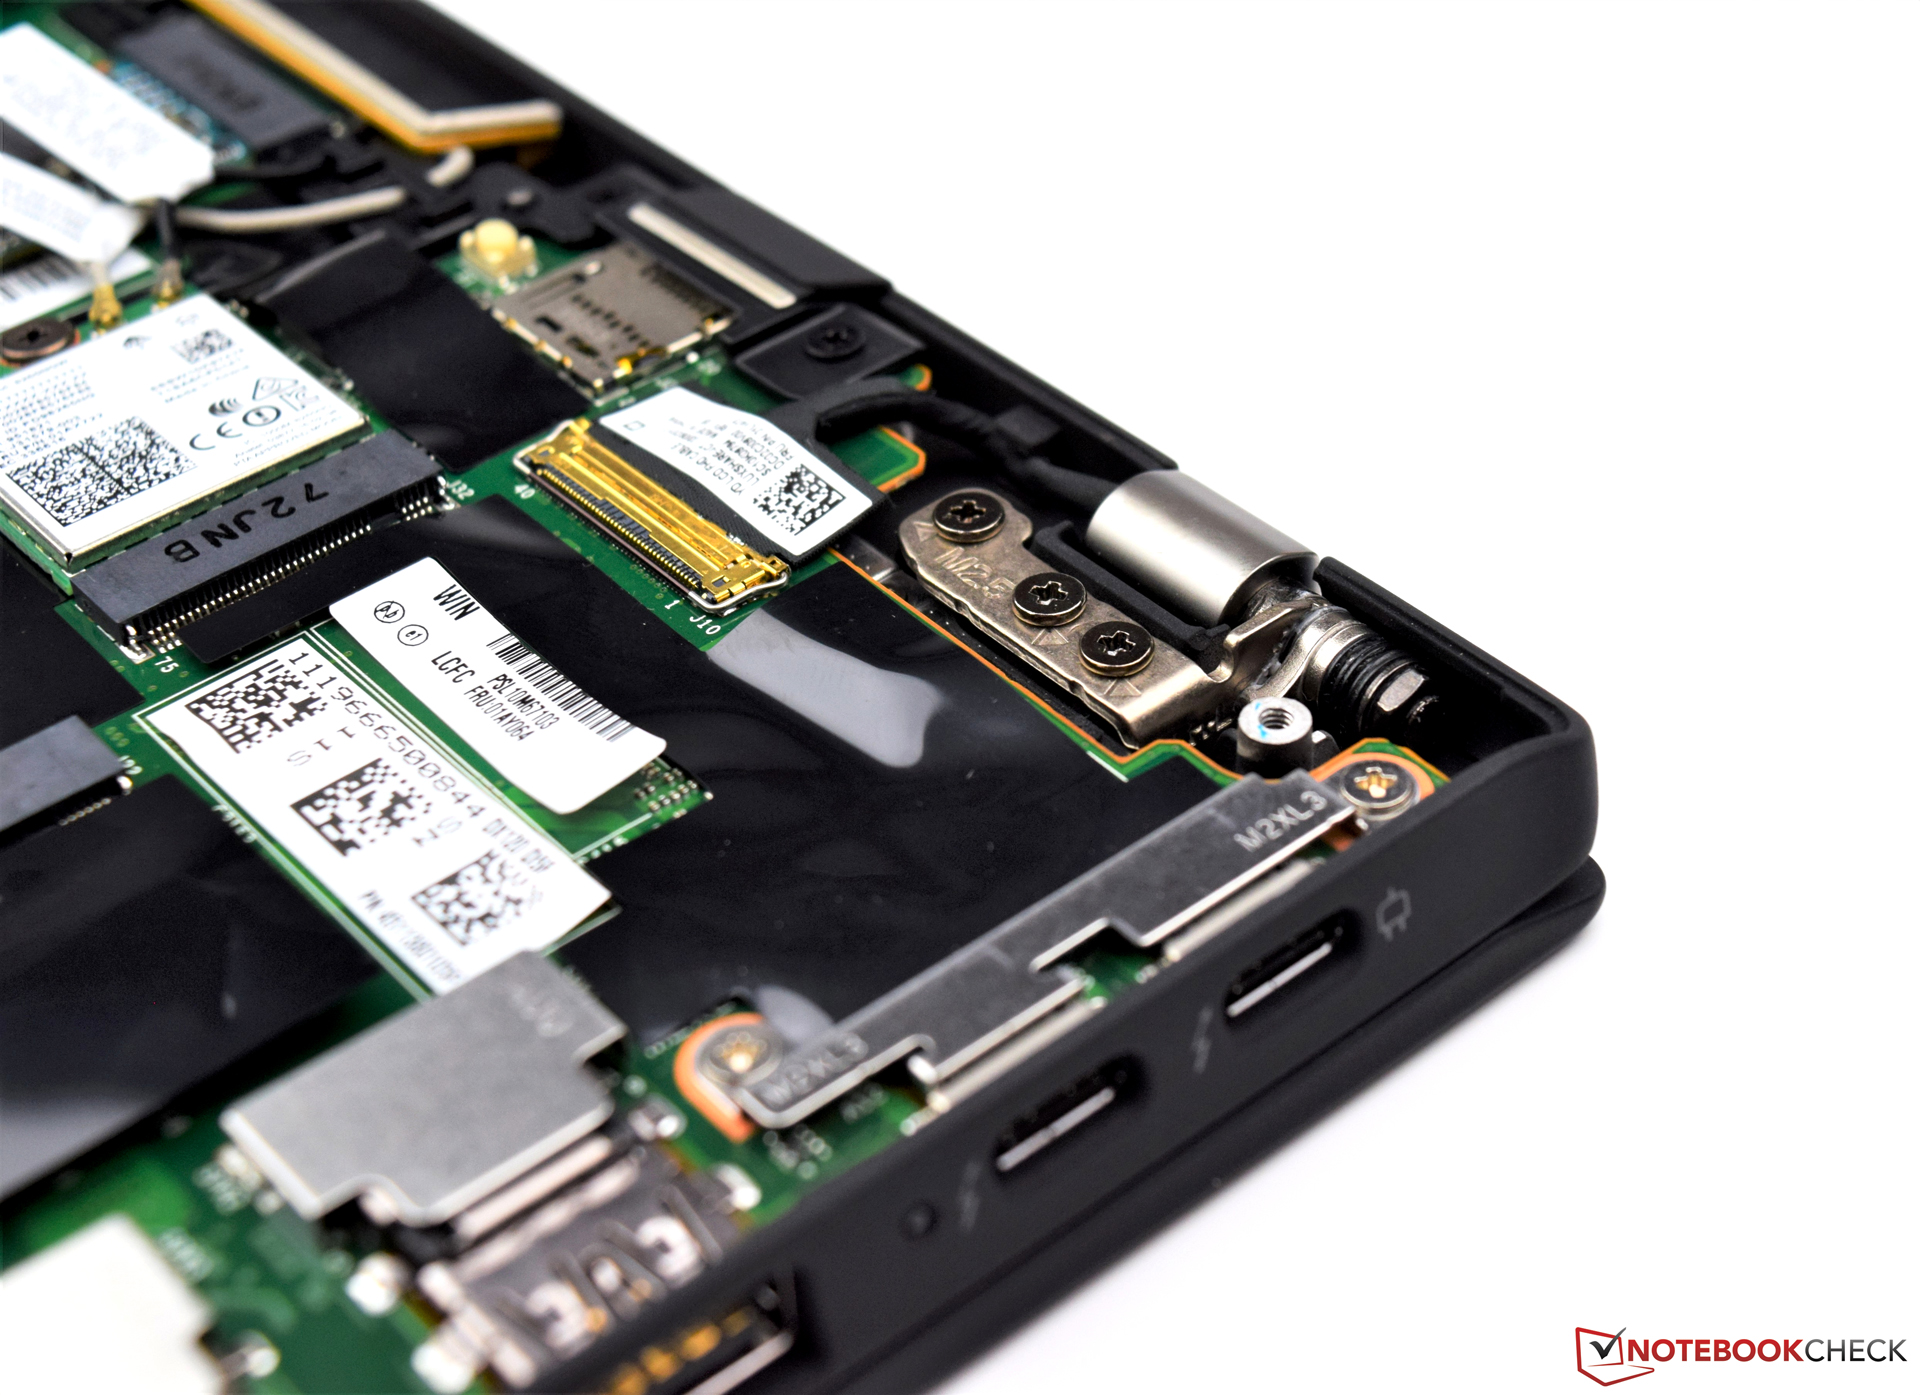
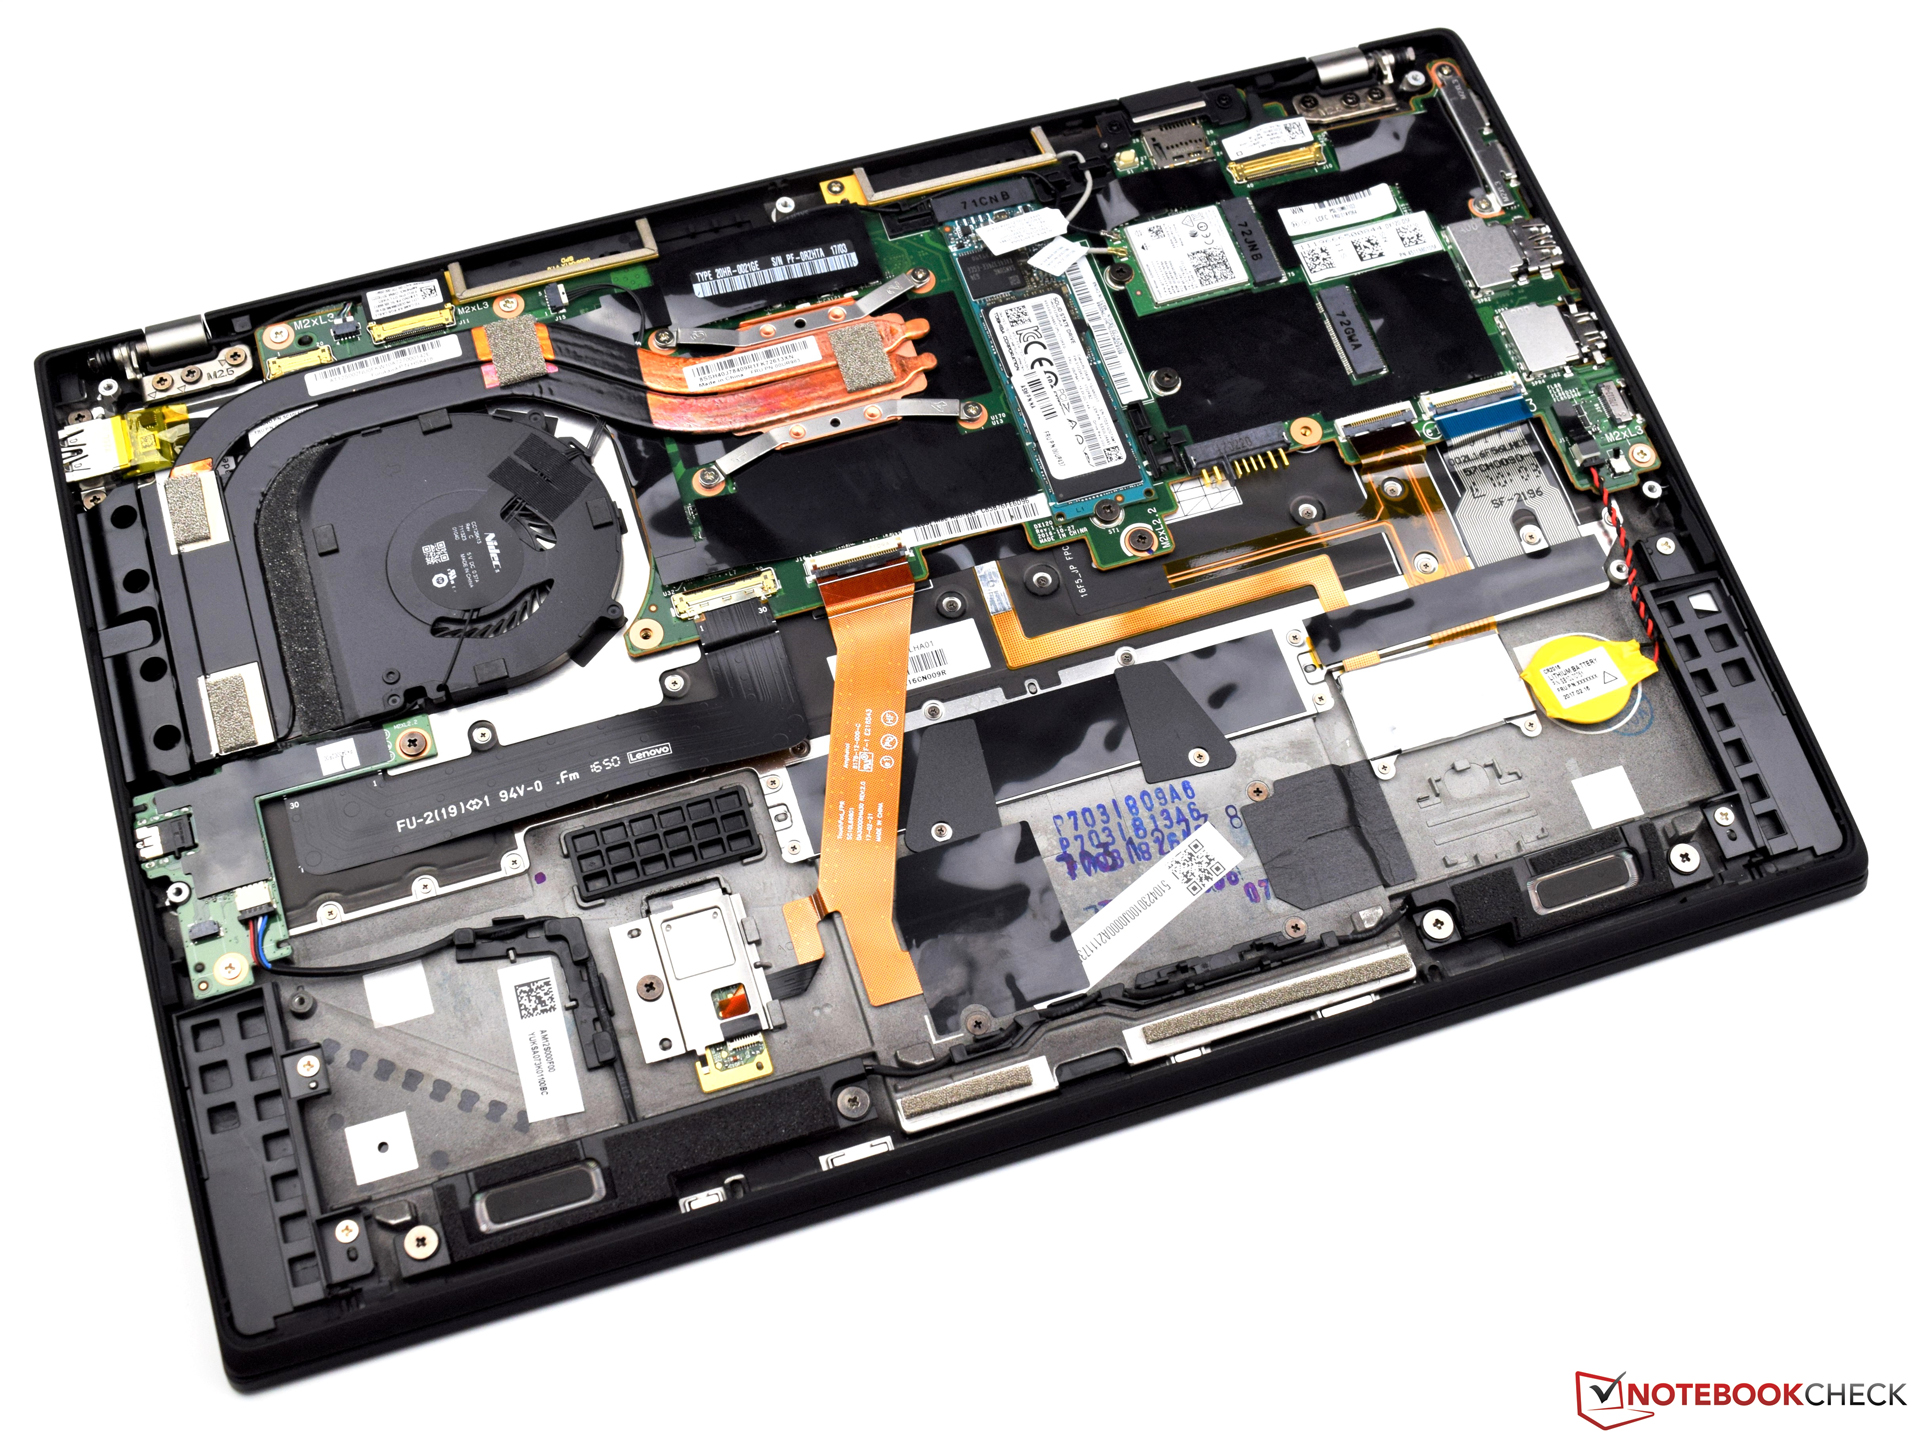
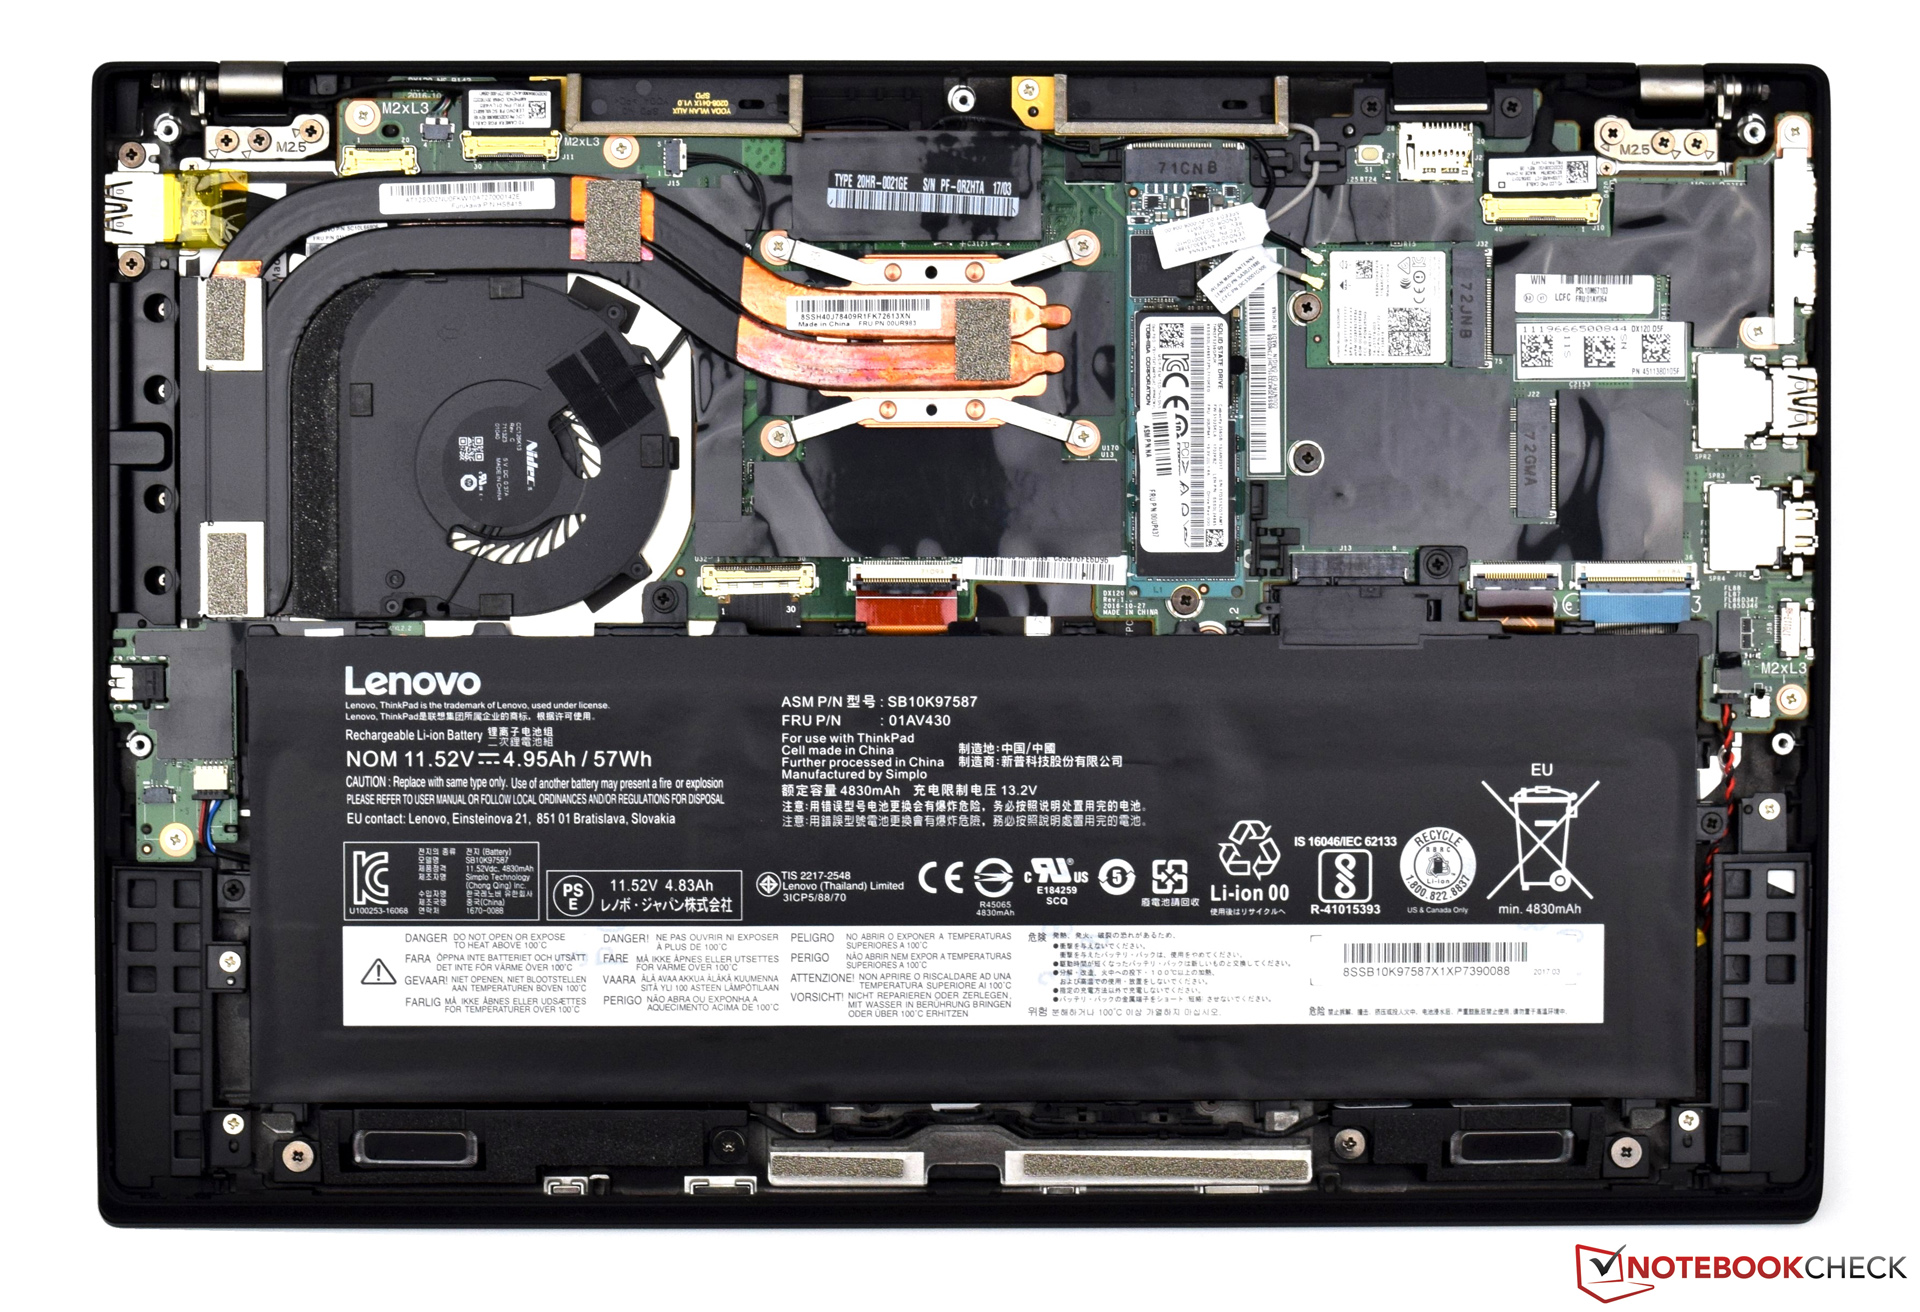
Le Lenovo ThinkPad X1 Carbon 2017 est un portable pro de haute qualité, aux finitions excellentes. Il ne déçoit pas en termes de mobilité, apanage de cette série, avec un poids de tout juste 1 kg à faire rêver certains convertibles. Comparé au modèle de 2016, en plus d’un encombrement encore plus réduit, le nouveau châssis offre des connexions modernes, comme le Thunderbolt 3 (USB C). Avec cet équipement, le portable est paré pour les années à venir. Les bonnes performances couronnent le tout, vendu à 1 669 € dans la configuration de notre modèle.
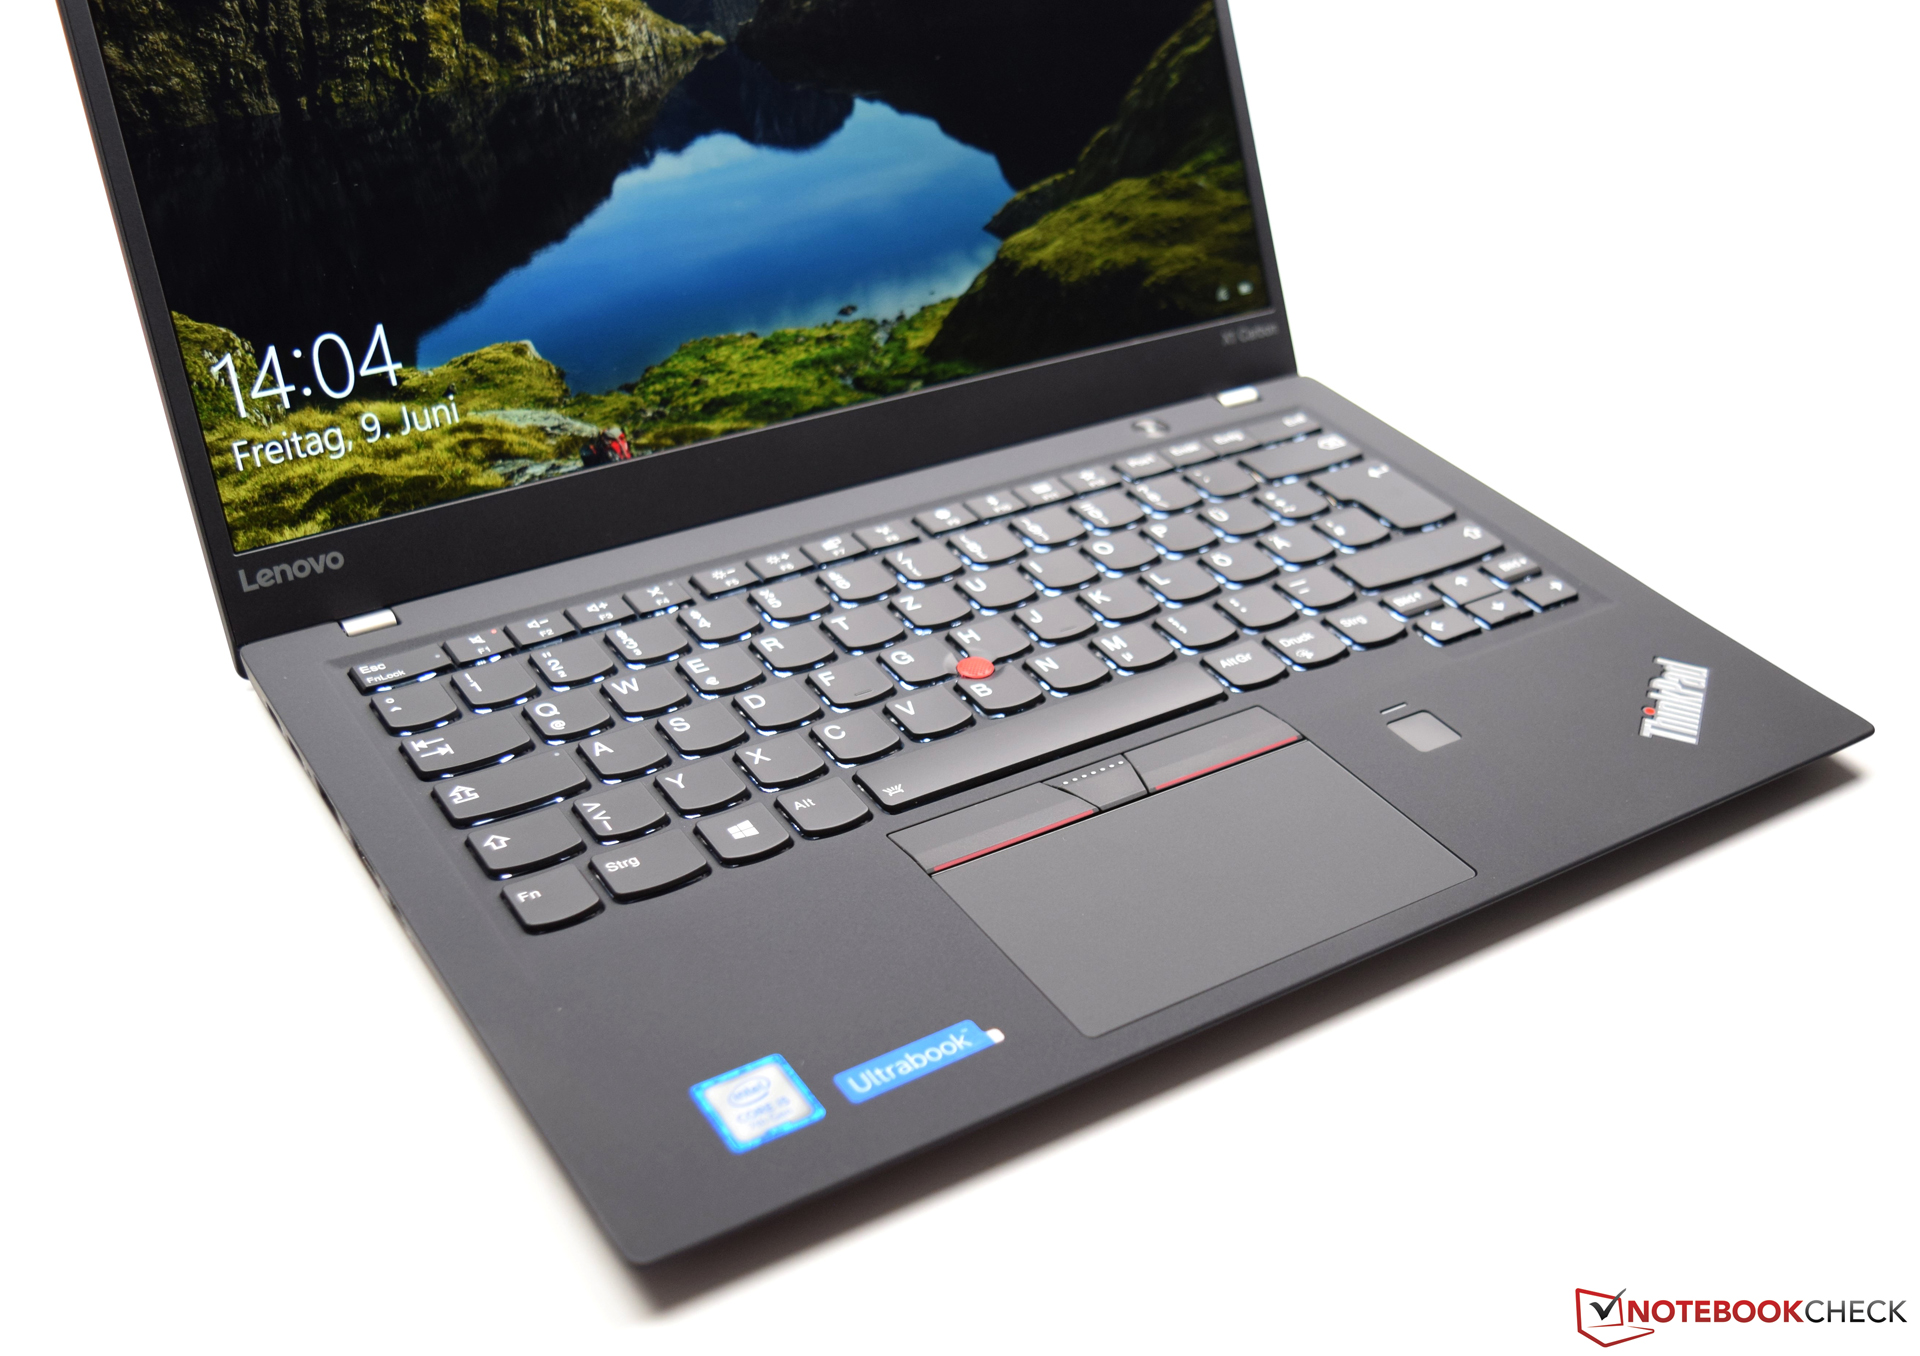
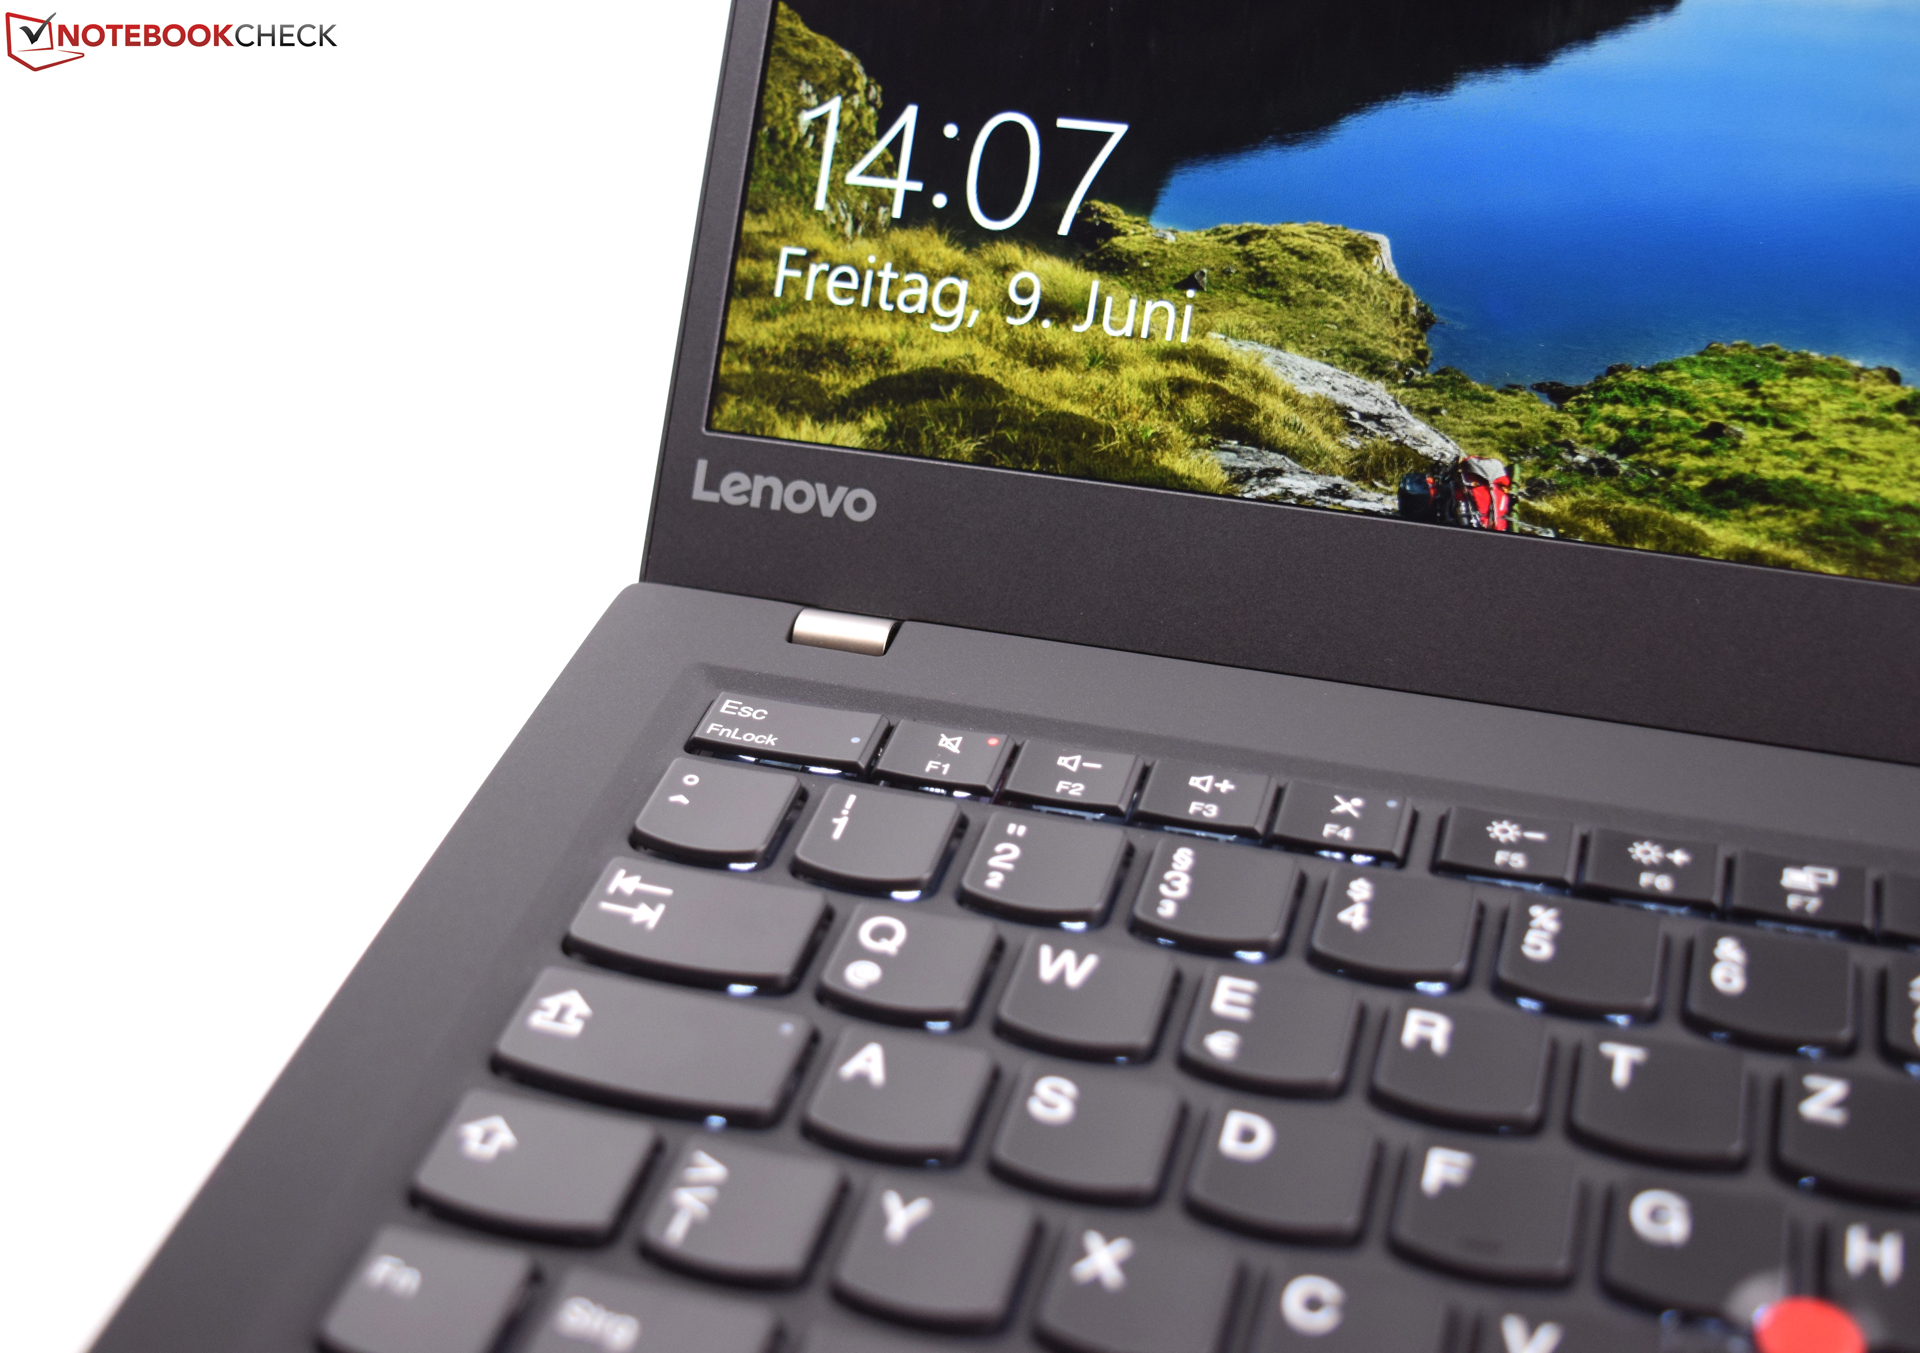
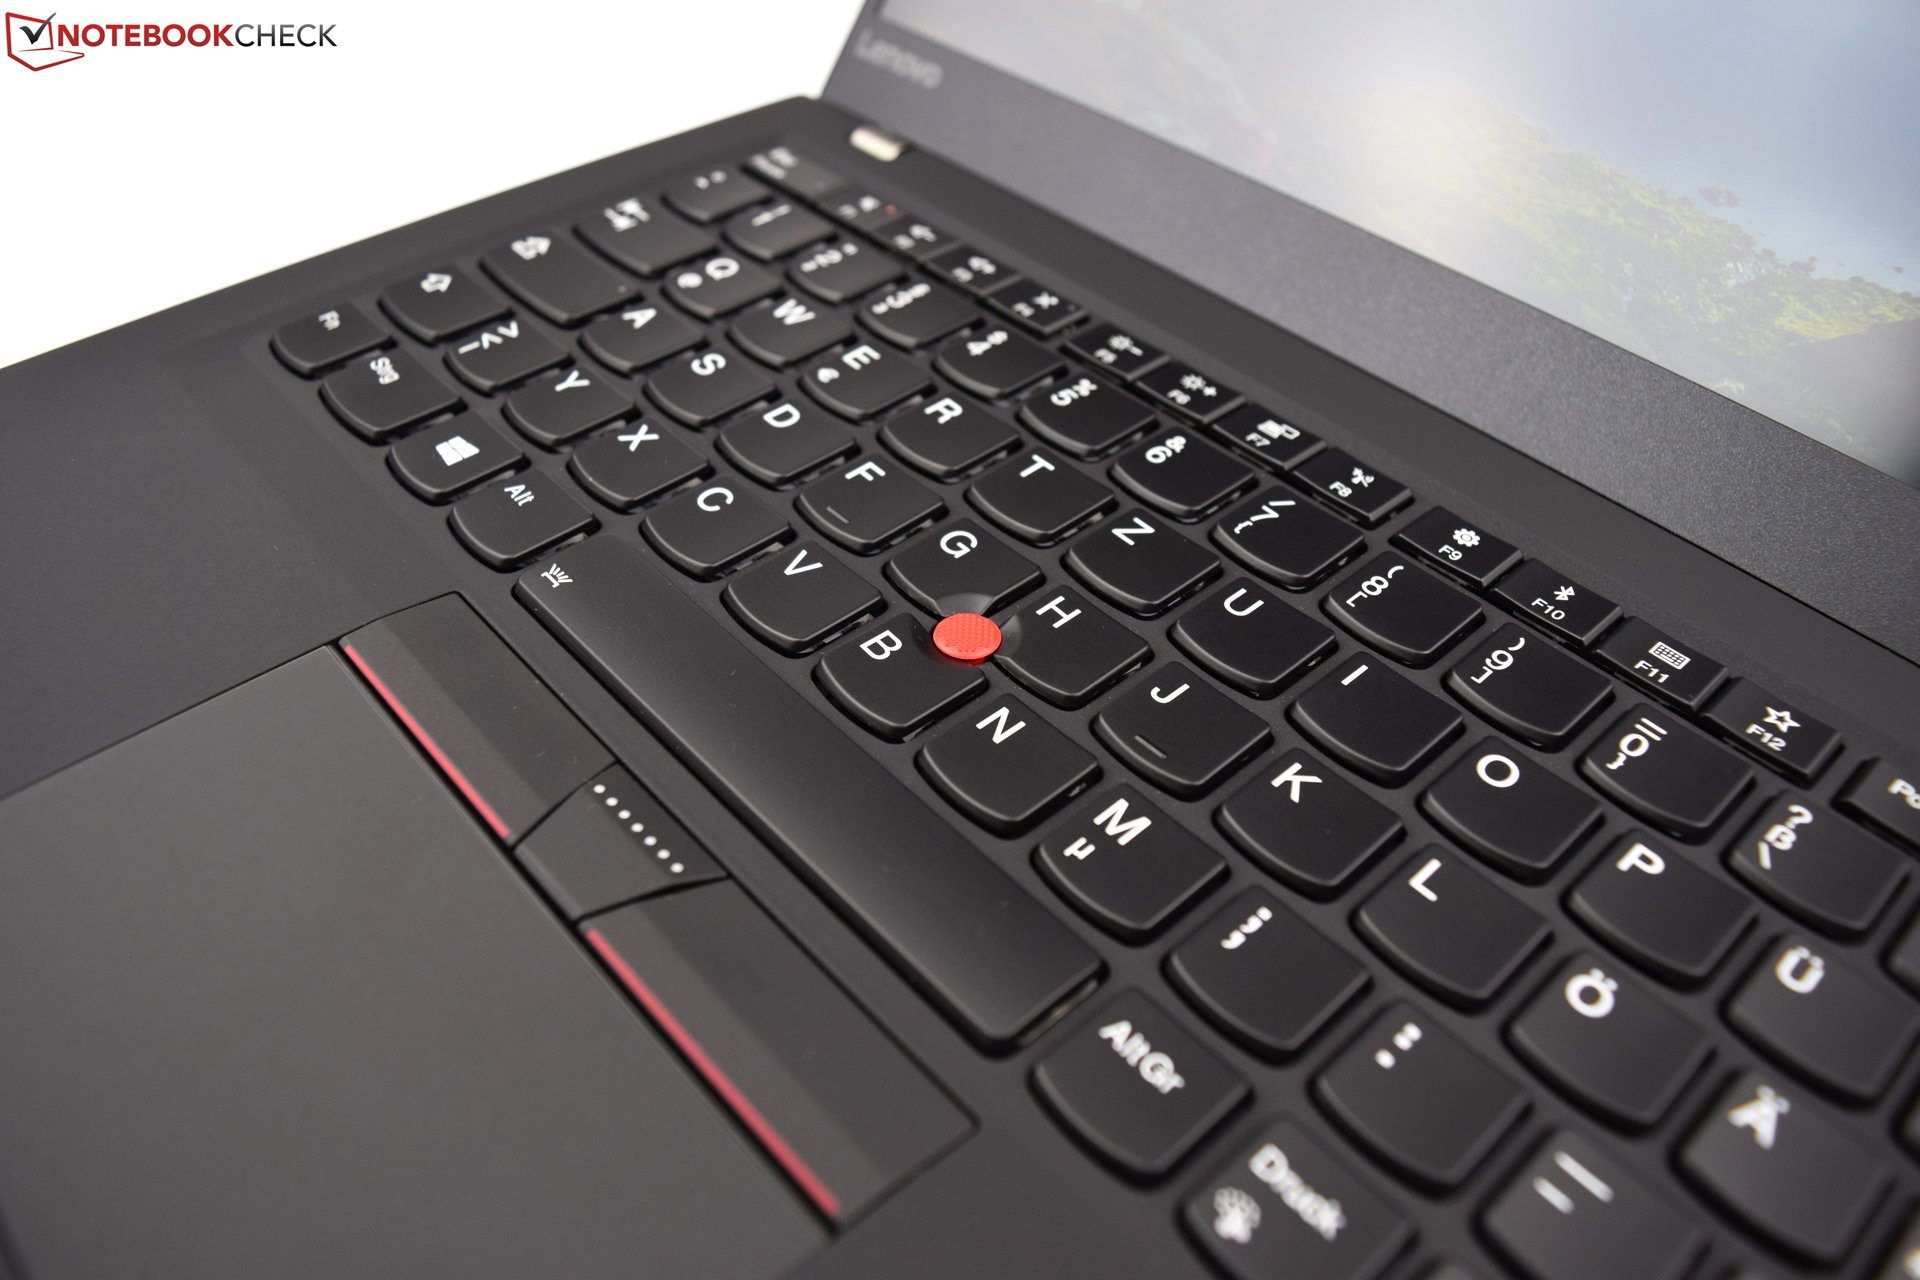
Avec le ThinkPad X1 Carbon 2017, Lenovo reste fidèle à ses principes, et propose un très bon appareil pro, qui convainc avec d’excellents périphériques d’entrée – mais nous n’en attendions pas moins de Lenovo.
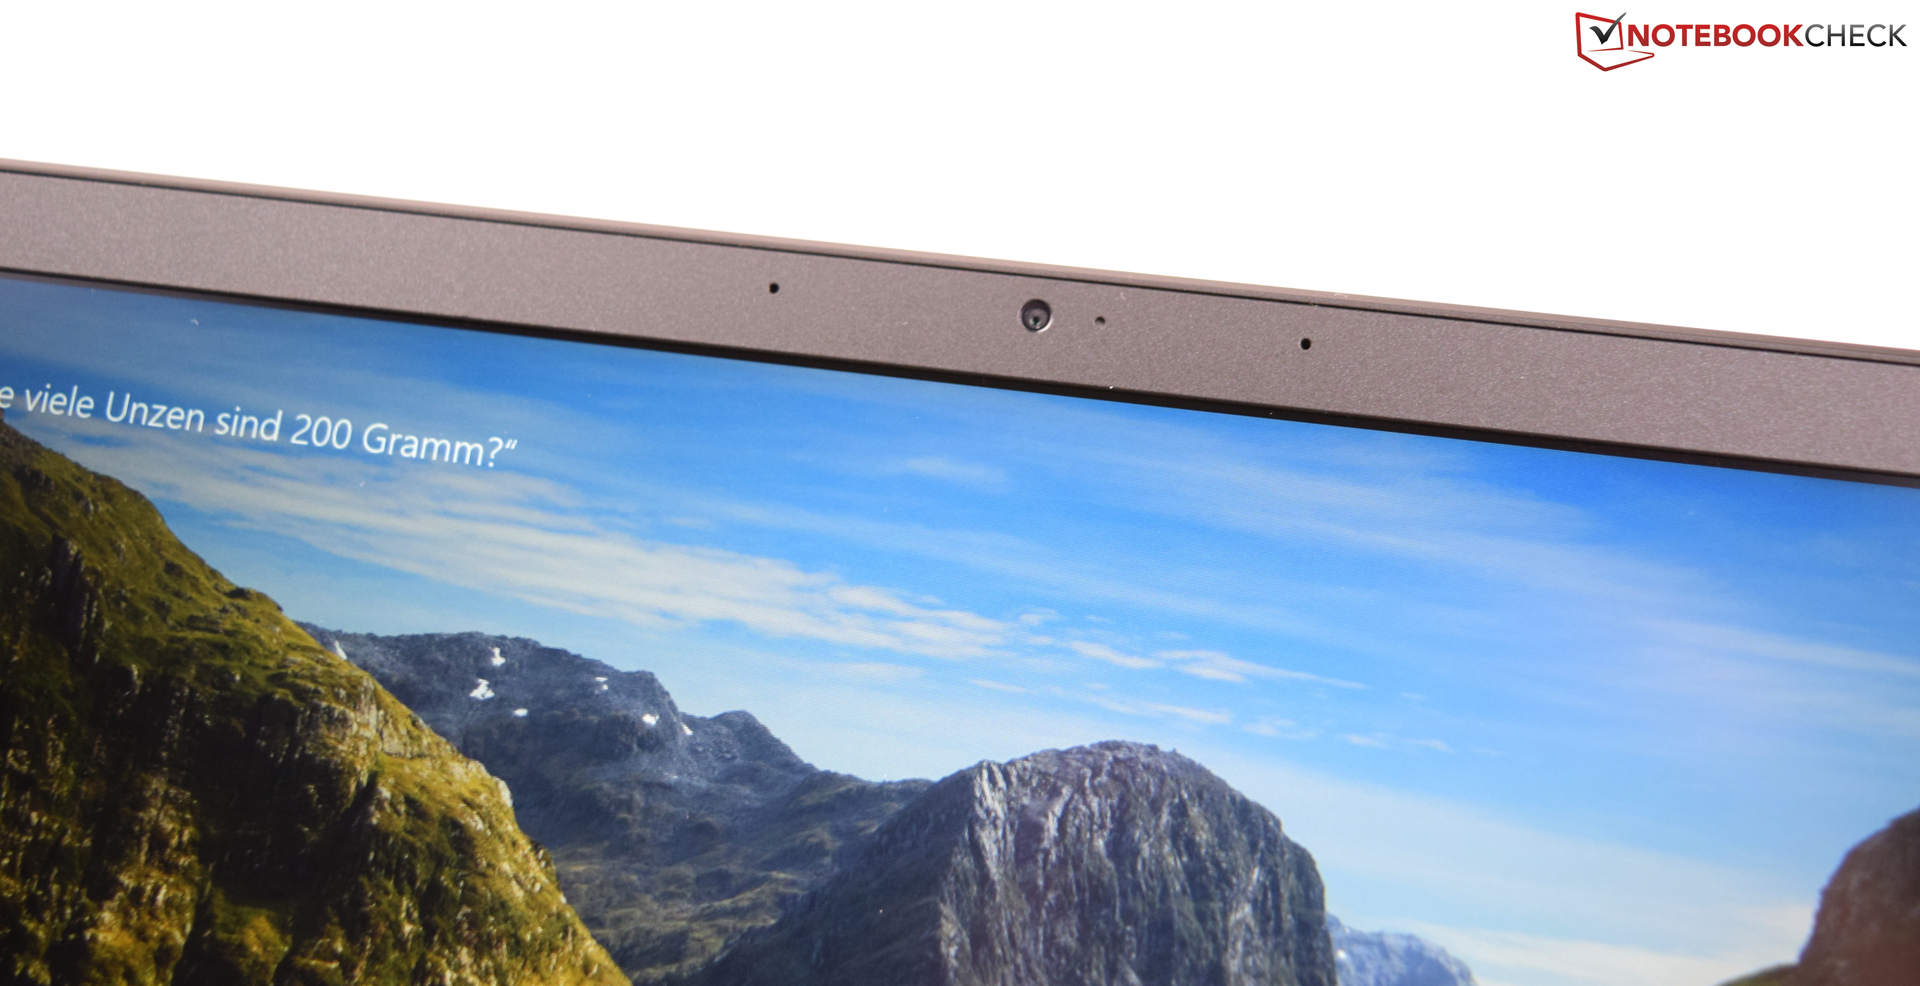
Mais même si l’écran IPS Full HD offre de bons résultats, il ne peut se mesurer à l’écran WQHD de son prédécesseur. Malgré cela l’appareil est convaincant, agréable à utiliser, avec de bonnes performances générales pour un usage au quotidien.
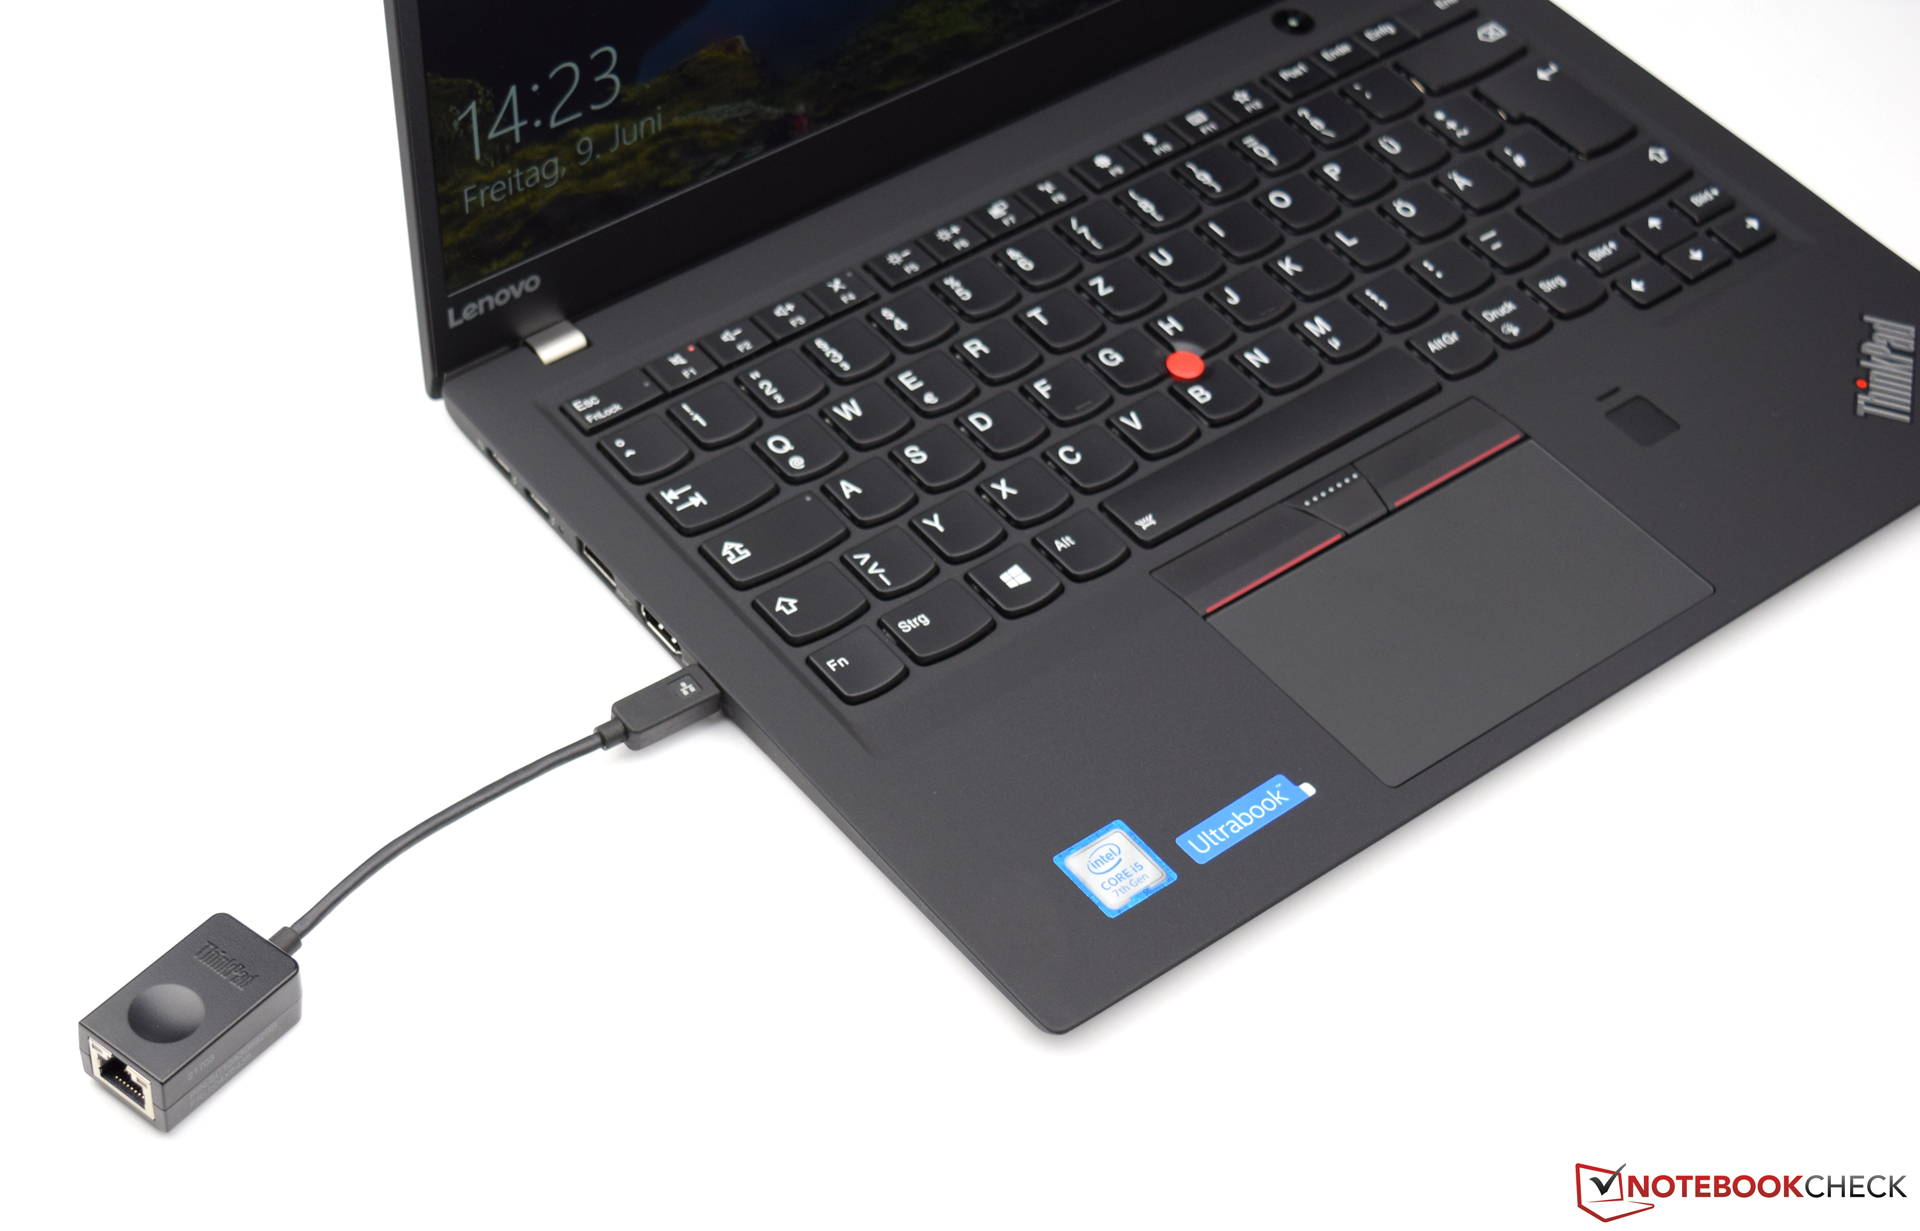
Mais il y a quelques raisons de se plaindre : l’absence de lecteur de cartes SD oblige à utiliser un adaptateur, ce qui est gênant pour ceux qui utilisent beaucoup les cartes SD. La chauffe du châssis en cas de sollicitations est gênante, et rend inconfortable l’utilisation de l’appareil sur les genoux.
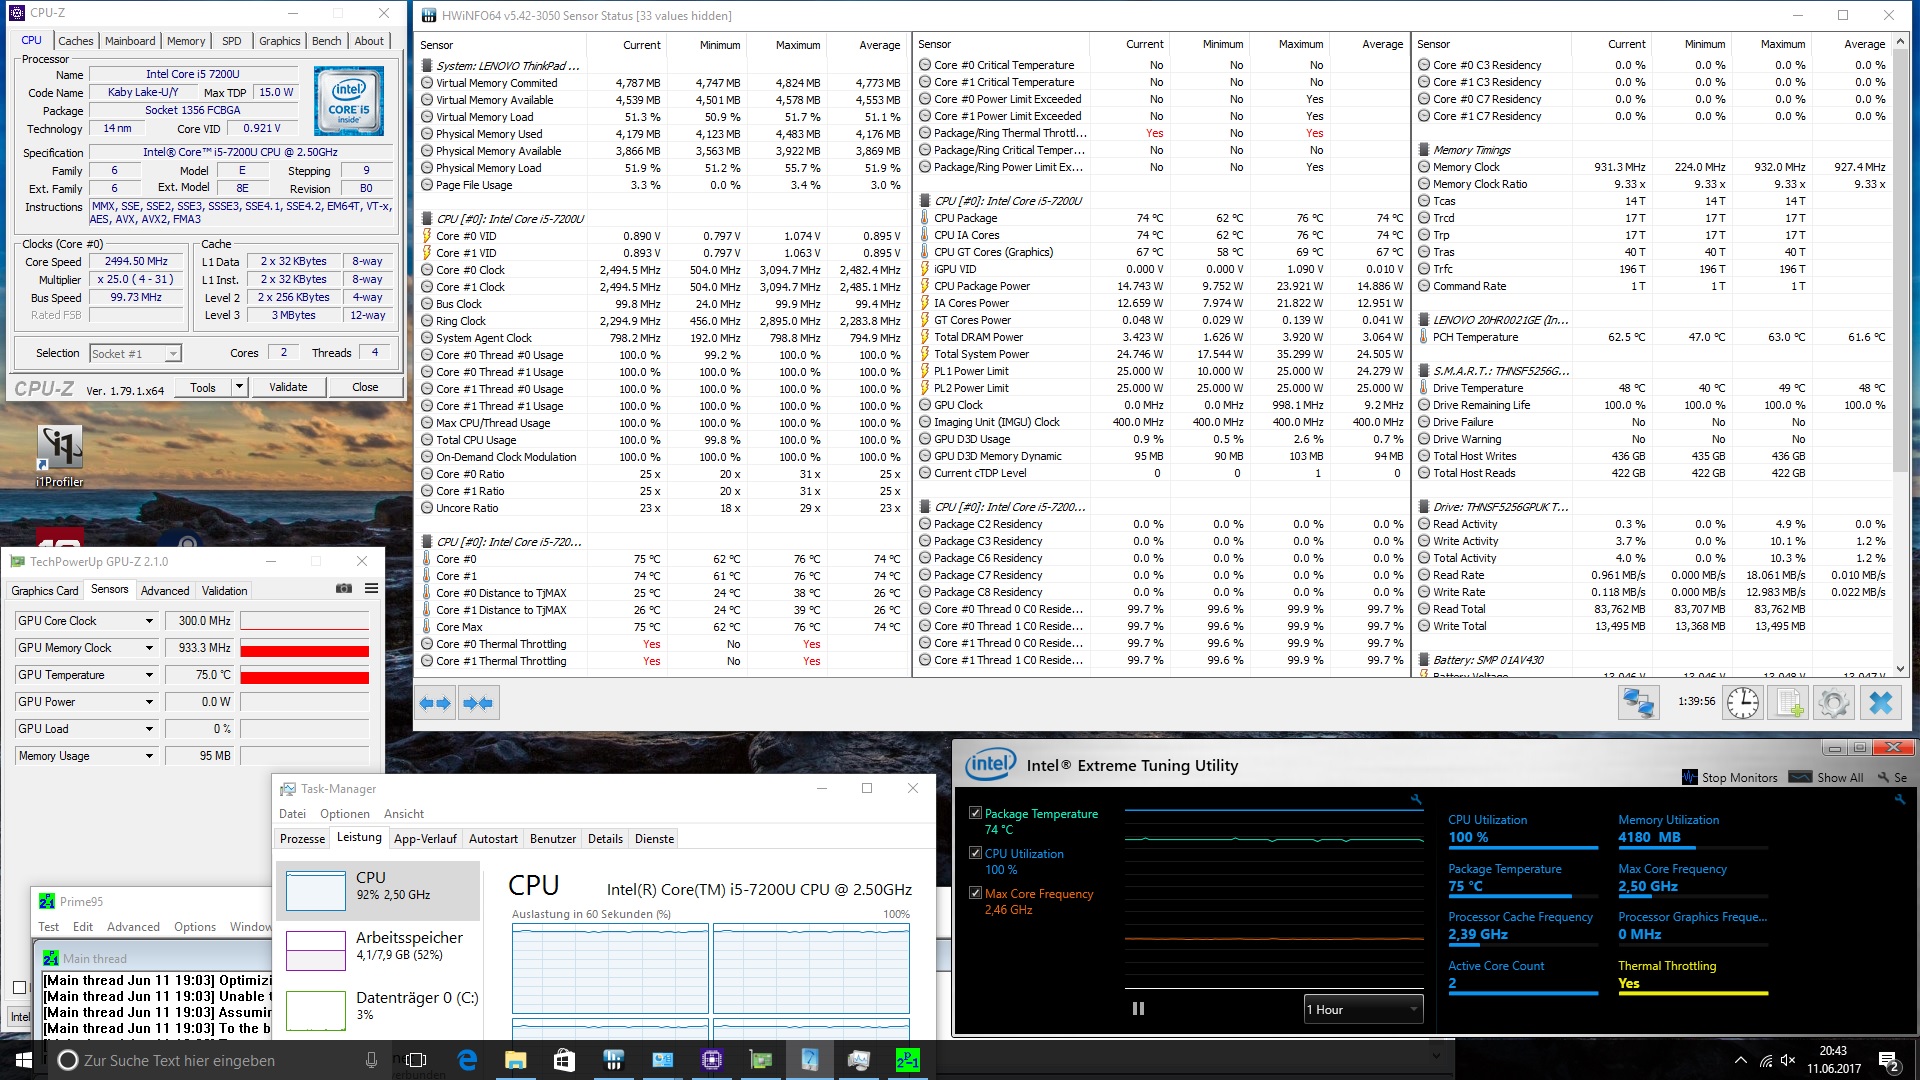
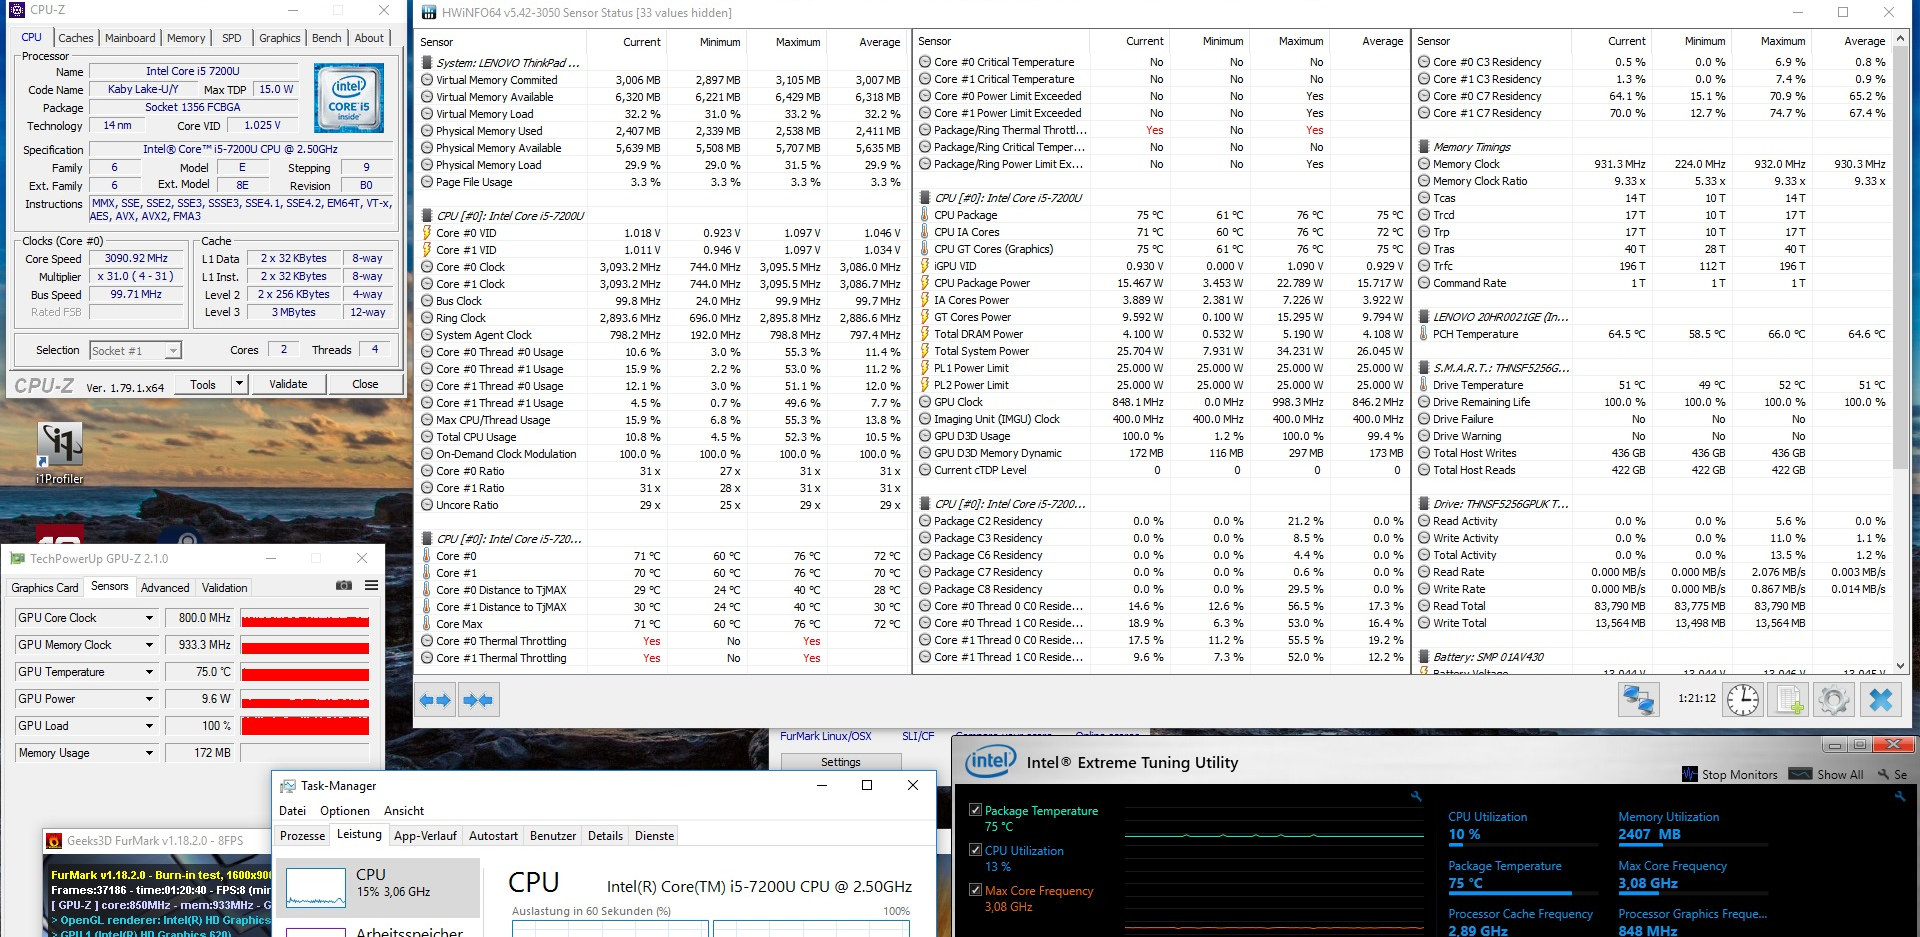
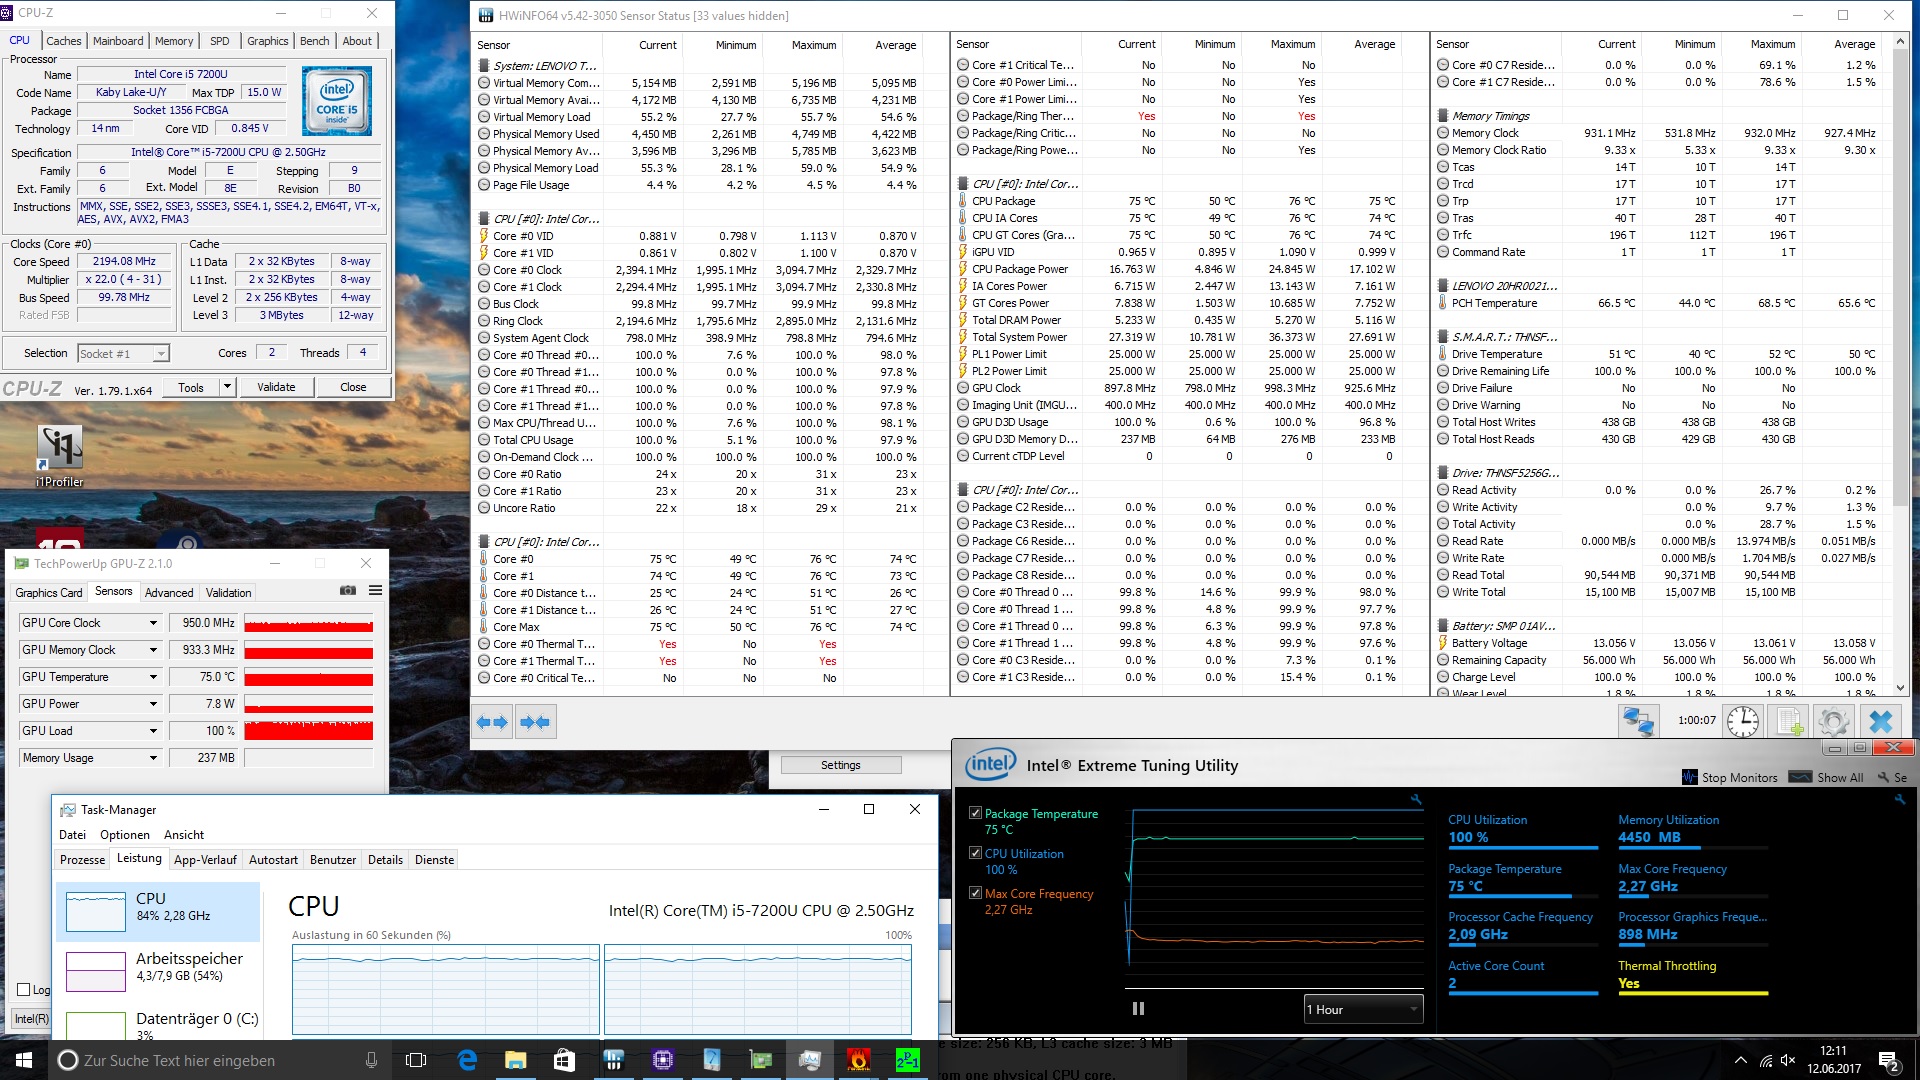
Il est intéressant de savoir quelle version du ThinkPad X1 Carbon 2017 est la meilleure. Au premier abord, d’après les fiches techniques, le modèle équipé de l’Intel Core i7-7500U paraît plus intéressant, d’autant qu’il est équipé de 16 Go de RAM. Néanmoins le modèle équipé d’un Core i5-7200U est également très bon. Et même avec la moitié de RAM (8 Go), il n’y a pas de souci à se faire pour l’avenir. En termes de performances, le X1 Carbon plus puissant ne l’est que pendant quelques minutes, car avec des sollicitations constantes, il est à peine plus rapide que le modèle i5, beaucoup moins cher. Nous sommes de ce fait très sceptiques quant à la différence de prix, et conseillons plutôt le ThinkPad X1 Carbon 2017 équipé du Core i5-7200U. Les avantages du Core i7 sont juste trop limités, et les 16 Go de RAM ne sont pas nécessaires…
L’intégralité de cette critique est disponible en anglais en suivant ce lien.
Lenovo ThinkPad X1 Carbon 2017-20HR0021GE
- 06/14/2017 v6 (old)
Sebastian Bade