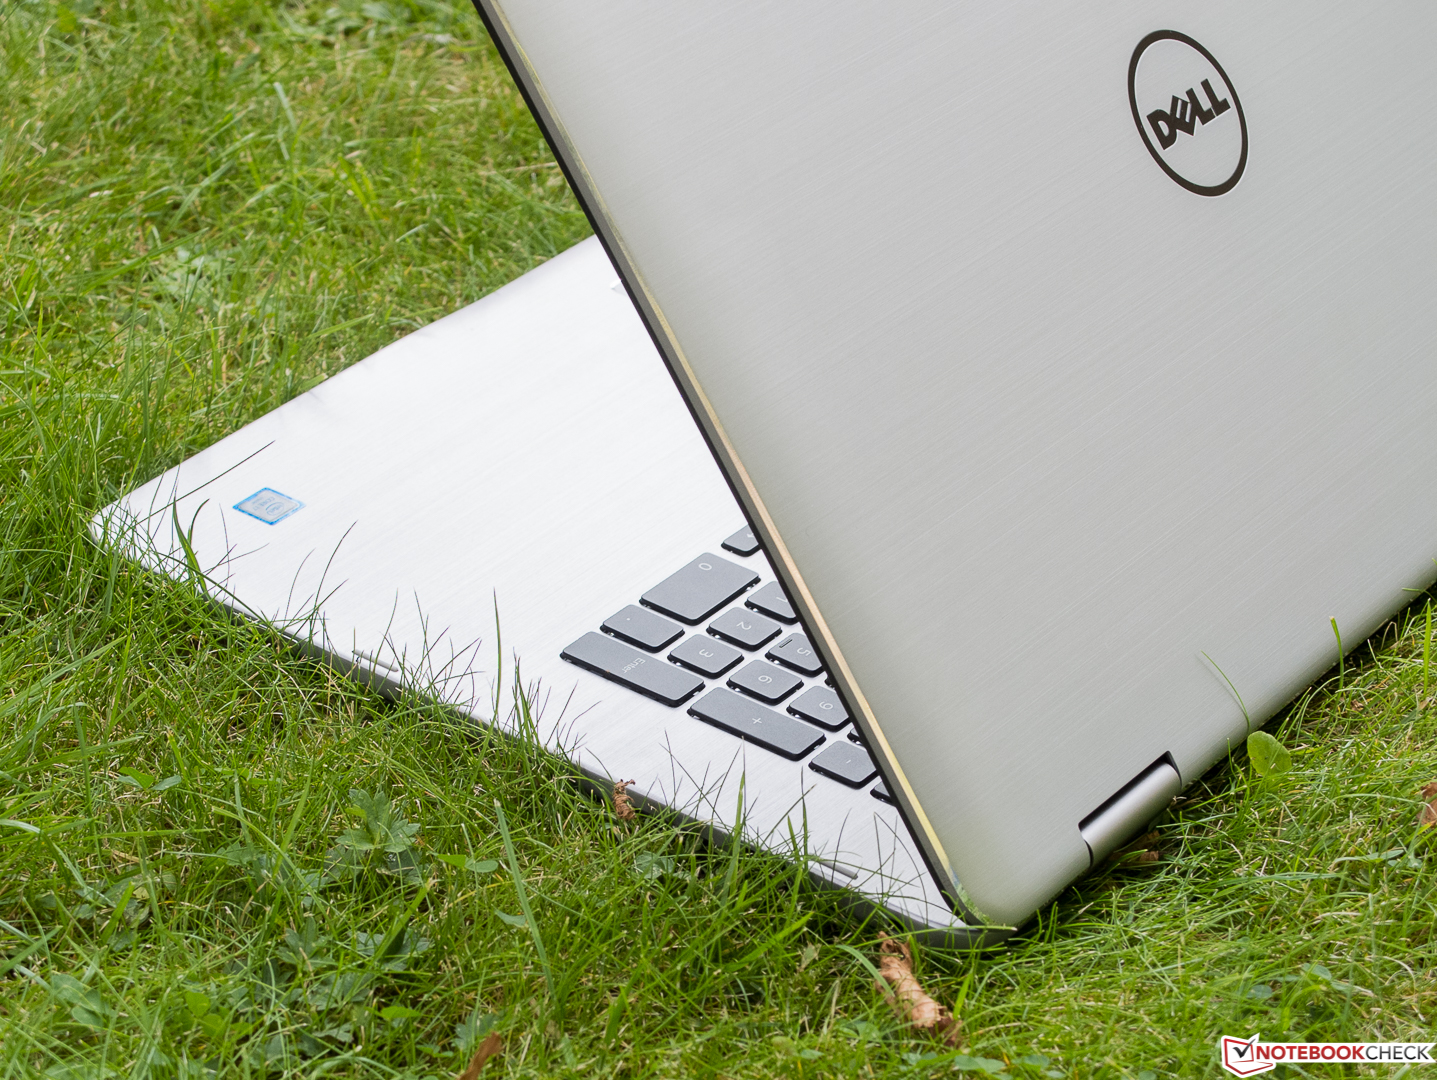
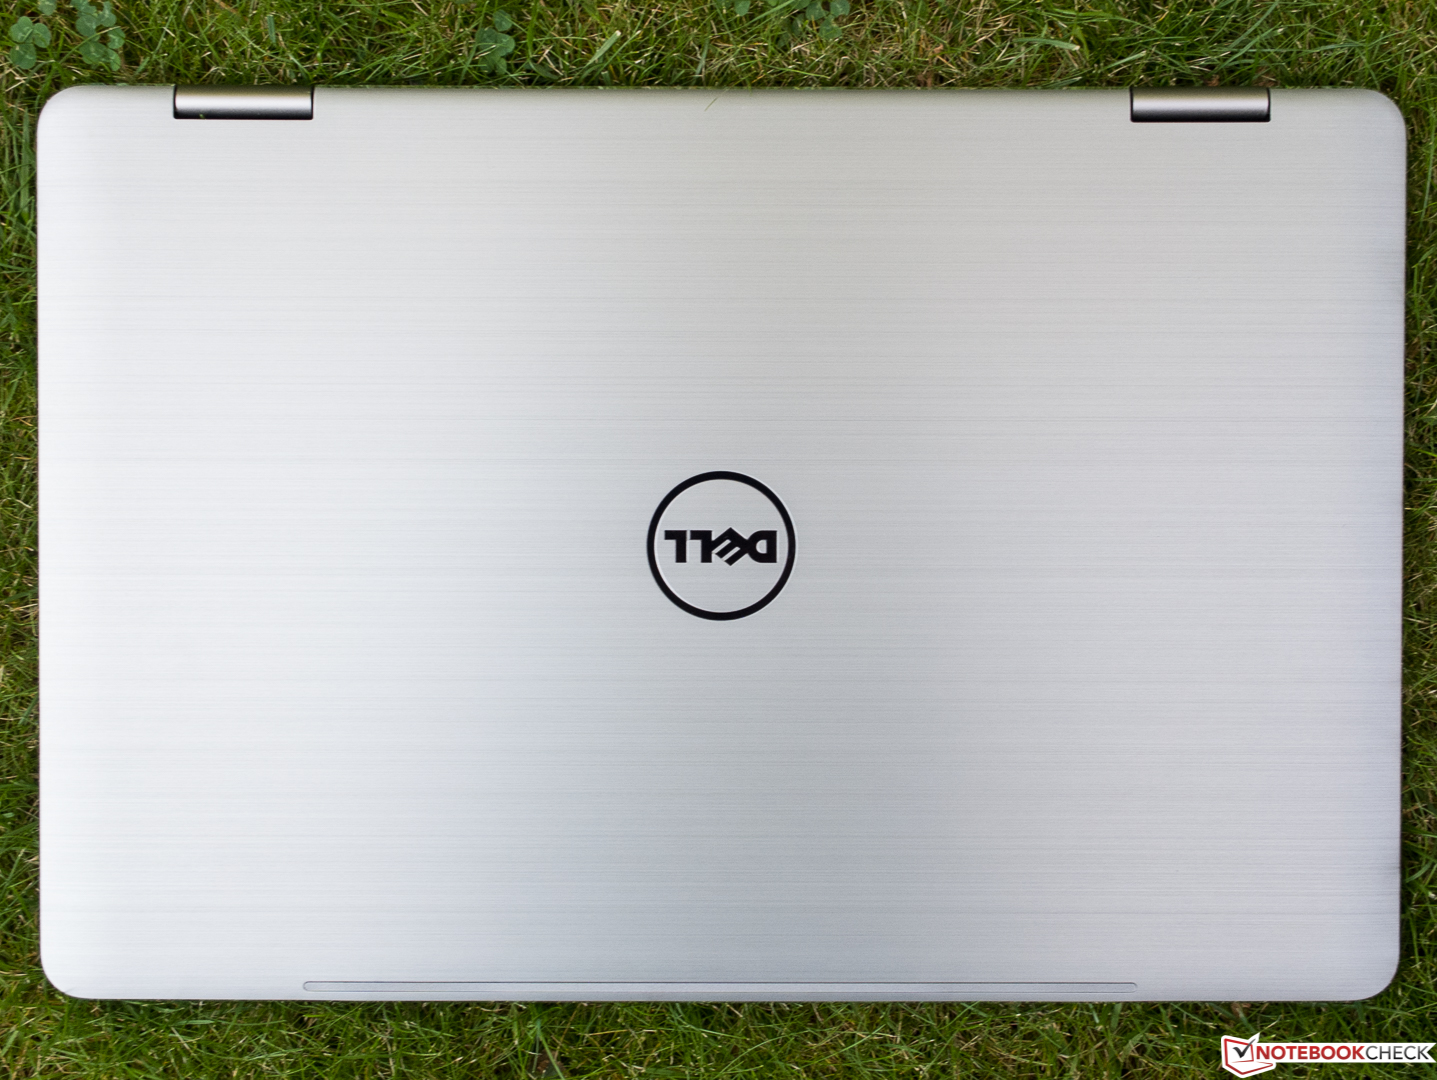
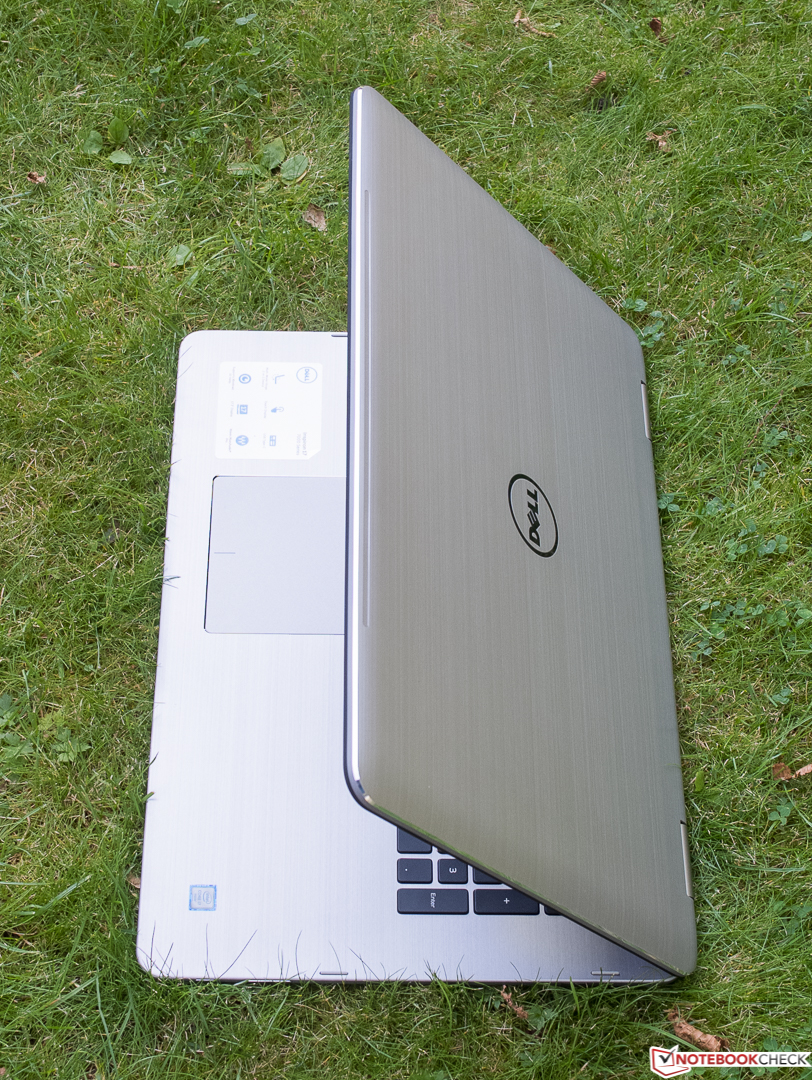
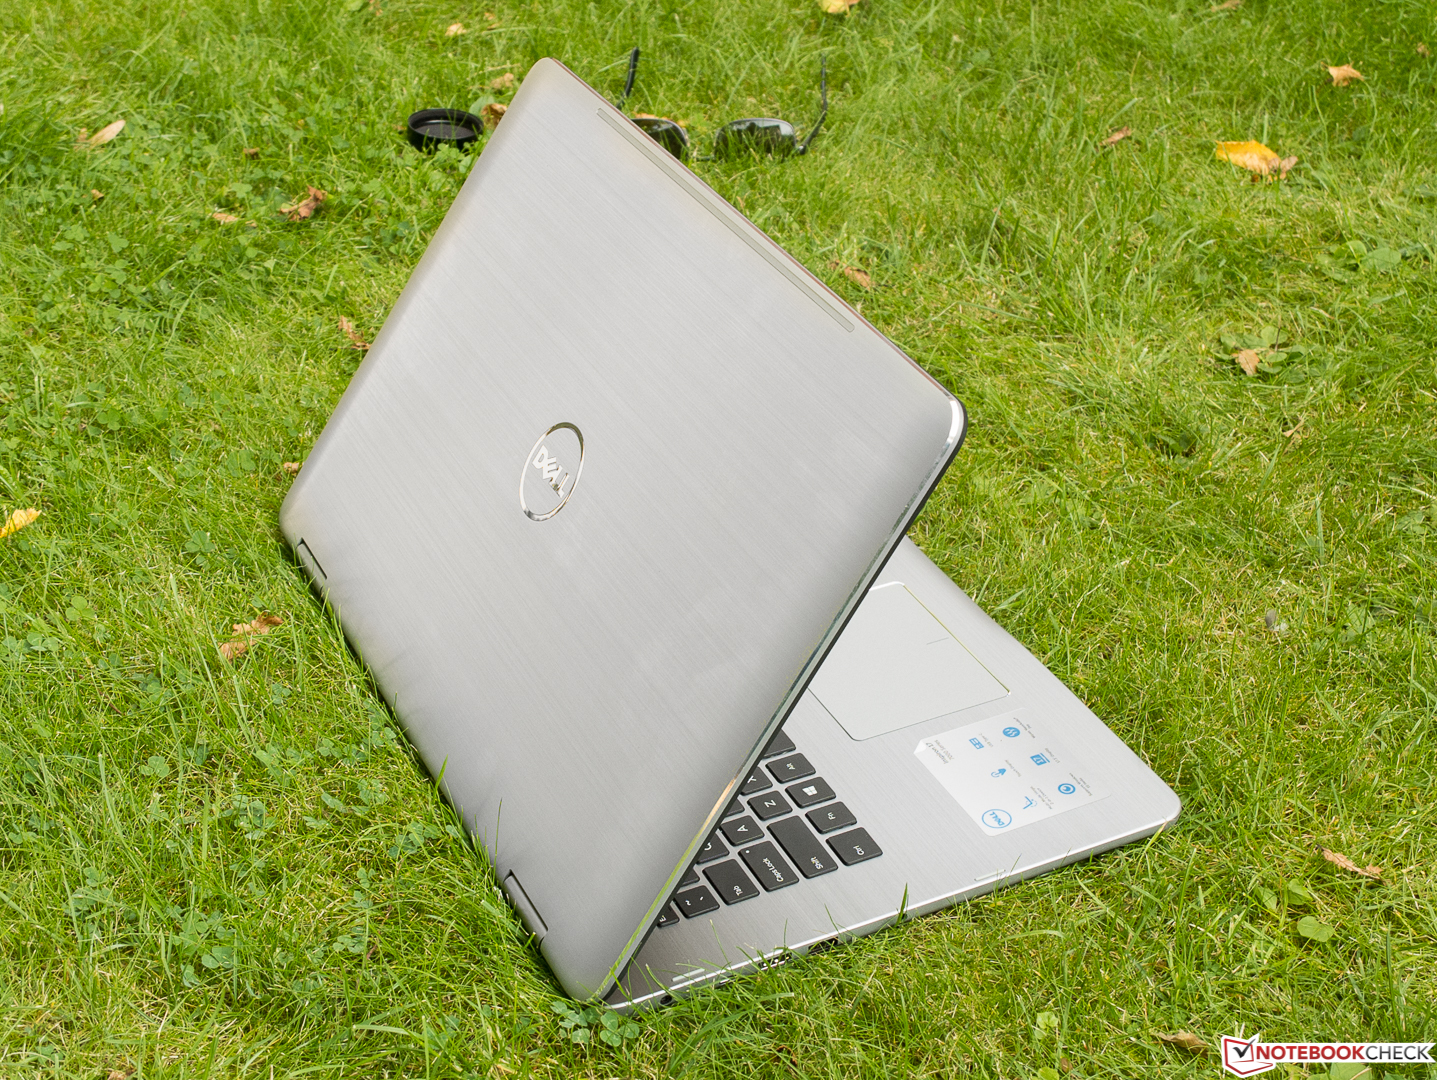
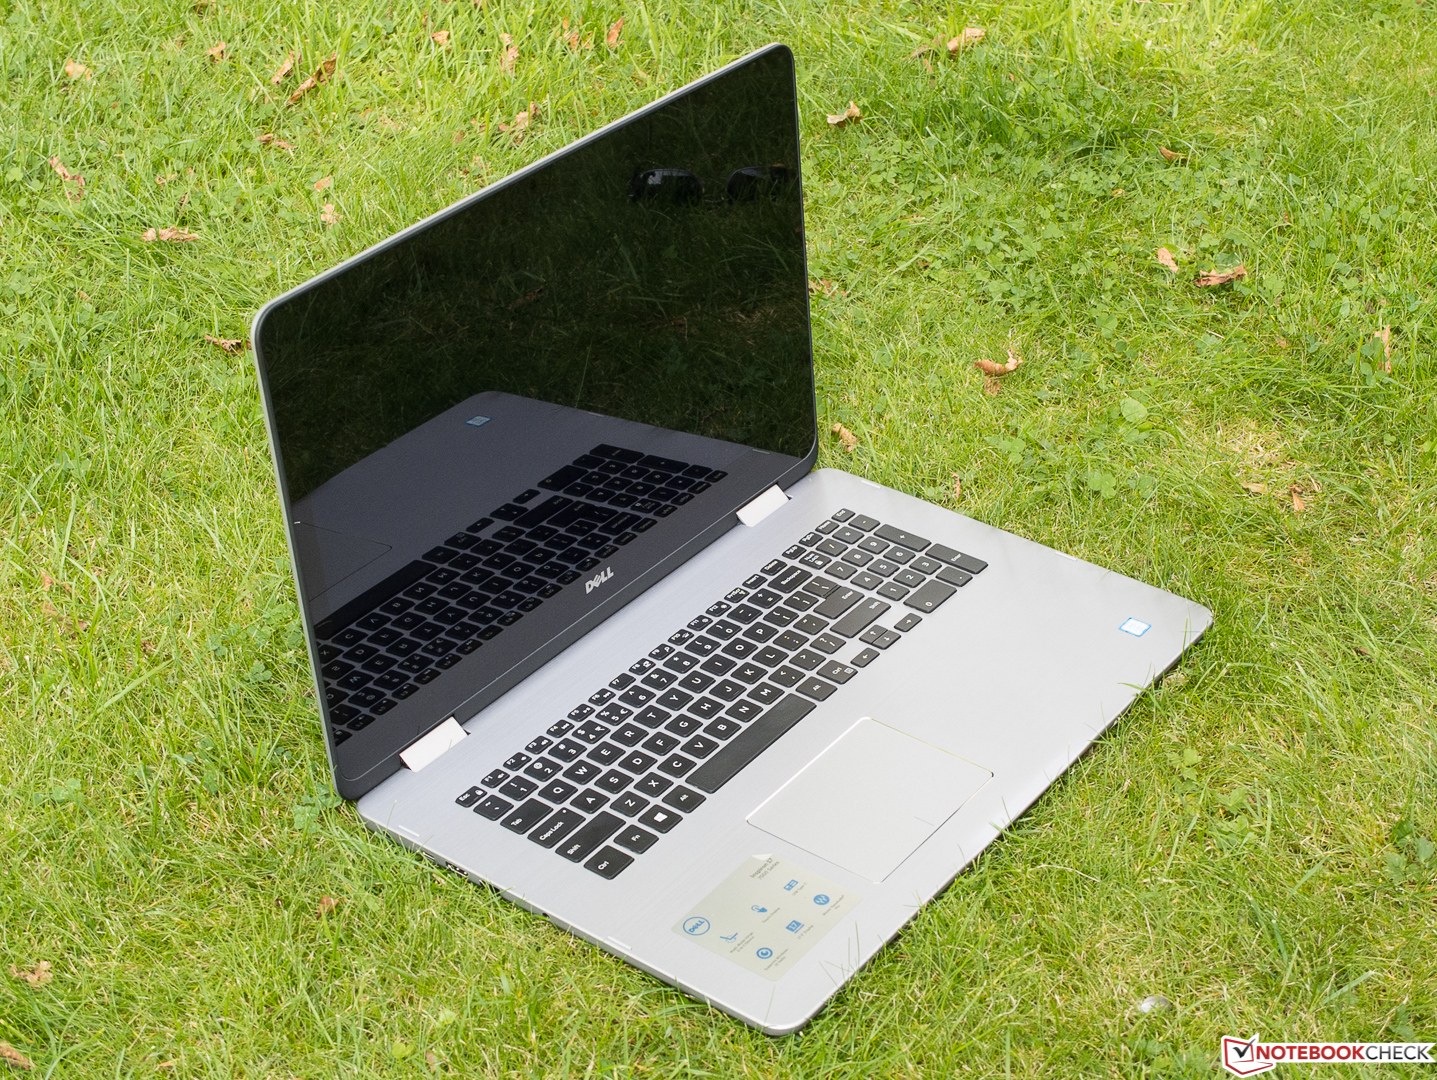
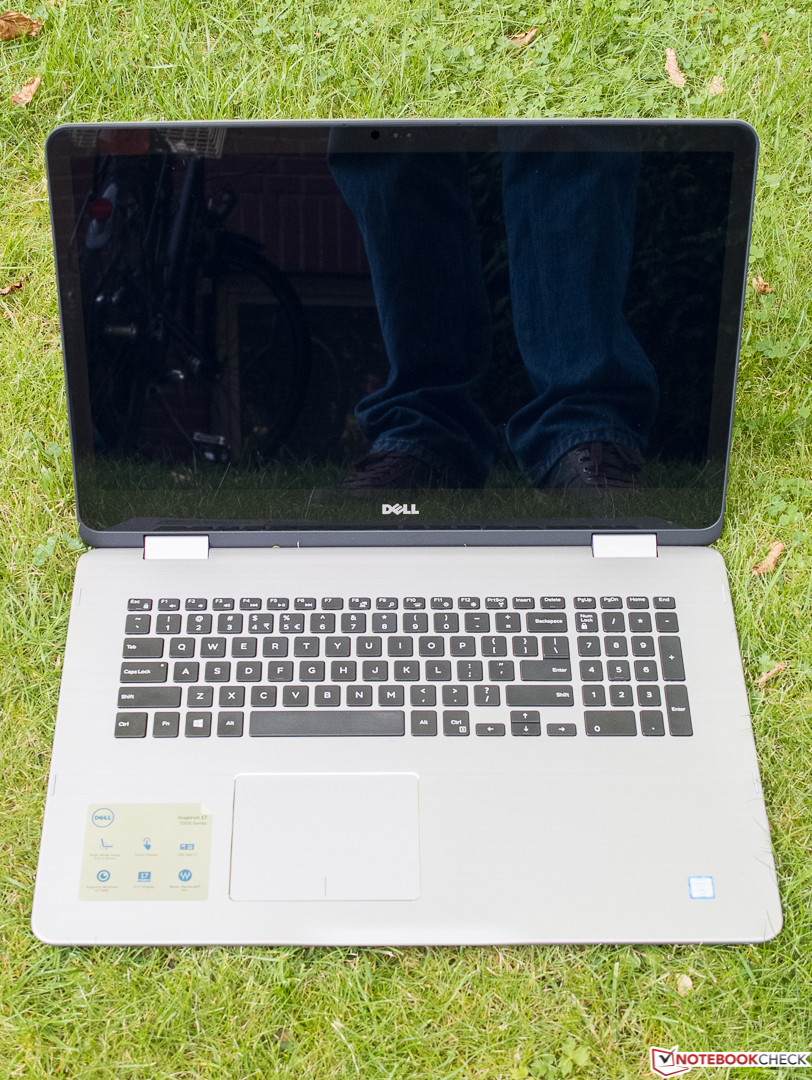
Courte critique du convertible Dell Inspiron 17 7778


| SD Card Reader | |
| average JPG Copy Test (av. of 3 runs) | |
| HP Envy 15-w103ng x360 | |
| Dell Inspiron 17 7778 | |
| Dell Inspiron 15 5568 | |
| Acer TravelMate P278-MG-76L2 | |
| maximum AS SSD Seq Read Test (1GB) | |
| HP Envy 15-w103ng x360 | |
| Acer TravelMate P278-MG-76L2 | |
| Dell Inspiron 15 5568 | |
| Dell Inspiron 17 7778 | |
| Networking | |
| Wi-Fi Client 1m | |
| Wi-Fi Server 1m |
| |||||||||||||||||||||||||
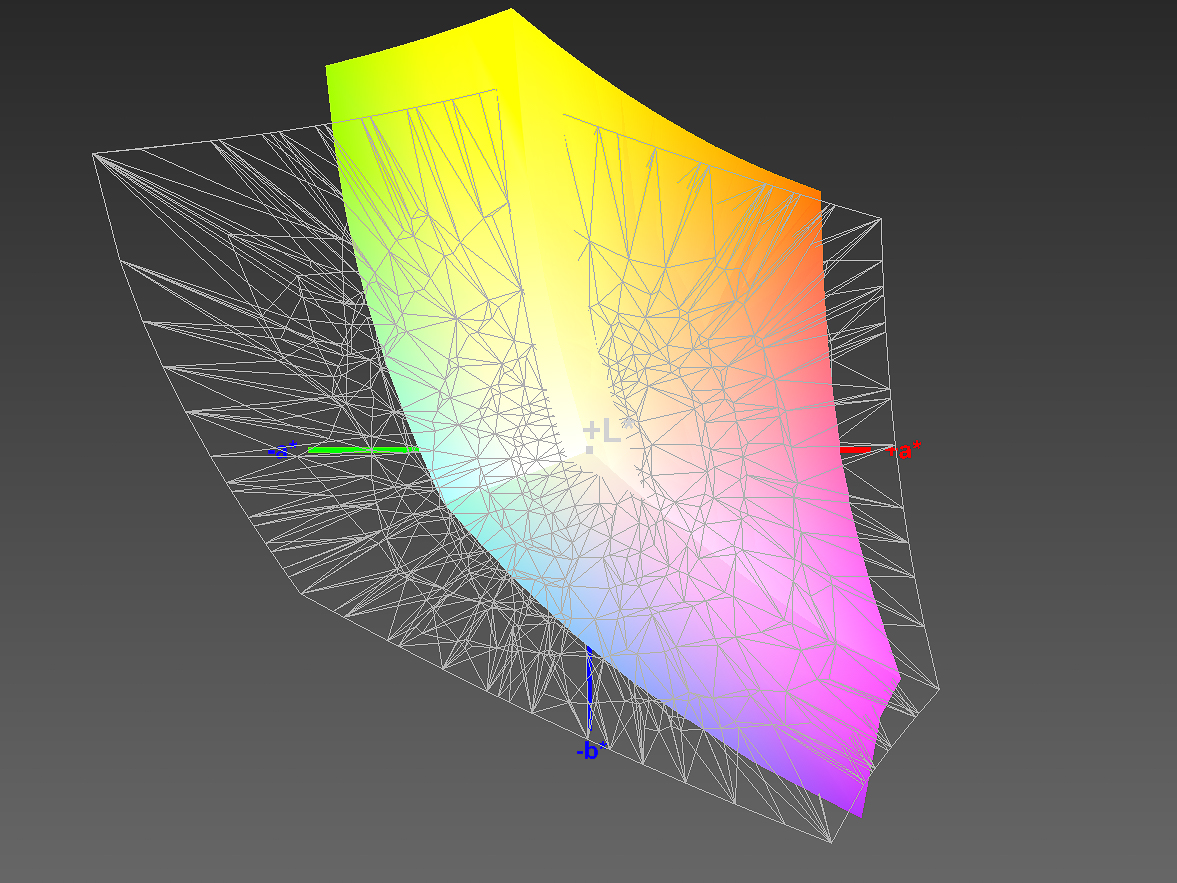
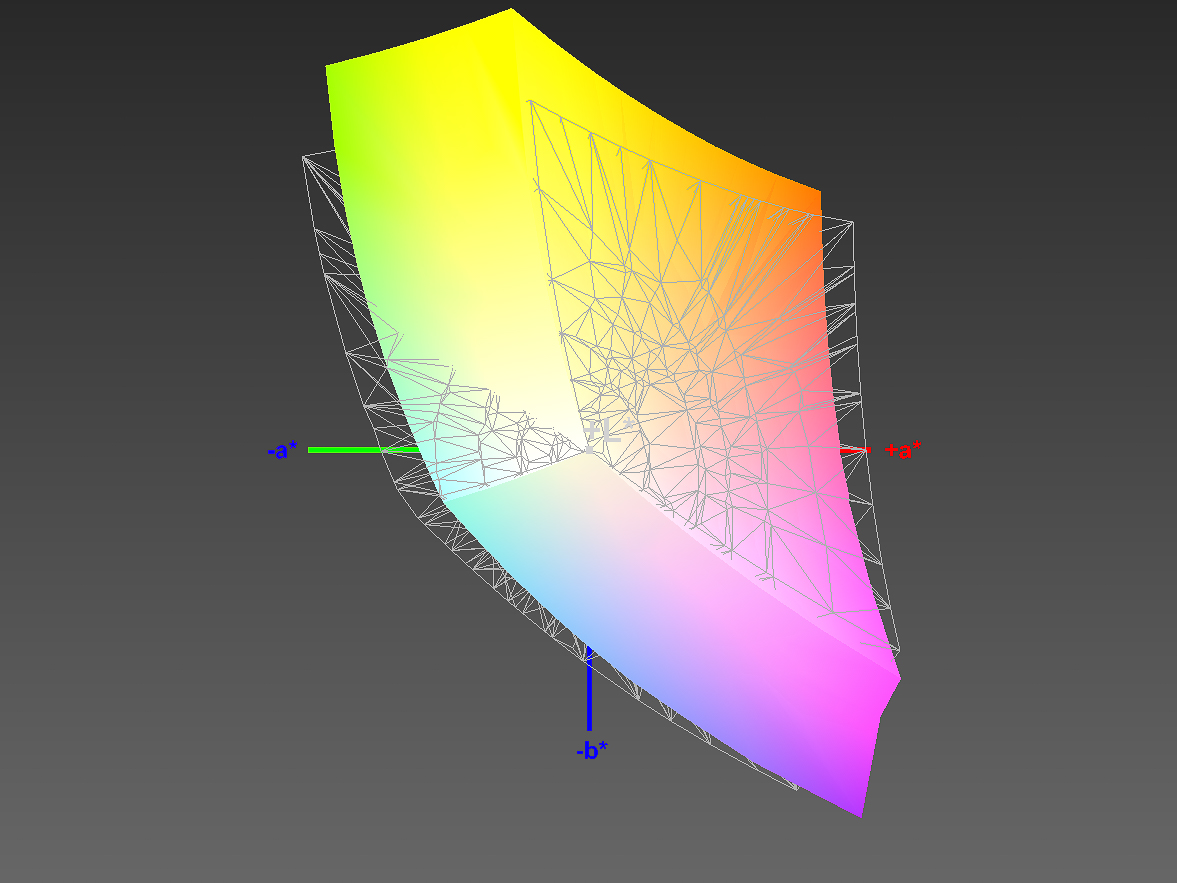
Homogénéité de la luminosité: 87 %
Valeur mesurée au centre, sur batterie: 334 cd/m²
Contraste: 1090:1 (Valeurs des noirs: 0.3 cd/m²)
ΔE ColorChecker Calman: 6.75 | ∀{0.5-29.43 Ø4.72}
ΔE Greyscale Calman: 7.91 | ∀{0.09-98 Ø4.97}
86% sRGB (Argyll 1.6.3 3D)
57% AdobeRGB 1998 (Argyll 1.6.3 3D)
63.1% AdobeRGB 1998 (Argyll 3D)
86.3% sRGB (Argyll 3D)
67.4% Display P3 (Argyll 3D)
Gamma: 2.31
CCT: 7642 K
| Dell Inspiron 17 7778 LG Philips LGD 0513 / 173WF4, , 1920x1080, 17.3" | HP Spectre x360 15-ap012dx 3840x2160, 15.6" | Dell Inspiron 15 5568 AU Optronics B156HW01 V0, , 1920x1080, 15.6" | HP Envy 15-w103ng x360 LG Philips, , 1920x1080, 15.6" | Acer TravelMate P278-MG-76L2 AUO B173HTN01.1 (AUO119D), , 1920x1080, 17.3" | |
|---|---|---|---|---|---|
| Display | -1% | -39% | -36% | 4% | |
| Display P3 Coverage (%) | 67.4 | 62.8 -7% | 38.04 -44% | 39.97 -41% | 68.8 2% |
| sRGB Coverage (%) | 86.3 | 88.2 2% | 57.1 -34% | 59.8 -31% | 90.6 5% |
| AdobeRGB 1998 Coverage (%) | 63.1 | 63.9 1% | 39.3 -38% | 41.32 -35% | 66.3 5% |
| Response Times | -9% | -9% | -15% | -10% | |
| Response Time Grey 50% / Grey 80% * (ms) | 36 ? | 32.8 ? 9% | 42 ? -17% | 37 ? -3% | 41 ? -14% |
| Response Time Black / White * (ms) | 22 ? | 28 ? -27% | 22 ? -0% | 28 ? -27% | 23 ? -5% |
| PWM Frequency (Hz) | 1000 ? | ||||
| Screen | -1% | -1% | -17% | -21% | |
| Brightness middle (cd/m²) | 327 | 298 -9% | 266 -19% | 208 -36% | 362 11% |
| Brightness (cd/m²) | 314 | 295 -6% | 249 -21% | 205 -35% | 344 10% |
| Brightness Distribution (%) | 87 | 88 1% | 85 -2% | 80 -8% | 84 -3% |
| Black Level * (cd/m²) | 0.3 | 0.57 -90% | 0.26 13% | 0.26 13% | 0.57 -90% |
| Contrast (:1) | 1090 | 523 -52% | 1023 -6% | 800 -27% | 635 -42% |
| Colorchecker dE 2000 * | 6.75 | 4.43 34% | 4.98 26% | 6.97 -3% | 9.54 -41% |
| Colorchecker dE 2000 max. * | 11.82 | 6.62 44% | 11.82 -0% | 16.11 -36% | |
| Greyscale dE 2000 * | 7.91 | 2.45 69% | 2.68 66% | 7.37 7% | 10.39 -31% |
| Gamma | 2.31 95% | 2.45 90% | 2.27 97% | 2.34 94% | 2.55 86% |
| CCT | 7642 85% | 6326 103% | 6583 99% | 6823 95% | 11093 59% |
| Color Space (Percent of AdobeRGB 1998) (%) | 57 | 57.2 0% | 36 -37% | 38 -33% | 59 4% |
| Color Space (Percent of sRGB) (%) | 86 | 87.8 2% | 57 -34% | 59 -31% | 90 5% |
| Moyenne finale (programmes/paramètres) | -4% /
-2% | -16% /
-10% | -23% /
-21% | -9% /
-15% |
* ... Moindre est la valeur, meilleures sont les performances
Temps de réponse de l'écran
| ↔ Temps de réponse noir à blanc | ||
|---|---|---|
| 22 ms ... hausse ↗ et chute ↘ combinées | ↗ 5 ms hausse | 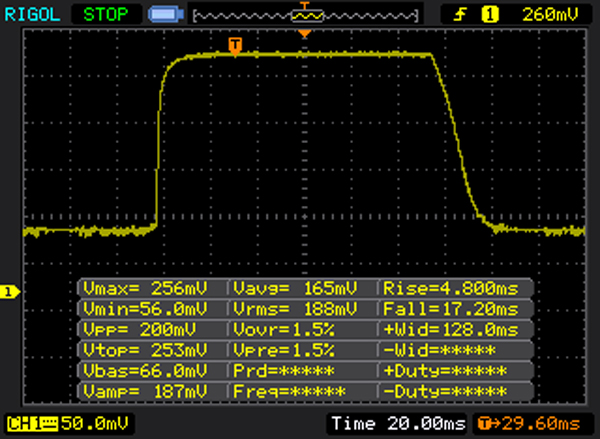 |
| ↘ 17 ms chute | ||
| L'écran montre de bons temps de réponse, mais insuffisant pour du jeu compétitif. En comparaison, tous les appareils testés affichent entre 0.1 (minimum) et 240 (maximum) ms. » 48 % des appareils testés affichent de meilleures performances. Cela signifie que les latences relevées sont moins bonnes que la moyenne (19.8 ms) de tous les appareils testés. | ||
| ↔ Temps de réponse gris 50% à gris 80% | ||
| 36 ms ... hausse ↗ et chute ↘ combinées | ↗ 14 ms hausse | 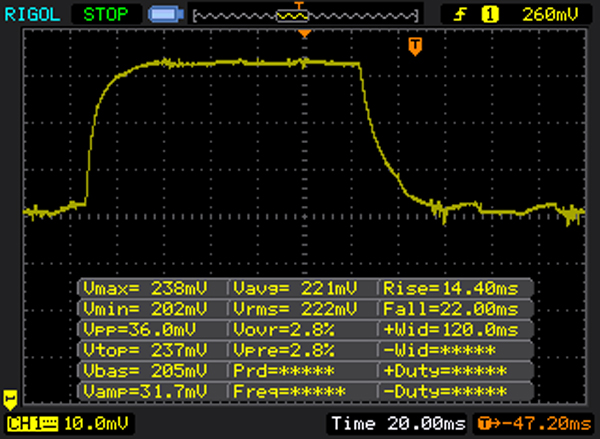 |
| ↘ 22 ms chute | ||
| L'écran souffre de latences très élevées, à éviter pour le jeu. En comparaison, tous les appareils testés affichent entre 0.165 (minimum) et 636 (maximum) ms. » 50 % des appareils testés affichent de meilleures performances. Cela signifie que les latences relevées sont moins bonnes que la moyenne (31 ms) de tous les appareils testés. | ||
Scintillement / MLI (Modulation de largeur d'impulsion)
| Scintillement / MLI (Modulation de largeur d'impulsion) non décelé | ||
En comparaison, 52 % des appareils testés n'emploient pas MDI pour assombrir leur écran. Nous avons relevé une moyenne à 7781 (minimum : 5 - maximum : 343500) Hz dans le cas où une MDI était active. | ||

| PCMark 8 | |
| Home Score Accelerated v2 | |
| Dell Inspiron 17 7778 | |
| Dell Inspiron 15 5568 | |
| Acer TravelMate P278-MG-76L2 | |
| HP Envy 15-w103ng x360 | |
| HP Spectre x360 15-ap012dx | |
| Work Score Accelerated v2 | |
| Dell Inspiron 17 7778 | |
| Acer TravelMate P278-MG-76L2 | |
| Dell Inspiron 15 5568 | |
| HP Envy 15-w103ng x360 | |
| HP Spectre x360 15-ap012dx | |
| PCMark 8 Home Score Accelerated v2 | 3696 points | |
| PCMark 8 Work Score Accelerated v2 | 4572 points | |
Aide | ||
| Dell Inspiron 17 7778 Liteonit CV3-CE512 | HP Spectre x360 15-ap012dx Sandisk X300 SD7SN6S-256G-1006 | Dell Inspiron 15 5568 Toshiba THNSNK256GCS8 | HP Envy 15-w103ng x360 Samsung SSD PM851 256 GB MZNTE256HMHP | Acer TravelMate P278-MG-76L2 Lite-On CV1-8B256 | |
|---|---|---|---|---|---|
| CrystalDiskMark 3.0 | -4% | -8% | 2% | -4% | |
| Read Seq (MB/s) | 486.4 | 475.6 -2% | 458.6 -6% | 515 6% | 473 -3% |
| Write Seq (MB/s) | 438.4 | 425 -3% | 270 -38% | 240.7 -45% | 366.3 -16% |
| Read 512 (MB/s) | 232.8 | 258.4 11% | 397.4 71% | 391.3 68% | 329.4 41% |
| Write 512 (MB/s) | 386.7 | 318.9 -18% | 242 -37% | 240 -38% | 357.3 -8% |
| Read 4k (MB/s) | 32.3 | 35.48 10% | 19.88 -38% | 27.64 -14% | 30.83 -5% |
| Write 4k (MB/s) | 65.8 | 93 41% | 86.7 32% | 95.2 45% | 74.8 14% |
| Read 4k QD32 (MB/s) | 334.4 | 281.2 -16% | 275.3 -18% | 367.9 10% | 245.1 -27% |
| Write 4k QD32 (MB/s) | 289.5 | 138.7 -52% | 197.6 -32% | 239 -17% | 217.3 -25% |

| 3DMark 11 - 1280x720 Performance GPU | |
| Dell Inspiron 17 7778 | |
| Acer TravelMate P278-MG-76L2 | |
| HP Envy 15-w103ng x360 | |
| Dell Inspiron 15 5568 | |
| HP Spectre x360 15-ap012dx | |
| 3DMark | |
| 1280x720 Cloud Gate Standard Graphics | |
| Dell Inspiron 17 7778 | |
| Acer TravelMate P278-MG-76L2 | |
| Dell Inspiron 15 5568 | |
| HP Envy 15-w103ng x360 | |
| HP Spectre x360 15-ap012dx | |
| 1920x1080 Fire Strike Graphics | |
| Dell Inspiron 17 7778 | |
| Acer TravelMate P278-MG-76L2 | |
| HP Envy 15-w103ng x360 | |
| HP Spectre x360 15-ap012dx | |
| 3DMark 11 Performance | 2867 points | |
| 3DMark Cloud Gate Standard Score | 7674 points | |
| 3DMark Fire Strike Score | 1748 points | |
Aide | ||
| Mirror's Edge Catalyst | |
| 1920x1080 High Preset AF:16x | |
| MSI CX72 6QD | |
| Dell Inspiron 17 7778 | |
| 1366x768 Medium Preset AF:4x | |
| MSI CX72 6QD | |
| Asus VivoBook X556UQ-XO076T | |
| Dell Inspiron 17 7778 | |
| Far Cry Primal | |
| 1920x1080 High Preset AA:SM | |
| Dell Inspiron 17 7778 | |
| MSI CX72 6QD | |
| Lenovo ThinkPad T560-20FH002RGE | |
| 1920x1080 Medium Preset AA:SM | |
| MSI CX72 6QD | |
| Dell Inspiron 17 7778 | |
| Lenovo ThinkPad T560-20FH002RGE | |
| Rise of the Tomb Raider | |
| 1920x1080 High Preset AA:FX AF:4x | |
| Dell Inspiron 17 7778 | |
| MSI CX72 6QD | |
| Lenovo ThinkPad T560-20FH002RGE | |
| Acer TravelMate P278-MG-76L2 | |
| 1366x768 Medium Preset AF:2x | |
| Dell Inspiron 17 7778 | |
| MSI CX72 6QD | |
| Lenovo ThinkPad T560-20FH002RGE | |
| Acer TravelMate P278-MG-76L2 | |
| Just Cause 3 | |
| 1920x1080 High / On AA:FX AF:8x | |
| MSI CX72 6QD | |
| Lenovo ThinkPad T560-20FH002RGE | |
| Dell Inspiron 17 7778 | |
| 1366x768 Medium / Off AF:4x | |
| MSI CX72 6QD | |
| Lenovo ThinkPad T560-20FH002RGE | |
| Dell Inspiron 17 7778 | |
| Rainbow Six Siege | |
| 1920x1080 High Preset AA:T AF:4x | |
| MSI CX72 6QD | |
| Dell Inspiron 17 7778 | |
| Lenovo ThinkPad T560-20FH002RGE | |
| 1366x768 Medium Preset AA:T AF:2x | |
| MSI CX72 6QD | |
| Lenovo ThinkPad T560-20FH002RGE | |
| Dell Inspiron 17 7778 | |
| Assassin's Creed Syndicate | |
| 1920x1080 High Preset AA:FX | |
| Dell Inspiron 17 7778 | |
| HP Envy 15-w103ng x360 | |
| 1366x768 Medium Preset AA:FX | |
| Dell Inspiron 17 7778 | |
| MSI CX72 6QD | |
| HP Envy 15-w103ng x360 | |
| Star Wars Battlefront | |
| 1920x1080 High Preset AA:FX | |
| Dell Inspiron 17 7778 | |
| MSI CX72 6QD | |
| Lenovo ThinkPad T560-20FH002RGE | |
| HP Envy 15-w103ng x360 | |
| 1366x768 Medium Preset AA:FX | |
| MSI CX72 6QD | |
| Lenovo ThinkPad T560-20FH002RGE | |
| Asus VivoBook X556UQ-XO076T | |
| Dell Inspiron 17 7778 | |
| HP Envy 15-w103ng x360 | |
| Fallout 4 | |
| 1920x1080 High Preset AA:T AF:16x | |
| Dell Inspiron 17 7778 | |
| MSI CX72 6QD | |
| Lenovo ThinkPad T560-20FH002RGE | |
| HP Envy 15-w103ng x360 | |
| 1366x768 Medium Preset AA:T AF:16x | |
| Dell Inspiron 17 7778 | |
| MSI CX72 6QD | |
| Lenovo ThinkPad T560-20FH002RGE | |
| HP Envy 15-w103ng x360 | |
| Anno 2205 | |
| 1920x1080 High Preset AA:4x | |
| Dell Inspiron 17 7778 | |
| Lenovo ThinkPad T560-20FH002RGE | |
| MSI CX72 6QD | |
| HP Envy 15-w103ng x360 | |
| 1366x768 Medium Preset AA:2x | |
| MSI CX72 6QD | |
| Dell Inspiron 17 7778 | |
| Lenovo ThinkPad T560-20FH002RGE | |
| HP Envy 15-w103ng x360 | |
| FIFA 16 | |
| 1920x1080 High Preset AA:4x MS | |
| Dell Inspiron 17 7778 | |
| MSI CX72 6QD | |
| HP Envy 15-w103ng x360 | |
| 1366x768 High Preset AA:2x MS | |
| MSI CX72 6QD | |
| HP Envy 15-w103ng x360 | |
| Dirt Rally | |
| 1920x1080 High Preset | |
| Dell Inspiron 17 7778 | |
| Lenovo ThinkPad T560-20FH002RGE | |
| 1366x768 Medium Preset | |
| Dell Inspiron 17 7778 | |
| Lenovo ThinkPad T560-20FH002RGE | |
| The Witcher 3 | |
| 1920x1080 High Graphics & Postprocessing (Nvidia HairWorks Off) | |
| Dell Inspiron 17 7778 | |
| MSI CX72 6QD | |
| Lenovo ThinkPad T560-20FH002RGE | |
| HP Envy 15-w103ng x360 | |
| 1366x768 Medium Graphics & Postprocessing | |
| Dell Inspiron 17 7778 | |
| MSI CX72 6QD | |
| Lenovo ThinkPad T560-20FH002RGE | |
| HP Envy 15-w103ng x360 | |
| Battlefield 4 | |
| 1366x768 High Preset | |
| Dell Inspiron 17 7778 | |
| Lenovo ThinkPad T560-20FH002RGE | |
| Asus VivoBook X556UQ-XO076T | |
| Acer TravelMate P278-MG-76L2 | |
| 1366x768 Medium Preset | |
| Lenovo ThinkPad T560-20FH002RGE | |
| Asus VivoBook X556UQ-XO076T | |
| Dell Inspiron 17 7778 | |
| Acer TravelMate P278-MG-76L2 | |
| Metro: Last Light | |
| 1366x768 High (DX11) AF:16x | |
| Dell Inspiron 17 7778 | |
| Lenovo ThinkPad T560-20FH002RGE | |
| 1366x768 Medium (DX10) AF:4x | |
| Dell Inspiron 17 7778 | |
| Lenovo ThinkPad T560-20FH002RGE | |
| BioShock Infinite | |
| 1366x768 High Preset | |
| Dell Inspiron 17 7778 | |
| Lenovo ThinkPad T560-20FH002RGE | |
| Acer TravelMate P278-MG-76L2 | |
| Asus VivoBook X556UQ-XO076T | |
| 1366x768 Medium Preset | |
| Dell Inspiron 17 7778 | |
| Lenovo ThinkPad T560-20FH002RGE | |
| Acer TravelMate P278-MG-76L2 | |
| Asus VivoBook X556UQ-XO076T | |
| Crysis 3 | |
| 1366x768 High Preset AA:FX AF:16x | |
| Dell Inspiron 17 7778 | |
| Lenovo ThinkPad T560-20FH002RGE | |
| 1366x768 Medium Preset AF:16x | |
| Dell Inspiron 17 7778 | |
| Lenovo ThinkPad T560-20FH002RGE | |
| Bas | Moyen | Élevé | Ultra | |
|---|---|---|---|---|
| Crysis 3 (2013) | 51.5 | 28.1 | 21.7 | |
| BioShock Infinite (2013) | 107.8 | 60.1 | 53.1 | 19.3 |
| Metro: Last Light (2013) | 55.2 | 42.6 | 25.2 | |
| Battlefield 4 (2013) | 40.6 | 32.4 | 14.3 | |
| Dirt Rally (2015) | 52.4 | 30.7 | ||
| The Witcher 3 (2015) | 36.9 | 21.7 | 11.2 | |
| FIFA 16 (2015) | 45.8 | |||
| Anno 2205 (2015) | 39.4 | 27 | 13.2 | |
| Fallout 4 (2015) | 37.1 | 25.2 | 13.9 | |
| Star Wars Battlefront (2015) | 40.1 | 29.6 | 16.5 | |
| Assassin's Creed Syndicate (2015) | 20.7 | 20.1 | 11.1 | |
| Rainbow Six Siege (2015) | 79.1 | 40.4 | 22.5 | |
| Just Cause 3 (2015) | 31.9 | 25.7 | 13.4 | |
| Rise of the Tomb Raider (2016) | 37.7 | 22.3 | 13.1 | |
| Far Cry Primal (2016) | 32 | 14 | 14 | |
| The Division (2016) | 40.2 | 20.7 | 8.8 | |
| Hitman 2016 (2016) | 21.7 | 23.4 | ||
| Mirror's Edge Catalyst (2016) | 44 | 19.3 | 8.3 |
Degré de la nuisance sonore
| Au repos |
| 32.1 / 32.1 / 34 dB(A) |
| Fortement sollicité |
| 40.3 / 42.6 dB(A) |
 | ||
30 dB silencieux 40 dB(A) audible 50 dB(A) bruyant |
||
min: | ||
(±) La température maximale du côté supérieur est de 44.7 °C / 112 F, par rapport à la moyenne de 36.8 °C / 98 F, allant de 21 à 71 °C pour la classe Multimedia.
(-) Le fond chauffe jusqu'à un maximum de 45.5 °C / 114 F, contre une moyenne de 39.1 °C / 102 F
(+) En utilisation inactive, la température moyenne du côté supérieur est de 29.9 °C / 86 F, par rapport à la moyenne du dispositif de 31.3 °C / 88 F.
(+) Les repose-poignets et le pavé tactile atteignent la température maximale de la peau (33.5 °C / 92.3 F) et ne sont donc pas chauds.
(-) La température moyenne de la zone de l'appui-paume de dispositifs similaires était de 28.7 °C / 83.7 F (-4.8 °C / #-8.6 F).
Dell Inspiron 17 7778 analyse audio
(±) | le niveau sonore du haut-parleur est moyen mais bon (74# dB)
Basses 100 - 315 Hz
(±) | basse réduite - en moyenne 7.5% inférieure à la médiane
(+) | les basses sont linéaires (6.4% delta à la fréquence précédente)
Médiums 400 - 2000 Hz
(+) | médiane équilibrée - seulement 4.9% de la médiane
(+) | les médiums sont linéaires (6.6% delta à la fréquence précédente)
Aiguës 2 - 16 kHz
(+) | des sommets équilibrés - à seulement 1.7% de la médiane
(+) | les aigus sont linéaires (4.5% delta à la fréquence précédente)
Globalement 100 - 16 000 Hz
(+) | le son global est linéaire (12.5% différence à la médiane)
Par rapport à la même classe
» 24% de tous les appareils testés de cette catégorie étaient meilleurs, 3% similaires, 73% pires
» Le meilleur avait un delta de 5%, la moyenne était de 17%, le pire était de 45%.
Par rapport à tous les appareils testés
» 11% de tous les appareils testés étaient meilleurs, 2% similaires, 87% pires
» Le meilleur avait un delta de 4%, la moyenne était de 24%, le pire était de 134%.
| Éteint/en veille | |
| Au repos | |
| Fortement sollicité |
|
Légende:
min: | |
| Dell Inspiron 17 7778 6500U, GeForce 940MX, Liteonit CV3-CE512, IPS, 1920x1080, 17.3" | HP Spectre x360 15-ap012dx 6200U, HD Graphics 520, Sandisk X300 SD7SN6S-256G-1006, IPS, 3840x2160, 15.6" | Dell Inspiron 15 5568 6500U, HD Graphics 520, Toshiba THNSNK256GCS8, IPS, 1920x1080, 15.6" | HP Envy 15-w103ng x360 6200U, GeForce 930M, Samsung SSD PM851 256 GB MZNTE256HMHP, IPS, 1920x1080, 15.6" | Acer TravelMate P278-MG-76L2 6500U, GeForce 940M, Lite-On CV1-8B256, TN LED, 1920x1080, 17.3" | |
|---|---|---|---|---|---|
| Power Consumption | -0% | 31% | 24% | -13% | |
| Idle Minimum * (Watt) | 5.6 | 6.5 -16% | 4.34 22% | 4.15 26% | 5.8 -4% |
| Idle Average * (Watt) | 11.2 | 13.3 -19% | 7.5 33% | 8.2 27% | 11.6 -4% |
| Idle Maximum * (Watt) | 11.9 | 15.1 -27% | 8.4 29% | 8.2 31% | 13.6 -14% |
| Load Average * (Watt) | 46 | 30.8 33% | 30.4 34% | 34.6 25% | 51 -11% |
| Load Maximum * (Watt) | 53 | 38.5 27% | 32.5 39% | 48 9% | 69 -30% |
* ... Moindre est la valeur, meilleures sont les performances
| Dell Inspiron 17 7778 6500U, GeForce 940MX, 56 Wh | HP Spectre x360 15-ap012dx 6200U, HD Graphics 520, 65 Wh | Dell Inspiron 15 5568 6500U, HD Graphics 520, 42 Wh | HP Envy 15-w103ng x360 6200U, GeForce 930M, 48 Wh | Acer TravelMate P278-MG-76L2 6500U, GeForce 940M, 37 Wh | |
|---|---|---|---|---|---|
| Autonomie de la batterie | -7% | -32% | -20% | -24% | |
| Reader / Idle (h) | 13.5 | 11.8 -13% | 7.5 -44% | 10 -26% | |
| WiFi v1.3 (h) | 8.3 | 7.2 -13% | 5 -40% | 6.6 -20% | 5 -40% |
| Load (h) | 1.8 | 1.9 6% | 1.6 -11% | 1.7 -6% | |
| H.264 (h) | 5 | 4.8 |
Points positifs
Points négatifs
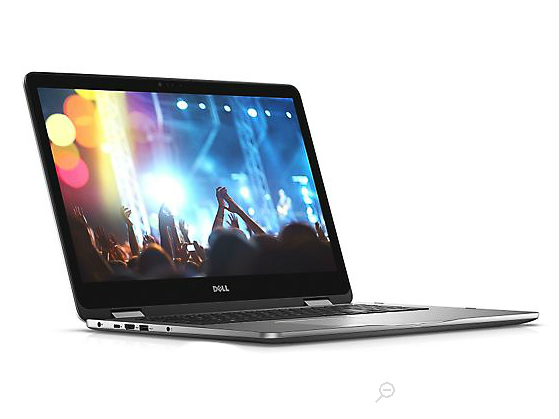
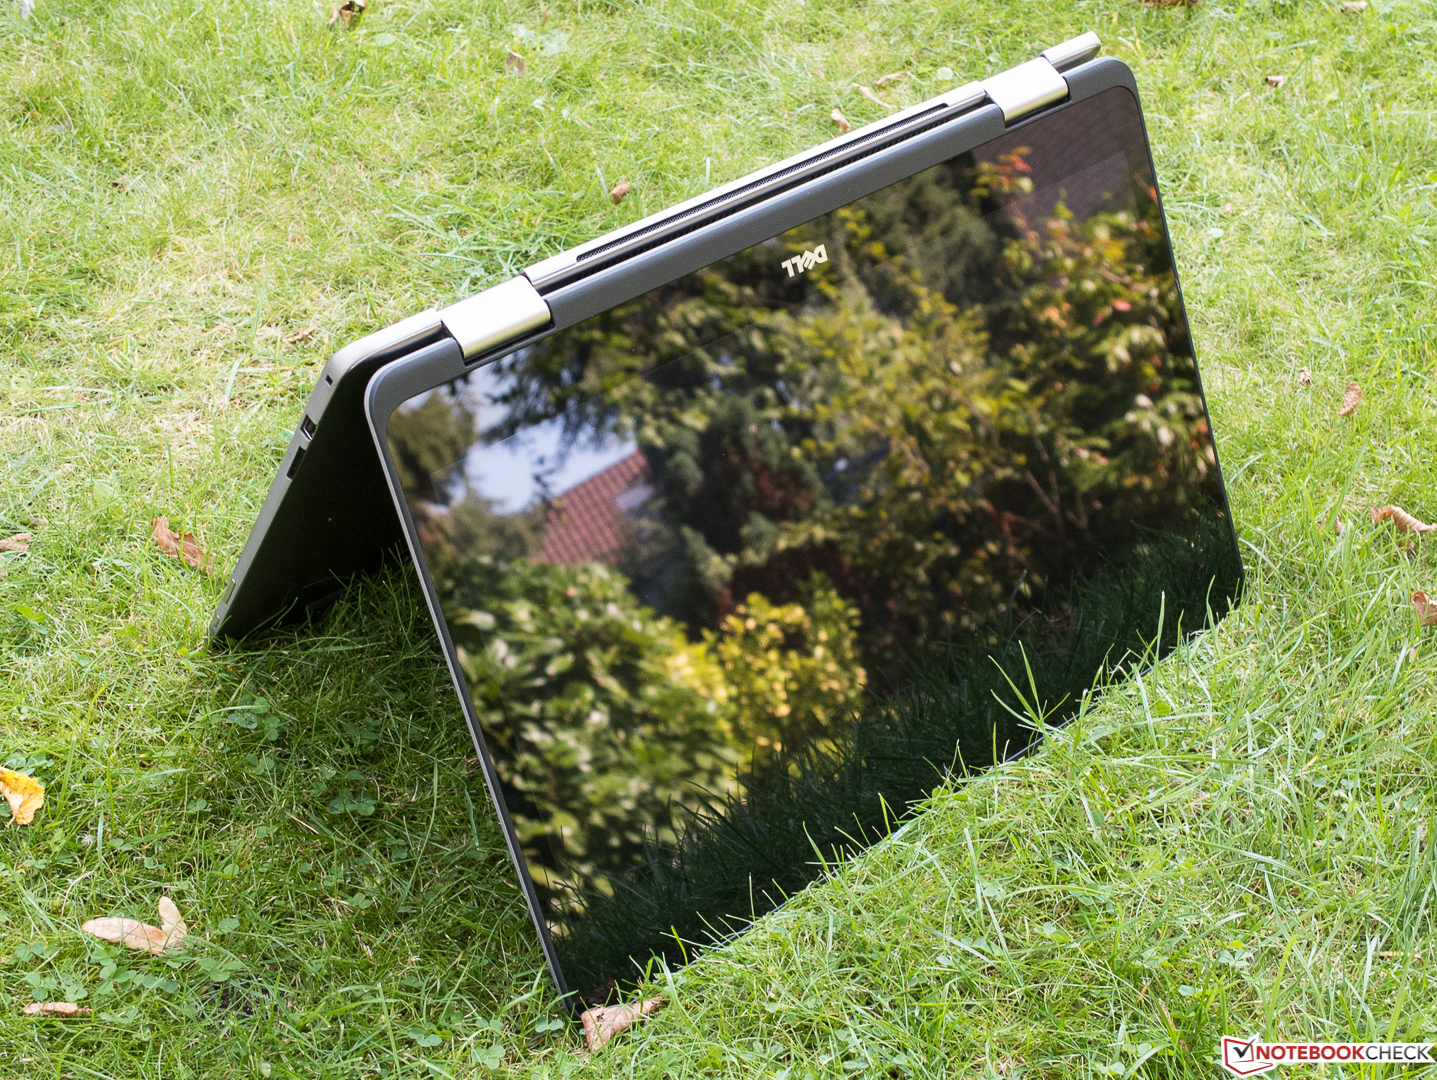
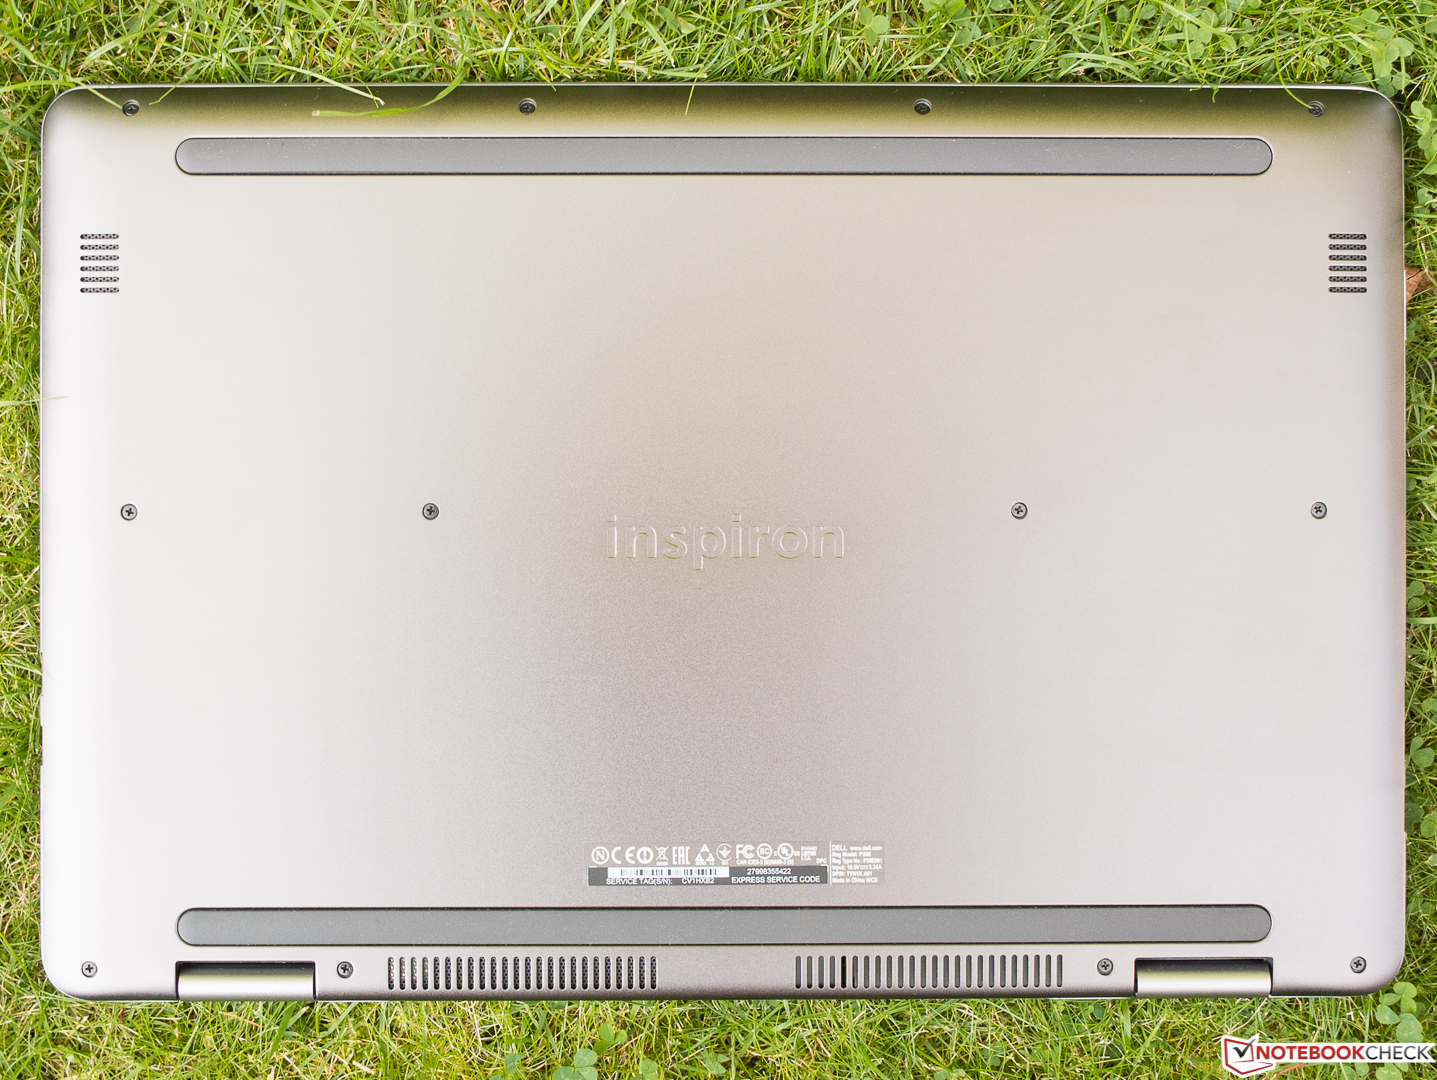
Le nouveau Inspiron 17 7778 2-en-1 de Dell est sans doute un convertible plutôt inhabituel, dont la mobilité sera moindre que celle des petits convertibles du fait de ses dimensions et de son poids. Mais cela n'est pas en soi un défaut, lorsque les différents modes d'utilisation typiques d'un convertible ne sont qu'un bonus dans une machine qui peut servir parfaitement de PC portable multimédia conventionnel et qui permet même de s'adonner occasionnellement aux jeux grâce au GPU GeForce 940MX. Le châssis est de bonne qualité, de même que l'écran. Le PC reste généralement silencieux et dispose d'une excellente autonomie qui devrait plaire aux nomades.
En dépit du fait que les charnières de l'écran soient un peu instables dans certains modes, le plus gros défaut vient du clavier qui ne devrait pas satisfaire la plupart des utilisateurs. Le GPU parfois bridé n'est pas un défaut aussi important. A cela s'ajoute l'écran tactile qui n'est pas vraiment utilisable avec des doigts mouillés.
En résumé, l'Inspiron 17 7778 est un convertible géant, polyvalent, doté d'un excellent design et plutôt convaincant qui ne comporte que peu de compromis pour les amateurs de l'usage hybride.
Pour plus de détails, la version complète de ce test (en anglais) est disponible ici.
Dell Inspiron 17 7778
- 09/09/2016 v5.1 (old)
Sven Kloevekorn