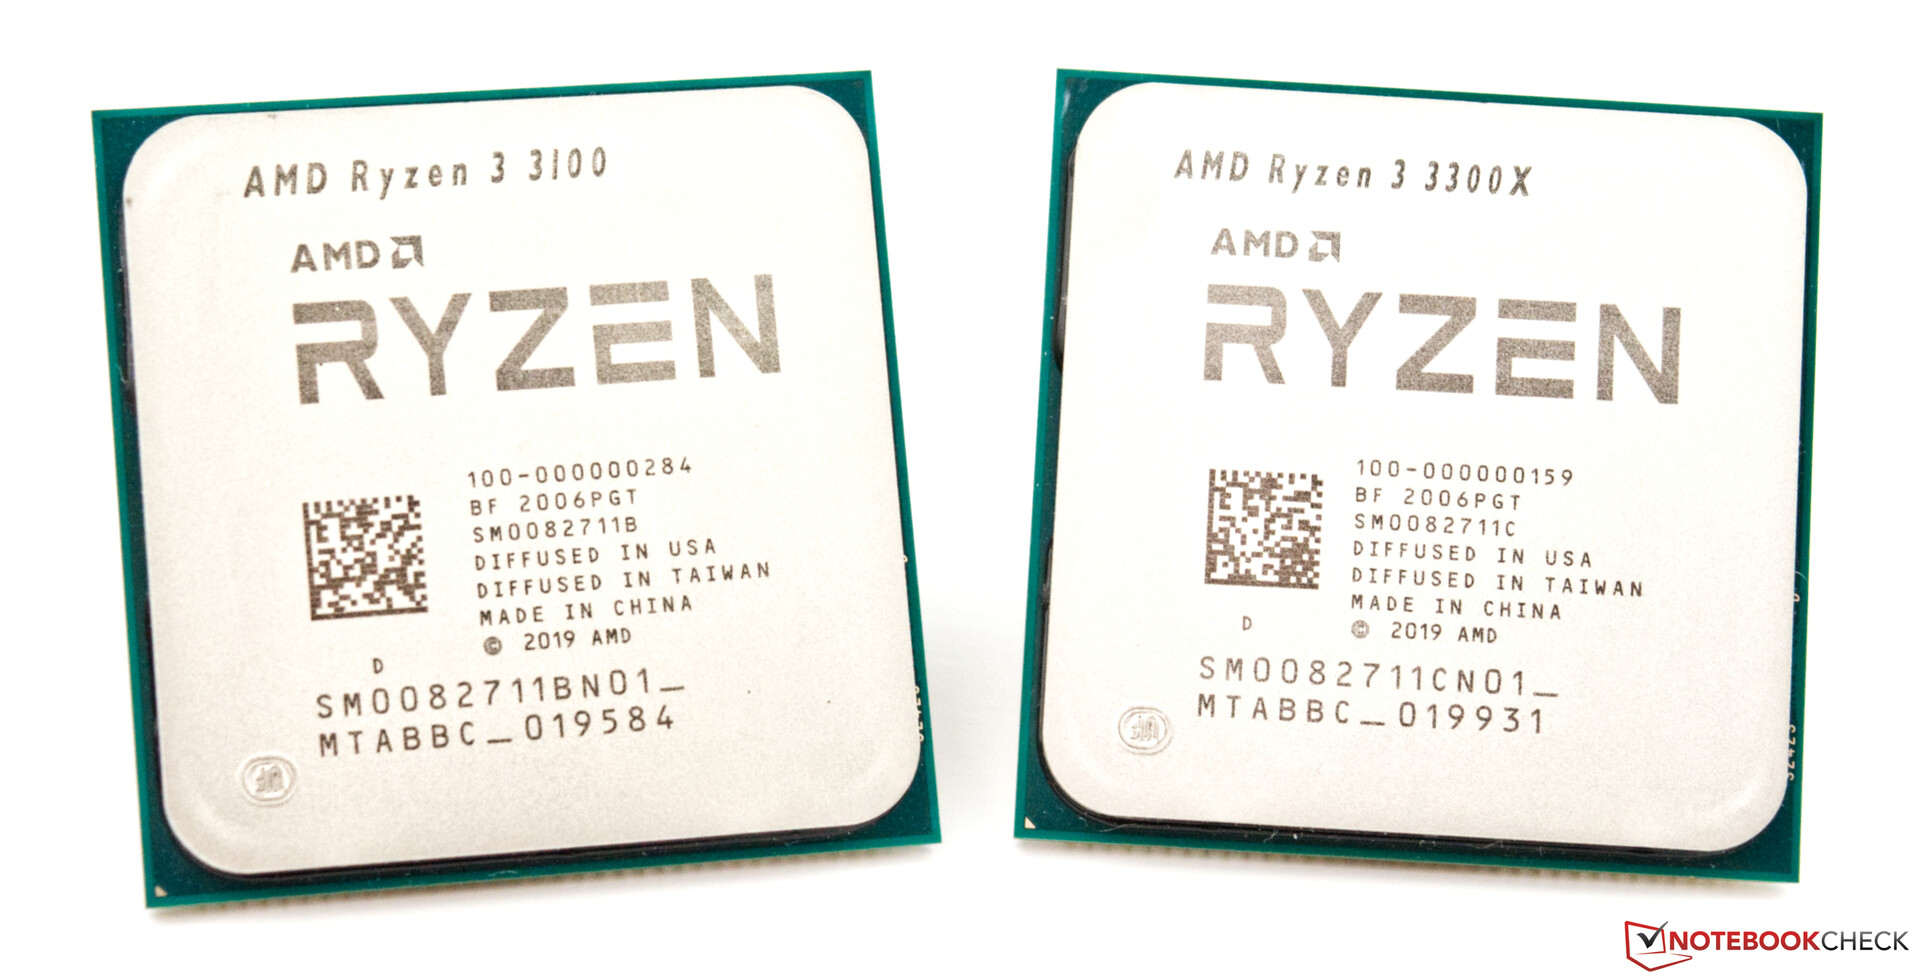
Test des AMD Ryzen 3 3100 et Ryzen 3 3300X avec 4 coeurs et 8 threads
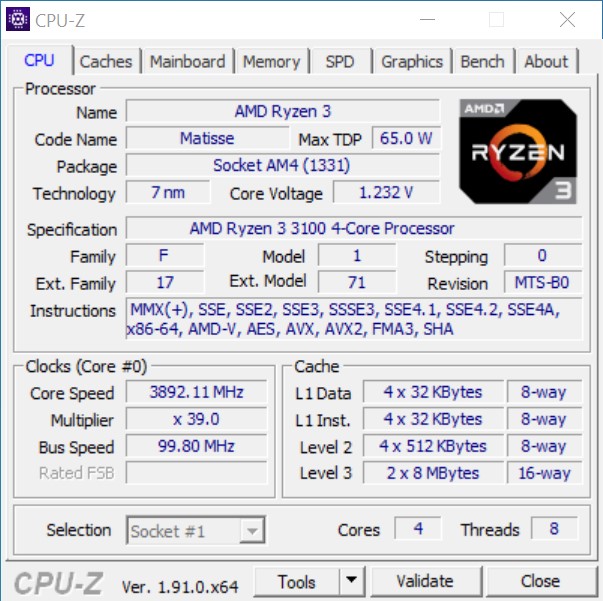
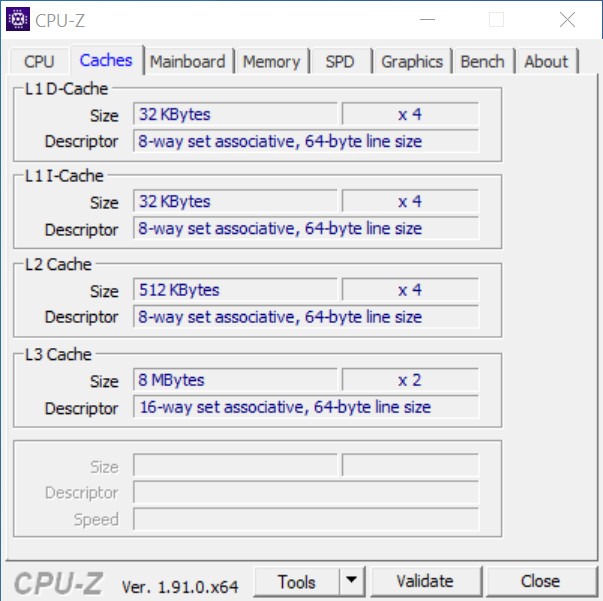
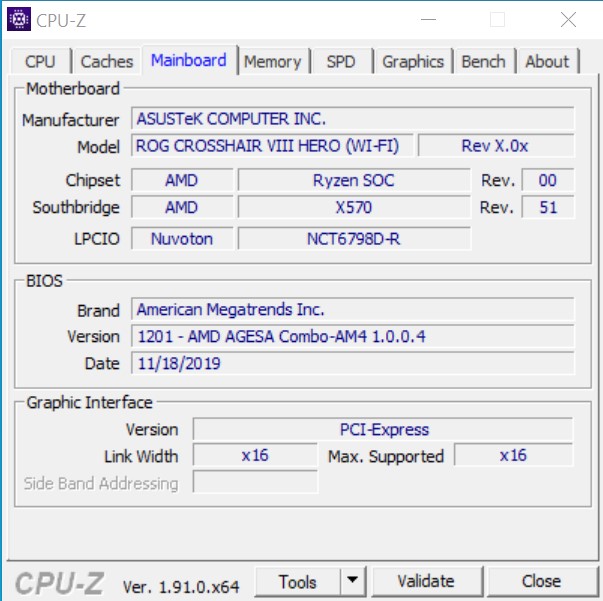
AMD Ryzen 3 3100

AMD Ryzen 3 3300X


| Performance rating - Percent | |
| Moyenne Intel Core i7-7740X | |
| AMD Ryzen 3 3300X | |
| Intel Core i5-9400F | |
| AMD Ryzen 3 3100 | |
| AMD Ryzen 5 1600 | |
| Intel Core i3-9100F | |
| Cinebench R10 | |
| Rendering Single CPUs 64Bit | |
| AMD Ryzen 3 3300X | |
| Moyenne Intel Core i7-7740X (n=1) | |
| AMD Ryzen 3 3100 | |
| Intel Core i3-9100F | |
| Intel Core i5-9400F | |
| AMD Ryzen 5 1600 | |
| Rendering Multiple CPUs 64Bit | |
| AMD Ryzen 5 1600 | |
| AMD Ryzen 3 3300X | |
| Intel Core i5-9400F | |
| Moyenne Intel Core i7-7740X (n=1) | |
| AMD Ryzen 3 3100 | |
| Intel Core i3-9100F | |
| Blender - v2.79 BMW27 CPU | |
| Intel Core i3-9100F | |
| AMD Ryzen 3 3100 | |
| Intel Core i5-9400F | |
| Moyenne Intel Core i7-7740X (n=1) | |
| AMD Ryzen 3 3300X | |
| AMD Ryzen 5 1600 | |
| WinRAR - Result | |
| AMD Ryzen 3 3300X | |
| Moyenne Intel Core i7-7740X (n=1) | |
| Intel Core i5-9400F | |
| AMD Ryzen 3 3100 | |
| AMD Ryzen 5 1600 | |
| Intel Core i3-9100F | |
| Geekbench 4.4 | |
| 64 Bit Single-Core Score | |
| Moyenne Intel Core i7-7740X (n=1) | |
| AMD Ryzen 3 3300X | |
| Intel Core i5-9400F | |
| Intel Core i3-9100F | |
| AMD Ryzen 3 3100 | |
| AMD Ryzen 5 1600 | |
| 64 Bit Multi-Core Score | |
| Intel Core i5-9400F | |
| AMD Ryzen 5 1600 | |
| AMD Ryzen 3 3300X | |
| Moyenne Intel Core i7-7740X (n=1) | |
| AMD Ryzen 3 3100 | |
| Intel Core i3-9100F | |
| 3DMark 11 - 1280x720 Performance Physics | |
| AMD Ryzen 3 3300X | |
| Moyenne Intel Core i7-7740X (12196 - 12488, n=6) | |
| AMD Ryzen 5 1600 | |
| Intel Core i5-9400F | |
| AMD Ryzen 3 3100 | |
| Intel Core i3-9100F | |
| HWBOT x265 Benchmark v2.2 - 4k Preset | |
| Intel Core i5-9400F | |
| Moyenne Intel Core i7-7740X (n=1) | |
| AMD Ryzen 3 3300X | |
| AMD Ryzen 3 3100 | |
| AMD Ryzen 5 1600 | |
| Intel Core i3-9100F | |
| R Benchmark 2.5 - Overall mean | |
| Intel Core i5-9400F | |
| Intel Core i3-9100F | |
| AMD Ryzen 5 1600 | |
| AMD Ryzen 3 3100 | |
| Moyenne Intel Core i7-7740X (n=1) | |
| AMD Ryzen 3 3300X | |
| LibreOffice - 20 Documents To PDF | |
| AMD Ryzen 5 1600 | |
| Intel Core i3-9100F | |
| AMD Ryzen 3 3100 | |
| Intel Core i5-9400F | |
| Moyenne Intel Core i7-7740X (n=1) | |
| AMD Ryzen 3 3300X | |
| WebXPRT 3 - Overall | |
| Moyenne Intel Core i7-7740X (247 - 265, n=2) | |
| AMD Ryzen 3 3300X | |
| Intel Core i5-9400F | |
| AMD Ryzen 3 3100 | |
| Intel Core i3-9100F | |
| AMD Ryzen 5 1600 | |
| Mozilla Kraken 1.1 - Total | |
| AMD Ryzen 5 1600 | |
| Intel Core i5-9400F | |
| Intel Core i3-9100F | |
| AMD Ryzen 3 3100 | |
| Moyenne Intel Core i7-7740X (n=1) | |
| AMD Ryzen 3 3300X | |
| 3DMark | |
| 3840x2160 Fire Strike Ultra Physics | |
| AMD Ryzen 5 1600 | |
| AMD Ryzen 3 3300X | |
| Moyenne Intel Core i7-7740X (n=1) | |
| AMD Ryzen 3 3100 | |
| Intel Core i5-9400F | |
| Intel Core i3-9100F | |
| 1920x1080 Fire Strike Physics | |
| AMD Ryzen 5 1600 | |
| AMD Ryzen 3 3300X | |
| Moyenne Intel Core i7-7740X (13230 - 14523, n=7) | |
| AMD Ryzen 3 3100 | |
| Intel Core i5-9400F | |
| Intel Core i3-9100F | |
| 2560x1440 Time Spy CPU | |
| AMD Ryzen 5 1600 | |
| Intel Core i5-9400F | |
| Moyenne Intel Core i7-7740X (5632 - 5792, n=7) | |
| AMD Ryzen 3 3300X | |
| AMD Ryzen 3 3100 | |
| Intel Core i3-9100F | |
* ... Moindre est la valeur, meilleures sont les performances
| PCMark 10 - Score | |
| AMD Ryzen 3 3300X | |
| Intel Core i5-9400F | |
| AMD Ryzen 3 3100 | |
| Intel Core i3-9100F | |
| AMD Ryzen 5 1600 | |
| PCMark 8 | |
| Work Score Accelerated v2 | |
| AMD Ryzen 3 3300X | |
| Intel Core i3-9100F | |
| Intel Core i5-9400F | |
| AMD Ryzen 3 3100 | |
| AMD Ryzen 5 1600 | |
| Creative Score Accelerated v2 | |
| AMD Ryzen 3 3300X | |
| Intel Core i5-9400F | |
| AMD Ryzen 3 3100 | |
| Intel Core i3-9100F | |
| AMD Ryzen 5 1600 | |
| Home Score Accelerated v2 | |
| AMD Ryzen 3 3300X | |
| Intel Core i5-9400F | |
| Intel Core i3-9100F | |
| AMD Ryzen 3 3100 | |
| AMD Ryzen 5 1600 | |
| Performance rating - Percent | |
| AMD Ryzen 3 3300X | |
| Intel Core i5-9400F | |
| AMD Ryzen 5 1600 | |
| AMD Ryzen 3 3100 | |
| Intel Core i3-9100F | |
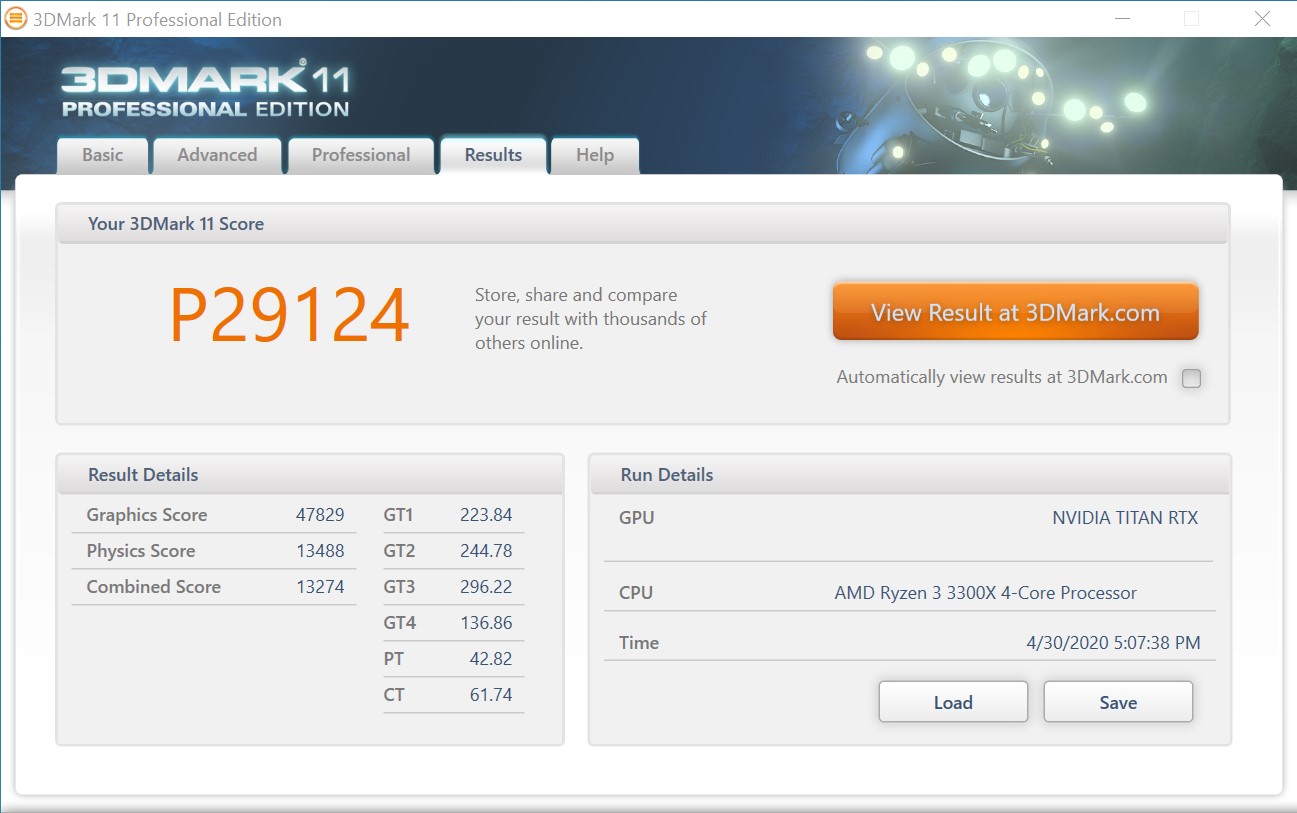
| 3DMark 11 | |
| 1280x720 Performance | |
| AMD Ryzen 3 3300X | |
| Intel Core i5-9400F | |
| AMD Ryzen 5 1600 | |
| AMD Ryzen 3 3100 | |
| Intel Core i3-9100F | |
| 1280x720 Performance GPU | |
| Intel Core i3-9100F | |
| Intel Core i5-9400F | |
| AMD Ryzen 3 3300X | |
| AMD Ryzen 5 1600 | |
| AMD Ryzen 3 3100 | |
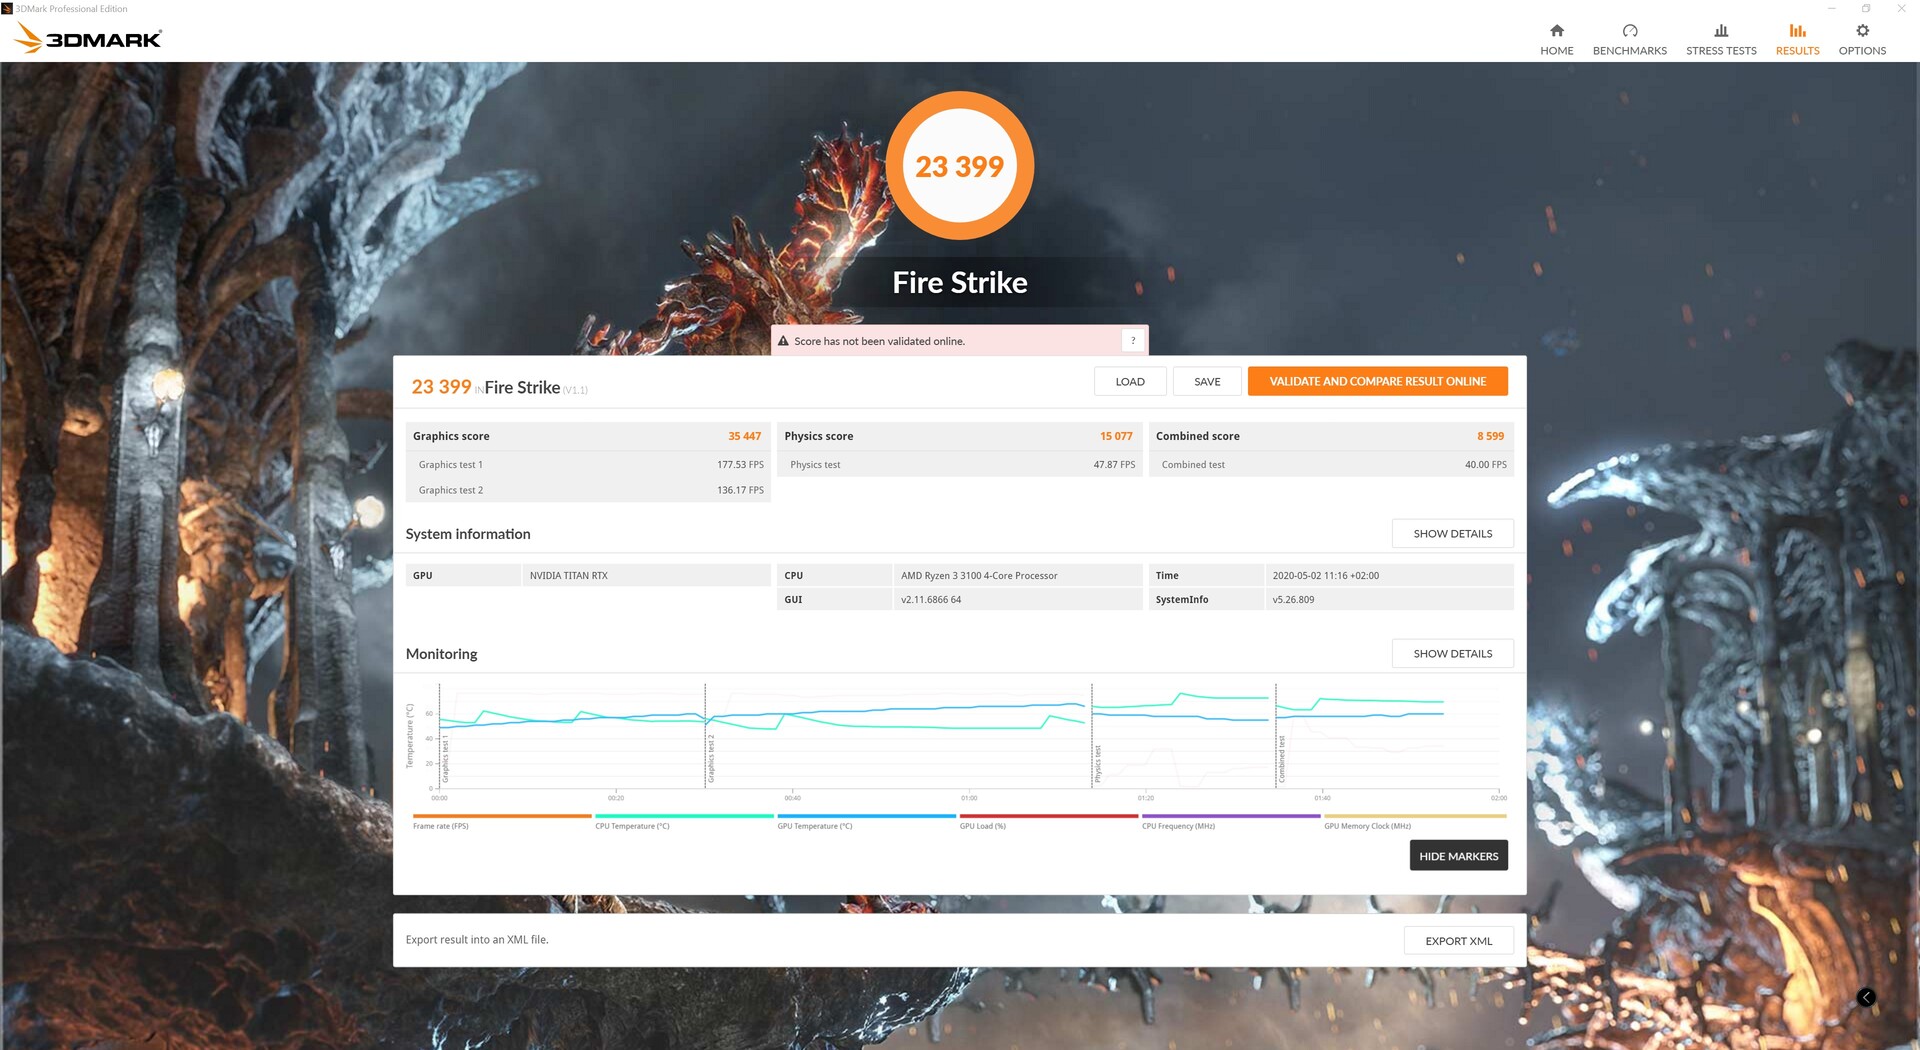
| 3DMark | |
| 1920x1080 Fire Strike Score | |
| AMD Ryzen 3 3300X | |
| Intel Core i5-9400F | |
| AMD Ryzen 5 1600 | |
| AMD Ryzen 3 3100 | |
| Intel Core i3-9100F | |
| 1920x1080 Fire Strike Graphics | |
| Intel Core i3-9100F | |
| Intel Core i5-9400F | |
| AMD Ryzen 3 3100 | |
| AMD Ryzen 3 3300X | |
| AMD Ryzen 5 1600 | |
| 3840x2160 Fire Strike Ultra Score | |
| AMD Ryzen 3 3300X | |
| Intel Core i5-9400F | |
| AMD Ryzen 5 1600 | |
| AMD Ryzen 3 3100 | |
| Intel Core i3-9100F | |
| 2560x1440 Time Spy Graphics | |
| Intel Core i5-9400F | |
| AMD Ryzen 3 3300X | |
| Intel Core i3-9100F | |
| AMD Ryzen 5 1600 | |
| AMD Ryzen 3 3100 | |
| 2560x1440 Time Spy Score | |
| Intel Core i5-9400F | |
| AMD Ryzen 5 1600 | |
| AMD Ryzen 3 3300X | |
| AMD Ryzen 3 3100 | |
| Intel Core i3-9100F | |
| Performance rating - Percent | |
| Intel Core i5 9400F | |
| AMD Ryzen 3 3300X | |
| Intel Core i3 9100F | |
| AMD Ryzen 3 3100 | |
| AMD Ryzen 5 1600 (12nm) | |
| Borderlands 3 | |
| 1280x720 Very Low Overall Quality (DX11) | |
| Intel Core i5 9400F | |
| AMD Ryzen 3 3300X | |
| Intel Core i3 9100F | |
| AMD Ryzen 3 3100 | |
| AMD Ryzen 5 1600 (12nm) | |
| 1920x1080 Badass Overall Quality (DX11) | |
| Intel Core i5 9400F | |
| AMD Ryzen 3 3300X | |
| Intel Core i3 9100F | |
| AMD Ryzen 3 3100 | |
| AMD Ryzen 5 1600 (12nm) | |
| Metro Exodus | |
| 1280x720 Low Quality AF:4x | |
| Intel Core i5 9400F | |
| AMD Ryzen 3 3300X | |
| AMD Ryzen 3 3100 | |
| AMD Ryzen 5 1600 (12nm) | |
| Intel Core i3 9100F | |
| 1920x1080 Ultra Quality AF:16x | |
| Intel Core i5 9400F | |
| AMD Ryzen 3 3300X | |
| AMD Ryzen 3 3100 | |
| AMD Ryzen 5 1600 (12nm) | |
| Intel Core i3 9100F | |
| Far Cry New Dawn | |
| 1280x720 Low Preset | |
| Intel Core i5 9400F | |
| AMD Ryzen 3 3300X | |
| Intel Core i3 9100F | |
| AMD Ryzen 5 1600 (12nm) | |
| AMD Ryzen 3 3100 | |
| 1920x1080 Ultra Preset | |
| Intel Core i5 9400F | |
| Intel Core i3 9100F | |
| AMD Ryzen 3 3300X | |
| AMD Ryzen 3 3100 | |
| AMD Ryzen 5 1600 (12nm) | |
| Forza Horizon 4 | |
| 1280x720 Very Low Preset | |
| Intel Core i5 9400F | |
| AMD Ryzen 3 3300X | |
| Intel Core i3 9100F | |
| AMD Ryzen 3 3100 | |
| AMD Ryzen 5 1600 (12nm) | |
| 1920x1080 Ultra Preset AA:2xMS | |
| Intel Core i5 9400F | |
| AMD Ryzen 3 3300X | |
| Intel Core i3 9100F | |
| AMD Ryzen 3 3100 | |
| AMD Ryzen 5 1600 (12nm) | |
| Shadow of the Tomb Raider | |
| 1280x720 Lowest Preset | |
| Intel Core i5 9400F | |
| AMD Ryzen 3 3300X | |
| Intel Core i3 9100F | |
| AMD Ryzen 3 3100 | |
| AMD Ryzen 5 1600 (12nm) | |
| 1920x1080 Highest Preset AA:T | |
| Intel Core i5 9400F | |
| AMD Ryzen 3 3300X | |
| AMD Ryzen 3 3100 | |
| AMD Ryzen 5 1600 (12nm) | |
| Intel Core i3 9100F | |
| Far Cry 5 | |
| 1280x720 Low Preset AA:T | |
| AMD Ryzen 3 3300X | |
| Intel Core i5 9400F | |
| AMD Ryzen 3 3100 | |
| AMD Ryzen 5 1600 (12nm) | |
| Intel Core i3 9100F | |
| 1920x1080 Ultra Preset AA:T | |
| Intel Core i5 9400F | |
| AMD Ryzen 3 3300X | |
| AMD Ryzen 3 3100 | |
| AMD Ryzen 5 1600 (12nm) | |
| Intel Core i3 9100F | |
| X-Plane 11.11 | |
| 1280x720 low (fps_test=1) | |
| Intel Core i5 9400F | |
| AMD Ryzen 3 3300X | |
| Intel Core i3 9100F | |
| AMD Ryzen 3 3100 | |
| AMD Ryzen 5 1600 (12nm) | |
| 1920x1080 high (fps_test=3) | |
| Intel Core i5 9400F | |
| AMD Ryzen 3 3300X | |
| Intel Core i3 9100F | |
| AMD Ryzen 3 3100 | |
| AMD Ryzen 5 1600 (12nm) | |
| Final Fantasy XV Benchmark | |
| 1280x720 Lite Quality | |
| Intel Core i5 9400F | |
| AMD Ryzen 3 3300X | |
| AMD Ryzen 3 3100 | |
| AMD Ryzen 5 1600 (12nm) | |
| Intel Core i3 9100F | |
| 1920x1080 High Quality | |
| Intel Core i5 9400F | |
| AMD Ryzen 3 3300X | |
| AMD Ryzen 5 1600 (12nm) | |
| AMD Ryzen 3 3100 | |
| Intel Core i3 9100F | |
| Dota 2 Reborn | |
| 1280x720 min (0/3) fastest | |
| Intel Core i5 9400F | |
| Intel Core i3 9100F | |
| AMD Ryzen 3 3300X | |
| AMD Ryzen 5 1600 (12nm) | |
| AMD Ryzen 3 3100 | |
| 1920x1080 ultra (3/3) best looking | |
| Intel Core i5 9400F | |
| Intel Core i3 9100F | |
| AMD Ryzen 3 3300X | |
| AMD Ryzen 5 1600 (12nm) | |
| AMD Ryzen 3 3100 | |
| The Witcher 3 | |
| 1024x768 Low Graphics & Postprocessing | |
| Intel Core i5 9400F | |
| AMD Ryzen 3 3300X | |
| AMD Ryzen 5 1600 (12nm) | |
| AMD Ryzen 3 3100 | |
| Intel Core i3 9100F | |
| 1920x1080 Ultra Graphics & Postprocessing (HBAO+) | |
| Intel Core i5 9400F | |
| AMD Ryzen 5 1600 (12nm) | |
| AMD Ryzen 3 3300X | |
| Intel Core i3 9100F | |
| AMD Ryzen 3 3100 | |
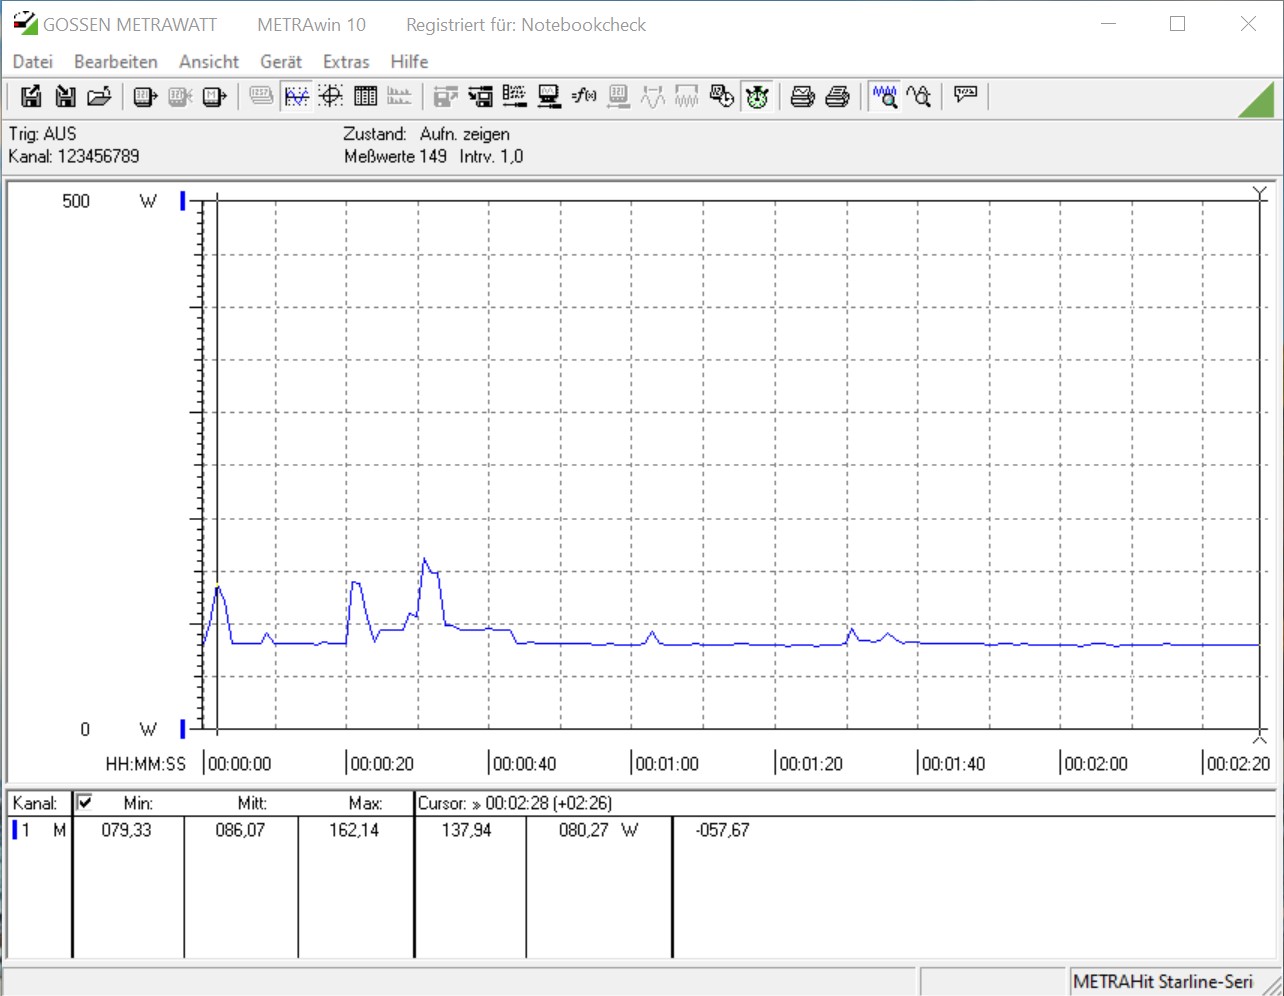
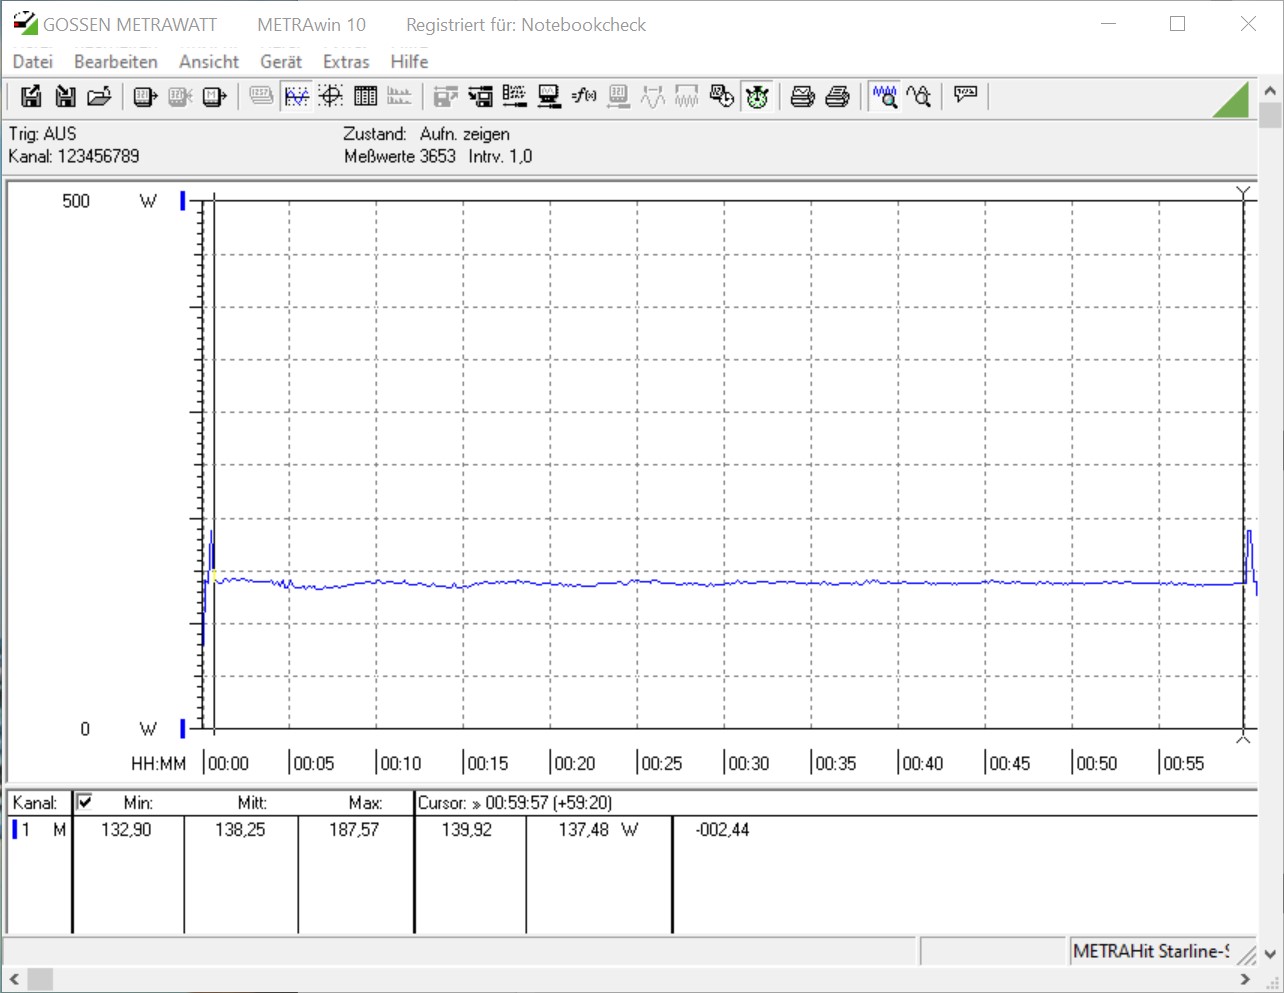
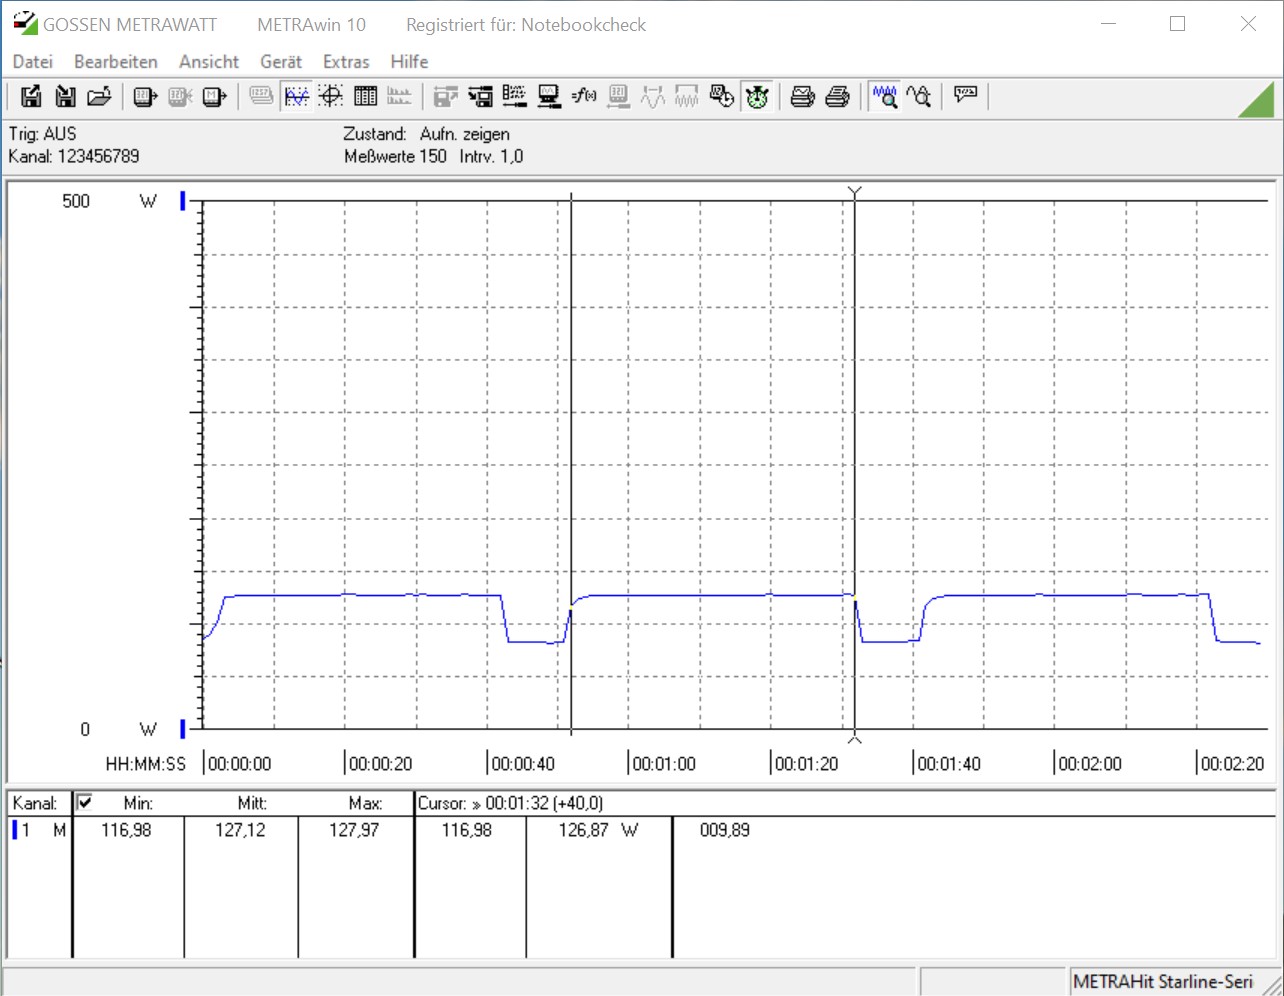
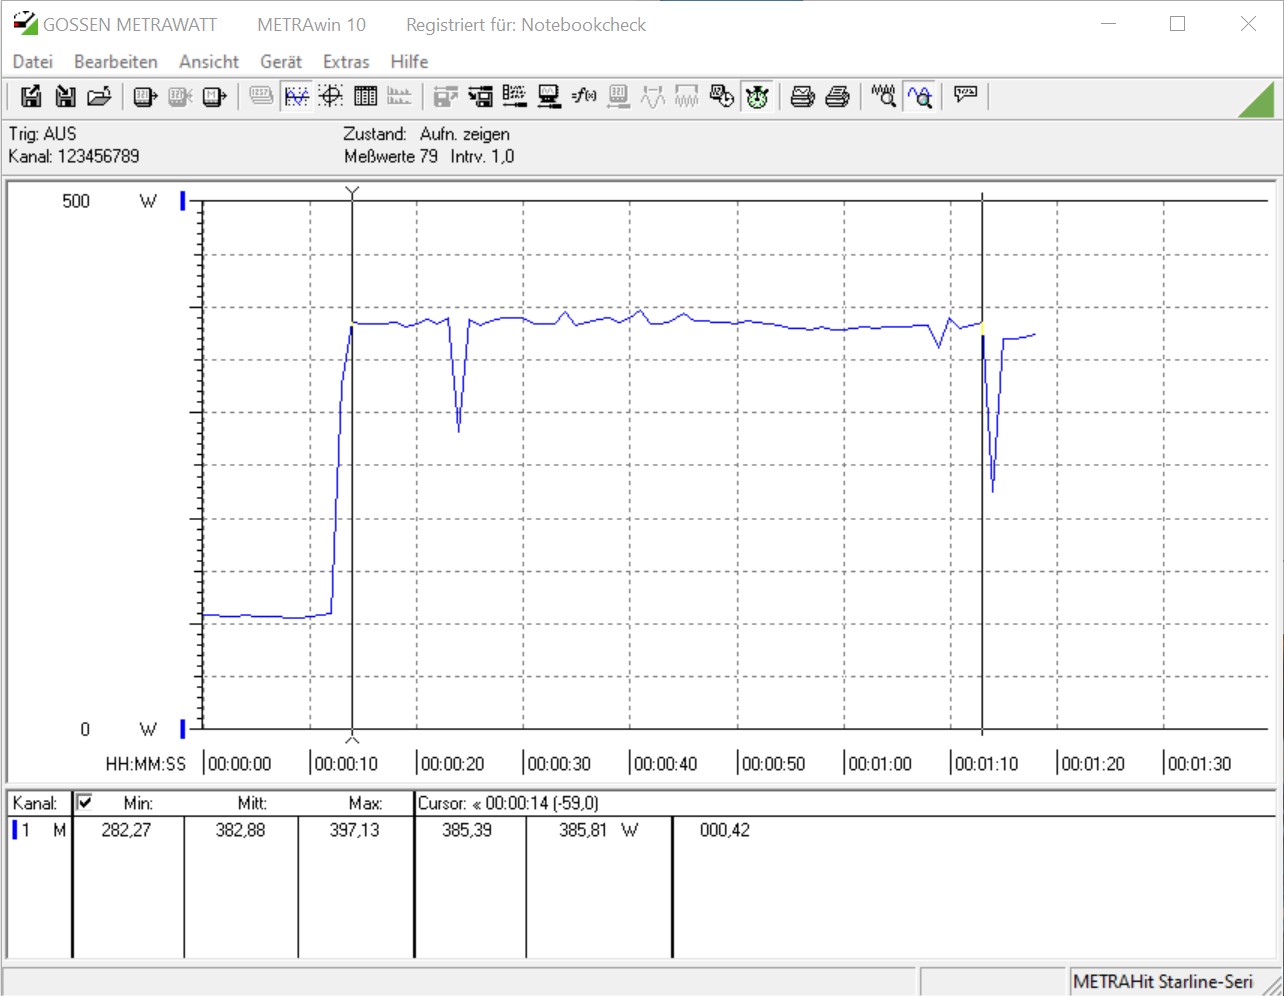
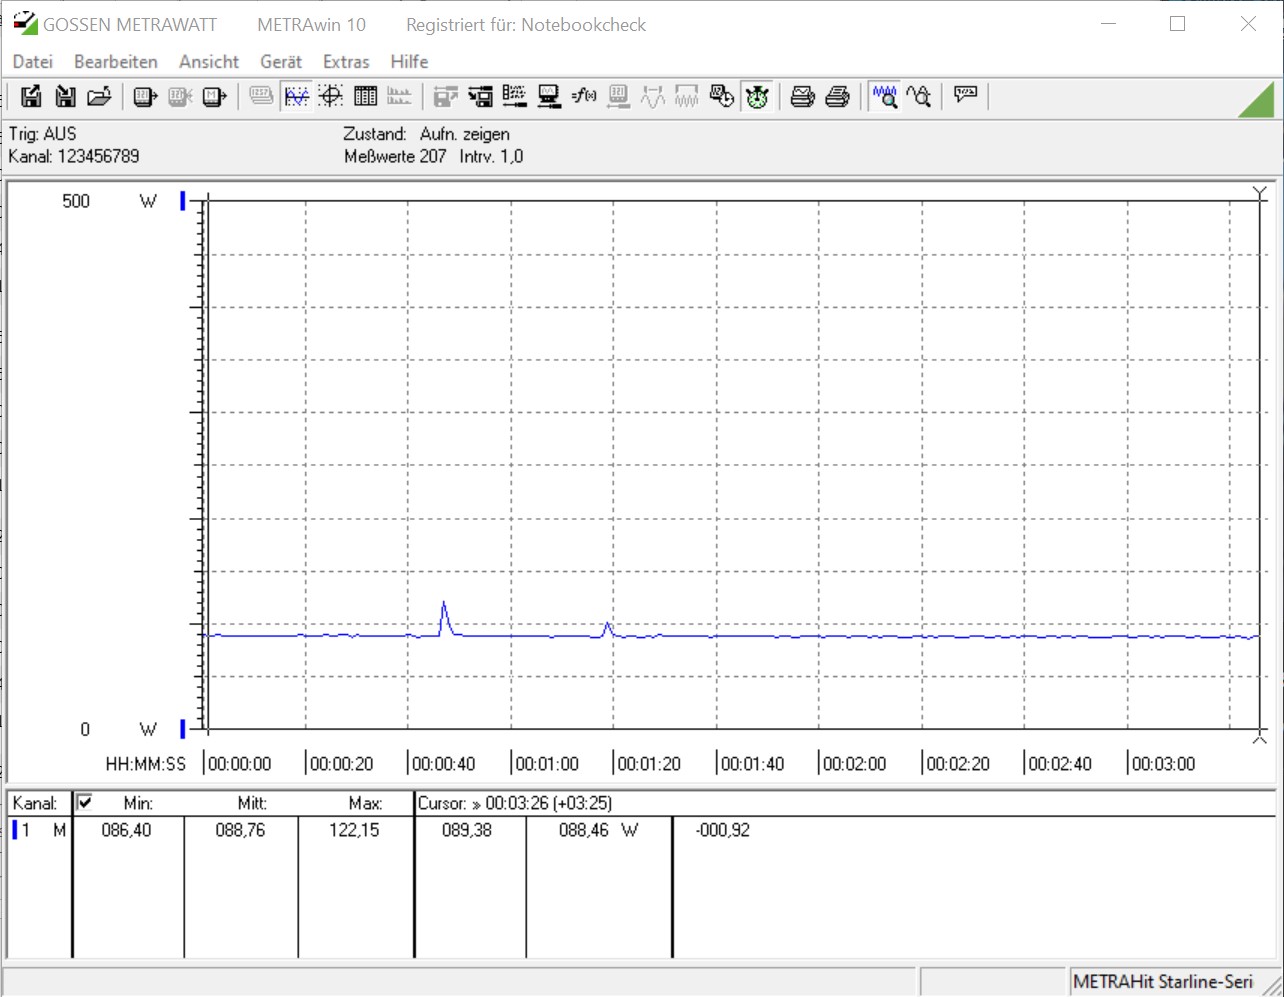
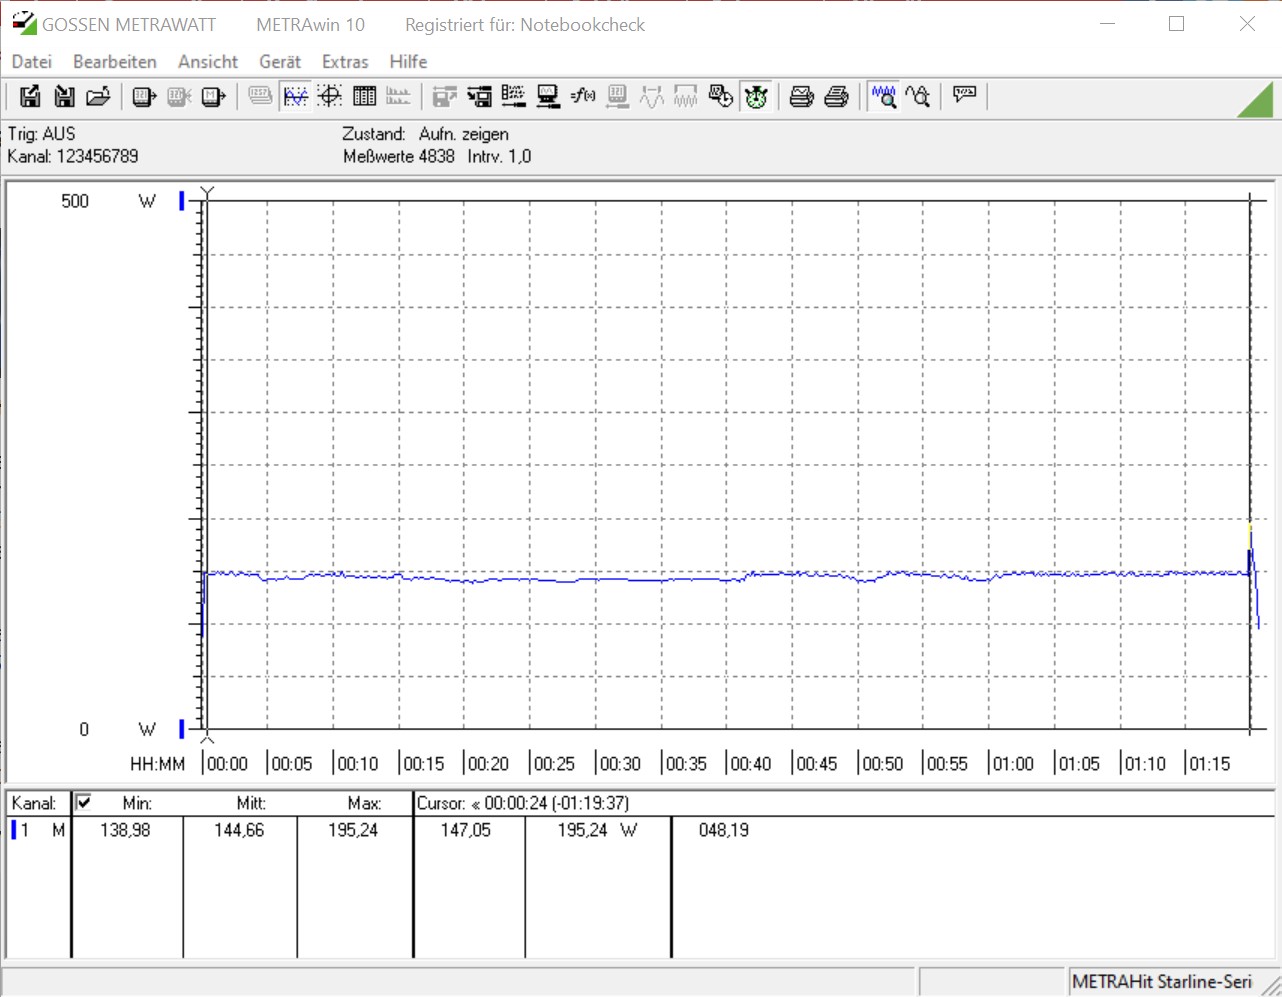
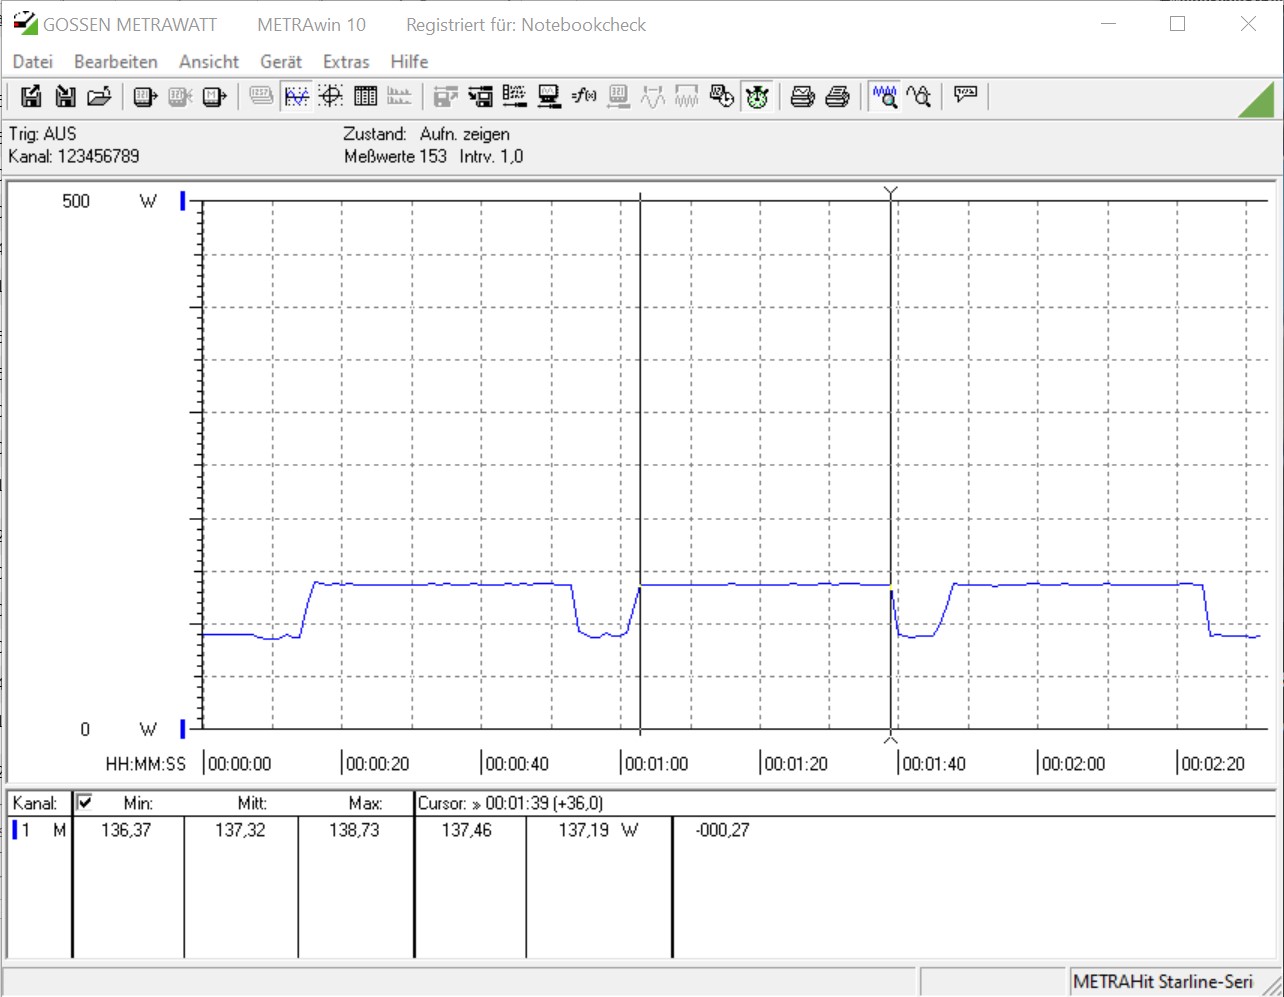
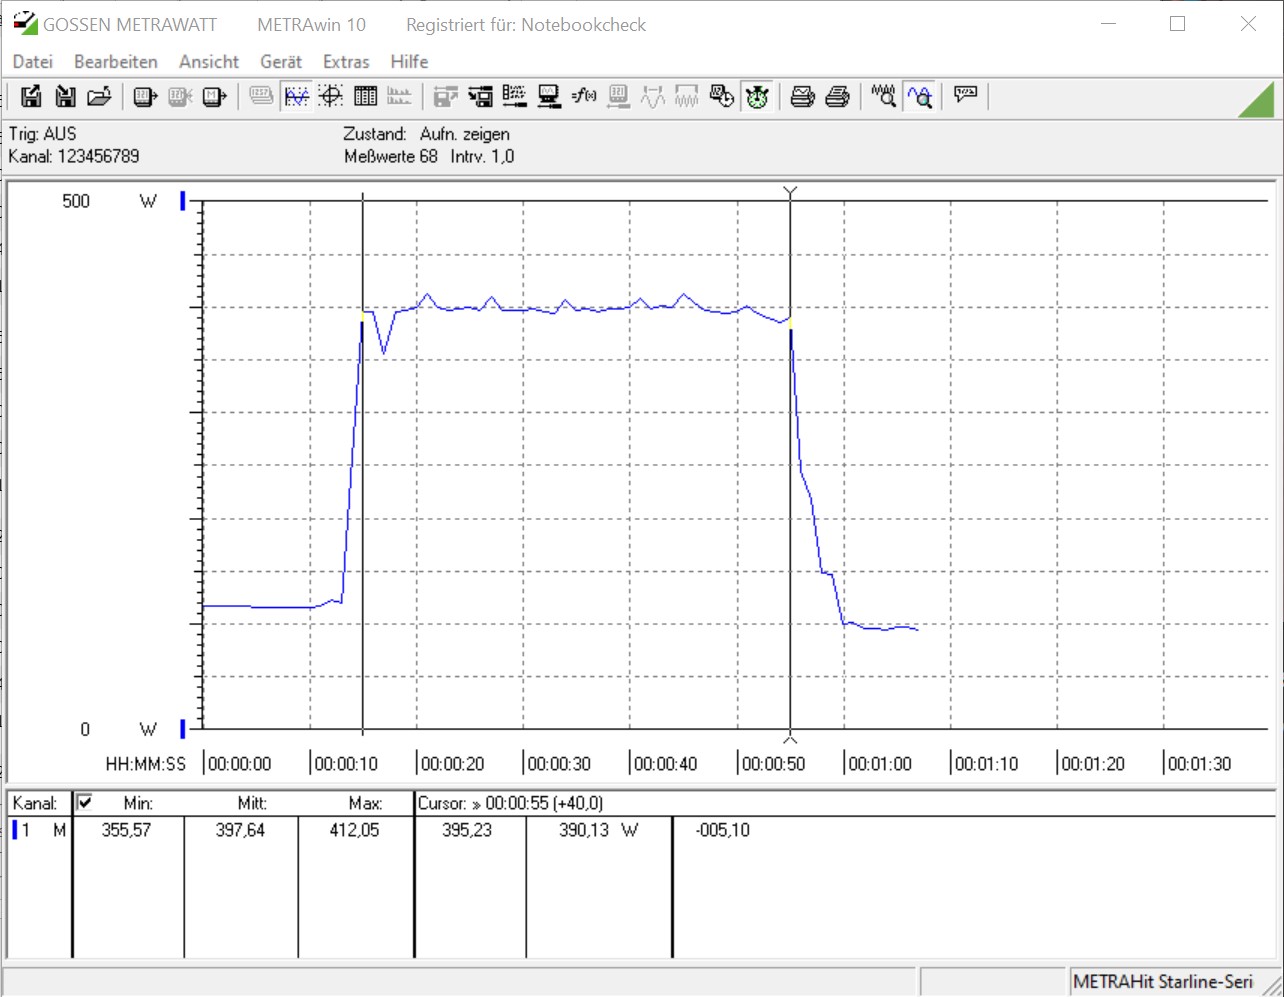
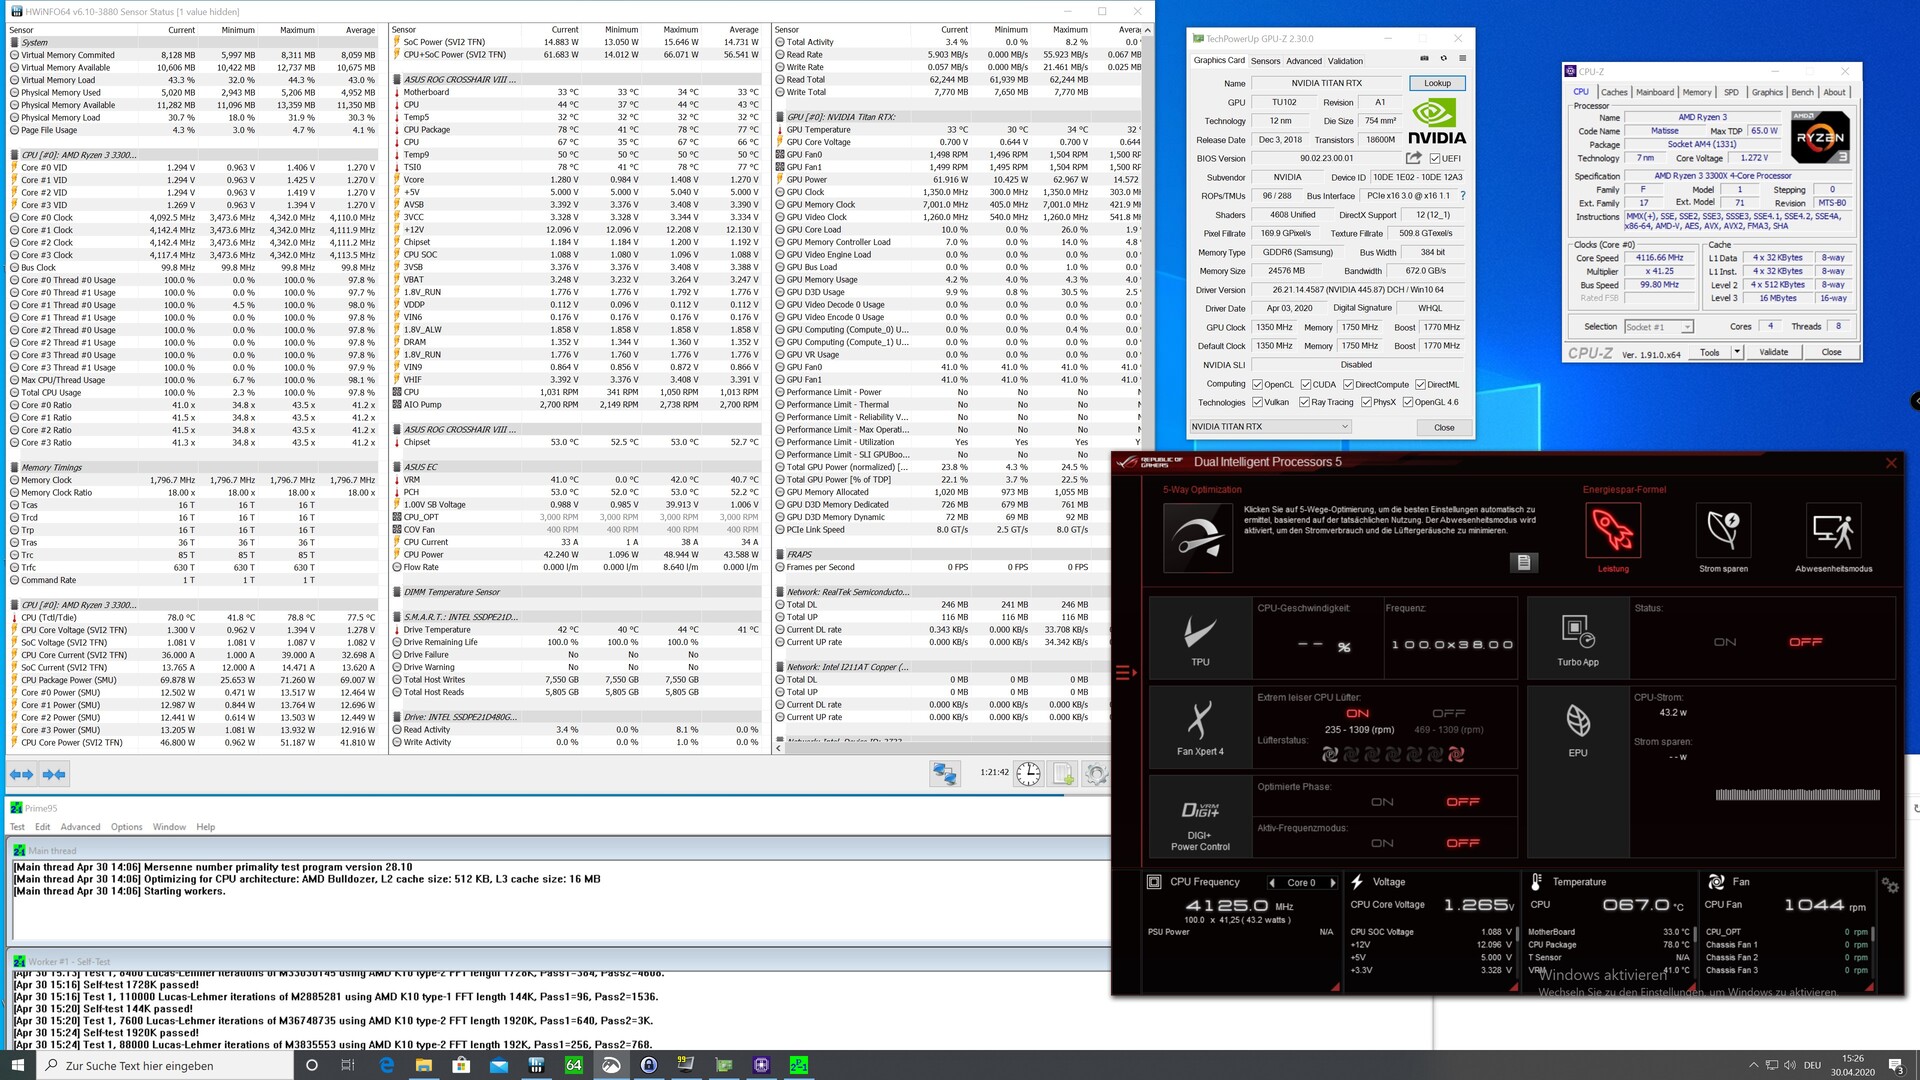
| Power Consumption | |
| 1920x1080 The Witcher 3 ultra (external Monitor) | |
| AMD Ryzen 5 1600 (12nm) (Idle: 85.9 W) | |
| AMD Ryzen 3 3300X (Idle: 88.8 W) | |
| AMD Ryzen 3 3100 (Idle: 86 W) | |
| Intel Core i5 9400F (Idle: 57 W) | |
| Intel Core i3 9100F (Idle: 56 W) | |
| Prime95 V2810 Stress (external Monitor) | |
| AMD Ryzen 5 1600 (12nm) (Idle: 85.9 W) | |
| AMD Ryzen 3 3300X (Idle: 88.8 W) | |
| Intel Core i3 9100F (Idle: 56 W) | |
| AMD Ryzen 3 3100 (Idle: 86 W) | |
| Intel Core i5 9400F (Idle: 57 W) | |
| Cinebench R15 Multi (external Monitor) | |
| AMD Ryzen 5 1600 (12nm) (Idle: 85.9 W) | |
| AMD Ryzen 3 3300X (Idle: 88.8 W) | |
| AMD Ryzen 3 3100 (Idle: 86 W) | |
| Intel Core i5 9400F (Idle: 57 W) | |
| Intel Core i3 9100F (Idle: 56 W) | |
| Temperatures - CPU Temperature Prime95 | |
| AMD Ryzen 3 3300X | |
| Intel Core i3 9100F | |
| AMD Ryzen 3 3100 | |
| AMD Ryzen 5 1600 (12nm) | |
| Intel Core i5 9400F | |
* ... Moindre est la valeur, meilleures sont les performances
| Performance rating - Percent | |
| AMD Ryzen 3 3300X @ 4.4 GHz | |
| AMD Ryzen 3 3300X | |
| AMD Ryzen 3 3100 @ 4.4 GHz | |
| AMD Ryzen 5 1600 (12nm) | |
| Intel Core i5 9400F | |
| AMD Ryzen 3 3100 | |
| Intel Core i3 9100F | |
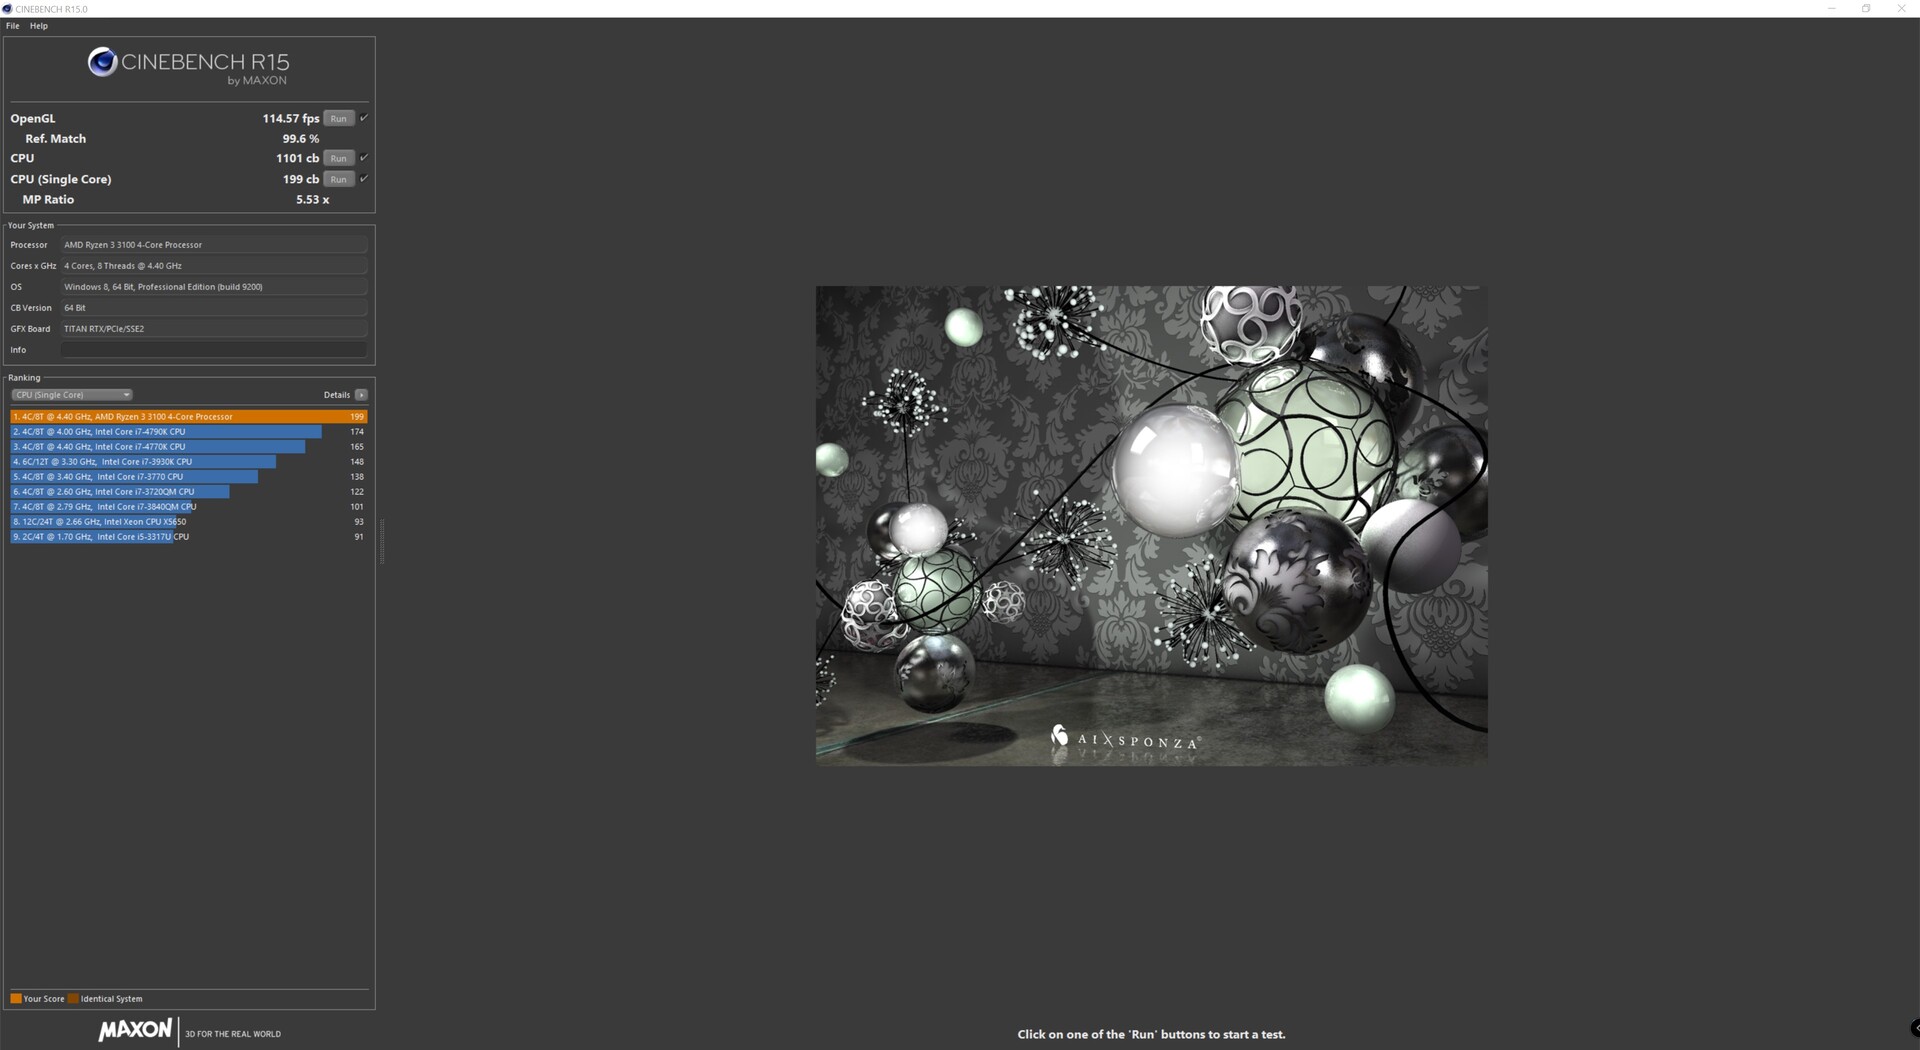
| Cinebench R15 | |
| CPU Single 64Bit | |
| AMD Ryzen 3 3300X @ 4.4 GHz | |
| AMD Ryzen 3 3100 @ 4.4 GHz | |
| AMD Ryzen 3 3300X | |
| AMD Ryzen 3 3100 | |
| Intel Core i5 9400F | |
| Intel Core i3 9100F | |
| AMD Ryzen 5 1600 (12nm) | |
| CPU Multi 64Bit | |
| AMD Ryzen 5 1600 (12nm) | |
| AMD Ryzen 3 3300X @ 4.4 GHz | |
| AMD Ryzen 3 3100 @ 4.4 GHz | |
| AMD Ryzen 3 3300X | |
| AMD Ryzen 3 3100 | |
| Intel Core i5 9400F | |
| Intel Core i3 9100F | |
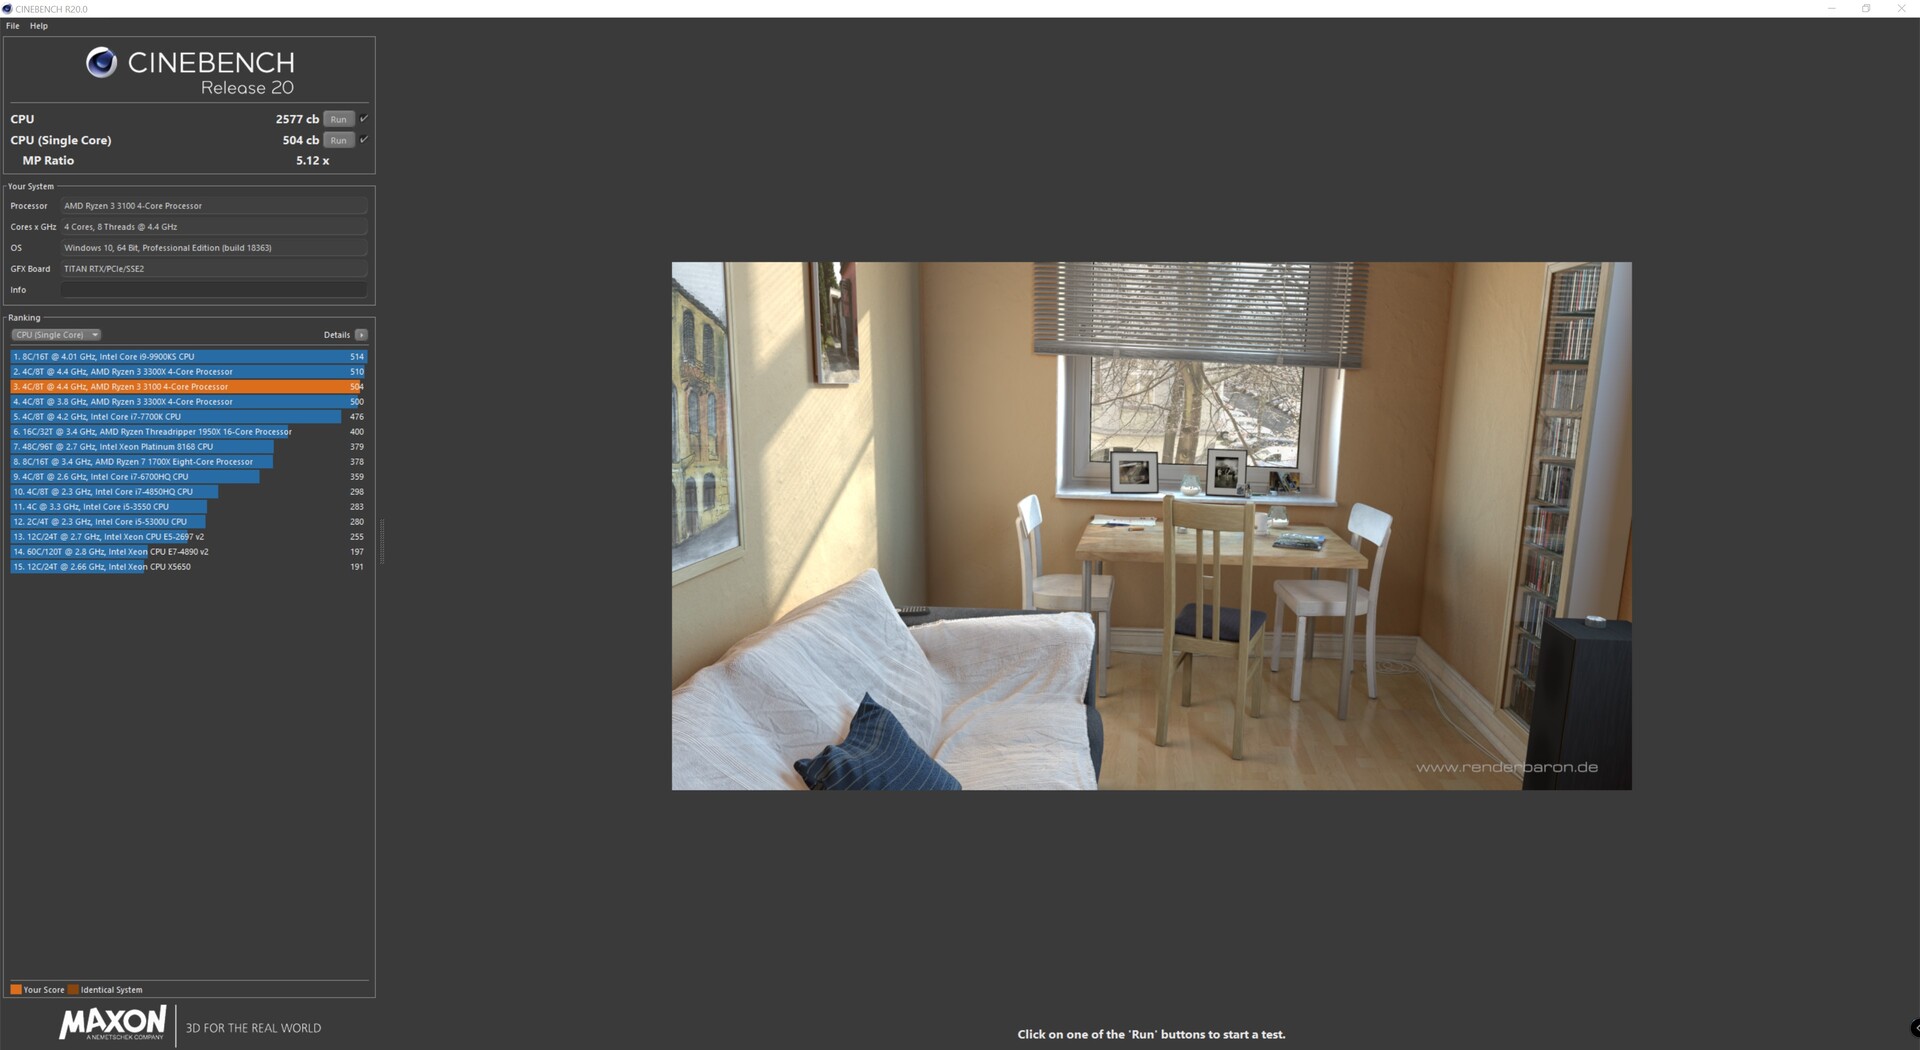
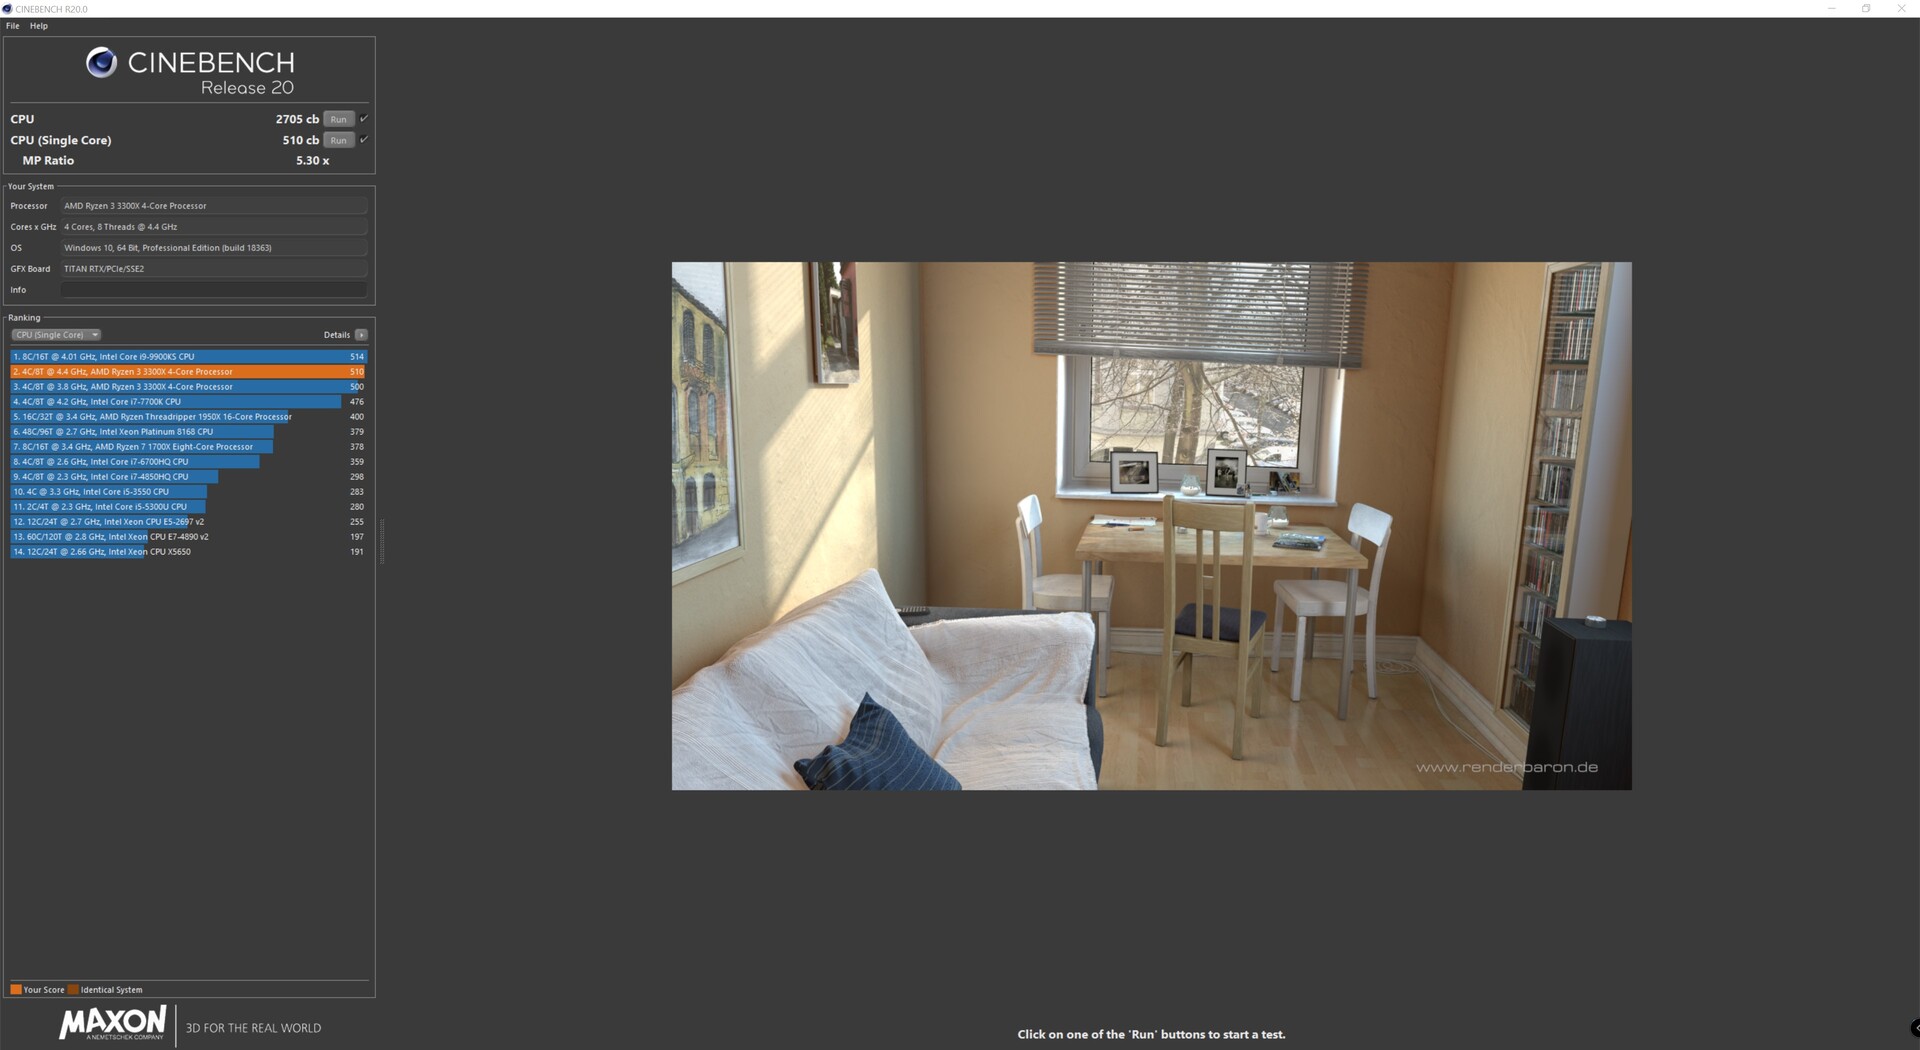
| Cinebench R20 | |
| CPU (Single Core) | |
| AMD Ryzen 3 3300X @ 4.4 GHz | |
| AMD Ryzen 3 3100 @ 4.4 GHz | |
| AMD Ryzen 3 3300X | |
| AMD Ryzen 3 3100 | |
| Intel Core i5 9400F | |
| Intel Core i3 9100F | |
| AMD Ryzen 5 1600 (12nm) | |
| CPU (Multi Core) | |
| AMD Ryzen 3 3300X @ 4.4 GHz | |
| AMD Ryzen 5 1600 (12nm) | |
| AMD Ryzen 3 3100 @ 4.4 GHz | |
| AMD Ryzen 3 3300X | |
| Intel Core i5 9400F | |
| AMD Ryzen 3 3100 | |
| Intel Core i3 9100F | |
| 3DMark 11 | |
| 1280x720 Performance | |
| AMD Ryzen 3 3300X @ 4.4 GHz | |
| AMD Ryzen 3 3300X | |
| AMD Ryzen 3 3100 @ 4.4 GHz | |
| Intel Core i5 9400F | |
| AMD Ryzen 5 1600 (12nm) | |
| AMD Ryzen 3 3100 | |
| Intel Core i3 9100F | |
| 1280x720 Performance GPU | |
| Intel Core i3 9100F | |
| Intel Core i5 9400F | |
| AMD Ryzen 3 3300X | |
| AMD Ryzen 3 3100 @ 4.4 GHz | |
| AMD Ryzen 3 3300X @ 4.4 GHz | |
| AMD Ryzen 5 1600 (12nm) | |
| AMD Ryzen 3 3100 | |
| 1280x720 Performance Physics | |
| AMD Ryzen 3 3300X @ 4.4 GHz | |
| AMD Ryzen 3 3300X | |
| AMD Ryzen 5 1600 (12nm) | |
| AMD Ryzen 3 3100 @ 4.4 GHz | |
| Intel Core i5 9400F | |
| AMD Ryzen 3 3100 | |
| Intel Core i3 9100F | |
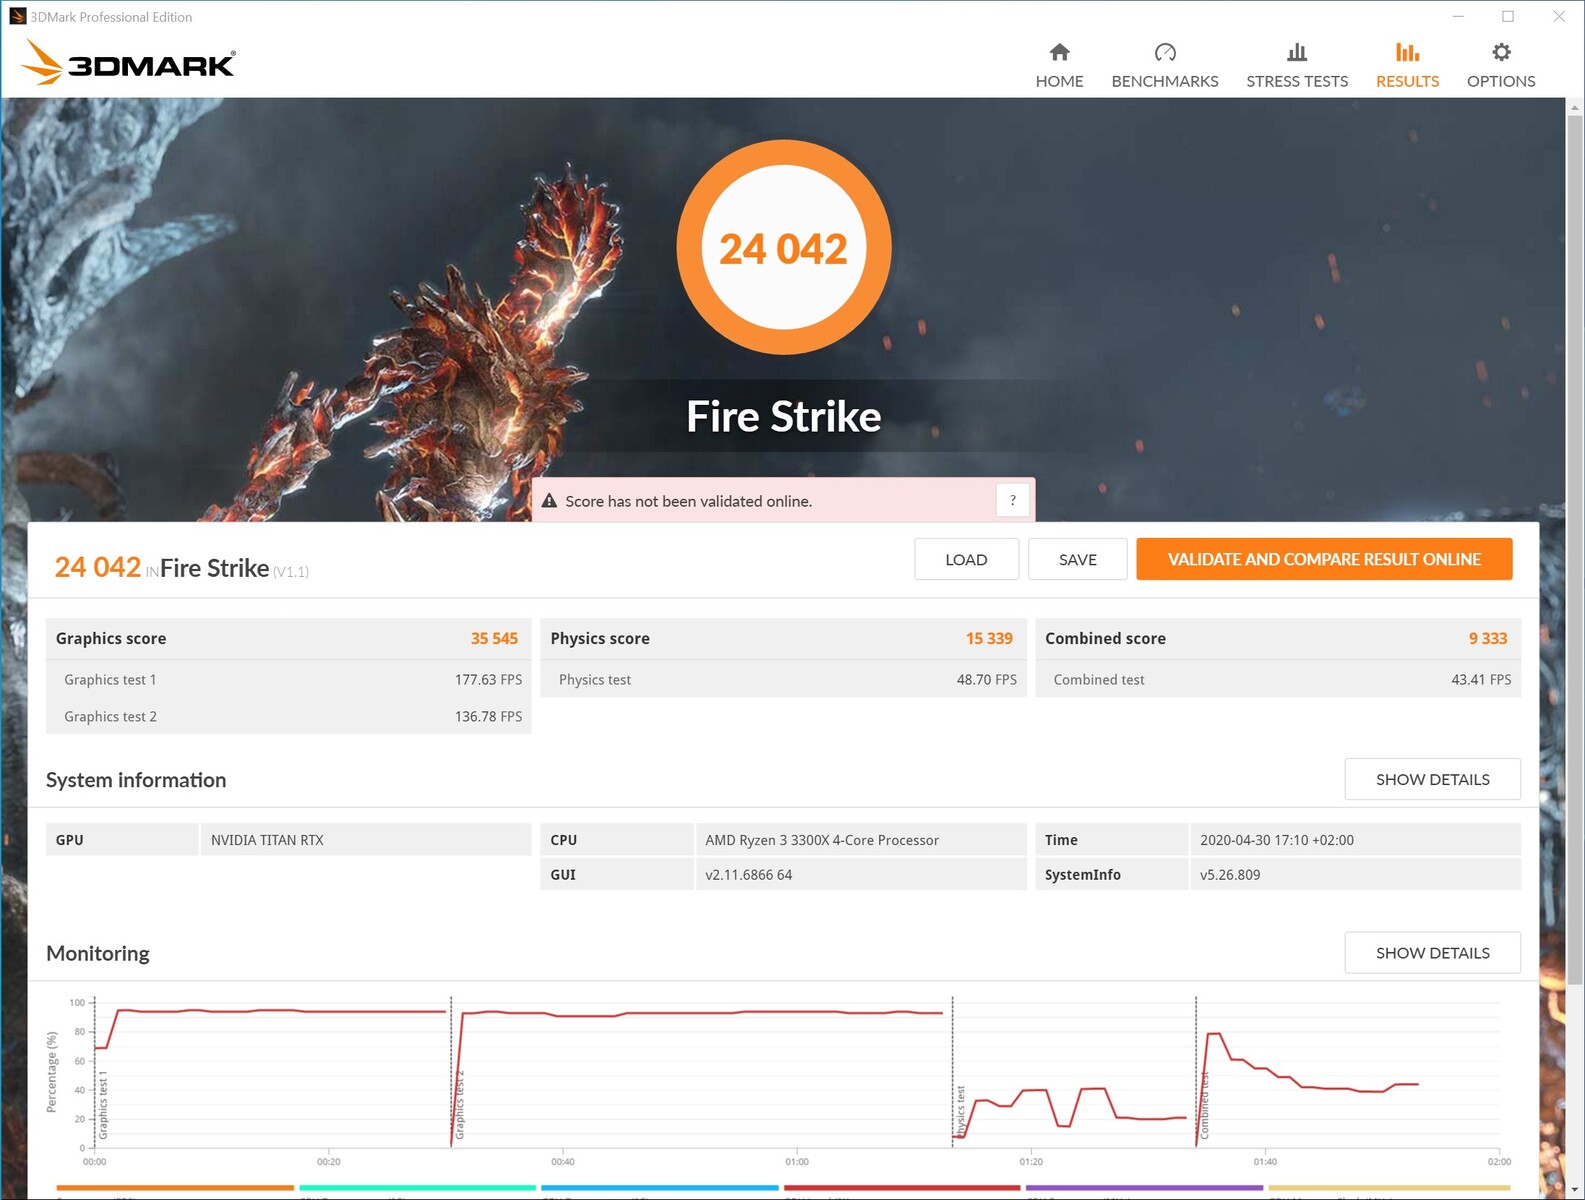
| 3DMark | |
| 1920x1080 Fire Strike Score | |
| AMD Ryzen 3 3300X @ 4.4 GHz | |
| AMD Ryzen 3 3300X | |
| AMD Ryzen 3 3100 @ 4.4 GHz | |
| Intel Core i5 9400F | |
| AMD Ryzen 5 1600 (12nm) | |
| AMD Ryzen 3 3100 | |
| Intel Core i3 9100F | |
| 1920x1080 Fire Strike Graphics | |
| Intel Core i3 9100F | |
| Intel Core i5 9400F | |
| AMD Ryzen 3 3100 | |
| AMD Ryzen 3 3300X @ 4.4 GHz | |
| AMD Ryzen 3 3100 @ 4.4 GHz | |
| AMD Ryzen 3 3300X | |
| AMD Ryzen 5 1600 (12nm) | |
| 1920x1080 Fire Strike Physics | |
| AMD Ryzen 5 1600 (12nm) | |
| AMD Ryzen 3 3300X @ 4.4 GHz | |
| AMD Ryzen 3 3100 @ 4.4 GHz | |
| AMD Ryzen 3 3300X | |
| AMD Ryzen 3 3100 | |
| Intel Core i5 9400F | |
| Intel Core i3 9100F | |
Ryzen 3 3100 @ 4.4 GHz

Ryzen 3 3300X @ 4.4 GHz

Points positifs
Points négatifs
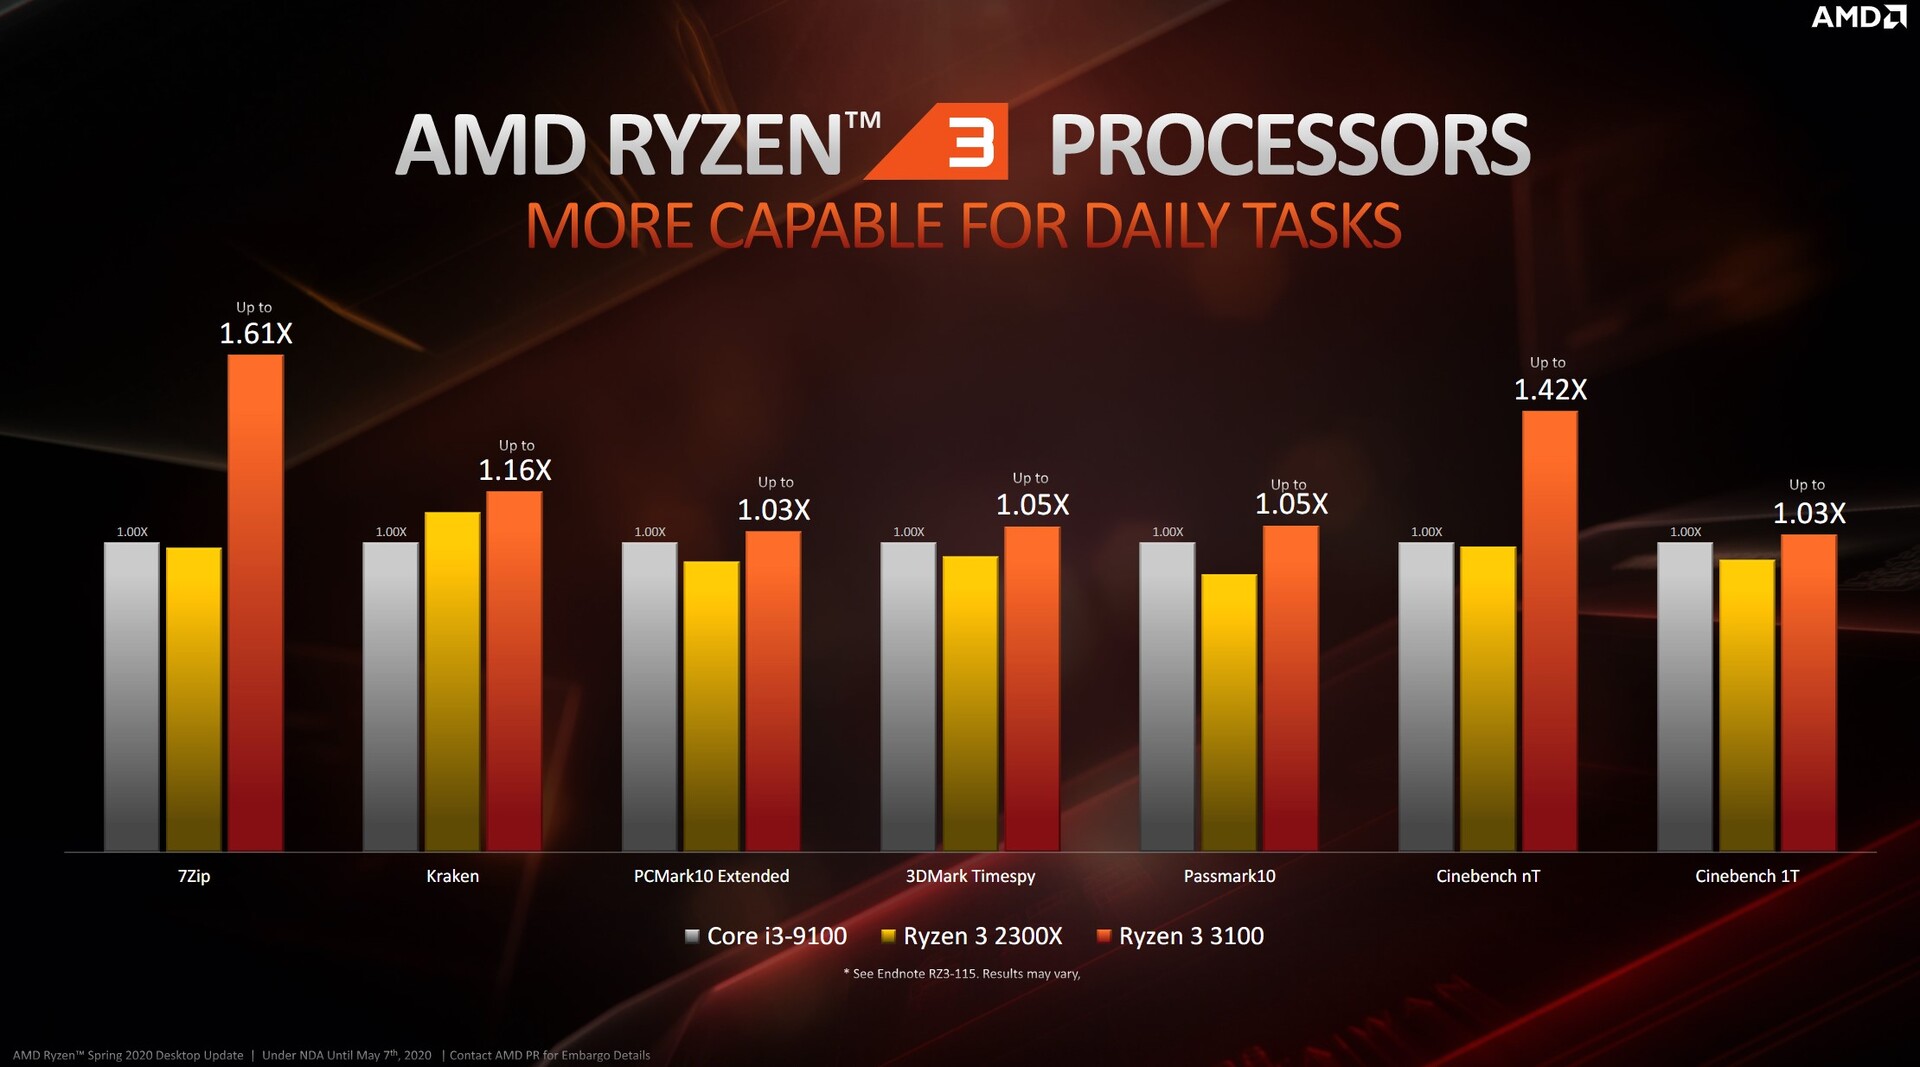
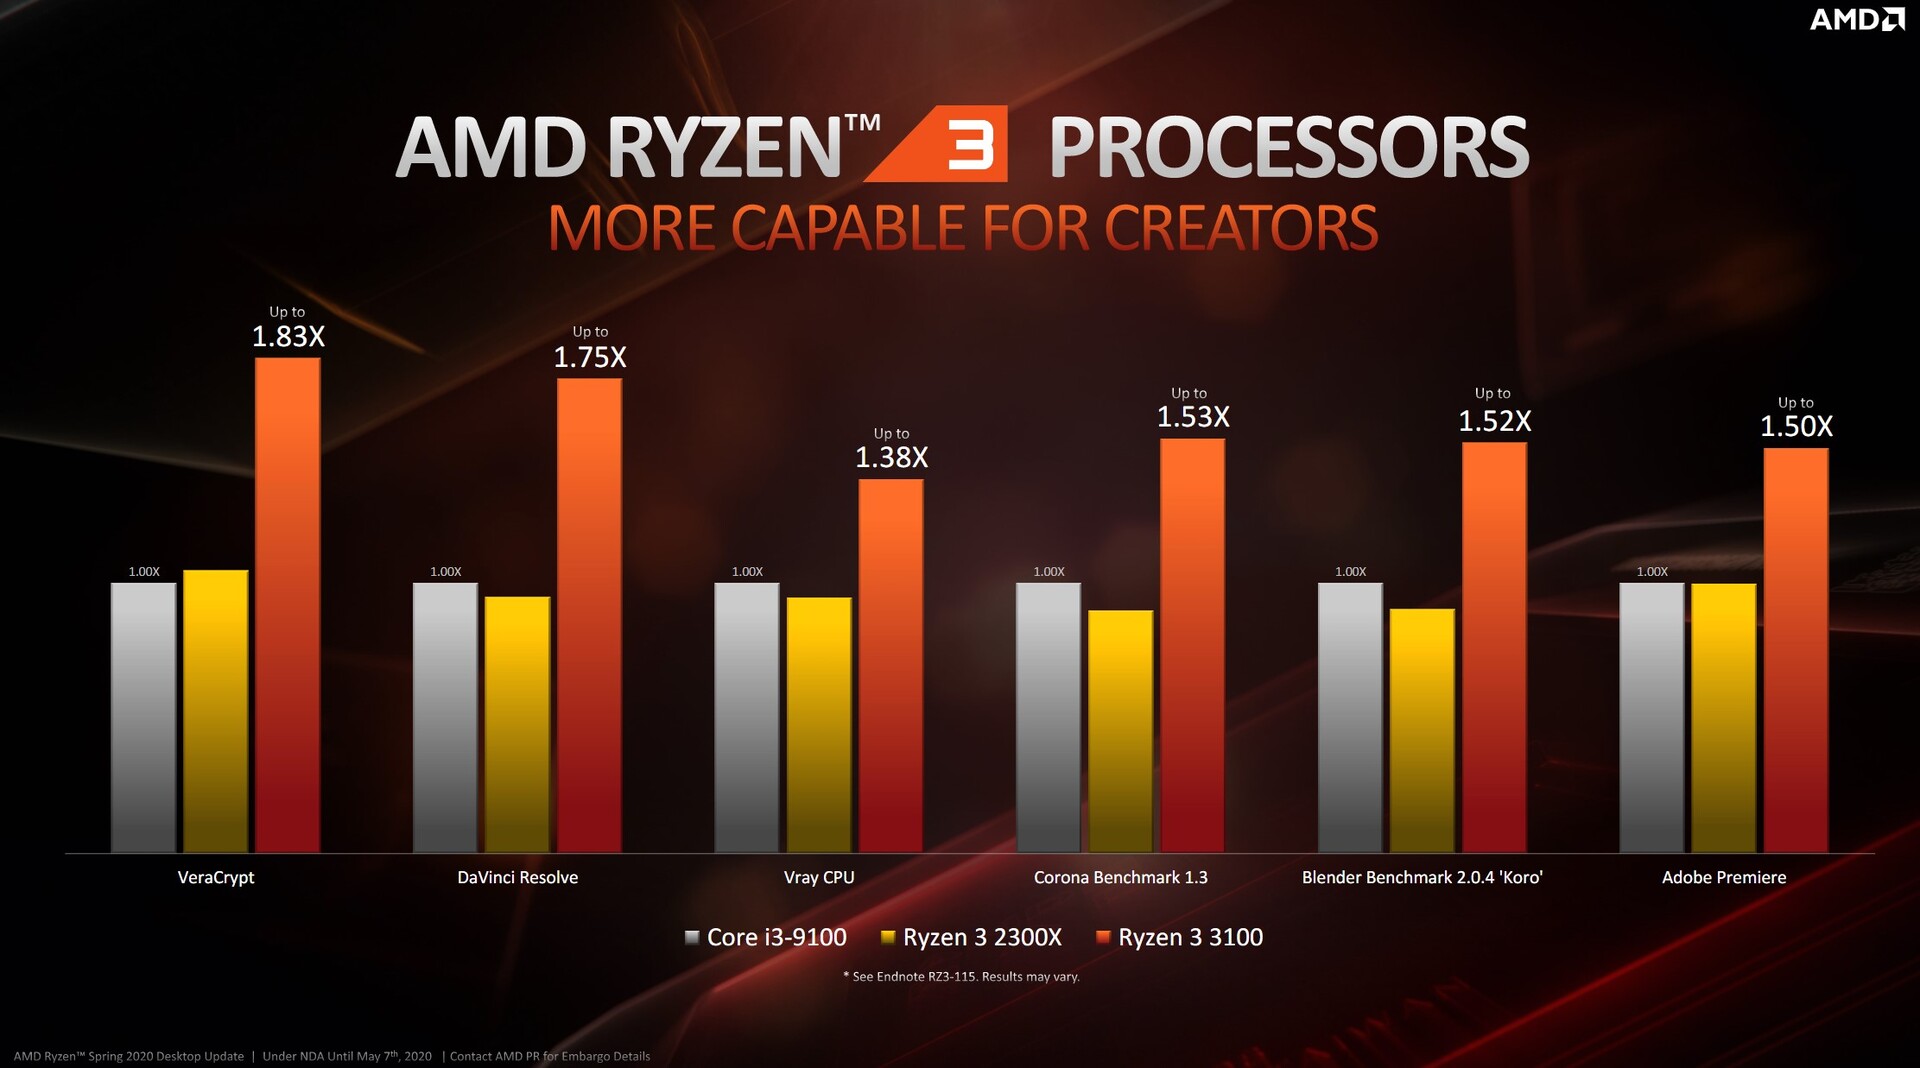
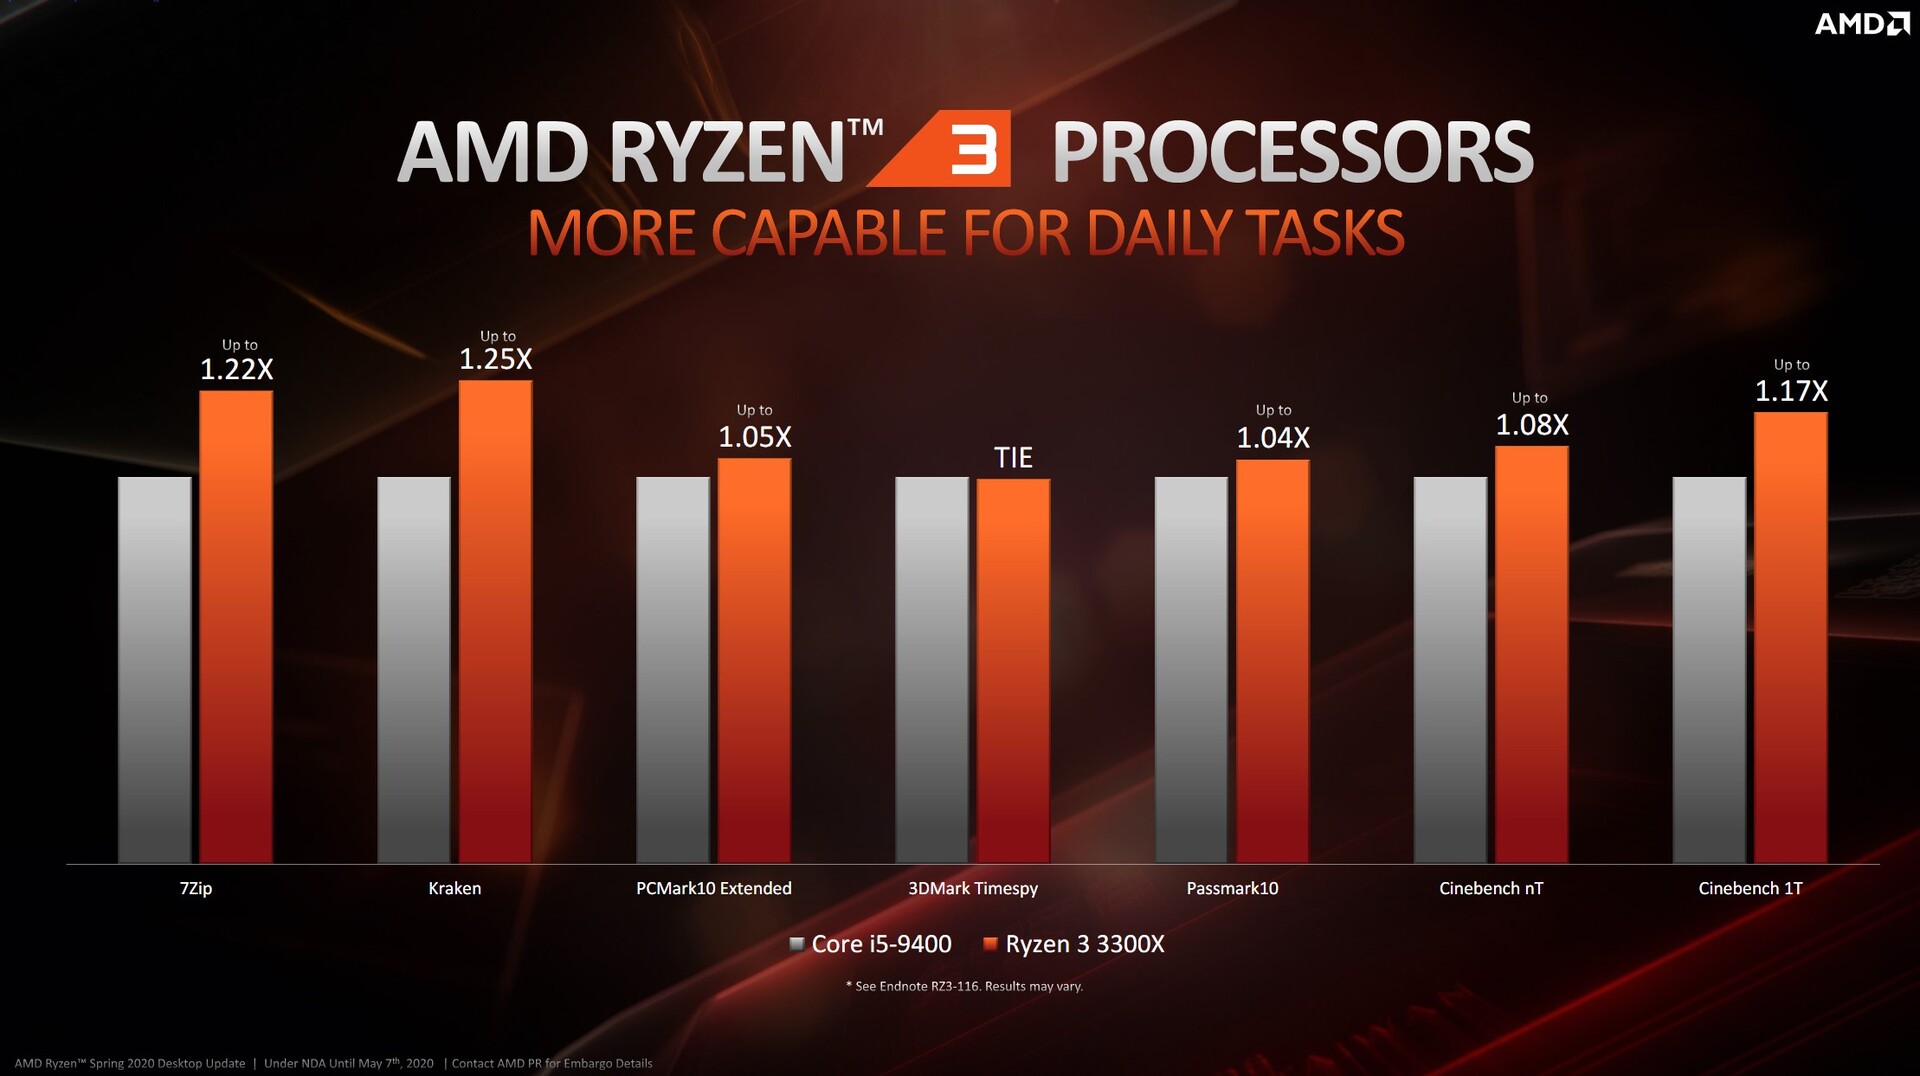
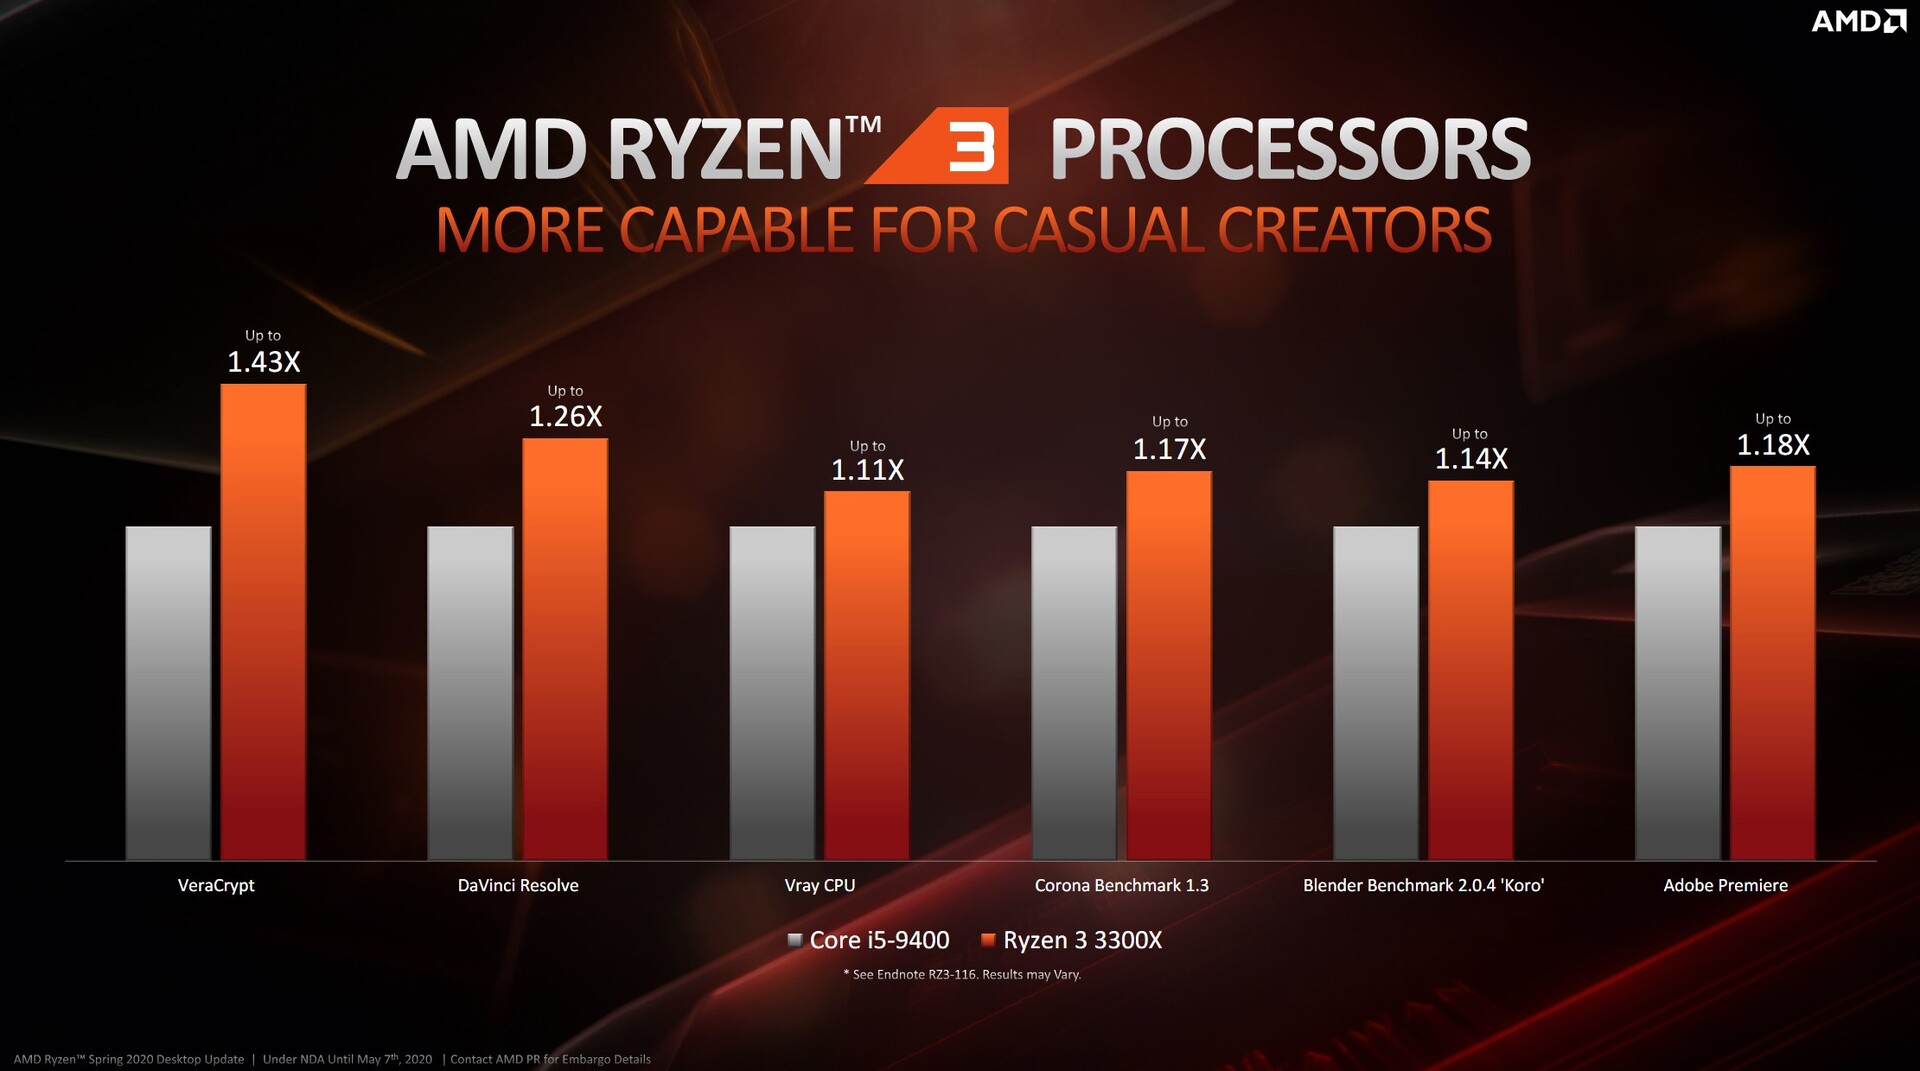
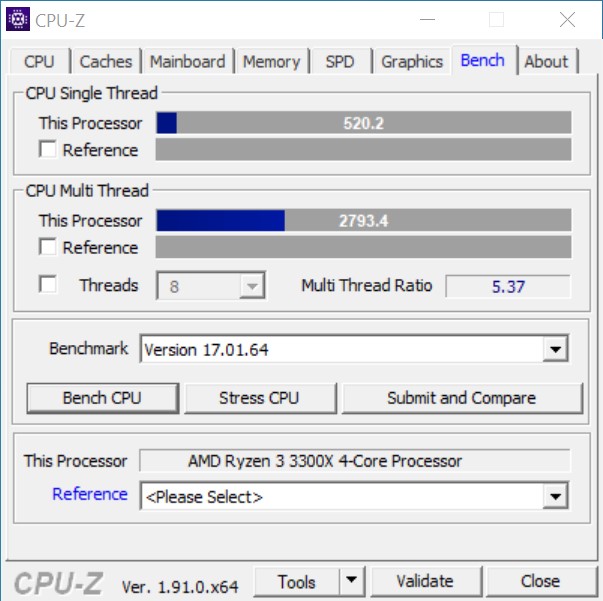
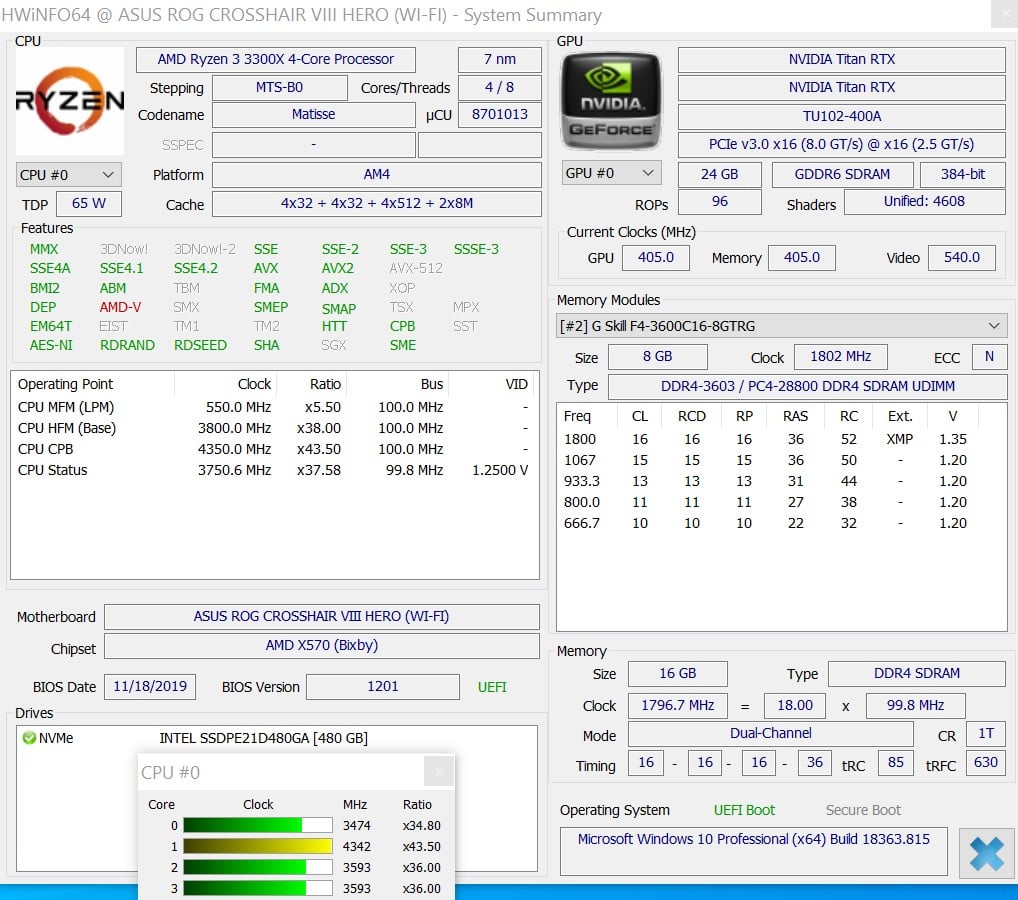
Avec les nouveaux Ryzen 3, AMD montre une fois de plus ce dont est capable Zen 2. Par rapport aux générations basées sur Zen+, les performances sont largement améliorées. De plus, Intel est de plus en plus sous pression, mais cela va peut-être bientôt changer, Comet Lake S étant déjà dans les startings blocks. On pourrait même croire qu'AMD s'est un peu endormi sur ses lauriers avec le lancement de la nouvelle génération Ryzen 3, Zen 2 étant disponible depuis un moment. Mais AMD peut toujours compter sur le PCI Express 4.0 comme argument unique, la génération 10 d'Intel ne le supportant toujours pas. Le fait que Ryzen 3 intègre maintenant le SMT est non seulement plaisant, mais répond enfin à nos demandes depuis longtemps. Cela permet de gagner quelques pourcents dans les comparatifs de performances, AMD gagnant souvent face à Intel avec ces nouveaux processeurs.
Les versions petits prix des nouveaux processeurs Ryzen 3 s'avèrent être une réussie en ce qui concerne le rapport performances / prix, grâce à leur bonne capacité d'overclocking. Les deux modèles Ryzen sont rapides, même si les six coeurs natifs de l'Intel Core i5-9400F parvient à fournir légèrement plus d'images dans les jeux.
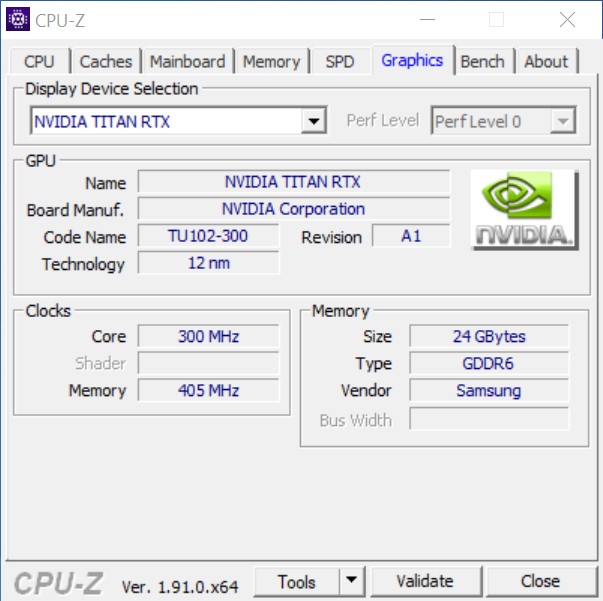
Les deux modèles sont proches l'un de l'autre du côté du prix, et sont significativement moins chers que l'Intel Core i5-9400F. L'AMD Ryzen 3 3100 débute à 109 €, et propose de bonnes performances pour avoir un système puissant. A cause de ses fréquences de base et de turbo un peu inférieures, le Ryzen 3 3100 manque un peu d'IPC face au Ryzen 3 3300X, si bien que ce dernier atteint de bien meilleurs taux dans les jeux, avec la Nvidia Titan RTX. Le modèle le plus performant ne coûte que 20 € de plus, ce que nous considérons comme tout à fait justifié.
Les deux modèles obtiennent une recommandation d'achat, parce qu'ils fournissent de très bonnes performances sans être trop chers. De plus, le Ryzen 3 3100 possède de bonnes capacités d'overclocking, qui peuvent lui permettre d'atteindre le niveau de performances du Ryzen 3 3300X avec quelques ajustements - le potentiel d'overclocking de ce dernier est bien plus faible.
L’intégralité de cette critique est disponible en anglais en suivant ce lien.
