Courte critique du HP Envy x360 13-ar0601ng (Ryzen 7, Vega 10, FHD) : un convertible AMD Ryzen au superbe écran

| SD Card Reader | |
| average JPG Copy Test (av. of 3 runs) | |
| Lenovo ThinkPad X390 Yoga-20NQS05R00 (Toshiba Exceria Pro M501) | |
| HP Envy x360 13-ar0601ng (Toshiba Exceria Pro M501 microSDXC 64GB) | |
| Lenovo ThinkPad L390 Yoga-20NT000XGE (Toshiba Exceria Pro M501 UHS-II) | |
| Moyenne de la classe Convertible (28.1 - 197, n=23, 2 dernières années) | |
| Dell Latitude 13 3390 (Toshiba Exceria Pro SDXC 64 GB UHS-II) | |
| maximum AS SSD Seq Read Test (1GB) | |
| Moyenne de la classe Convertible (28.9 - 254, n=22, 2 dernières années) | |
| HP Envy x360 13-ar0601ng (Toshiba Exceria Pro M501 microSDXC 64GB) | |
| Lenovo ThinkPad X390 Yoga-20NQS05R00 (Toshiba Exceria Pro M501) | |
| Lenovo ThinkPad L390 Yoga-20NT000XGE (Toshiba Exceria Pro M501 UHS-II) | |
| Dell Inspiron 13 7386 (Toshiba Exceria Pro M501 microSDXC 64GB) | |
| Dell Latitude 13 3390 (Toshiba Exceria Pro SDXC 64 GB UHS-II) | |
| |||||||||||||||||||||||||
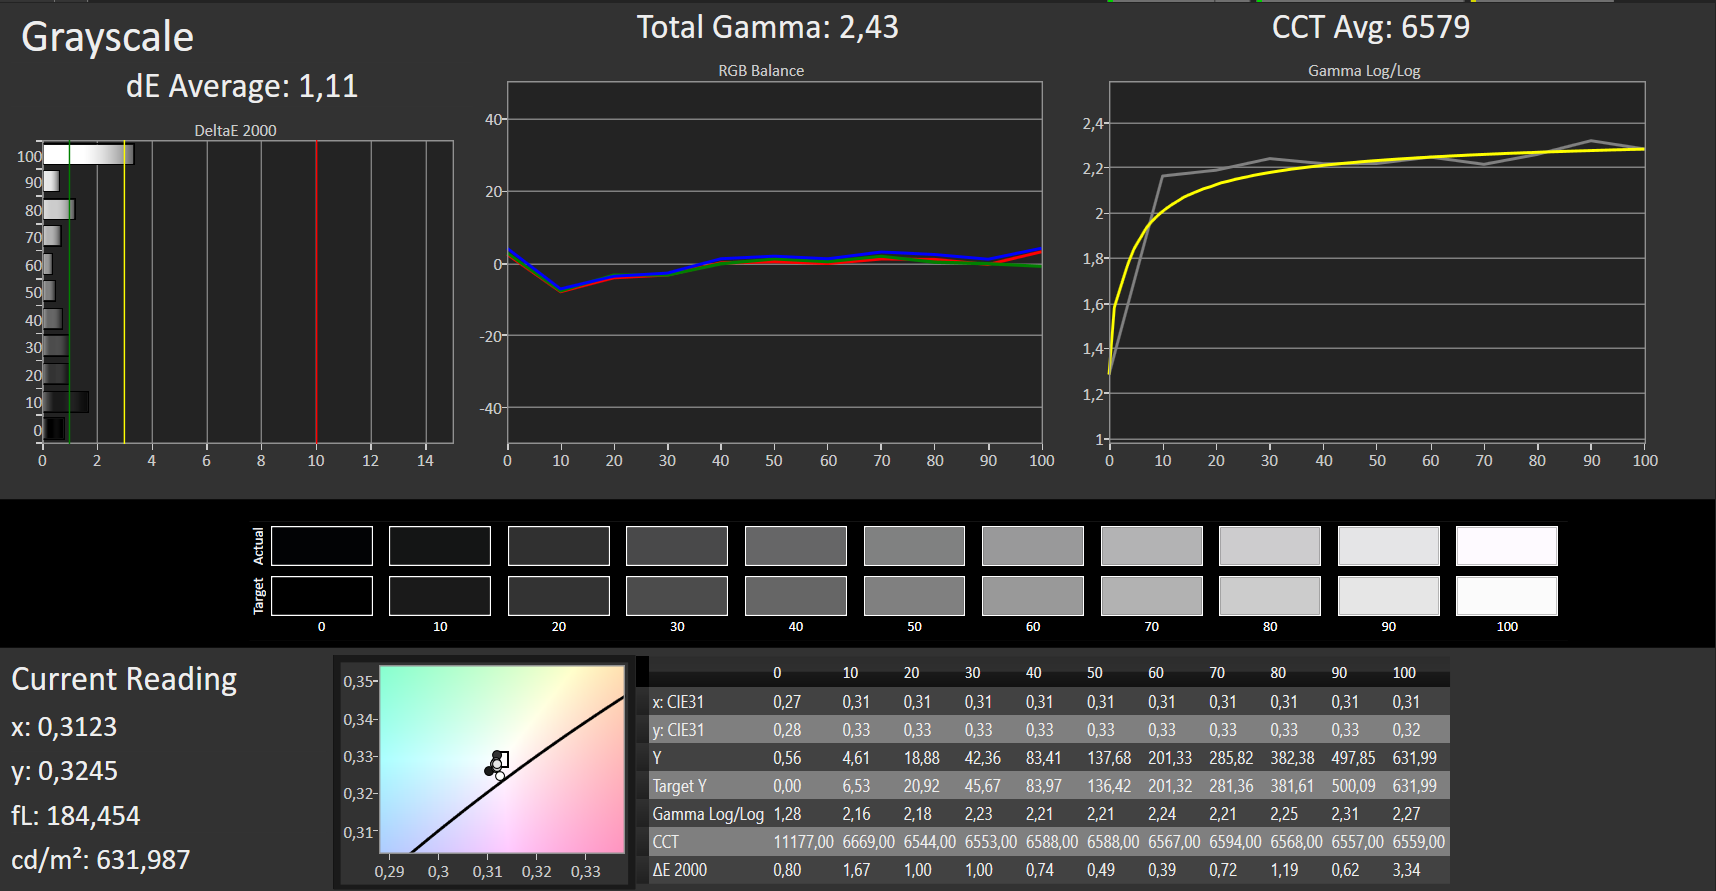
Homogénéité de la luminosité: 75 %
Valeur mesurée au centre, sur batterie: 635 cd/m²
Contraste: 1151:1 (Valeurs des noirs: 0.55 cd/m²)
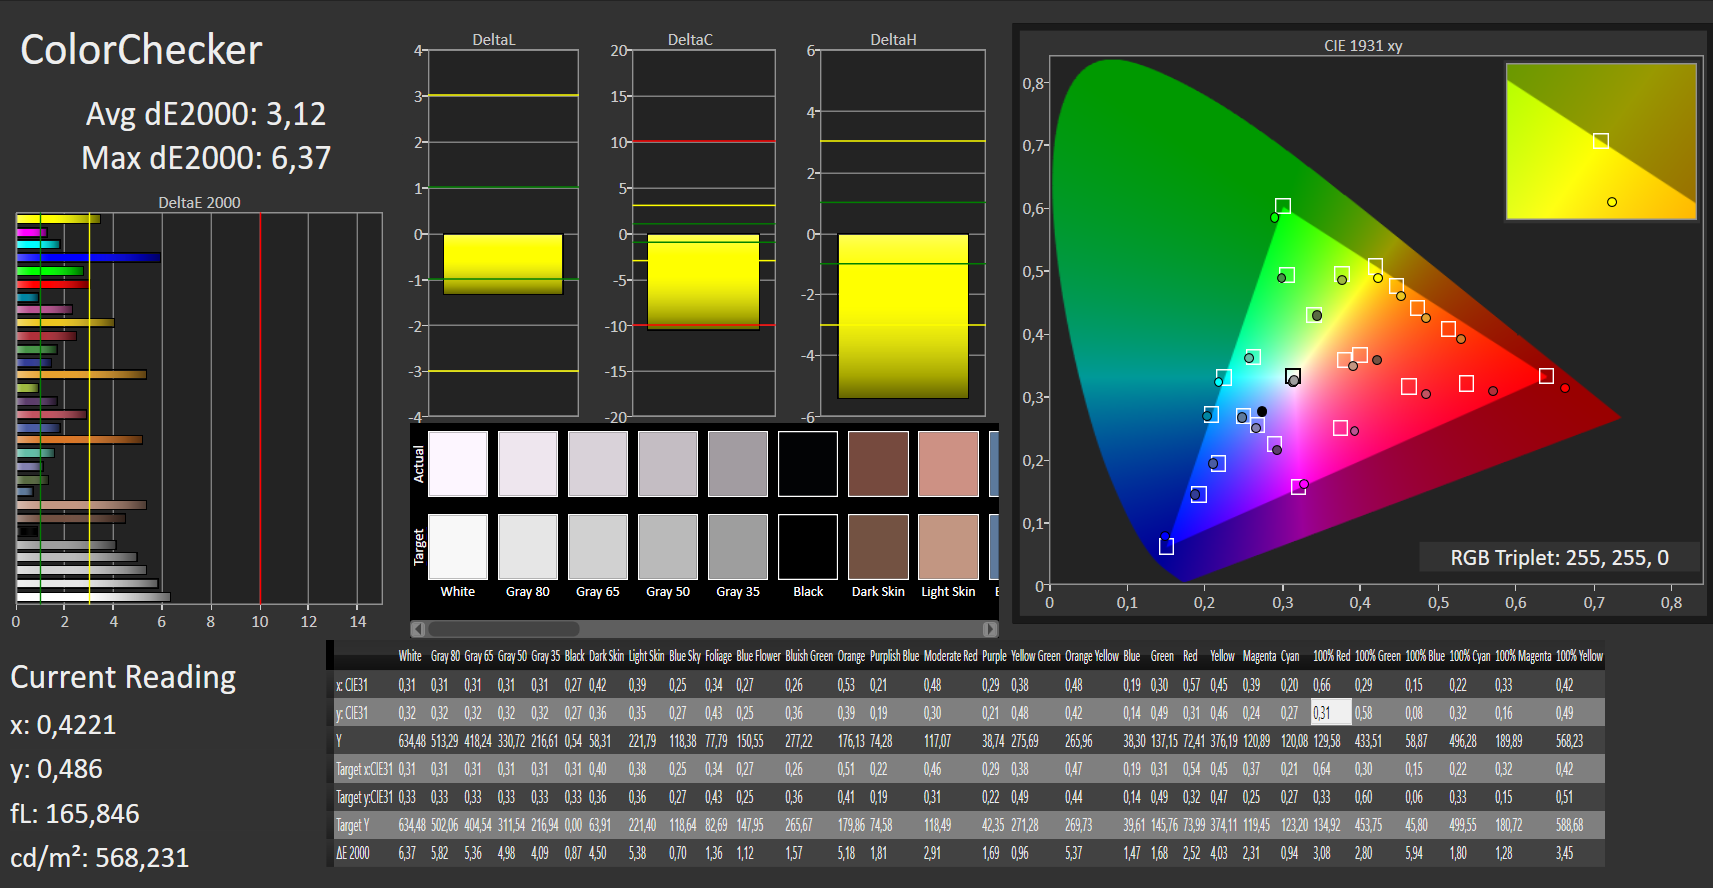
ΔE ColorChecker Calman: 3.12 | ∀{0.5-29.43 Ø4.73}
calibrated: 1.83
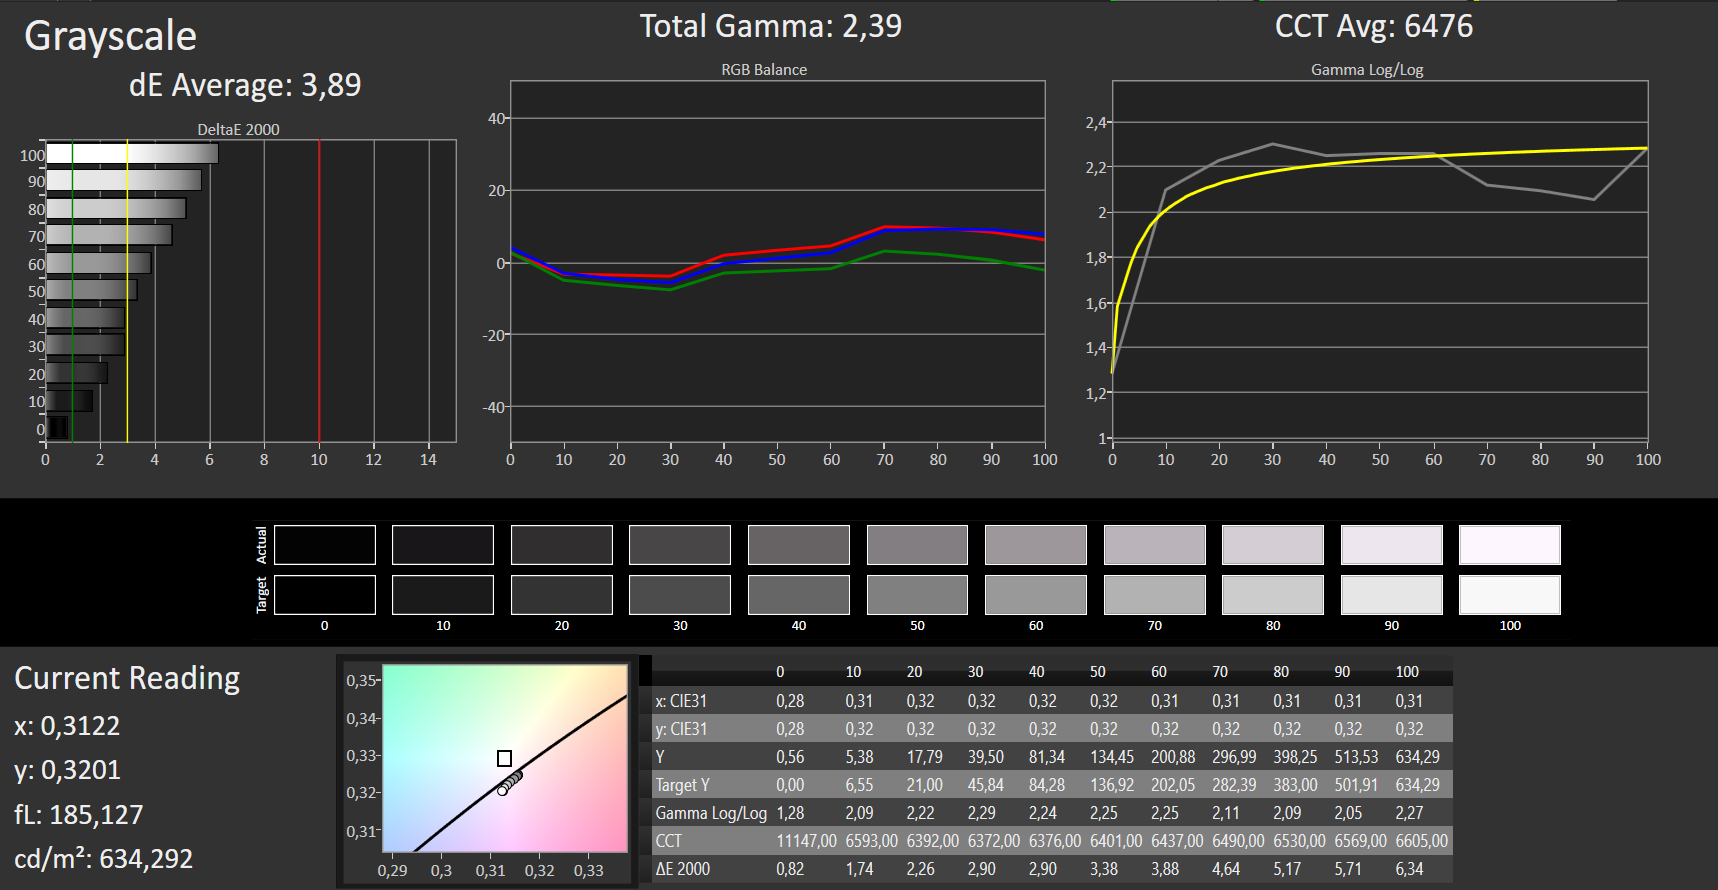
ΔE Greyscale Calman: 3.89 | ∀{0.09-98 Ø4.97}
91% sRGB (Argyll 1.6.3 3D)
59% AdobeRGB 1998 (Argyll 1.6.3 3D)
63.8% AdobeRGB 1998 (Argyll 3D)
90.8% sRGB (Argyll 3D)
63% Display P3 (Argyll 3D)
Gamma: 2.39
CCT: 6476 K
| HP Envy x360 13-ar0601ng InfoVision, M133NVF3 R2, IPS, 120 Hz, 1920x1080, 13.3" | Lenovo ThinkPad X390 Yoga-20NQS05R00 LP133WF7-SPA1, IPS LED, 1920x1080, 13.3" | Dell Latitude 13 3390 BOE06A7, NV13FHM, IPS, 1920x1080, 13.3" | Lenovo ThinkPad L390 Yoga-20NT000XGE LEN4094, NV133FHM-N5A, IPS LED, 1920x1080, 13.3" | Dell Inspiron 13 7386 Chi Mei CMN1385 / 133DCE / Dell 3GRT6, IPS, 3840x2160, 13.3" | Lenovo Yoga C930-13IKB B139HAN03_0, IPS, 1920x1080, 13.9" | |
|---|---|---|---|---|---|---|
| Display | 5% | -34% | 5% | 9% | 3% | |
| Display P3 Coverage (%) | 63 | 65.2 3% | 40.9 -35% | 69.2 10% | 68.2 8% | 64.3 2% |
| sRGB Coverage (%) | 90.8 | 97 7% | 61.3 -32% | 90.6 0% | 99.8 10% | 94.6 4% |
| AdobeRGB 1998 Coverage (%) | 63.8 | 67.3 5% | 42.29 -34% | 66.3 4% | 70 10% | 66.2 4% |
| Response Times | -55% | -33% | -57% | -50% | -21% | |
| Response Time Grey 50% / Grey 80% * (ms) | 35 ? | 59.2 ? -69% | 42 ? -20% | 51.2 ? -46% | 57 ? -63% | 40.8 ? -17% |
| Response Time Black / White * (ms) | 22 ? | 30.8 ? -40% | 32 ? -45% | 36.8 ? -67% | 30 ? -36% | 27.6 ? -25% |
| PWM Frequency (Hz) | 4065 ? | 208 ? | 1000 ? | 26000 ? | ||
| Screen | -13% | -66% | -28% | -2% | -33% | |
| Brightness middle (cd/m²) | 633 | 319 -50% | 276 -56% | 313 -51% | 318 -50% | 316 -50% |
| Brightness (cd/m²) | 675 | 306 -55% | 274 -59% | 295 -56% | 278 -59% | 291 -57% |
| Brightness Distribution (%) | 75 | 90 20% | 82 9% | 90 20% | 81 8% | 83 11% |
| Black Level * (cd/m²) | 0.55 | 0.15 73% | 0.29 47% | 0.22 60% | 0.18 67% | 0.36 35% |
| Contrast (:1) | 1151 | 2127 85% | 952 -17% | 1423 24% | 1767 54% | 878 -24% |
| Colorchecker dE 2000 * | 3.12 | 6.1 -96% | 5.84 -87% | 6.2 -99% | 2.91 7% | 5.9 -89% |
| Colorchecker dE 2000 max. * | 6.37 | 9.7 -52% | 26.72 -319% | 10.7 -68% | 6.11 4% | 12.9 -103% |
| Colorchecker dE 2000 calibrated * | 1.83 | 1 45% | 5.15 -181% | 2.5 -37% | 2.91 -59% | 1.3 29% |
| Greyscale dE 2000 * | 3.89 | 8.6 -121% | 3.54 9% | 8 -106% | 4.37 -12% | 8.6 -121% |
| Gamma | 2.39 92% | 2.62 84% | 2.43 91% | 2.38 92% | 2.26 97% | 2.1 105% |
| CCT | 6476 100% | 6613 98% | 6747 96% | 7100 92% | 6448 101% | 6854 95% |
| Color Space (Percent of AdobeRGB 1998) (%) | 59 | 61.9 5% | 39 -34% | 59.1 0% | 70 19% | 60.7 3% |
| Color Space (Percent of sRGB) (%) | 91 | 96.8 6% | 61 -33% | 90.6 0% | 93 2% | 94.5 4% |
| Moyenne finale (programmes/paramètres) | -21% /
-15% | -44% /
-55% | -27% /
-26% | -14% /
-6% | -17% /
-25% |
* ... Moindre est la valeur, meilleures sont les performances


Temps de réponse de l'écran
| ↔ Temps de réponse noir à blanc | ||
|---|---|---|
| 22 ms ... hausse ↗ et chute ↘ combinées | ↗ 12 ms hausse |  |
| ↘ 10 ms chute | ||
| L'écran montre de bons temps de réponse, mais insuffisant pour du jeu compétitif. En comparaison, tous les appareils testés affichent entre 0.1 (minimum) et 240 (maximum) ms. » 48 % des appareils testés affichent de meilleures performances. Cela signifie que les latences relevées sont moins bonnes que la moyenne (19.9 ms) de tous les appareils testés. | ||
| ↔ Temps de réponse gris 50% à gris 80% | ||
| 35 ms ... hausse ↗ et chute ↘ combinées | ↗ 18 ms hausse | 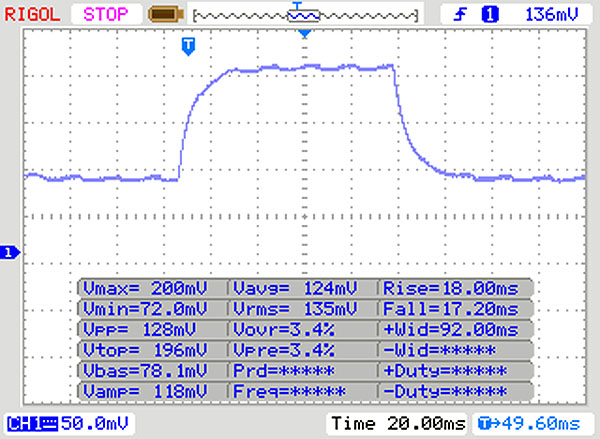 |
| ↘ 17 ms chute | ||
| L'écran souffre de latences très élevées, à éviter pour le jeu. En comparaison, tous les appareils testés affichent entre 0.165 (minimum) et 636 (maximum) ms. » 49 % des appareils testés affichent de meilleures performances. Cela signifie que les latences relevées sont moins bonnes que la moyenne (31.1 ms) de tous les appareils testés. | ||
Scintillement / MLI (Modulation de largeur d'impulsion)
| Scintillement / MLI (Modulation de largeur d'impulsion) décelé | 4065 Hz | ≤ 90 Niveau de luminosité | 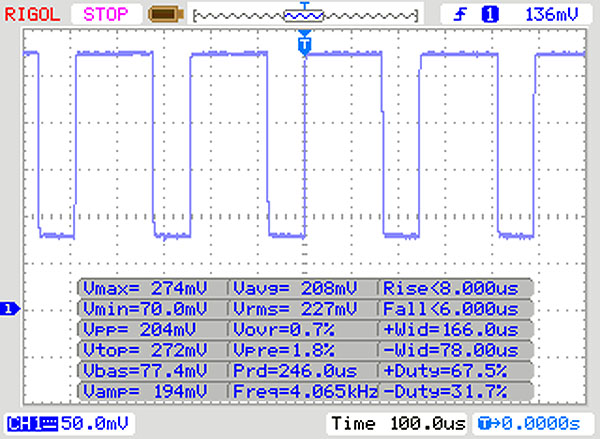 |
Le rétroéclairage de l'écran scintille à la fréquence de 4065 Hz (certainement du fait de l'utilisation d'une MDI - Modulation de largeur d'impulsion) à un niveau de luminosité inférieur ou égal à 90 % . Aucun scintillement ne devrait être perceptible au-dessus de cette valeur. La fréquence de rafraîchissement de 4065 Hz est élevée, la grande majorité des utilisateurs ne devrait pas percevoir de scintillements et être sujette à une fatigue oculaire accrue. En comparaison, 52 % des appareils testés n'emploient pas MDI pour assombrir leur écran. Nous avons relevé une moyenne à 7794 (minimum : 5 - maximum : 343500) Hz dans le cas où une MDI était active. | |||
* ... Moindre est la valeur, meilleures sont les performances
| PCMark 8 Home Score Accelerated v2 | 3863 points | |
| PCMark 8 Creative Score Accelerated v2 | 4974 points | |
| PCMark 8 Work Score Accelerated v2 | 4869 points | |
| PCMark 10 Score | 3685 points | |
Aide | ||
| HP Envy x360 13-ar0601ng SK Hynix BC501 HFM512GDJTNG | Lenovo ThinkPad X390 Yoga-20NQS05R00 Intel SSD Pro 7600p SSDPEKKF512G8L | Dell Latitude 13 3390 SK hynix SC311 SATA | Lenovo ThinkPad L390 Yoga-20NT000XGE Samsung SSD PM981 MZVLB256HAHQ | Dell Inspiron 13 7386 SK Hynix BC501 HFM512GDJTNG | Lenovo Yoga C930-13IKB SK hynix PC401 HFS256GD9TNG | Moyenne SK Hynix BC501 HFM512GDJTNG | |
|---|---|---|---|---|---|---|---|
| AS SSD | 81% | -51% | 55% | 16% | -11% | 15% | |
| Seq Read (MB/s) | 1412 | 2742 94% | 479.5 -66% | 1724 22% | 1122 -21% | 1850 31% | 1323 ? -6% |
| Seq Write (MB/s) | 540 | 1511 180% | 354.9 -34% | 1123 108% | 619 15% | 661 22% | 697 ? 29% |
| 4K Read (MB/s) | 32.24 | 66.3 106% | 23.88 -26% | 51.8 61% | 39.58 23% | 38.04 18% | 40.4 ? 25% |
| 4K Write (MB/s) | 74.7 | 175.2 135% | 51.3 -31% | 133.8 79% | 108.5 45% | 95 27% | 100.8 ? 35% |
| 4K-64 Read (MB/s) | 567 | 873 54% | 294.8 -48% | 745 31% | 776 37% | 434.3 -23% | 686 ? 21% |
| 4K-64 Write (MB/s) | 700 | 594 -15% | 217.5 -69% | 1193 70% | 671 -4% | 266.3 -62% | 660 ? -6% |
| Access Time Read * (ms) | 0.049 | 0.035 29% | 0.093 -90% | 0.041 16% | 0.045 8% | 0.069 -41% | 0.06071 ? -24% |
| Access Time Write * (ms) | 0.048 | 0.021 56% | 0.071 -48% | 0.028 42% | 0.033 31% | 0.056 -17% | 0.037 ? 23% |
| Score Read (Points) | 741 | 1213 64% | 367 -50% | 969 31% | 928 25% | 657 -11% | 858 ? 16% |
| Score Write (Points) | 829 | 920 11% | 304 -63% | 1440 74% | 841 1% | 427 -48% | 830 ? 0% |
| Score Total (Points) | 1913 | 2712 42% | 860 -55% | 2889 51% | 2228 16% | 1373 -28% | 2107 ? 10% |
| Copy ISO MB/s (MB/s) | 521 | 1725 231% | 294 -44% | 1025 97% | 539 3% | 802 ? 54% | |
| Copy Program MB/s (MB/s) | 253.1 | 418.3 65% | 137.4 -46% | 322.1 27% | 209.7 -17% | 265 ? 5% | |
| Copy Game MB/s (MB/s) | 392.9 | 687 75% | 202.2 -49% | 637 62% | 340 -13% | 487 ? 24% |
* ... Moindre est la valeur, meilleures sont les performances

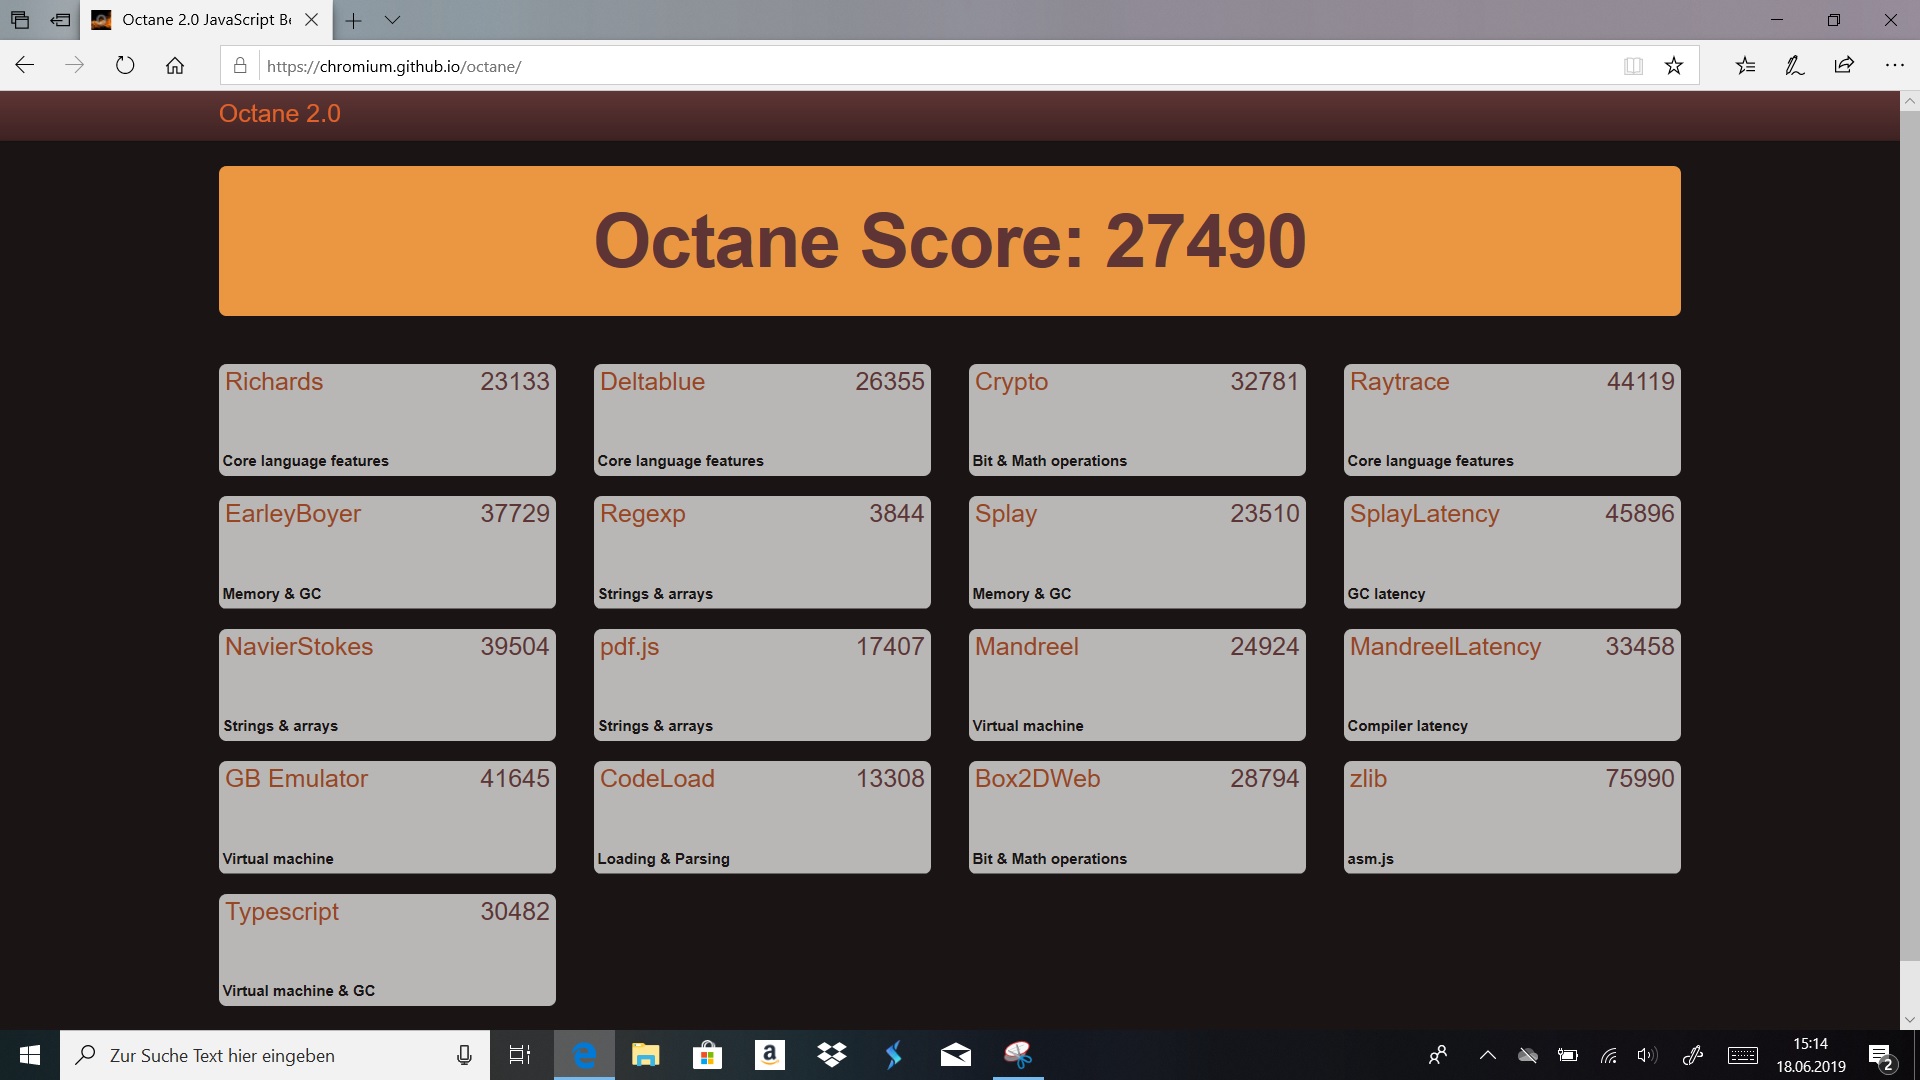
| 3DMark 11 Performance | 3737 points | |
| 3DMark Ice Storm Standard Score | 69242 points | |
| 3DMark Cloud Gate Standard Score | 9802 points | |
| 3DMark Fire Strike Score | 1669 points | |
| 3DMark Fire Strike Extreme Score | 813 points | |
| 3DMark Time Spy Score | 647 points | |
Aide | ||
| Bas | Moyen | Élevé | Ultra | |
|---|---|---|---|---|
| BioShock Infinite (2013) | 113 | 14 | ||
| Dota 2 Reborn (2015) | 67.4 | 43.8 | 23.3 | 22.3 |
| Rise of the Tomb Raider (2016) | 45.9 | 8.3 | ||
| X-Plane 11.11 (2018) | 23.4 | 16.8 | 14.8 |
Degré de la nuisance sonore
| Au repos |
| 32.2 / 32.2 / 32.2 dB(A) |
| Fortement sollicité |
| 40.8 / 41.9 dB(A) |
 | ||
30 dB silencieux 40 dB(A) audible 50 dB(A) bruyant |
||
min: | ||
| HP Envy x360 13-ar0601ng Vega 10, R7 3700U, SK Hynix BC501 HFM512GDJTNG | Lenovo ThinkPad X390 Yoga-20NQS05R00 UHD Graphics 620, i7-8565U, Intel SSD Pro 7600p SSDPEKKF512G8L | Dell Latitude 13 3390 UHD Graphics 620, i5-8250U, SK hynix SC311 SATA | Lenovo ThinkPad L390 Yoga-20NT000XGE UHD Graphics 620, i5-8265U, Samsung SSD PM981 MZVLB256HAHQ | Dell Inspiron 13 7386 UHD Graphics 620, i7-8565U, SK Hynix BC501 HFM512GDJTNG | Lenovo Yoga C930-13IKB UHD Graphics 620, i5-8250U, SK hynix PC401 HFS256GD9TNG | |
|---|---|---|---|---|---|---|
| Noise | 10% | 9% | 13% | 9% | 12% | |
| arrêt / environnement * (dB) | 30.5 | 29.2 4% | 30.6 -0% | 29.5 3% | 30.3 1% | 29.3 4% |
| Idle Minimum * (dB) | 32.2 | 29.2 9% | 30.6 5% | 29.5 8% | 30.4 6% | 29.3 9% |
| Idle Average * (dB) | 32.2 | 29.2 9% | 30.6 5% | 29.5 8% | 30.4 6% | 29.3 9% |
| Idle Maximum * (dB) | 32.2 | 29.2 9% | 30.6 5% | 29.5 8% | 30.4 6% | 29.7 8% |
| Load Average * (dB) | 40.8 | 35 14% | 33.3 18% | 30.6 25% | 34.3 16% | 31.8 22% |
| Load Maximum * (dB) | 41.9 | 35 16% | 33 21% | 30.6 27% | 34.2 18% | 32.7 22% |
* ... Moindre est la valeur, meilleures sont les performances
(±) La température maximale du côté supérieur est de 43 °C / 109 F, par rapport à la moyenne de 35.4 °C / 96 F, allant de 19.6 à 60 °C pour la classe Convertible.
(±) Le fond chauffe jusqu'à un maximum de 43.6 °C / 110 F, contre une moyenne de 36.9 °C / 98 F
(+) En utilisation inactive, la température moyenne du côté supérieur est de 30.7 °C / 87 F, par rapport à la moyenne du dispositif de 30.3 °C / 87 F.
(+) Les repose-poignets et le pavé tactile atteignent la température maximale de la peau (33.3 °C / 91.9 F) et ne sont donc pas chauds.
(-) La température moyenne de la zone de l'appui-paume de dispositifs similaires était de 28 °C / 82.4 F (-5.3 °C / #-9.5 F).
| HP Envy x360 13-ar0601ng Vega 10, R7 3700U, SK Hynix BC501 HFM512GDJTNG | Lenovo ThinkPad X390 Yoga-20NQS05R00 UHD Graphics 620, i7-8565U, Intel SSD Pro 7600p SSDPEKKF512G8L | Dell Latitude 13 3390 UHD Graphics 620, i5-8250U, SK hynix SC311 SATA | Lenovo ThinkPad L390 Yoga-20NT000XGE UHD Graphics 620, i5-8265U, Samsung SSD PM981 MZVLB256HAHQ | Dell Inspiron 13 7386 UHD Graphics 620, i7-8565U, SK Hynix BC501 HFM512GDJTNG | Lenovo Yoga C930-13IKB UHD Graphics 620, i5-8250U, SK hynix PC401 HFS256GD9TNG | |
|---|---|---|---|---|---|---|
| Heat | 3% | 11% | 6% | 13% | 14% | |
| Maximum Upper Side * (°C) | 43 | 41.7 3% | 40 7% | 46.7 -9% | 40.5 6% | 41.8 3% |
| Maximum Bottom * (°C) | 43.6 | 50.1 -15% | 46.1 -6% | 50.7 -16% | 41.6 5% | 40.9 6% |
| Idle Upper Side * (°C) | 33.1 | 27.8 16% | 25.7 22% | 23.8 28% | 26.3 21% | 25.6 23% |
| Idle Bottom * (°C) | 32.5 | 30.2 7% | 26 20% | 25.6 21% | 26.2 19% | 24.5 25% |
* ... Moindre est la valeur, meilleures sont les performances
HP Envy x360 13-ar0601ng analyse audio
(-) | haut-parleurs pas très forts (70.3 dB)
Basses 100 - 315 Hz
(-) | presque aucune basse - en moyenne 19.5% plus bas que la médiane
(±) | la linéarité des basses est moyenne (12.6% delta à la fréquence précédente)
Médiums 400 - 2000 Hz
(+) | médiane équilibrée - seulement 4.3% de la médiane
(±) | la linéarité des médiums est moyenne (7.2% delta à la fréquence précédente)
Aiguës 2 - 16 kHz
(+) | des sommets équilibrés - à seulement 3.1% de la médiane
(+) | les aigus sont linéaires (4.7% delta à la fréquence précédente)
Globalement 100 - 16 000 Hz
(±) | la linéarité du son global est moyenne (21.2% de différence avec la médiane)
Par rapport à la même classe
» 56% de tous les appareils testés de cette catégorie étaient meilleurs, 11% similaires, 32% pires
» Le meilleur avait un delta de 6%, la moyenne était de 20%, le pire était de 57%.
Par rapport à tous les appareils testés
» 59% de tous les appareils testés étaient meilleurs, 7% similaires, 34% pires
» Le meilleur avait un delta de 4%, la moyenne était de 24%, le pire était de 134%.
| Éteint/en veille | |
| Au repos | |
| Fortement sollicité |
|
Légende:
min: | |
| HP Envy x360 13-ar0601ng R7 3700U, Vega 10, SK Hynix BC501 HFM512GDJTNG, IPS, 120 Hz, 1920x1080, 13.3" | Lenovo ThinkPad X390 Yoga-20NQS05R00 i7-8565U, UHD Graphics 620, Intel SSD Pro 7600p SSDPEKKF512G8L, IPS LED, 1920x1080, 13.3" | Dell Latitude 13 3390 i5-8250U, UHD Graphics 620, SK hynix SC311 SATA, IPS, 1920x1080, 13.3" | Lenovo ThinkPad L390 Yoga-20NT000XGE i5-8265U, UHD Graphics 620, Samsung SSD PM981 MZVLB256HAHQ, IPS LED, 1920x1080, 13.3" | Dell Inspiron 13 7386 i7-8565U, UHD Graphics 620, SK Hynix BC501 HFM512GDJTNG, IPS, 3840x2160, 13.3" | Lenovo Yoga C930-13IKB i5-8250U, UHD Graphics 620, SK hynix PC401 HFS256GD9TNG, IPS, 1920x1080, 13.9" | Moyenne AMD Radeon RX Vega 10 | Moyenne de la classe Convertible | |
|---|---|---|---|---|---|---|---|---|
| Power Consumption | -42% | -24% | -41% | -96% | -41% | -45% | -55% | |
| Idle Minimum * (Watt) | 3.2 | 3.46 -8% | 3.9 -22% | 4 -25% | 6.5 -103% | 3.3 -3% | 4.73 ? -48% | 4.29 ? -34% |
| Idle Average * (Watt) | 2.8 | 5.88 -110% | 6.5 -132% | 7.1 -154% | 12.2 -336% | 6.8 -143% | 7.61 ? -172% | 7.08 ? -153% |
| Idle Maximum * (Watt) | 12.4 | 9.12 26% | 8.6 31% | 10.7 14% | 12.7 -2% | 9.5 23% | 9.63 ? 22% | 8.68 ? 30% |
| Load Average * (Watt) | 24.2 | 45.6 -88% | 25 -3% | 33.8 -40% | 39 -61% | 40.8 -69% | 33.3 ? -38% | 44 ? -82% |
| Load Maximum * (Watt) | 50 | 65.9 -32% | 48.1 4% | 48.8 2% | 39 22% | 57 -14% | 45.1 ? 10% | 67.3 ? -35% |
* ... Moindre est la valeur, meilleures sont les performances
| HP Envy x360 13-ar0601ng R7 3700U, Vega 10, 53 Wh | Lenovo ThinkPad X390 Yoga-20NQS05R00 i7-8565U, UHD Graphics 620, 50 Wh | Dell Latitude 13 3390 i5-8250U, UHD Graphics 620, 42 Wh | Lenovo ThinkPad L390 Yoga-20NT000XGE i5-8265U, UHD Graphics 620, 45 Wh | Dell Inspiron 13 7386 i7-8565U, UHD Graphics 620, 38 Wh | Lenovo Yoga C930-13IKB i5-8250U, UHD Graphics 620, 60 Wh | Moyenne de la classe Convertible | |
|---|---|---|---|---|---|---|---|
| Autonomie de la batterie | 11% | 6% | 8% | -33% | 53% | 86% | |
| Reader / Idle (h) | 10.5 | 16.7 59% | 15.8 50% | 6.7 -36% | 23.9 128% | 27.7 ? 164% | |
| H.264 (h) | 6.5 | 10 54% | 5.9 -9% | 7.4 14% | 5.5 -15% | 10.5 62% | 15.3 ? 135% |
| WiFi v1.3 (h) | 7.3 | 8.2 12% | 6.7 -8% | 7.2 -1% | 3.9 -47% | 9.2 26% | 11.9 ? 63% |
| Load (h) | 2.2 | 1.5 -32% | 1.8 -18% | 1.5 -32% | 1.5 -32% | 2.1 -5% | 1.779 ? -19% |
Points positifs
Points négatifs
Verdict
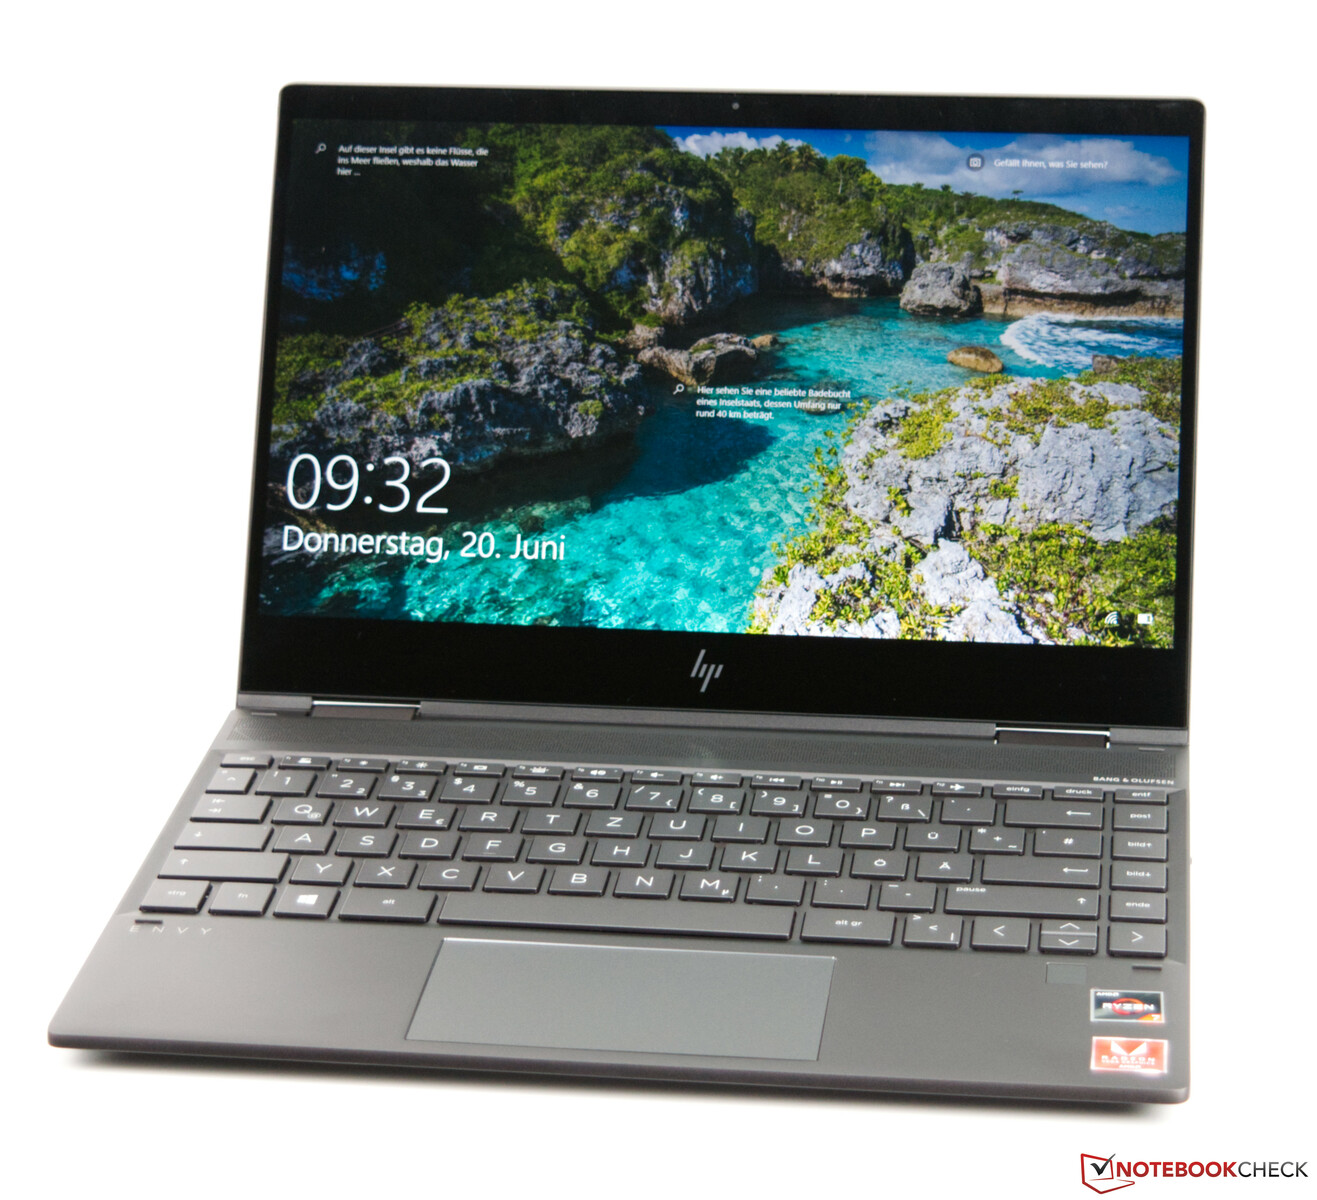
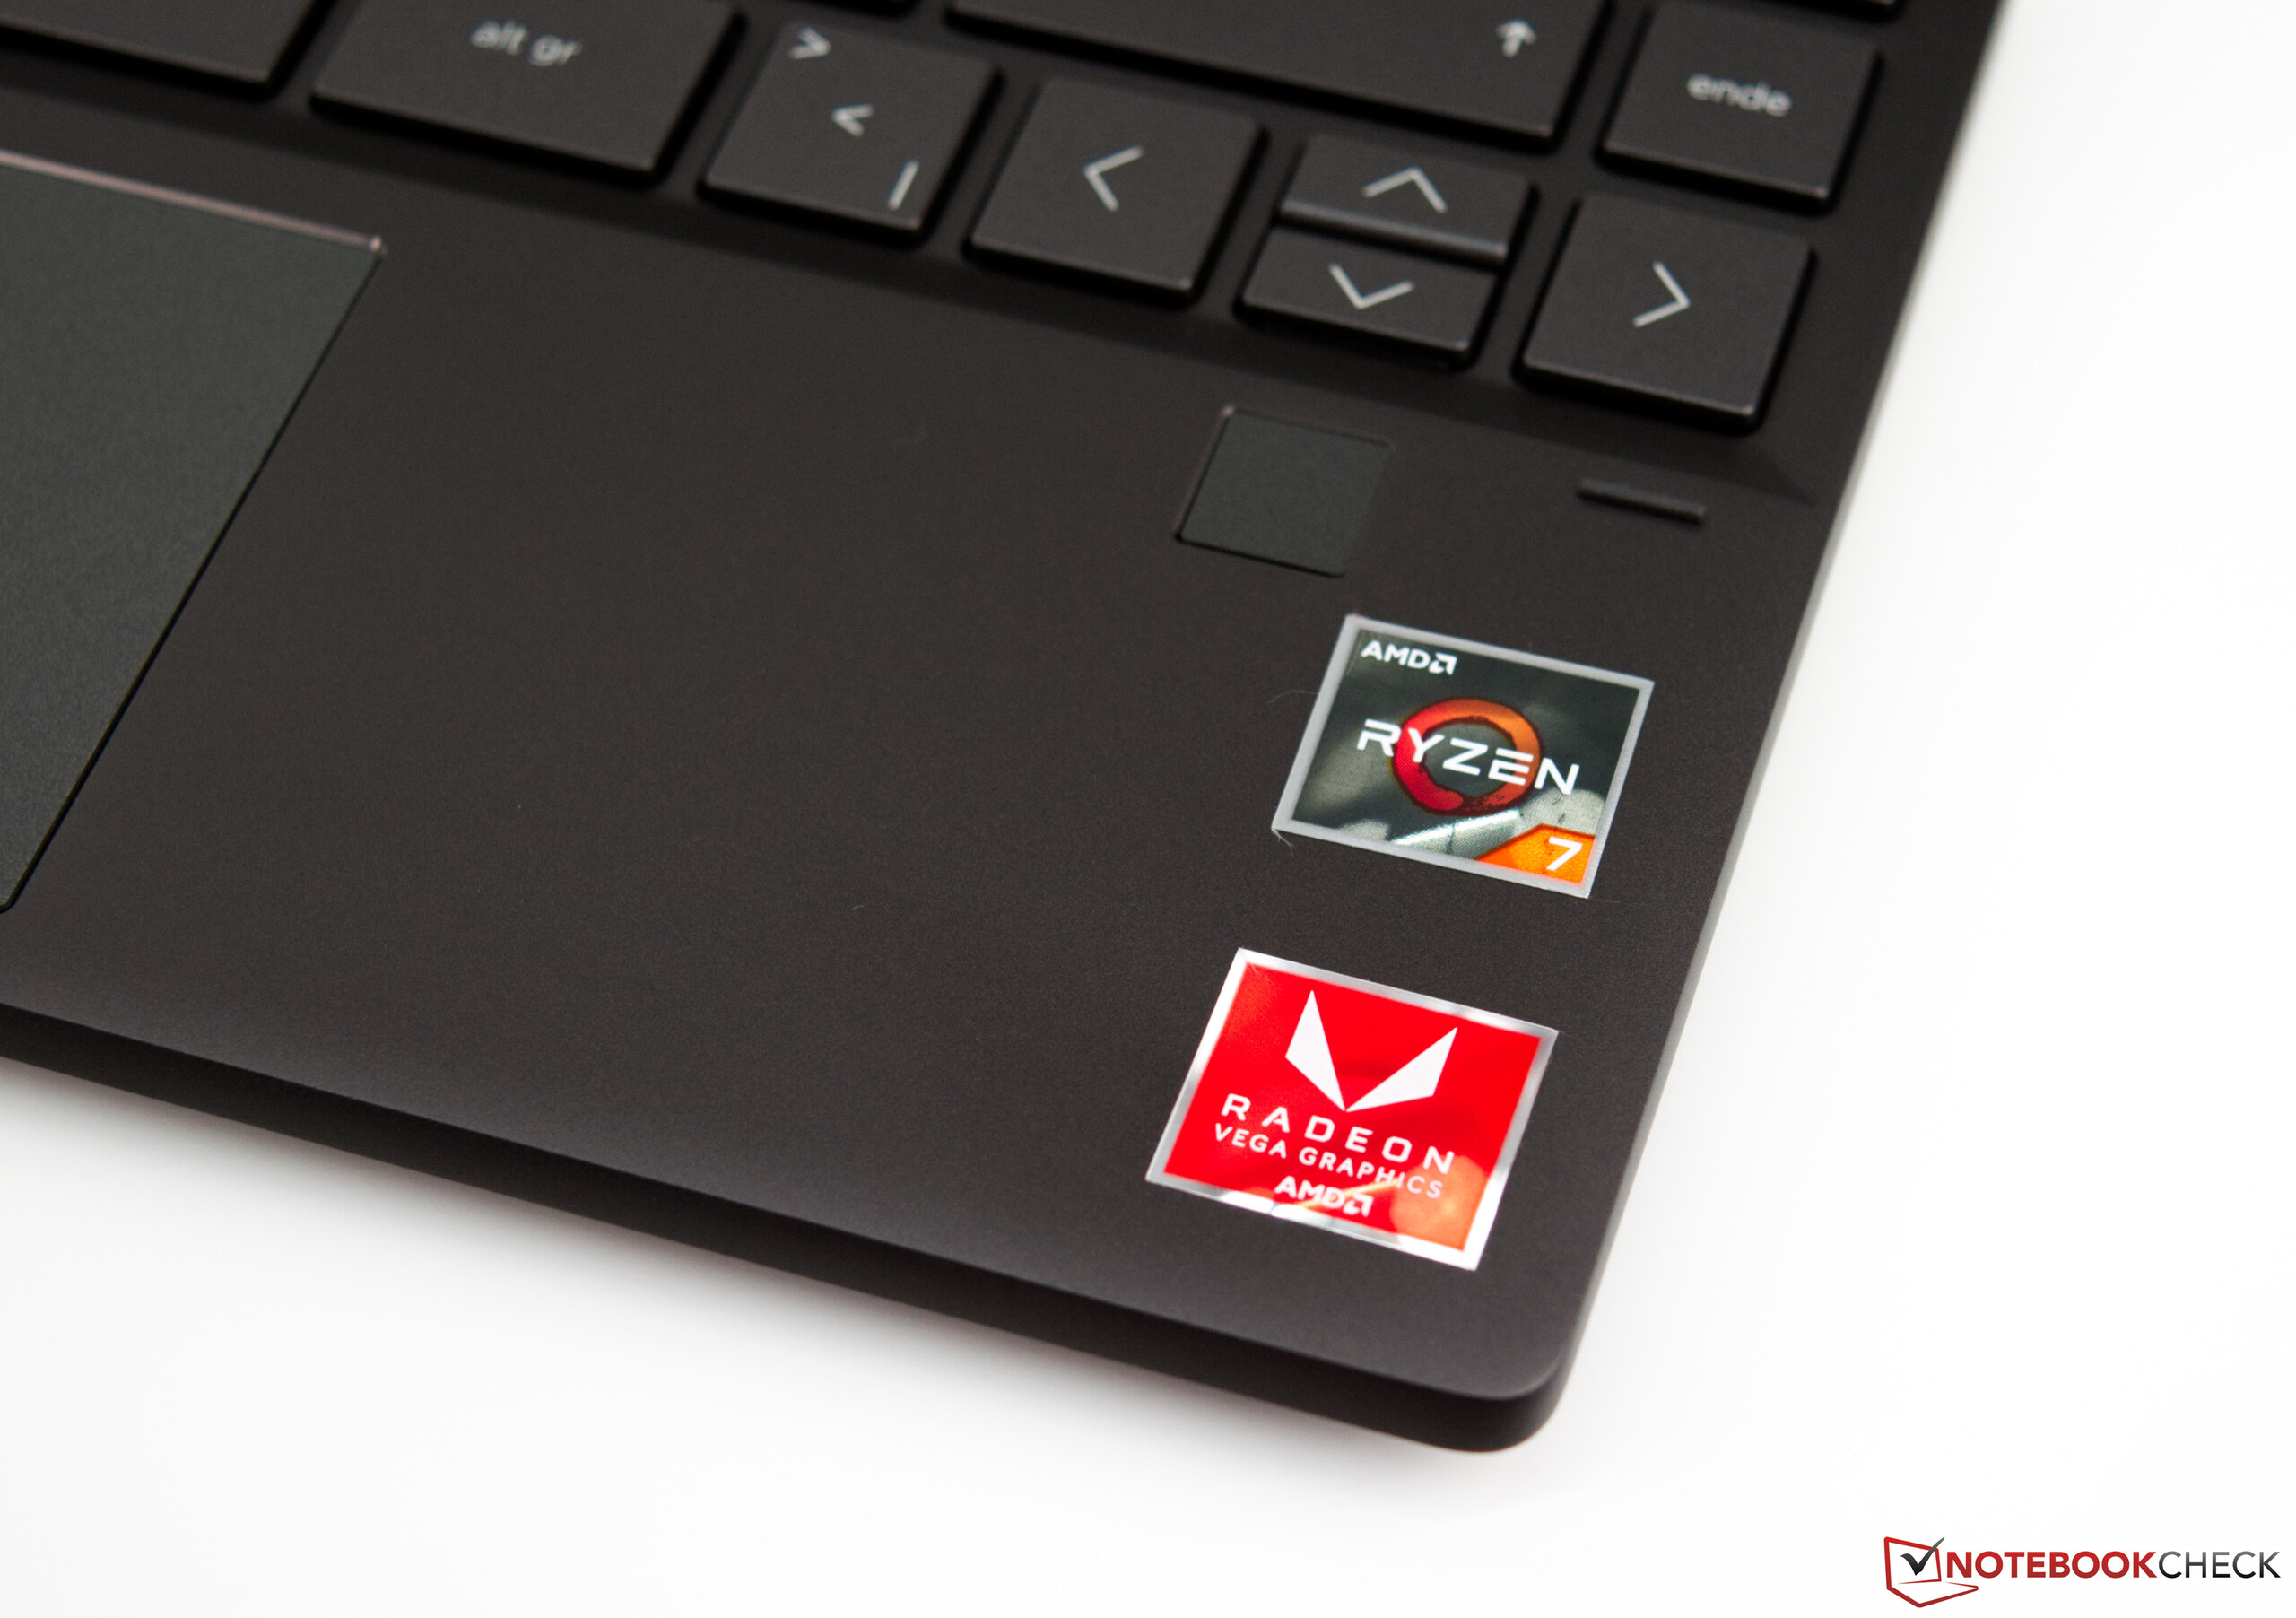
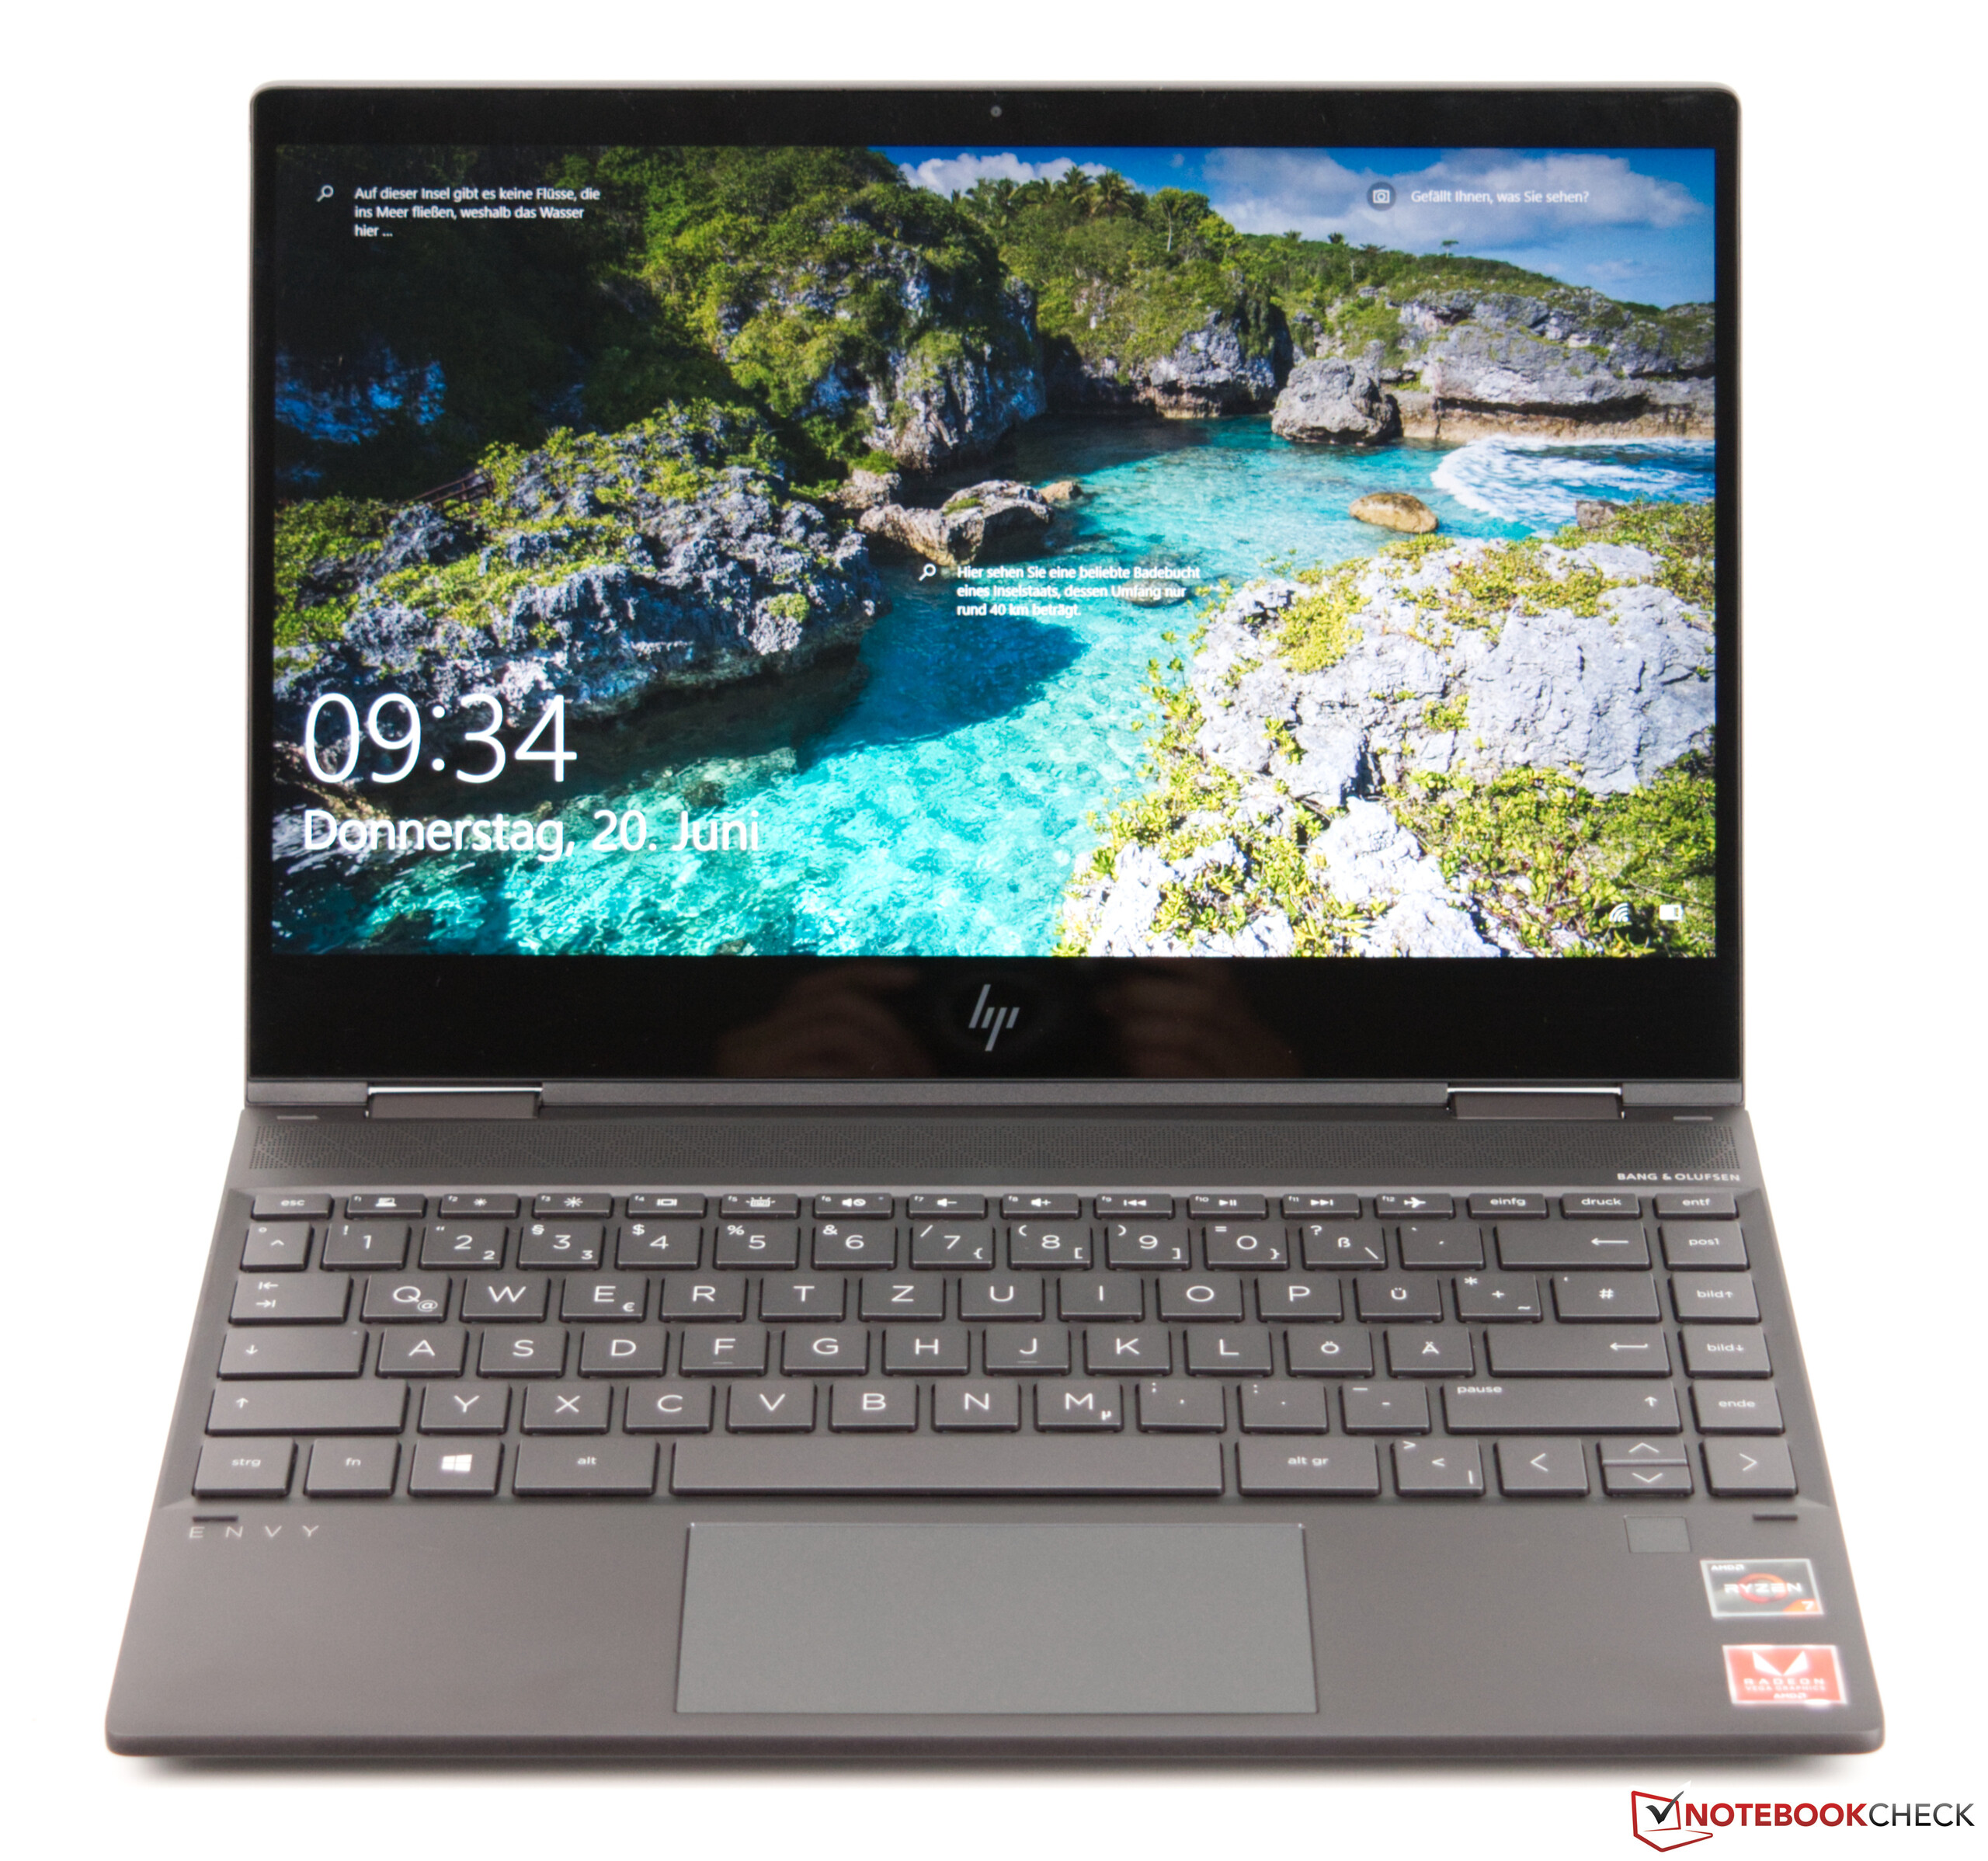
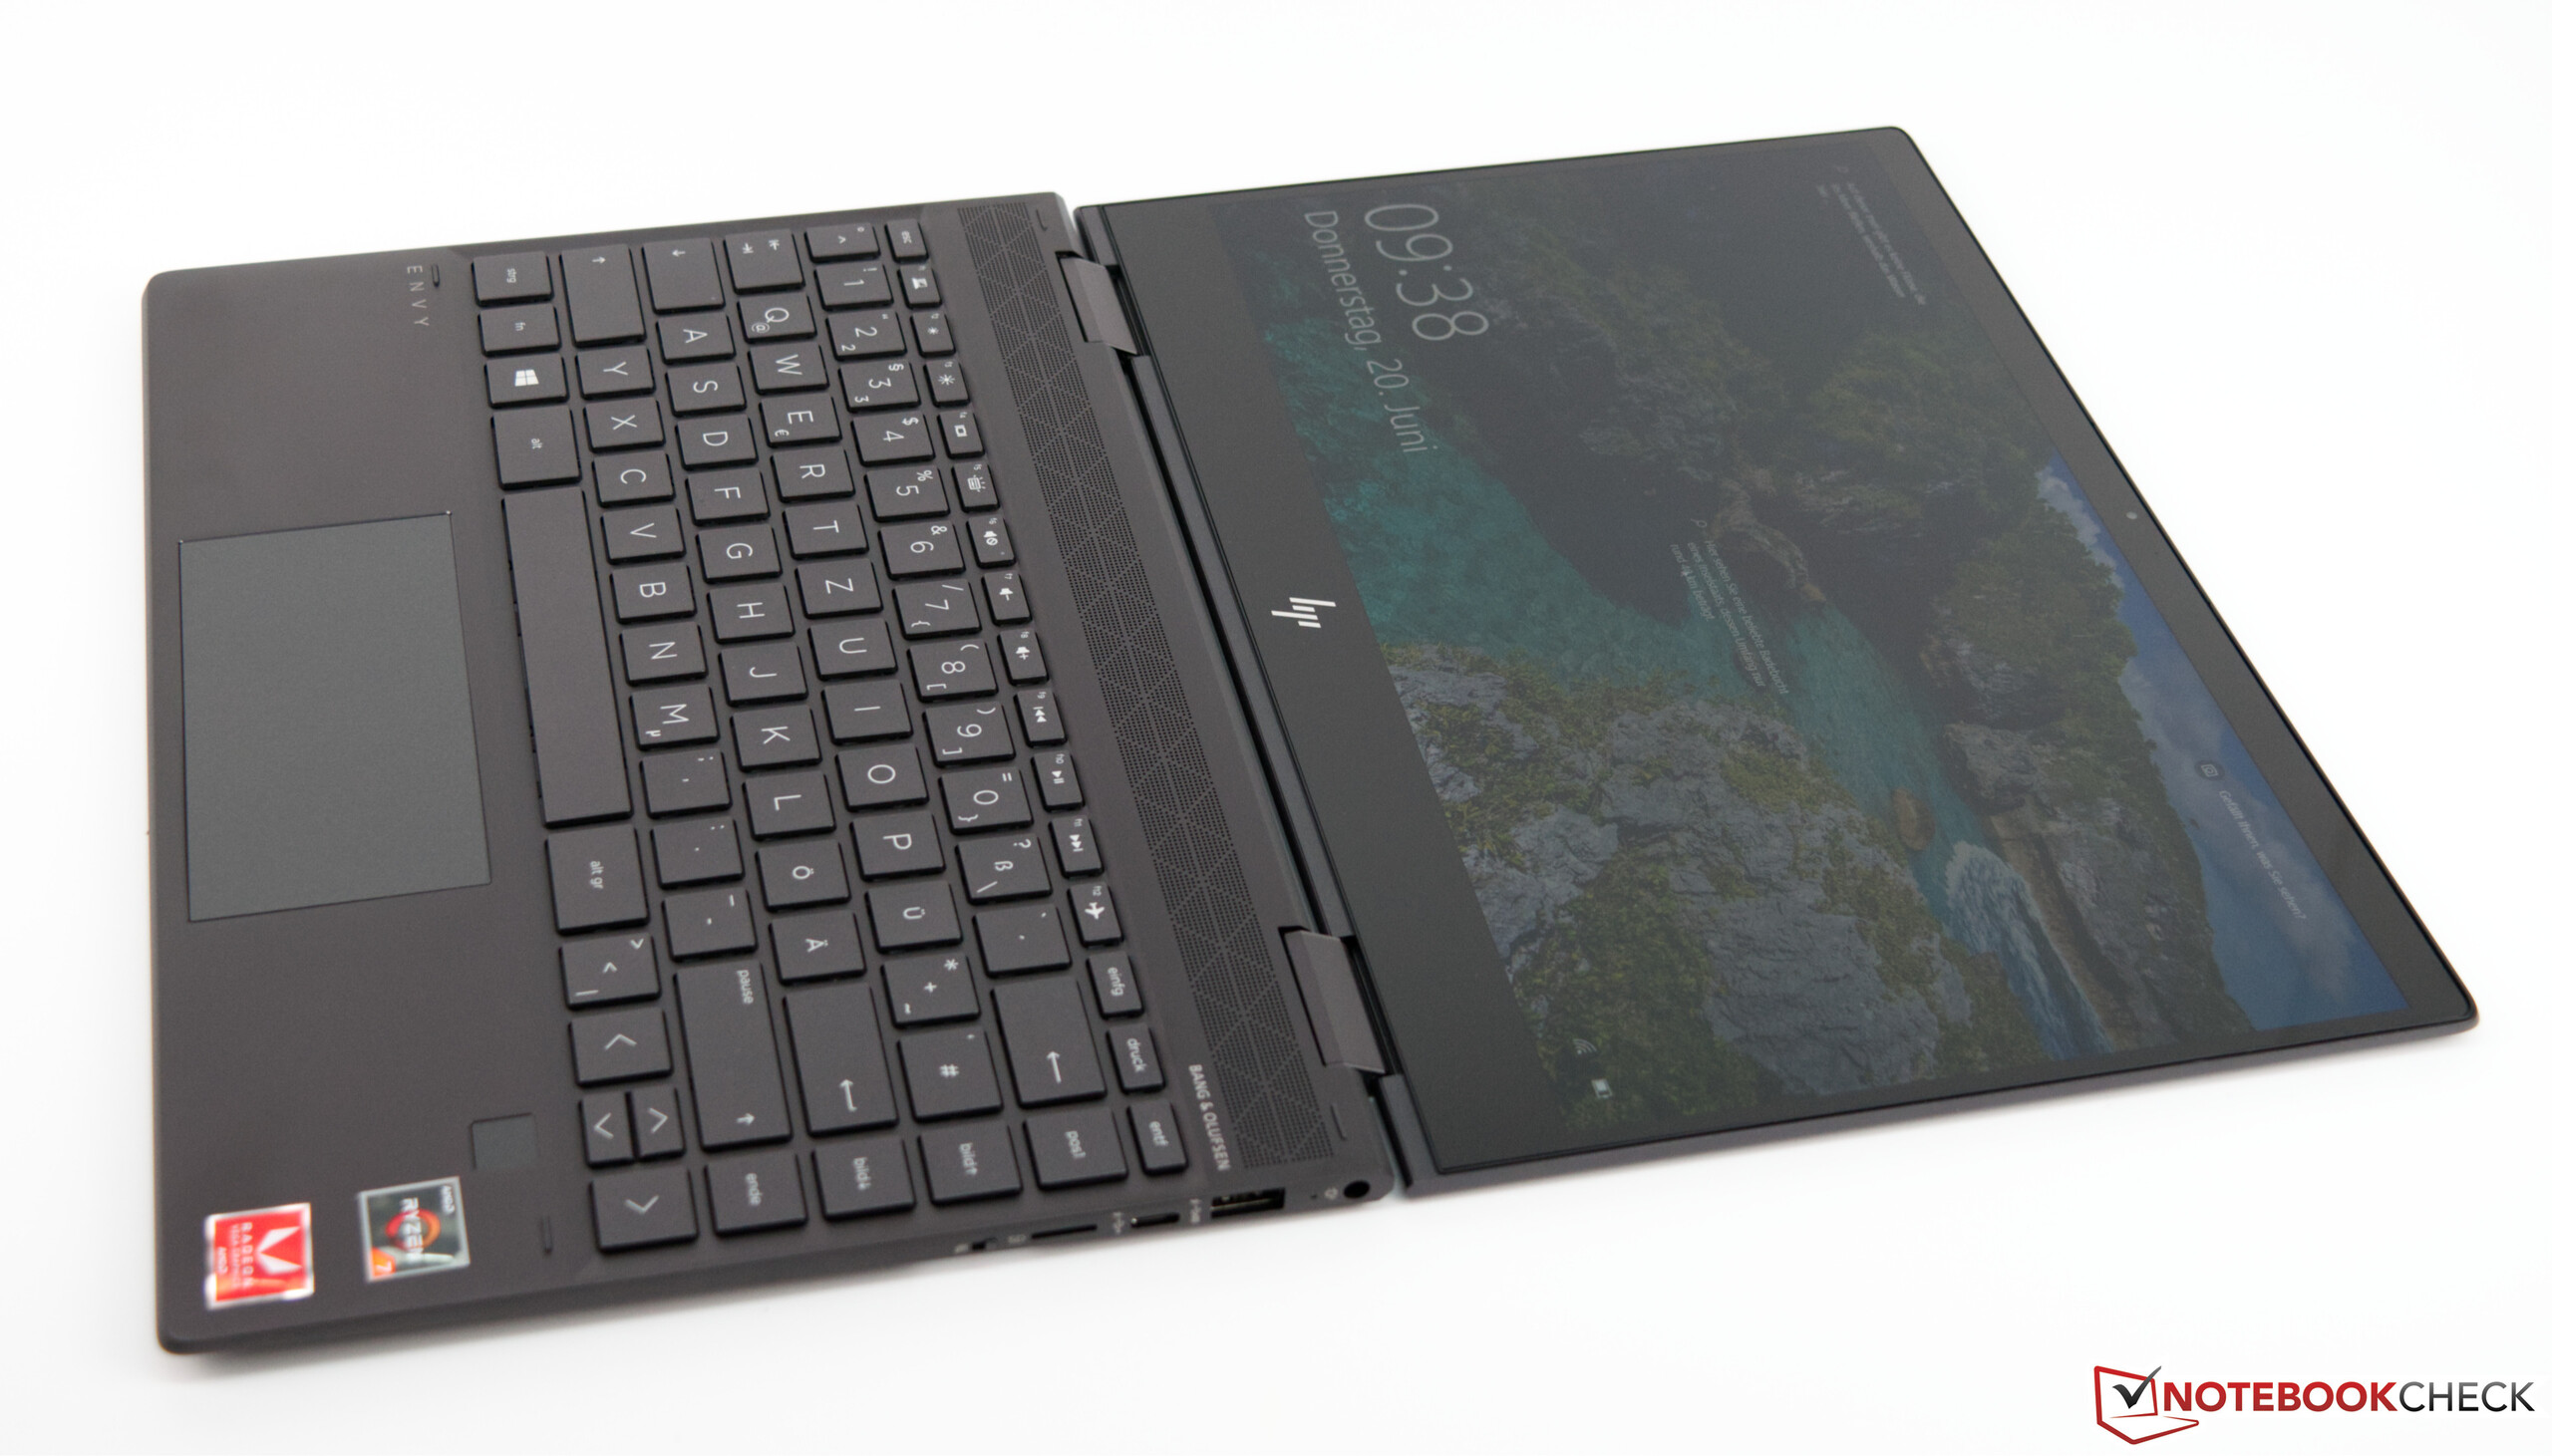
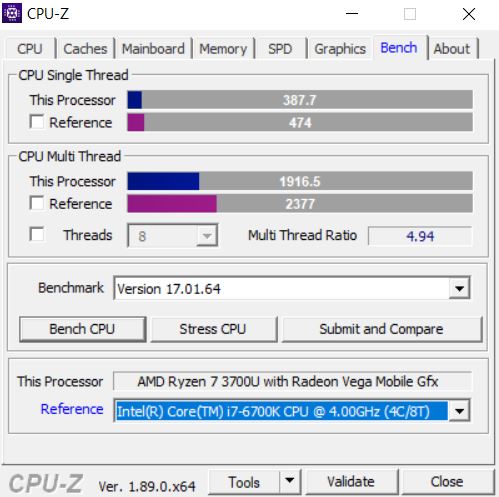
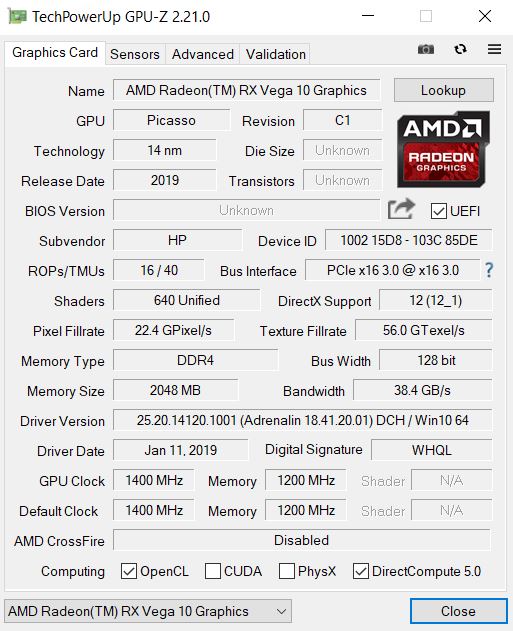
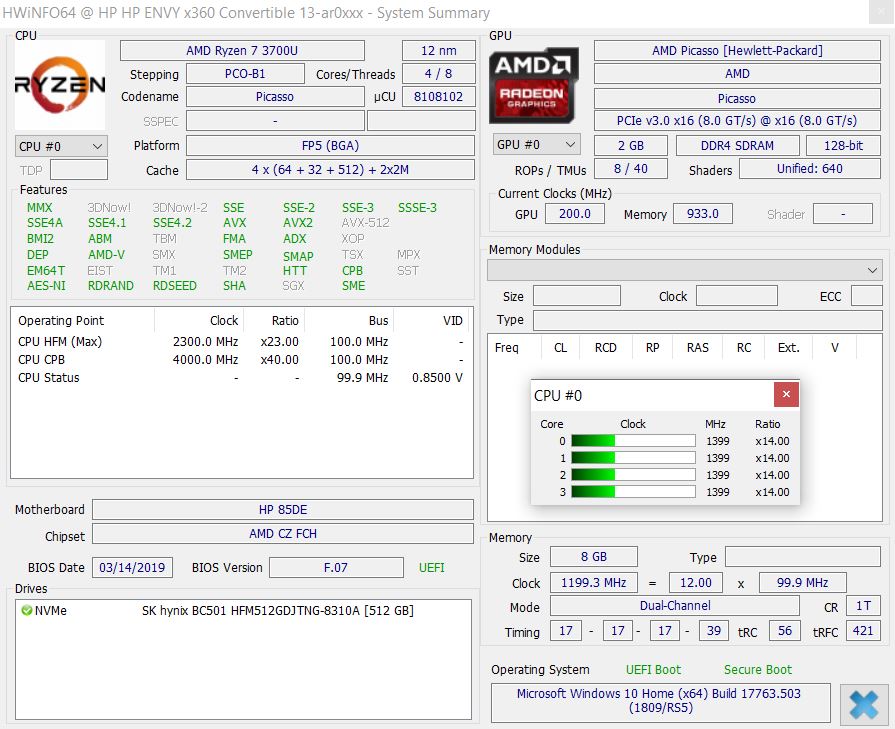
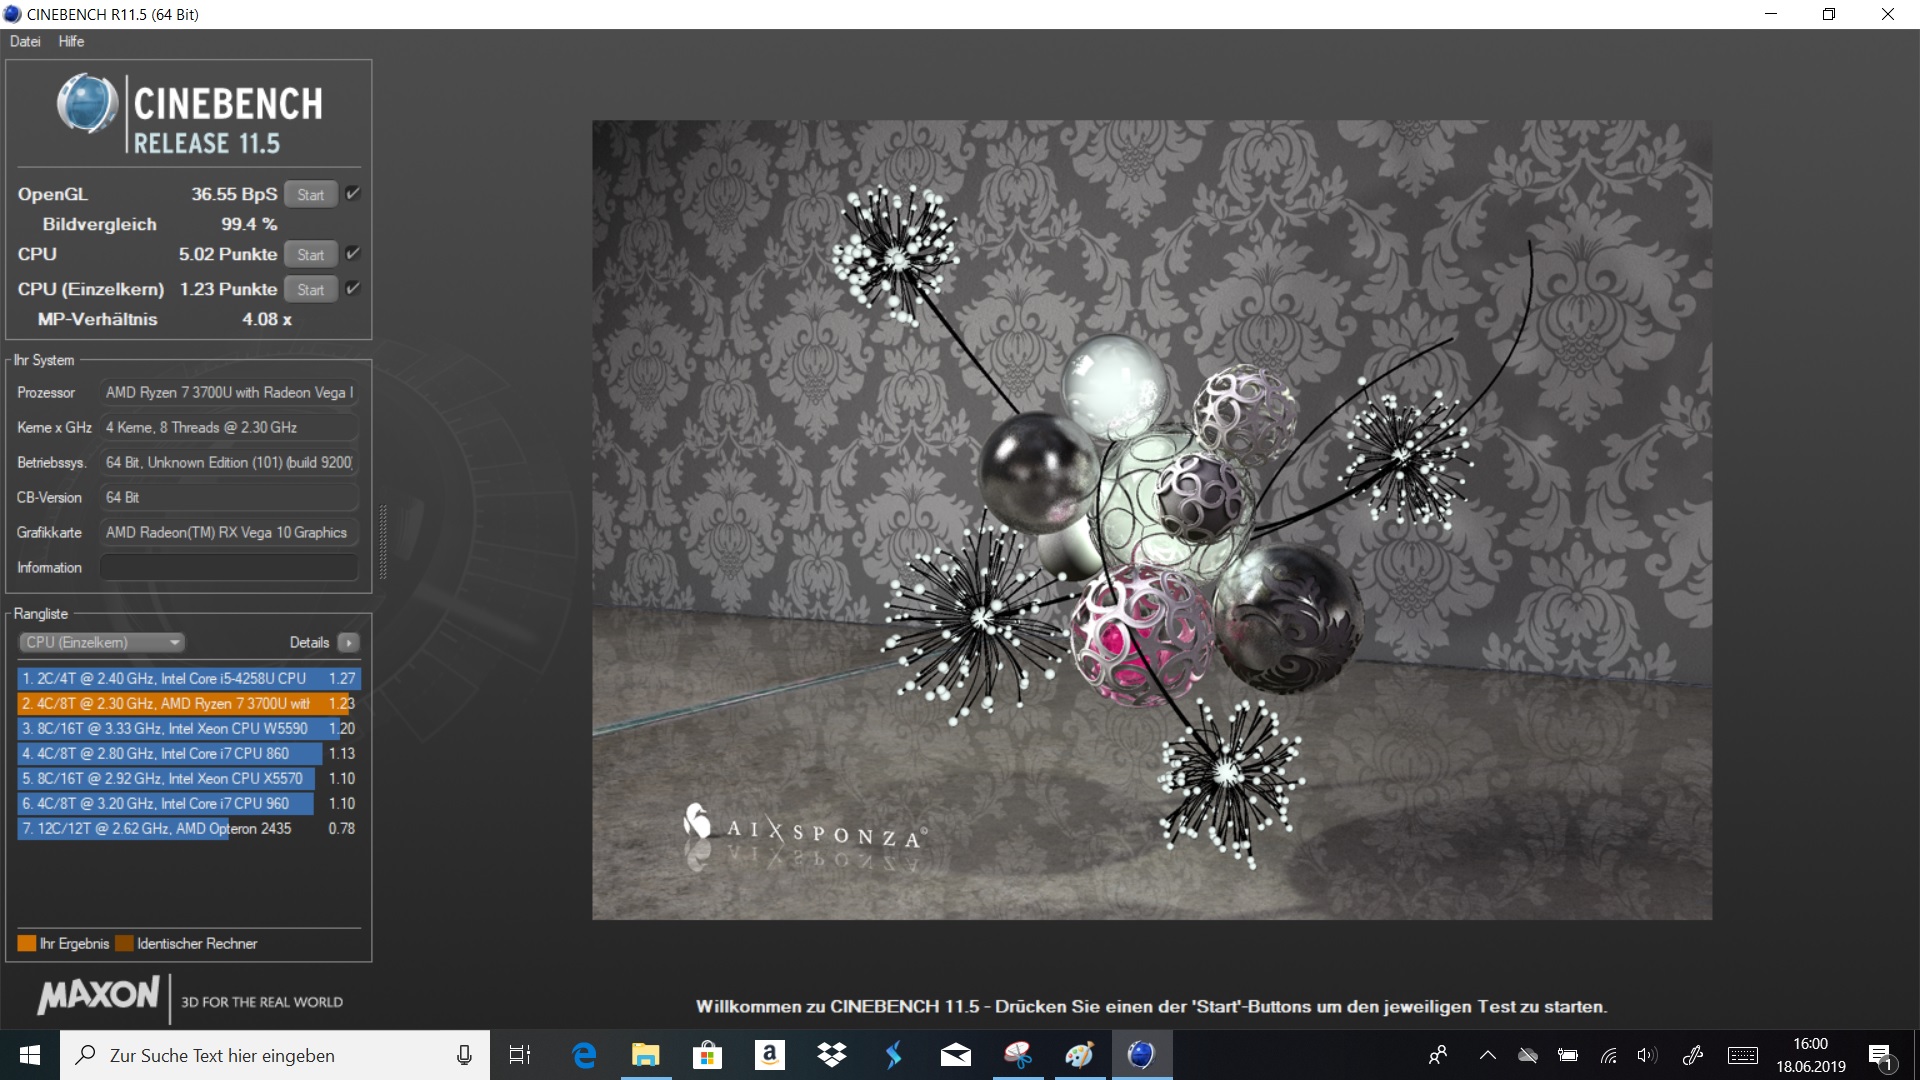
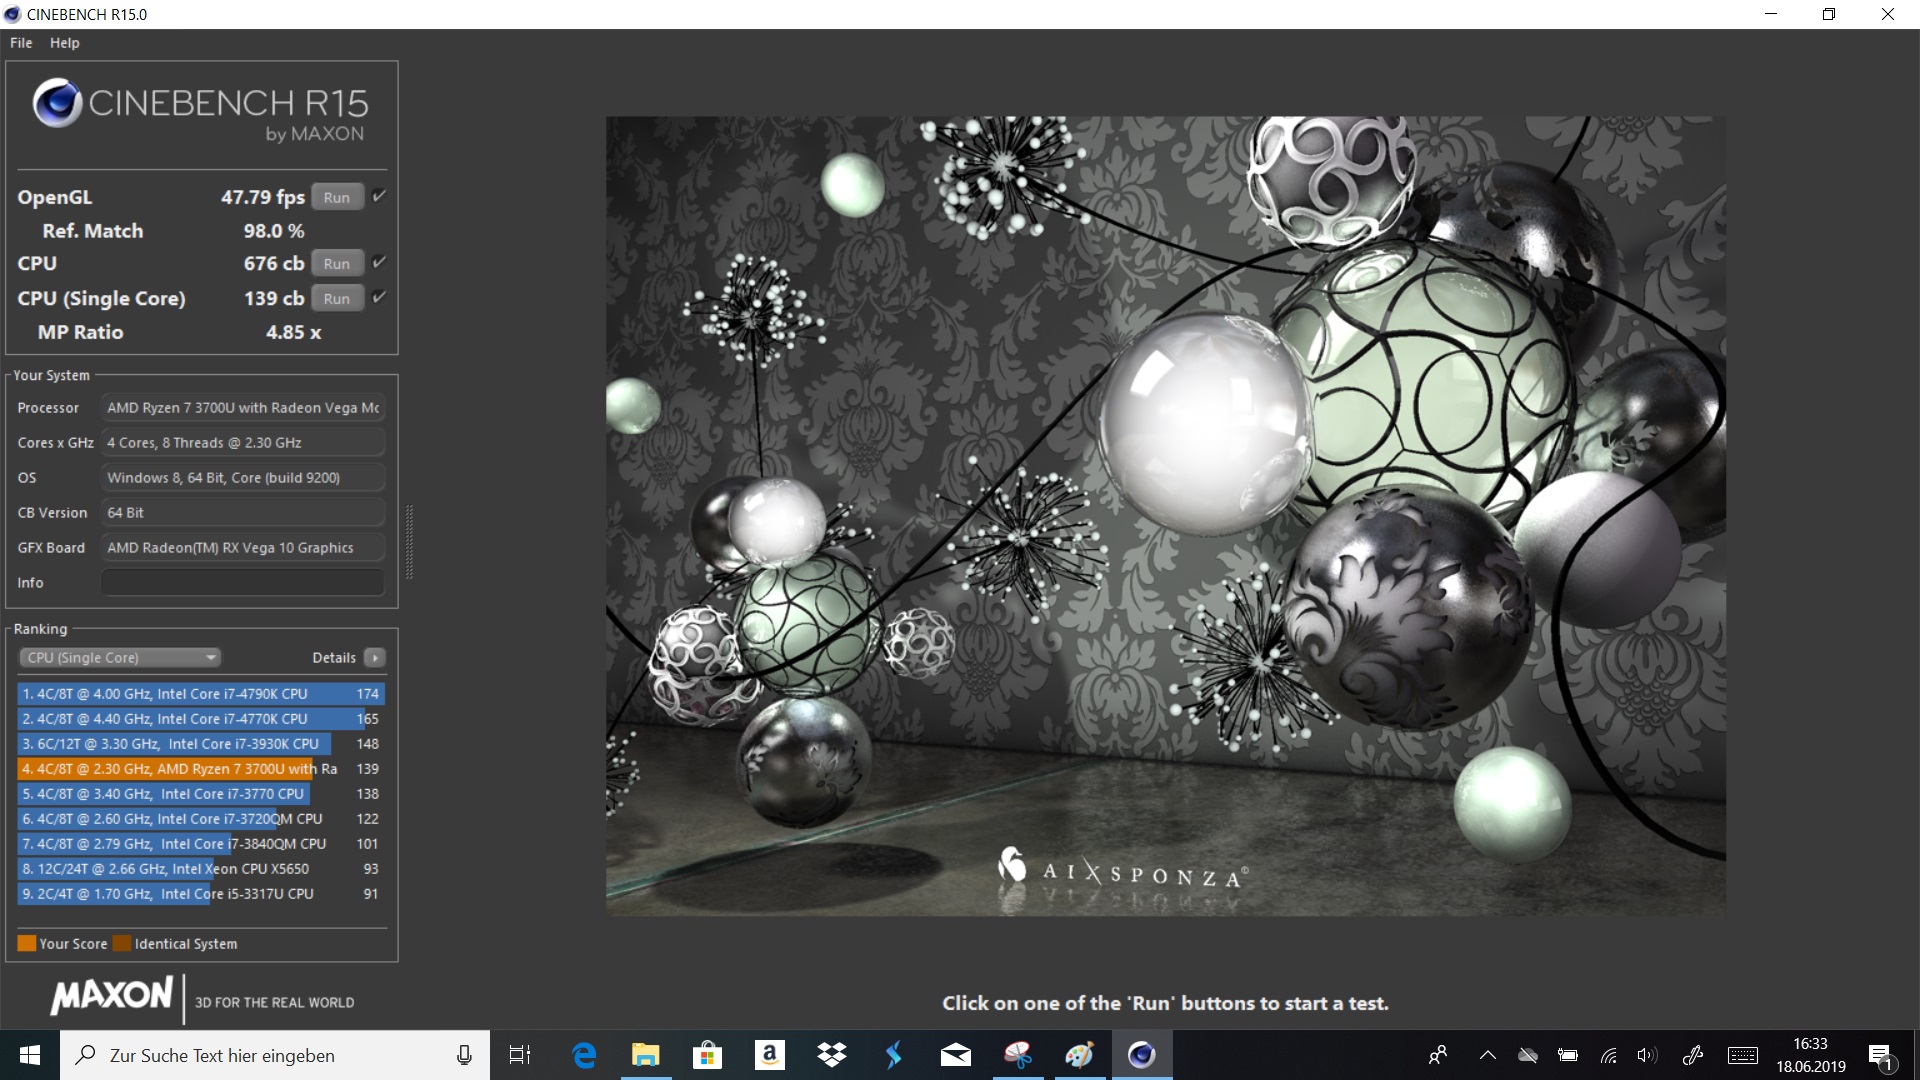
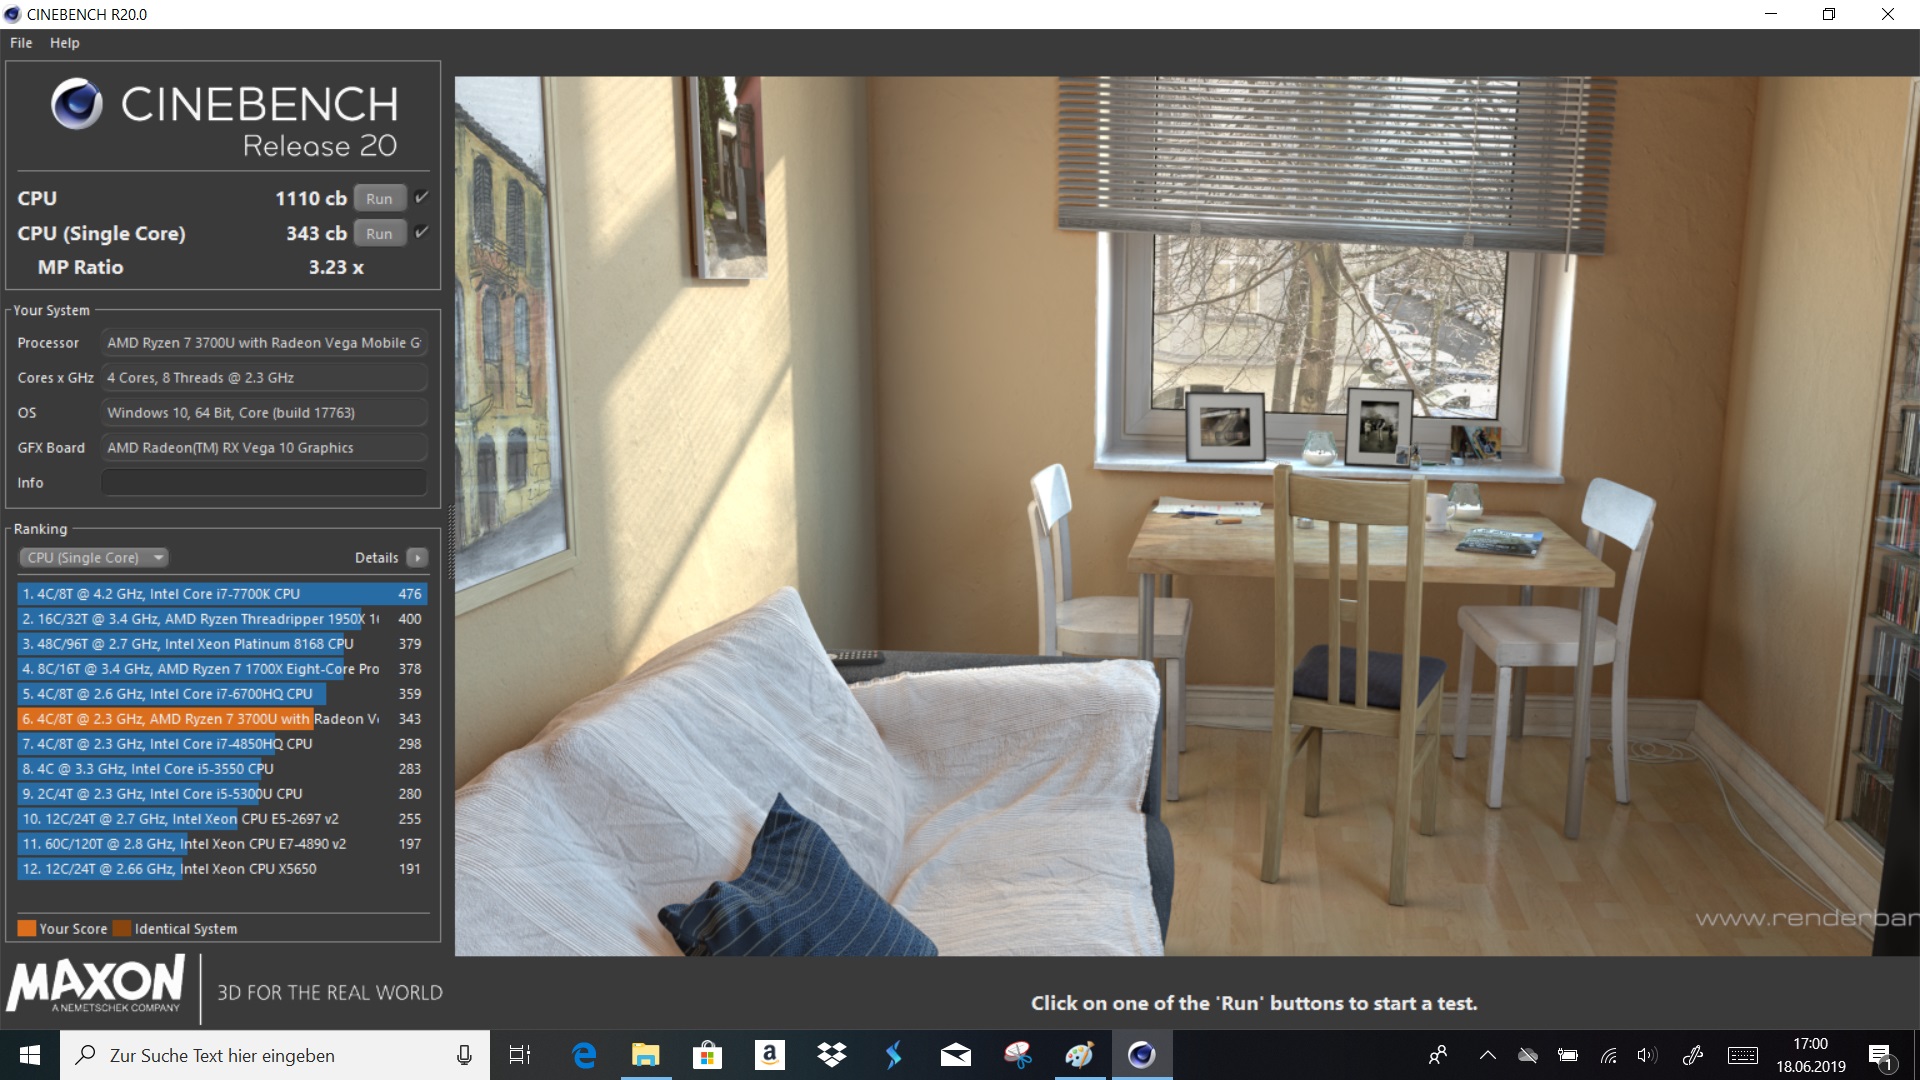
Le HP Envy x360 13 est un convertible abordable à moins de 1000 €. Avec son AMD Ryzen 7 3700U et son AMD Radeon RX Vega 10, le 2-en-1 est assez performant au quotidien. Il est également possible de jouer fluidement à d’anciens jeux avec l’iGPU et le SoC AMD. Après tout, cette configuration est graphiquement plus performante que celle des SoC Intel.
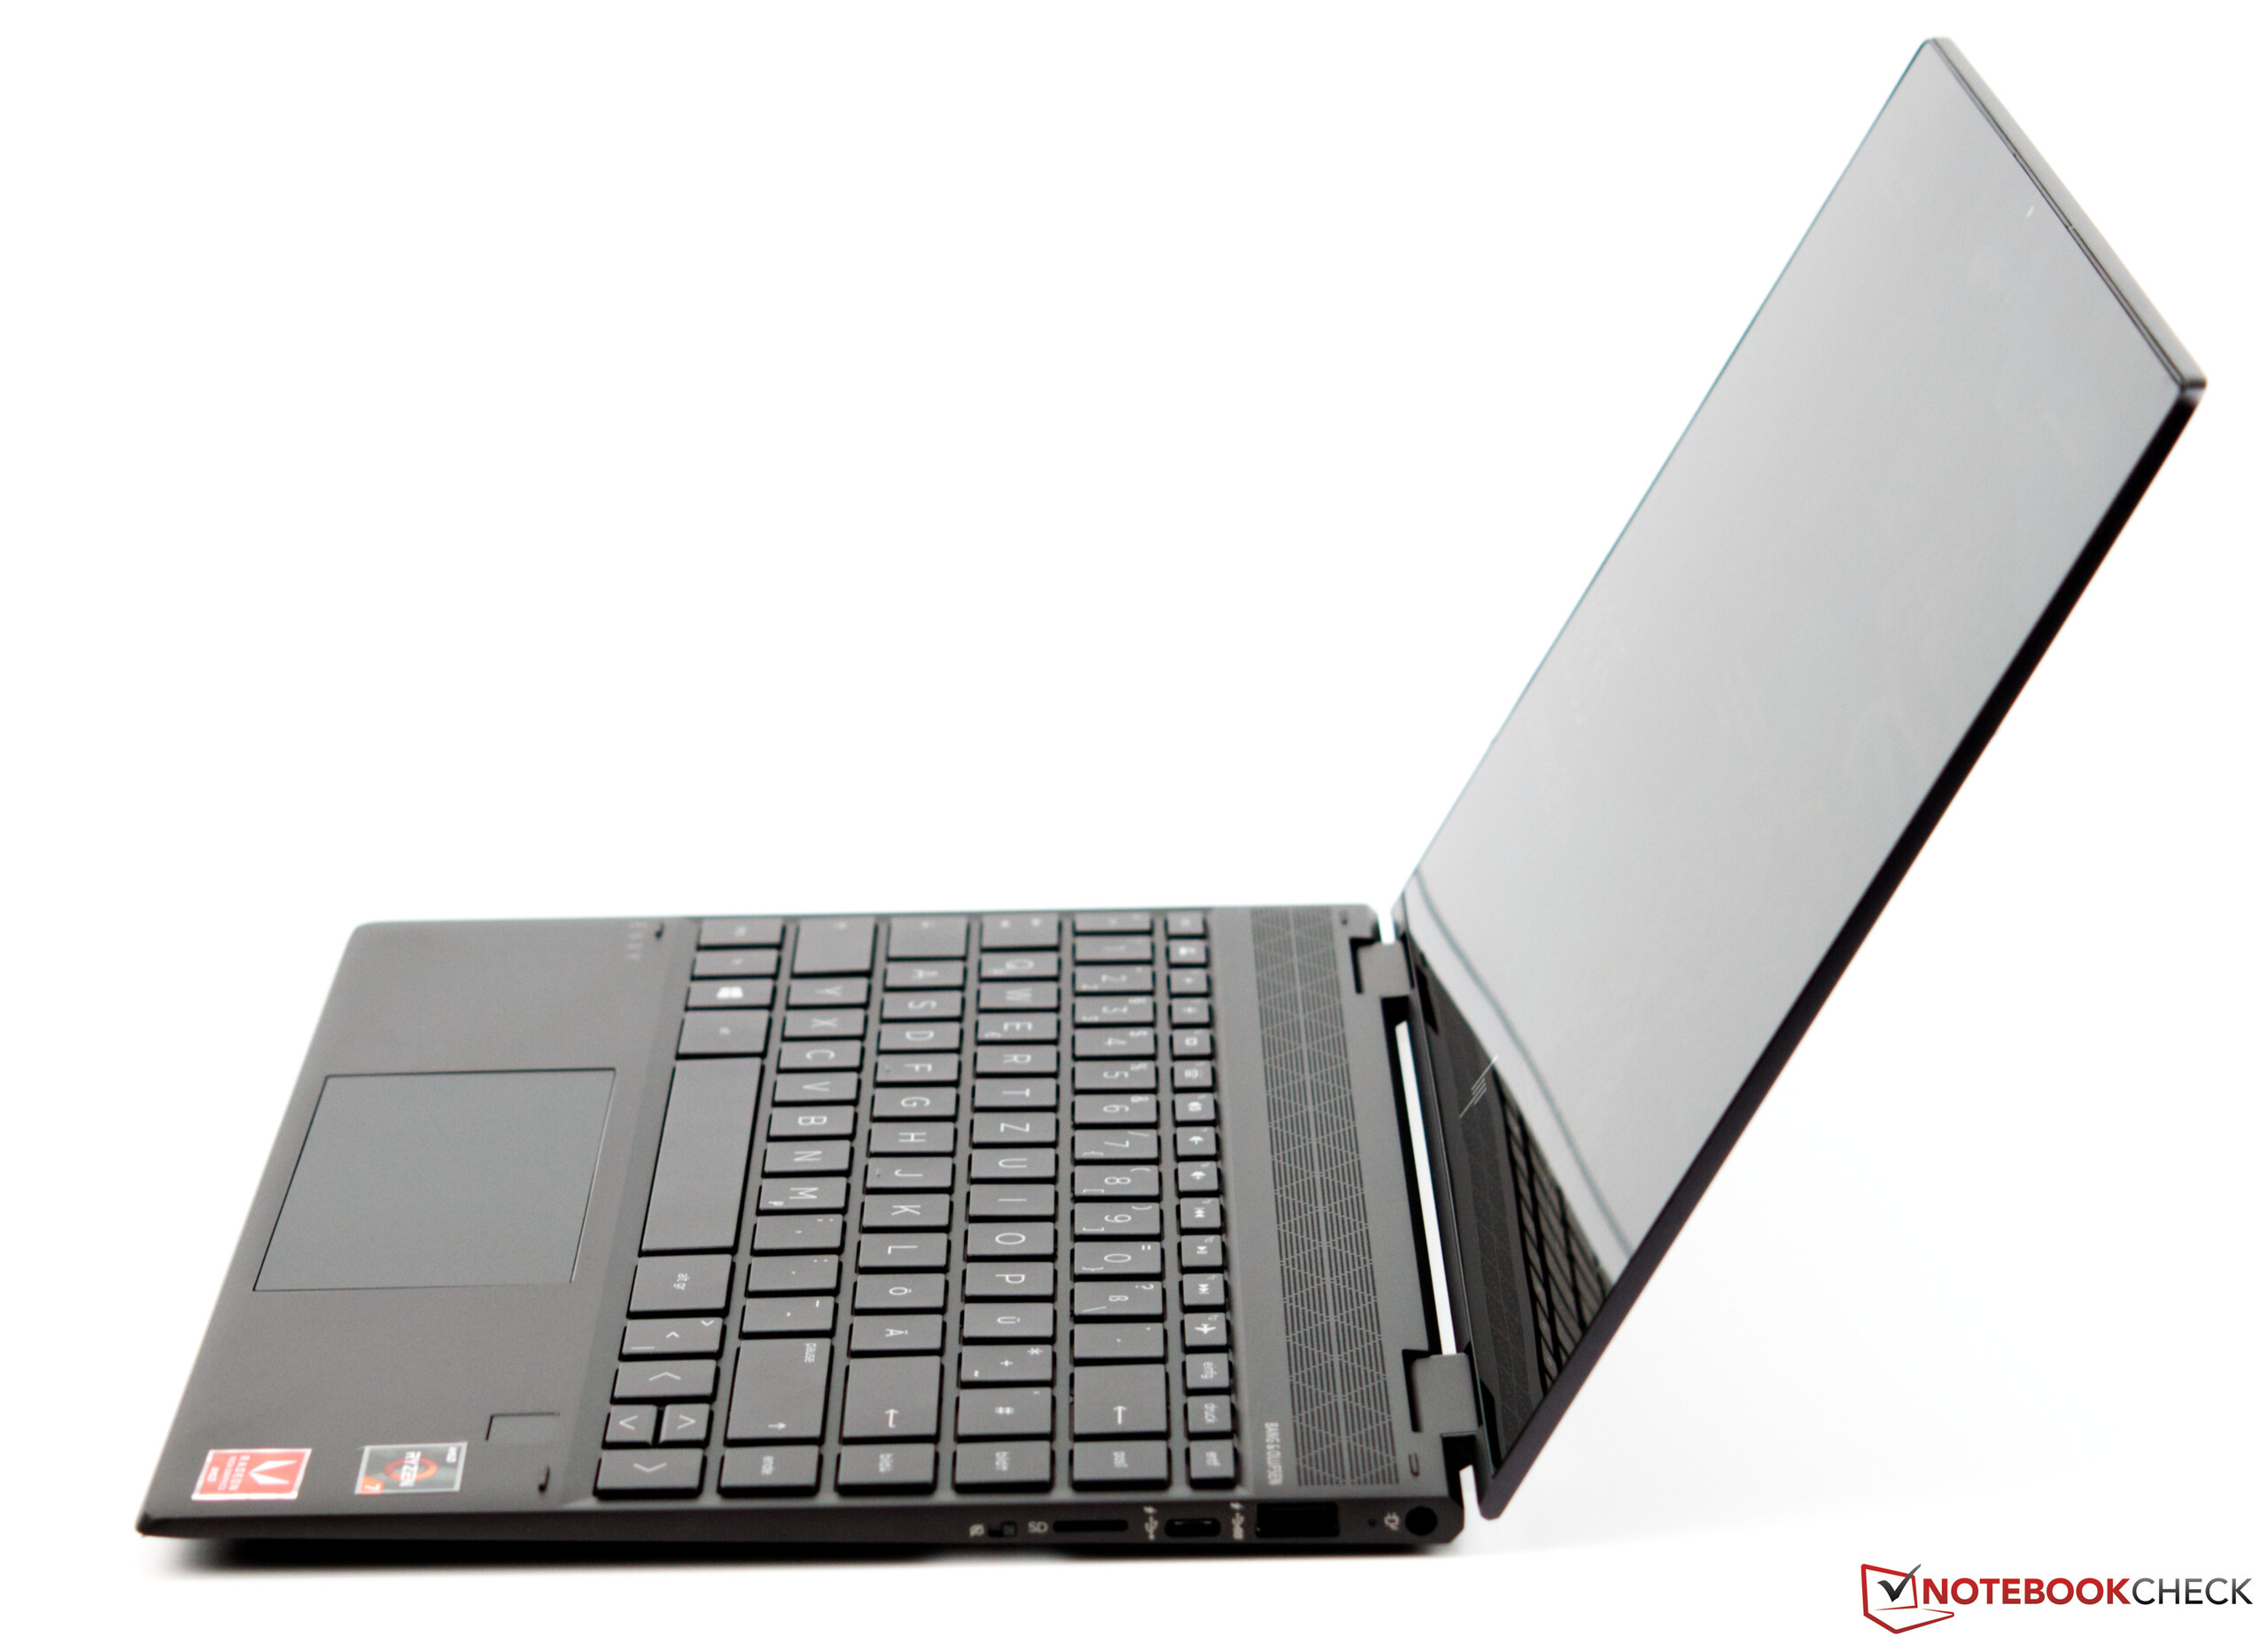
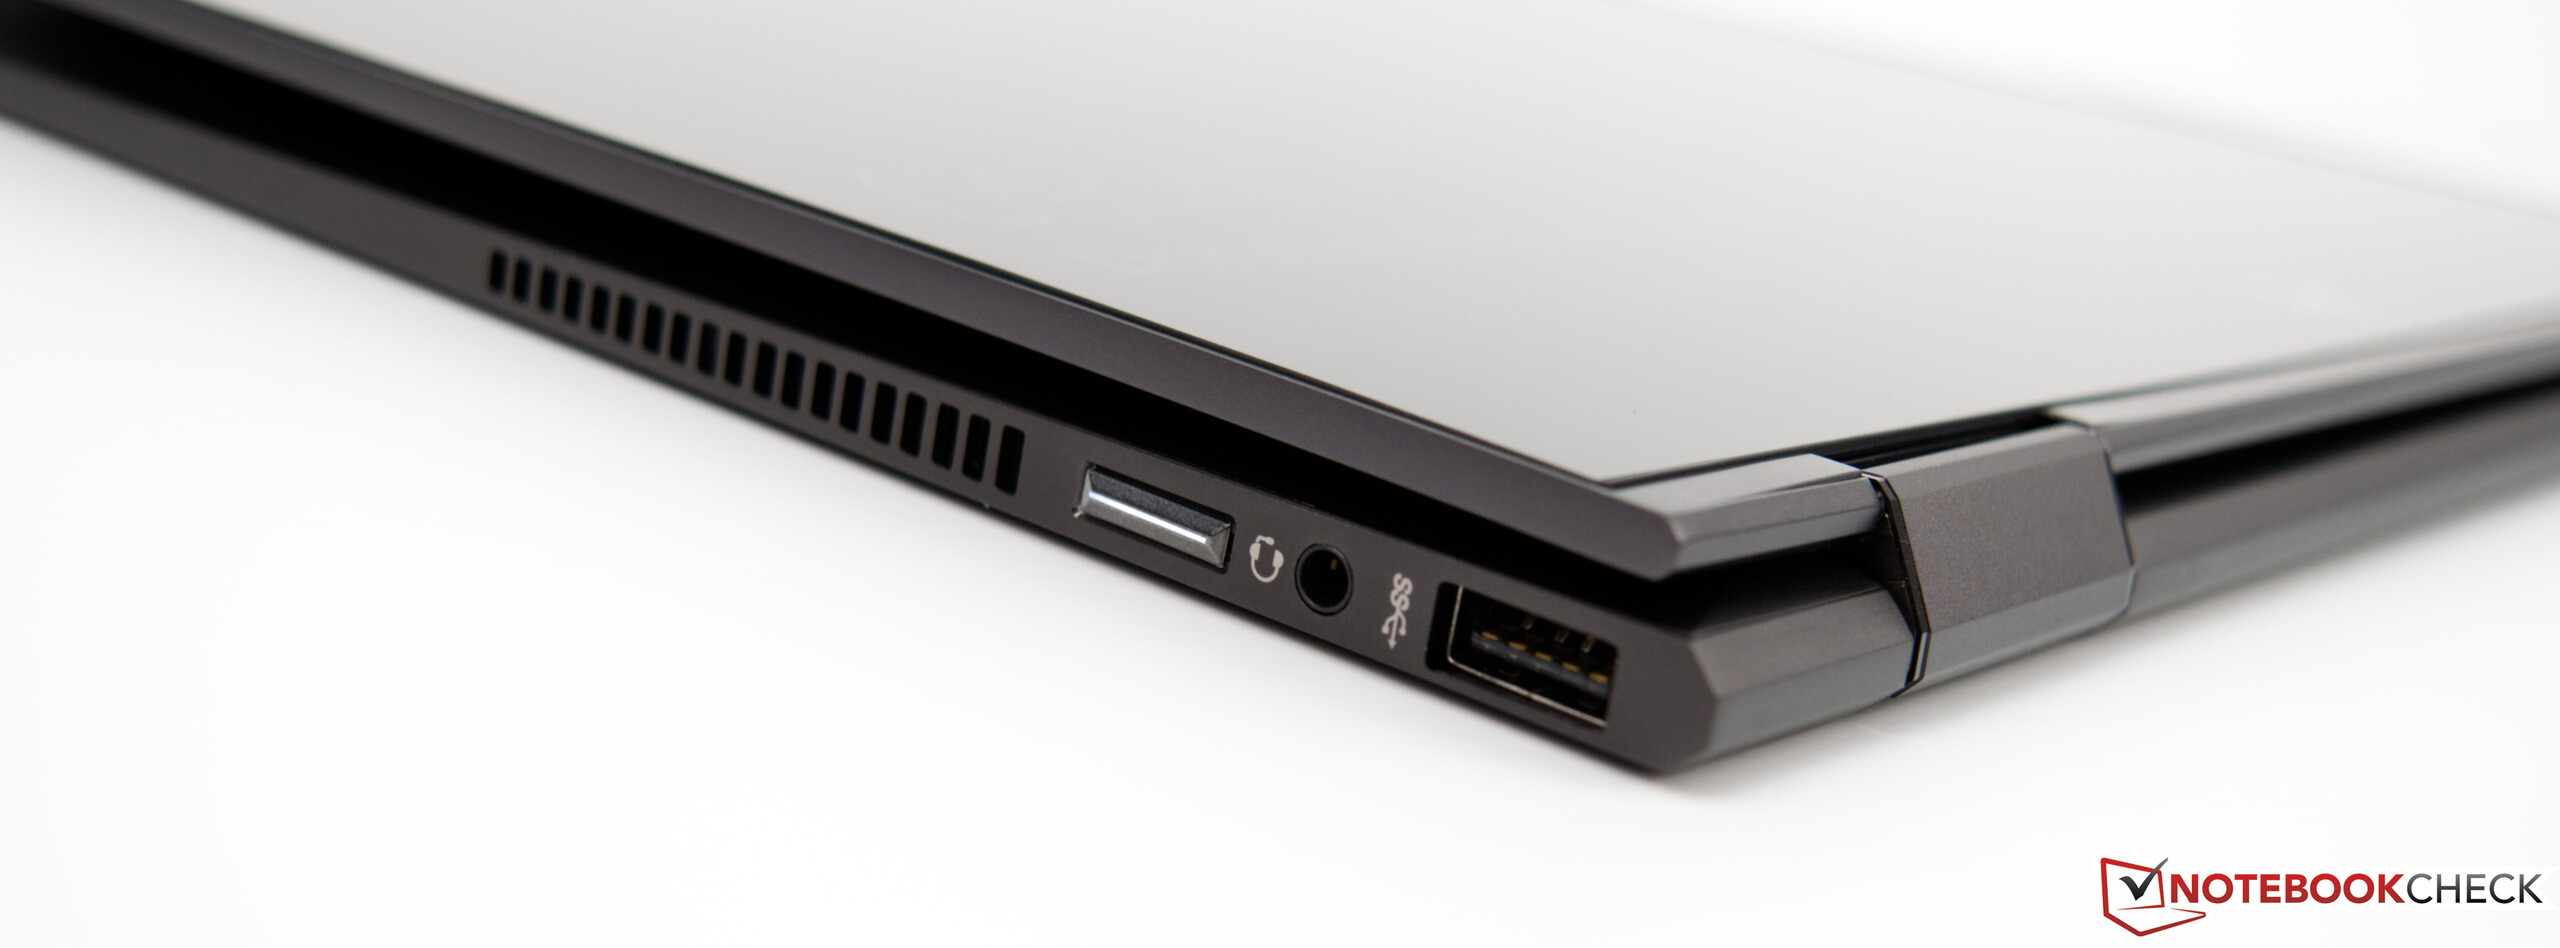
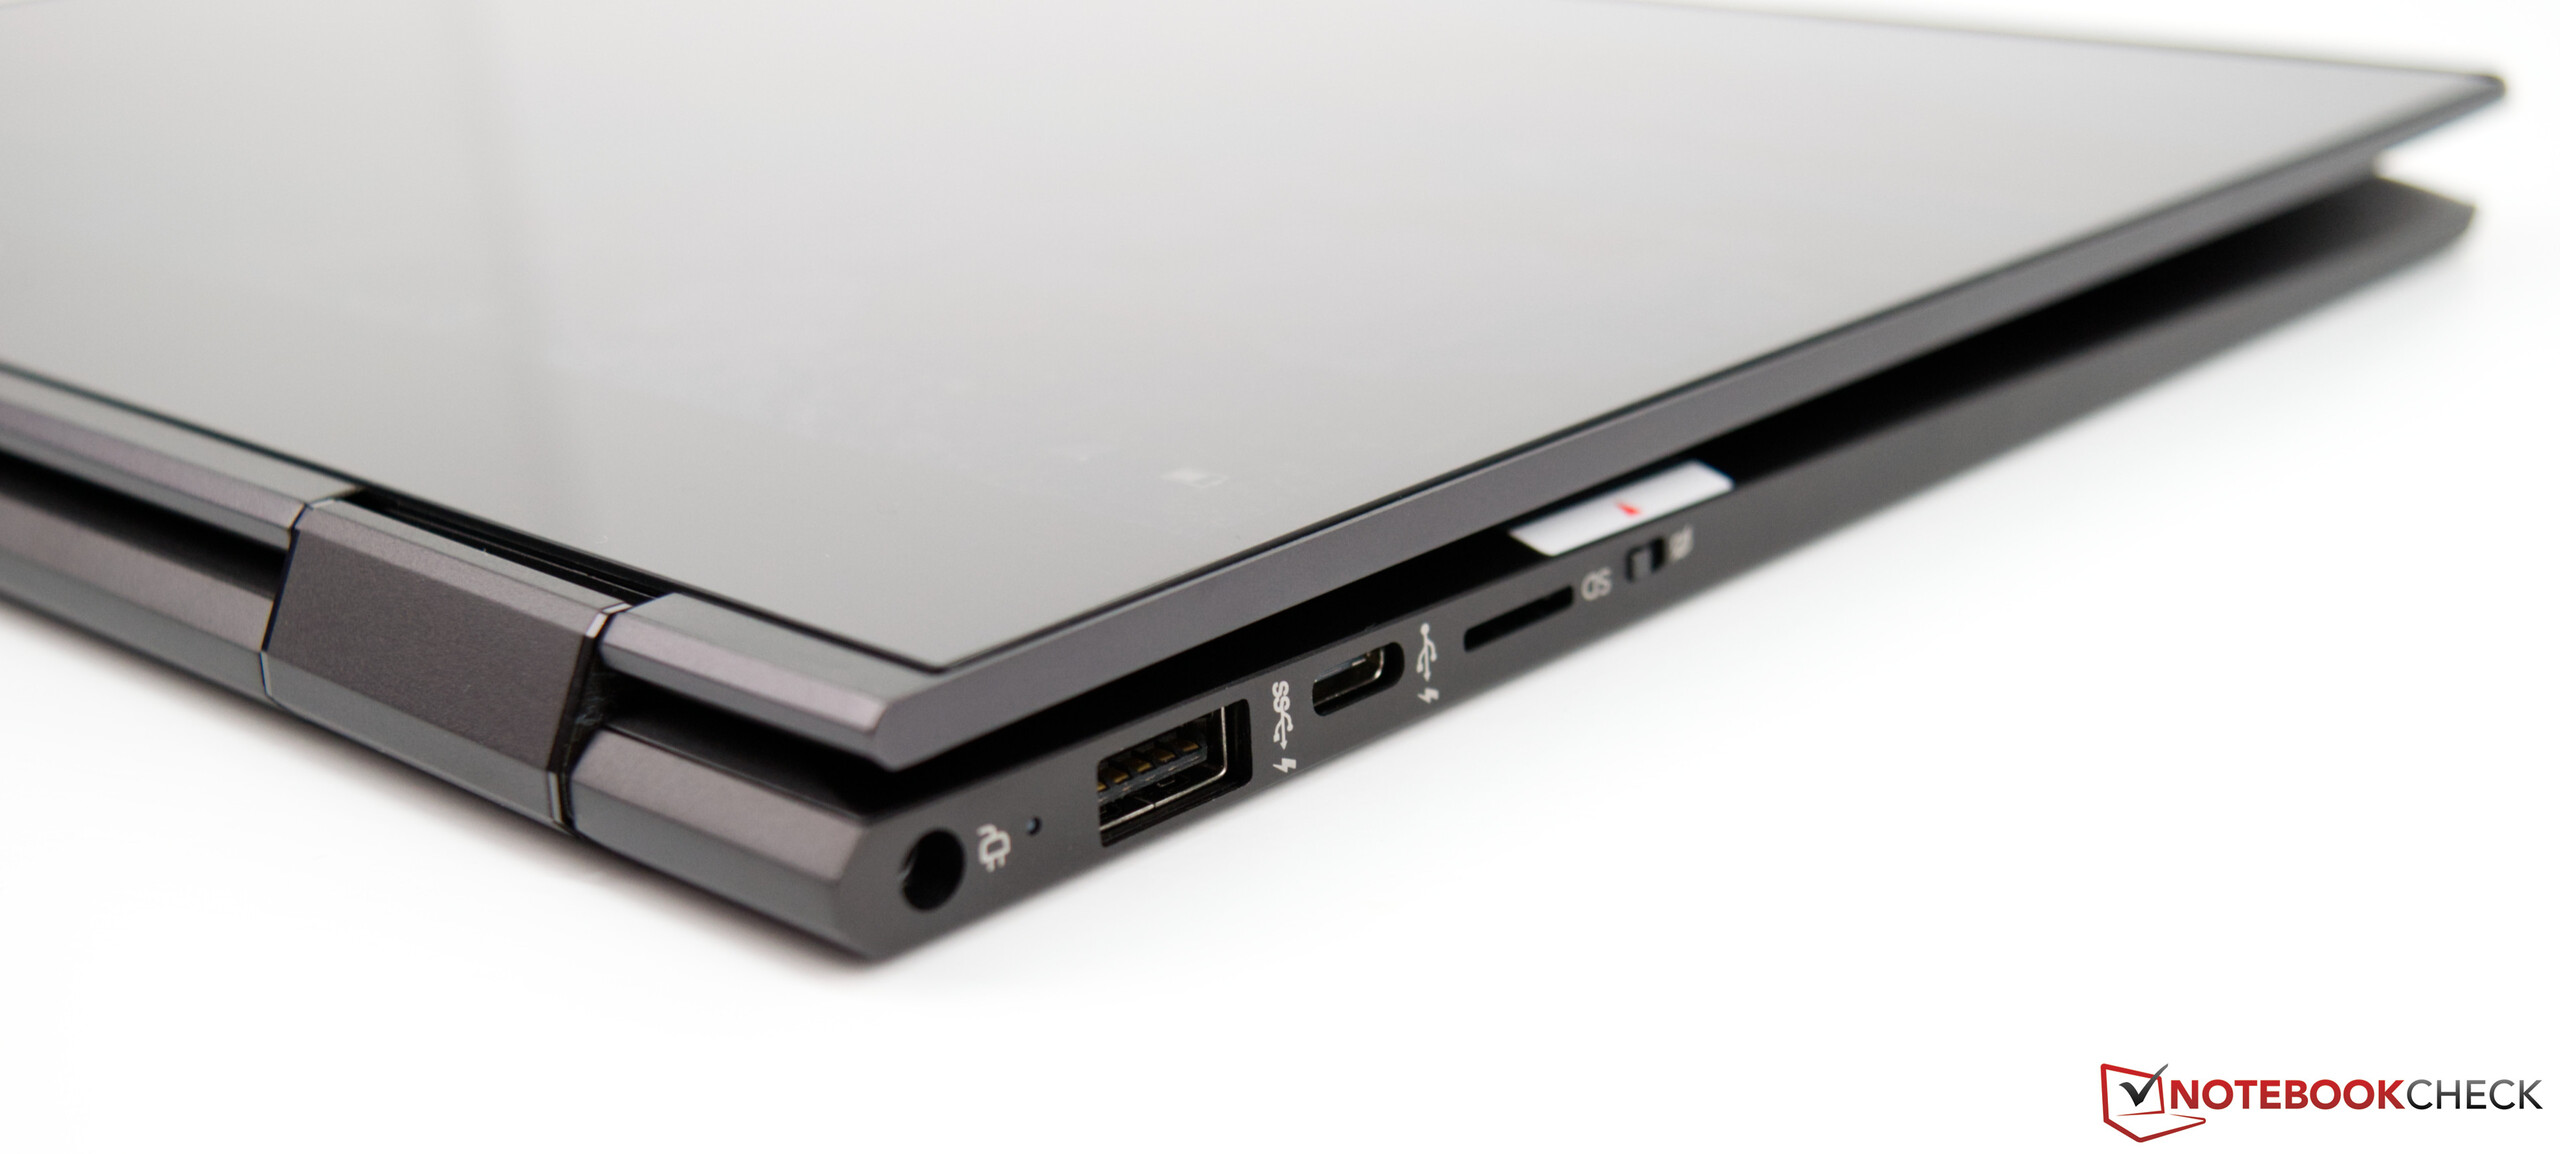
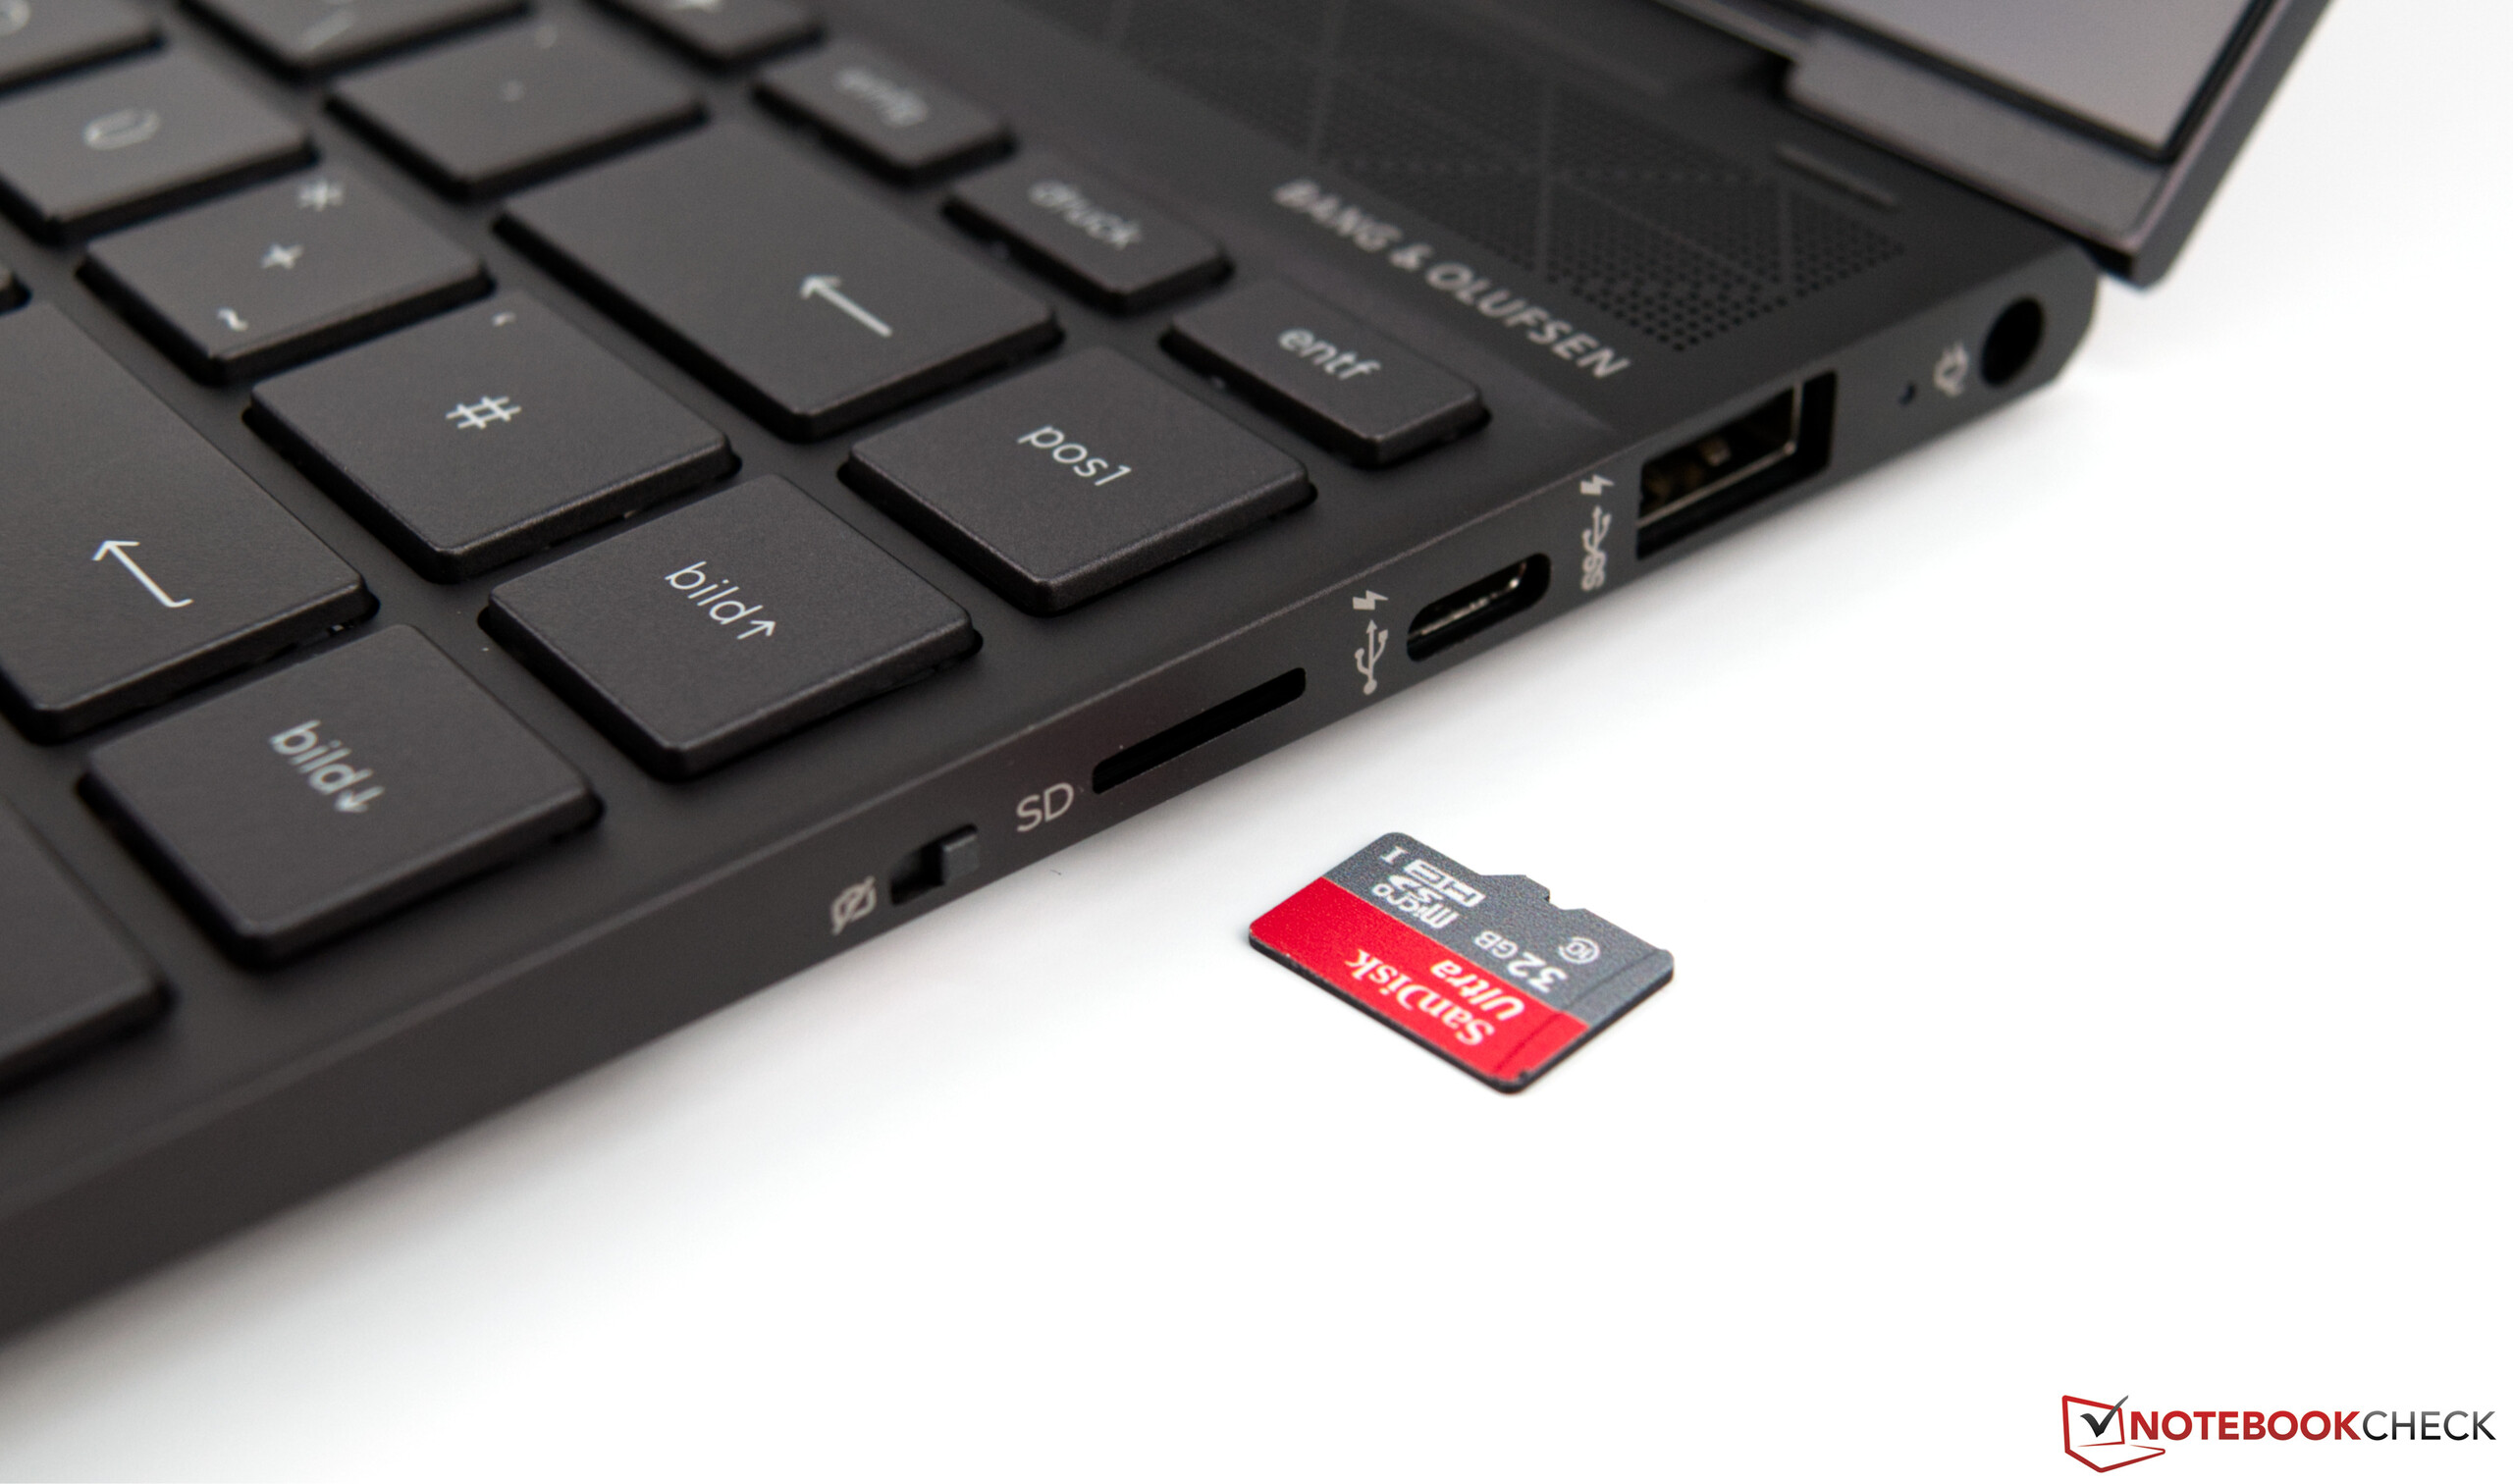
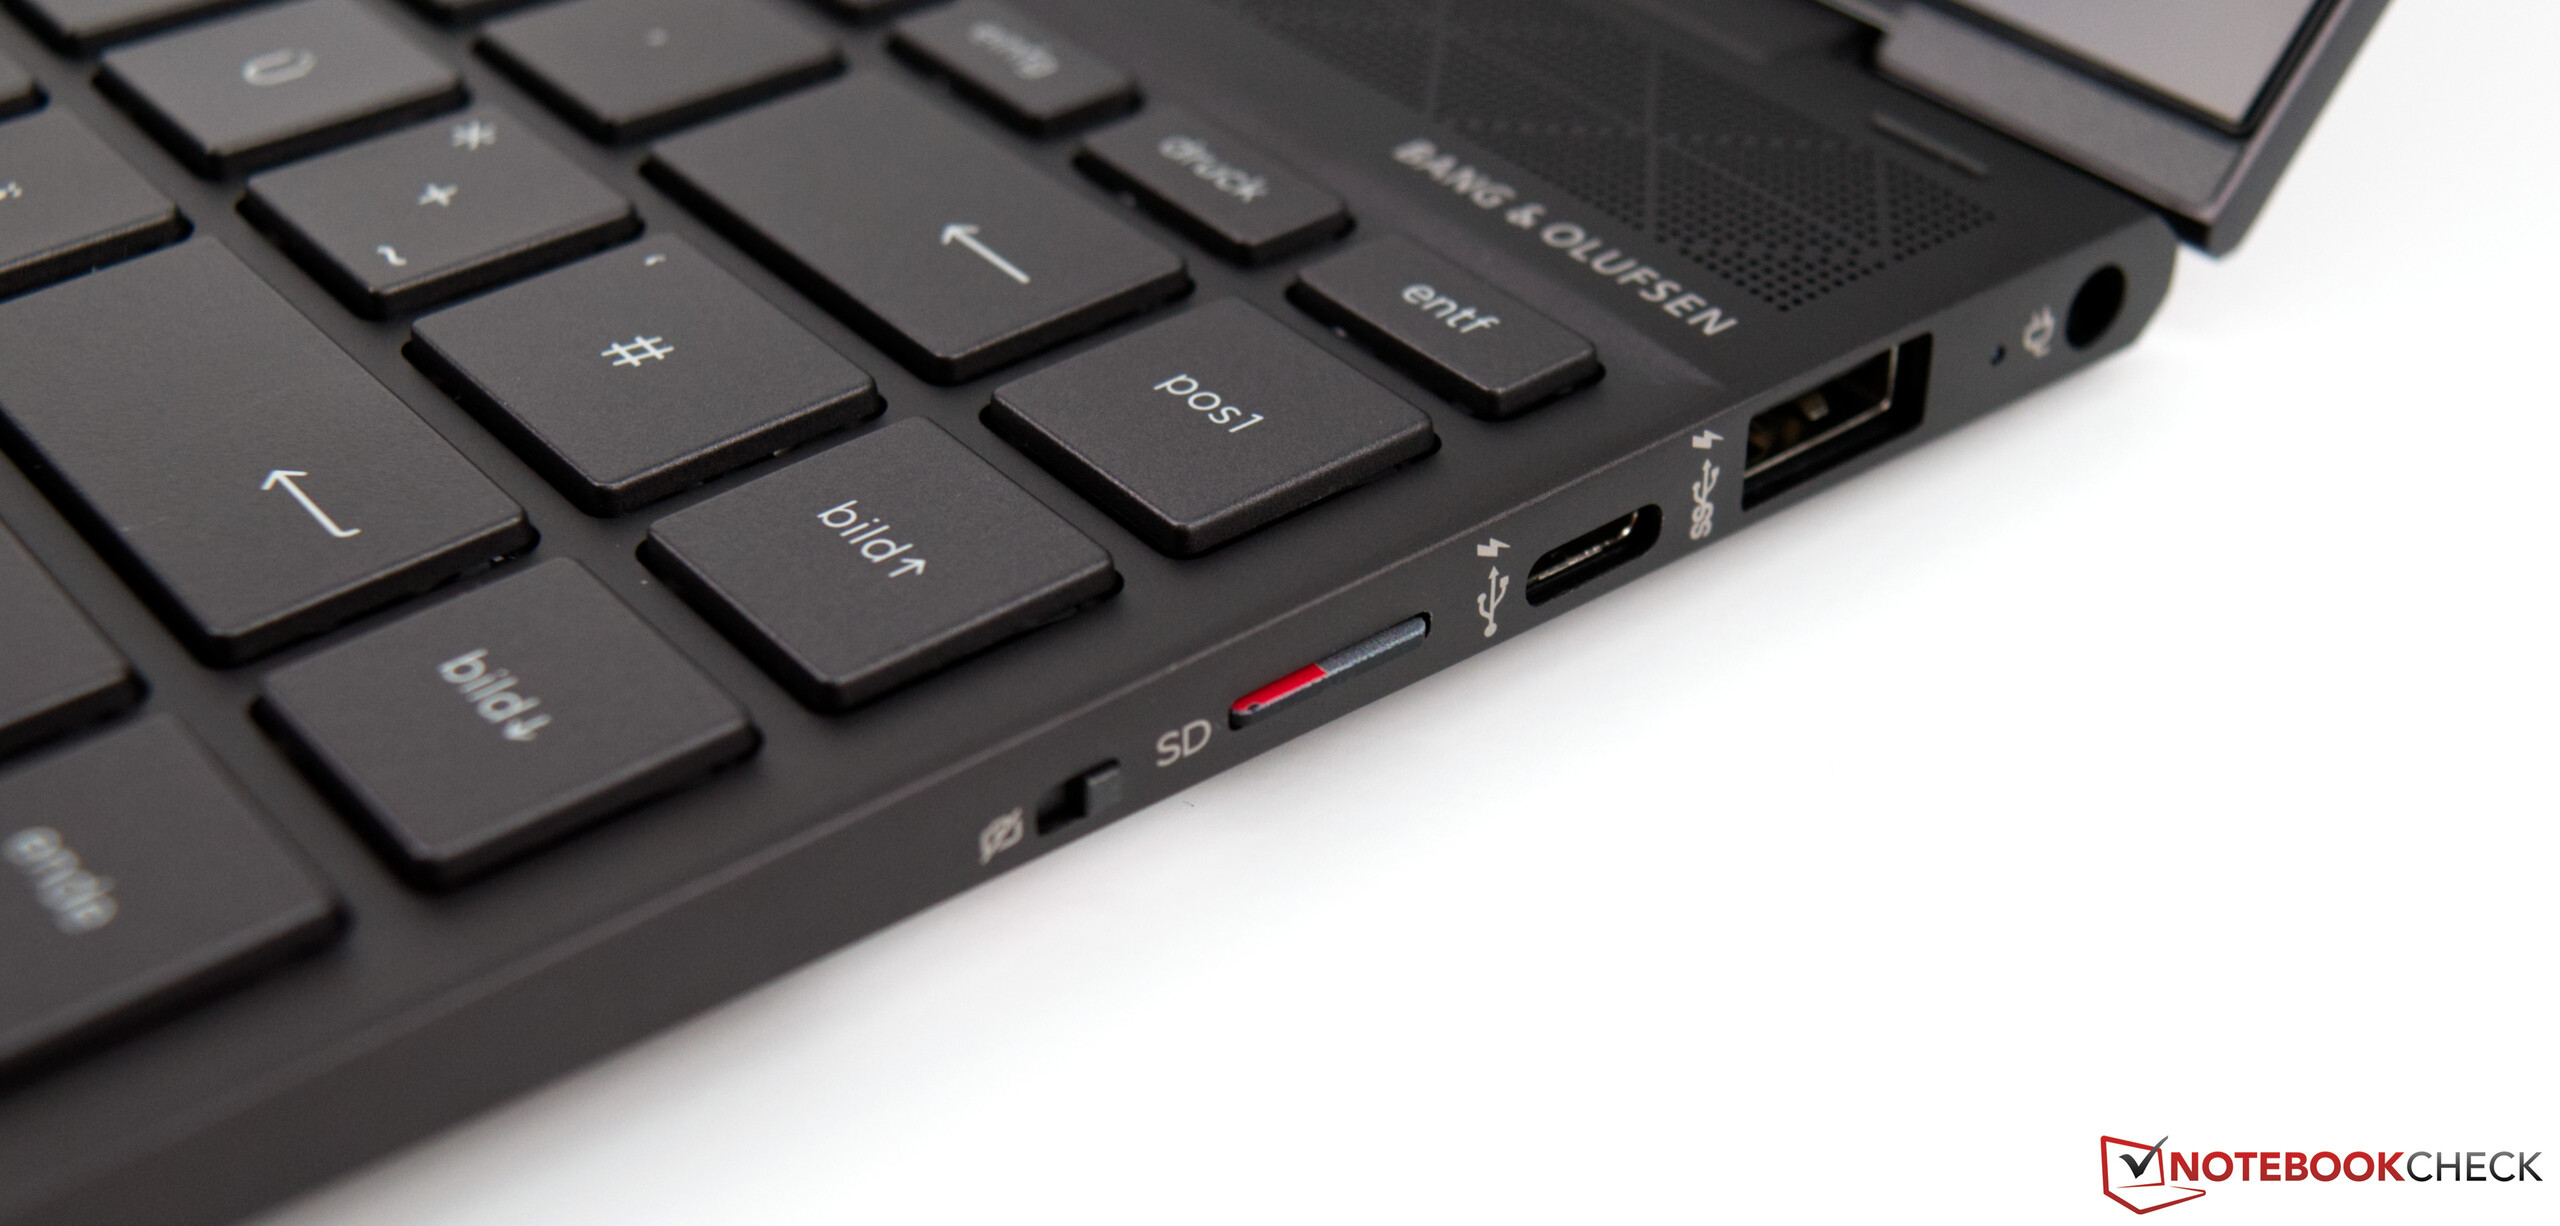
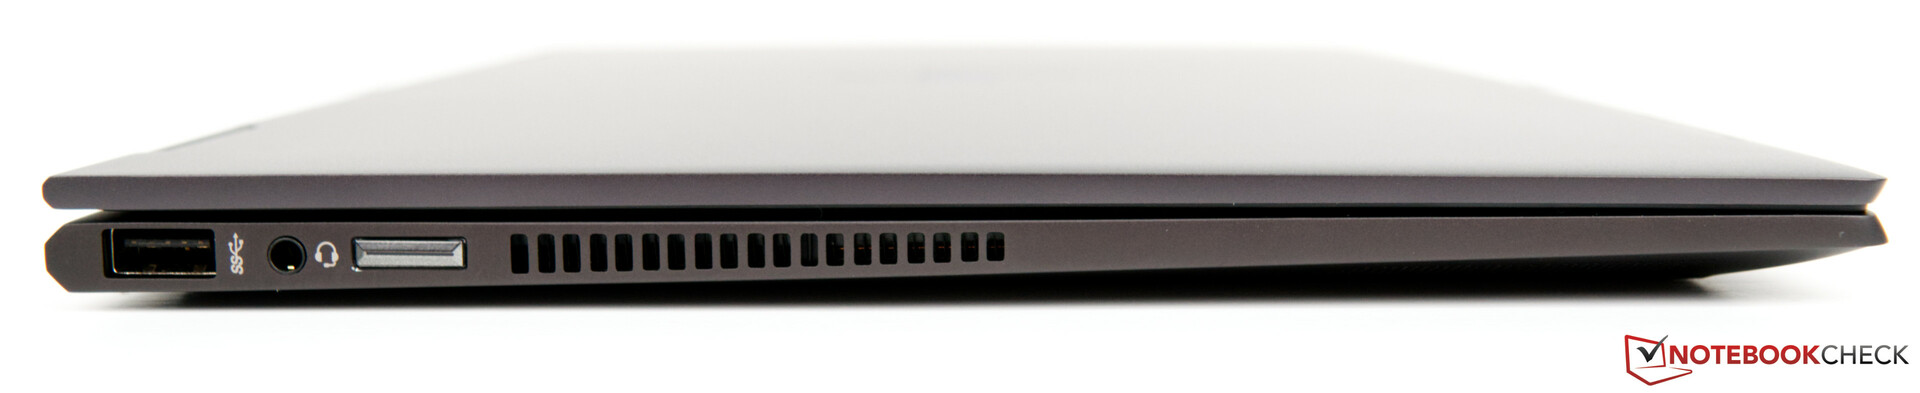
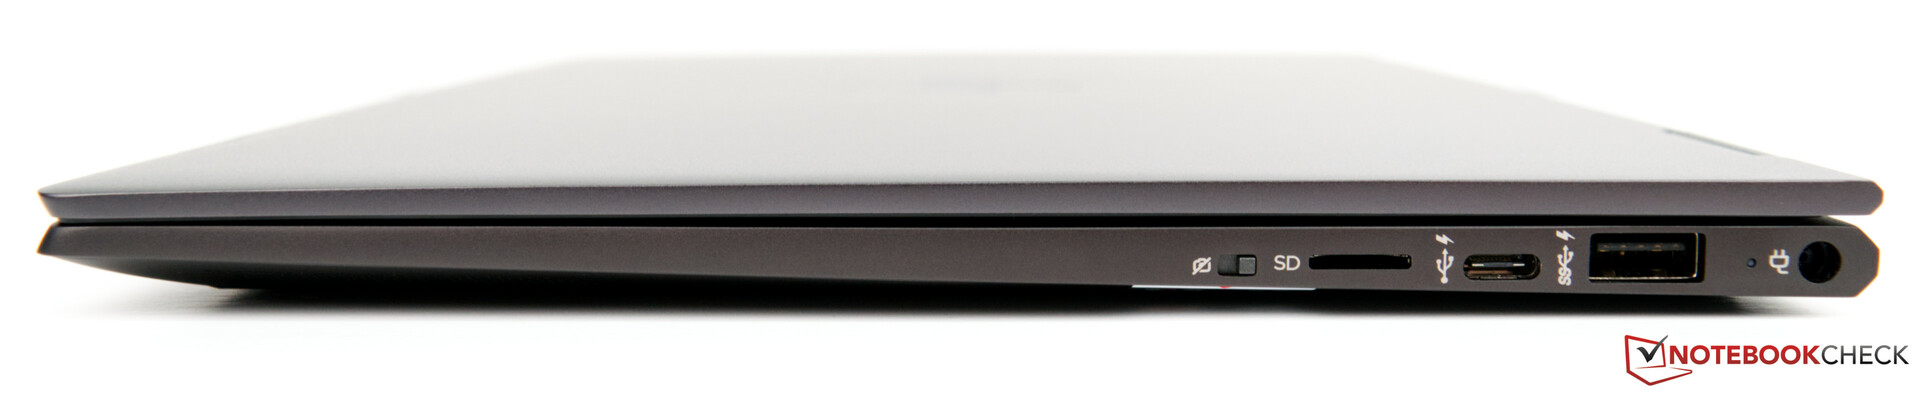
Cet appareil fait déjà visuellement bonne impression, paraissant très moderne grâce à ses bordures d’écran fines. Ceux qui peuvent s’en sortir sans pléthore de ports seront bien servis avec les trois ports USB disponibles – mais nous ne nous plaindrions pas de la présence d’un port USB C Thunderbolt. Mais au moins, la connexion USB C présente est compatible DisplayPort. C’est le minimum attendu quand il n’y a pas de connexions HDMI ou DisplayPort dédiées.
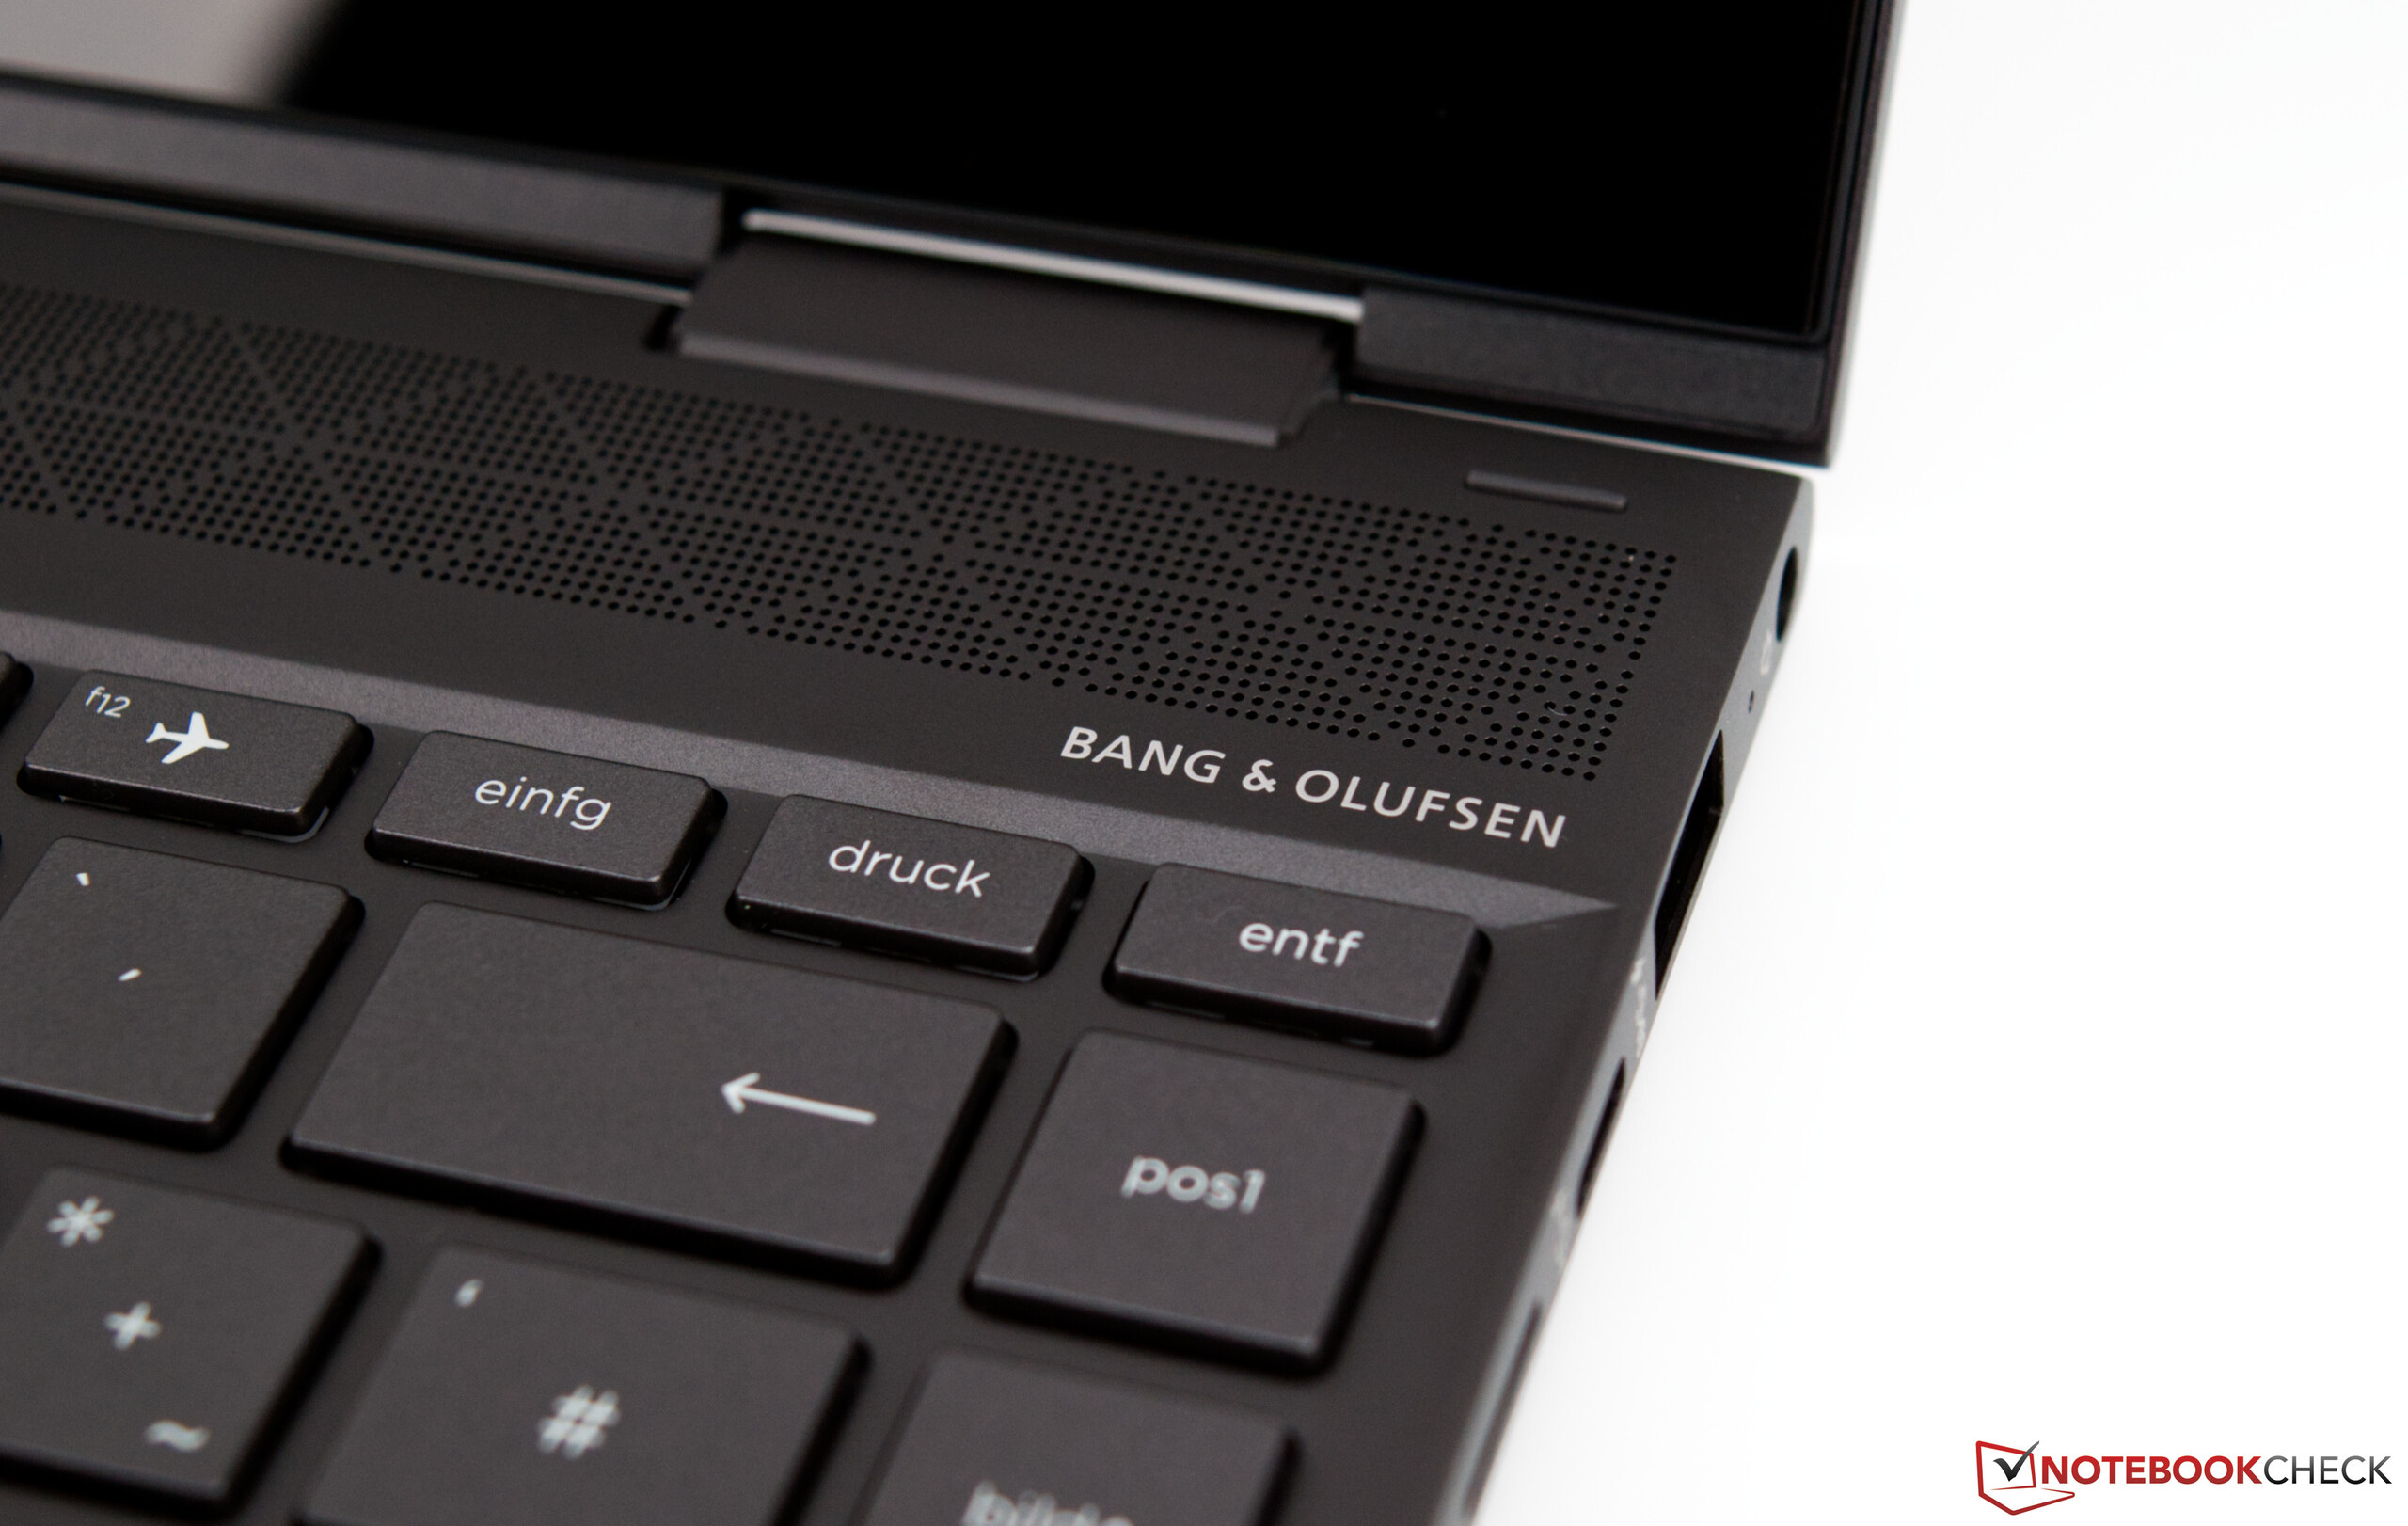
La bonne efficience et les haut-parleurs acceptables sont des points positifs. Le concept de quatre haut-parleurs permet d’avoir une bonne expérience audio, quel que soit le mode utilisé (portable, support, tablette, tente).
Malheureusement, le HP Envy x360 13 a été incapable de convertir sa faible consommation en une bonne autonomie. 7h d’autonomie ne permettront pas de passer la journée complète sans charge.
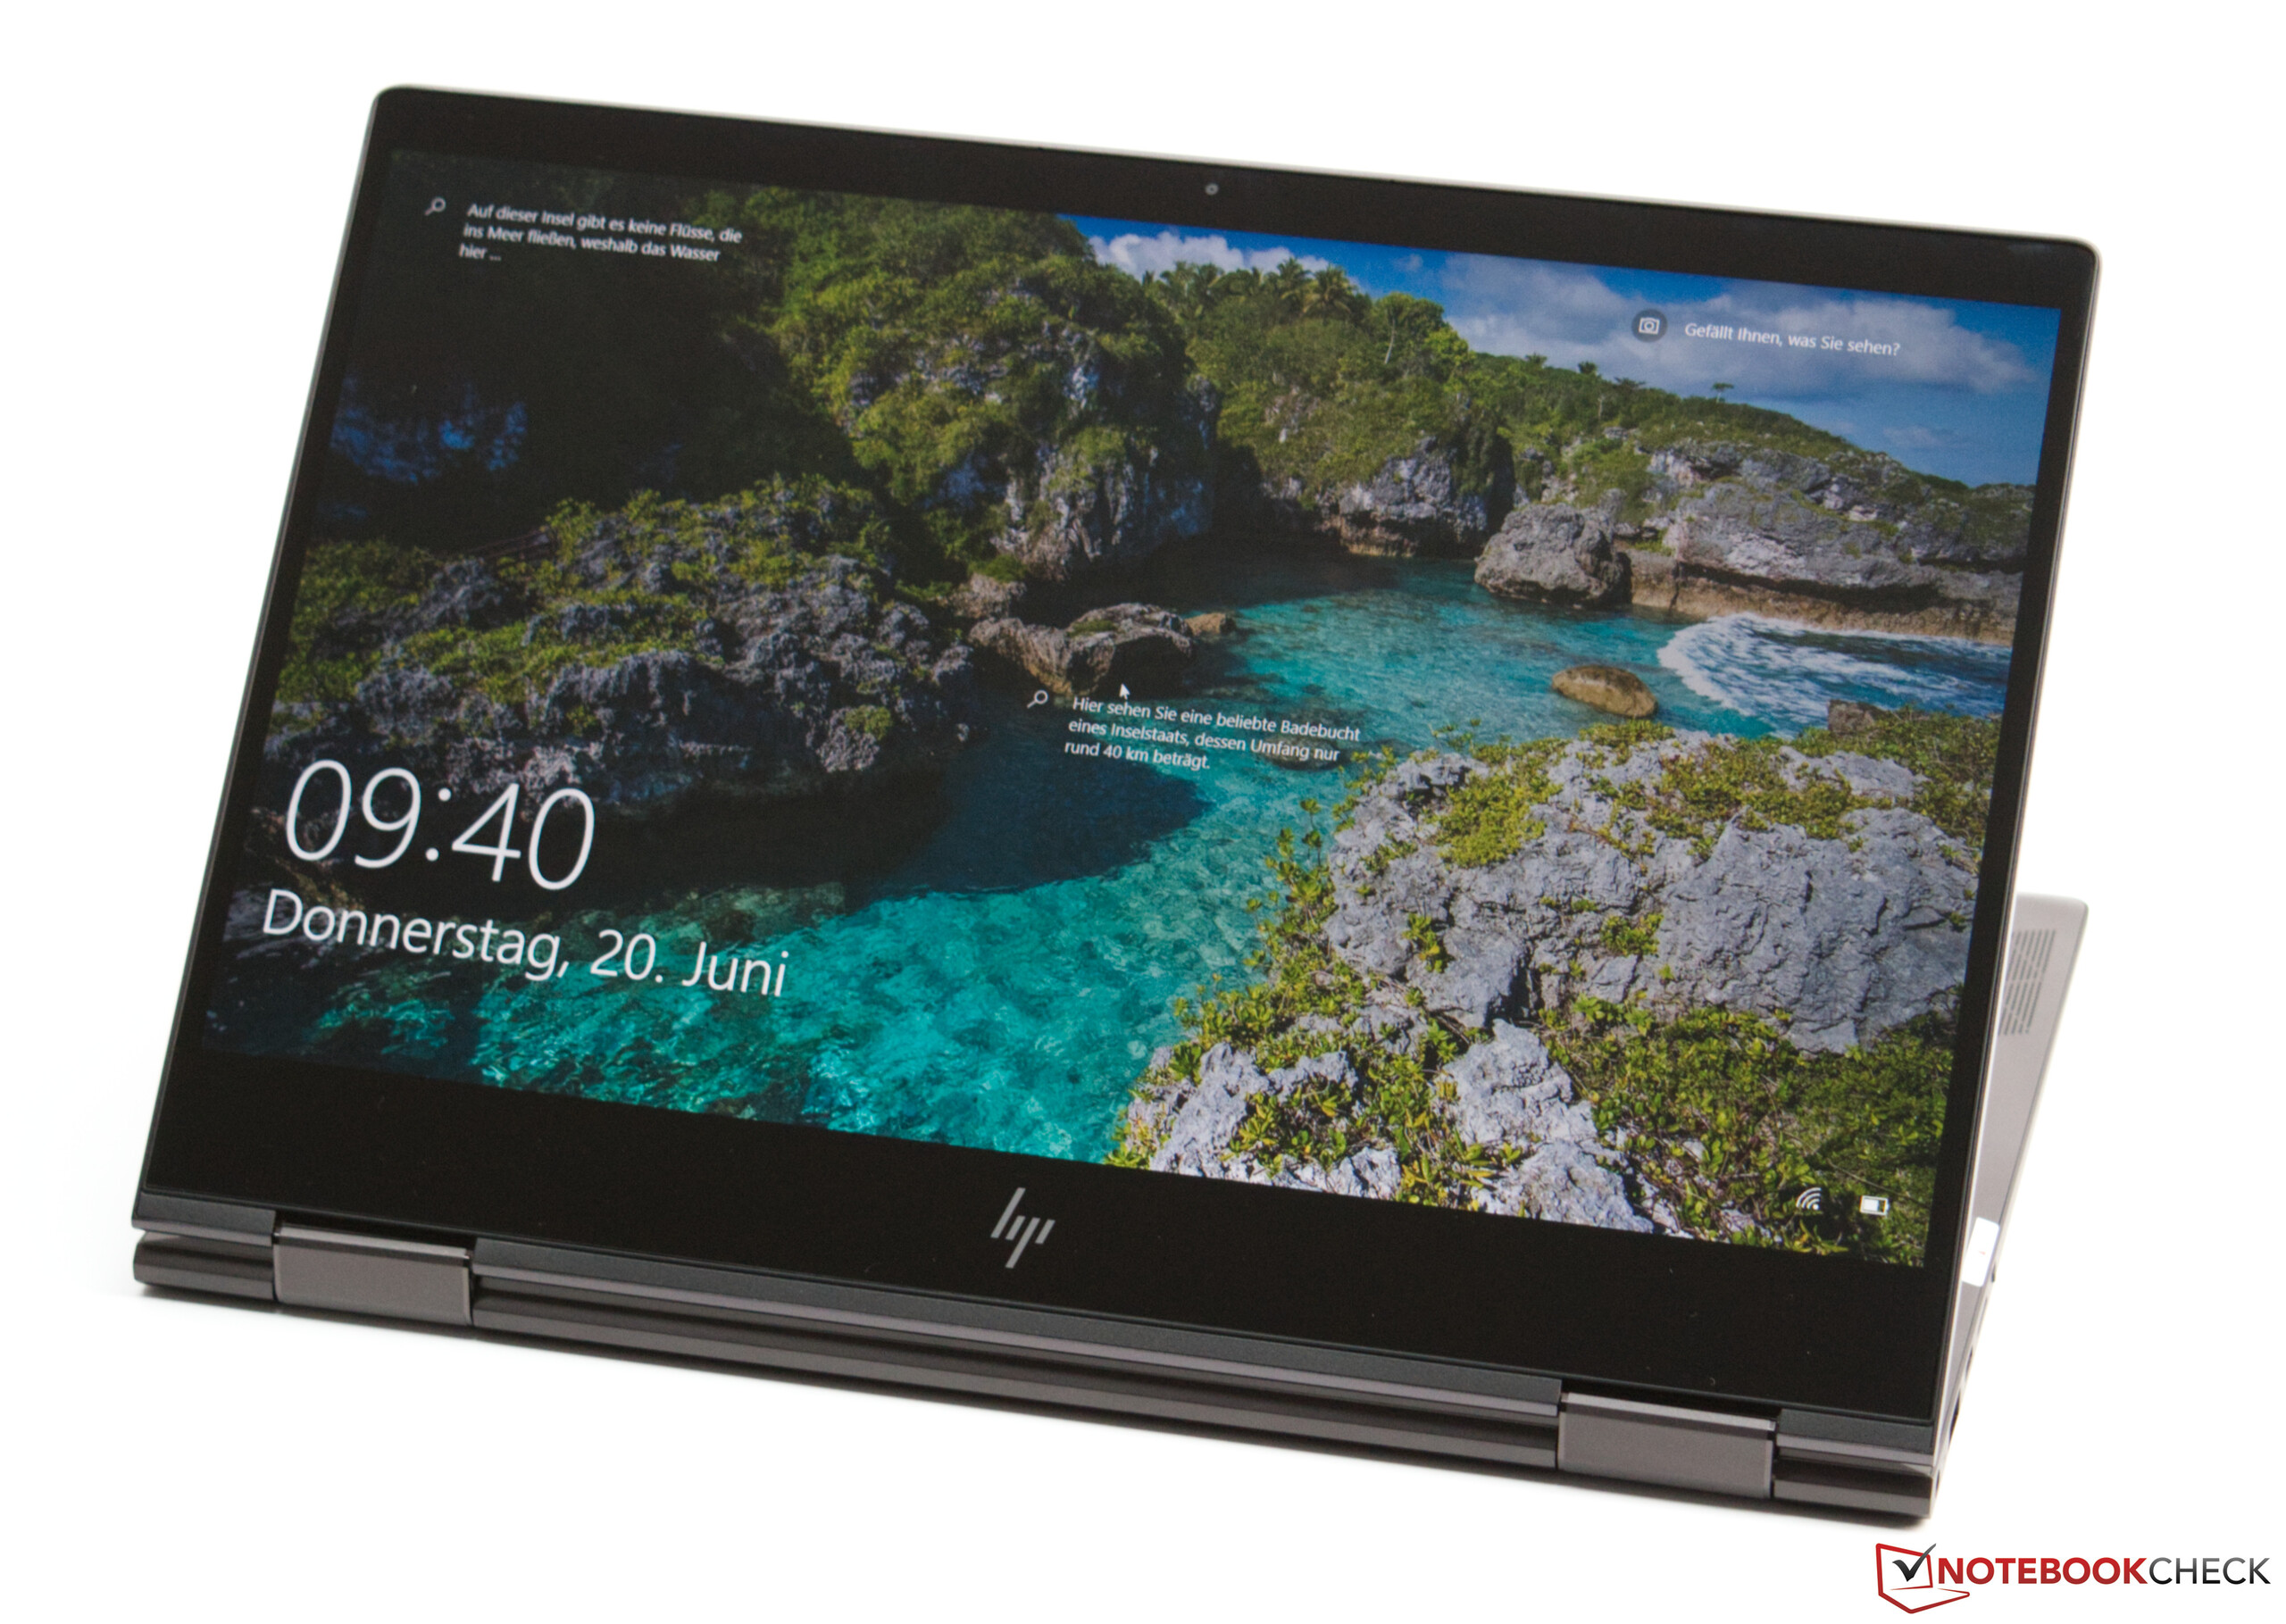
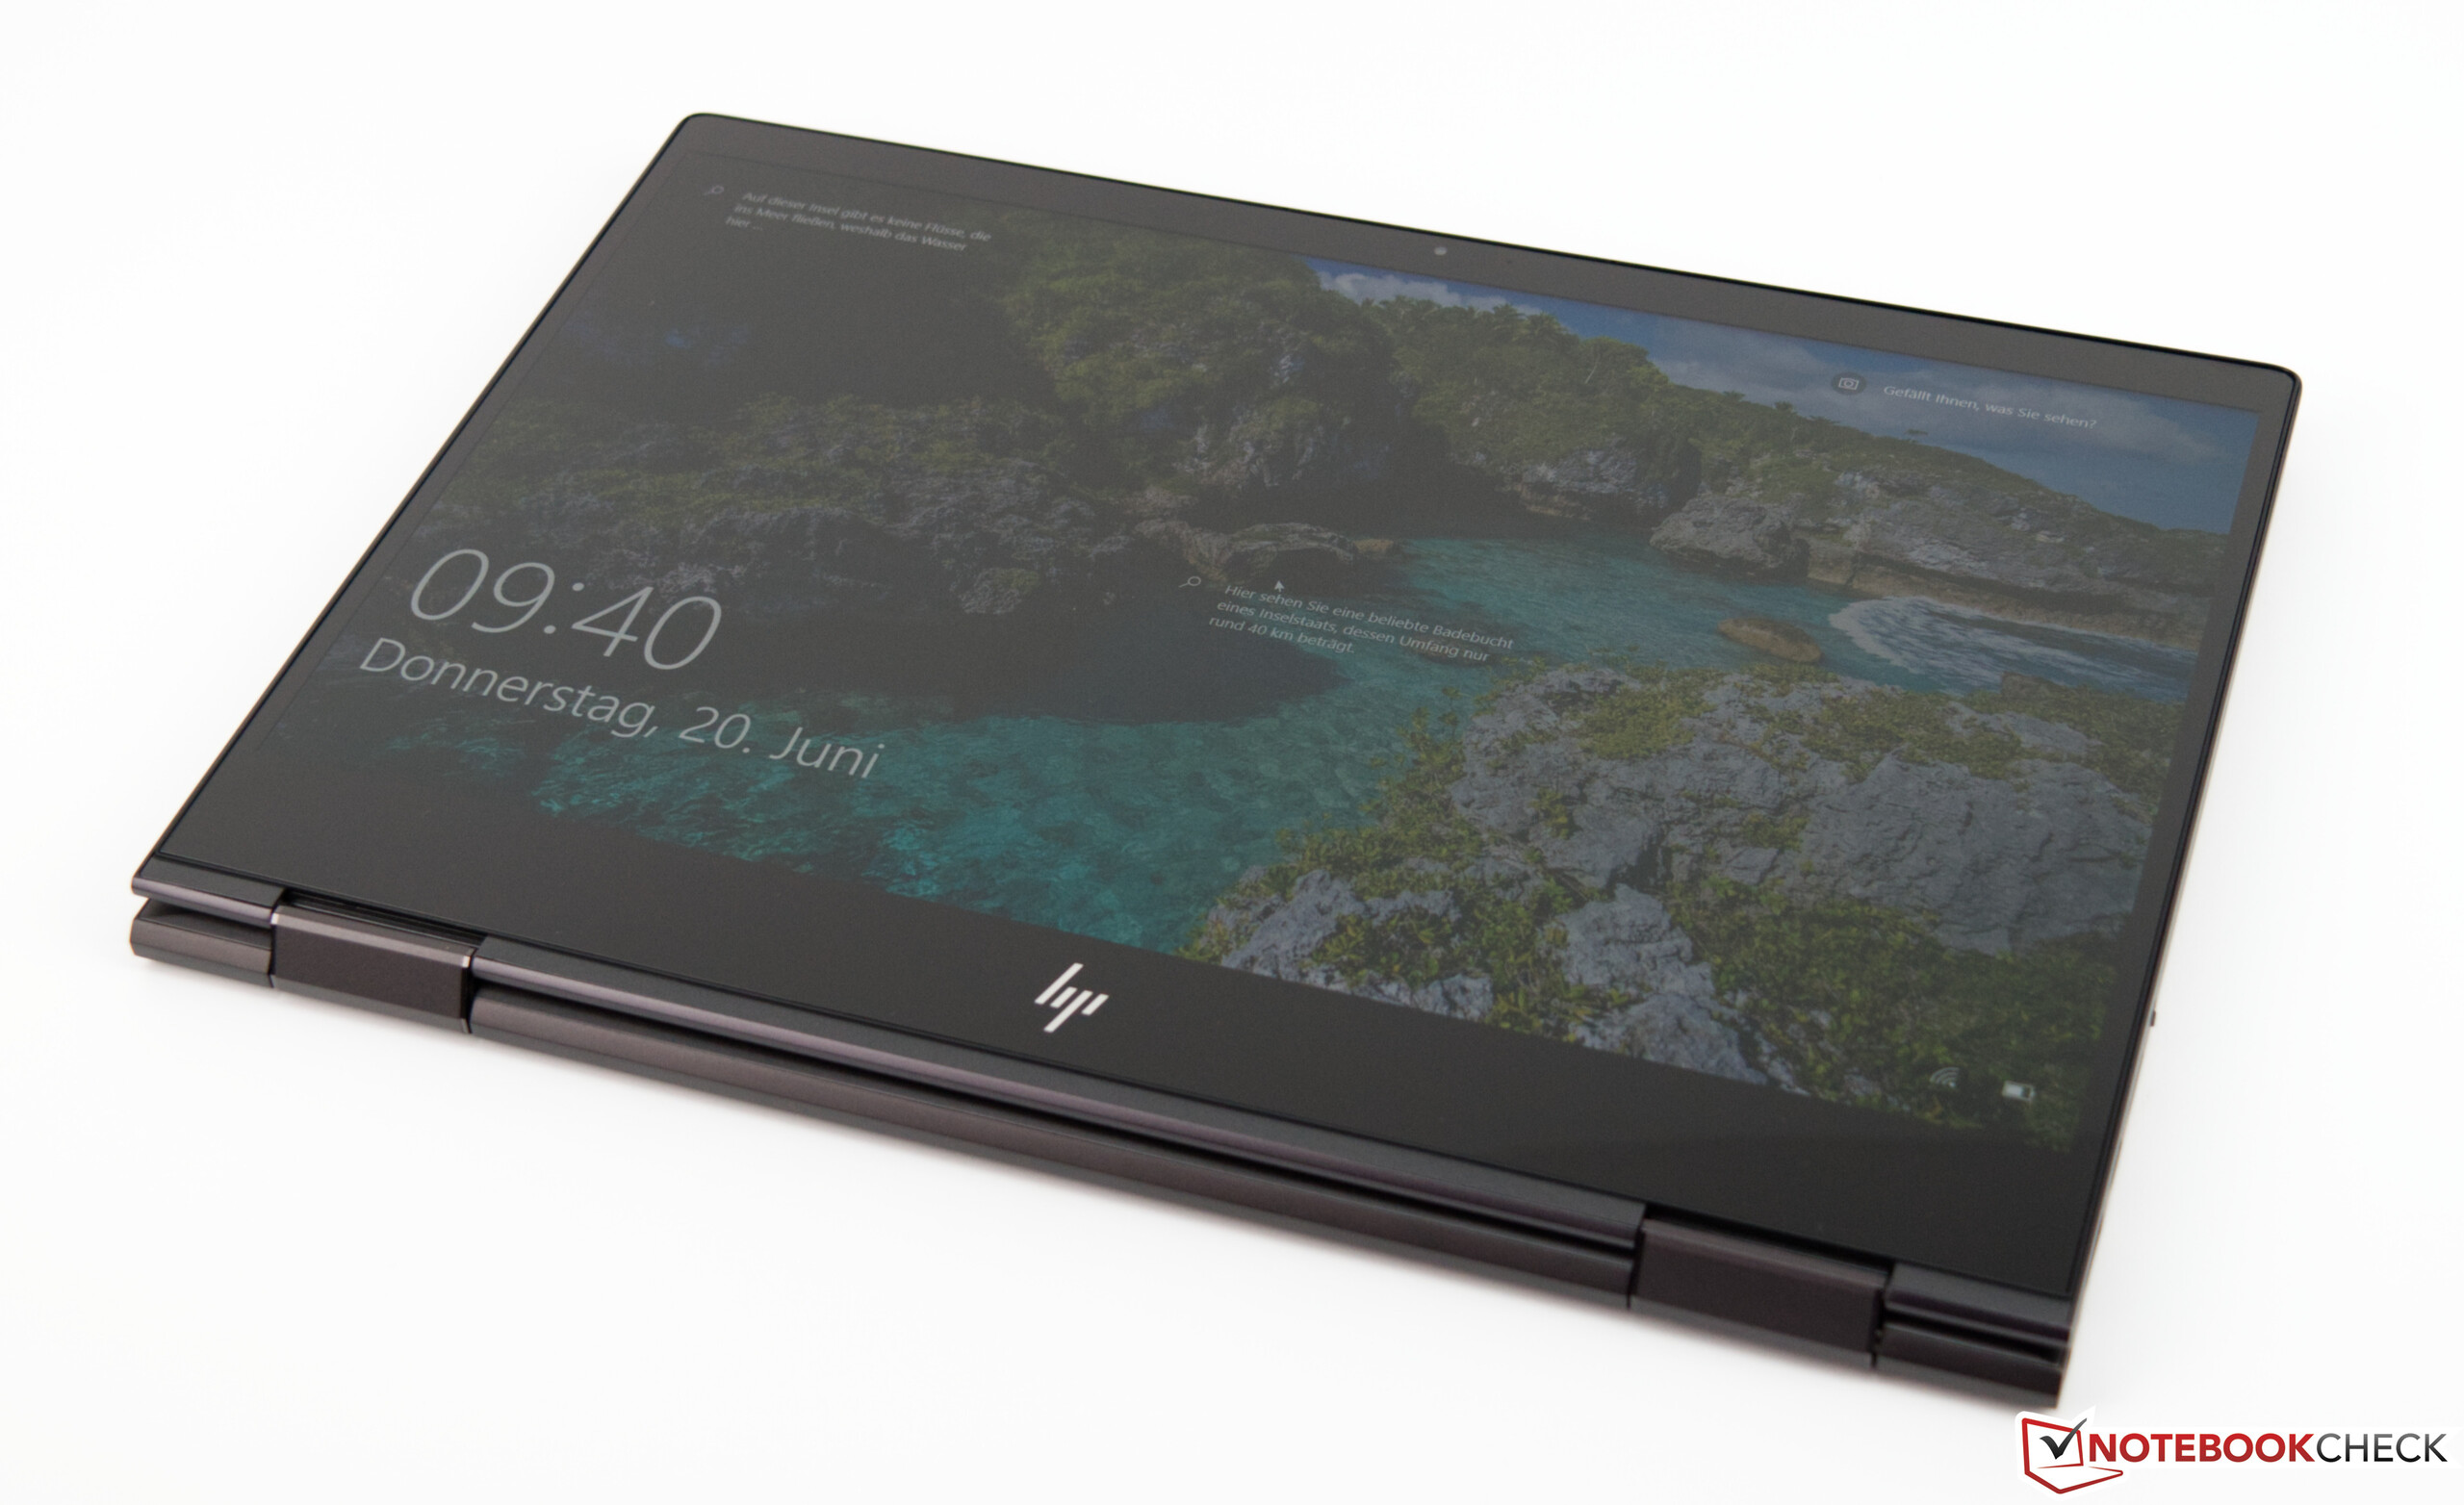
L’une des meilleures surprises du HP Envy x360 13 vient de son excellent écran 120 Hz. Avec sa très bonne luminosité et son contraste élevé, le travail sur la machine est agréable. Malheureusement, il faudra quand même accepter des limitations lors du travail à l’extérieur, l’écran étant très sujet aux reflets malgré sa luminosité. Et il faudra également composer avec l’absence de stylet actif.
Un convertible abordable avec un CPU AMD et un bon écran, voilà ce que propose le HP Envy x360 13.
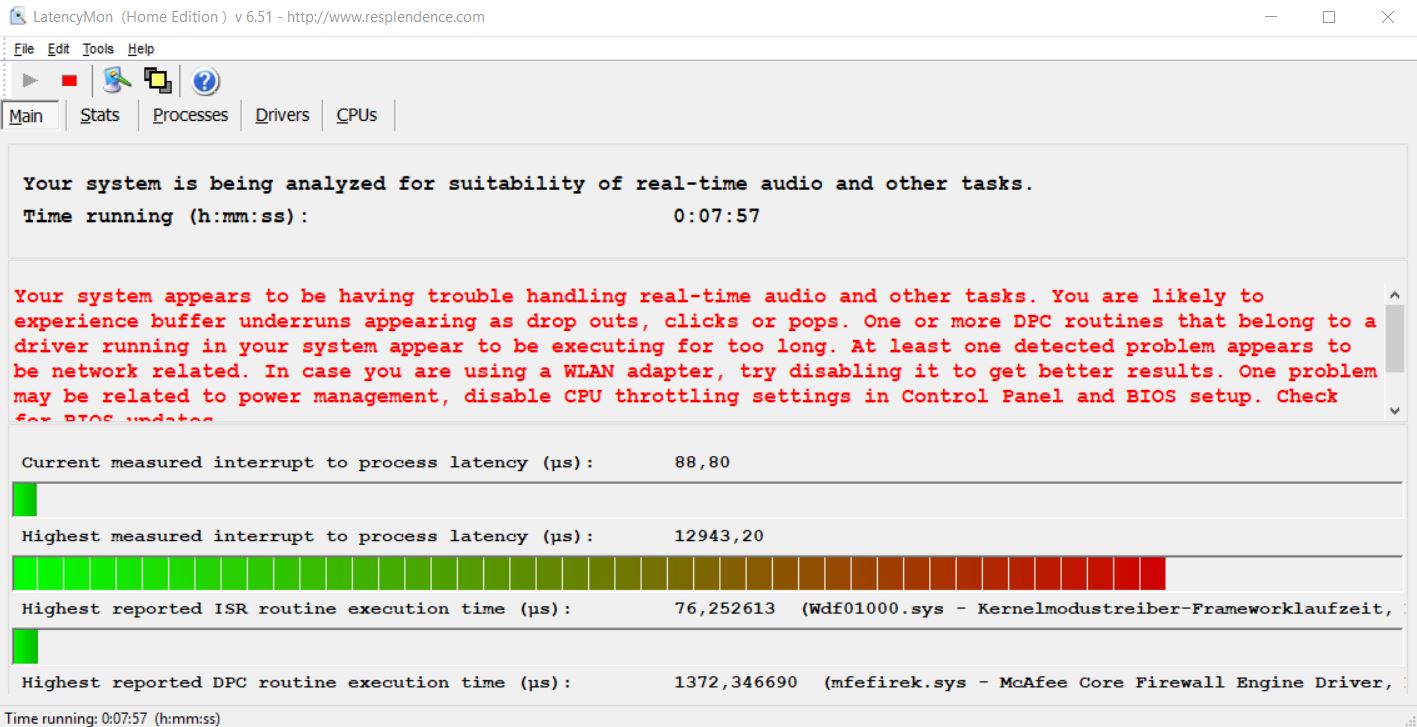
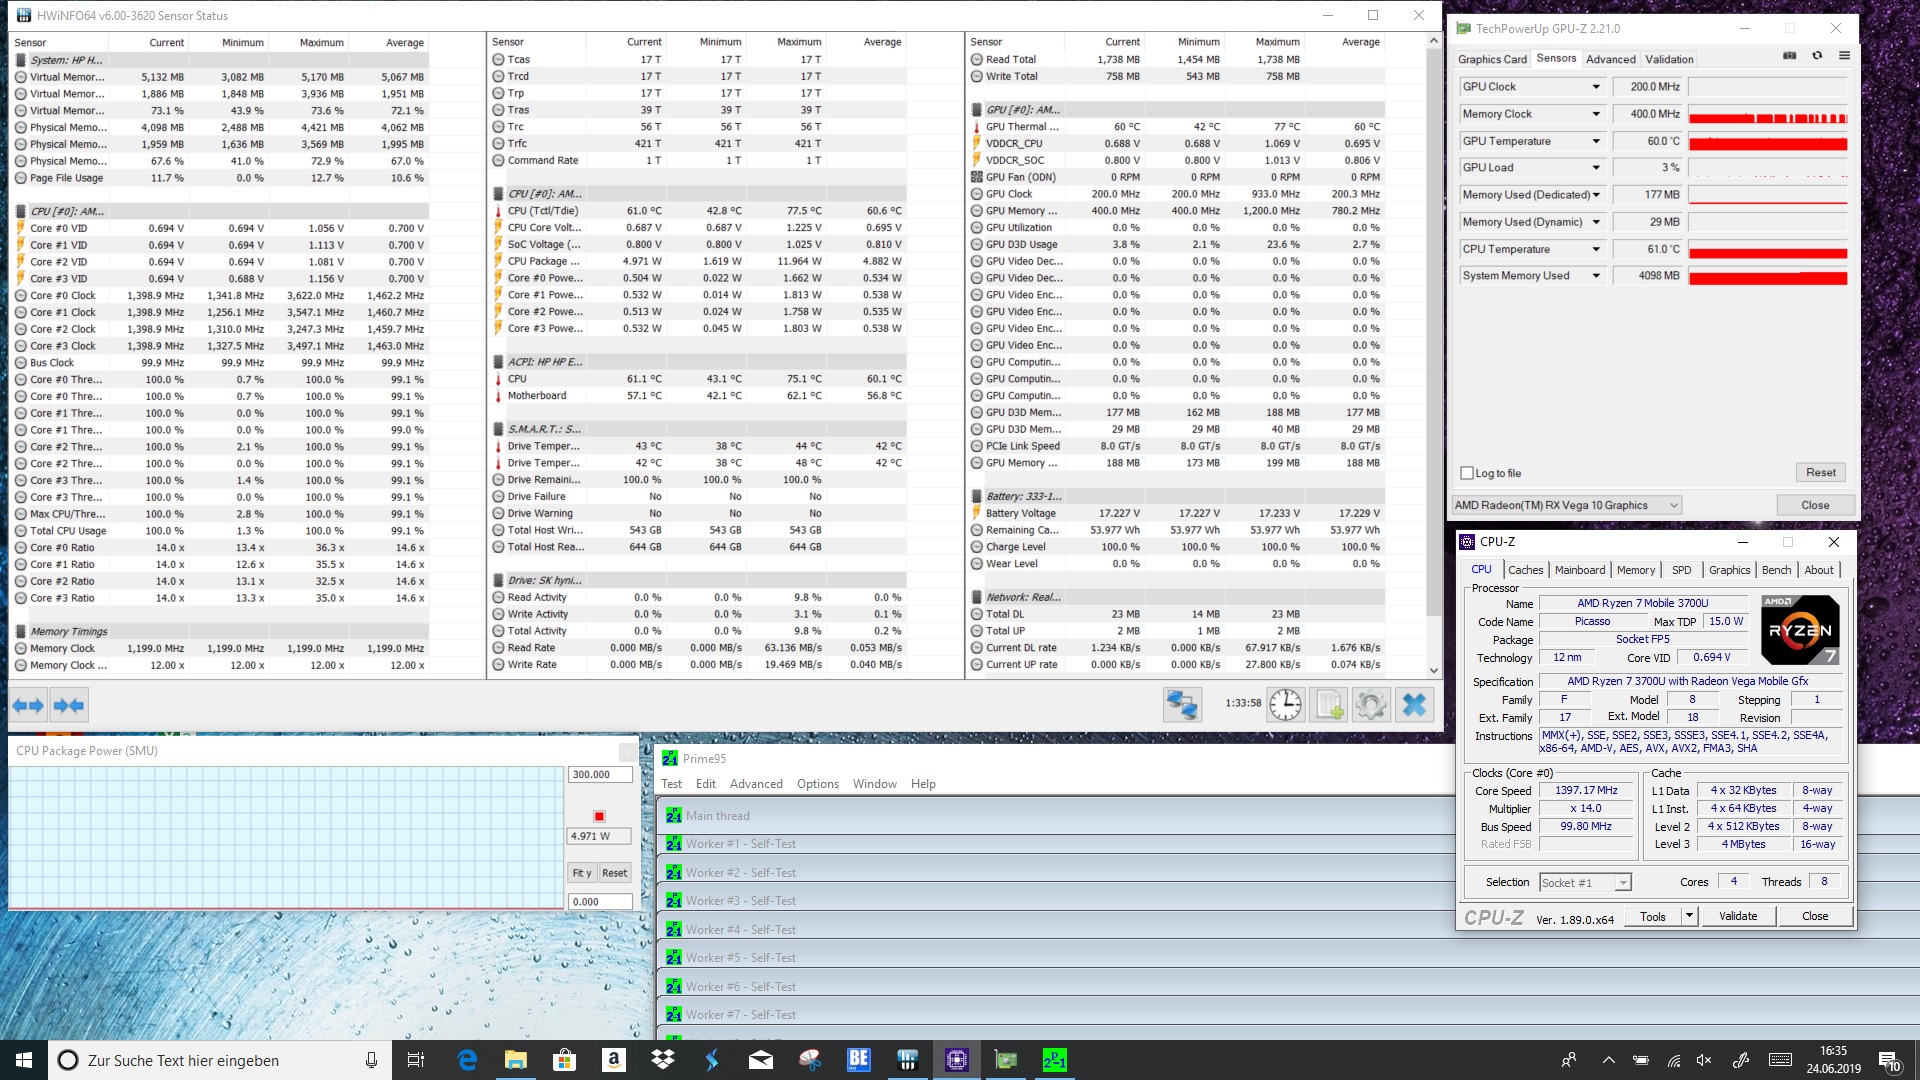
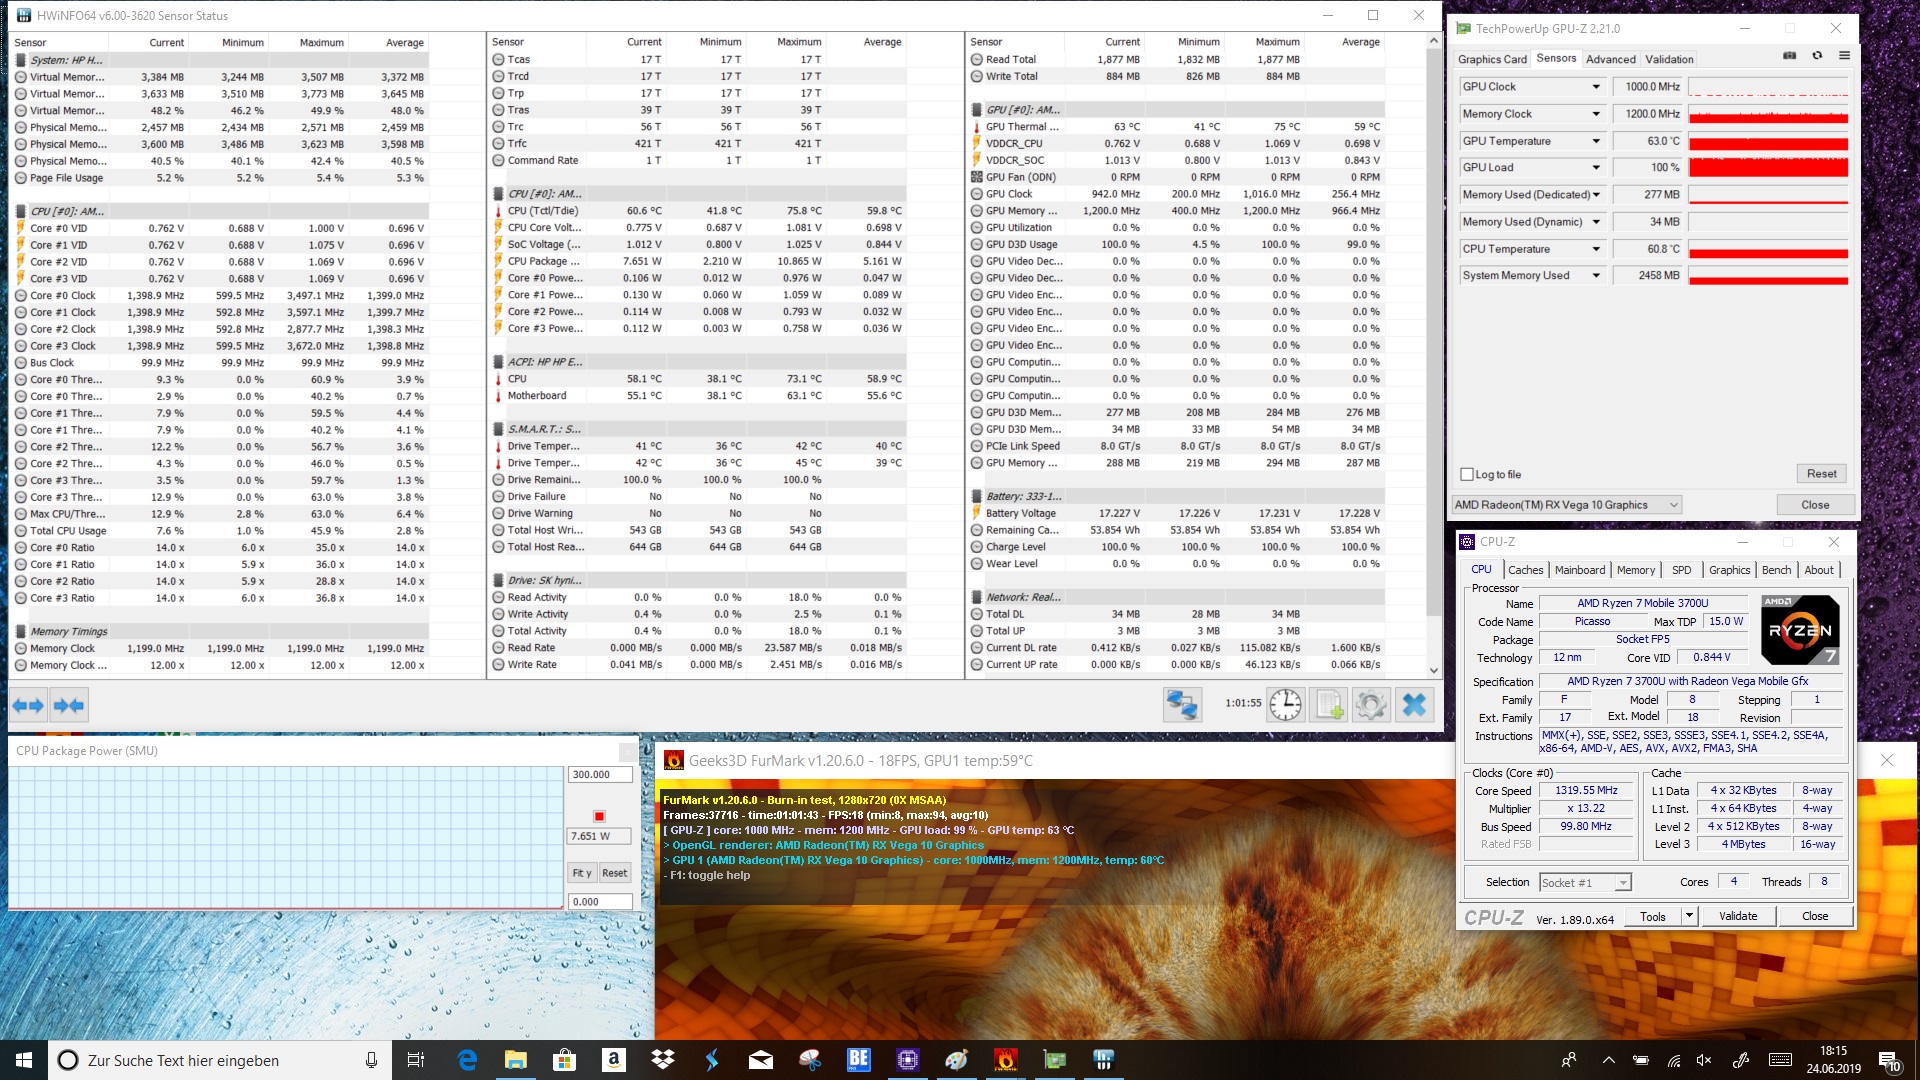
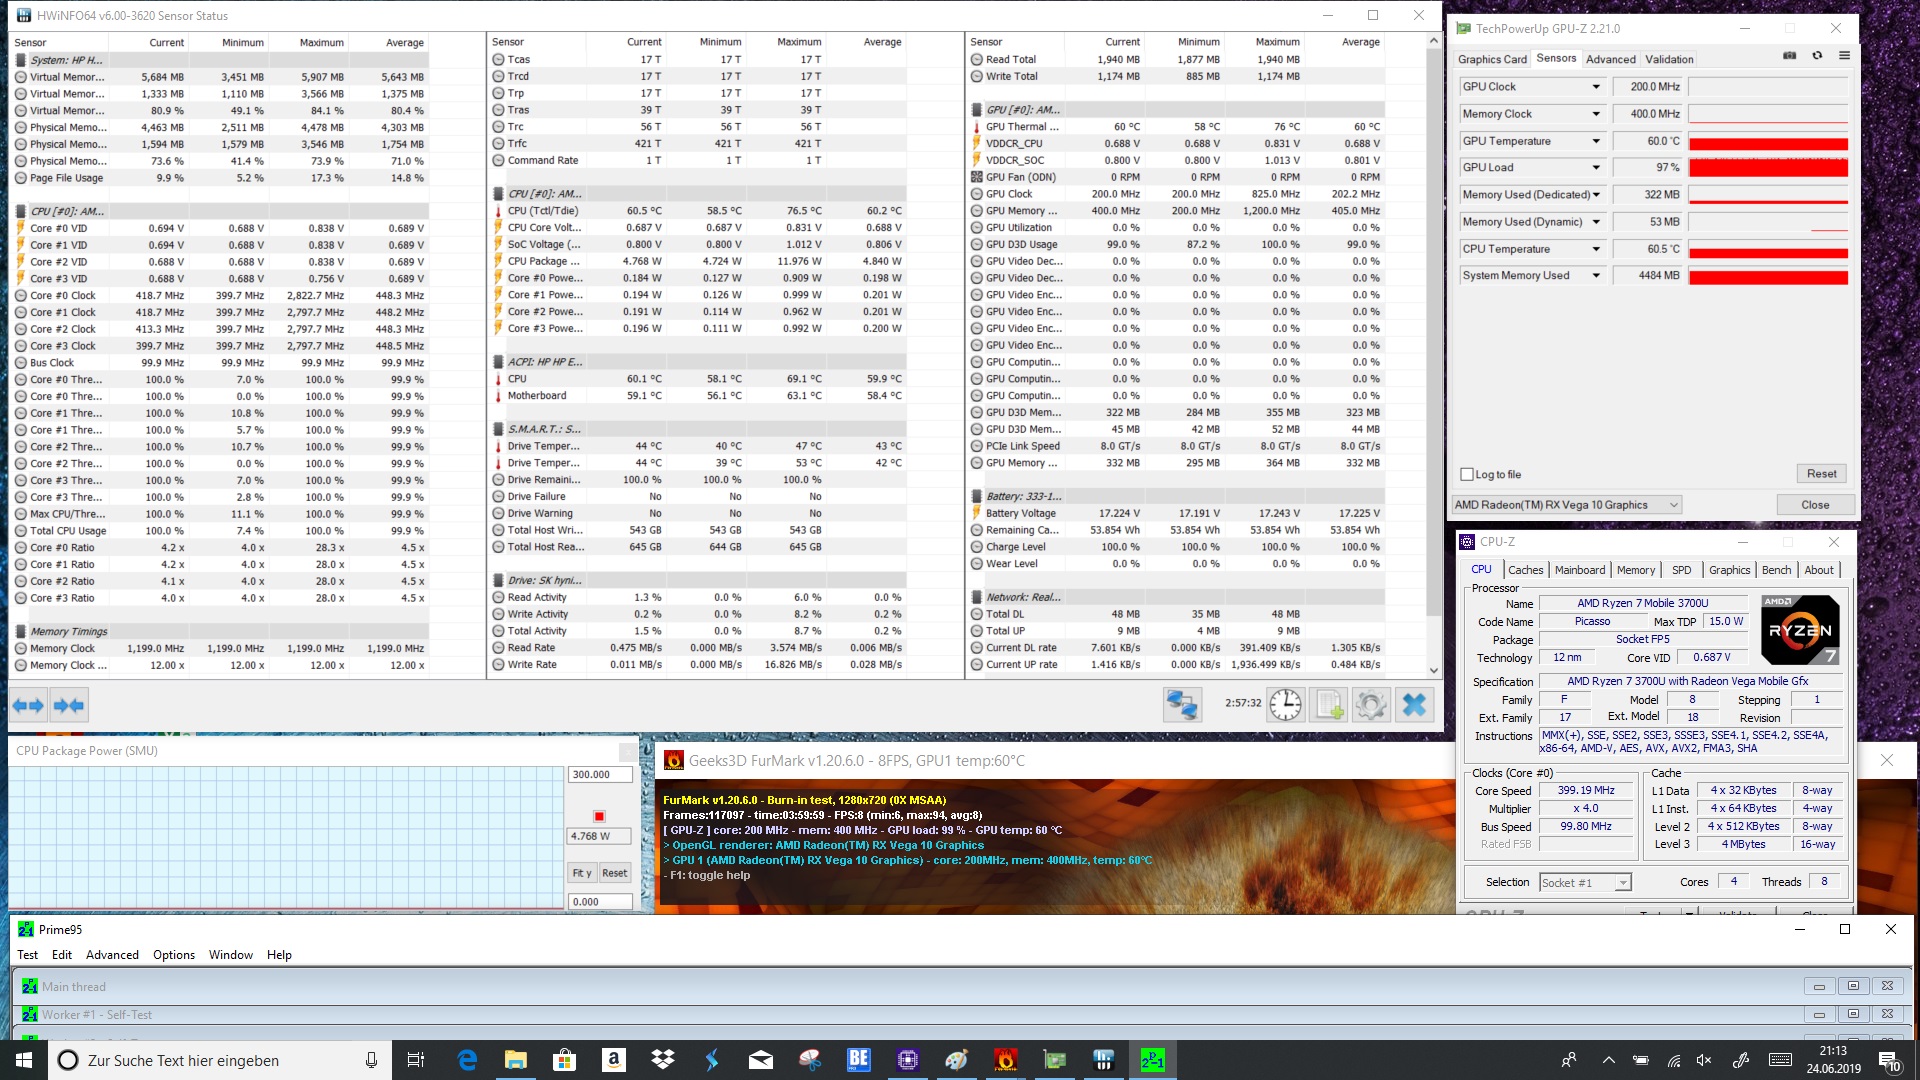
L’un des plus gros points faibles du HP Envy x360 13 est son APU AMD au throttling élevé en cas de sollicitations. Mais ceux qui n’ont pas besoin de performances élevées de façon durable seront bien servis par l’AMD Ryzen 7 3700U.
L’intégralité de cette critique est disponible en anglais en suivant ce lien.
HP Envy x360 13-ar0601ng
- 06/28/2019 v6 (old)
Sebastian Bade
Price comparison
