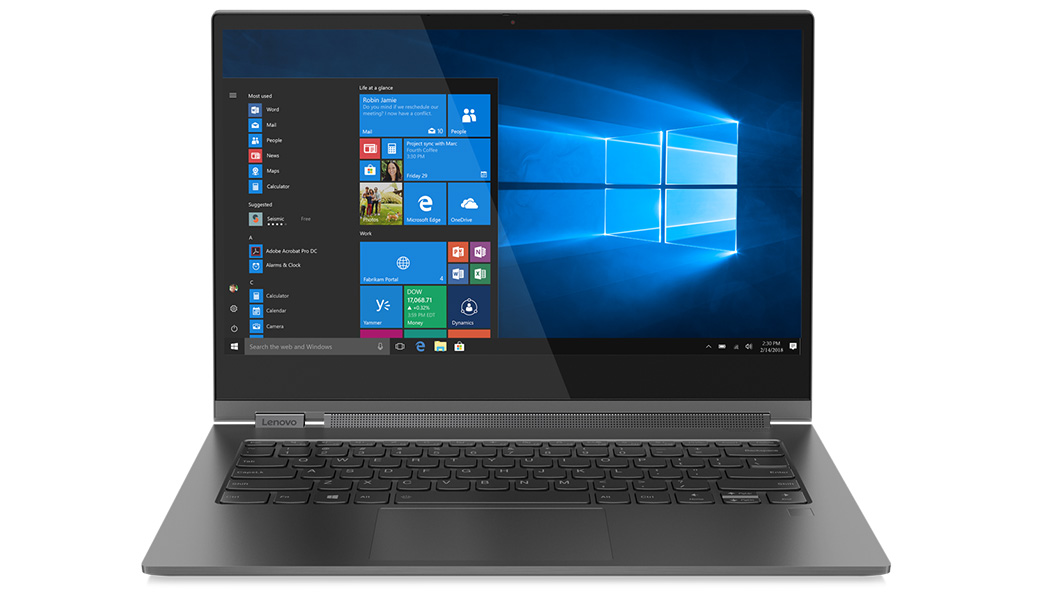
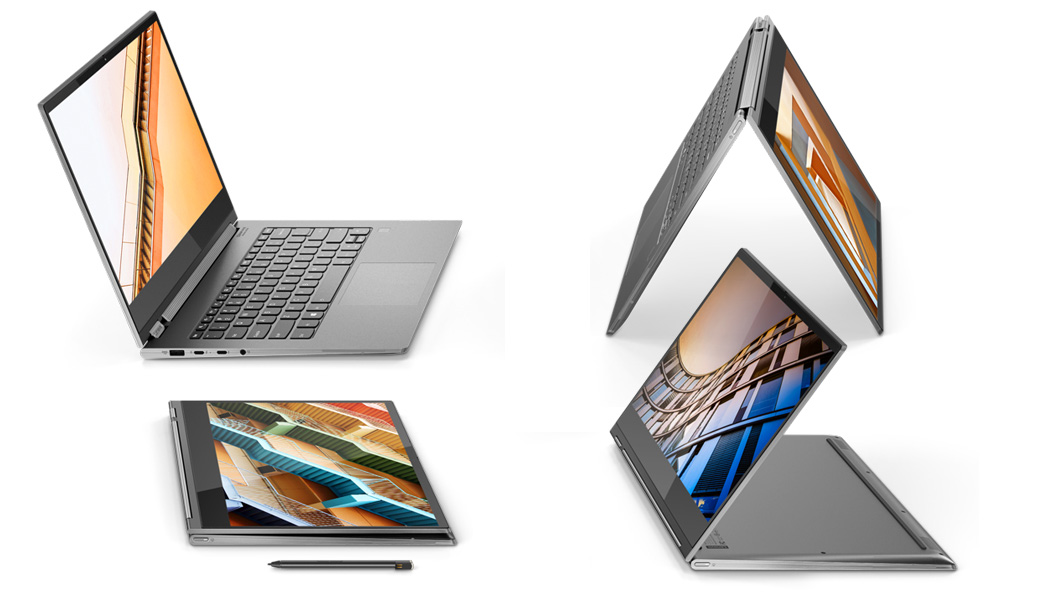
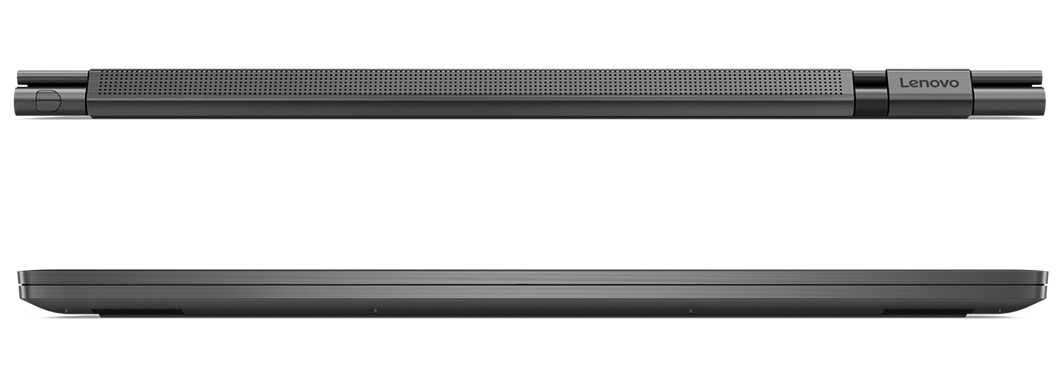
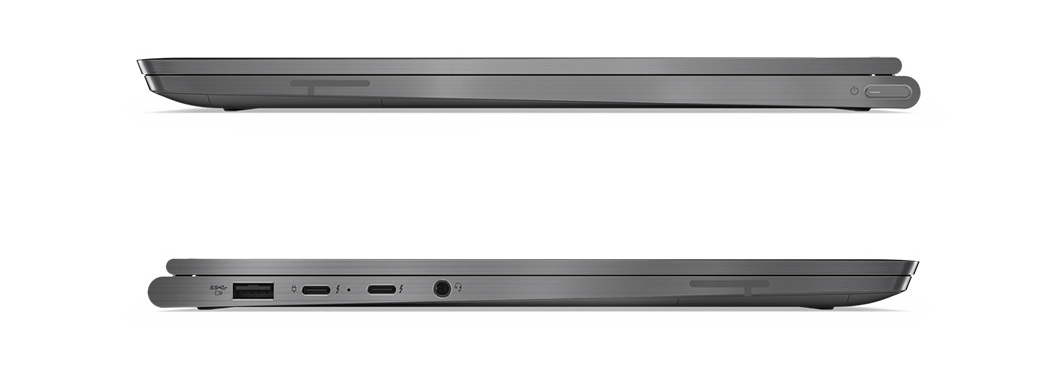
Courte critique du convertible Lenovo Yoga C930-13IKB (i7-8550U, UHD 620, FHD)
| Networking | |
| iperf3 transmit AX12 | |
| HP Spectre x360 13-ae048ng | |
| Lenovo Yoga C930-13IKB 81C4 | |
| Lenovo Yoga 920-13IKB-80Y7 | |
| Dell XPS 13 9370 i7 UHD | |
| iperf3 receive AX12 | |
| Dell XPS 13 9370 i7 UHD | |
| Lenovo Yoga 920-13IKB-80Y7 | |
| Lenovo Yoga C930-13IKB 81C4 | |
| HP Spectre x360 13-ae048ng | |
| |||||||||||||||||||||||||
Homogénéité de la luminosité: 87 %
Valeur mesurée au centre, sur batterie: 312 cd/m²
Contraste: 726:1 (Valeurs des noirs: 0.43 cd/m²)
ΔE ColorChecker Calman: 7.6 | ∀{0.5-29.43 Ø4.73}
calibrated: 1.96
ΔE Greyscale Calman: 8.8 | ∀{0.09-98 Ø4.97}
92.3% sRGB (Argyll 1.6.3 3D)
59.1% AdobeRGB 1998 (Argyll 1.6.3 3D)
64.7% AdobeRGB 1998 (Argyll 3D)
92.6% sRGB (Argyll 3D)
62.7% Display P3 (Argyll 3D)
Gamma: 2.01
CCT: 6874 K
| Lenovo Yoga C930-13IKB 81C4 AUO B139HAN03_0, IPS, 13.9", 1920x1080 | Lenovo Yoga C930-13IKB B139HAN03_0, IPS, 13.9", 1920x1080 | Lenovo Yoga 920-13IKB-80Y7 AU Optronics B139HAN03.0, IPS, 13.9", 1920x1080 | HP Spectre x360 13-ae048ng Chi Mei (CMN1376), IPS, 13.3", 1920x1080 | Acer Spin 3 SP314-51-548L BOE CQ NV140FHM-N41, IPS, 14", 1920x1080 | Dell XPS 13 9370 i7 UHD ID: Sharp SHP148B, Name: LQ133D1, Dell P/N: 8XDHY, IPS, 13.3", 3840x2160 | |
|---|---|---|---|---|---|---|
| Display | 2% | -1% | 8% | -37% | 8% | |
| Display P3 Coverage (%) | 62.7 | 64.3 3% | 62.5 0% | 68.1 9% | 39.68 -37% | 68.9 10% |
| sRGB Coverage (%) | 92.6 | 94.6 2% | 91.7 -1% | 99.5 7% | 58.9 -36% | 98.4 6% |
| AdobeRGB 1998 Coverage (%) | 64.7 | 66.2 2% | 64.1 -1% | 70.2 9% | 41 -37% | 69.5 7% |
| Response Times | -14% | -29% | -5% | -31% | -87% | |
| Response Time Grey 50% / Grey 80% * (ms) | 34.4 ? | 40.8 ? -19% | 46 ? -34% | 36 ? -5% | 43 ? -25% | 69.6 ? -102% |
| Response Time Black / White * (ms) | 25.6 ? | 27.6 ? -8% | 31.6 ? -23% | 27 ? -5% | 35 ? -37% | 44 ? -72% |
| PWM Frequency (Hz) | 25000 ? | 1000 | 3759 ? | |||
| Screen | 10% | 6% | 30% | 6% | 34% | |
| Brightness middle (cd/m²) | 312 | 316 1% | 297.9 -5% | 311 0% | 220 -29% | 478.5 53% |
| Brightness (cd/m²) | 295 | 291 -1% | 278 -6% | 278 -6% | 221 -25% | 466 58% |
| Brightness Distribution (%) | 87 | 83 -5% | 81 -7% | 82 -6% | 78 -10% | 86 -1% |
| Black Level * (cd/m²) | 0.43 | 0.36 16% | 0.44 -2% | 0.2 53% | 0.18 58% | 0.43 -0% |
| Contrast (:1) | 726 | 878 21% | 677 -7% | 1555 114% | 1222 68% | 1113 53% |
| Colorchecker dE 2000 * | 7.6 | 5.9 22% | 5.1 33% | 3.98 48% | 3.98 48% | 3.09 59% |
| Colorchecker dE 2000 max. * | 15.06 | 12.9 14% | 11 27% | 8.48 44% | 7.69 49% | 5.94 61% |
| Colorchecker dE 2000 calibrated * | 1.96 | 1.3 34% | 4 -104% | 2.06 -5% | ||
| Greyscale dE 2000 * | 8.8 | 8.6 2% | 6.7 24% | 5.57 37% | 1.68 81% | 2.4 73% |
| Gamma | 2.01 109% | 2.1 105% | 2.9 76% | 2.51 88% | 2.37 93% | 2.063 107% |
| CCT | 6874 95% | 6854 95% | 6839 95% | 7810 83% | 6382 102% | 6883 94% |
| Color Space (Percent of AdobeRGB 1998) (%) | 59.1 | 60.7 3% | 64.1 8% | 64 8% | 38 -36% | 69.47 18% |
| Color Space (Percent of sRGB) (%) | 92.3 | 94.5 2% | 91.7 -1% | 99 7% | 58 -37% | 98.36 7% |
| Moyenne finale (programmes/paramètres) | -1% /
6% | -8% /
0% | 11% /
21% | -21% /
-7% | -15% /
14% |
* ... Moindre est la valeur, meilleures sont les performances
Temps de réponse de l'écran
| ↔ Temps de réponse noir à blanc | ||
|---|---|---|
| 25.6 ms ... hausse ↗ et chute ↘ combinées | ↗ 15.6 ms hausse | 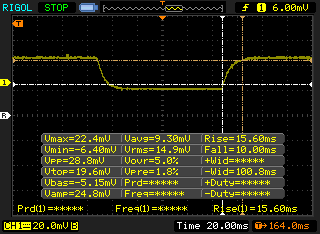 |
| ↘ 10 ms chute | ||
| L'écran souffre de latences relativement élevées, insuffisant pour le jeu. En comparaison, tous les appareils testés affichent entre 0.1 (minimum) et 240 (maximum) ms. » 61 % des appareils testés affichent de meilleures performances. Cela signifie que les latences relevées sont moins bonnes que la moyenne (19.9 ms) de tous les appareils testés. | ||
| ↔ Temps de réponse gris 50% à gris 80% | ||
| 34.4 ms ... hausse ↗ et chute ↘ combinées | ↗ 18.8 ms hausse | 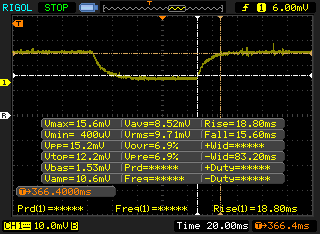 |
| ↘ 15.6 ms chute | ||
| L'écran souffre de latences très élevées, à éviter pour le jeu. En comparaison, tous les appareils testés affichent entre 0.165 (minimum) et 636 (maximum) ms. » 48 % des appareils testés affichent de meilleures performances. Cela signifie que les latences relevées sont moins bonnes que la moyenne (31.1 ms) de tous les appareils testés. | ||
Scintillement / MLI (Modulation de largeur d'impulsion)
| Scintillement / MLI (Modulation de largeur d'impulsion) non décelé | 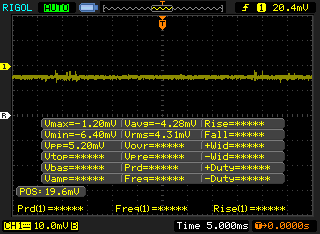 | ||
En comparaison, 52 % des appareils testés n'emploient pas MDI pour assombrir leur écran. Nous avons relevé une moyenne à 7798 (minimum : 5 - maximum : 343500) Hz dans le cas où une MDI était active. | |||
| wPrime 2.10 - 1024m | |
| Lenovo ThinkPad 25 | |
| Lenovo ThinkPad A485-20MU000CGE | |
| Lenovo Yoga 920-13IKB-80Y7 | |
| Moyenne Intel Core i7-8550U (258 - 435, n=11) | |
* ... Moindre est la valeur, meilleures sont les performances
| PCMark 10 - Score | |
| Lenovo Yoga C930-13IKB 81C4 | |
| Lenovo Yoga 920-13IKB-80Y7 | |
| Dell XPS 13 9370 i7 UHD | |
| Moyenne Intel Core i7-8550U, Intel UHD Graphics 620 (2629 - 4072, n=31) | |
| Lenovo Yoga C930-13IKB | |
| PCMark 8 Home Score Accelerated v2 | 3615 points | |
| PCMark 8 Work Score Accelerated v2 | 5110 points | |
| PCMark 10 Score | 4072 points | |
Aide | ||
| Lenovo Yoga C930-13IKB 81C4 SK hynix PC401 HFS256GD9TNG | Dell XPS 13 9370 i7 UHD Toshiba XG5 KXG50ZNV512G | Lenovo Yoga 920-13IKB-80Y7 Samsung PM961 MZVLW256HEHP | Lenovo Yoga 910-13IKB-80VF004CGE Samsung PM951 NVMe MZVLV512 | HP Spectre x360 13-ae048ng Toshiba NVMe THNSN51T02DUK | Lenovo Yoga C930-13IKB SK hynix PC401 HFS256GD9TNG | |
|---|---|---|---|---|---|---|
| AS SSD | 29% | 58% | 38% | -48% | 7% | |
| Copy Game MB/s (MB/s) | 533 | 503 -6% | 319.2 -40% | 856 61% | 340 -36% | |
| Copy Program MB/s (MB/s) | 540 | 570 6% | 463.3 -14% | 281.8 -48% | 209.7 -61% | |
| Copy ISO MB/s (MB/s) | 628 | 585 -7% | 1341 114% | 1205 92% | 539 -14% | |
| Score Total (Points) | 1394 | 1911 37% | 2536 82% | 1865 34% | 455 -67% | 1373 -2% |
| Score Write (Points) | 466 | 596 28% | 608 30% | 611 31% | 42 -91% | 427 -8% |
| Score Read (Points) | 628 | 926 47% | 1316 110% | 850 35% | 305 -51% | 657 5% |
| Access Time Write * (ms) | 0.51 | 0.055 89% | 0.028 95% | 0.028 95% | 2.391 -369% | 0.056 89% |
| Access Time Read * (ms) | 0.46 | 0.059 87% | 0.044 90% | 0.034 93% | 0.044 90% | 0.069 85% |
| 4K-64 Write (MB/s) | 305.1 | 444.8 46% | 391.3 28% | 422.2 38% | 2.09 -99% | 266.3 -13% |
| 4K-64 Read (MB/s) | 466.4 | 678 45% | 1039 123% | 671 44% | 115.6 -75% | 434.3 -7% |
| 4K Write (MB/s) | 106.5 | 107.4 1% | 128.1 20% | 132.9 25% | 1.73 -98% | 95 -11% |
| 4K Read (MB/s) | 39.16 | 29.36 -25% | 48.46 24% | 39.92 2% | 31.73 -19% | 38.04 -3% |
| Seq Write (MB/s) | 544 | 435.8 -20% | 885 63% | 560 3% | 377.1 -31% | 661 22% |
| Seq Read (MB/s) | 1228 | 2205 80% | 2282 86% | 1389 13% | 1574 28% | 1850 51% |
* ... Moindre est la valeur, meilleures sont les performances

| 3DMark 11 Performance | 2149 points | |
| 3DMark Cloud Gate Standard Score | 9459 points | |
Aide | ||
| Bas | Moyen | Élevé | Ultra | |
|---|---|---|---|---|
| BioShock Infinite (2013) | 58.6 | 33.8 | 30.3 | 9.6 |
Degré de la nuisance sonore
| Au repos |
| 27.9 / 27.9 / 29.3 dB(A) |
| Fortement sollicité |
| 32 / 39.3 dB(A) |
 | ||
30 dB silencieux 40 dB(A) audible 50 dB(A) bruyant |
||
min: | ||
| Lenovo Yoga C930-13IKB 81C4 UHD Graphics 620, i5-8550U, SK hynix PC401 HFS256GD9TNG | Dell XPS 13 9370 i7 UHD UHD Graphics 620, i5-8550U, Toshiba XG5 KXG50ZNV512G | Lenovo Yoga 920-13IKB-80Y7 UHD Graphics 620, i5-8550U, Samsung PM961 MZVLW256HEHP | Asus VivoBook Flip 14 TP412UA-DB51T UHD Graphics 620, i5-8250U, Micron 1100 MTFDDAV256TBN | HP Spectre x360 13-ae048ng UHD Graphics 620, i5-8550U, Toshiba NVMe THNSN51T02DUK | Acer Spin 3 SP314-51-548L UHD Graphics 620, i5-8250U, Micron 1100 MTFDDAV256TBN | Lenovo Yoga C930-13IKB UHD Graphics 620, i5-8250U, SK hynix PC401 HFS256GD9TNG | |
|---|---|---|---|---|---|---|---|
| Noise | -1% | -0% | -2% | -3% | -10% | 0% | |
| arrêt / environnement * (dB) | 27.9 | 28 -0% | 28 -0% | 28.4 -2% | 30.13 -8% | 30 -8% | 29.3 -5% |
| Idle Minimum * (dB) | 27.9 | 28 -0% | 28 -0% | 28.4 -2% | 30.13 -8% | 30 -8% | 29.3 -5% |
| Idle Average * (dB) | 27.9 | 28 -0% | 28.8 -3% | 28.4 -2% | 30 -8% | 30 -8% | 29.3 -5% |
| Idle Maximum * (dB) | 29.3 | 28 4% | 30.3 -3% | 28.4 3% | 30.13 -3% | 30 -2% | 29.7 -1% |
| Load Average * (dB) | 32 | 32.5 -2% | 34.5 -8% | 35.7 -12% | 33.4 -4% | 38.5 -20% | 31.8 1% |
| Load Maximum * (dB) | 39.3 | 42.2 -7% | 34.3 13% | 39 1% | 33 16% | 44 -12% | 32.7 17% |
* ... Moindre est la valeur, meilleures sont les performances
(-) La température maximale du côté supérieur est de 45.4 °C / 114 F, par rapport à la moyenne de 35.4 °C / 96 F, allant de 19.6 à 60 °C pour la classe Convertible.
(±) Le fond chauffe jusqu'à un maximum de 44.2 °C / 112 F, contre une moyenne de 36.9 °C / 98 F
(+) En utilisation inactive, la température moyenne du côté supérieur est de 29.3 °C / 85 F, par rapport à la moyenne du dispositif de 30.3 °C / 87 F.
(+) Les repose-poignets et le pavé tactile atteignent la température maximale de la peau (33.2 °C / 91.8 F) et ne sont donc pas chauds.
(-) La température moyenne de la zone de l'appui-paume de dispositifs similaires était de 28 °C / 82.4 F (-5.2 °C / #-9.4 F).
| Éteint/en veille | |
| Au repos | |
| Fortement sollicité |
|
Légende:
min: | |
| Lenovo Yoga C930-13IKB 81C4 i5-8550U, UHD Graphics 620, SK hynix PC401 HFS256GD9TNG, IPS, 1920x1080, 13.9" | Dell XPS 13 9370 i7 UHD i5-8550U, UHD Graphics 620, Toshiba XG5 KXG50ZNV512G, IPS, 3840x2160, 13.3" | Lenovo Yoga 920-13IKB-80Y7 i5-8550U, UHD Graphics 620, Samsung PM961 MZVLW256HEHP, IPS, 1920x1080, 13.9" | Asus VivoBook Flip 14 TP412UA-DB51T i5-8250U, UHD Graphics 620, Micron 1100 MTFDDAV256TBN, IPS, 1920x1080, 14" | HP Spectre x360 13-ae048ng i5-8550U, UHD Graphics 620, Toshiba NVMe THNSN51T02DUK, IPS, 1920x1080, 13.3" | Acer Spin 3 SP314-51-548L i5-8250U, UHD Graphics 620, Micron 1100 MTFDDAV256TBN, IPS, 1920x1080, 14" | Lenovo Yoga C930-13IKB i5-8250U, UHD Graphics 620, SK hynix PC401 HFS256GD9TNG, IPS, 1920x1080, 13.9" | |
|---|---|---|---|---|---|---|---|
| Power Consumption | -1% | 27% | 32% | 26% | 38% | 11% | |
| Idle Minimum * (Watt) | 3.4 | 5 -47% | 3.1 9% | 3.3 3% | 3.2 6% | 2.9 15% | 3.3 3% |
| Idle Average * (Watt) | 7.5 | 8.3 -11% | 6.6 12% | 5.2 31% | 6 20% | 5.2 31% | 6.8 9% |
| Idle Maximum * (Watt) | 11.8 | 8.8 25% | 7 41% | 5.6 53% | 9.2 22% | 5.4 54% | 9.5 19% |
| Load Average * (Watt) | 47.7 | 46.4 3% | 35.2 26% | 32.9 31% | 29.5 38% | 29.4 38% | 40.8 14% |
| Load Maximum * (Watt) | 63.2 | 48.6 23% | 34.6 45% | 35.2 44% | 35.6 44% | 29.6 53% | 57 10% |
* ... Moindre est la valeur, meilleures sont les performances
| Lenovo Yoga C930-13IKB 81C4 i5-8550U, UHD Graphics 620, 60 Wh | Dell XPS 13 9370 i7 UHD i5-8550U, UHD Graphics 620, 52 Wh | Lenovo Yoga 920-13IKB-80Y7 i5-8550U, UHD Graphics 620, 70 Wh | Lenovo Yoga 910-13IKB-80VF004CGE i7-7500U, HD Graphics 620, 78 Wh | Asus VivoBook Flip 14 TP412UA-DB51T i5-8250U, UHD Graphics 620, 42 Wh | HP Spectre x360 13-ae048ng i5-8550U, UHD Graphics 620, 60 Wh | Acer Spin 3 SP314-51-548L i5-8250U, UHD Graphics 620, 52.5 Wh | Lenovo Yoga C930-13IKB i5-8250U, UHD Graphics 620, 60 Wh | |
|---|---|---|---|---|---|---|---|---|
| Autonomie de la batterie | -30% | 3% | -4% | -14% | -21% | -25% | -17% | |
| WiFi v1.3 (h) | 11.1 | 7.8 -30% | 11.4 3% | 10.7 -4% | 9.6 -14% | 8.8 -21% | 8.3 -25% | 9.2 -17% |
| Reader / Idle (h) | 13.7 | 27.6 | 17.8 | 23.9 | ||||
| Load (h) | 1.8 | 2.3 | 2.9 | 2.8 | 2.1 |
Points positifs
Points négatifs
Dans quelle mesure le Yoga C930 Core i7 est plus puissant que la version Core i5 ? Vous pouvez au mieux vous attendre à une hausse de 20 % des performances brutes quand les machines sont fortement sollicitées. La version Core i7 maintient mieux sa fréquence Turbo Boost, sans pour autant impacter l’autonomie pour les tâches du quotidien, comme la navigation web, le streaming vidéo, ou le traitement de texte. Ceux qui savent qu’ils profiteront de cette puissance supplémentaire bénéficieront de la version plus chère.
Pour tous les autres, la différence de performances entre les versions Core i5 et Core i7 n’est pas notable. Le Core i5-8250U est plus que suffisant pour la navigation web, le streaming et le multitâche. Le plus gros point faible du Yoga C930 est sa partie graphique, la série n’ayant toujours pas de version avec carte graphique dédiée Nvidia ou même des versions Iris. Ces performances graphiques limitées pour l’édition d’images ou de vidéos seront plus visibles que la différence réduite entre le Core i5 et le Core i7.
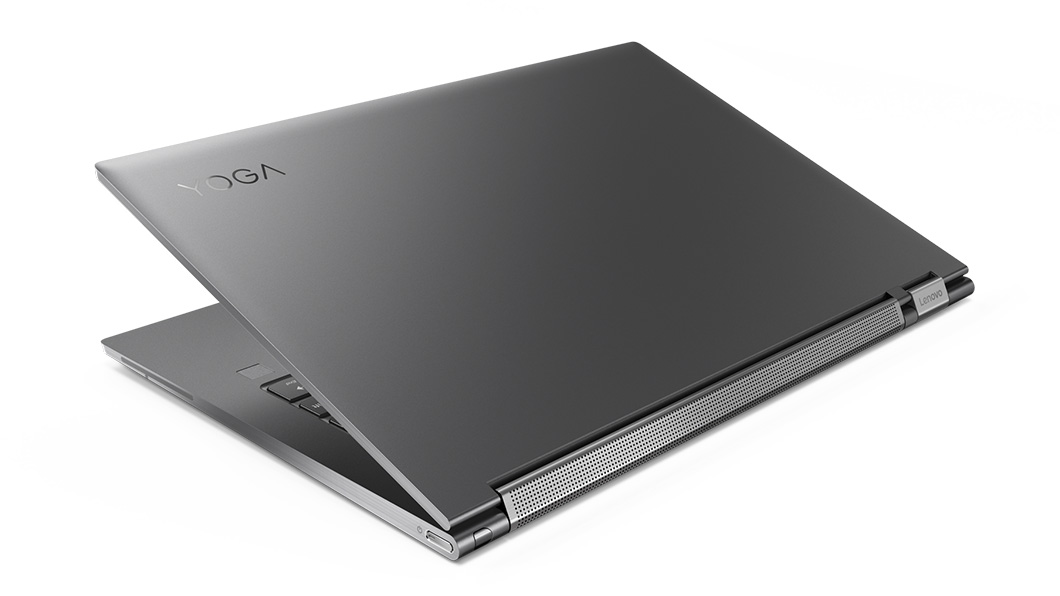
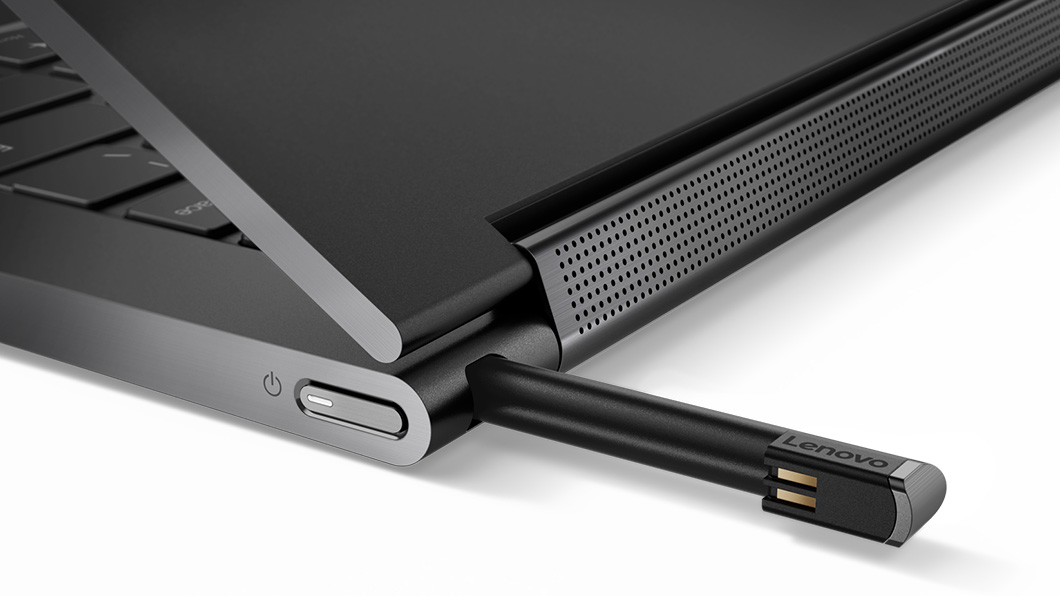
Le Yoga C930 ressemble de plus en plus à un convertible hybride grand public / professionnel, avec sa conception très portable et son stylet actif très utile. Les tâches basiques de bureau ou de spectacle familial tourneront sans souci sur la version Core i5. Ceux qui voudraient plus de puissance graphique devraient regarder du côté du MateBook X Pro, du MSI PS42, ou du XPS 13 avec graphiques Iris.
L’intégralité de cette critique est disponible en anglais en suivant ce lien.
Lenovo Yoga C930-13IKB 81C4
- 10/17/2019 v7 (old)
Allen Ngo
Price comparison
