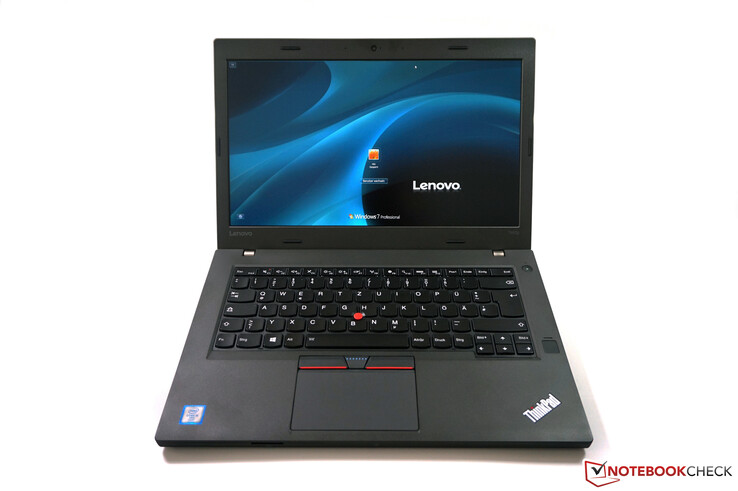
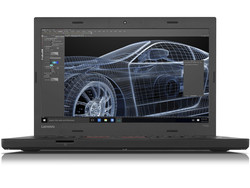
Courte critique du PC portable Lenovo ThinkPad T460p (Core i7, GeForce 940MX)
Top 10
» Le Top 10 des PC portables multimédia
» Le Top 10 des PC portables de jeu
» Le Top 10 des PC portables de jeu légers
» Le Top 10 des ordinateurs portables bureautiques
» Le Top 10 des PC portables bureautiques premium/professionnels
» Le Top 10 des Stations de travail mobiles
» Le Top 10 des Ultraportables
» Le Top 10 des Ultrabooks
» Le Top 10 des Convertibles
» Le Top 10 des Tablettes
» Le Top 10 des Tablettes Windows
» Le Top 10 des Smartphones
» Le Top 10 des PC Portables á moins de 300 euros
» Le Top 10 des PC Portables á moins de 500 euros
» Le Top 25 des meilleurs écrans d'ordinateurs
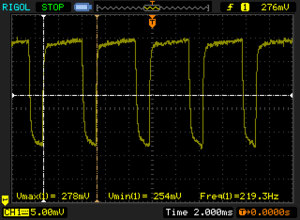
Scintillement / MLI (Modulation de largeur d'impulsion)
| Scintillement / MLI (Modulation de largeur d'impulsion) décelé | 220 Hz | ||
Le rétroéclairage de l'écran scintille à la fréquence de 220 Hz (certainement du fait de l'utilisation d'une MDI - Modulation de largeur d'impulsion) . La fréquence de rafraîchissement de 220 Hz est relativement faible, les personnes les plus sensibles devraient percevoir un scintillement et être sujettes à une fatigue oculaire accrue (avec le niveau de luminosité indiqué) En comparaison, 53 % des appareils testés n'emploient pas MDI pour assombrir leur écran. Nous avons relevé une moyenne à 8023 (minimum : 5 - maximum : 343500) Hz dans le cas où une MDI était active. | |||
| |||||||||||||||||||||||||
Homogénéité de la luminosité: 93 %
Valeur mesurée au centre, sur batterie: 290 cd/m²
Contraste: 935:1 (Valeurs des noirs: 0.31 cd/m²)
ΔE ColorChecker Calman: 3.88 | ∀{0.5-29.43 Ø4.76}
ΔE Greyscale Calman: 5.47 | ∀{0.09-98 Ø5}
96.64% sRGB (Argyll 1.6.3 3D)
63.3% AdobeRGB 1998 (Argyll 1.6.3 3D)
68.8% AdobeRGB 1998 (Argyll 3D)
96.5% sRGB (Argyll 3D)
66.9% Display P3 (Argyll 3D)
Gamma: 2.33
CCT: 6469 K
| Lenovo ThinkPad T460p-20FXS05500 2560 x 1440 IPS-Panel | Lenovo ThinkPad T460p-20FW000DGE 1920 x 1080 IPS-Panel | Lenovo ThinkPad T460s-20FA003GGE 2560 x 1440 IPS-Panel | HP EliteBook 840 G3 T9X59ET#ABD 1920 x 1080 TN-Panel | Dell Latitude 14 7000 Series E7470 2560 x 1440 IPS-Panel | |
|---|---|---|---|---|---|
| Display | -41% | 2% | -26% | 0% | |
| Display P3 Coverage (%) | 66.9 | 38.78 -42% | 68.7 3% | 48.93 -27% | 67.2 0% |
| sRGB Coverage (%) | 96.5 | 58.3 -40% | 98.1 2% | 73.7 -24% | 95.9 -1% |
| AdobeRGB 1998 Coverage (%) | 68.8 | 40.08 -42% | 70.4 2% | 50.5 -27% | 69.3 1% |
| Response Times | 10% | -6% | -7% | -17% | |
| Response Time Grey 50% / Grey 80% * (ms) | 38.4 ? | 30.8 ? 20% | 35.6 ? 7% | 43 ? -12% | 48 ? -25% |
| Response Time Black / White * (ms) | 24.8 ? | 24.8 ? -0% | 29.2 ? -18% | 25 ? -1% | 27 ? -9% |
| PWM Frequency (Hz) | 220 | 220 ? | 204 ? | ||
| Screen | -3% | -5% | -48% | 17% | |
| Brightness middle (cd/m²) | 290 | 269 -7% | 257 -11% | 366 26% | 380 31% |
| Brightness (cd/m²) | 280 | 255 -9% | 248 -11% | 336 20% | 354 26% |
| Brightness Distribution (%) | 93 | 91 -2% | 94 1% | 87 -6% | 81 -13% |
| Black Level * (cd/m²) | 0.31 | 0.24 23% | 0.26 16% | 0.65 -110% | 0.26 16% |
| Contrast (:1) | 935 | 1121 20% | 988 6% | 563 -40% | 1462 56% |
| Colorchecker dE 2000 * | 3.88 | 4.27 -10% | 4.59 -18% | 10.26 -164% | 3.11 20% |
| Colorchecker dE 2000 max. * | 8.19 | 8.82 -8% | 9.72 -19% | 6.73 18% | |
| Greyscale dE 2000 * | 5.47 | 2.95 46% | 6.38 -17% | 11.51 -110% | 4.35 20% |
| Gamma | 2.33 94% | 2.12 104% | 2.51 88% | 2.4 92% | 2.37 93% |
| CCT | 6469 100% | 7049 92% | 6238 104% | 12725 51% | 6771 96% |
| Color Space (Percent of AdobeRGB 1998) (%) | 63.3 | 37 -42% | 65 3% | 47 -26% | 62 -2% |
| Color Space (Percent of sRGB) (%) | 96.64 | 58.2 -40% | 98 1% | 74 -23% | 96 -1% |
| Moyenne finale (programmes/paramètres) | -11% /
-9% | -3% /
-4% | -27% /
-37% | 0% /
9% |
* ... Moindre est la valeur, meilleures sont les performances
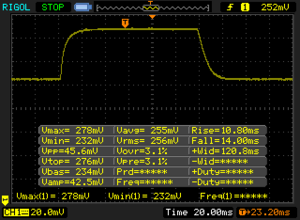
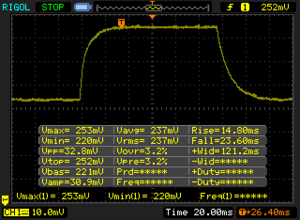
Temps de réponse de l'écran
| ↔ Temps de réponse noir à blanc | ||
|---|---|---|
| 24.8 ms ... hausse ↗ et chute ↘ combinées | ↗ 10.8 ms hausse | |
| ↘ 14 ms chute | ||
| L'écran montre de bons temps de réponse, mais insuffisant pour du jeu compétitif. En comparaison, tous les appareils testés affichent entre 0.1 (minimum) et 240 (maximum) ms. » 57 % des appareils testés affichent de meilleures performances. Cela signifie que les latences relevées sont moins bonnes que la moyenne (20.1 ms) de tous les appareils testés. | ||
| ↔ Temps de réponse gris 50% à gris 80% | ||
| 38.4 ms ... hausse ↗ et chute ↘ combinées | ↗ 14.8 ms hausse | |
| ↘ 23.6 ms chute | ||
| L'écran souffre de latences très élevées, à éviter pour le jeu. En comparaison, tous les appareils testés affichent entre 0.165 (minimum) et 636 (maximum) ms. » 57 % des appareils testés affichent de meilleures performances. Cela signifie que les latences relevées sont moins bonnes que la moyenne (31.5 ms) de tous les appareils testés. | ||
| Cinebench R15 | |
| CPU Single 64Bit | |
| Lenovo ThinkPad T460p-20FXS05500 | |
| Lenovo ThinkPad T460p | |
| Dell Latitude 14 7000 Series E7470 | |
| Lenovo ThinkPad T460s-20FA003GGE | |
| Lenovo ThinkPad T440p 20AN-006VGE | |
| HP EliteBook 840 G3 T9X59ET#ABD | |
| Lenovo ThinkPad T460s-20F9003SGE | |
| CPU Multi 64Bit | |
| Lenovo ThinkPad T460p-20FXS05500 | |
| Lenovo ThinkPad T440p 20AN-006VGE | |
| Lenovo ThinkPad T460p | |
| Lenovo ThinkPad T460s-20FA003GGE | |
| Dell Latitude 14 7000 Series E7470 | |
| HP EliteBook 840 G3 T9X59ET#ABD | |
| Lenovo ThinkPad T460s-20F9003SGE | |
| Cinebench R11.5 | |
| CPU Single 64Bit | |
| Lenovo ThinkPad T460p-20FXS05500 | |
| Lenovo ThinkPad T460p | |
| Dell Latitude 14 7000 Series E7470 | |
| Lenovo ThinkPad T460s-20FA003GGE | |
| Lenovo ThinkPad T440p 20AN-006VGE | |
| Lenovo ThinkPad T460s-20F9003SGE | |
| CPU Multi 64Bit | |
| Lenovo ThinkPad T460p-20FXS05500 | |
| Lenovo ThinkPad T460p | |
| Lenovo ThinkPad T440p 20AN-006VGE | |
| Lenovo ThinkPad T460s-20FA003GGE | |
| Dell Latitude 14 7000 Series E7470 | |
| Lenovo ThinkPad T460s-20F9003SGE | |
| X264 HD Benchmark 4.0 | |
| Pass 1 | |
| Lenovo ThinkPad T460p-20FXS05500 | |
| Lenovo ThinkPad T460s-20FA003GGE | |
| Pass 2 | |
| Lenovo ThinkPad T460p-20FXS05500 | |
| Lenovo ThinkPad T460s-20FA003GGE | |
| Lenovo ThinkPad T460p-20FXS05500 Samsung SSD PM871 MZ7LN512HCHP | Lenovo ThinkPad T460s-20FA003GGE Samsung SSD SM951a 512GB M.2 PCIe 3.0 x4 NVMe (MZVKV512) | Lenovo ThinkPad T460s-20F9003SGE Samsung CM871 MZ7LF192HCGS | HP EliteBook 840 G3 T9X59ET#ABD Samsung SSD PM851 256 GB MZNTE256HMHP | Dell Latitude 14 7000 Series E7470 Samsung SSD PM851 M.2 2280 256GB | |
|---|---|---|---|---|---|
| AS SSD | 168% | -55% | -12% | -6% | |
| Seq Read (MB/s) | 510 | 2039 300% | 471 -8% | 505 -1% | 495.5 -3% |
| Seq Write (MB/s) | 448.3 | 1407 214% | 163.3 -64% | 231.6 -48% | 283.7 -37% |
| 4K Read (MB/s) | 23.3 | 45.41 95% | 14.18 -39% | 25.24 8% | 30.91 33% |
| 4K Write (MB/s) | 74 | 114.4 55% | 34.38 -54% | 72.4 -2% | 85.1 15% |
| 4K-64 Read (MB/s) | 338 | 968 186% | 85.4 -75% | 362 7% | 336.1 -1% |
| 4K-64 Write (MB/s) | 286.8 | 366 28% | 33.4 -88% | 190.6 -34% | 170 -41% |
| Copy ISO MB/s (MB/s) | 285 | 1135 298% | 119.9 -58% |
| PCMark 7 - Score | |
| Lenovo ThinkPad T460p-20FXS05500 | |
| Dell Latitude 14 7000 Series E7470 | |
| Lenovo ThinkPad T460s-20FA003GGE | |
| Lenovo ThinkPad T460p | |
| PCMark 8 | |
| Home Score Accelerated v2 | |
| Lenovo ThinkPad T460s-20FA003GGE | |
| Dell Latitude 14 7000 Series E7470 | |
| Lenovo ThinkPad T460p-20FXS05500 | |
| HP EliteBook 840 G3 T9X59ET#ABD | |
| Lenovo ThinkPad T460p | |
| Lenovo ThinkPad T460s-20F9003SGE | |
| Creative Score Accelerated v2 | |
| Lenovo ThinkPad T460s-20FA003GGE | |
| Lenovo ThinkPad T460p-20FXS05500 | |
| Lenovo ThinkPad T460s-20F9003SGE | |
| Work Score Accelerated v2 | |
| Dell Latitude 14 7000 Series E7470 | |
| Lenovo ThinkPad T460p-20FXS05500 | |
| Lenovo ThinkPad T460s-20FA003GGE | |
| HP EliteBook 840 G3 T9X59ET#ABD | |
| Lenovo ThinkPad T460s-20F9003SGE | |
| Lenovo ThinkPad T460p | |
| PCMark 7 Score | 5585 points | |
| PCMark 8 Home Score Accelerated v2 | 3292 points | |
| PCMark 8 Creative Score Accelerated v2 | 4241 points | |
| PCMark 8 Work Score Accelerated v2 | 4463 points | |
Aide | ||
| 3DMark 11 - 1280x720 Performance GPU | |
| Lenovo ThinkPad T460p-20FXS05500 | |
| Lenovo ThinkPad T450s-20BWS1UT00 | |
| Lenovo ThinkPad T440p 20AN-006VGE | |
| Lenovo ThinkPad T460s-20FA003GGE | |
| HP EliteBook 840 G3 T9X59ET#ABD | |
| Dell Latitude 14 7000 Series E7470 | |
| Lenovo ThinkPad T460p | |
| 3DMark - 1920x1080 Fire Strike Graphics | |
| Lenovo ThinkPad T460p-20FXS05500 | |
| Lenovo ThinkPad T450s-20BWS1UT00 | |
| Lenovo ThinkPad T440p 20AN-006VGE | |
| Lenovo ThinkPad T460s-20FA003GGE | |
| HP EliteBook 840 G3 T9X59ET#ABD | |
| Dell Latitude 14 7000 Series E7470 | |
| Lenovo ThinkPad T460p | |
| 3DMark 06 Standard Score | 14195 points | |
| 3DMark 11 Performance | 2805 points | |
| 3DMark Ice Storm Standard Score | 41687 points | |
| 3DMark Cloud Gate Standard Score | 8503 points | |
| 3DMark Fire Strike Score | 1537 points | |
Aide | ||
| Tomb Raider | |
| 1024x768 Low Preset | |
| Lenovo ThinkPad T460p-20FXS05500 | |
| Lenovo ThinkPad T450s-20BWS1UT00 | |
| Lenovo ThinkPad T460s-20FA003GGE | |
| Lenovo ThinkPad T460p | |
| 1366x768 Normal Preset AA:FX AF:4x | |
| Lenovo ThinkPad T460p-20FXS05500 | |
| Lenovo ThinkPad T450s-20BWS1UT00 | |
| Lenovo ThinkPad T460s-20FA003GGE | |
| Lenovo ThinkPad T460p | |
| 1366x768 High Preset AA:FX AF:8x | |
| Lenovo ThinkPad T460p-20FXS05500 | |
| Lenovo ThinkPad T450s-20BWS1UT00 | |
| Lenovo ThinkPad T460s-20FA003GGE | |
| Lenovo ThinkPad T460p | |
| Bas | Moyen | Élevé | Ultra | |
|---|---|---|---|---|
| Diablo III (2012) | 125.6 | 103 | 83.4 | 50.6 |
| Counter-Strike: GO (2012) | 182 | 156.8 | 107.2 | 57.9 |
| Crysis 3 (2013) | 44.3 | 26.1 | 19.6 | 7.3 |
| Tomb Raider (2013) | 141.2 | 68.4 | 37.4 | 18.5 |
| BioShock Infinite (2013) | 98.7 | 55.7 | 44.8 | 15.5 |
| Metro: Last Light (2013) | 52.5 | 39.8 | 24 | 12 |
| Battlefield 4 (2013) | 67.9 | 47 | 31.7 | 12.1 |
| Thief (2014) | 37.5 | 24.8 | 20 | 9.9 |
| Sims 4 (2014) | 173.4 | 68.7 | 38 | 29 |
| Dirt Rally (2015) | 145.4 | 57.3 | 29.7 | 13 |
| FIFA 16 (2015) | 126.8 | 68.6 | 43.5 | |
| Fallout 4 (2015) | 36.5 | 22.9 | 12.3 | |
| Rise of the Tomb Raider (2016) | 29.1 | 18.7 | 11.3 |
| Lenovo ThinkPad T460p-20FXS05500 6700HQ, GeForce 940MX | Lenovo ThinkPad T460p-20FW000DGE 6440HQ, HD Graphics 530 | Lenovo ThinkPad T460s-20F9003SGE 6200U, HD Graphics 520 | Lenovo ThinkPad T460s-20FA003GGE 6600U, HD Graphics 520 | Dell Latitude 14 7000 Series E7470 6600U, HD Graphics 520 | |
|---|---|---|---|---|---|
| Noise | -11% | 2% | 0% | -1% | |
| arrêt / environnement * (dB) | 29.2 | 30 -3% | 29.1 -0% | 29.2 -0% | 31.2 -7% |
| Idle Minimum * (dB) | 29.2 | 33.7 -15% | 29.1 -0% | 29.2 -0% | 31.2 -7% |
| Idle Average * (dB) | 29.2 | 33.7 -15% | 29.1 -0% | 29.2 -0% | 31.2 -7% |
| Idle Maximum * (dB) | 29.2 | 33.7 -15% | 29.1 -0% | 29.2 -0% | 31.2 -7% |
| Load Average * (dB) | 33.5 | 36.2 -8% | 32.3 4% | 33.7 -1% | 31.9 5% |
| Load Maximum * (dB) | 38.8 | 41.9 -8% | 36.6 6% | 38.5 1% | 31.9 18% |
* ... Moindre est la valeur, meilleures sont les performances
Degré de la nuisance sonore
| Au repos |
| 29.2 / 29.2 / 29.2 dB(A) |
| Fortement sollicité |
| 33.5 / 38.8 dB(A) |
 | ||
30 dB silencieux 40 dB(A) audible 50 dB(A) bruyant |
||
min: | ||
(-) La température maximale du côté supérieur est de 51.6 °C / 125 F, par rapport à la moyenne de 34.3 °C / 94 F, allant de 21.2 à 62.5 °C pour la classe Office.
(-) Le fond chauffe jusqu'à un maximum de 55.2 °C / 131 F, contre une moyenne de 36.8 °C / 98 F
(+) En utilisation inactive, la température moyenne du côté supérieur est de 29.6 °C / 85 F, par rapport à la moyenne du dispositif de 29.5 °C / 85 F.
(-) Les repose-poignets et le pavé tactile peuvent devenir très chauds au toucher, avec un maximum de 41.1 °C / 106# F.
(-) La température moyenne de la zone de l'appui-paume de dispositifs similaires était de 27.5 °C / 81.5 F (-13.6 °C / #-24.5 F).
| Éteint/en veille | |
| Au repos | |
| Fortement sollicité |
|
Légende:
min: | |
| Lenovo ThinkPad T460p-20FXS05500 48 Wh | Lenovo ThinkPad T460p-20FW000DGE 48 Wh | Lenovo ThinkPad T440p 20AN-006VGE 100 Wh | Lenovo ThinkPad T460s-20FA003GGE 49 Wh | Dell Latitude 14 7000 Series E7470 55 Wh | |
|---|---|---|---|---|---|
| Autonomie de la batterie | -17% | 59% | 13% | 53% | |
| Reader / Idle (h) | 11 | 8.2 -25% | 14.8 35% | 13.9 26% | |
| H.264 (h) | 6 | 4.8 -20% | 8.5 42% | 6.6 10% | |
| WiFi v1.3 (h) | 5 | 4.4 -12% | 5.7 14% | 5.8 16% | |
| Load (h) | 1 | 0.9 -10% | 2 100% | 1 0% | 1.9 90% |
| WiFi (h) | 10 |
Points positifs
Points négatifs
Il n'y a pas beaucoup de choix lorsque le processeur rentre vraiment en ligne de compte. Mis à part le Dell Latitude E5470, le ThinkPad T460p est le seul 14 pouces à pouvoir s'acquitter des applications lourdes multithread grâce à son processeur quad-core. Il ne s'agit pas de son seul atout, ce ThinkPad offre aussi un châssis robuste, d'excellents périphériques d'entrée et une très bonne dalle IPS. La carte graphique dédiée GeForce mérite amplement le surcoût en étant deux fois plus rapide que le circuit graphique. On regrettera certaines absences : pas de port USB Type-C, une alimentation encombrante ou encore une autonomie un peu décevante mais en somme rien de bien critique.
Il y a bien un point qui pourrait mettre le T460p en porte-à-faux : avec le temps, la pâte thermique va perdre en potentiel et la poussière s'accumuler, ce qui pourrait se traduire par l'autobridage des performances ou des températures élevées (même sans lancer de tests synthétiques). Un problème mineur selon vous ? Pas si vous comptez utiliser ce ThinkPad pour ce à quoi il a été conçu : la performance.
Les températures du processeur approchant les 100 °C en tests synthétiques, vous voilà prévenus pour l'été !
Si la chauffe ne pose pas de problème, il n'y a aucune raison de ne pas céder à ce T460p. N'hésitez pas à voir du côté de TPFanControl pour gérer la vitesse du ventilateur à la volée...
Pour plus de détails, vous trouverez la version complète (en anglais) de ce test ici.
Lenovo ThinkPad T460p-20FXS05500
- 04/18/2016 v5.1 (old)
Till Schönborn


