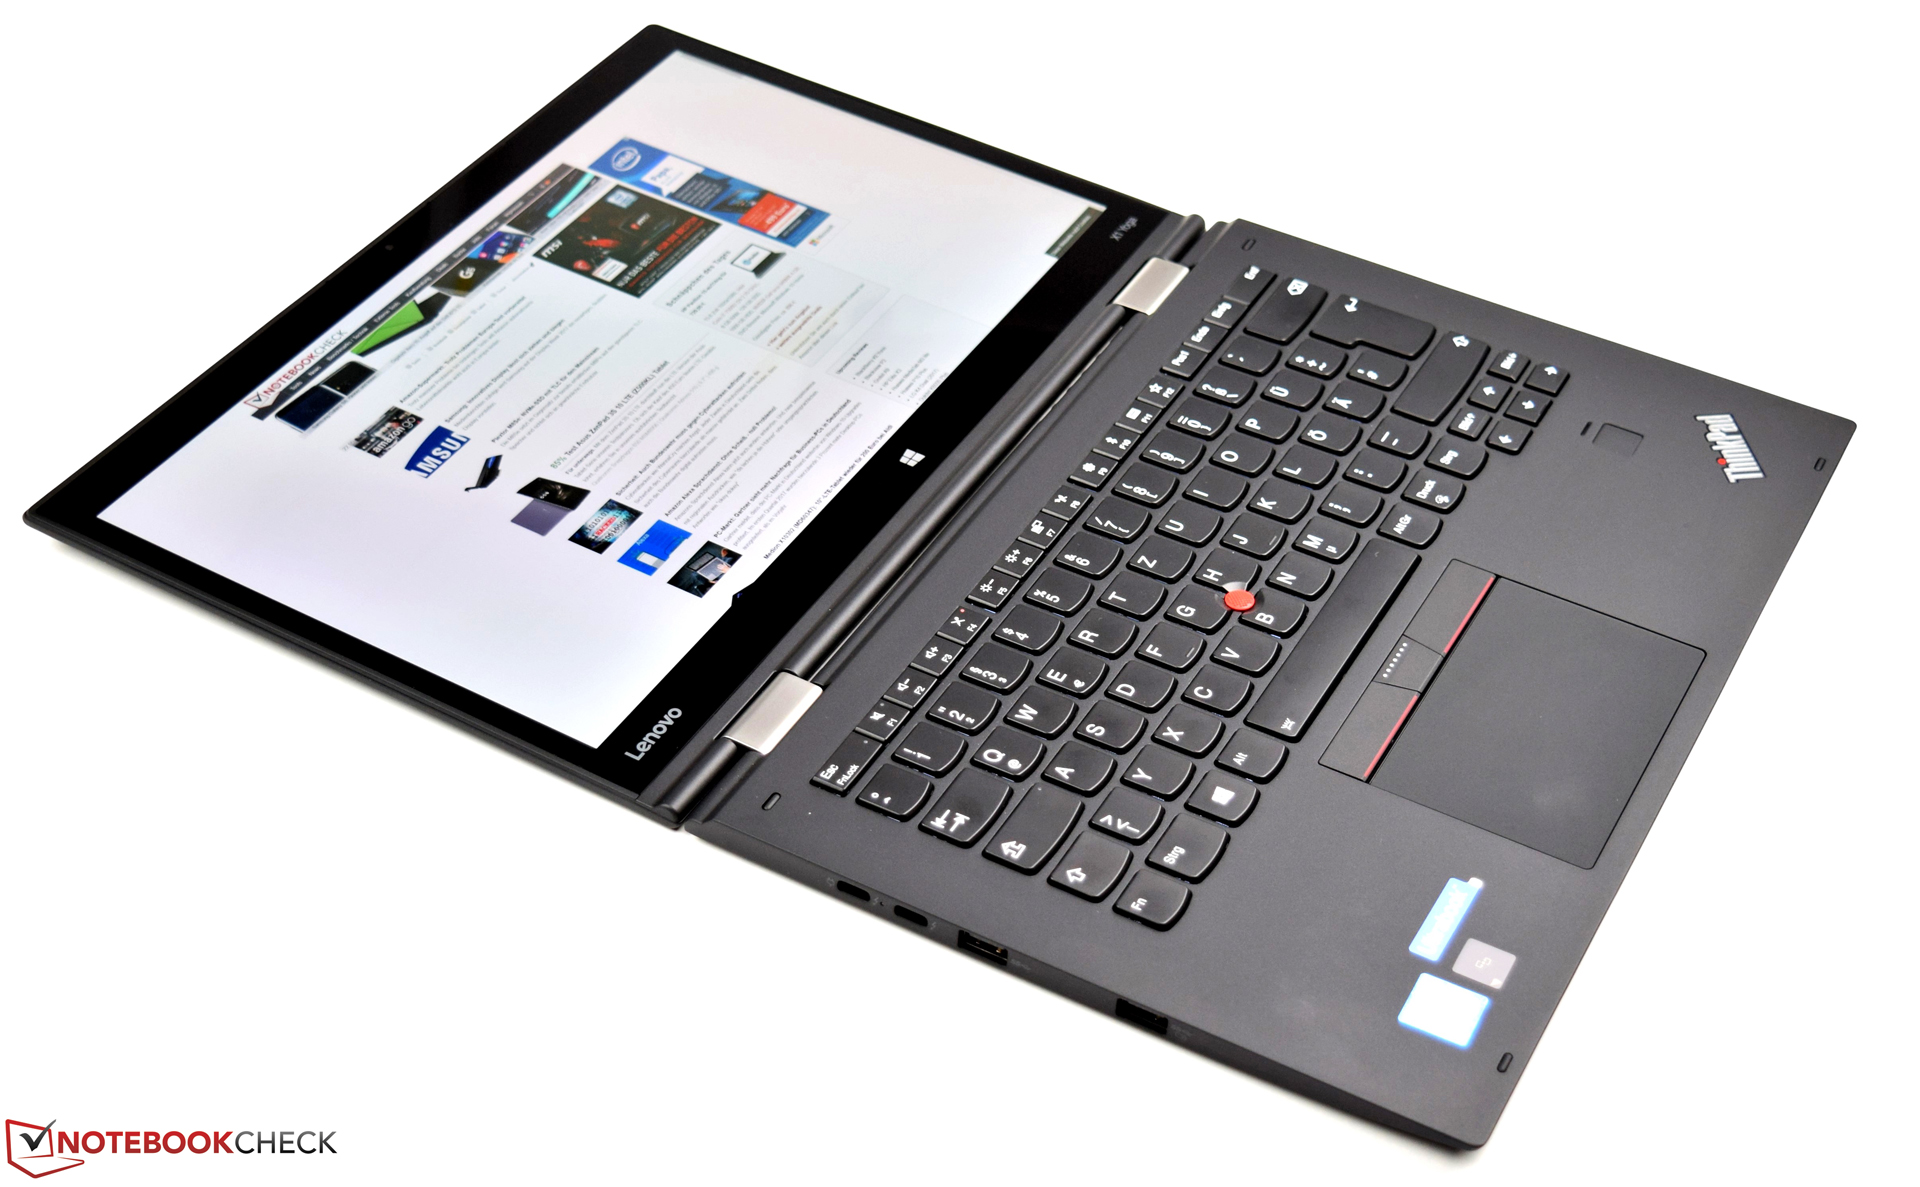
Courte critique du convertible Lenovo ThinkPad X1 Yoga 2017 (Core i7, OLED)


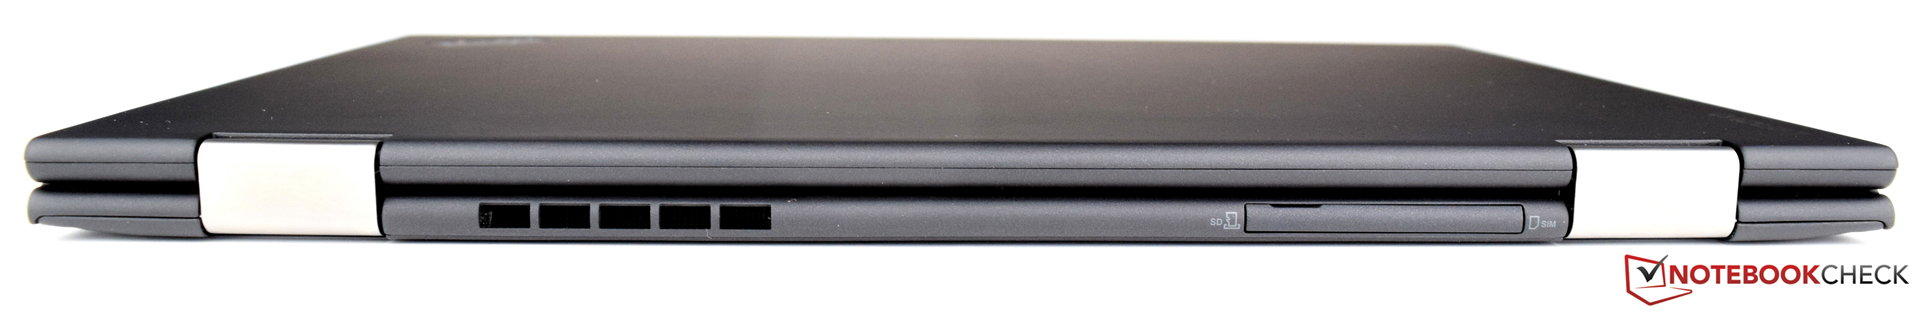

| SD Card Reader | |
| average JPG Copy Test (av. of 3 runs) | |
| Microsoft Surface Book with Performance Base | |
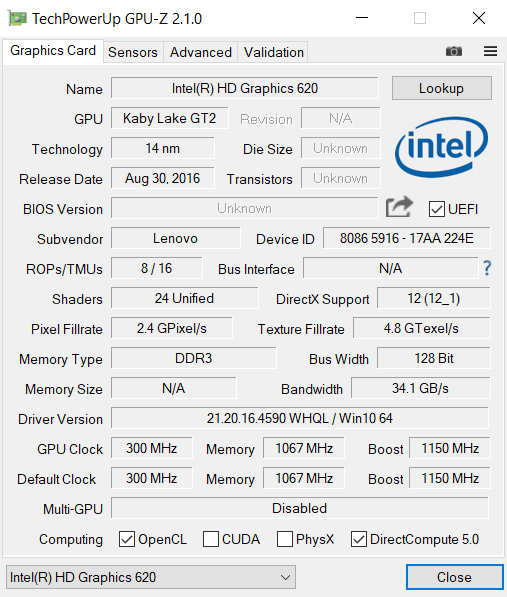
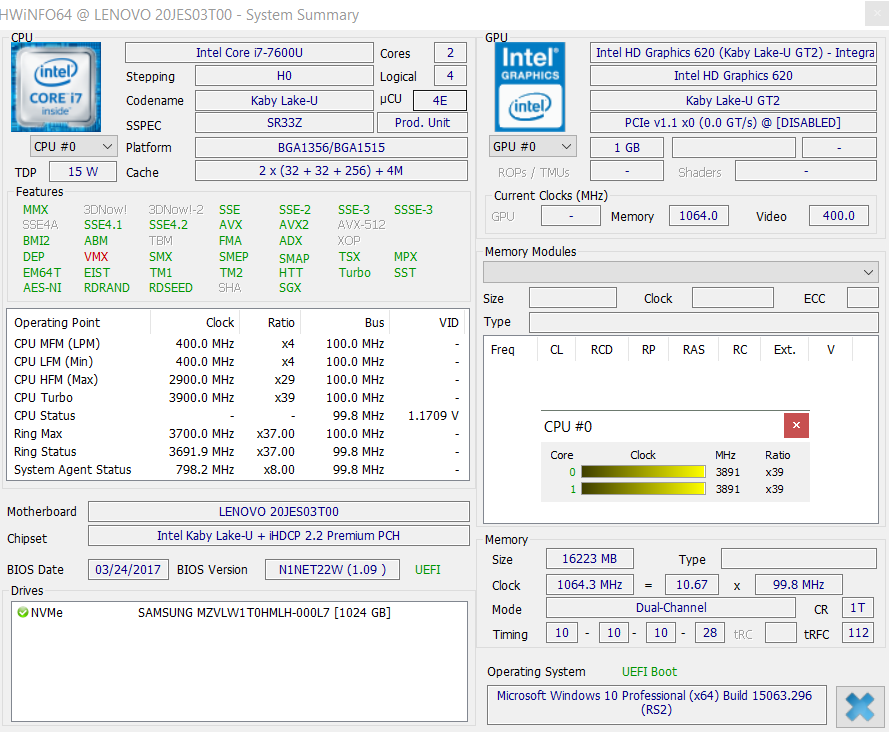
| Lenovo ThinkPad X1 Yoga 2017 20JES03T00 | |
| Dell Latitude 12 5285 2-in-1 | |
| maximum AS SSD Seq Read Test (1GB) | |
| Microsoft Surface Book with Performance Base | |
| Lenovo ThinkPad X1 Yoga 2017 20JES03T00 | |
| Dell Latitude 12 5285 2-in-1 | |
| |||||||||||||||||||||||||
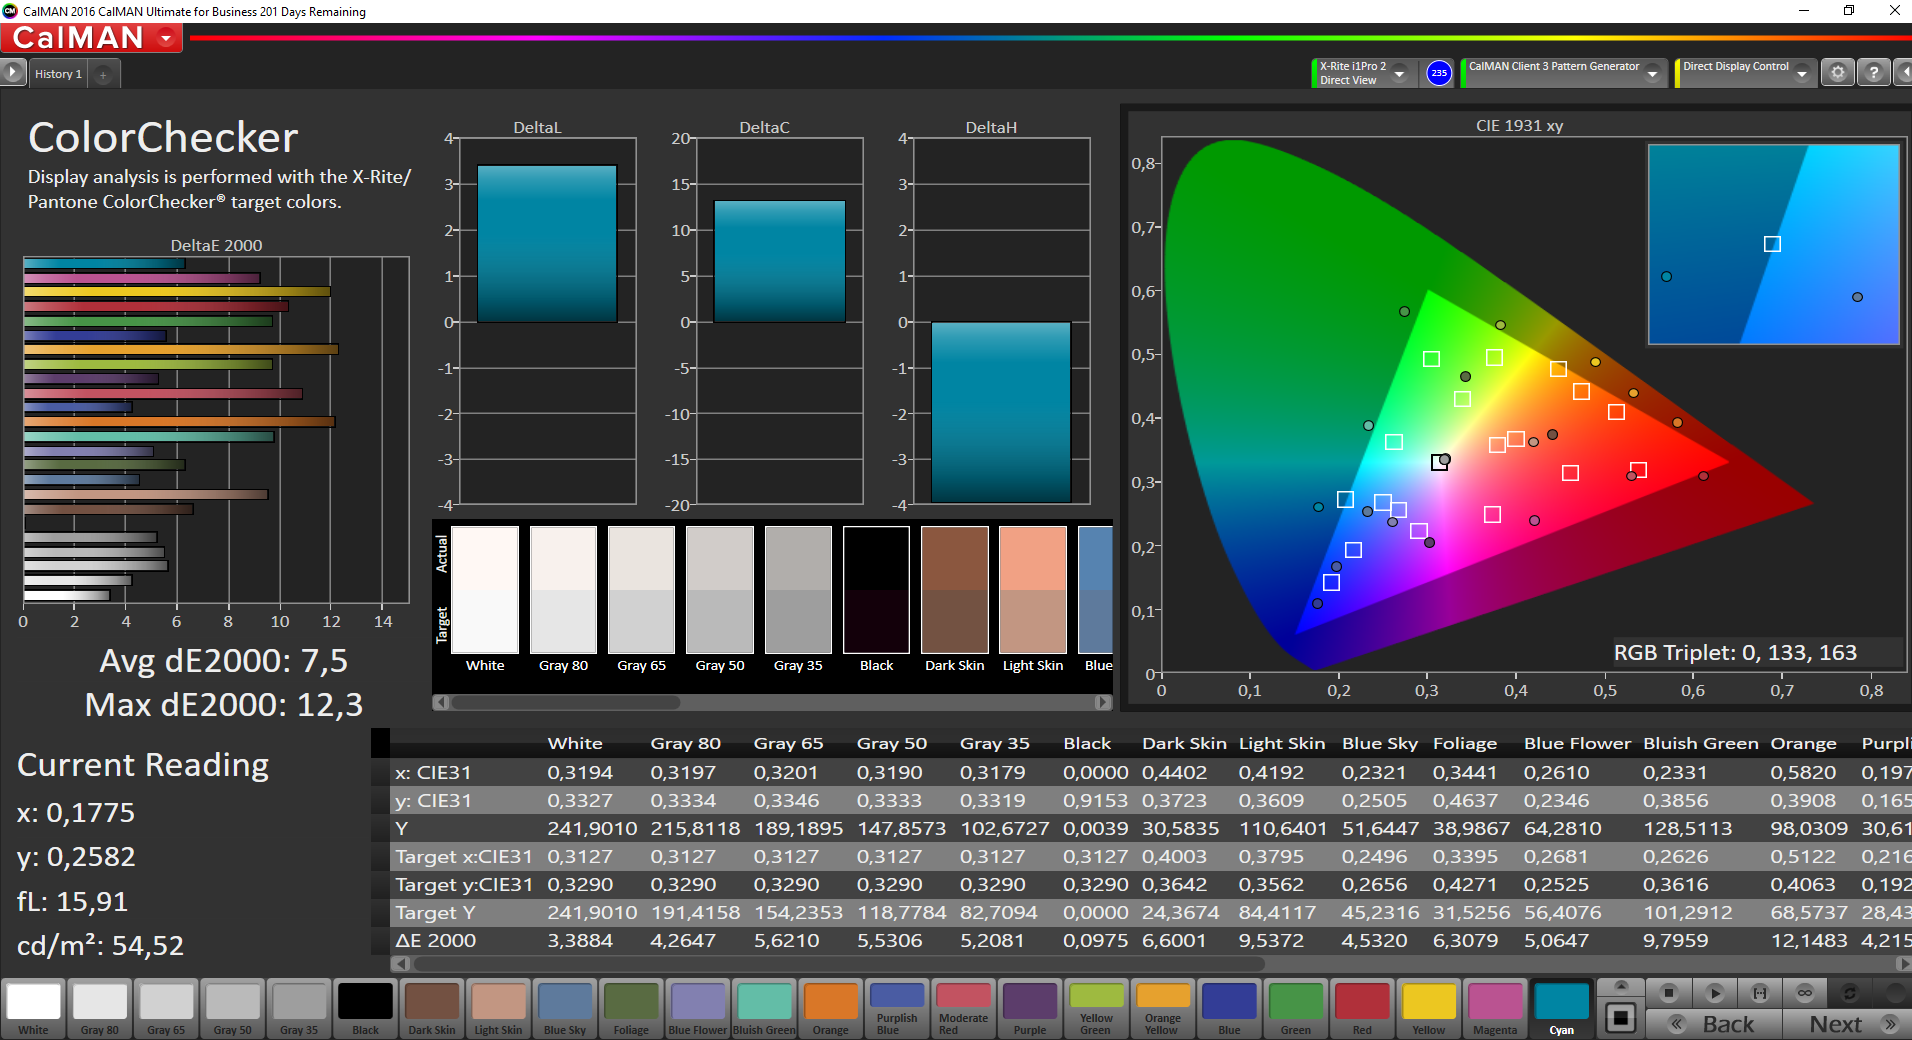
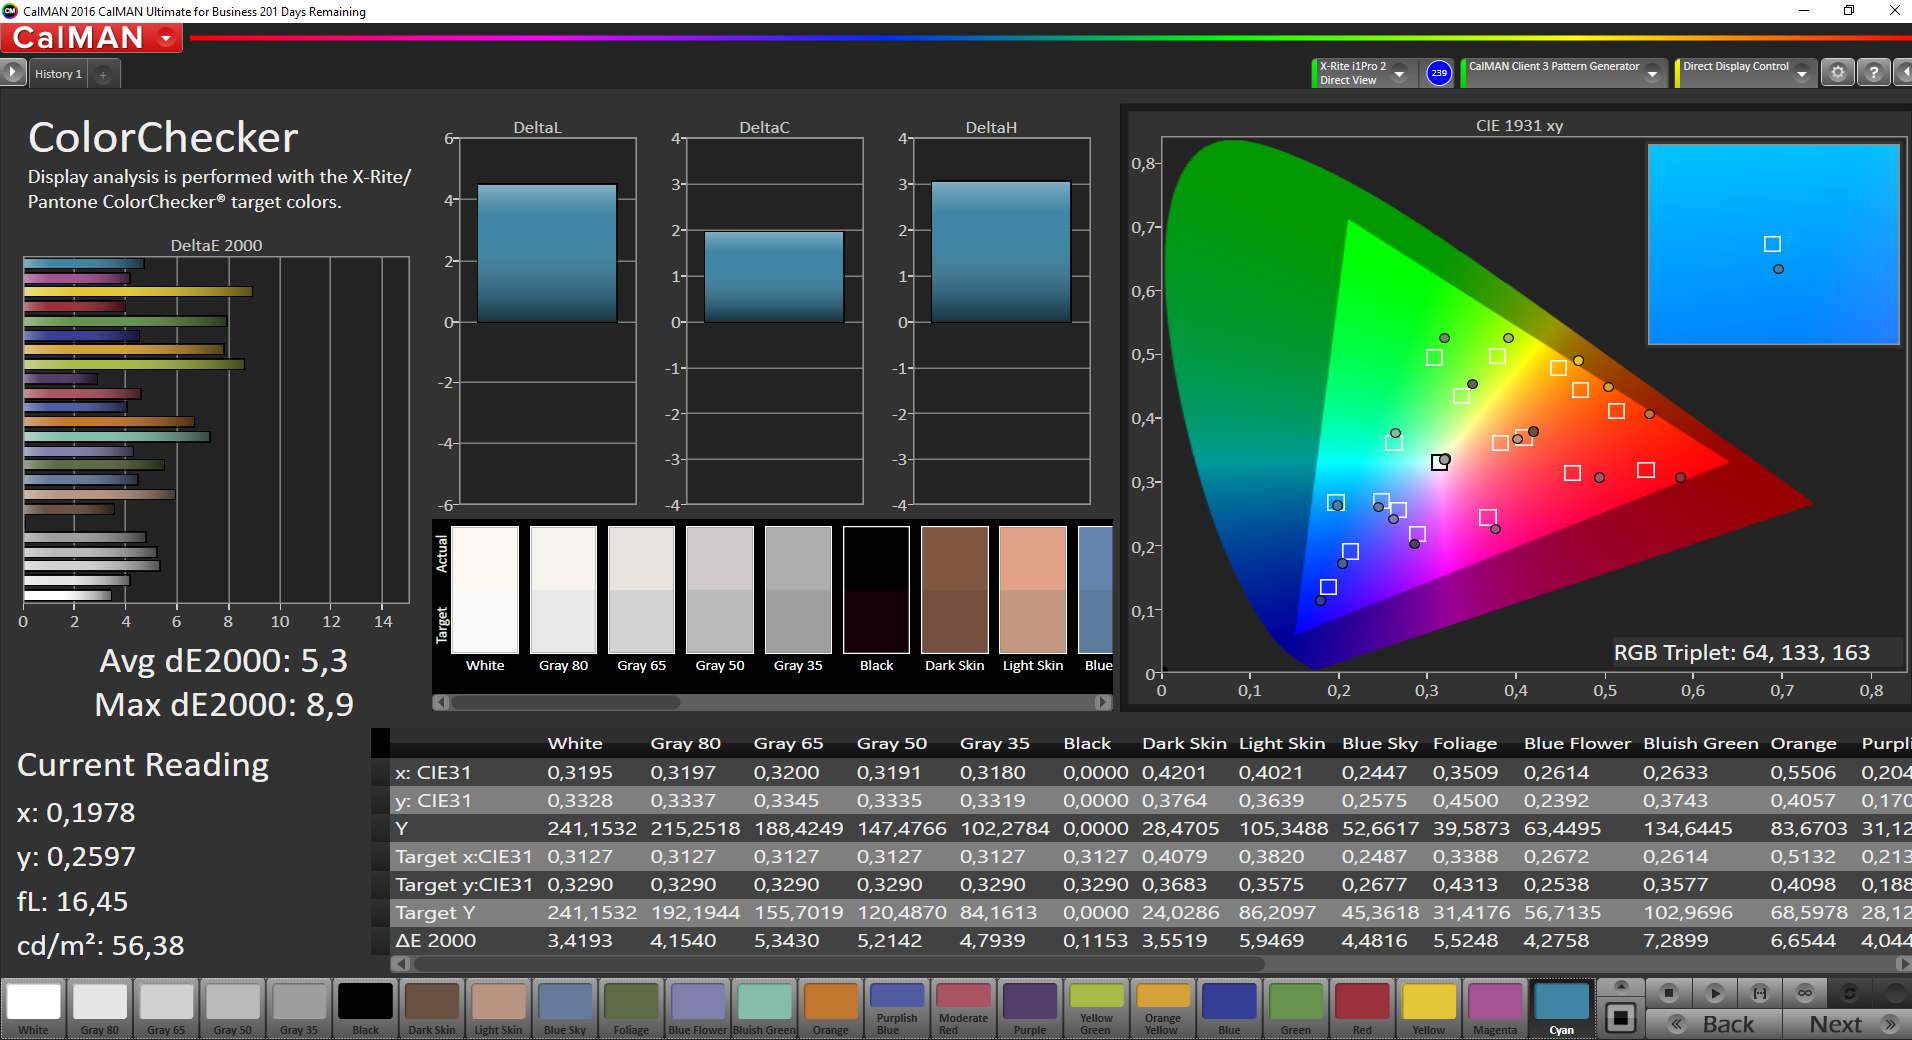
Homogénéité de la luminosité: 95 %
Valeur mesurée au centre, sur batterie: 242 cd/m²
Contraste: ∞:1 (Valeurs des noirs: 0 cd/m²)
ΔE ColorChecker Calman: 5.3 | ∀{0.5-29.43 Ø4.71}
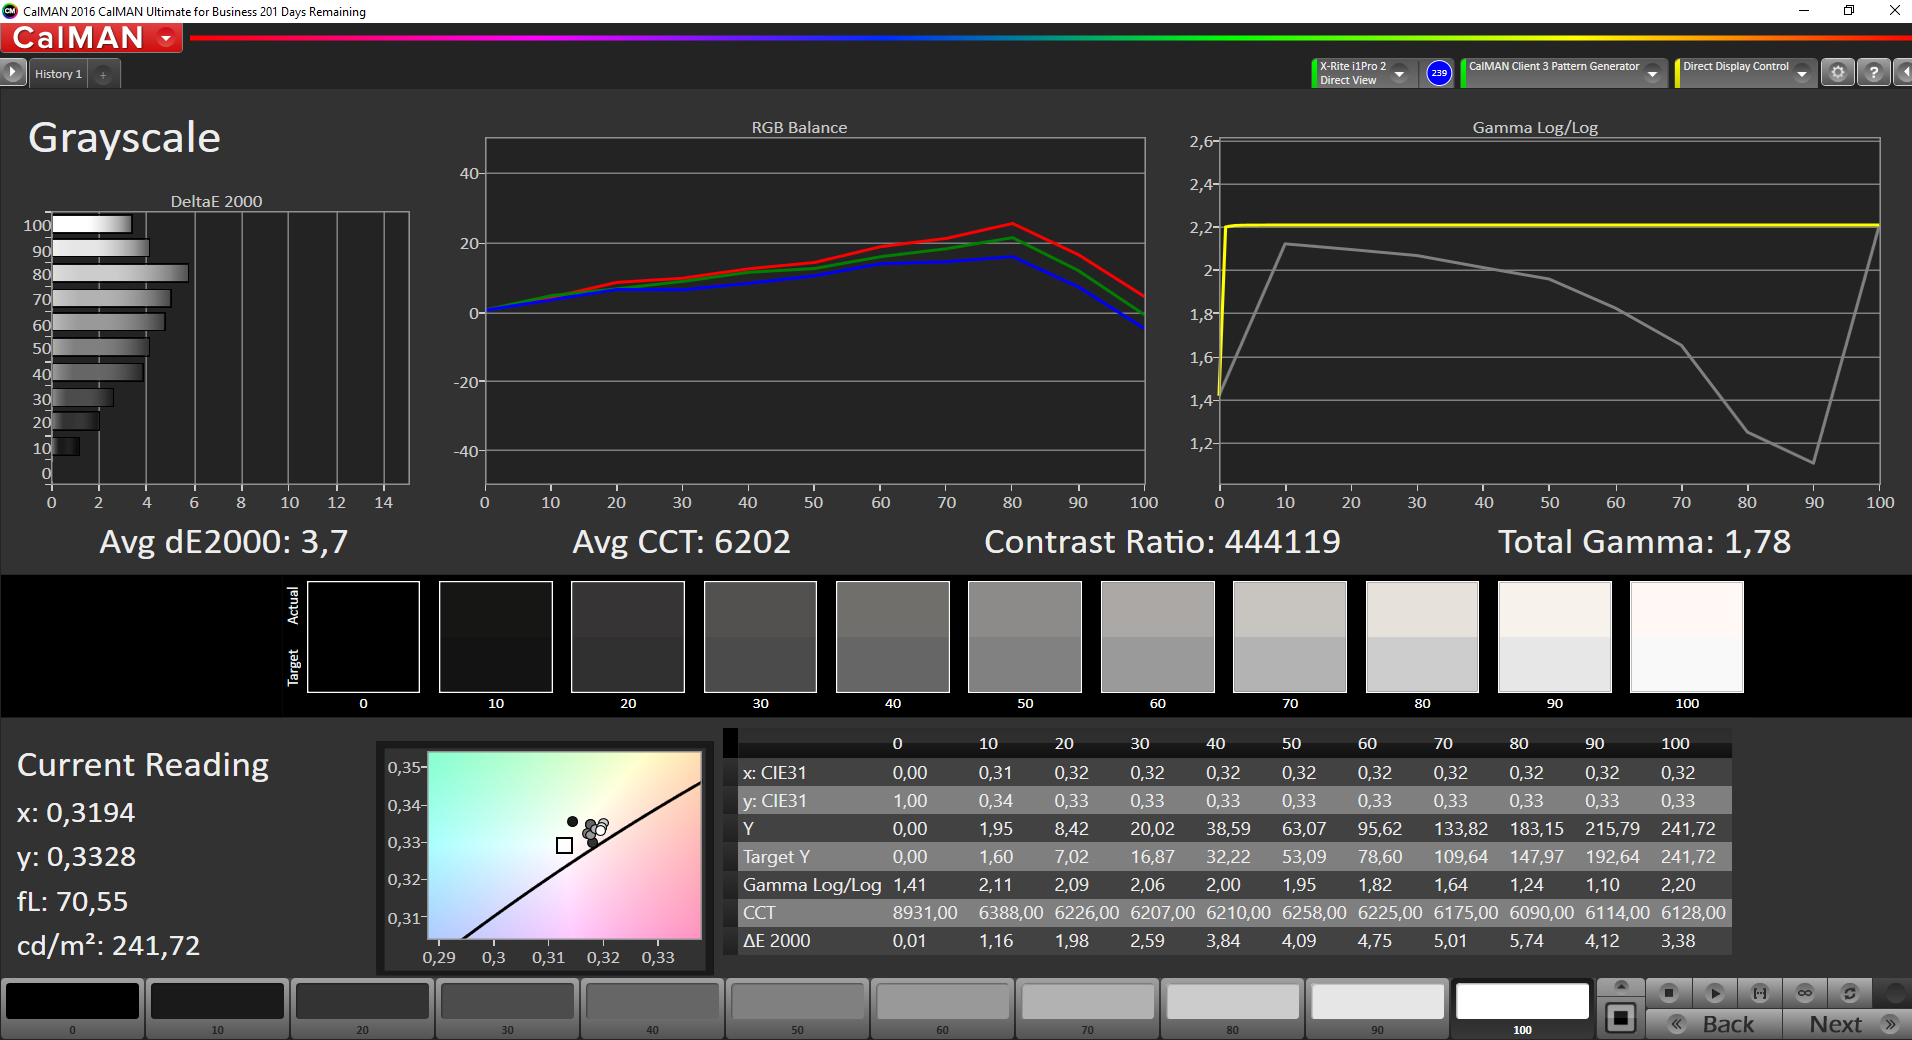
ΔE Greyscale Calman: 3.7 | ∀{0.09-98 Ø4.96}
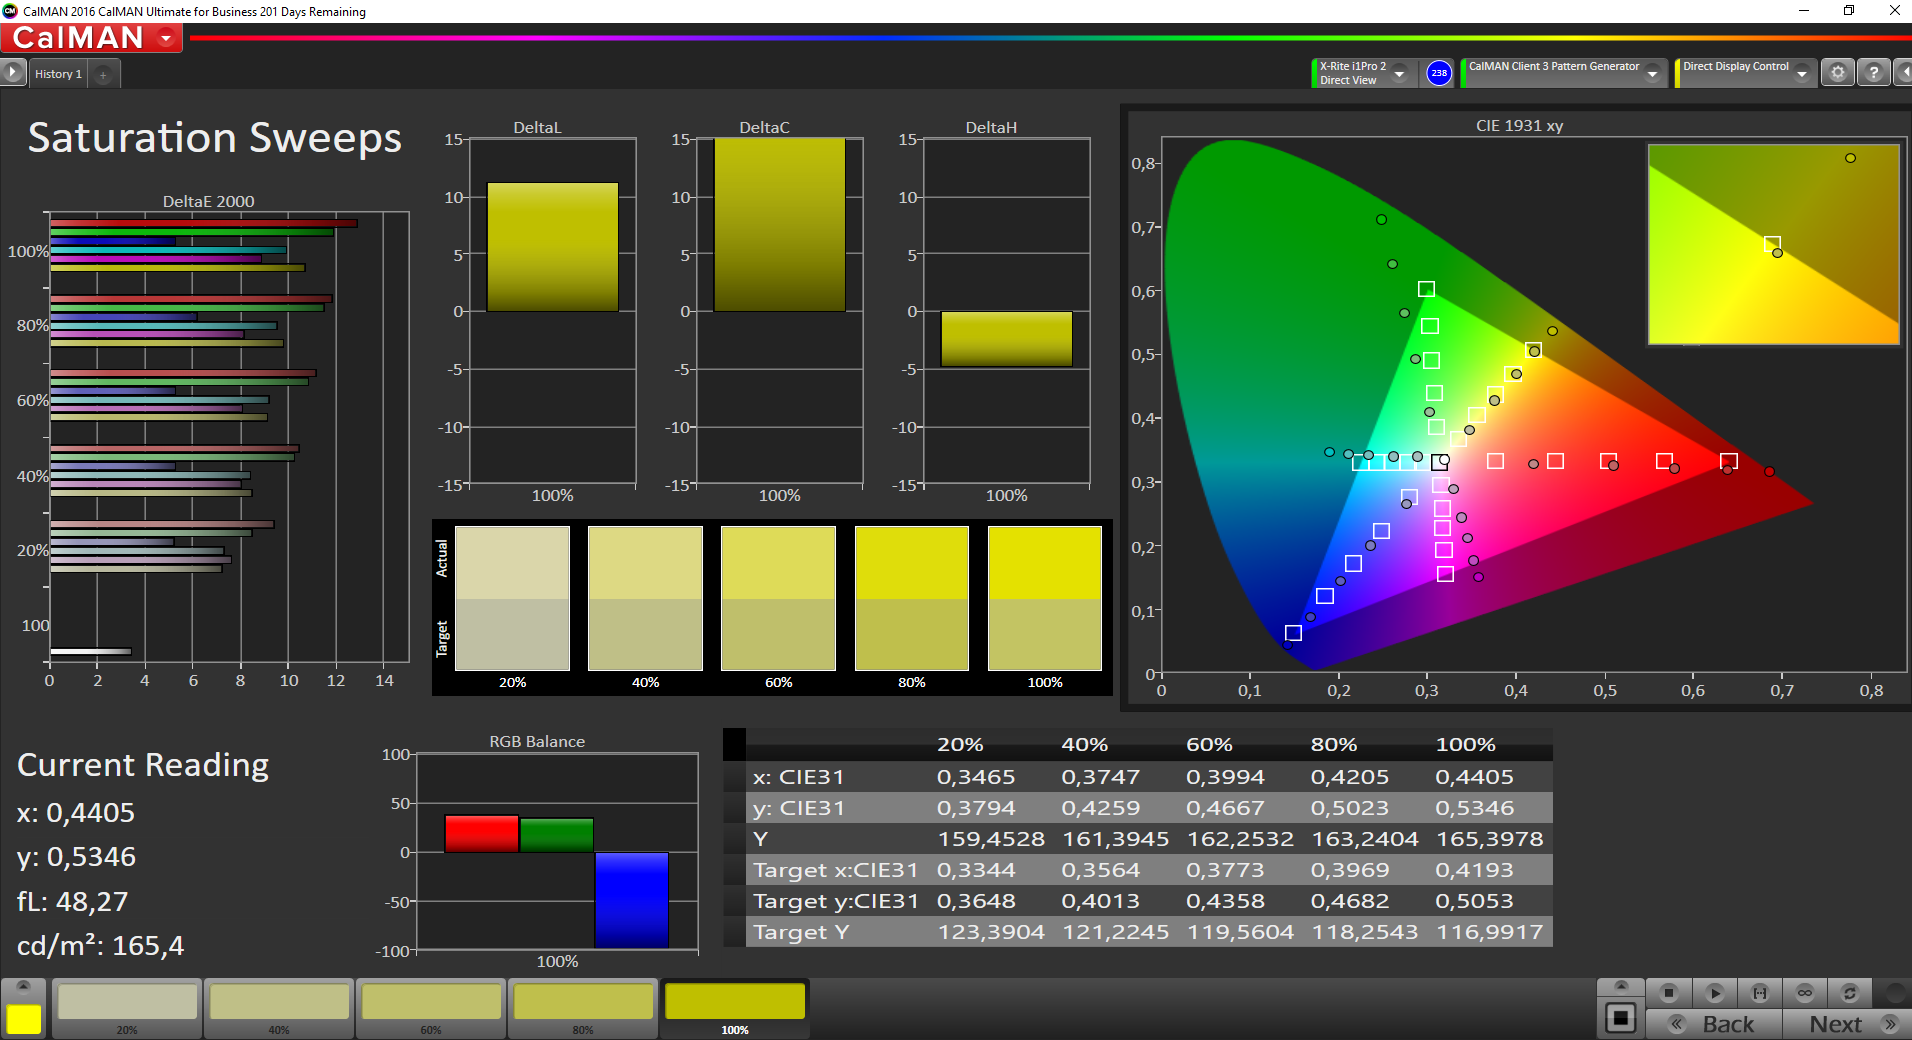
100% sRGB (Argyll 1.6.3 3D)
84.8% AdobeRGB 1998 (Argyll 1.6.3 3D)
Gamma: 1.78
CCT: 6202 K
| Lenovo ThinkPad X1 Yoga 2017 20JES03T00 LEN4140, , 2560x1440, 14" | Lenovo ThinkPad X1 Yoga-20FRS1VS00 Samsung ATNA40JU01-0, , 2560x1440, 14" | HP EliteBook x360 1030 G2 CMN1374, , 1920x1080, 13.3" | Toshiba Portege X20W-D-10R Toshiba TOS508F, , 1920x1080, 12.5" | Dell Latitude 12 5285 2-in-1 BOE06DC, , 1920x1280, 12.3" | Microsoft Surface Book with Performance Base Panasonic MEI96A2, , 3000x2000, 13.5" | |
|---|---|---|---|---|---|---|
| Display | ||||||
| Display P3 Coverage (%) | 65.5 | 68.7 | 62.8 | 66.4 | ||
| sRGB Coverage (%) | 88.8 | 96.8 | 94 | 95.4 | ||
| AdobeRGB 1998 Coverage (%) | 64.9 | 70.4 | 64.7 | 67.6 | ||
| Response Times | 71% | -1092% | -1440% | -971% | -1325% | |
| Response Time Grey 50% / Grey 80% * (ms) | 3.6 ? | 1 ? 72% | 55.2 ? -1433% | 67 ? -1761% | 42.4 ? -1078% | 61 ? -1594% |
| Response Time Black / White * (ms) | 3.2 ? | 1 ? 69% | 27.2 ? -750% | 39 ? -1119% | 30.8 ? -863% | 37 ? -1056% |
| PWM Frequency (Hz) | 240.4 ? | 240 ? | 210.1 ? | |||
| Screen | 1% | -14% | -4% | 22% | 34% | |
| Brightness middle (cd/m²) | 243 | 279 15% | 262 8% | 442 82% | 523.2 115% | 459 89% |
| Brightness (cd/m²) | 240 | 277 15% | 256 7% | 410 71% | 522 117% | 423 76% |
| Brightness Distribution (%) | 95 | 91 -4% | 83 -13% | 86 -9% | 88 -7% | 86 -9% |
| Black Level * (cd/m²) | 0.25 | 0.22 | 0.42 | 0.37 | ||
| Colorchecker dE 2000 * | 5.3 | 5.15 3% | 5.13 3% | 5.22 2% | 4 25% | 2.28 57% |
| Colorchecker dE 2000 max. * | 8.9 | 8.28 7% | 9.46 -6% | 11.84 -33% | 8.6 3% | 3.61 59% |
| Greyscale dE 2000 * | 3.7 | 5.44 -47% | 6.23 -68% | 7.88 -113% | 5.5 -49% | 2.48 33% |
| Gamma | 1.78 124% | 2.28 96% | 2.45 90% | 2.51 88% | 2.16 102% | 2.5 88% |
| CCT | 6202 105% | 5686 114% | 6413 101% | 6756 96% | 7546 86% | 8602 76% |
| Color Space (Percent of AdobeRGB 1998) (%) | 84.8 | 98 16% | 57.84 -32% | 64 -25% | 64.86 -24% | 62 -27% |
| Color Space (Percent of sRGB) (%) | 100 | 100 0% | 88.57 -11% | 97 -3% | 93.97 -6% | 96 -4% |
| Contrast (:1) | 1048 | 2009 | 1246 | 1241 | ||
| Moyenne finale (programmes/paramètres) | 36% /
15% | -553% /
-230% | -722% /
-291% | -475% /
-177% | -646% /
-238% |
* ... Moindre est la valeur, meilleures sont les performances

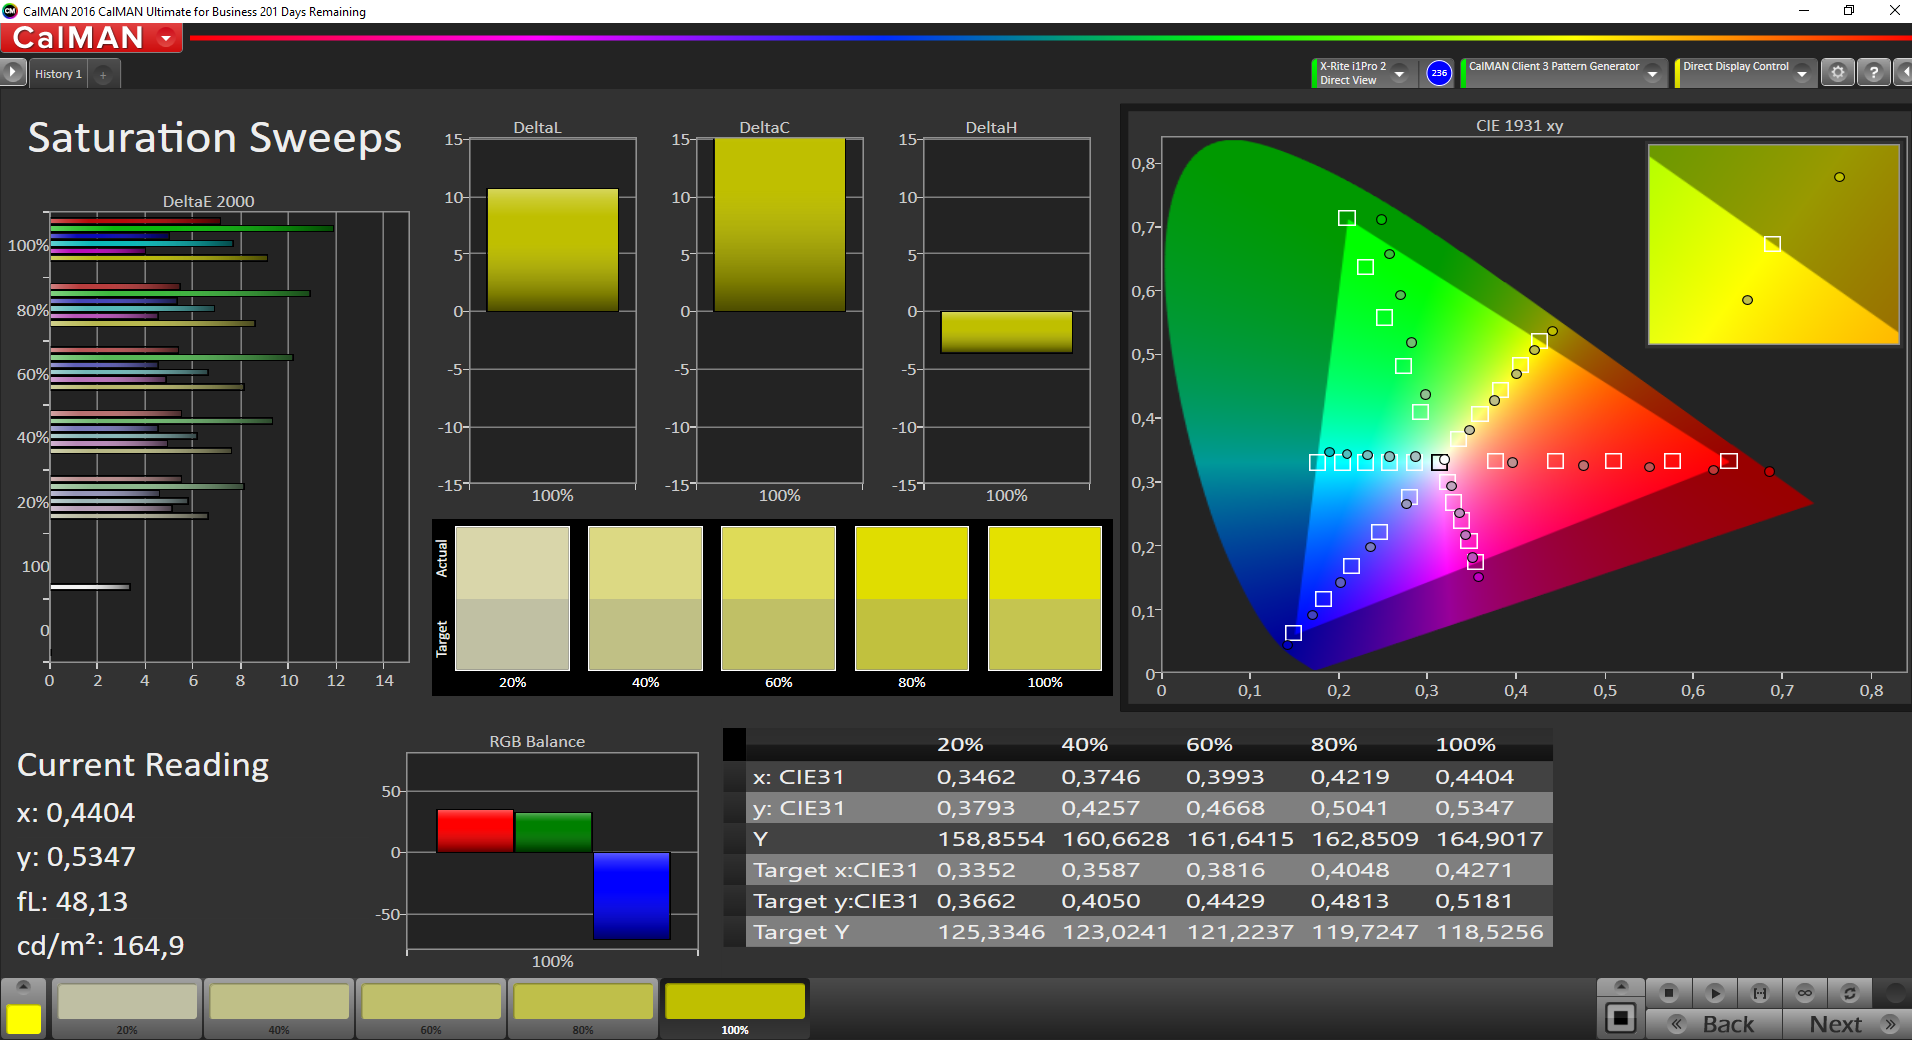

Temps de réponse de l'écran
| ↔ Temps de réponse noir à blanc | ||
|---|---|---|
| 3.2 ms ... hausse ↗ et chute ↘ combinées | ↗ 2 ms hausse | 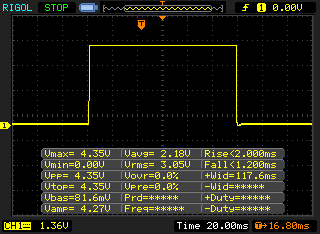 |
| ↘ 1.2 ms chute | ||
| L'écran montre de très faibles temps de réponse, parfait pour le jeu. En comparaison, tous les appareils testés affichent entre 0.1 (minimum) et 240 (maximum) ms. » 15 % des appareils testés affichent de meilleures performances. Cela signifie que les latences relevées sont meilleures que la moyenne (19.8 ms) de tous les appareils testés. | ||
| ↔ Temps de réponse gris 50% à gris 80% | ||
| 3.6 ms ... hausse ↗ et chute ↘ combinées | ↗ 1.6 ms hausse | 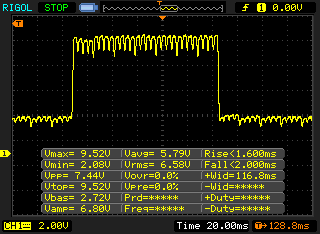 |
| ↘ 2 ms chute | ||
| L'écran montre de très faibles temps de réponse, parfait pour le jeu. En comparaison, tous les appareils testés affichent entre 0.165 (minimum) et 636 (maximum) ms. » 14 % des appareils testés affichent de meilleures performances. Cela signifie que les latences relevées sont meilleures que la moyenne (31 ms) de tous les appareils testés. | ||
Scintillement / MLI (Modulation de largeur d'impulsion)
| Scintillement / MLI (Modulation de largeur d'impulsion) décelé | 240.4 Hz | ≤ 80 Niveau de luminosité | 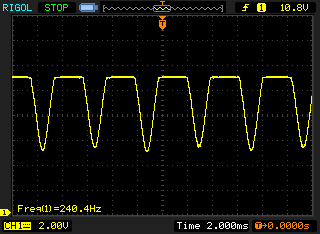 |
Le rétroéclairage de l'écran scintille à la fréquence de 240.4 Hz (certainement du fait de l'utilisation d'une MDI - Modulation de largeur d'impulsion) à un niveau de luminosité inférieur ou égal à 80 % . Aucun scintillement ne devrait être perceptible au-dessus de cette valeur. La fréquence de rafraîchissement de 240.4 Hz est relativement faible, les personnes les plus sensibles devraient percevoir un scintillement et être sujettes à une fatigue oculaire accrue (avec le niveau de luminosité indiqué) En comparaison, 52 % des appareils testés n'emploient pas MDI pour assombrir leur écran. Nous avons relevé une moyenne à 7754 (minimum : 5 - maximum : 343500) Hz dans le cas où une MDI était active. | |||
| |||||||||||||||||||||||||
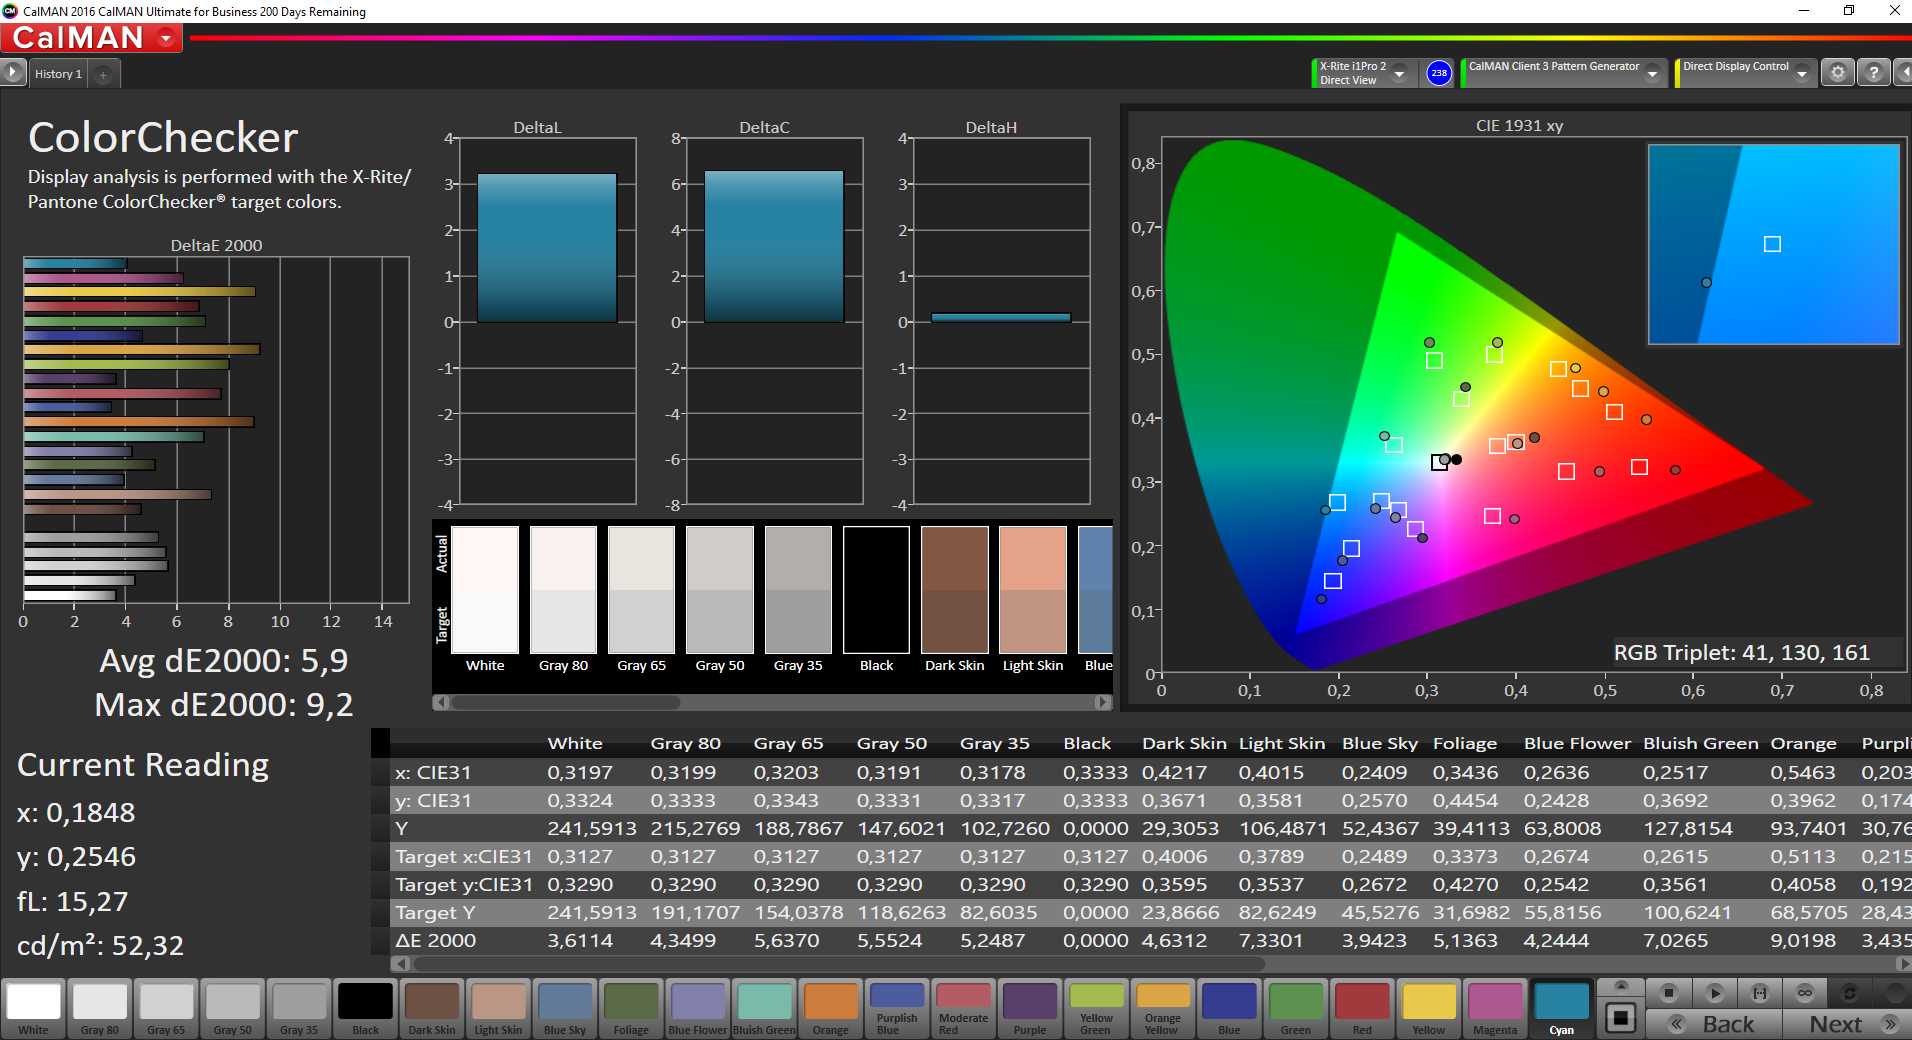
Homogénéité de la luminosité: 90 %
Valeur mesurée au centre, sur batterie: 318 cd/m²
Contraste: 1113:1 (Valeurs des noirs: 0.3 cd/m²)
ΔE ColorChecker Calman: 4.7 | ∀{0.5-29.43 Ø4.71}
ΔE Greyscale Calman: 5.4 | ∀{0.09-98 Ø4.96}
92.2% sRGB (Argyll 1.6.3 3D)
59.9% AdobeRGB 1998 (Argyll 1.6.3 3D)
Gamma: 2.14
CCT: 6877 K

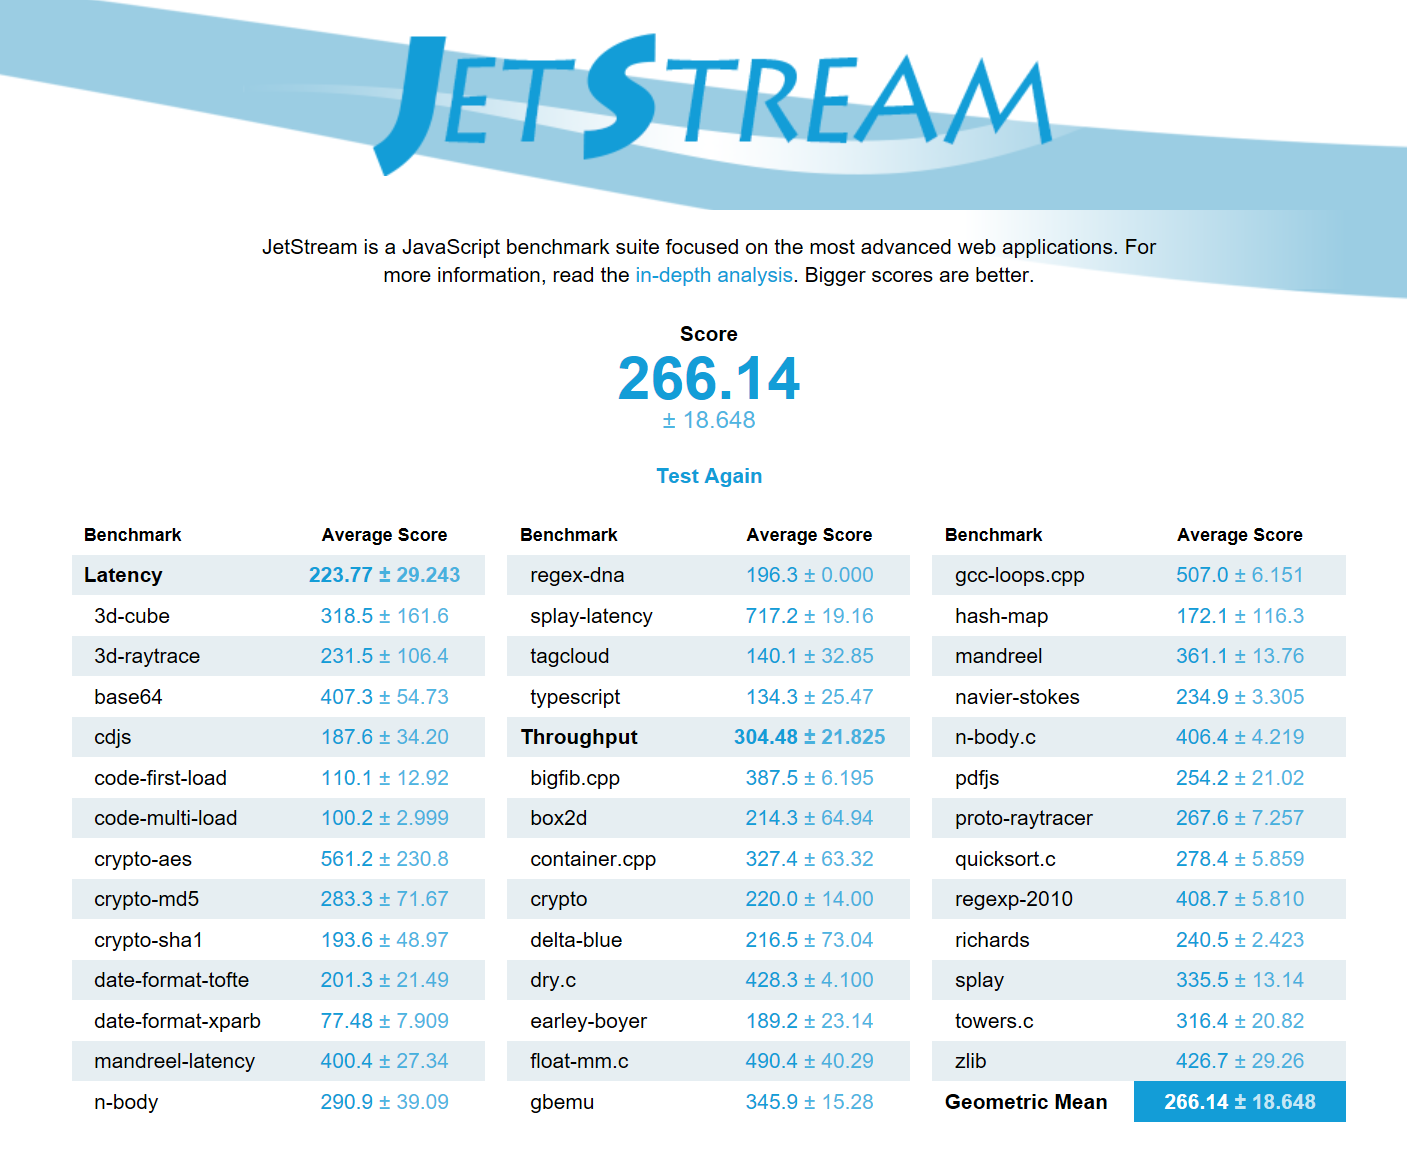
| JetStream 1.1 - 1.1 Total | |
| Lenovo ThinkPad X1 Yoga 2017 20JES03T00 | |
| Toshiba Portege X20W-D-10R | |
| Microsoft Surface Book with Performance Base | |
| HP EliteBook x360 1030 G2 | |
| Lenovo ThinkPad X1 Yoga-20FRS1VS00 | |
| Octane V2 - Total Score | |
| Toshiba Portege X20W-D-10R | |
| HP EliteBook x360 1030 G2 | |
| Microsoft Surface Book with Performance Base | |
| Lenovo ThinkPad X1 Yoga 2017 20JES03T00 | |
| Lenovo ThinkPad X1 Yoga-20FRS1VS00 | |
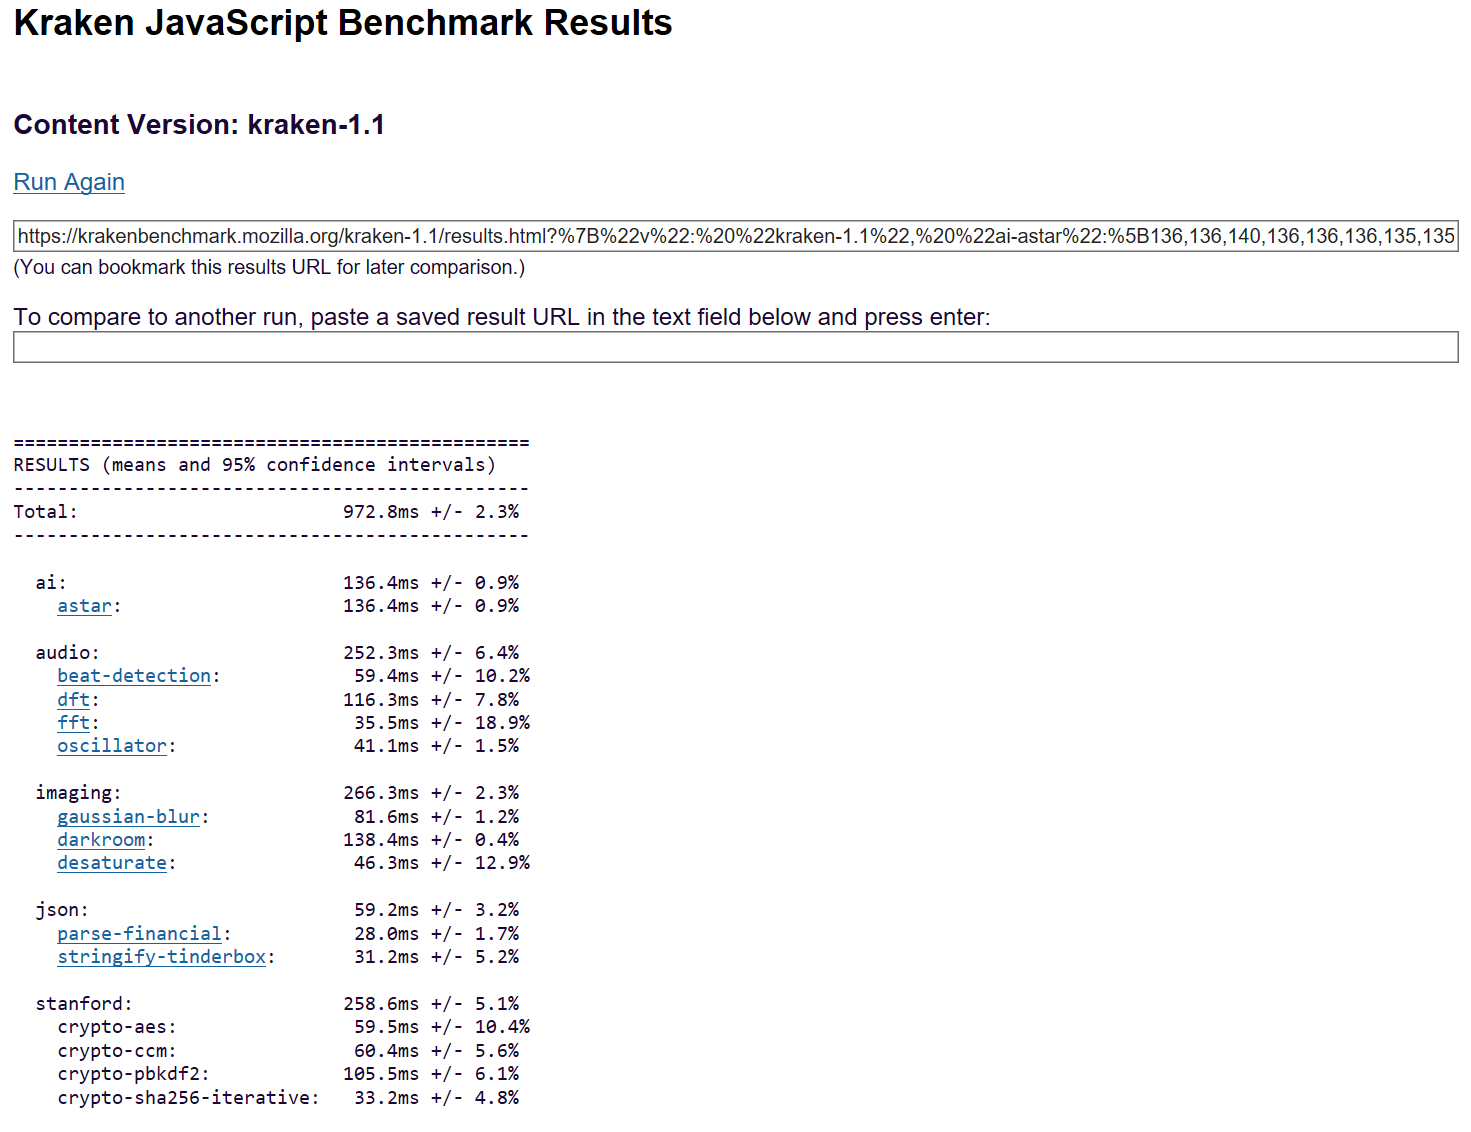
| Mozilla Kraken 1.1 - Total | |
| Lenovo ThinkPad X1 Yoga-20FRS1VS00 | |
| Microsoft Surface Book with Performance Base | |
| HP EliteBook x360 1030 G2 | |
| Toshiba Portege X20W-D-10R | |
| Lenovo ThinkPad X1 Yoga 2017 20JES03T00 | |
* ... Moindre est la valeur, meilleures sont les performances

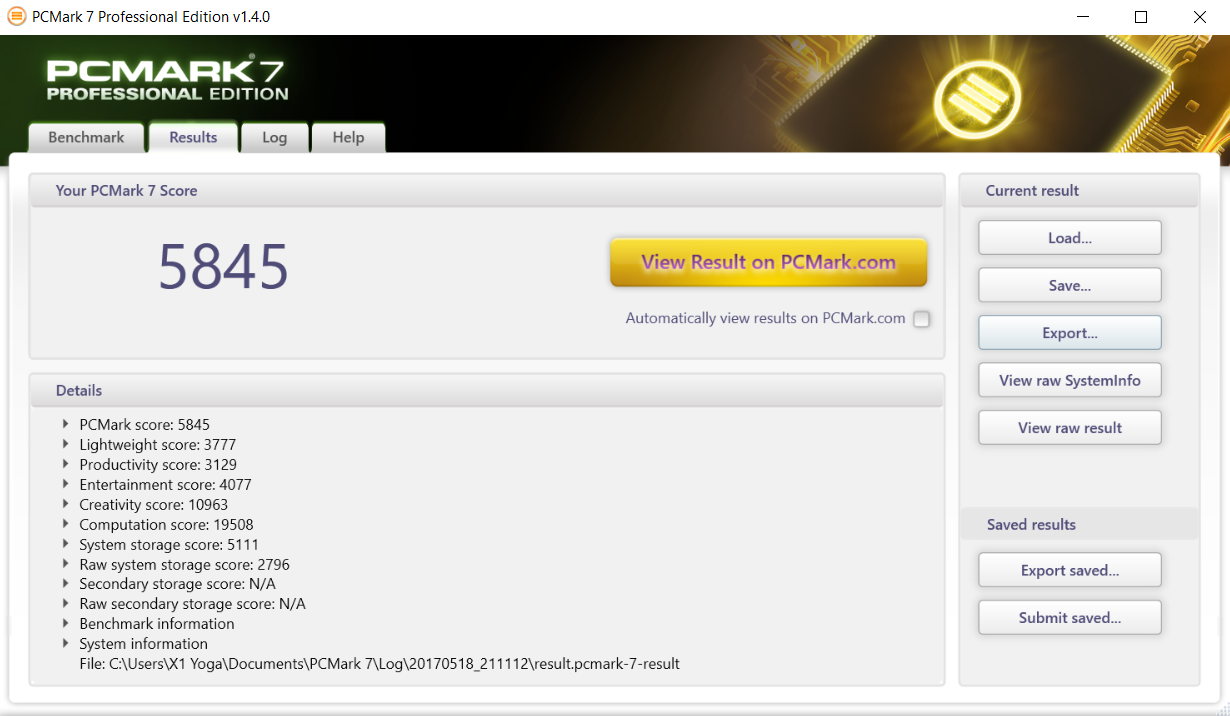
| PCMark 7 Score | 5845 points | |
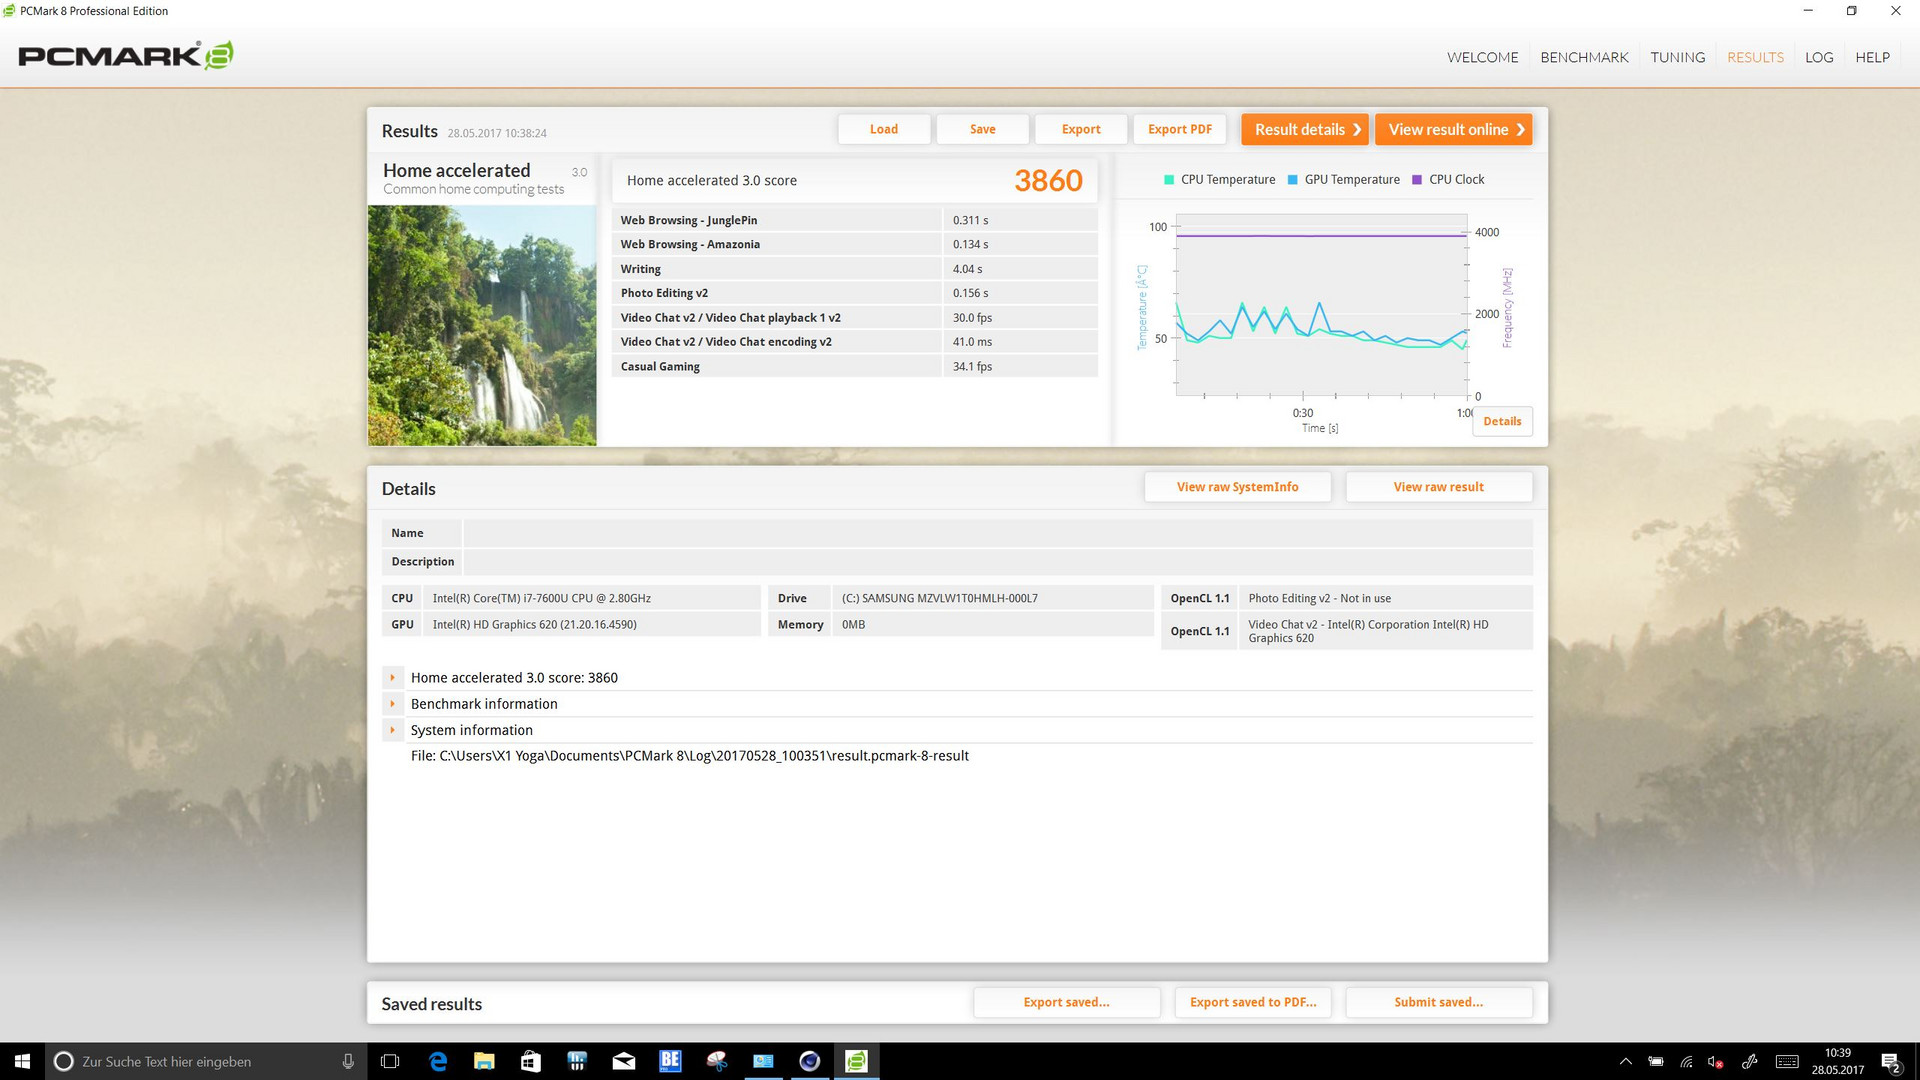
| PCMark 8 Home Score Accelerated v2 | 3860 points | |
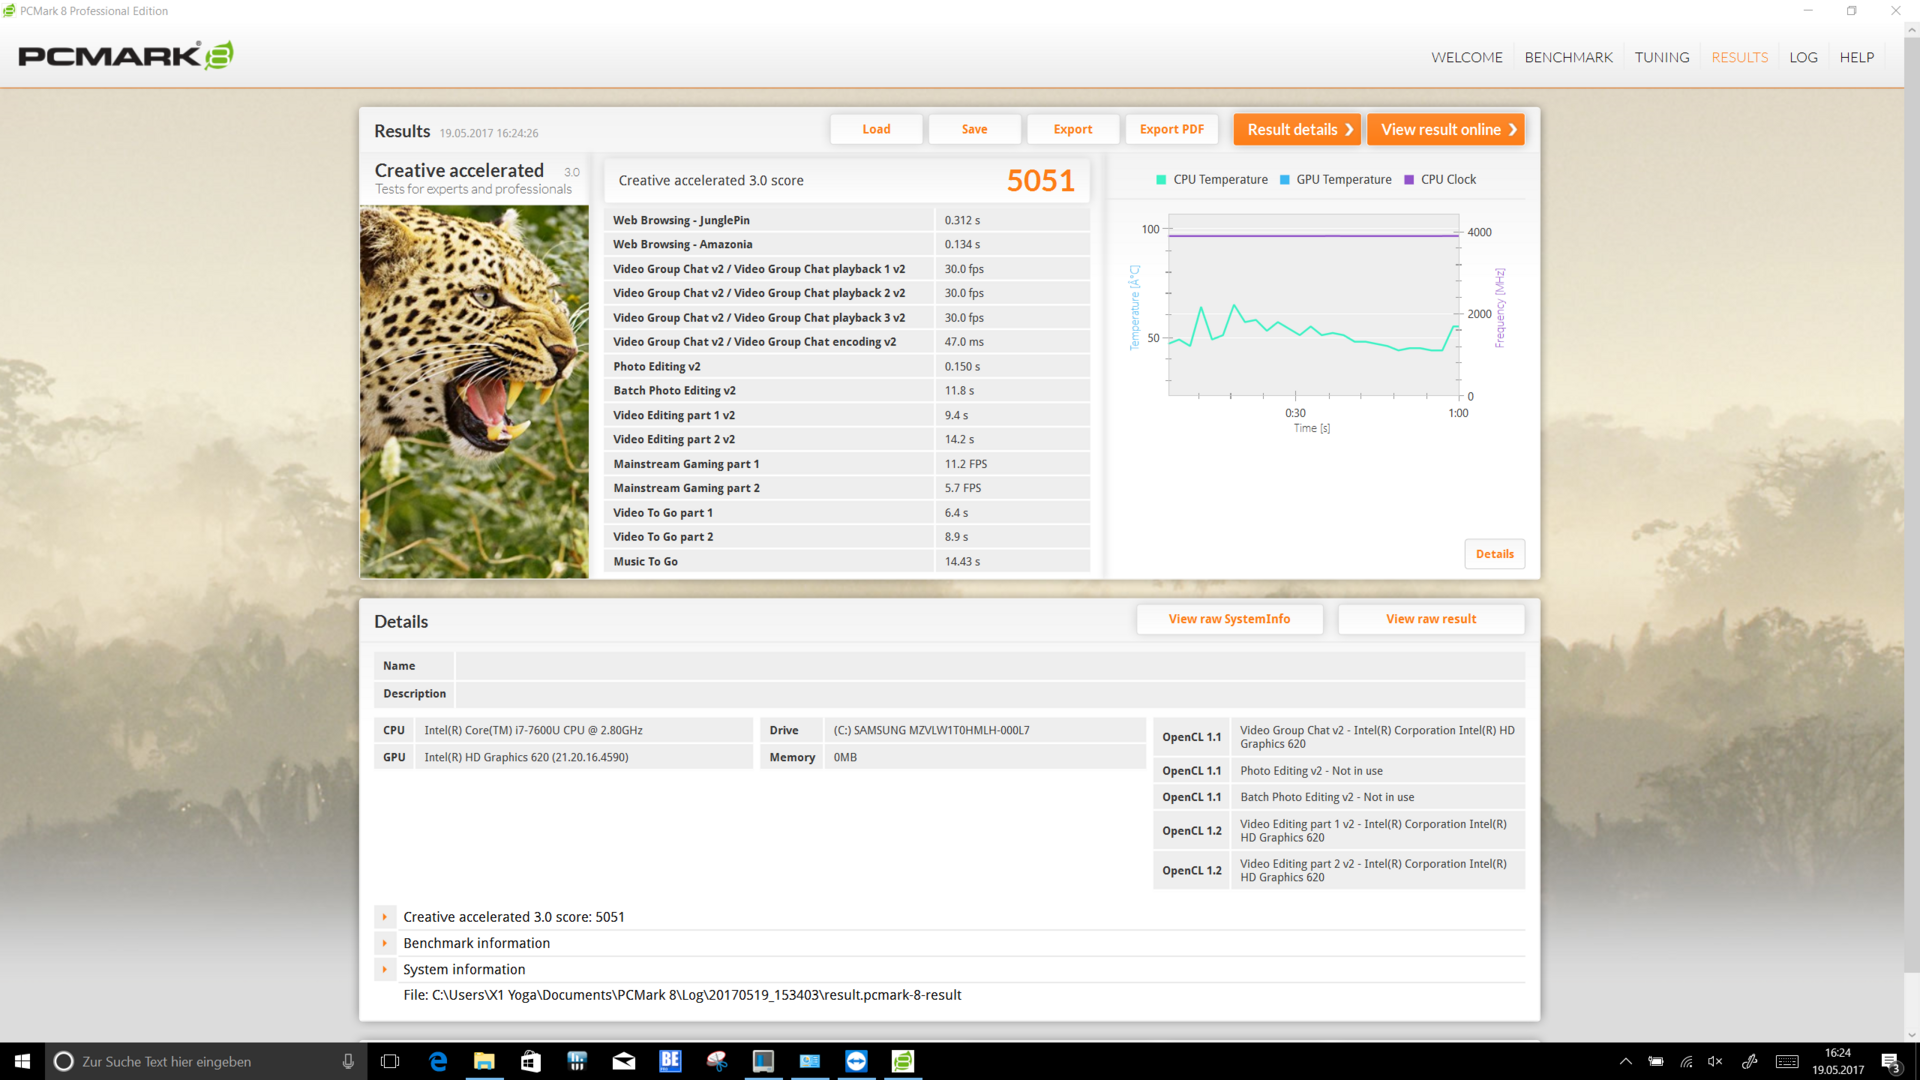
| PCMark 8 Creative Score Accelerated v2 | 5051 points | |
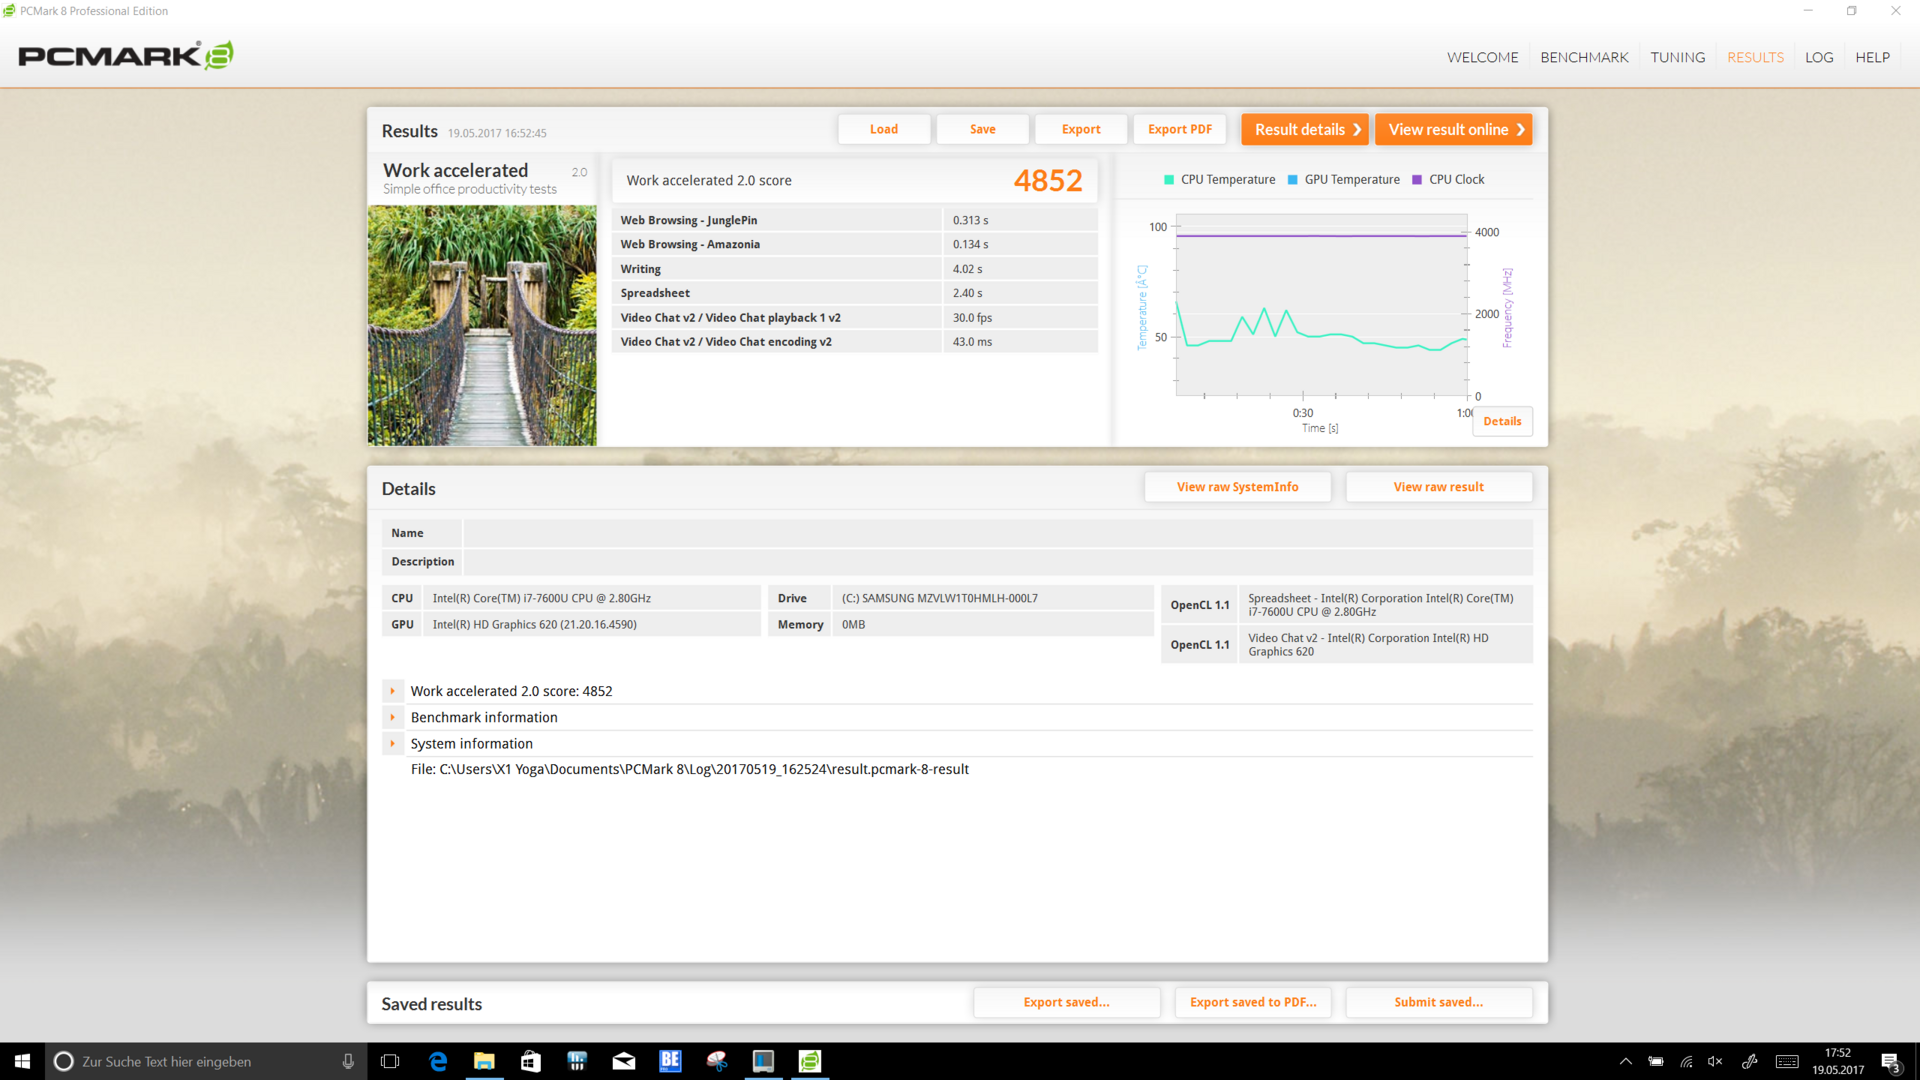
| PCMark 8 Work Score Accelerated v2 | 4852 points | |
Aide | ||
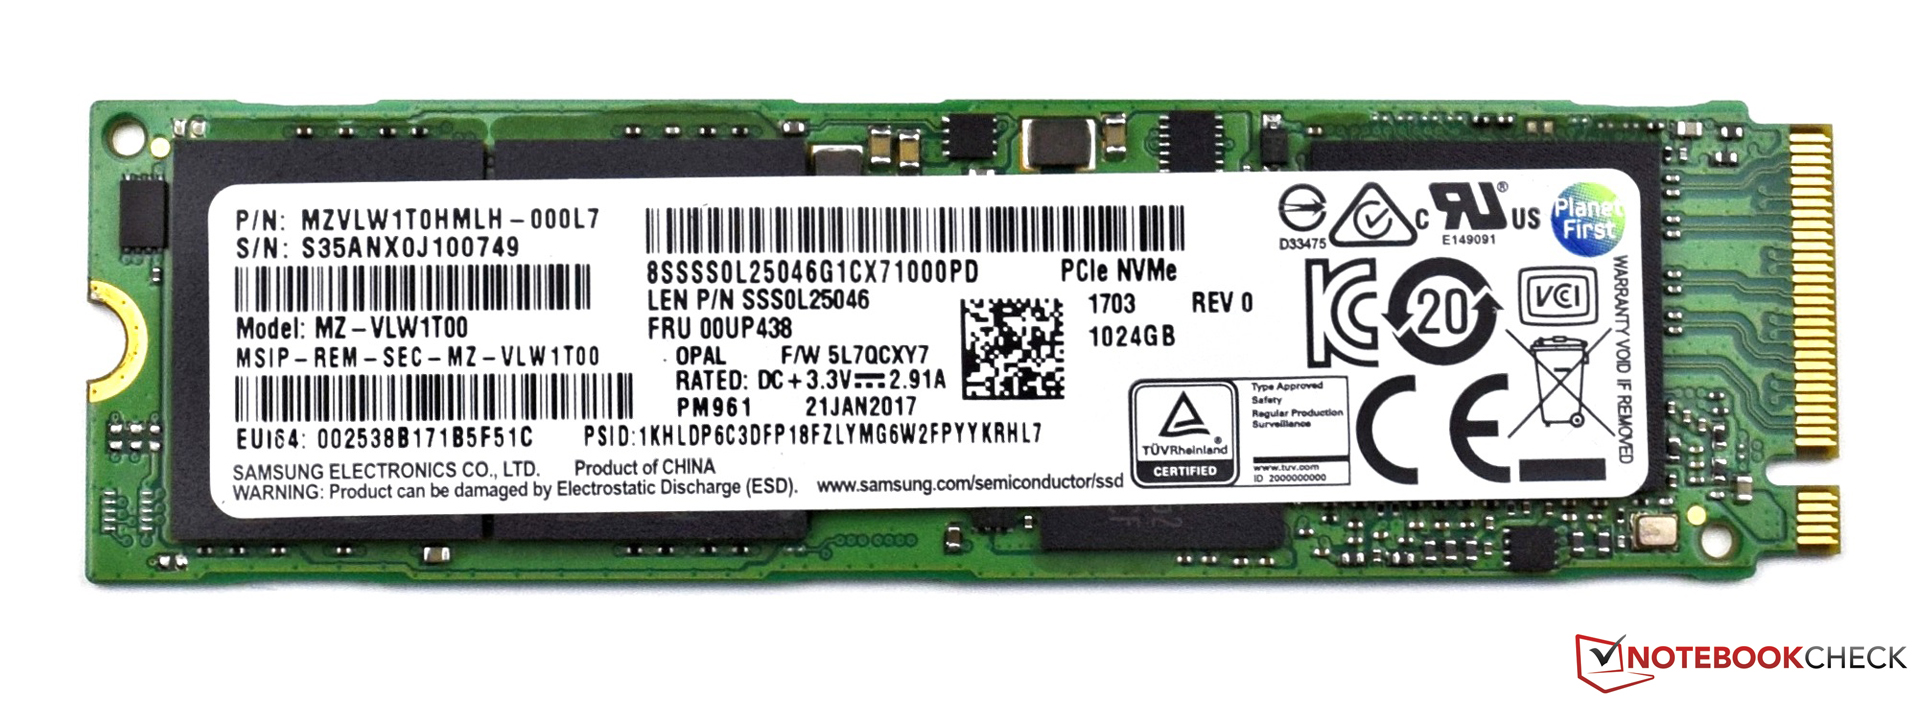

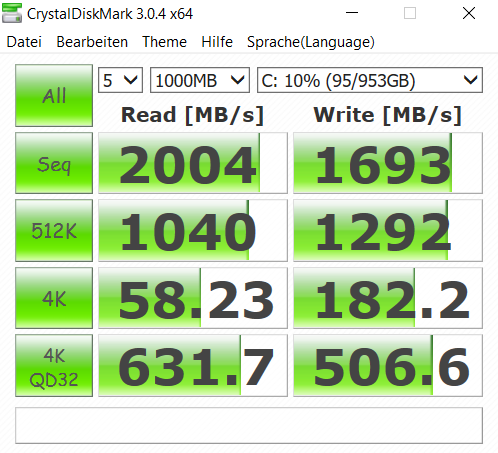
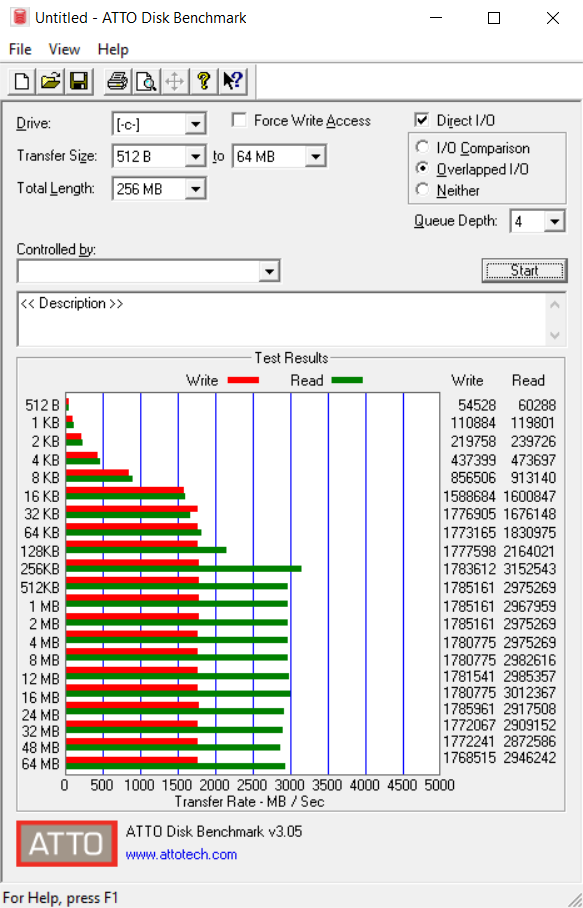
| Lenovo ThinkPad X1 Yoga 2017 20JES03T00 Samsung SSD PM961 1TB M.2 PCIe 3.0 x4 NVMe (MZVLW1T0) | Lenovo ThinkPad X1 Yoga-20FRS1VS00 Samsung SSD PM961 1TB M.2 PCIe 3.0 x4 NVMe (MZSLW1T0) | HP EliteBook x360 1030 G2 Sandisk SD8TN8U-256G-1006 | Toshiba Portege X20W-D-10R Toshiba SG5 THNSNK512GVN8 | Dell Latitude 12 5285 2-in-1 Samsung PM961 MZVLW256HEHP | Microsoft Surface Book with Performance Base Toshiba NVMe THNSN5256GPU7 | Apple MacBook 12 (Early 2016) 1.1 GHz Apple SSD AP0256 | |
|---|---|---|---|---|---|---|---|
| CrystalDiskMark 3.0 | -33% | -65% | -65% | -43% | -41% | -55% | |
| Read Seq (MB/s) | 2004 | 1510 -25% | 467.1 -77% | 469 -77% | 1294 -35% | 1017 -49% | 754 -62% |
| Write Seq (MB/s) | 1693 | 1193 -30% | 443.6 -74% | 277.3 -84% | 865 -49% | 861 -49% | 638 -62% |
| Read 512 (MB/s) | 1040 | 312.3 -70% | 404.4 -61% | 406 -61% | 687 -34% | 616 -41% | |
| Write 512 (MB/s) | 1292 | 372.5 -71% | 266.6 -79% | 589 -54% | 698 -46% | 678 -48% | |
| Read 4k (MB/s) | 58.2 | 37 -36% | 29.43 -49% | 25.24 -57% | 31.75 -45% | 40.91 -30% | 14.6 -75% |
| Write 4k (MB/s) | 182.2 | 126 -31% | 56.5 -69% | 89.4 -51% | 72.2 -60% | 108.6 -40% | 20.5 -89% |
| Read 4k QD32 (MB/s) | 632 | 404 -36% | 311.3 -51% | 322.5 -49% | 493.3 -22% | 326.9 -48% | 464 -27% |
| Write 4k QD32 (MB/s) | 507 | 319 -37% | 225.2 -56% | 208.1 -59% | 434.5 -14% | 347.1 -32% | 315 -38% |

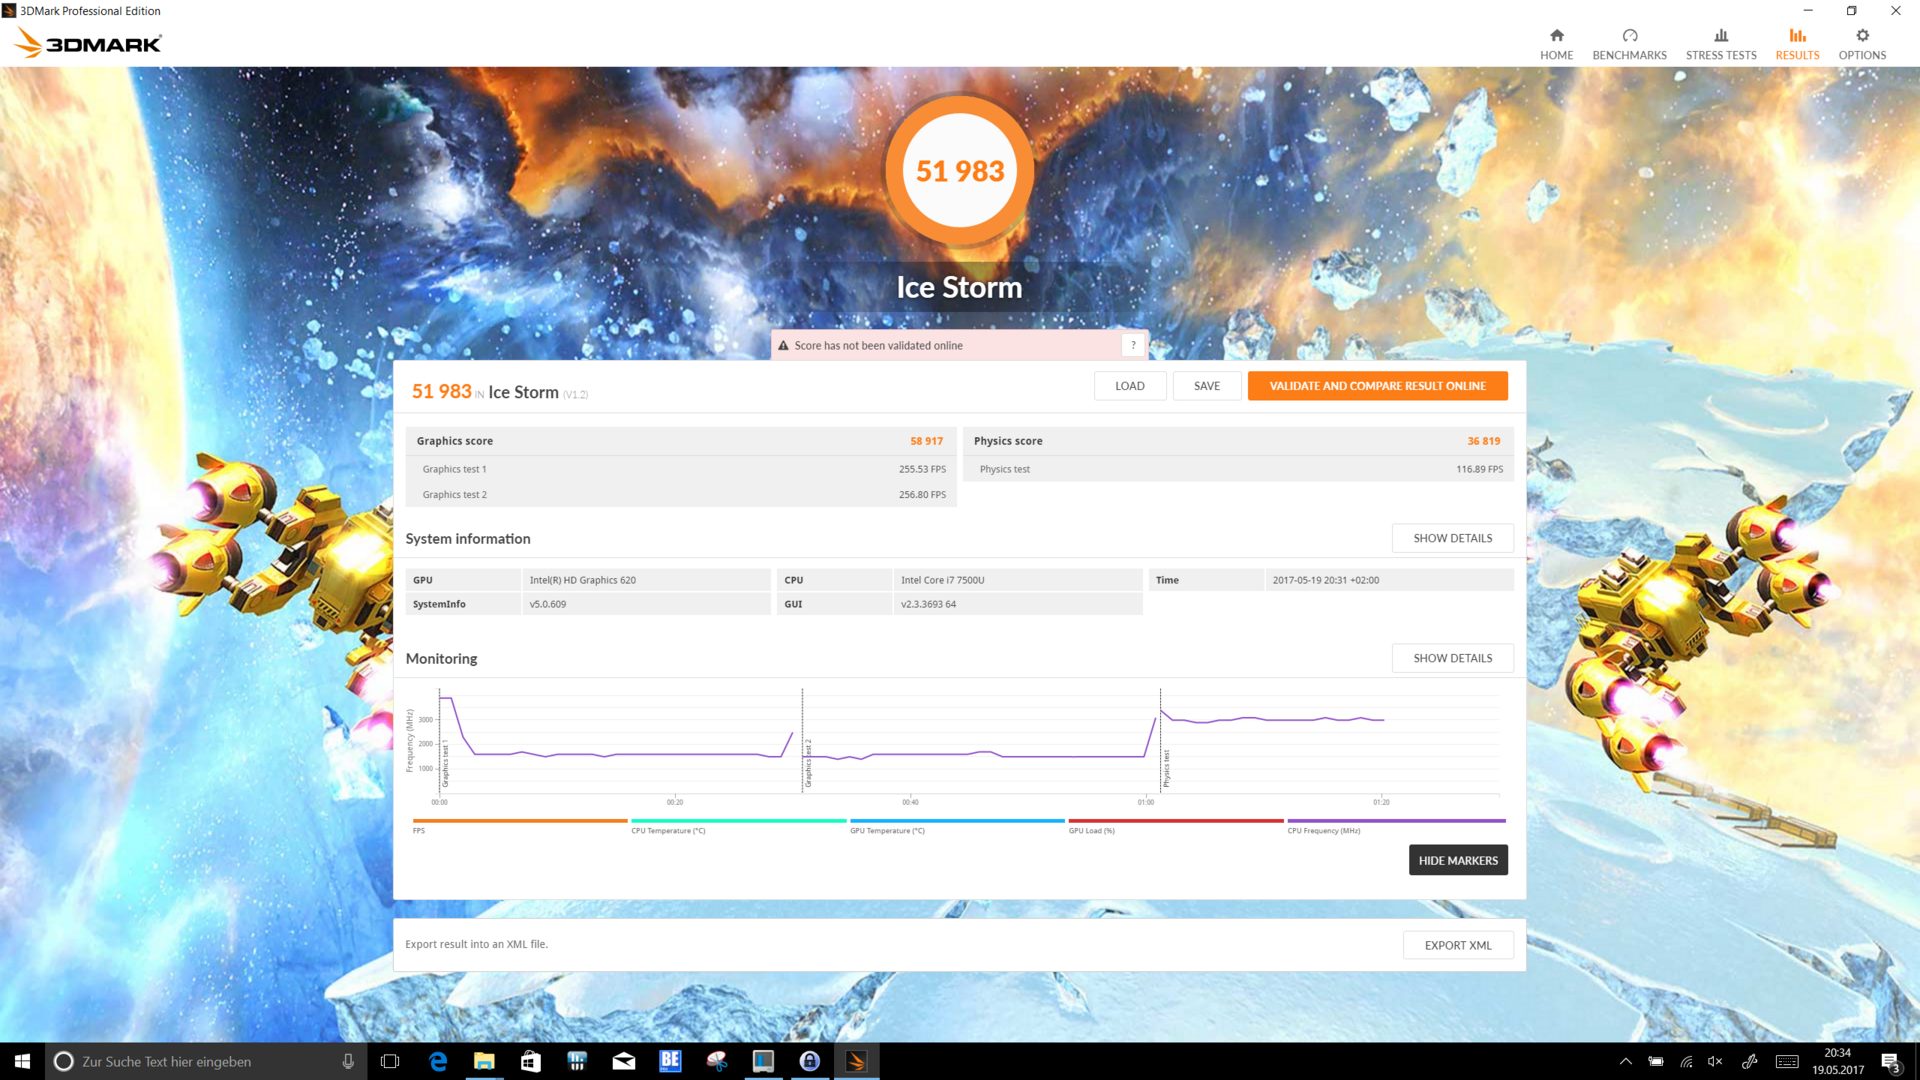
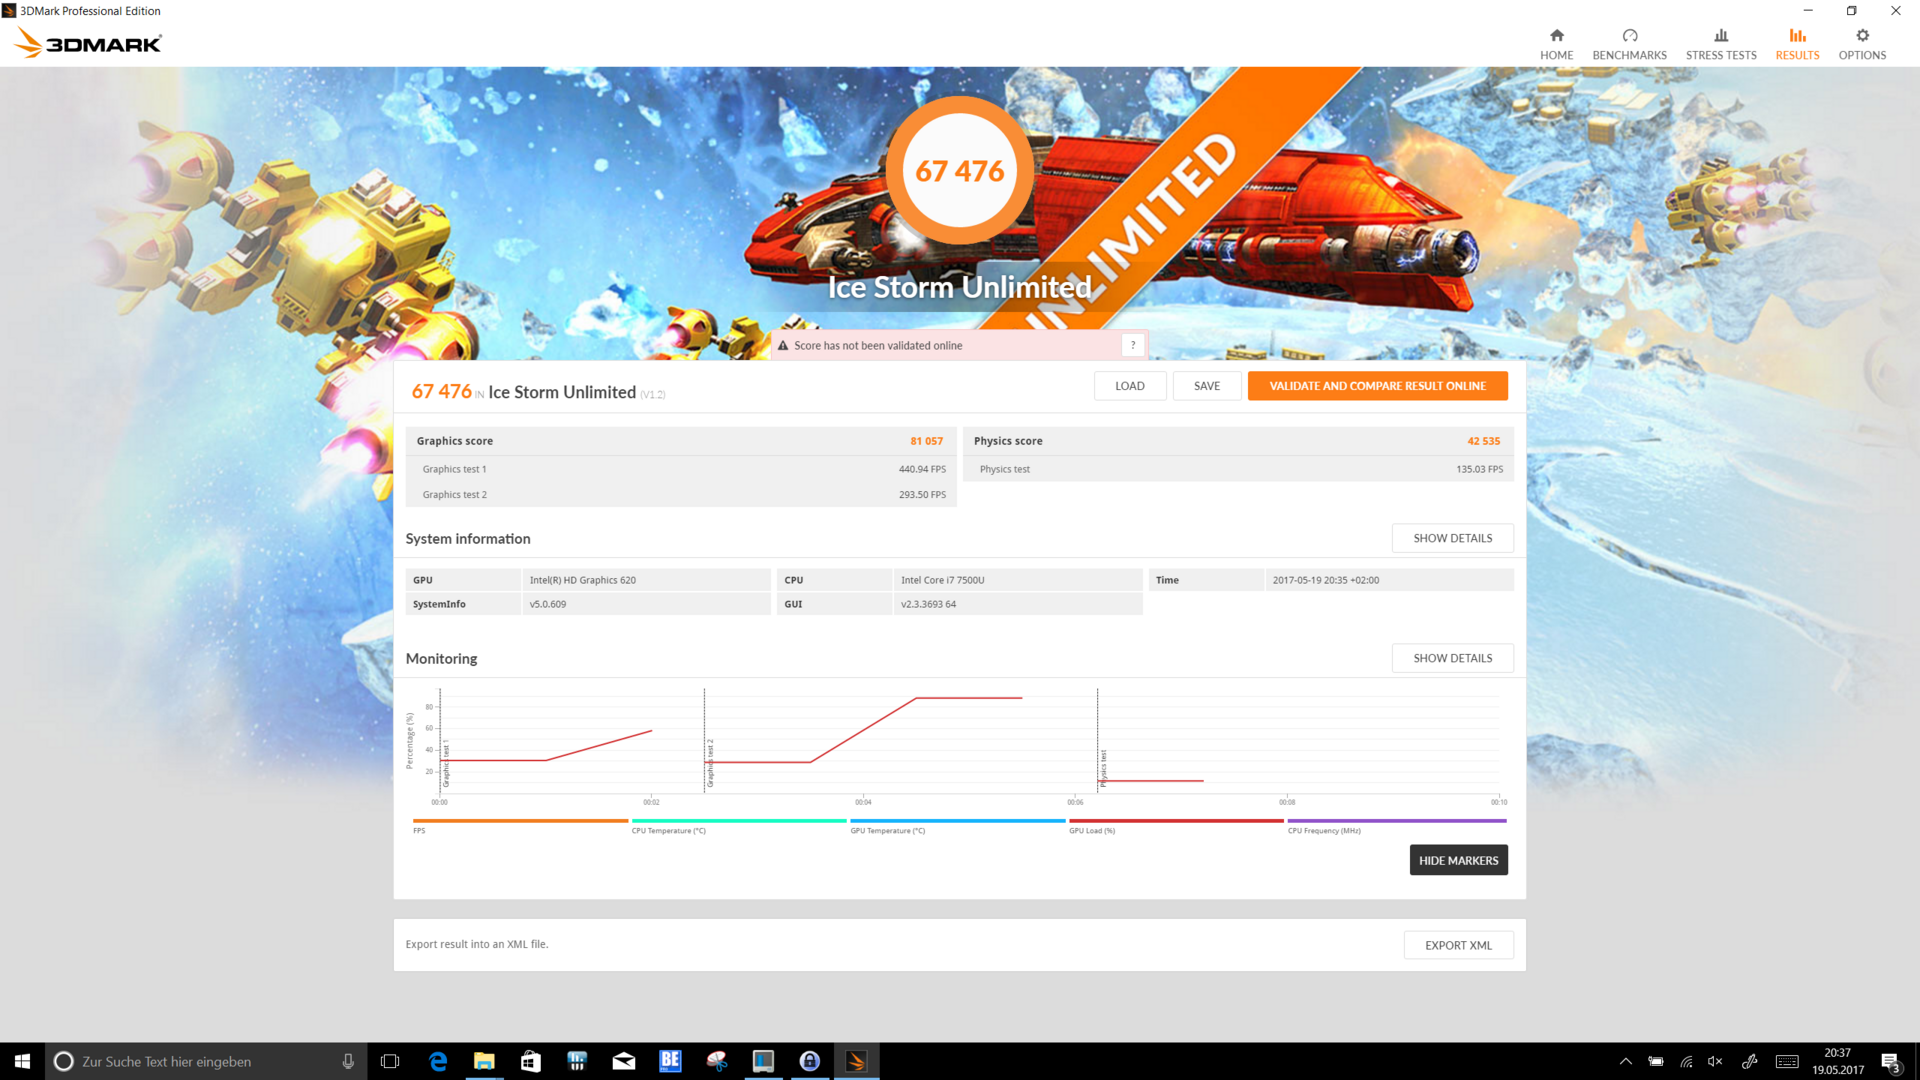
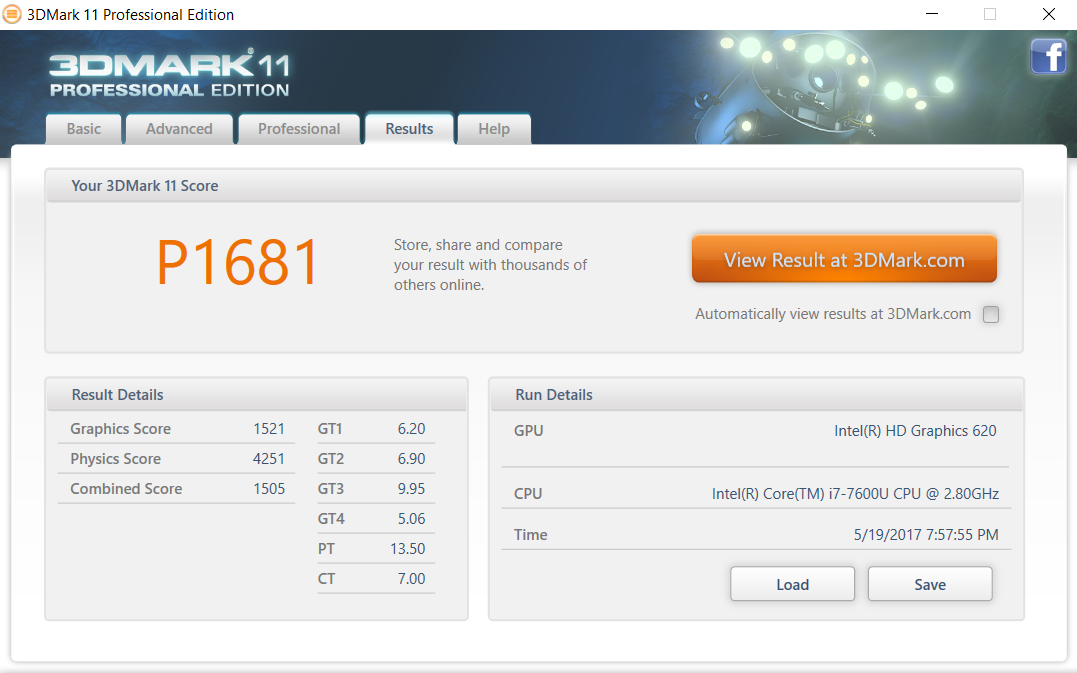
| 3DMark 11 Performance | 1794 points | |
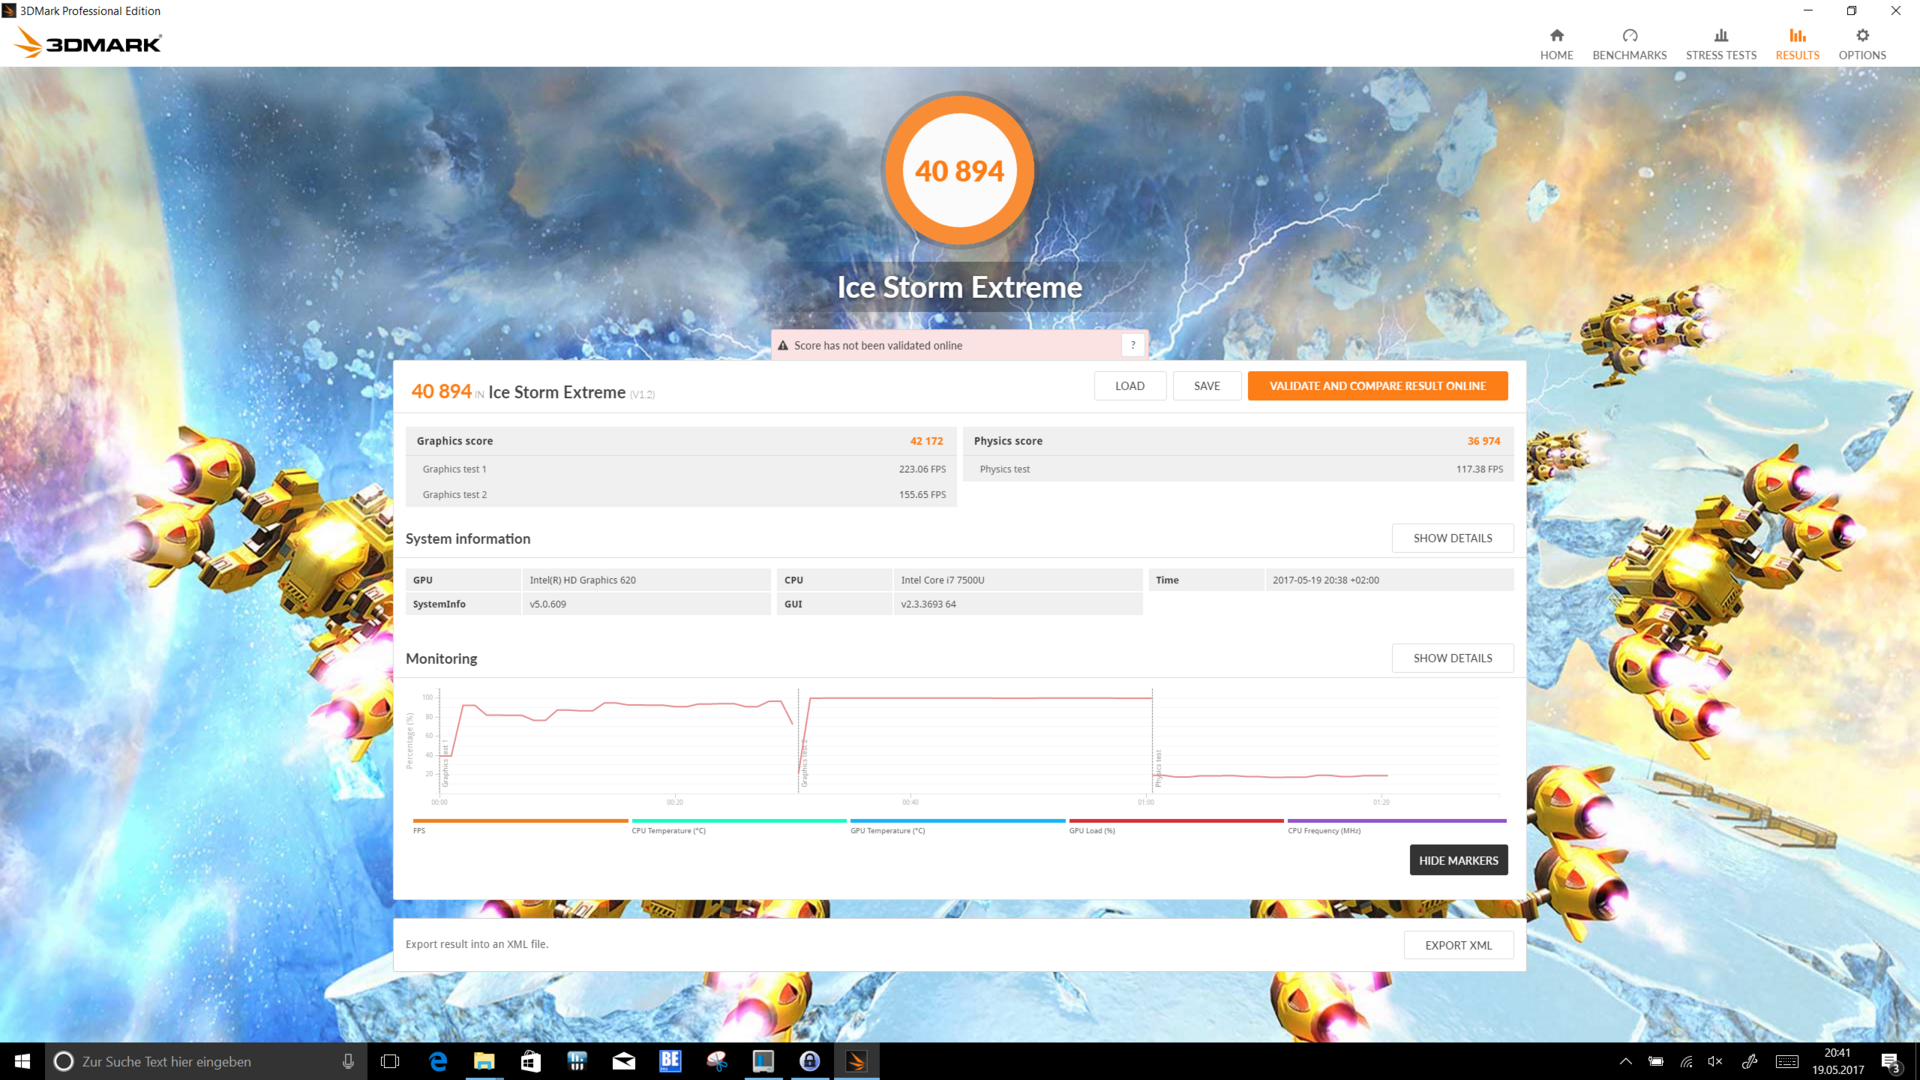
| 3DMark Ice Storm Standard Score | 51983 points | |
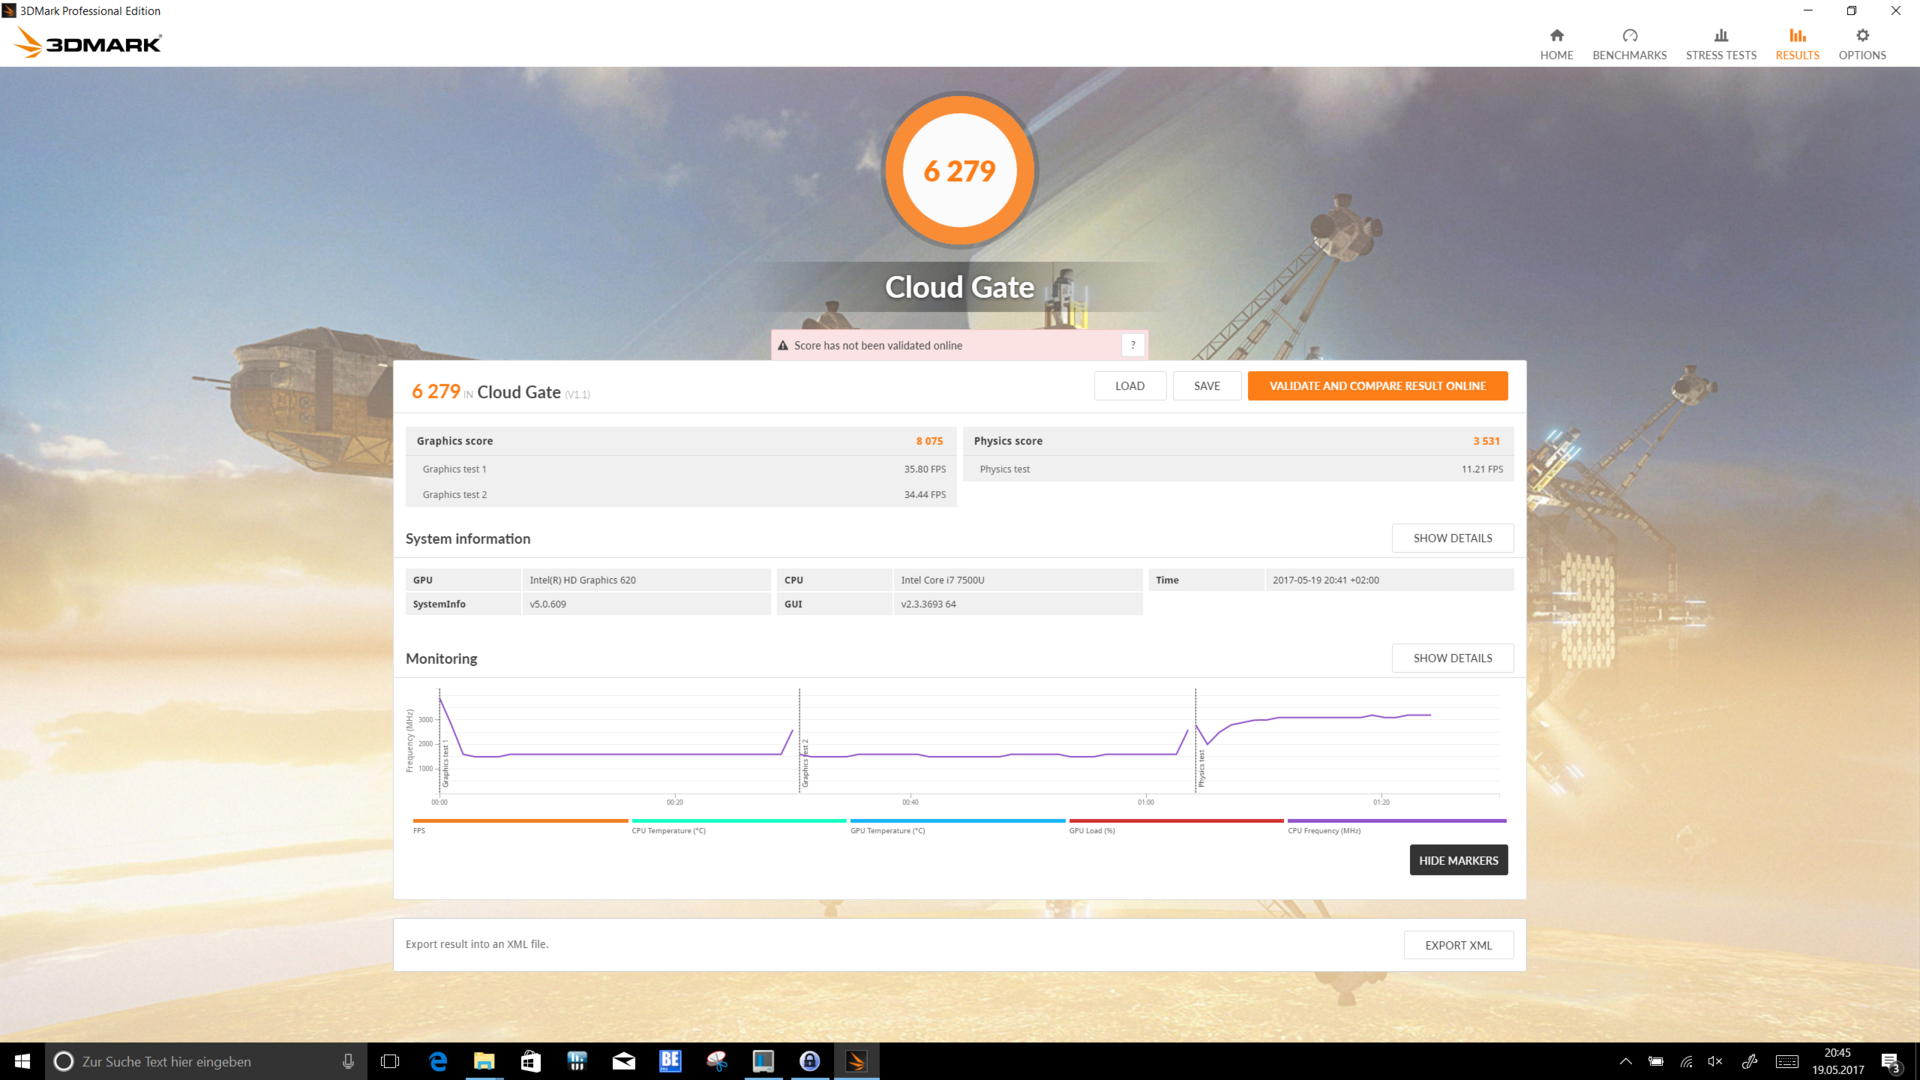
| 3DMark Cloud Gate Standard Score | 6279 points | |
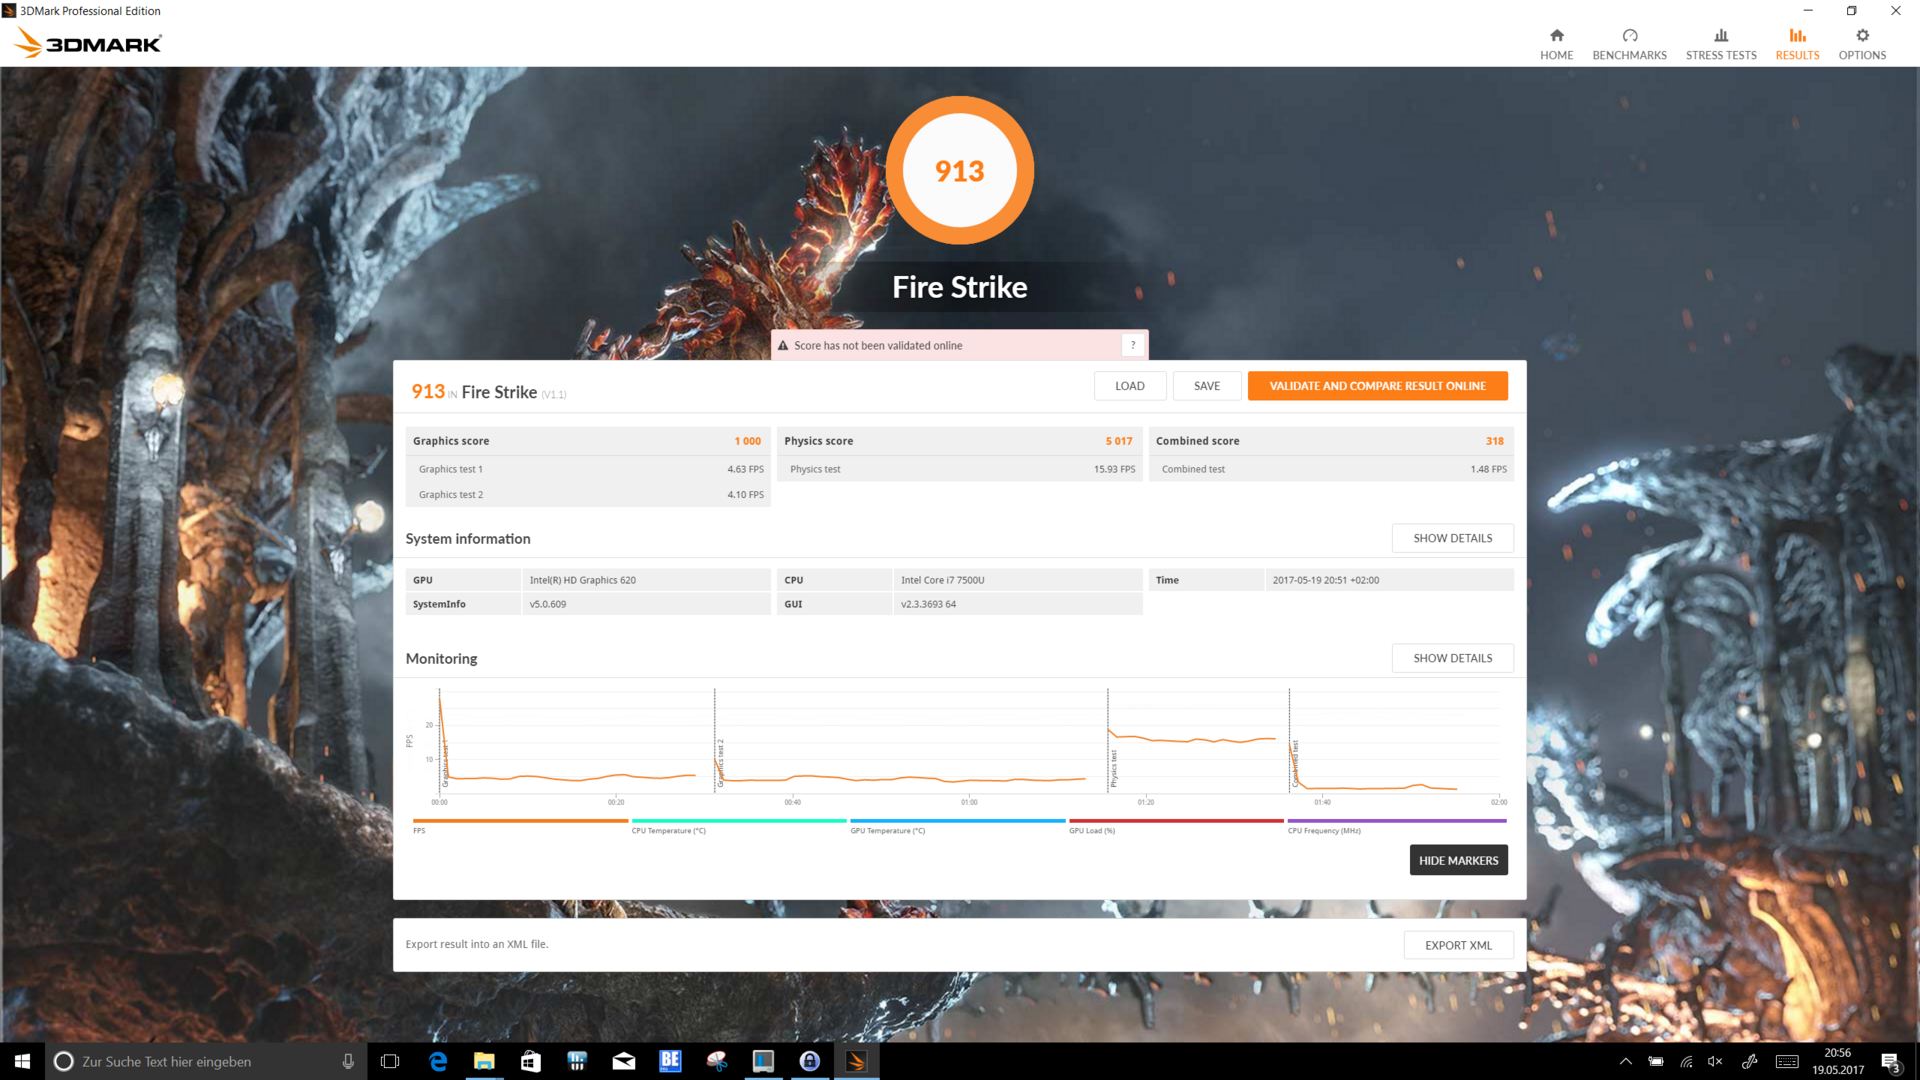
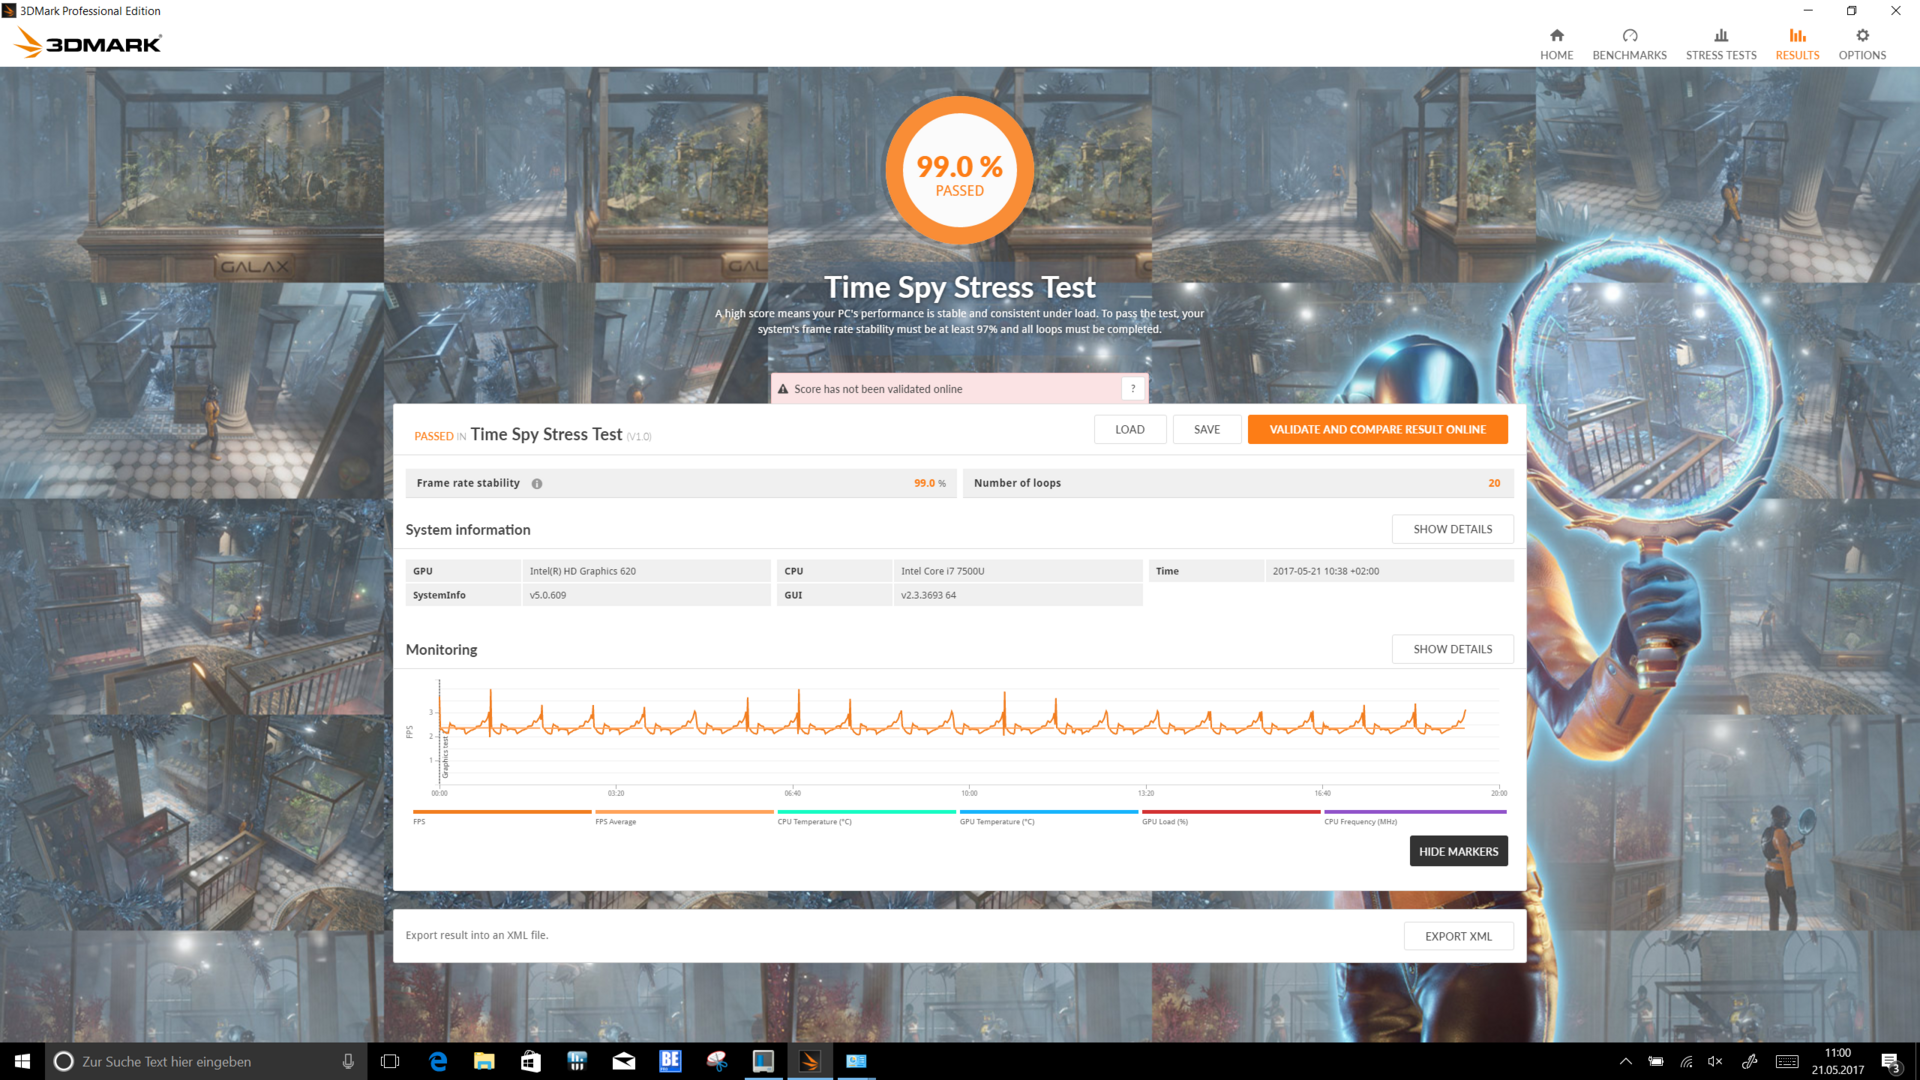
| 3DMark Fire Strike Score | 913 points | |
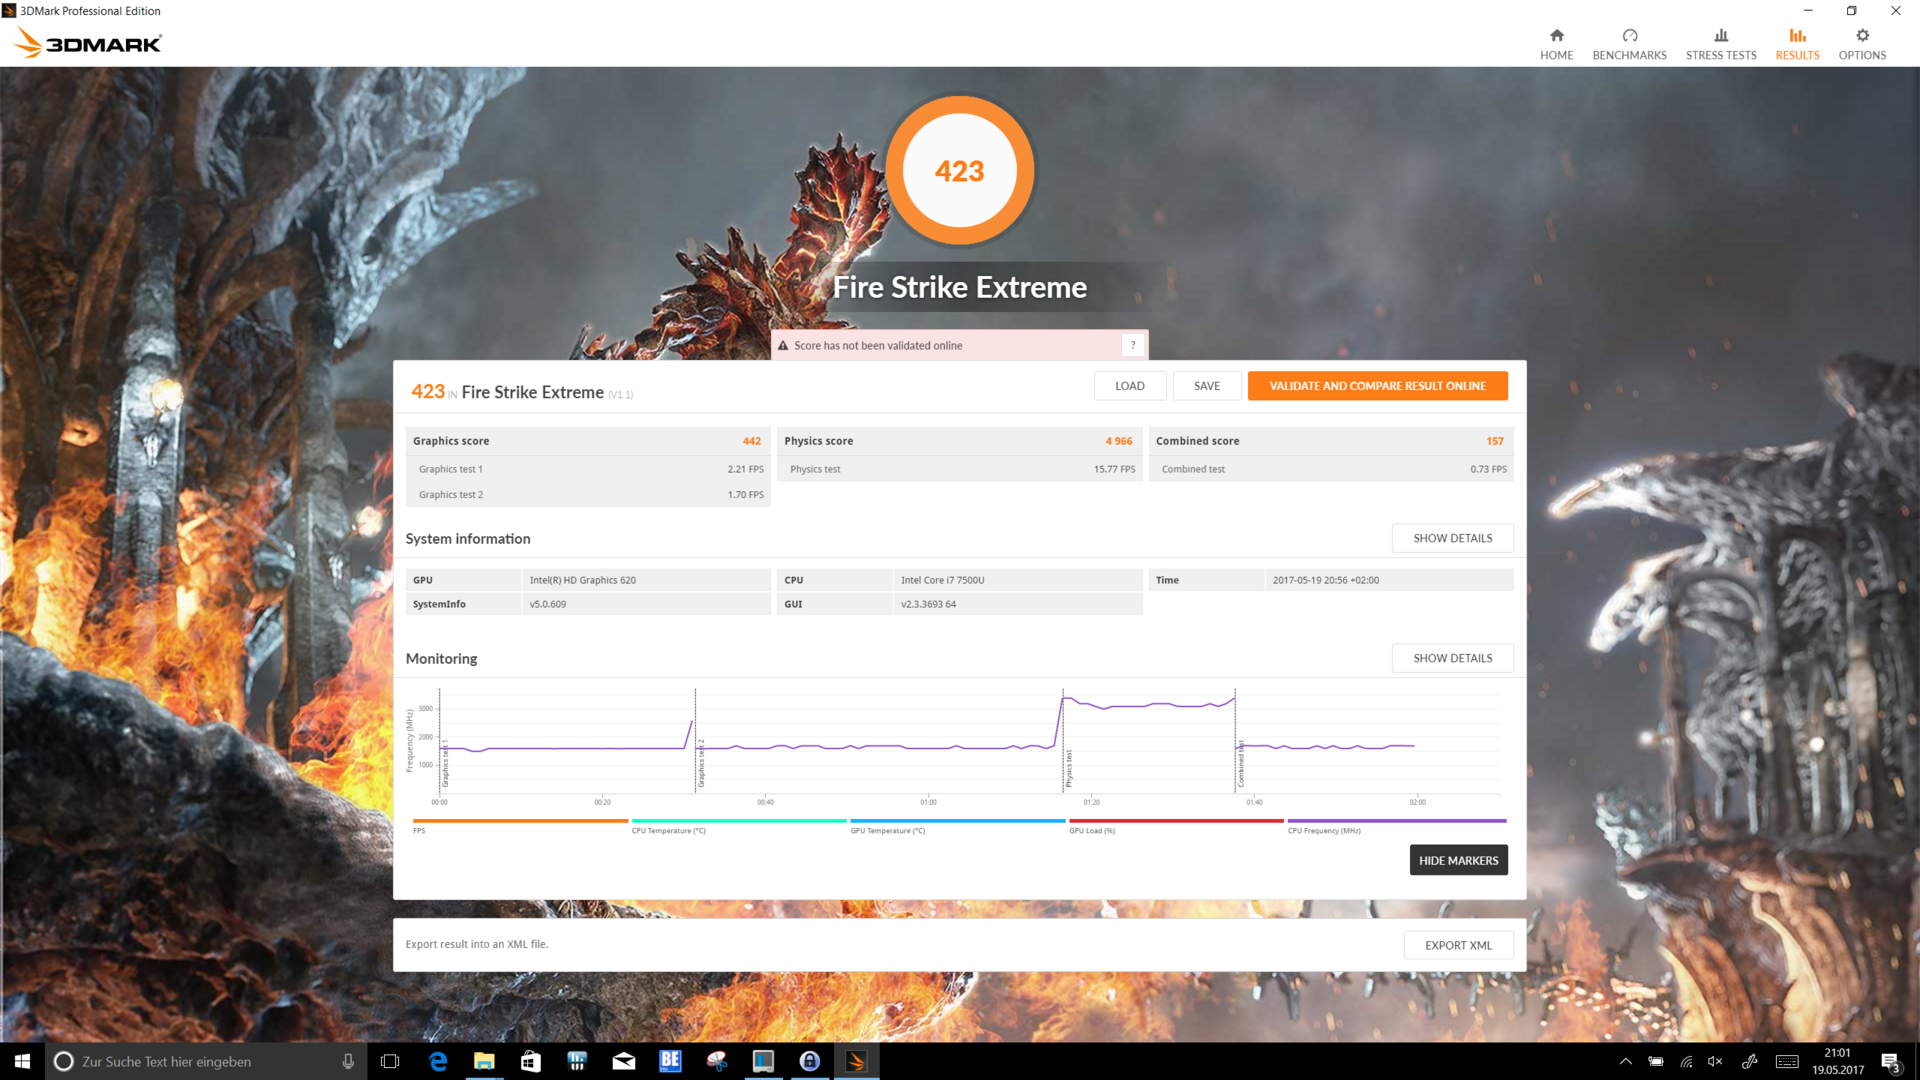
| 3DMark Fire Strike Extreme Score | 423 points | |
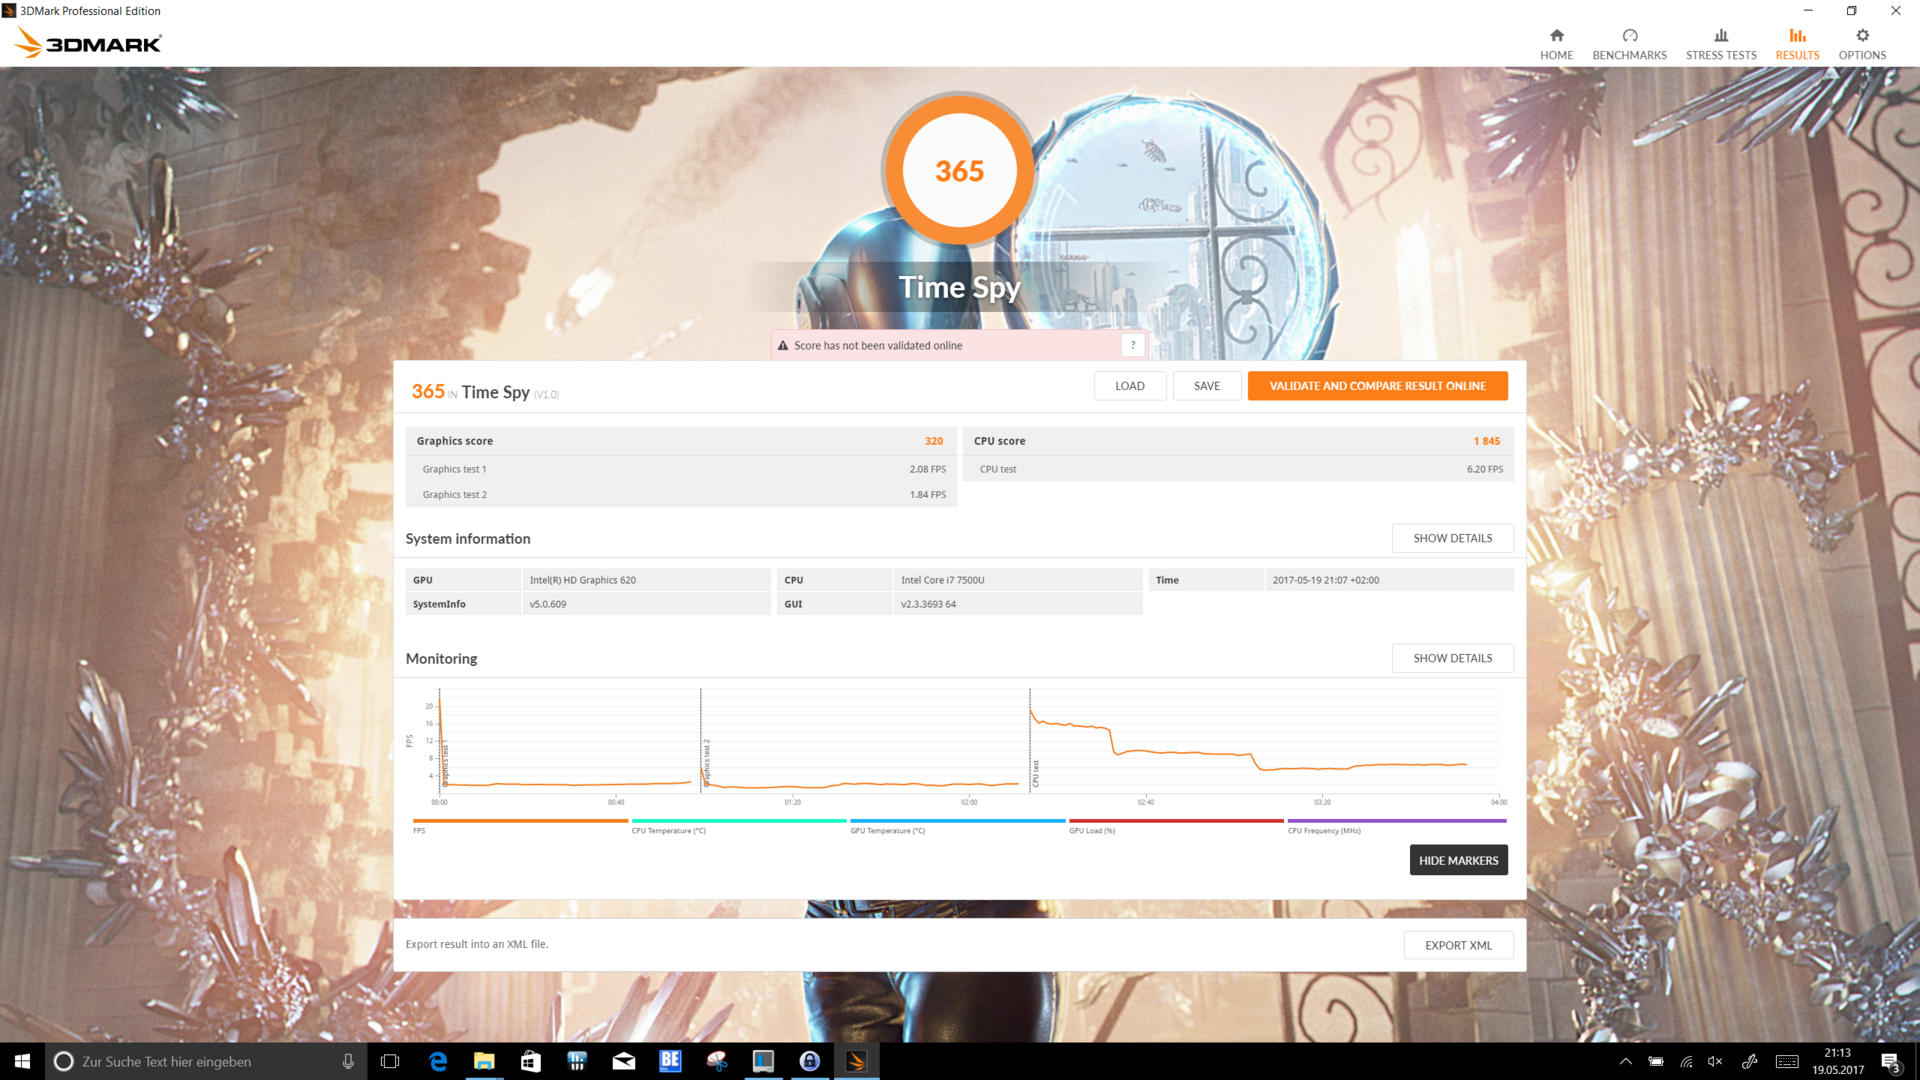
| 3DMark Time Spy Score | 365 points | |
Aide | ||
| Bas | Moyen | Élevé | Ultra | |
|---|---|---|---|---|
| BioShock Infinite (2013) | 54.7 | 31 | 26.3 | 8.2 |
| Battlefield 4 (2013) | 35.3 | 29.1 | 20.1 | 6.3 |
| Rise of the Tomb Raider (2016) | 17.8 | 11.6 | 6.4 |
Degré de la nuisance sonore
| Au repos |
| 29.3 / 31.1 / 33.3 dB(A) |
| Fortement sollicité |
| 33.3 / 38.9 dB(A) |
 | ||
30 dB silencieux 40 dB(A) audible 50 dB(A) bruyant |
||
min: | ||
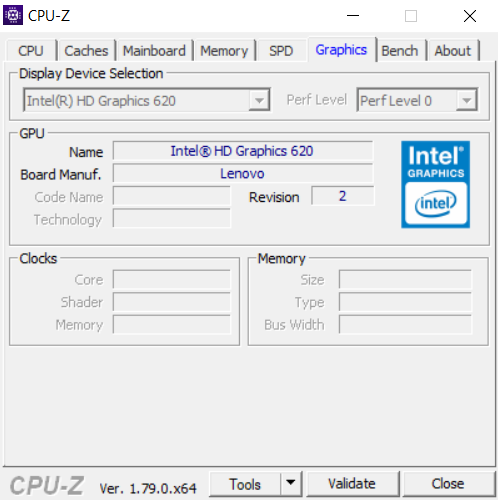
| Lenovo ThinkPad X1 Yoga 2017 20JES03T00 i7-7600U, HD Graphics 620 | Lenovo ThinkPad X1 Yoga-20FRS1VS00 6600U, HD Graphics 520 | HP EliteBook x360 1030 G2 i5-7300U, HD Graphics 620 | Toshiba Portege X20W-D-10R i7-7600U, HD Graphics 620 | Dell Latitude 12 5285 2-in-1 i7-7600U, HD Graphics 620 | Microsoft Surface Book with Performance Base 6600U, GeForce GTX 965M | |
|---|---|---|---|---|---|---|
| Noise | 3% | 5% | 5% | 9% | -1% | |
| arrêt / environnement * (dB) | 29.3 | 28.9 1% | 29 1% | 30.4 -4% | 28.2 4% | 29.4 -0% |
| Idle Minimum * (dB) | 29.3 | 28.9 1% | 29 1% | 30.5 -4% | 28.2 4% | 29.4 -0% |
| Idle Average * (dB) | 31.1 | 28.9 7% | 29 7% | 30.5 2% | 28.2 9% | 29.4 5% |
| Idle Maximum * (dB) | 33.3 | 28.9 13% | 29 13% | 30.5 8% | 28.2 15% | 29.7 11% |
| Load Average * (dB) | 33.3 | 35.3 -6% | 33.6 -1% | 31.2 6% | 30.4 9% | 39 -17% |
| Load Maximum * (dB) | 38.9 | 38.9 -0% | 35.8 8% | 31.3 20% | 34 13% | 40.2 -3% |
| Witcher 3 ultra * (dB) | 39.5 |
* ... Moindre est la valeur, meilleures sont les performances
| Lenovo ThinkPad X1 Yoga 2017 20JES03T00 i7-7600U, HD Graphics 620 | Lenovo ThinkPad X1 Yoga-20FRS1VS00 6600U, HD Graphics 520 | HP EliteBook x360 1030 G2 i5-7300U, HD Graphics 620 | Toshiba Portege X20W-D-10R i7-7600U, HD Graphics 620 | Dell Latitude 12 5285 2-in-1 i7-7600U, HD Graphics 620 | Microsoft Surface Book with Performance Base 6600U, GeForce GTX 965M | |
|---|---|---|---|---|---|---|
| Heat | -17% | 5% | 19% | -8% | -16% | |
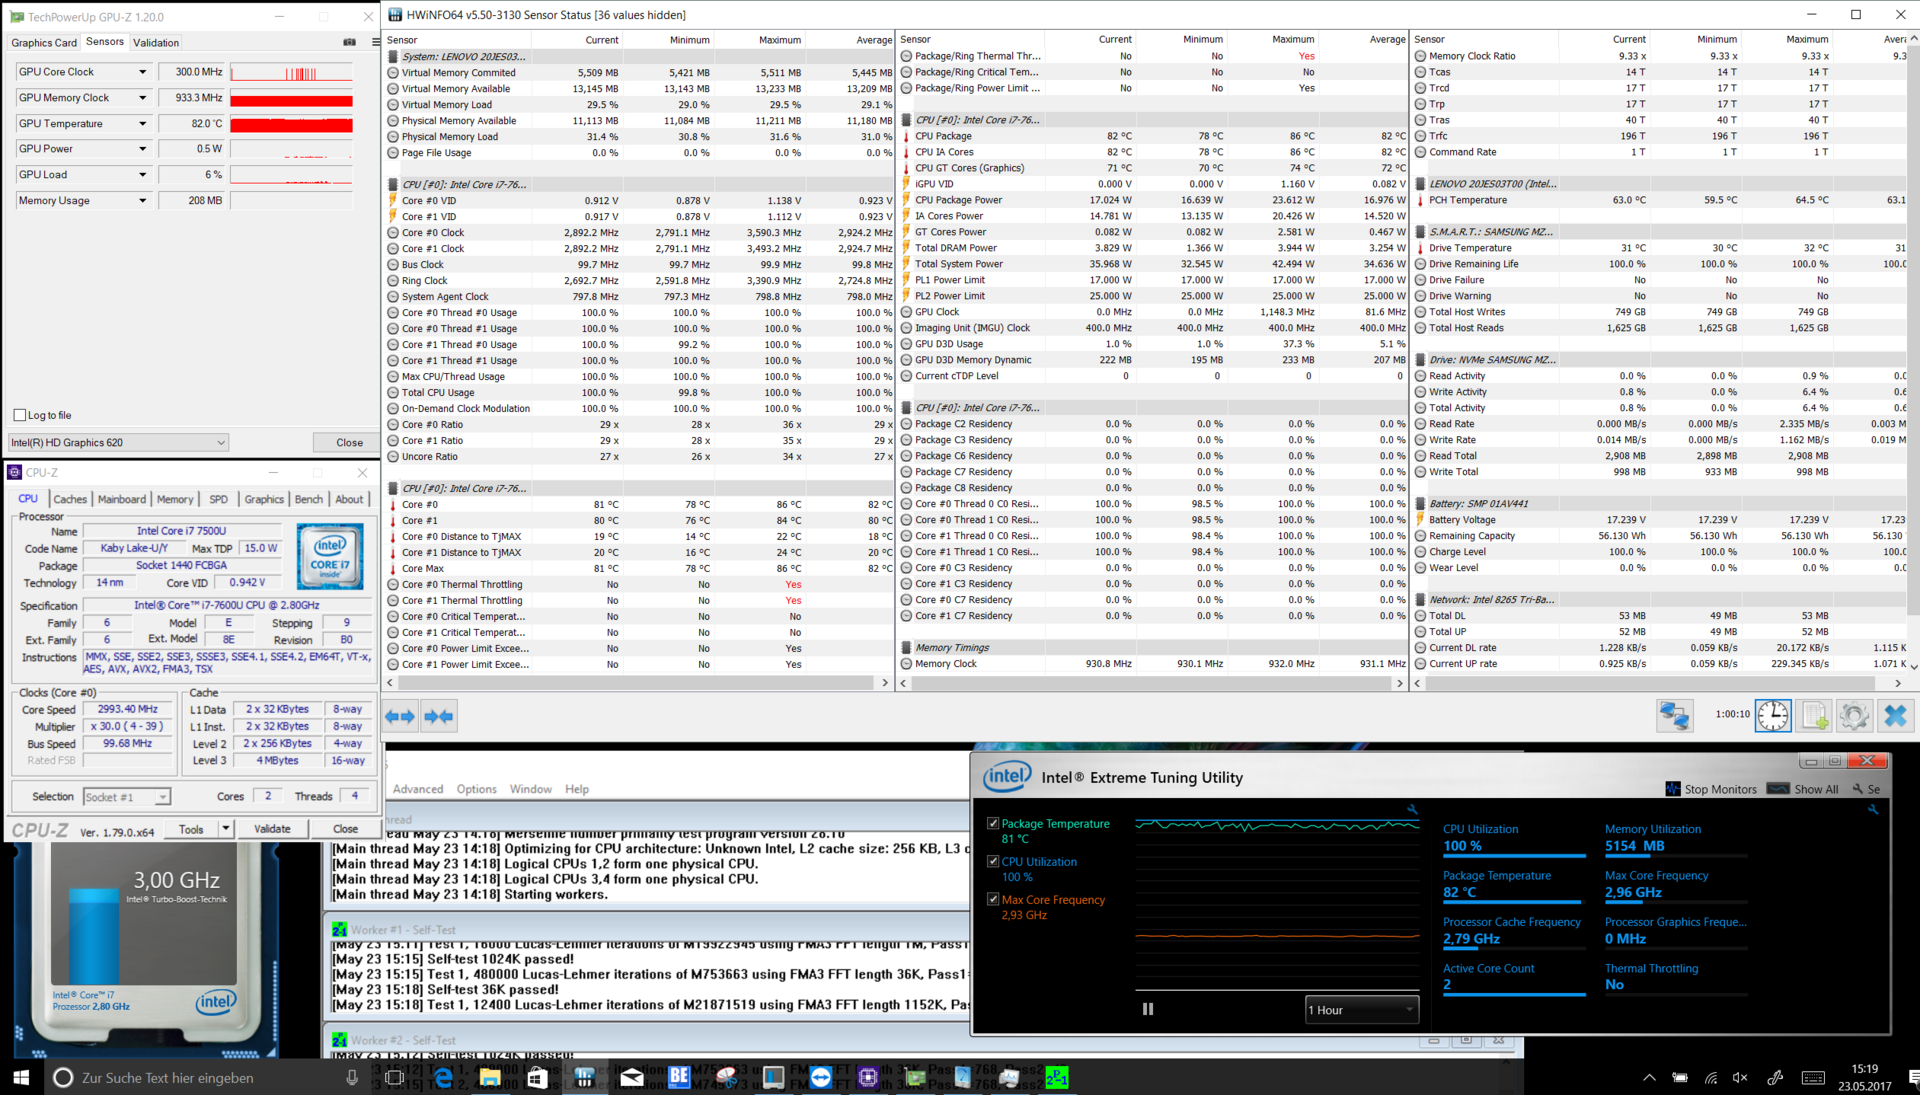
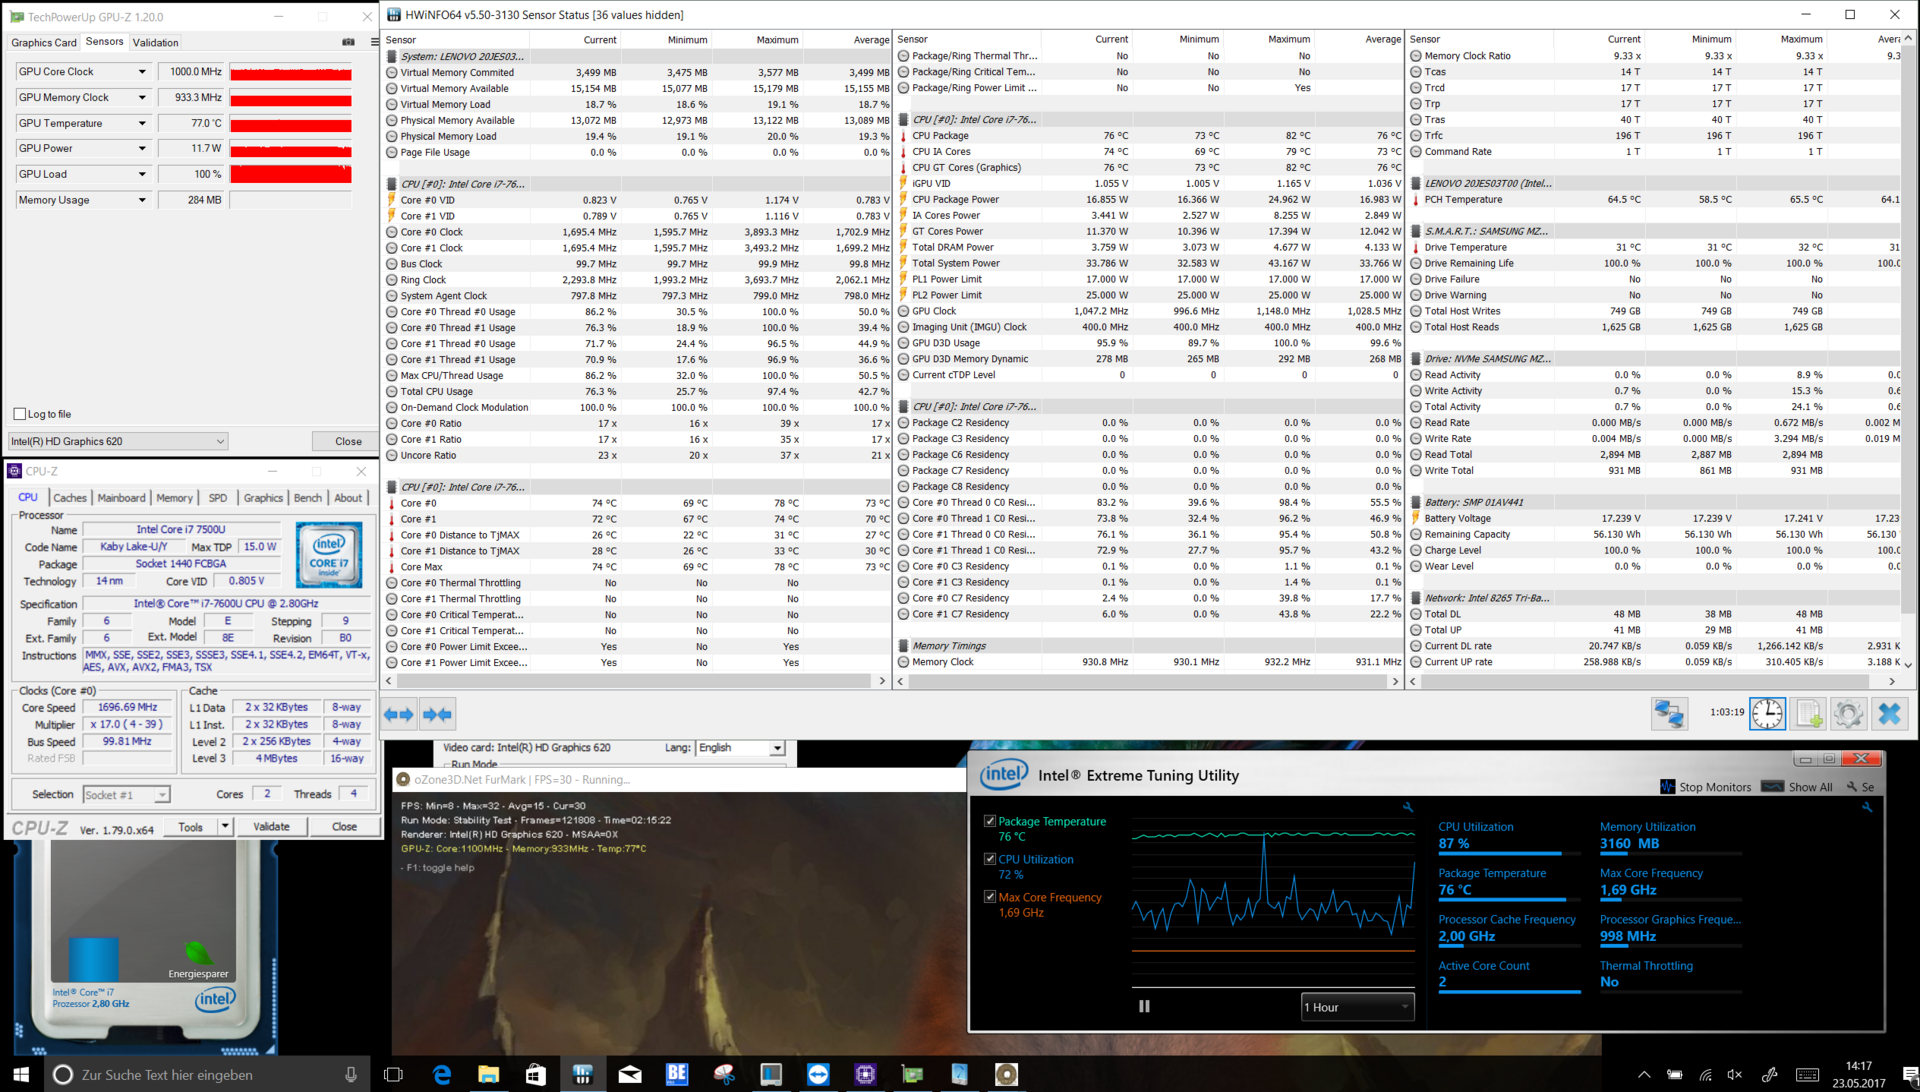
| Maximum Upper Side * (°C) | 47.5 | 45.5 4% | 36.1 24% | 35.7 25% | 38.2 20% | 47 1% |
| Maximum Bottom * (°C) | 44.8 | 47.1 -5% | 36.7 18% | 24.2 46% | 48.6 -8% | 47 -5% |
| Idle Upper Side * (°C) | 23.7 | 31.1 -31% | 26.8 -13% | 23.4 1% | 29.6 -25% | 34.4 -45% |
| Idle Bottom * (°C) | 24.6 | 33.1 -35% | 26.5 -8% | 24.2 2% | 28.8 -17% | 27.7 -13% |
* ... Moindre est la valeur, meilleures sont les performances
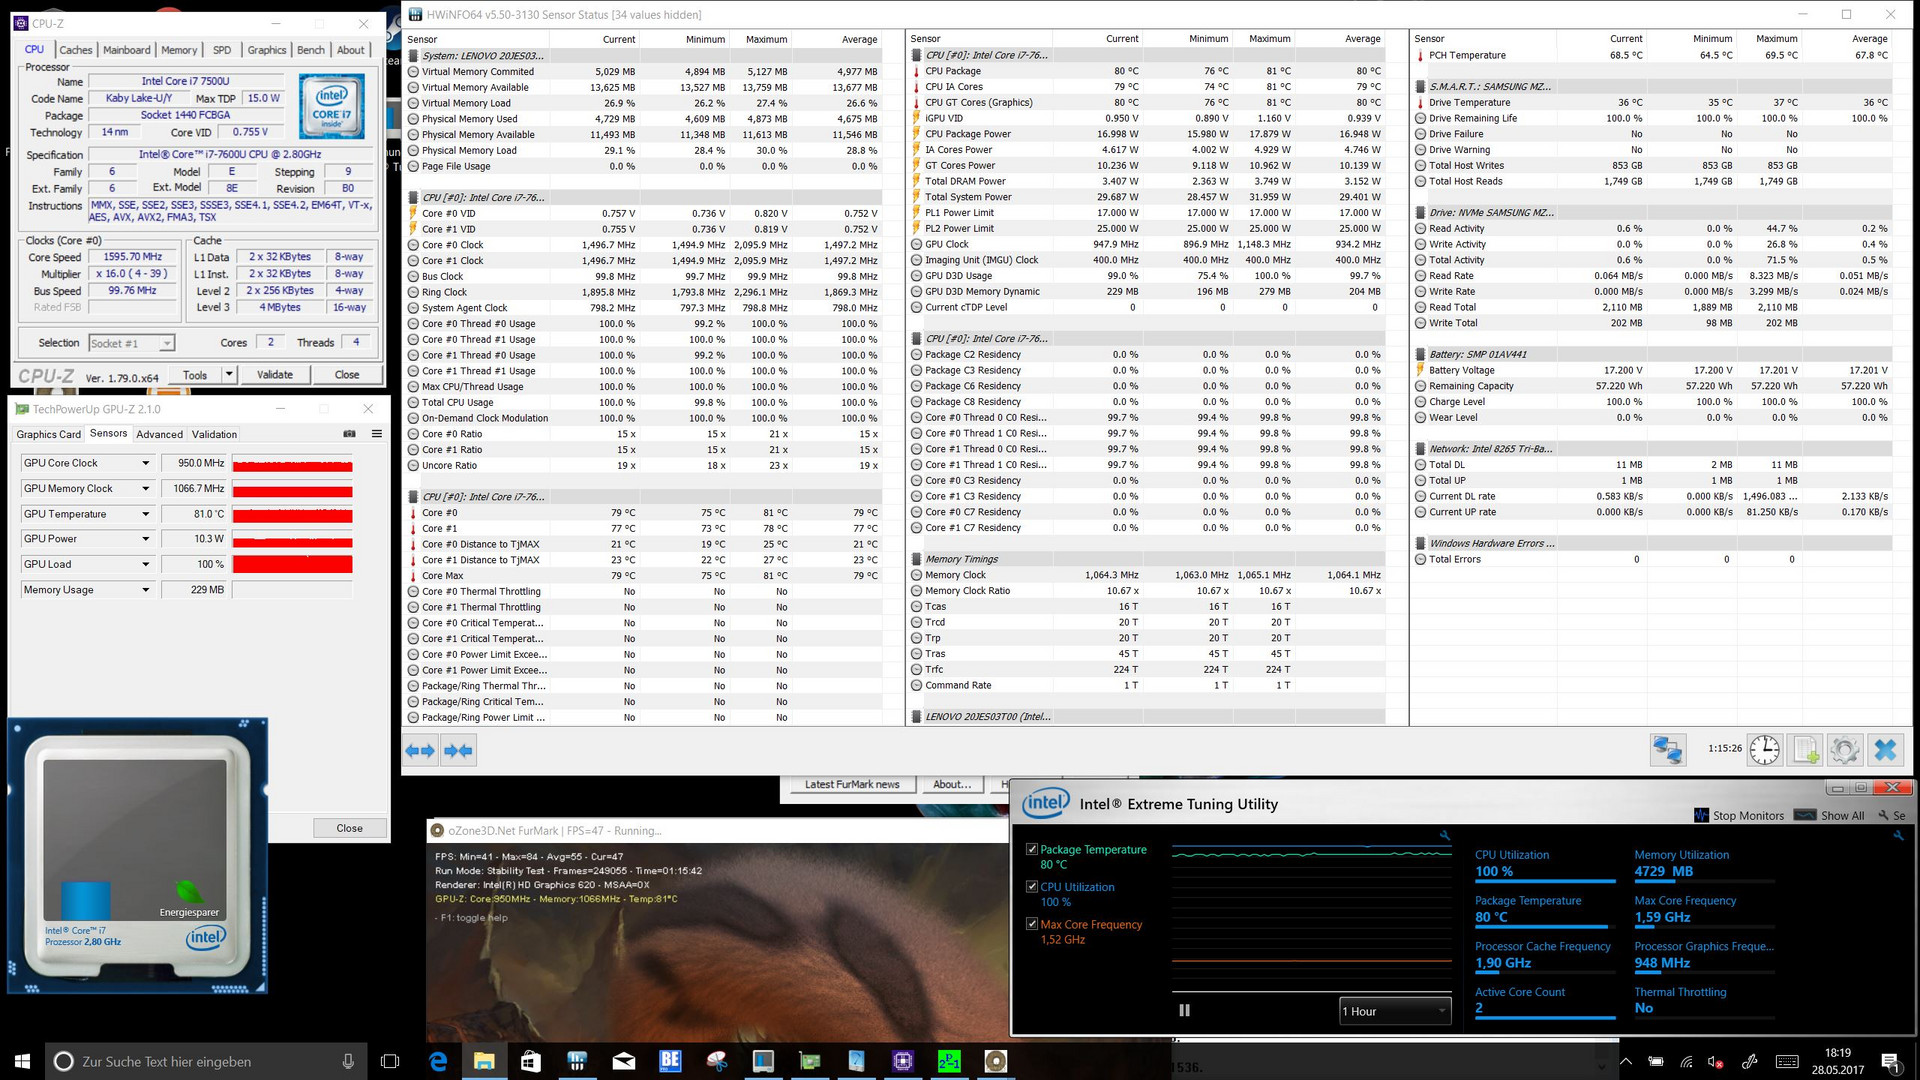
(-) La température maximale du côté supérieur est de 47.5 °C / 118 F, par rapport à la moyenne de 35.4 °C / 96 F, allant de 19.6 à 60 °C pour la classe Convertible.
(±) Le fond chauffe jusqu'à un maximum de 44.8 °C / 113 F, contre une moyenne de 36.9 °C / 98 F
(+) En utilisation inactive, la température moyenne du côté supérieur est de 22.9 °C / 73 F, par rapport à la moyenne du dispositif de 30.3 °C / 87 F.
(+) Les repose-poignets et le pavé tactile sont plus froids que la température de la peau avec un maximum de 30.2 °C / 86.4 F et sont donc froids au toucher.
(-) La température moyenne de la zone de l'appui-paume de dispositifs similaires était de 28 °C / 82.4 F (-2.2 °C / #-4 F).
Lenovo ThinkPad X1 Yoga 2017 20JES03T00 analyse audio
(±) | le niveau sonore du haut-parleur est moyen mais bon (73.3# dB)
Basses 100 - 315 Hz
(-) | presque aucune basse - en moyenne 19.1% plus bas que la médiane
(±) | la linéarité des basses est moyenne (8.6% delta à la fréquence précédente)
Médiums 400 - 2000 Hz
(+) | médiane équilibrée - seulement 2.6% de la médiane
(±) | la linéarité des médiums est moyenne (8% delta à la fréquence précédente)
Aiguës 2 - 16 kHz
(+) | des sommets équilibrés - à seulement 2.6% de la médiane
(+) | les aigus sont linéaires (6.6% delta à la fréquence précédente)
Globalement 100 - 16 000 Hz
(±) | la linéarité du son global est moyenne (21.7% de différence avec la médiane)
Par rapport à la même classe
» 60% de tous les appareils testés de cette catégorie étaient meilleurs, 9% similaires, 31% pires
» Le meilleur avait un delta de 6%, la moyenne était de 20%, le pire était de 57%.
Par rapport à tous les appareils testés
» 62% de tous les appareils testés étaient meilleurs, 7% similaires, 31% pires
» Le meilleur avait un delta de 4%, la moyenne était de 23%, le pire était de 134%.
Toshiba Portege X20W-D-10R analyse audio
(-) | haut-parleurs pas très forts (64 dB)
Basses 100 - 315 Hz
(-) | presque aucune basse - en moyenne 24.3% plus bas que la médiane
(±) | la linéarité des basses est moyenne (11.3% delta à la fréquence précédente)
Médiums 400 - 2000 Hz
(+) | médiane équilibrée - seulement 3.5% de la médiane
(±) | la linéarité des médiums est moyenne (7.9% delta à la fréquence précédente)
Aiguës 2 - 16 kHz
(+) | des sommets équilibrés - à seulement 4.8% de la médiane
(+) | les aigus sont linéaires (6.2% delta à la fréquence précédente)
Globalement 100 - 16 000 Hz
(±) | la linéarité du son global est moyenne (27% de différence avec la médiane)
Par rapport à la même classe
» 83% de tous les appareils testés de cette catégorie étaient meilleurs, 3% similaires, 14% pires
» Le meilleur avait un delta de 6%, la moyenne était de 20%, le pire était de 57%.
Par rapport à tous les appareils testés
» 83% de tous les appareils testés étaient meilleurs, 4% similaires, 14% pires
» Le meilleur avait un delta de 4%, la moyenne était de 23%, le pire était de 134%.
| Éteint/en veille | |
| Au repos | |
| Fortement sollicité |
|
Légende:
min: | |
| Lenovo ThinkPad X1 Yoga 2017 20JES03T00 i7-7600U, HD Graphics 620, Samsung SSD PM961 1TB M.2 PCIe 3.0 x4 NVMe (MZVLW1T0), OLED, 2560x1440, 14" | Lenovo ThinkPad X1 Yoga-20FRS1VS00 6600U, HD Graphics 520, Samsung SSD PM961 1TB M.2 PCIe 3.0 x4 NVMe (MZSLW1T0), OLED, 2560x1440, 14" | HP EliteBook x360 1030 G2 i5-7300U, HD Graphics 620, Sandisk SD8TN8U-256G-1006, IPS, 1920x1080, 13.3" | Toshiba Portege X20W-D-10R i7-7600U, HD Graphics 620, Toshiba SG5 THNSNK512GVN8, IPS, 1920x1080, 12.5" | Dell Latitude 12 5285 2-in-1 i7-7600U, HD Graphics 620, Samsung PM961 MZVLW256HEHP, IPS, 1920x1280, 12.3" | Microsoft Surface Book with Performance Base 6600U, GeForce GTX 965M, Toshiba NVMe THNSN5256GPU7, IPS, 3000x2000, 13.5" | |
|---|---|---|---|---|---|---|
| Power Consumption | 1% | 28% | 39% | 25% | -28% | |
| Idle Minimum * (Watt) | 4.9 | 4.7 4% | 3.2 35% | 3.4 31% | 2.85 42% | 4.15 15% |
| Idle Average * (Watt) | 7.6 | 8.6 -13% | 5.5 28% | 5.8 24% | 6.76 11% | 8 -5% |
| Idle Maximum * (Watt) | 13.8 | 12.2 12% | 6.5 53% | 6.7 51% | 6.91 50% | 11.9 14% |
| Load Average * (Watt) | 33.4 | 29.7 11% | 29.7 11% | 21.4 36% | 32.88 2% | 67 -101% |
| Load Maximum * (Watt) | 46.5 | 50.5 -9% | 41.3 11% | 21.6 54% | 37.41 20% | 76 -63% |
| Witcher 3 ultra * (Watt) | 58 |
* ... Moindre est la valeur, meilleures sont les performances

| Lenovo ThinkPad X1 Yoga 2017 20JES03T00 i7-7600U, HD Graphics 620, 56 Wh | Lenovo ThinkPad X1 Yoga-20FRS1VS00 6600U, HD Graphics 520, 56 Wh | HP EliteBook x360 1030 G2 i5-7300U, HD Graphics 620, 57 Wh | Toshiba Portege X20W-D-10R i7-7600U, HD Graphics 620, 44 Wh | Dell Latitude 12 5285 2-in-1 i7-7600U, HD Graphics 620, 42 Wh | Microsoft Surface Book with Performance Base 6600U, GeForce GTX 965M, 78 Wh | |
|---|---|---|---|---|---|---|
| Autonomie de la batterie | 8% | 79% | 50% | 20% | 42% | |
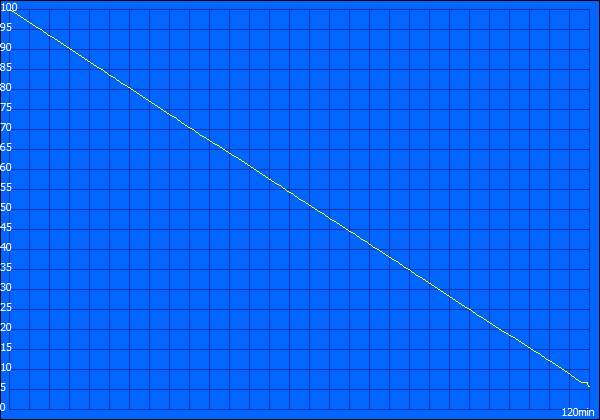
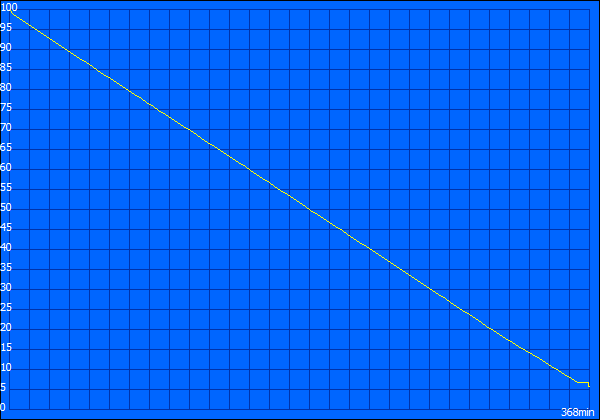
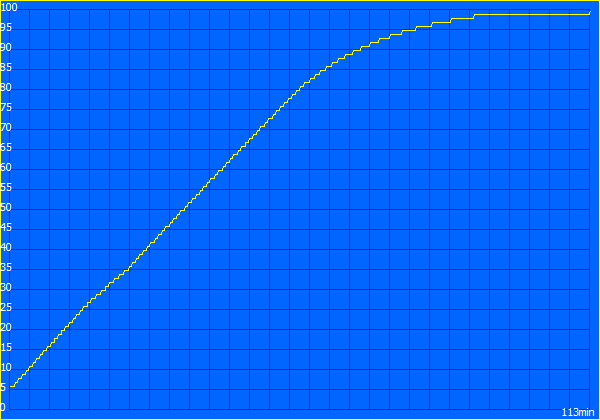
| Reader / Idle (h) | 13.1 | 13.7 5% | 23.1 76% | 16.7 27% | 17.9 37% | 25.5 95% |
| H.264 (h) | 6.8 | 8.7 28% | 11 62% | |||
| WiFi v1.3 (h) | 6.1 | 5.3 -13% | 10.5 72% | 12 97% | 8.1 33% | 9.6 57% |
| Load (h) | 2 | 2.2 10% | 4.1 105% | 2.5 25% | 1.8 -10% | 1.5 -25% |
Points positifs
Points négatifs
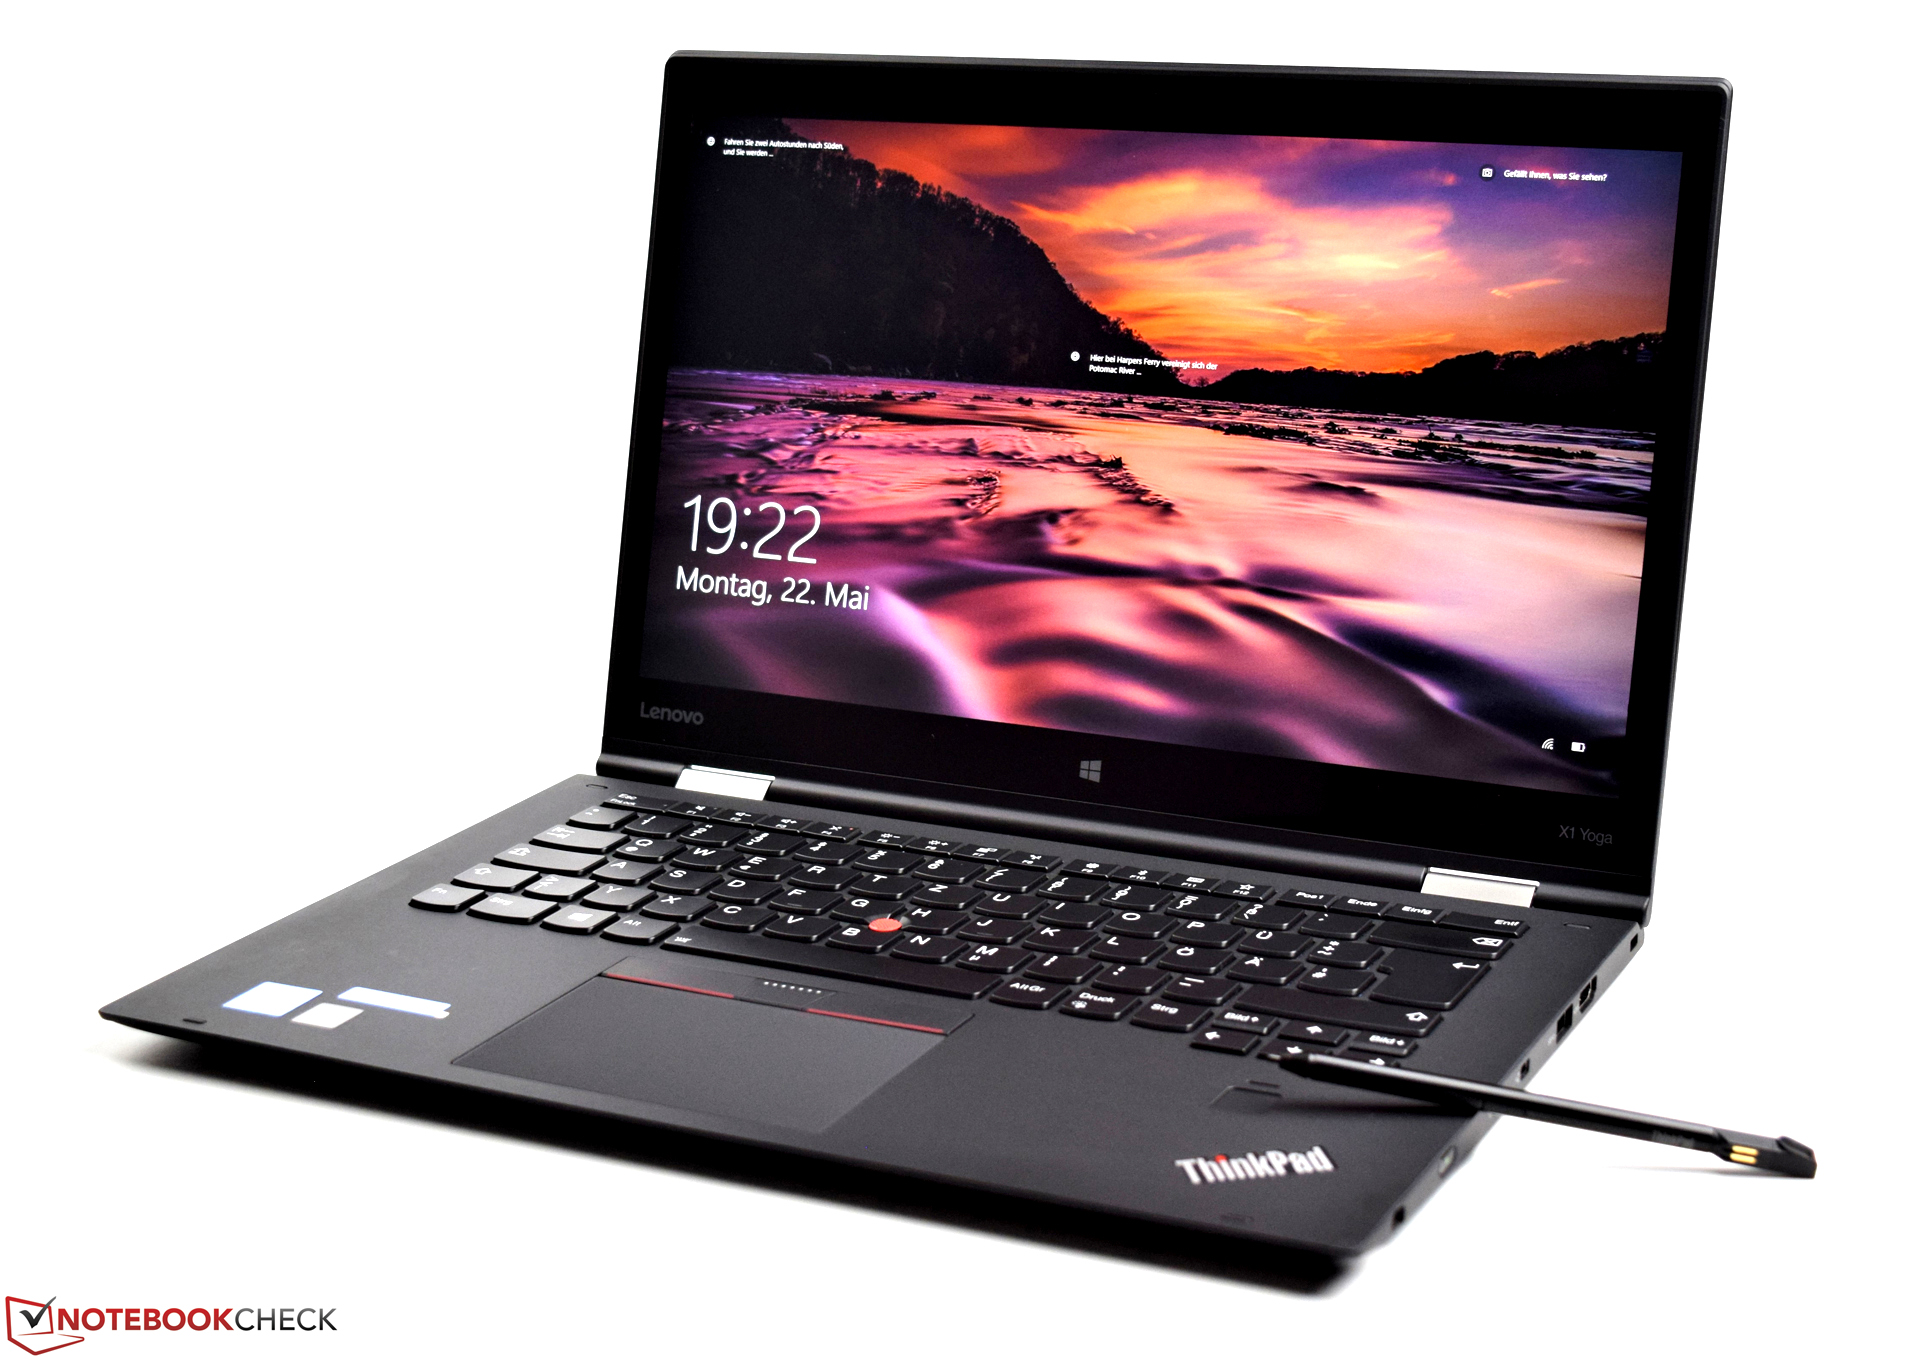
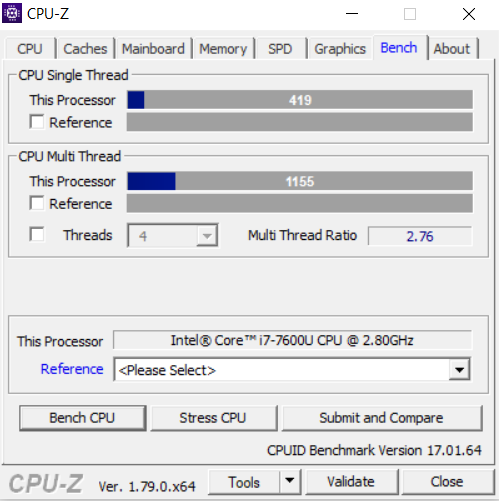
Le ThinkPad X1 Yoga 2017 est un convertible haut de gamme puissant, qui se distingue non seulement par son exceptionnel écran OLED, mais aussi par son prix : à 3 300 €, ce n’est pas vraiment l’affaire à saisir... Les composants premium sont à la hauteur, si bien que le système tourne très fluidement. Les résultats des tests confirment cette impression. L’Intel Core i7-7600U est puissant, et permet de voir venir. La quantité de stockage et de RAM est également très généreuse.
Si l’argent n’est pas un problème pour vous, et qu’un "convertible extraordinaire" est tout ce qu’il vous faut, alors le Lenovo ThinkPad X1 Yoga 2017 est un choix évident. Que le prix soit justifié ou non, c’est à l’utilisateur d’en décider.
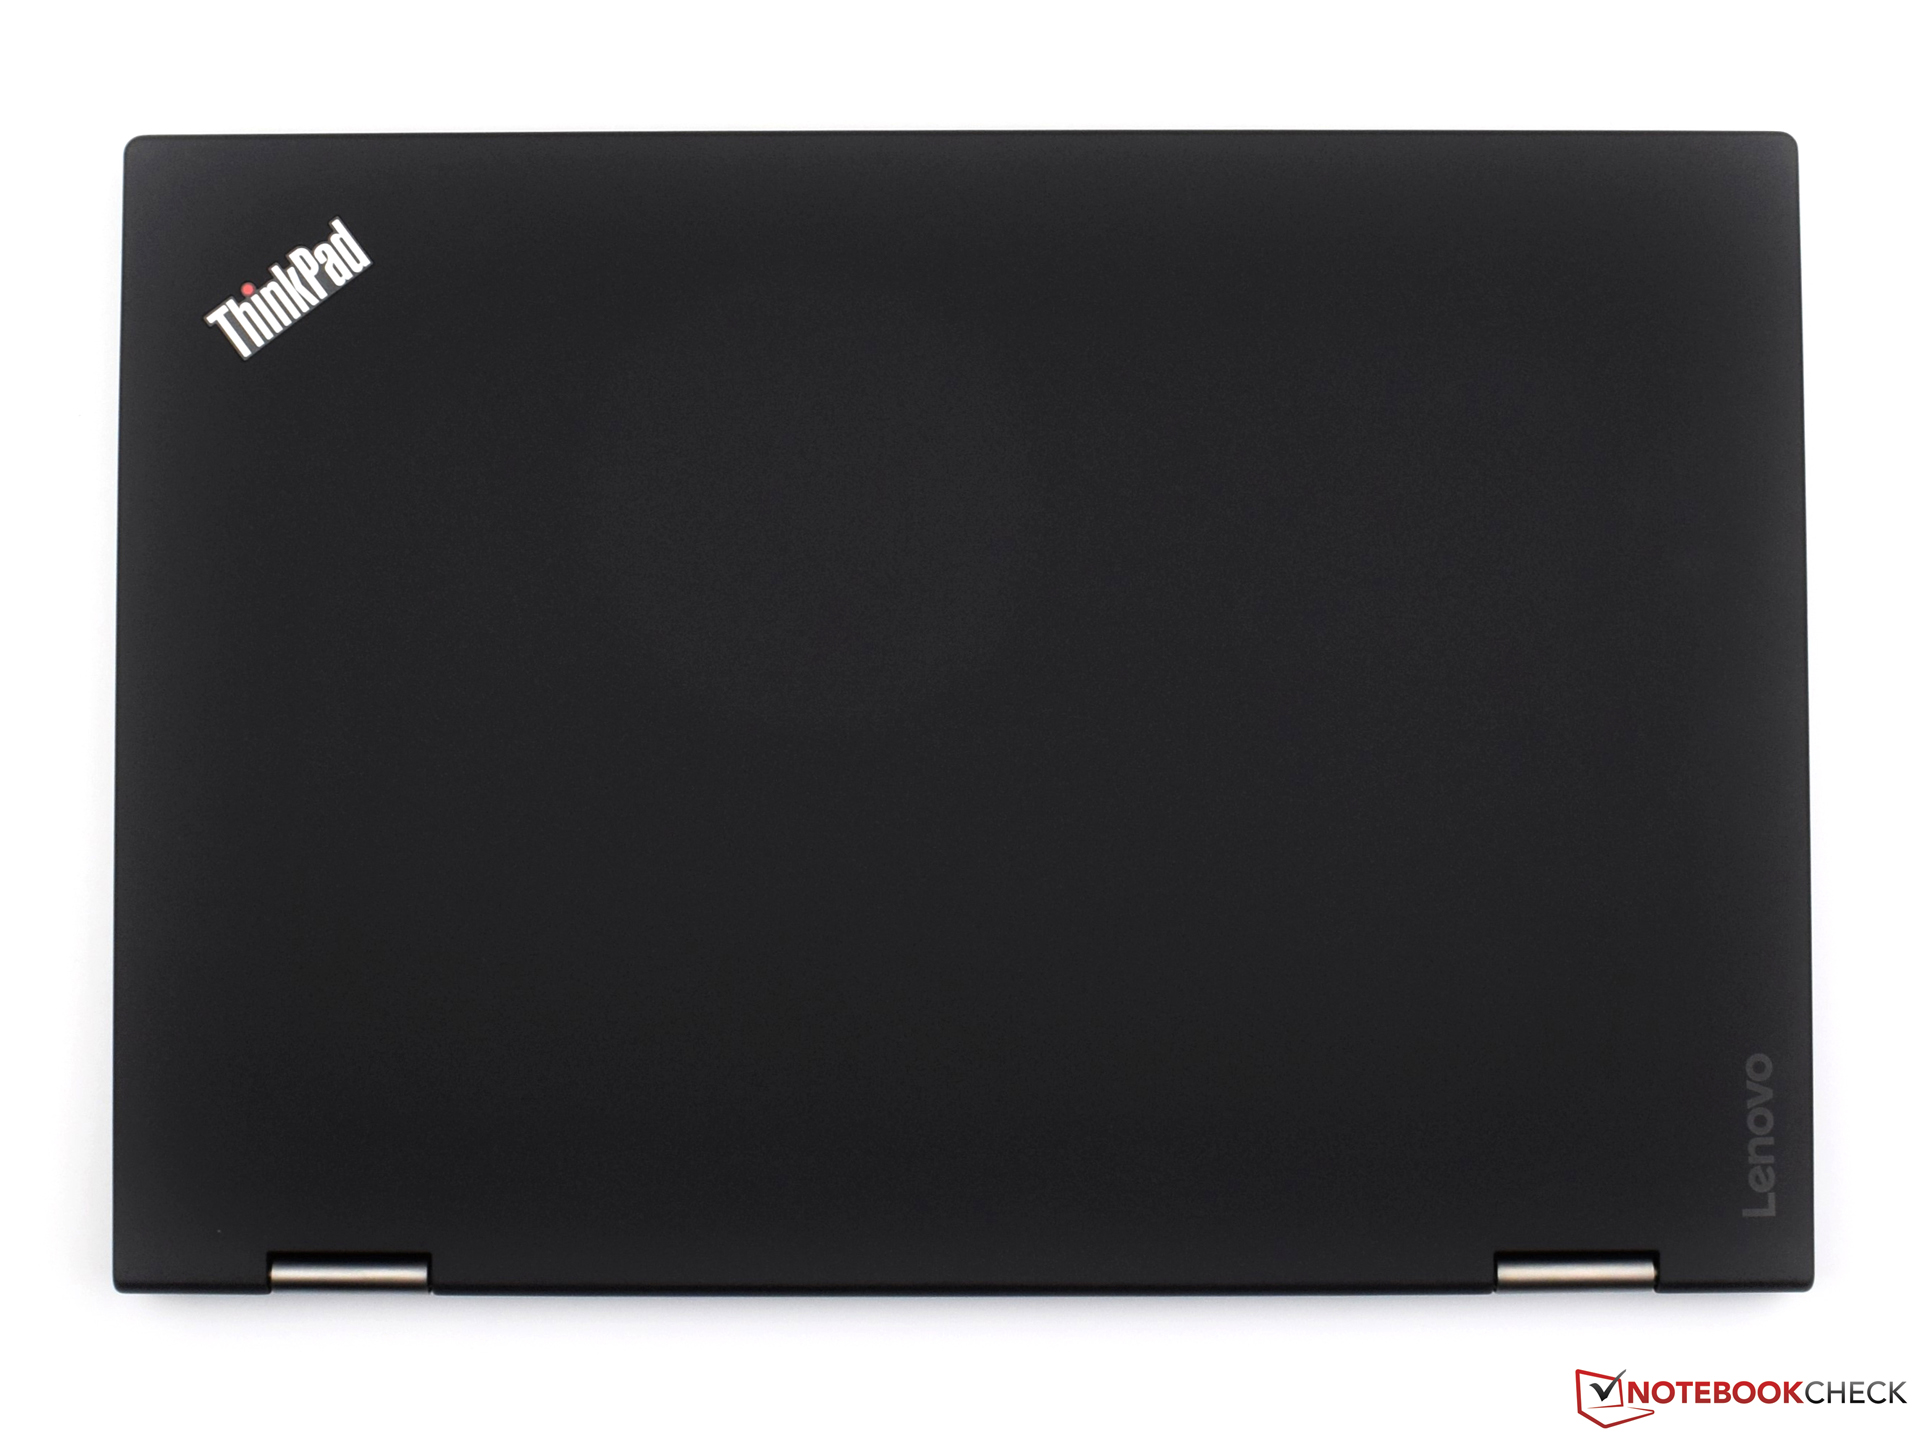
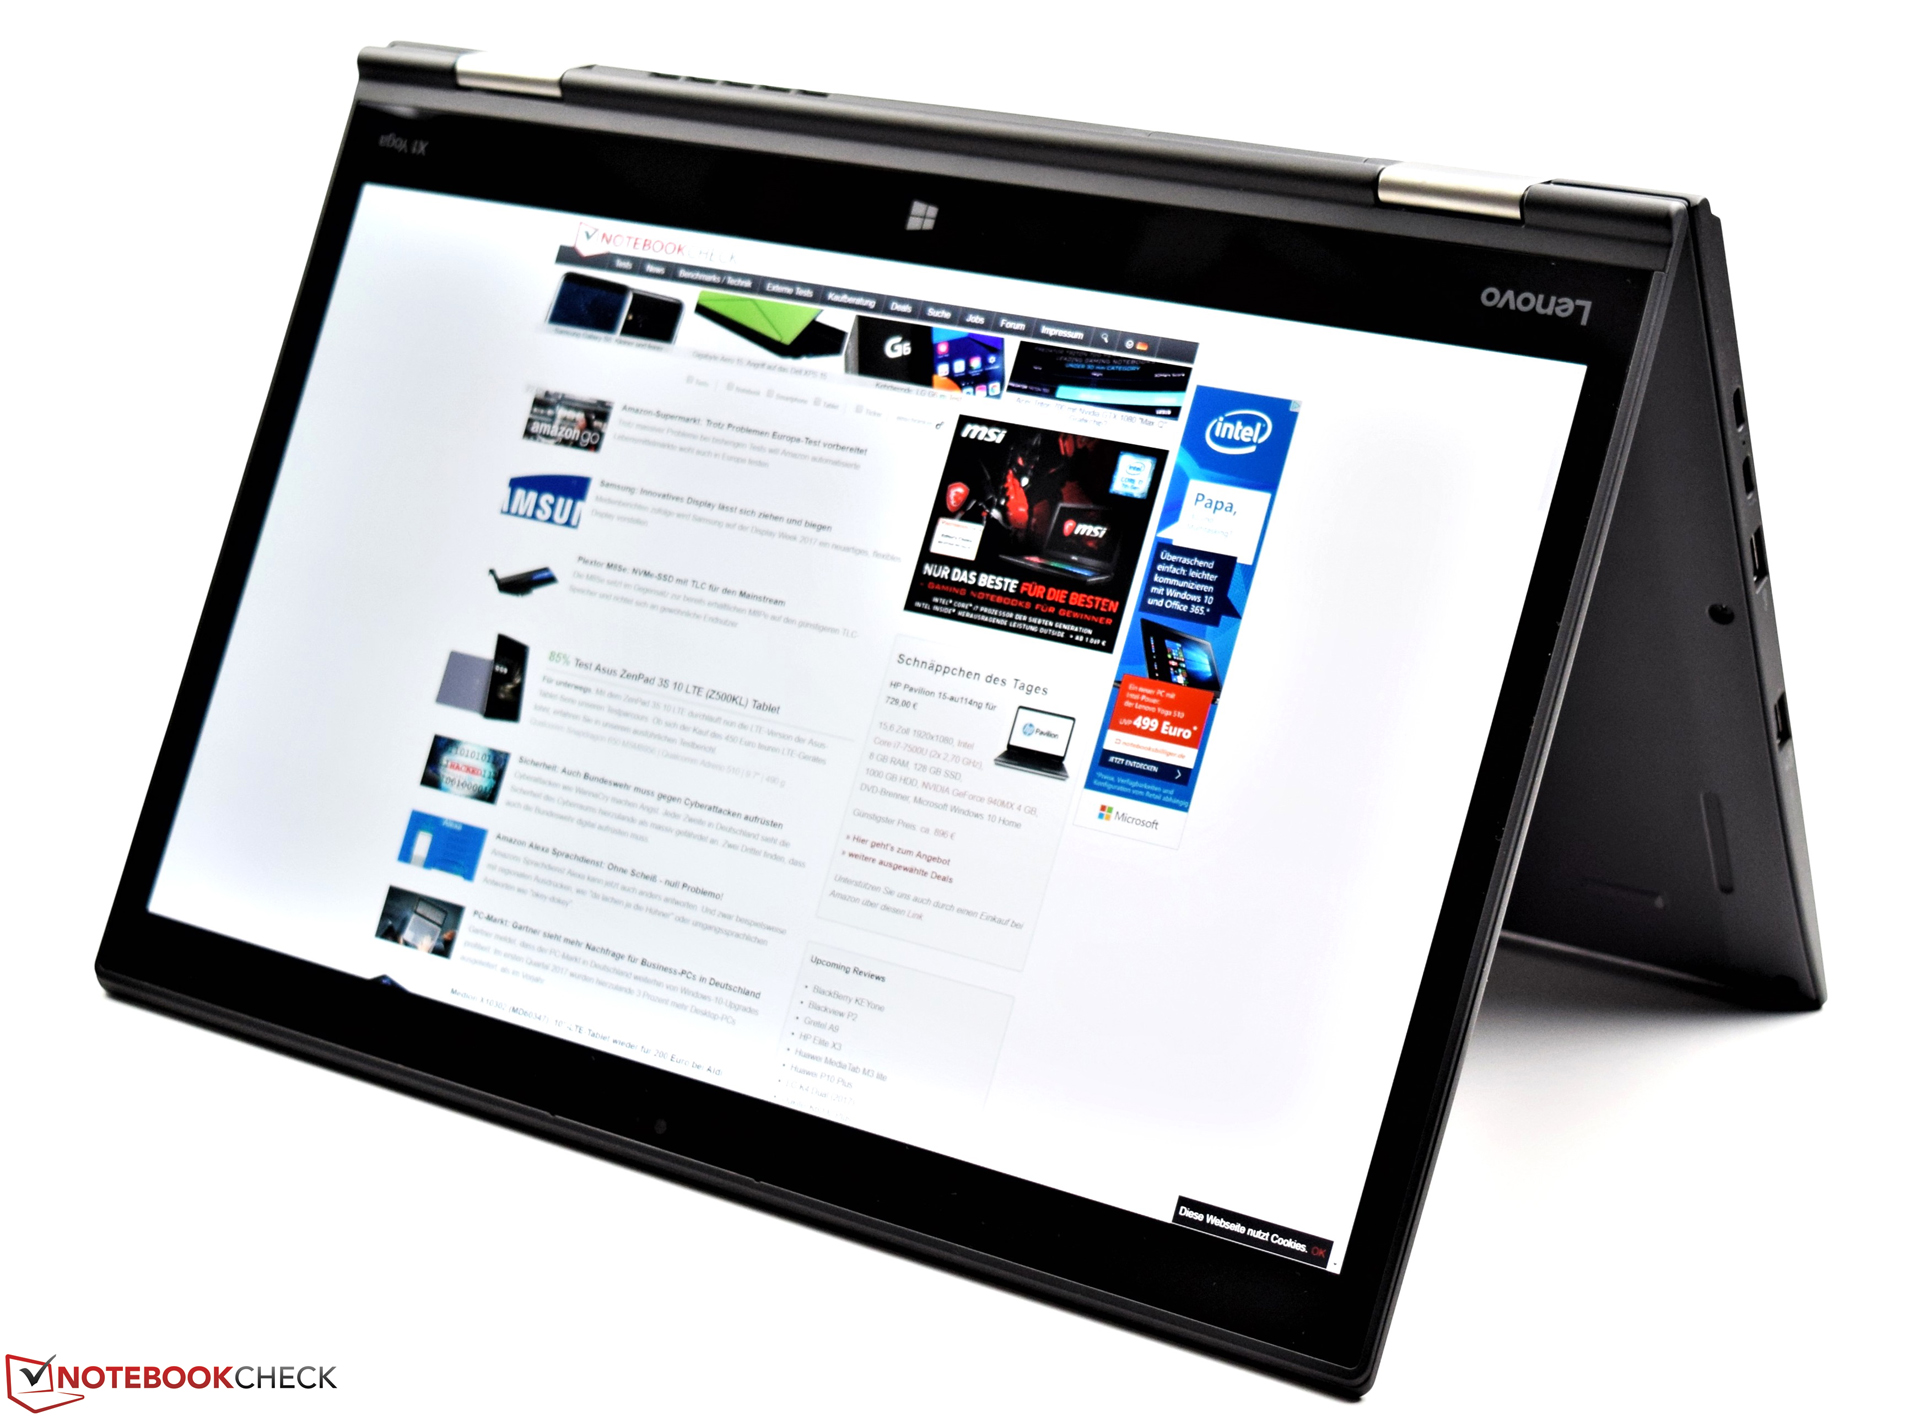
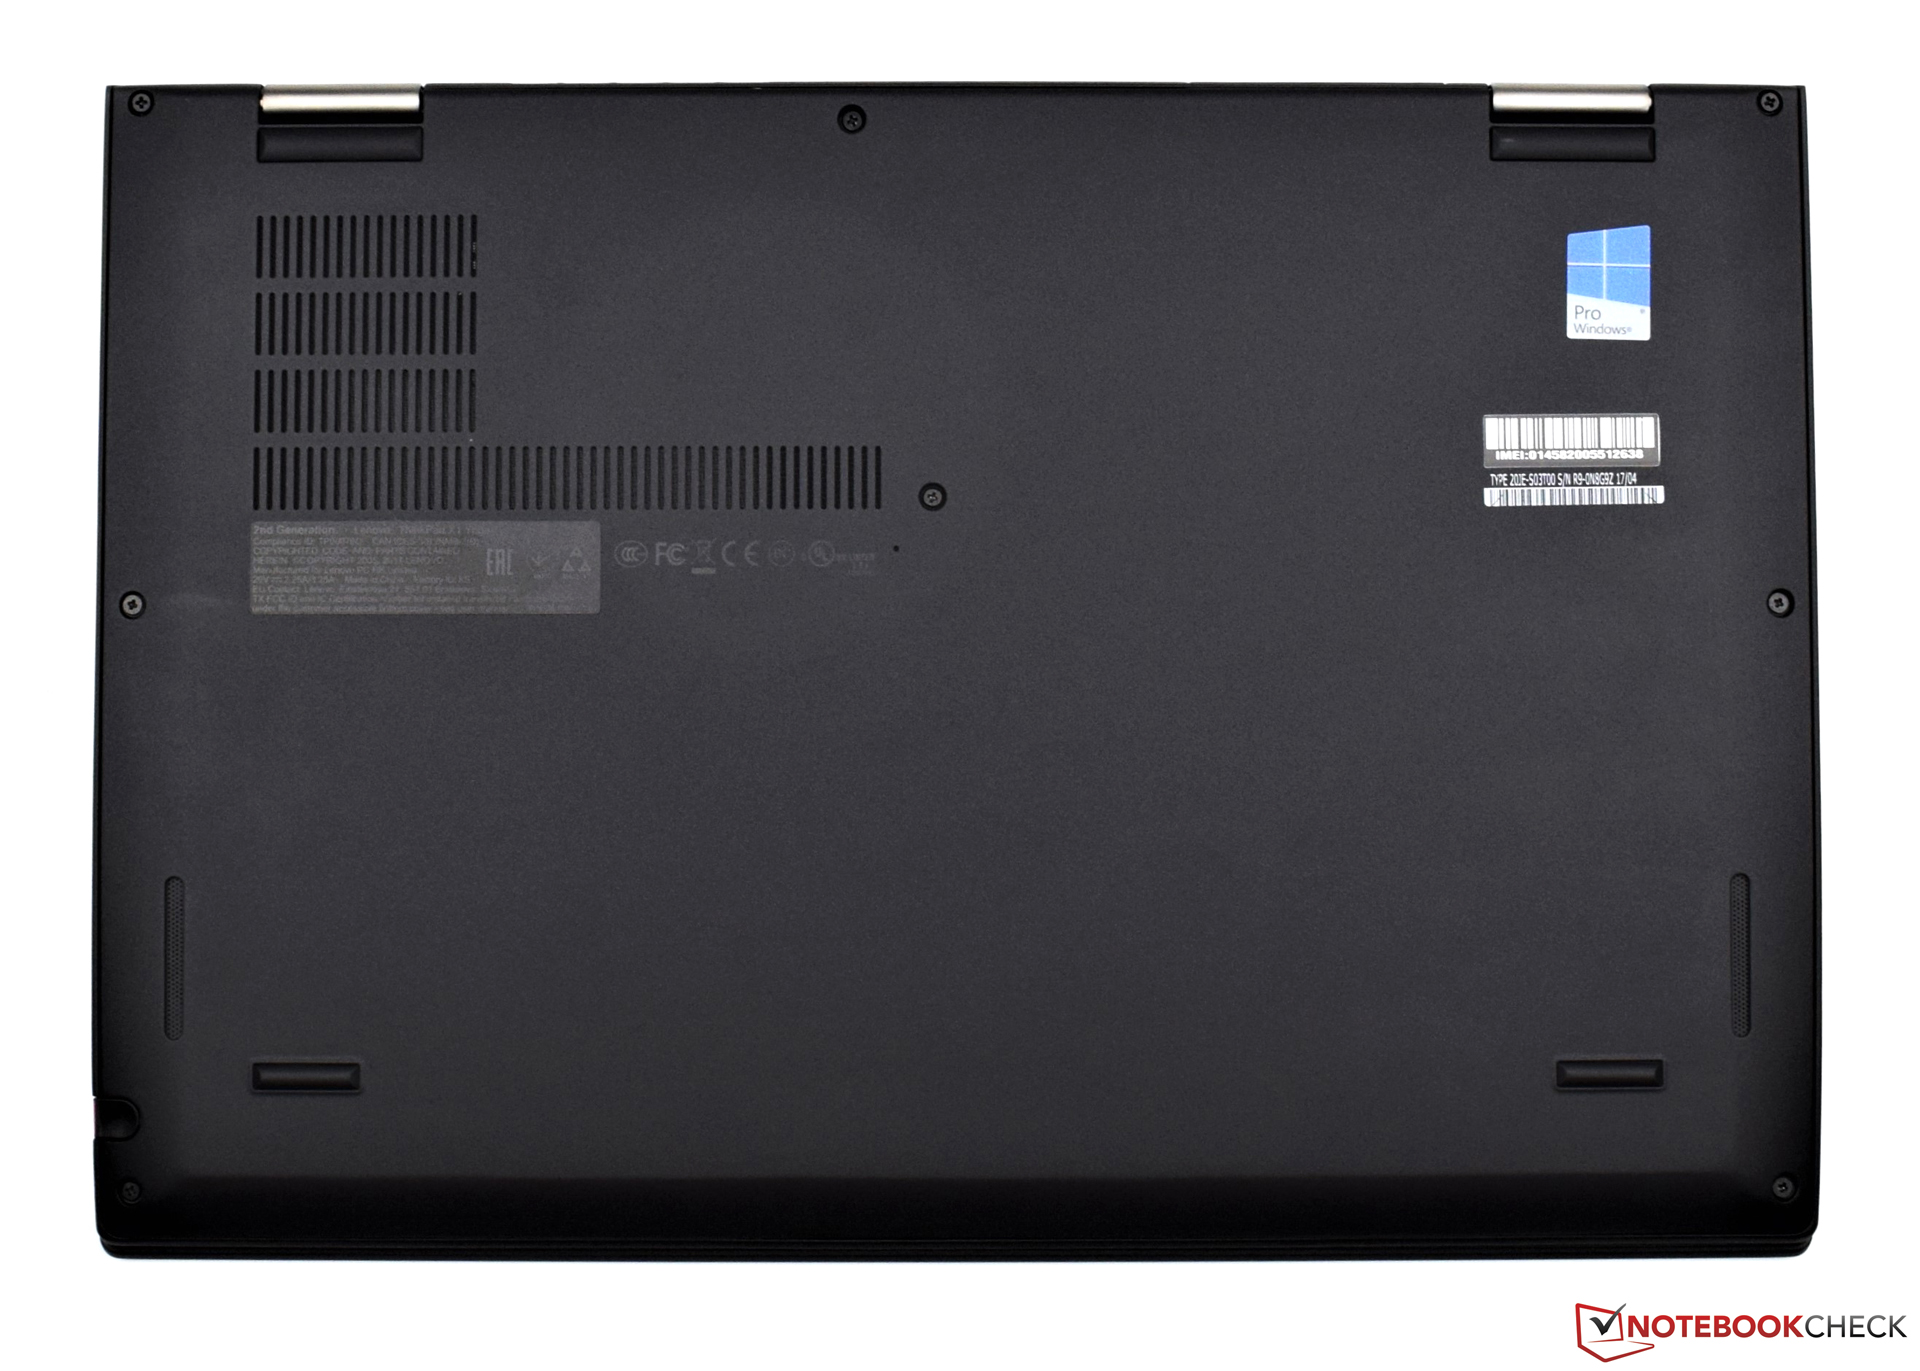
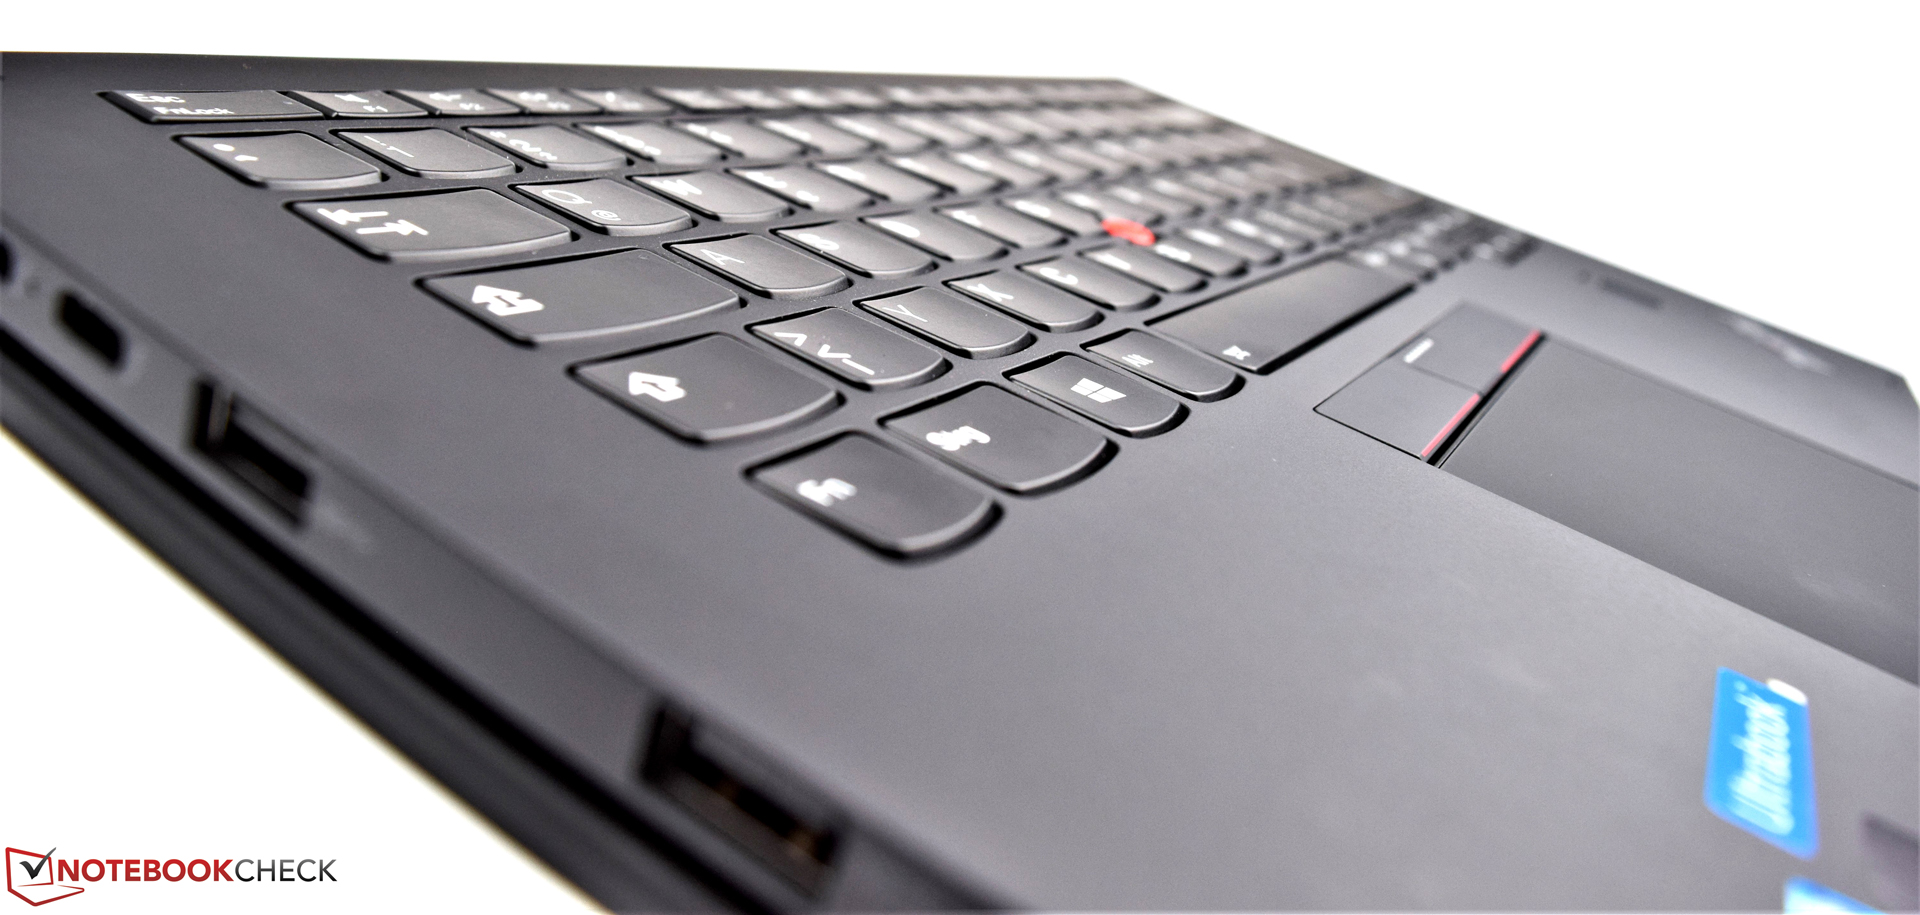
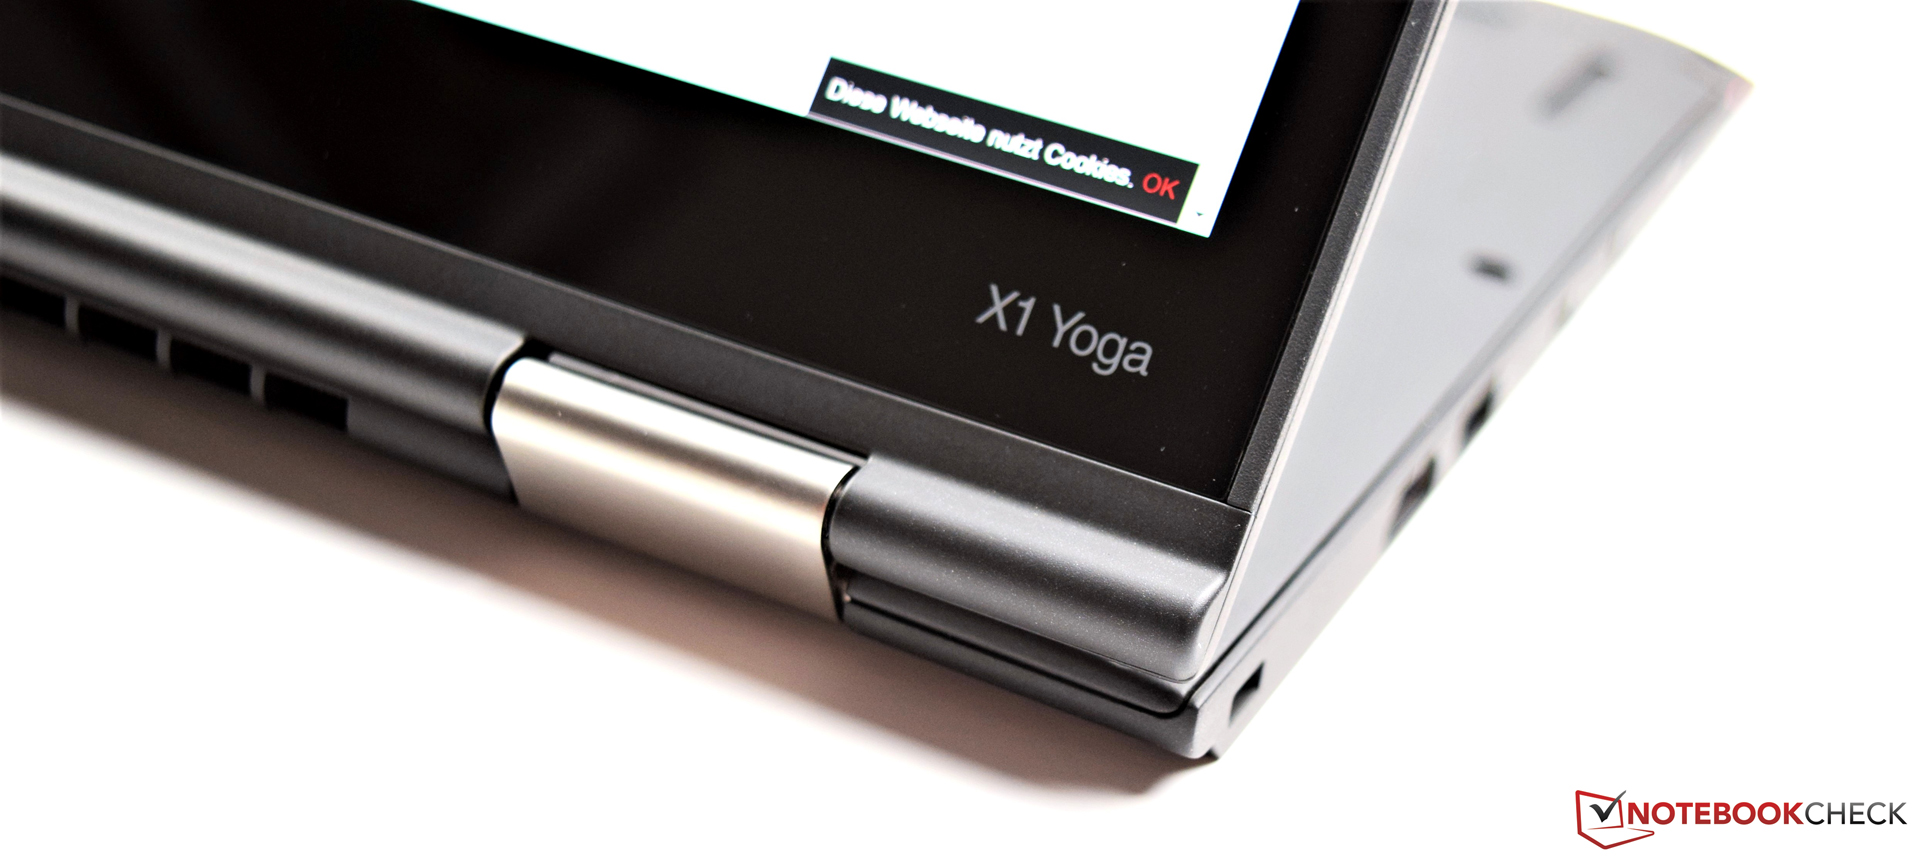
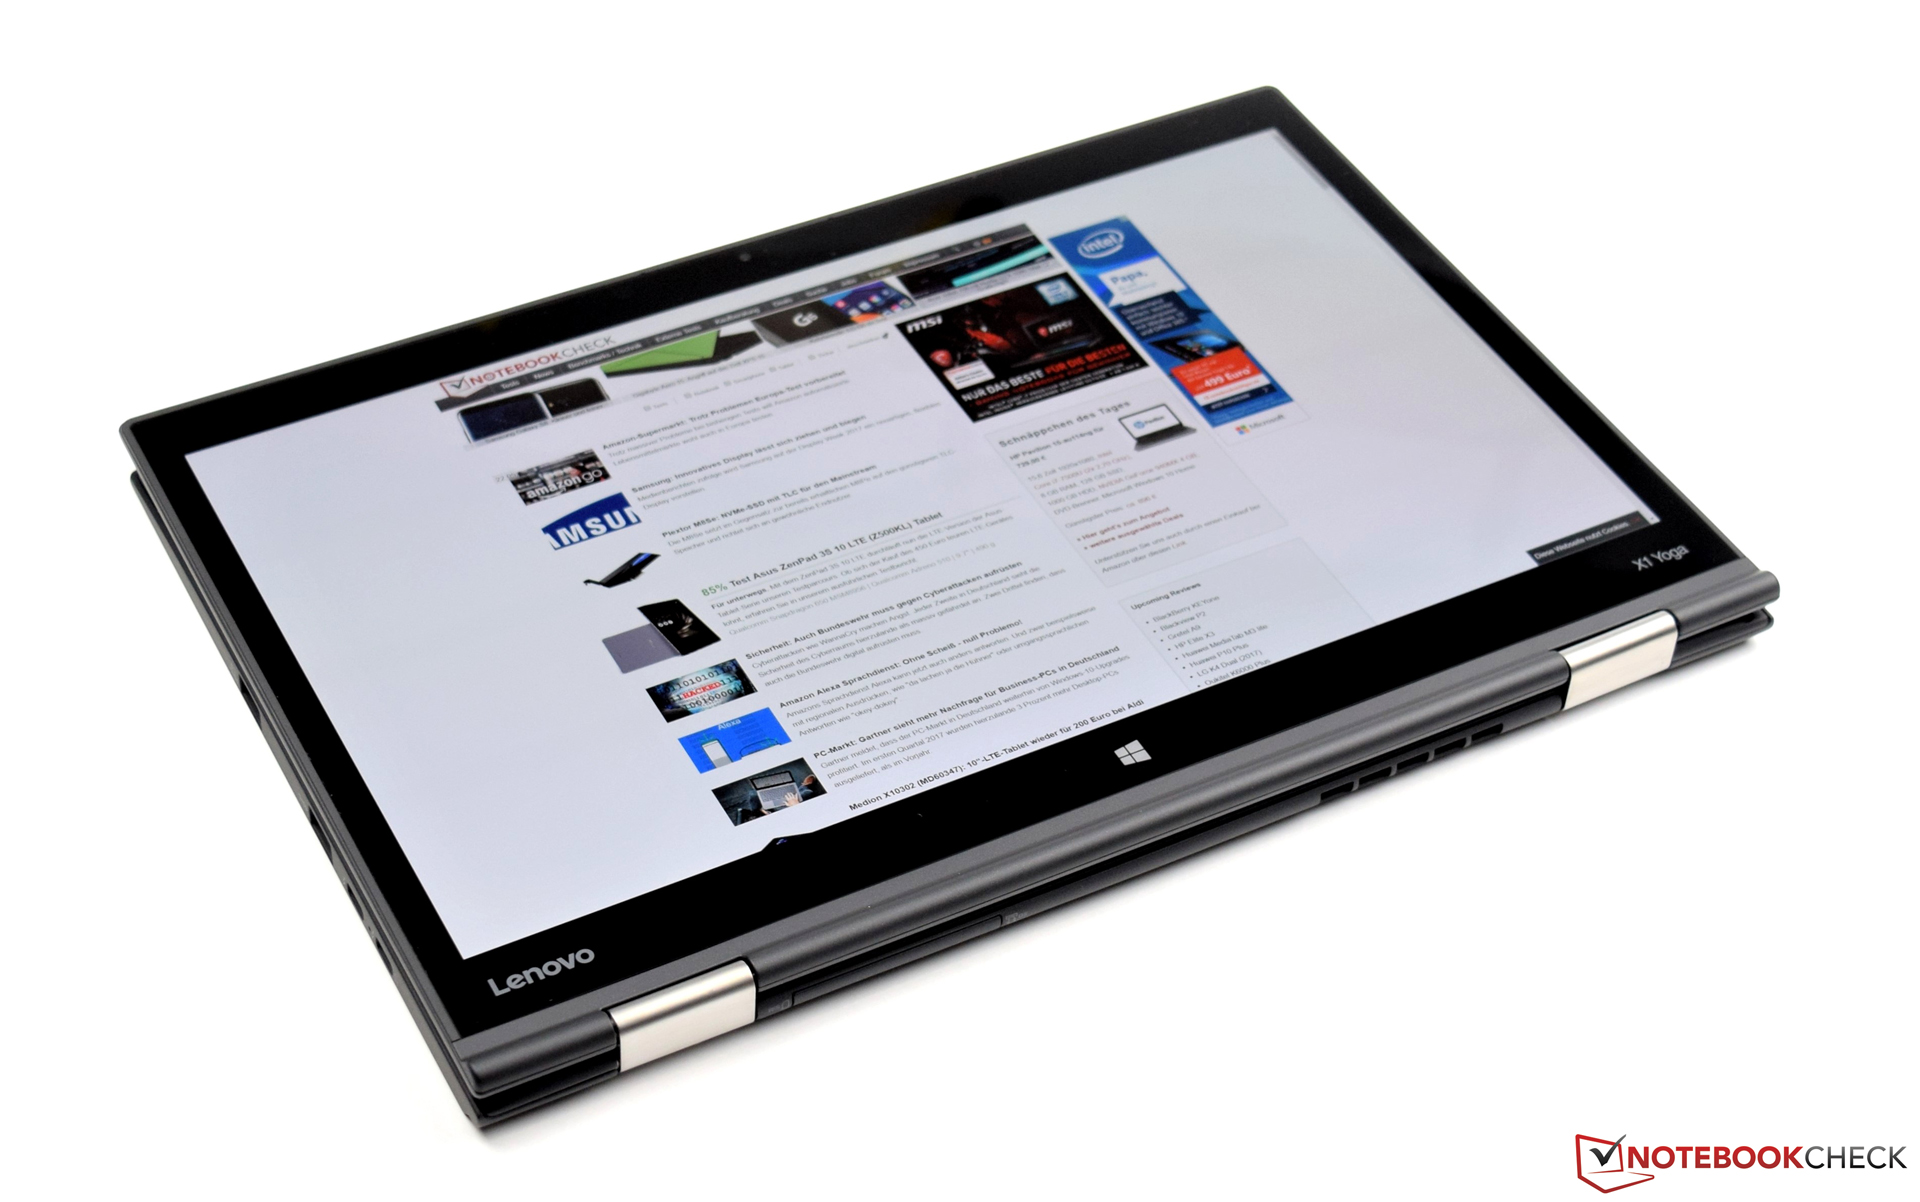
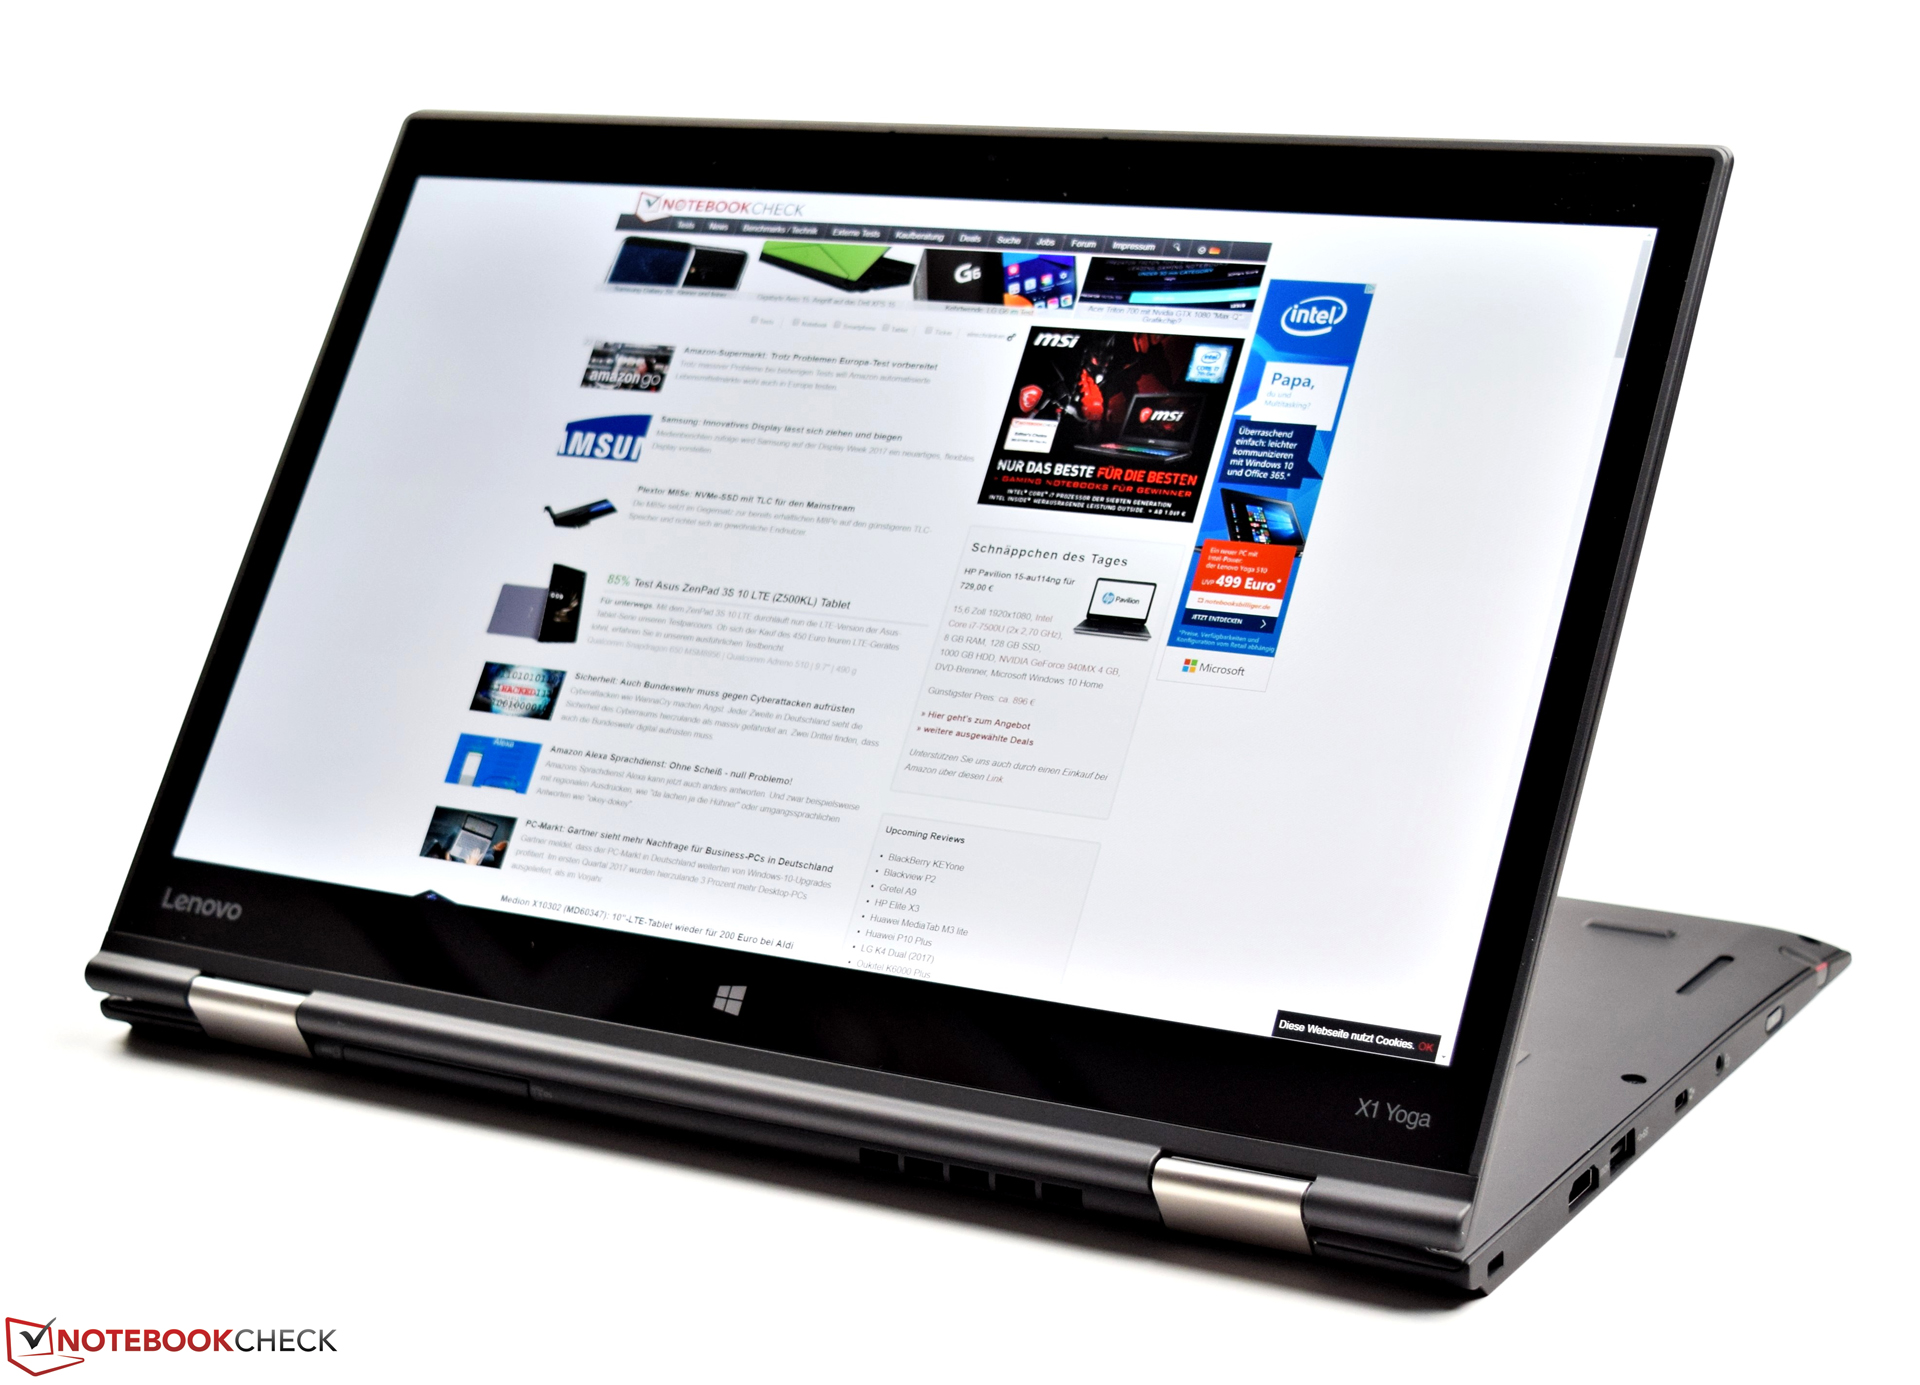
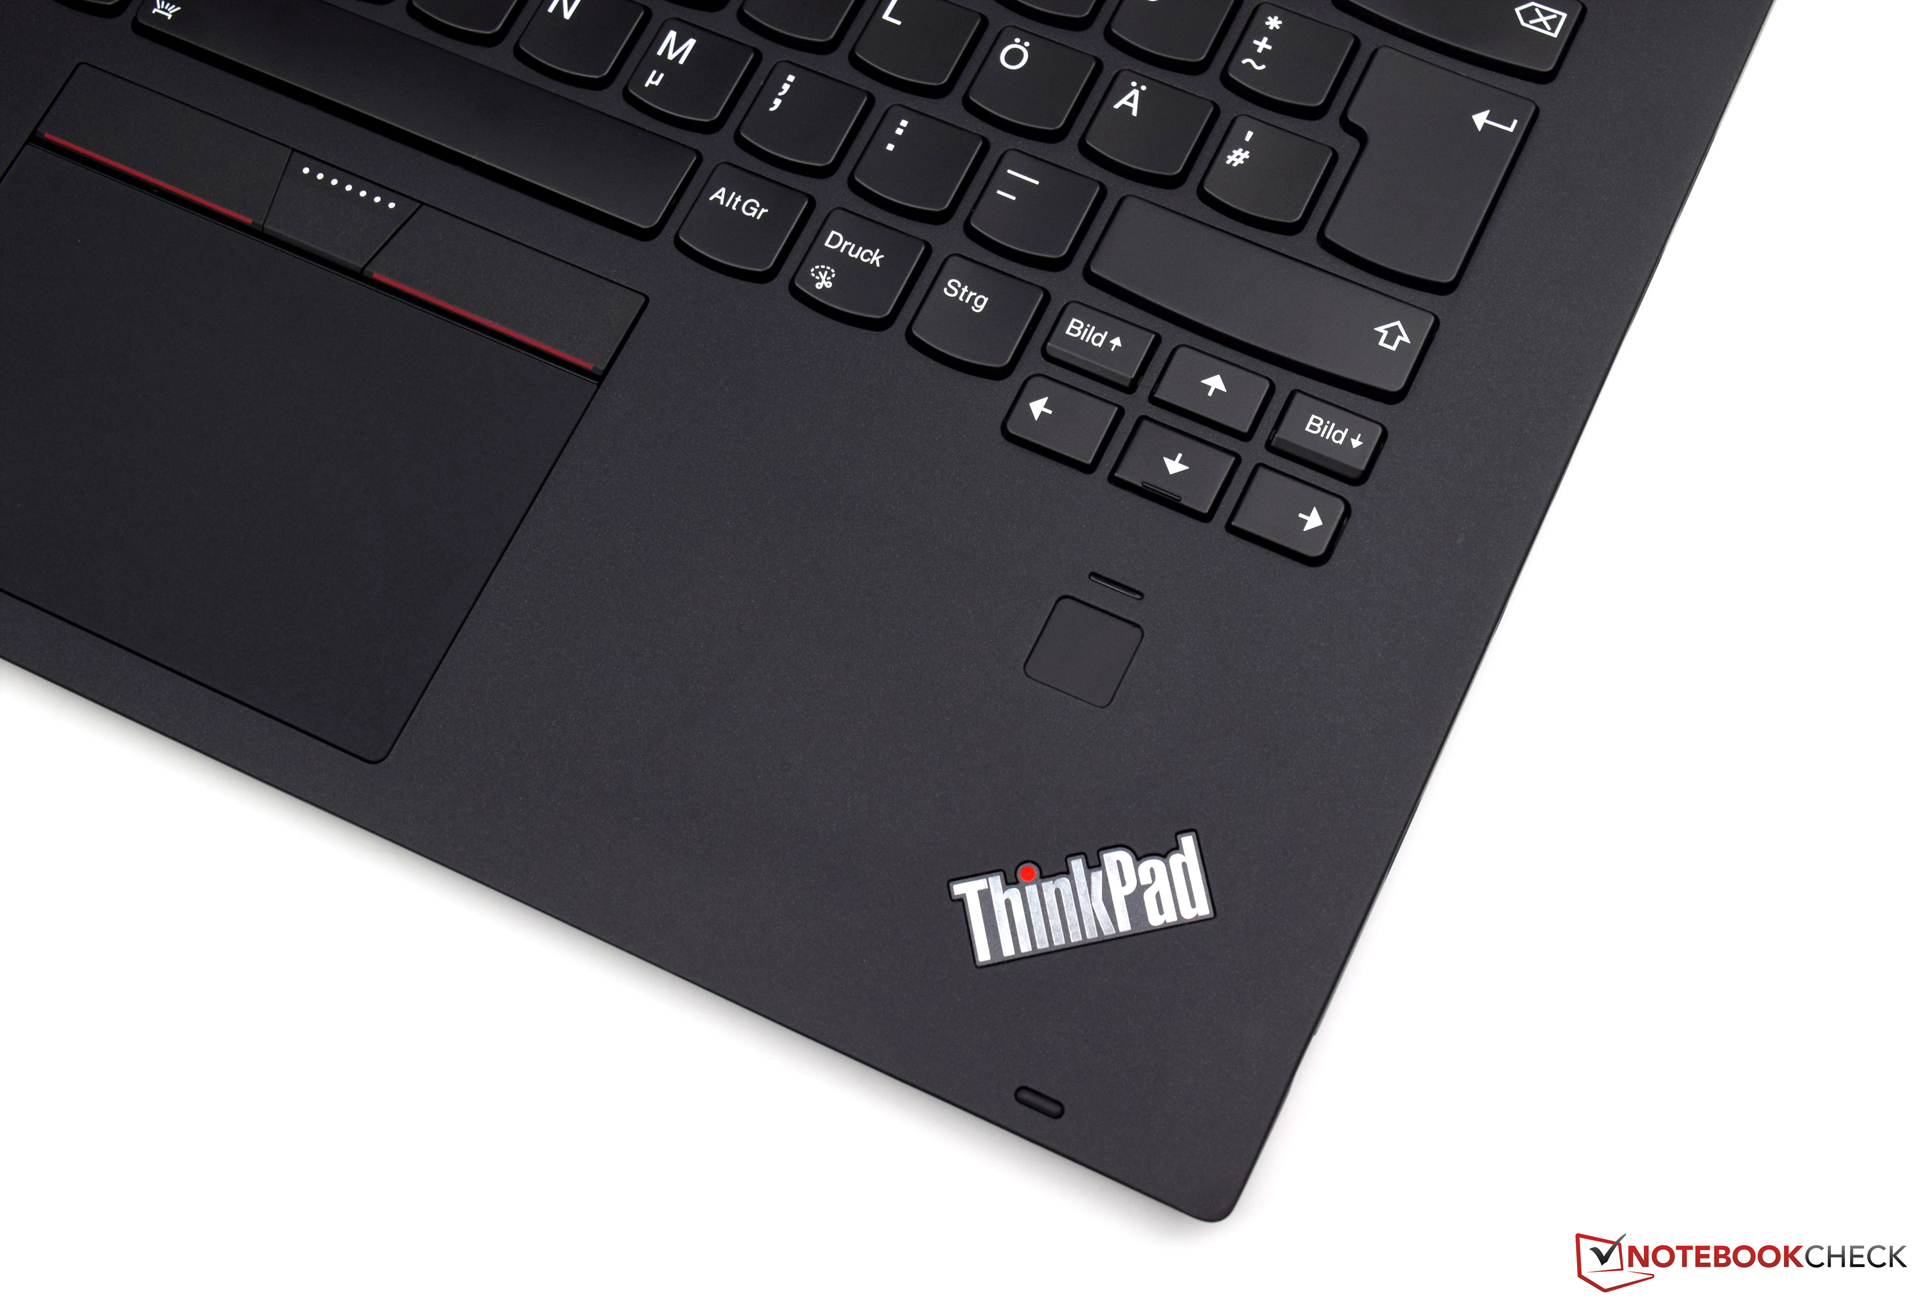
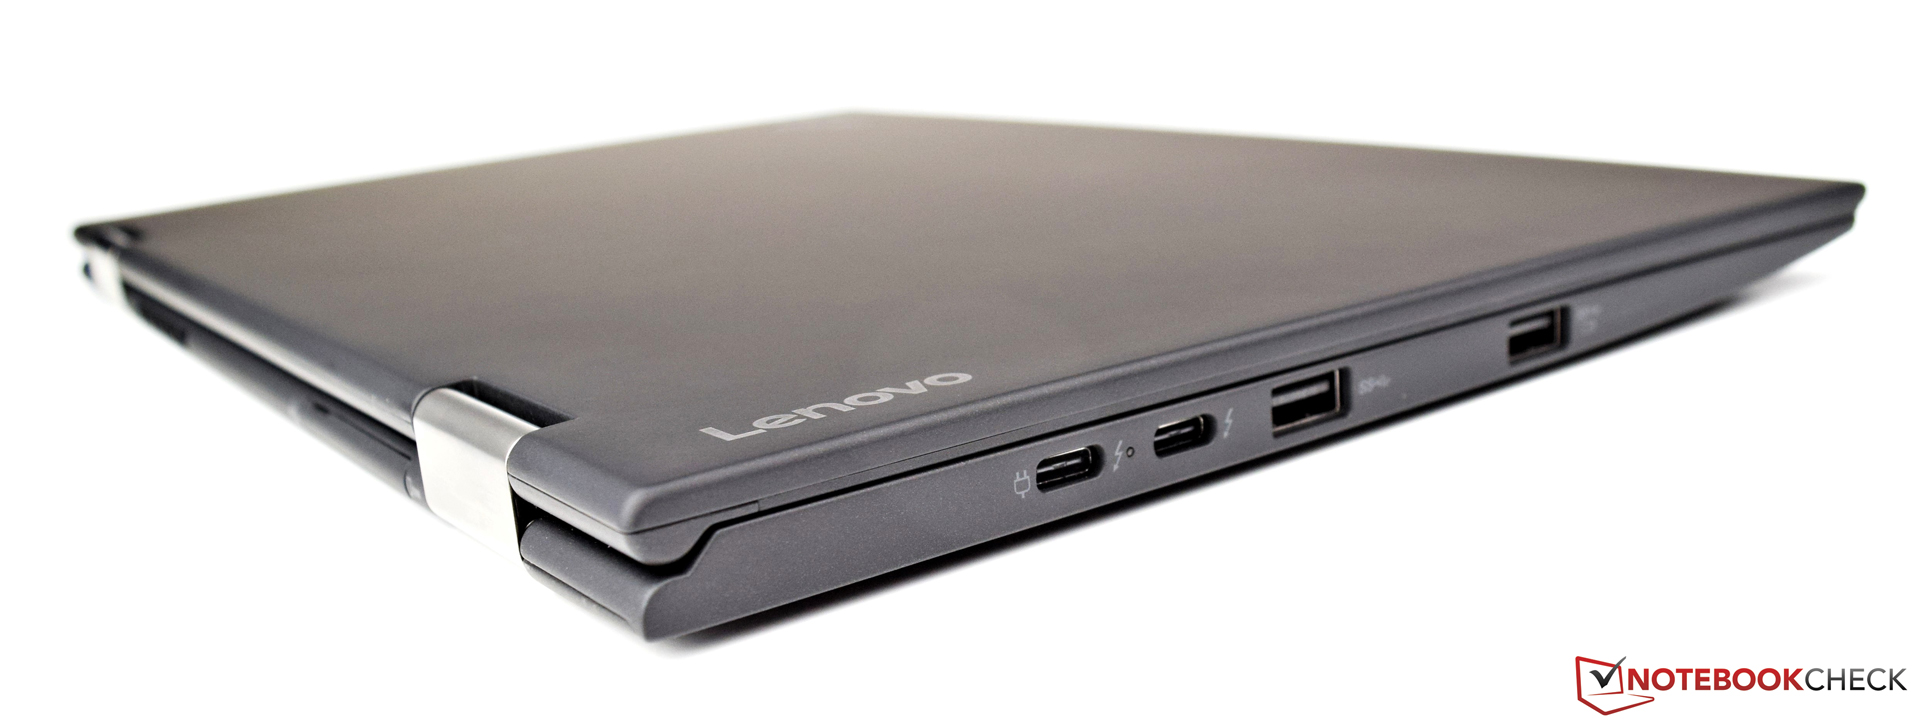
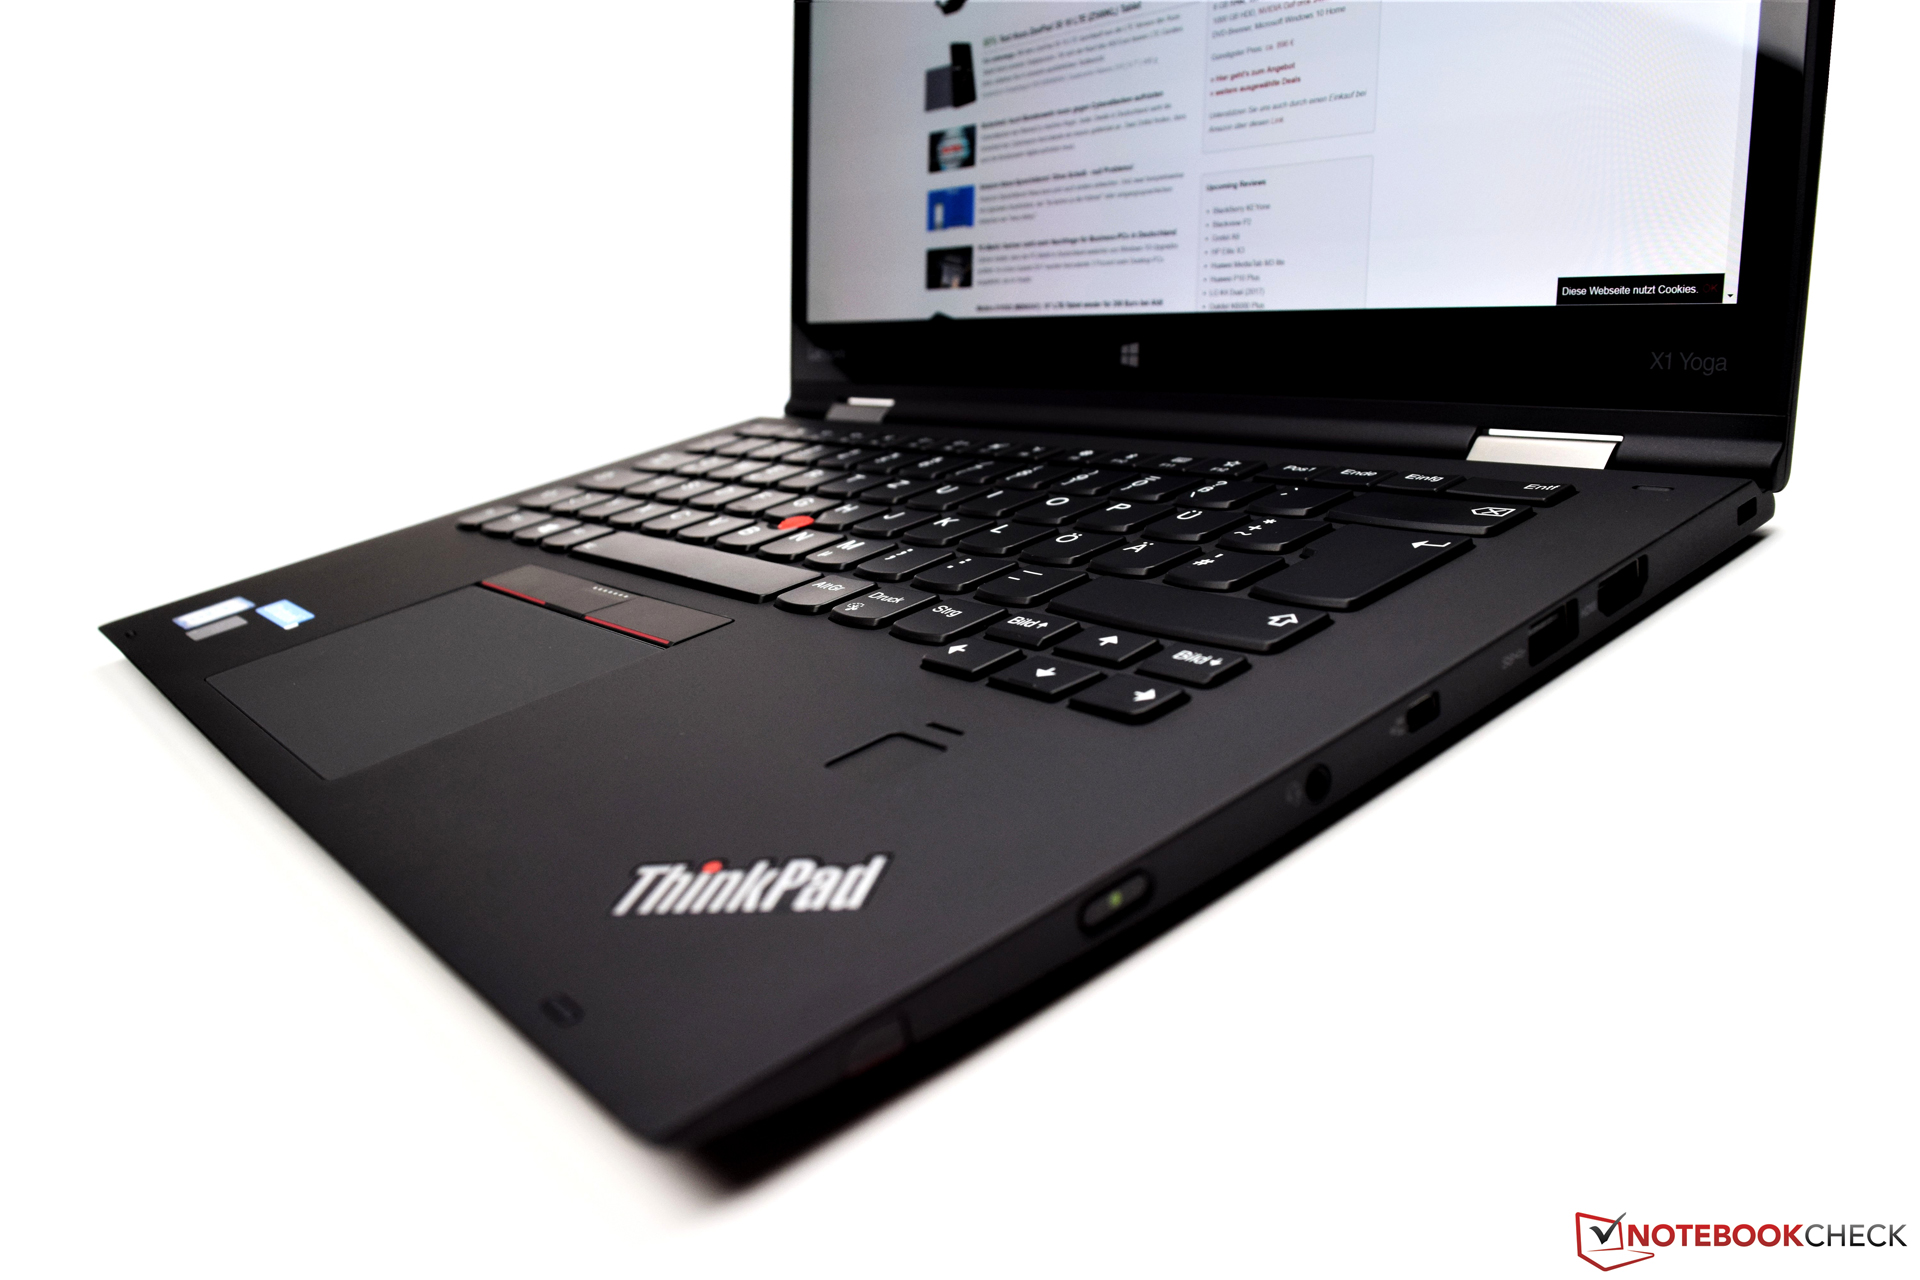
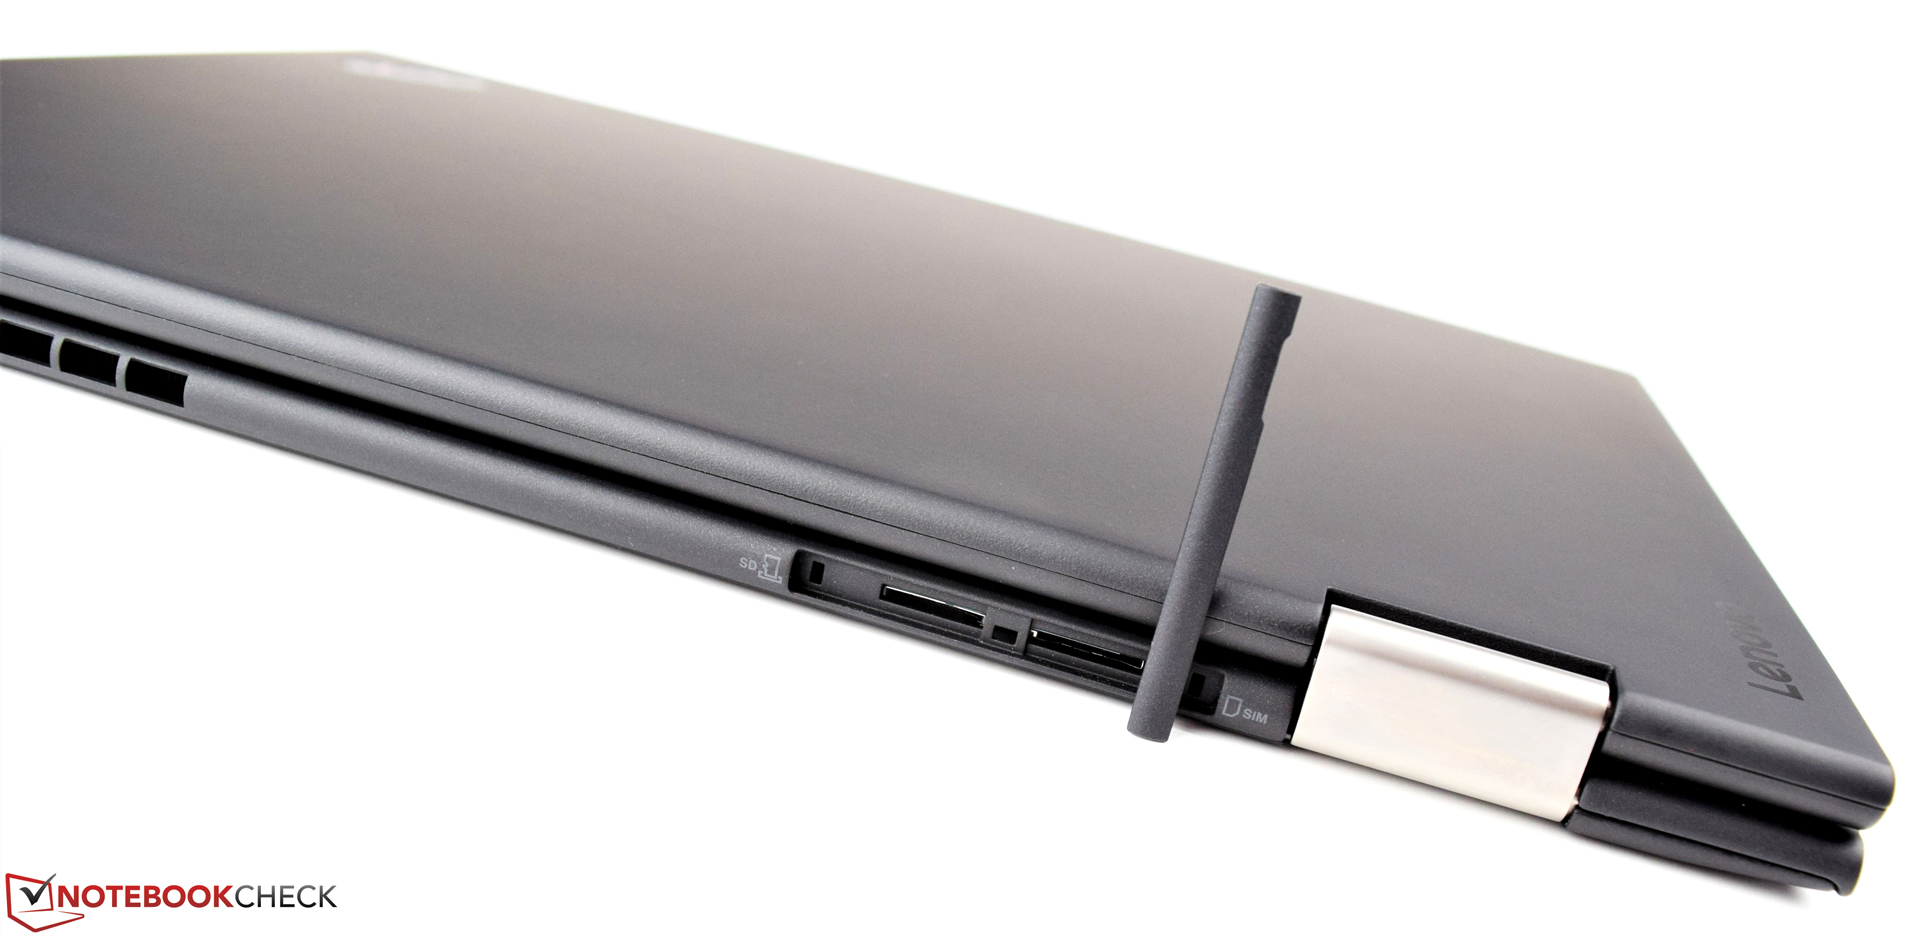
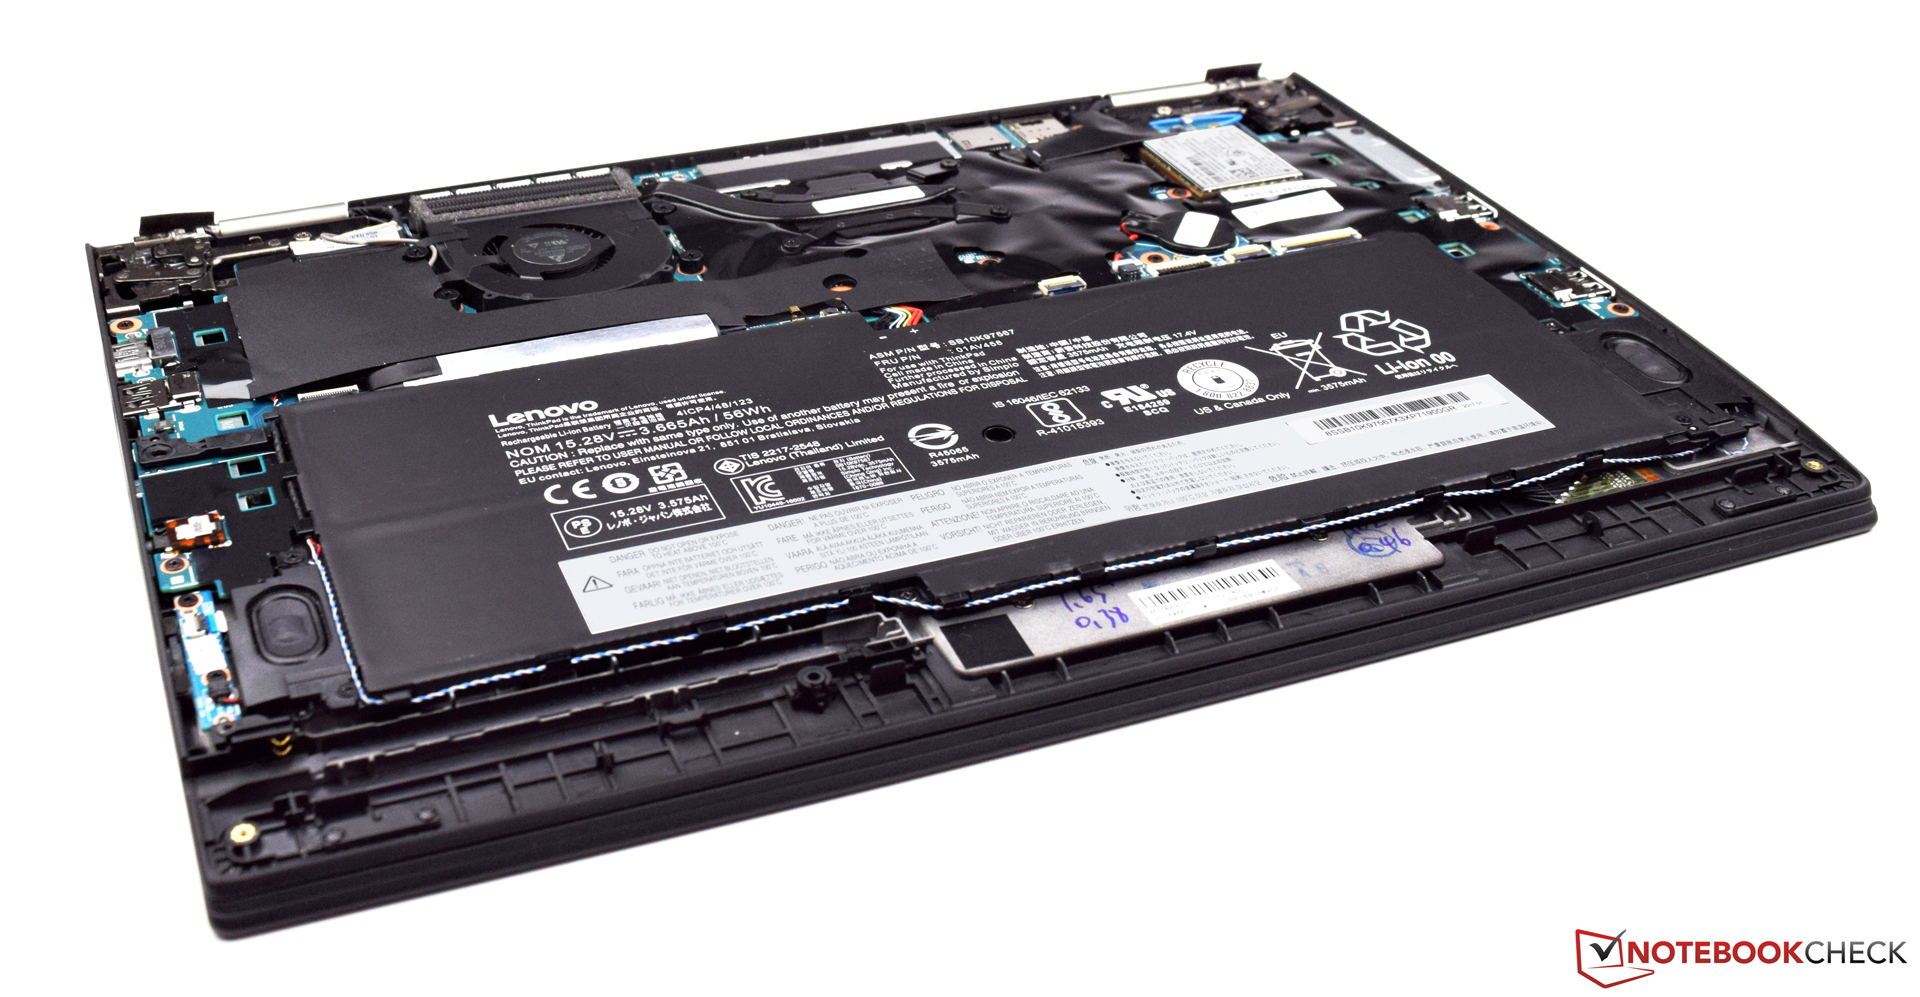
La qualité de construction est excellente, et le châssis n’a pas de défaut majeur. Les périphériques d’entrée sont également bons – nous aurions été surpris que Lenovo nous lâche dans ce domaine. L’écran OLED est également impressionnant, avec des couleurs vives, même si sa luminosité moyenne n’est pas aussi élevée qu’on aurait pu l’espérer. De ce fait, le convertible n’est pas particulièrement adapté à un usage à l’extérieur. Nous aurions également apprécié que Lenovo laisse un peu plus de marge à l’utilisateur pour faire des mises à jour de certains composants.
L’intégralité de cette critique est disponible en anglais en suivant ce lien.
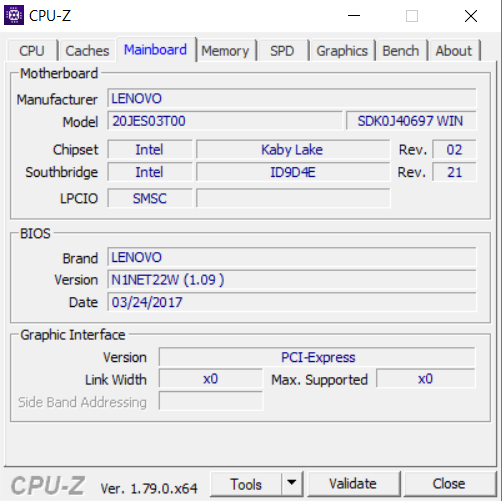
Lenovo ThinkPad X1 Yoga 2017 20JES03T00
- 06/18/2017 v6 (old)
Sebastian Bade
Price comparison
