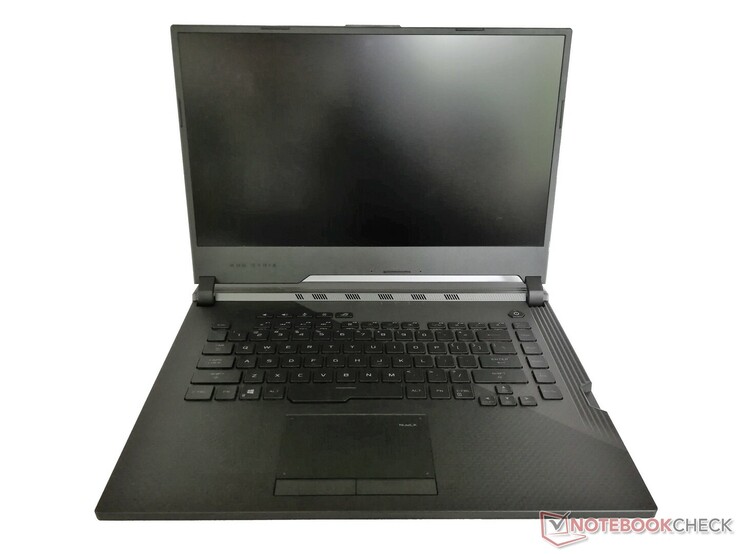
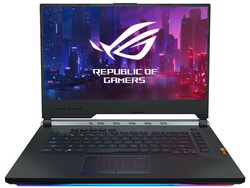
Test de l'Asus Strix Scar III G531GW (i7-9750H, RTX 2070, FHD 240 Hz) : écran 240 Hz rapide
Top 10
» Le Top 10 des PC portables multimédia
» Le Top 10 des PC portables de jeu
» Le Top 10 des PC portables de jeu légers
» Le Top 10 des ordinateurs portables bureautiques
» Le Top 10 des PC portables bureautiques premium/professionnels
» Le Top 10 des Stations de travail mobiles
» Le Top 10 des Ultraportables
» Le Top 10 des Ultrabooks
» Le Top 10 des Convertibles
» Le Top 10 des Tablettes
» Le Top 10 des Tablettes Windows
» Le Top 10 des Smartphones
» Le Top 10 des PC Portables á moins de 300 euros
» Le Top 10 des PC Portables á moins de 500 euros
» Le Top 25 des meilleurs écrans d'ordinateurs
Connectivité
| |||||||||||||||||||||||||
Homogénéité de la luminosité: 88 %
Valeur mesurée au centre, sur batterie: 309 cd/m²
Contraste: 736:1 (Valeurs des noirs: 0.42 cd/m²)
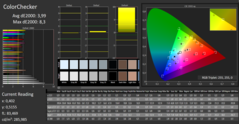
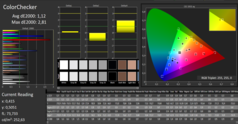
ΔE ColorChecker Calman: 3.99 | ∀{0.5-29.43 Ø4.76}
calibrated: 1.12
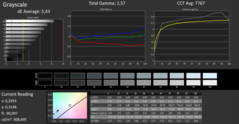
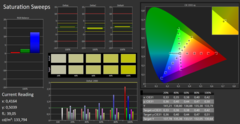
ΔE Greyscale Calman: 5.43 | ∀{0.09-98 Ø5}
97% sRGB (Argyll 1.6.3 3D)
63% AdobeRGB 1998 (Argyll 1.6.3 3D)
67.6% AdobeRGB 1998 (Argyll 3D)
97.1% sRGB (Argyll 3D)
66.2% Display P3 (Argyll 3D)
Gamma: 2.57
CCT: 7767 K
| Asus Strix Scar III G531GW-AZ062T Sharp LQ156M1JW09 (SHP14D3), IPS, 1920x1080, 15.6" | Asus Strix Scar III G531GW Sharp LQ156M1JW09 (SHP14D3), IPS, 1920x1080, 15.6" | Lenovo Legion Y740-15ICHg BOE NV156FHM-N4J, IPS, 1920x1080, 15.6" | Acer Predator Triton 500 PT515-51-71PZ NV156FHM-N4K (BOE082A), IPS, 1920x1080, 15.6" | Origin PC EVO16-S i7-9750H RTX 2080 Max-Q Chi Mei CMN N161HCA-GA1, IPS, 1920x1080, 16.1" | |
|---|---|---|---|---|---|
| Display | -0% | -2% | -3% | -5% | |
| Display P3 Coverage (%) | 66.2 | 66.2 0% | 67.7 2% | 64.6 -2% | 62.3 -6% |
| sRGB Coverage (%) | 97.1 | 96.5 -1% | 91.6 -6% | 92.6 -5% | 93.3 -4% |
| AdobeRGB 1998 Coverage (%) | 67.6 | 67.5 0% | 67.1 -1% | 66 -2% | 64 -5% |
| Response Times | -20% | -19% | 21% | -2% | |
| Response Time Grey 50% / Grey 80% * (ms) | 15 ? | 17.2 ? -15% | 19 ? -27% | 5.2 ? 65% | 14.4 ? 4% |
| Response Time Black / White * (ms) | 9 ? | 11.2 ? -24% | 10 ? -11% | 11.2 ? -24% | 9.6 ? -7% |
| PWM Frequency (Hz) | 250 ? | 24040 ? | 25510 ? | ||
| Screen | 20% | 31% | 13% | -1% | |
| Brightness middle (cd/m²) | 309 | 266 -14% | 477 54% | 288 -7% | 278 -10% |
| Brightness (cd/m²) | 284 | 252 -11% | 431 52% | 265 -7% | 259 -9% |
| Brightness Distribution (%) | 88 | 88 0% | 84 -5% | 84 -5% | 89 1% |
| Black Level * (cd/m²) | 0.42 | 0.27 36% | 0.175 58% | 0.22 48% | 0.41 2% |
| Contrast (:1) | 736 | 985 34% | 2726 270% | 1309 78% | 678 -8% |
| Colorchecker dE 2000 * | 3.99 | 1.81 55% | 4.17 -5% | 3.22 19% | 2.93 27% |
| Colorchecker dE 2000 max. * | 8.3 | 3.23 61% | 6.97 16% | 6.26 25% | 7.12 14% |
| Colorchecker dE 2000 calibrated * | 1.12 | 1.03 8% | 2.51 -124% | 1.5 -34% | 1.49 -33% |
| Greyscale dE 2000 * | 5.43 | 2.44 55% | 3.49 36% | 3.43 37% | 4.5 17% |
| Gamma | 2.57 86% | 2.42 91% | 2.5 88% | 2.41 91% | 2.17 101% |
| CCT | 7767 84% | 7005 93% | 7076 92% | 7290 89% | 5767 113% |
| Color Space (Percent of AdobeRGB 1998) (%) | 63 | 62 -2% | 60 -5% | 60 -5% | 59.2 -6% |
| Color Space (Percent of sRGB) (%) | 97 | 97 0% | 91 -6% | 93 -4% | 93.2 -4% |
| Moyenne finale (programmes/paramètres) | 0% /
11% | 3% /
19% | 10% /
11% | -3% /
-2% |
* ... Moindre est la valeur, meilleures sont les performances
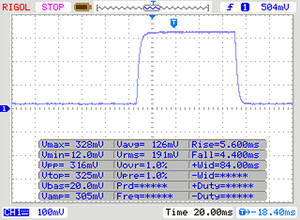
Temps de réponse de l'écran
| ↔ Temps de réponse noir à blanc | ||
|---|---|---|
| 9 ms ... hausse ↗ et chute ↘ combinées | ↗ 5 ms hausse | |
| ↘ 4 ms chute | ||
| L'écran montre de faibles temps de réponse, un bon écran pour jouer. En comparaison, tous les appareils testés affichent entre 0.1 (minimum) et 240 (maximum) ms. » 24 % des appareils testés affichent de meilleures performances. Cela signifie que les latences relevées sont meilleures que la moyenne (20.1 ms) de tous les appareils testés. | ||
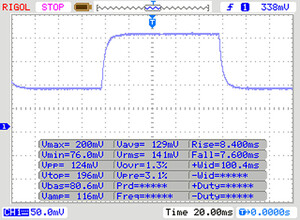
| ↔ Temps de réponse gris 50% à gris 80% | ||
| 15 ms ... hausse ↗ et chute ↘ combinées | ↗ 8 ms hausse | |
| ↘ 7 ms chute | ||
| L'écran montre de bons temps de réponse, mais insuffisant pour du jeu compétitif. En comparaison, tous les appareils testés affichent entre 0.165 (minimum) et 636 (maximum) ms. » 28 % des appareils testés affichent de meilleures performances. Cela signifie que les latences relevées sont meilleures que la moyenne (31.5 ms) de tous les appareils testés. | ||
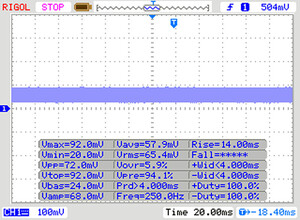
Scintillement / MLI (Modulation de largeur d'impulsion)
| Scintillement / MLI (Modulation de largeur d'impulsion) décelé | 250 Hz | ≤ 20 Niveau de luminosité | |
Le rétroéclairage de l'écran scintille à la fréquence de 250 Hz (certainement du fait de l'utilisation d'une MDI - Modulation de largeur d'impulsion) à un niveau de luminosité inférieur ou égal à 20 % . Aucun scintillement ne devrait être perceptible au-dessus de cette valeur. La fréquence de rafraîchissement de 250 Hz est relativement faible, les personnes les plus sensibles devraient percevoir un scintillement et être sujettes à une fatigue oculaire accrue (avec le niveau de luminosité indiqué) En comparaison, 53 % des appareils testés n'emploient pas MDI pour assombrir leur écran. Nous avons relevé une moyenne à 8075 (minimum : 5 - maximum : 343500) Hz dans le cas où une MDI était active. | |||
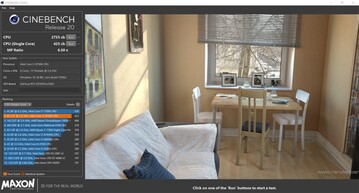
| Blender - v2.79 BMW27 CPU | |
| Moyenne Intel Core i7-9750H (342 - 495, n=21) | |
| Asus Strix Scar III G531GW-AZ062T | |
| Lenovo Legion Y740-15ICHg | |
| Geekbench 4.4 | |
| 64 Bit Single-Core Score | |
| Asus Strix Scar III G531GW-AZ062T | |
| Lenovo Legion Y740-15ICHg | |
| Moyenne Intel Core i7-9750H (4440 - 5511, n=27) | |
| 64 Bit Multi-Core Score | |
| Asus Strix Scar III G531GW-AZ062T | |
| Lenovo Legion Y740-15ICHg | |
| Moyenne Intel Core i7-9750H (17054 - 25043, n=27) | |
* ... Moindre est la valeur, meilleures sont les performances
| PCMark 8 Home Score Accelerated v2 | 4860 points | |
| PCMark 8 Creative Score Accelerated v2 | 7937 points | |
| PCMark 8 Work Score Accelerated v2 | 5697 points | |
| PCMark 10 Score | 5625 points | |
Aide | ||
| Asus Strix Scar III G531GW-AZ062T Intel SSD 660p SSDPEKNW512G8 | Asus Strix Scar III G531GW Intel SSD 660p 1TB SSDPEKNW010T8 | Lenovo Legion Y740-15ICHg WDC PC SN520 SDAPMUW-128G | Acer Predator Triton 500 PT515-51-71PZ WDC PC SN720 SDAPNTW-512G | Origin PC EVO16-S i7-9750H RTX 2080 Max-Q Samsung SSD 970 EVO Plus 500GB | Moyenne Intel SSD 660p SSDPEKNW512G8 | Moyenne de la classe Gaming | |
|---|---|---|---|---|---|---|---|
| AS SSD | 38% | -8% | 179% | 170% | 16% | 265% | |
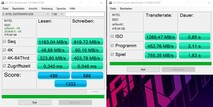
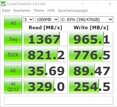
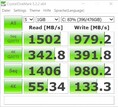
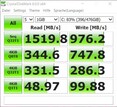
| Seq Read (MB/s) | 1163 | 1574 35% | 1372 18% | 2888 148% | 2172 87% | 1423 ? 22% | 5343 ? 359% |
| Seq Write (MB/s) | 919 | 1591 73% | 746 -19% | 2374 158% | 2760 200% | 828 ? -10% | 3911 ? 326% |
| 4K Read (MB/s) | 48.88 | 26.79 -45% | 35.42 -28% | 42.95 -12% | 54.6 12% | 51.3 ? 5% | 69.6 ? 42% |
| 4K Write (MB/s) | 90.1 | 105.1 17% | 99.9 11% | 143.6 59% | 145.8 62% | 128.9 ? 43% | 216 ? 140% |
| 4K-64 Read (MB/s) | 323.8 | 583 80% | 302.1 -7% | 1272 293% | 1234 281% | 326 ? 1% | 1721 ? 432% |
| 4K-64 Write (MB/s) | 403.8 | 603 49% | 191.4 -53% | 1546 283% | 2431 502% | 721 ? 79% | 2859 ? 608% |
| Access Time Read * (ms) | 0.24 | 0.128 47% | 0.132 45% | 0.038 84% | 0.09003 ? 62% | 0.06027 ? 75% | |
| Access Time Write * (ms) | 0.046 | 0.043 7% | 0.037 20% | 0.026 43% | 0.07378 ? -60% | 0.03723 ? 19% | |
| Score Read (Points) | 489 | 768 57% | 475 -3% | 1604 228% | 1506 208% | 519 ? 6% | 2324 ? 375% |
| Score Write (Points) | 586 | 867 48% | 366 -38% | 1927 229% | 2853 387% | 932 ? 59% | 3465 ? 491% |
| Score Total (Points) | 1332 | 2033 53% | 1065 -20% | 4329 225% | 5169 288% | 1708 ? 28% | 6914 ? 419% |
| Copy ISO MB/s (MB/s) | 1269 | 1062 -16% | 2728 115% | 1109 ? -13% | 2997 ? 136% | ||
| Copy Program MB/s (MB/s) | 452.8 | 426 -6% | 570 26% | 468 ? 3% | 964 ? 113% | ||
| Copy Game MB/s (MB/s) | 755 | 650 -14% | 1434 90% | 760 ? 1% | 2071 ? 174% |
* ... Moindre est la valeur, meilleures sont les performances
| 3DMark 11 Performance | 20072 points | |
| 3DMark Ice Storm Standard Score | 122334 points | |
| 3DMark Cloud Gate Standard Score | 39054 points | |
| 3DMark Fire Strike Score | 17384 points | |
| 3DMark Fire Strike Extreme Score | 8991 points | |
| 3DMark Time Spy Score | 7568 points | |
Aide | ||
| The Witcher 3 - 1920x1080 Ultra Graphics & Postprocessing (HBAO+) | |
| Moyenne de la classe Gaming (80.2 - 240, n=36, 2 dernières années) | |
| Origin PC EVO16-S i7-9750H RTX 2080 Max-Q | |
| Moyenne NVIDIA GeForce RTX 2070 Mobile (64 - 82.1, n=21) | |
| Asus Strix Scar III G531GW-AZ062T | |
| Asus Strix Scar III G531GW | |
| Acer Predator Triton 500 PT515-51-71PZ | |
| Lenovo Legion Y740-15ICHg | |
| Bas | Moyen | Élevé | Ultra | |
|---|---|---|---|---|
| The Witcher 3 (2015) | 258 | 208 | 130 | 72 |
| Dota 2 Reborn (2015) | 137.3 | 127.2 | 104.1 | 98.4 |
| X-Plane 11.11 (2018) | 103 | 85 | 76 | |
| Shadow of the Tomb Raider (2018) | 111 | 92 | 90 | 80 |
| Metro Exodus (2019) | 98 | 87 | 66 | 53.3 |
| Control (2019) | 180 | 93 | 68 |
Degré de la nuisance sonore
| Au repos |
| 30.6 / 30.6 / 37.7 dB(A) |
| Fortement sollicité |
| 36.5 / 48.1 dB(A) |
 | ||
30 dB silencieux 40 dB(A) audible 50 dB(A) bruyant |
||
min: | ||
| Asus Strix Scar III G531GW-AZ062T GeForce RTX 2070 Mobile, i7-9750H, Intel SSD 660p SSDPEKNW512G8 | Asus Strix Scar III G531GW GeForce RTX 2070 Mobile, i9-9880H, Intel SSD 660p 1TB SSDPEKNW010T8 | Lenovo Legion Y740-15ICHg GeForce RTX 2070 Max-Q, i7-9750H, WDC PC SN520 SDAPMUW-128G | Acer Predator Triton 500 PT515-51-71PZ GeForce RTX 2070 Max-Q, i7-9750H, WDC PC SN720 SDAPNTW-512G | Origin PC EVO16-S i7-9750H RTX 2080 Max-Q GeForce RTX 2080 Max-Q, i7-9750H, Samsung SSD 970 EVO Plus 500GB | |
|---|---|---|---|---|---|
| Noise | -12% | 3% | -5% | -5% | |
| arrêt / environnement * (dB) | 30 | 29 3% | 30 -0% | 30 -0% | 28.5 5% |
| Idle Minimum * (dB) | 30.6 | 30 2% | 31.3 -2% | 30 2% | 30.4 1% |
| Idle Average * (dB) | 30.6 | 37 -21% | 31.3 -2% | 33 -8% | 30.4 1% |
| Idle Maximum * (dB) | 37.7 | 39 -3% | 31.3 17% | 39 -3% | 31.5 16% |
| Load Average * (dB) | 36.5 | 54 -48% | 42 -15% | 45 -23% | 50 -37% |
| Witcher 3 ultra * (dB) | 52.1 | 54 -4% | 42.1 19% | 49 6% | 55.3 -6% |
| Load Maximum * (dB) | 48.1 | 54 -12% | 46.5 3% | 51 -6% | 55.5 -15% |
* ... Moindre est la valeur, meilleures sont les performances
(-) La température maximale du côté supérieur est de 45.6 °C / 114 F, par rapport à la moyenne de 40.4 °C / 105 F, allant de 21.2 à 68.8 °C pour la classe Gaming.
(-) Le fond chauffe jusqu'à un maximum de 55.5 °C / 132 F, contre une moyenne de 43.3 °C / 110 F
(+) En utilisation inactive, la température moyenne du côté supérieur est de 29.8 °C / 86 F, par rapport à la moyenne du dispositif de 33.9 °C / 93 F.
(±) En jouant à The Witcher 3, la température moyenne du côté supérieur est de 32.8 °C / 91 F, alors que la moyenne de l'appareil est de 33.9 °C / 93 F.
(+) Les repose-poignets et le pavé tactile sont plus froids que la température de la peau avec un maximum de 29 °C / 84.2 F et sont donc froids au toucher.
(±) La température moyenne de la zone de l'appui-paume de dispositifs similaires était de 28.8 °C / 83.8 F (-0.2 °C / #-0.4 F).
Asus Strix Scar III G531GW-AZ062T analyse audio
(-) | haut-parleurs pas très forts (68.3 dB)
Basses 100 - 315 Hz
(±) | basse réduite - en moyenne 9.9% inférieure à la médiane
(±) | la linéarité des basses est moyenne (13.2% delta à la fréquence précédente)
Médiums 400 - 2000 Hz
(+) | médiane équilibrée - seulement 2.6% de la médiane
(+) | les médiums sont linéaires (3.5% delta à la fréquence précédente)
Aiguës 2 - 16 kHz
(+) | des sommets équilibrés - à seulement 2.2% de la médiane
(+) | les aigus sont linéaires (4.6% delta à la fréquence précédente)
Globalement 100 - 16 000 Hz
(+) | le son global est linéaire (13.6% différence à la médiane)
Par rapport à la même classe
» 20% de tous les appareils testés de cette catégorie étaient meilleurs, 7% similaires, 73% pires
» Le meilleur avait un delta de 6%, la moyenne était de 18%, le pire était de 132%.
Par rapport à tous les appareils testés
» 14% de tous les appareils testés étaient meilleurs, 4% similaires, 82% pires
» Le meilleur avait un delta de 4%, la moyenne était de 24%, le pire était de 134%.
Acer Predator Triton 500 PT515-51-71PZ analyse audio
(±) | le niveau sonore du haut-parleur est moyen mais bon (80# dB)
Basses 100 - 315 Hz
(±) | basse réduite - en moyenne 12.2% inférieure à la médiane
(±) | la linéarité des basses est moyenne (12.6% delta à la fréquence précédente)
Médiums 400 - 2000 Hz
(+) | médiane équilibrée - seulement 4.5% de la médiane
(+) | les médiums sont linéaires (4.7% delta à la fréquence précédente)
Aiguës 2 - 16 kHz
(+) | des sommets équilibrés - à seulement 2.2% de la médiane
(+) | les aigus sont linéaires (3.2% delta à la fréquence précédente)
Globalement 100 - 16 000 Hz
(+) | le son global est linéaire (14.8% différence à la médiane)
Par rapport à la même classe
» 29% de tous les appareils testés de cette catégorie étaient meilleurs, 7% similaires, 64% pires
» Le meilleur avait un delta de 6%, la moyenne était de 18%, le pire était de 132%.
Par rapport à tous les appareils testés
» 19% de tous les appareils testés étaient meilleurs, 4% similaires, 77% pires
» Le meilleur avait un delta de 4%, la moyenne était de 24%, le pire était de 134%.
| Éteint/en veille | |
| Au repos | |
| Fortement sollicité |
|
Légende:
min: | |
| Asus Strix Scar III G531GW-AZ062T i7-9750H, GeForce RTX 2070 Mobile, Intel SSD 660p SSDPEKNW512G8, IPS, 1920x1080, 15.6" | Asus Strix Scar III G531GW i9-9880H, GeForce RTX 2070 Mobile, Intel SSD 660p 1TB SSDPEKNW010T8, IPS, 1920x1080, 15.6" | Lenovo Legion Y740-15ICHg i7-9750H, GeForce RTX 2070 Max-Q, WDC PC SN520 SDAPMUW-128G, IPS, 1920x1080, 15.6" | Acer Predator Triton 500 PT515-51-71PZ i7-9750H, GeForce RTX 2070 Max-Q, WDC PC SN720 SDAPNTW-512G, IPS, 1920x1080, 15.6" | Origin PC EVO16-S i7-9750H RTX 2080 Max-Q i7-9750H, GeForce RTX 2080 Max-Q, Samsung SSD 970 EVO Plus 500GB, IPS, 1920x1080, 16.1" | |
|---|---|---|---|---|---|
| Power Consumption | -69% | -31% | 17% | 12% | |
| Idle Minimum * (Watt) | 11.4 | 29 -154% | 22.2 -95% | 7 39% | 7.5 34% |
| Idle Average * (Watt) | 13.5 | 32 -137% | 24.9 -84% | 12 11% | 11.6 14% |
| Idle Maximum * (Watt) | 21.6 | 37 -71% | 30.6 -42% | 22 -2% | 21 3% |
| Load Average * (Watt) | 106 | 157 -48% | 101 5% | 86 19% | 91.3 14% |
| Witcher 3 ultra * (Watt) | 186 | 173 7% | 143 23% | 144 23% | 165.1 11% |
| Load Maximum * (Watt) | 196 | 217 -11% | 186 5% | 177 10% | 208.9 -7% |
* ... Moindre est la valeur, meilleures sont les performances
Points positifs
Points négatifs
Verdict
L’Asus ROG Strix Scar III est capable d’obtenir de bons résultats dans nos tests. La combinaison d’un Intel Core i7-9750H est d’une Nvidia GeForce RTX 2070 fonctionne bien, et tous les jeux actuels peuvent être joués sans souci. Beaucoup de jeux peuvent même être apprécié en UHD ou en WQHD, mais il faudra pour cela un écran externe, le ROG Strix Scar III n’étant disponible qu’avec un écran FHD - mais pas n’importe lequel, parce qu’à 240 Hz, c’est un écran adapté aux tireurs rapides.
Proposant de bonnes possibilités de maintenance, l’appareil peut être mis à jour facilement en ce qui concerne la RAM, le SSD et le HDD. Avec des fonctionnalités intéressantes comme Stonekey et un pavé numérique intégré dans le touchpad, Asus marque encore des points.
L’Asus ROG Strix Scar III convainc avec un bon niveau de performances, et l’éclairage RVB attire les yeux. Mais en cas de sollicitations, l’appareil ne conviendra qu’à ceux qui ne se soucient pas du bruit.
Dans l’ensemble, l’Asus ROG Strix Scar III avec Intel Core i7 propose un niveau similaire, voire supérieur, à la version Core i9. Actuellement, peu de jeux peuvent tirer profit de 8 cœurs, si bien que le portable 6 cœurs peut être dans certains cas une meilleure alternative. De plus, notre modèle est légèrement moins bruyant en cas de sollicitation – même s’il en remportera aucun prix à cet égard, l’appareil étant quand même très bruyant en cas de sollicitations.
L’intégralité de cette critique est disponible en anglais en suivant ce lien.
Asus Strix Scar III G531GW-AZ062T
- 05/14/2020 v7 (old)
Sebastian Bade


