|
|
Nvidia Titan RTX
Titan RTX, R7 2700X, ADATA Premier Pro SP900NS38 512 GB | |
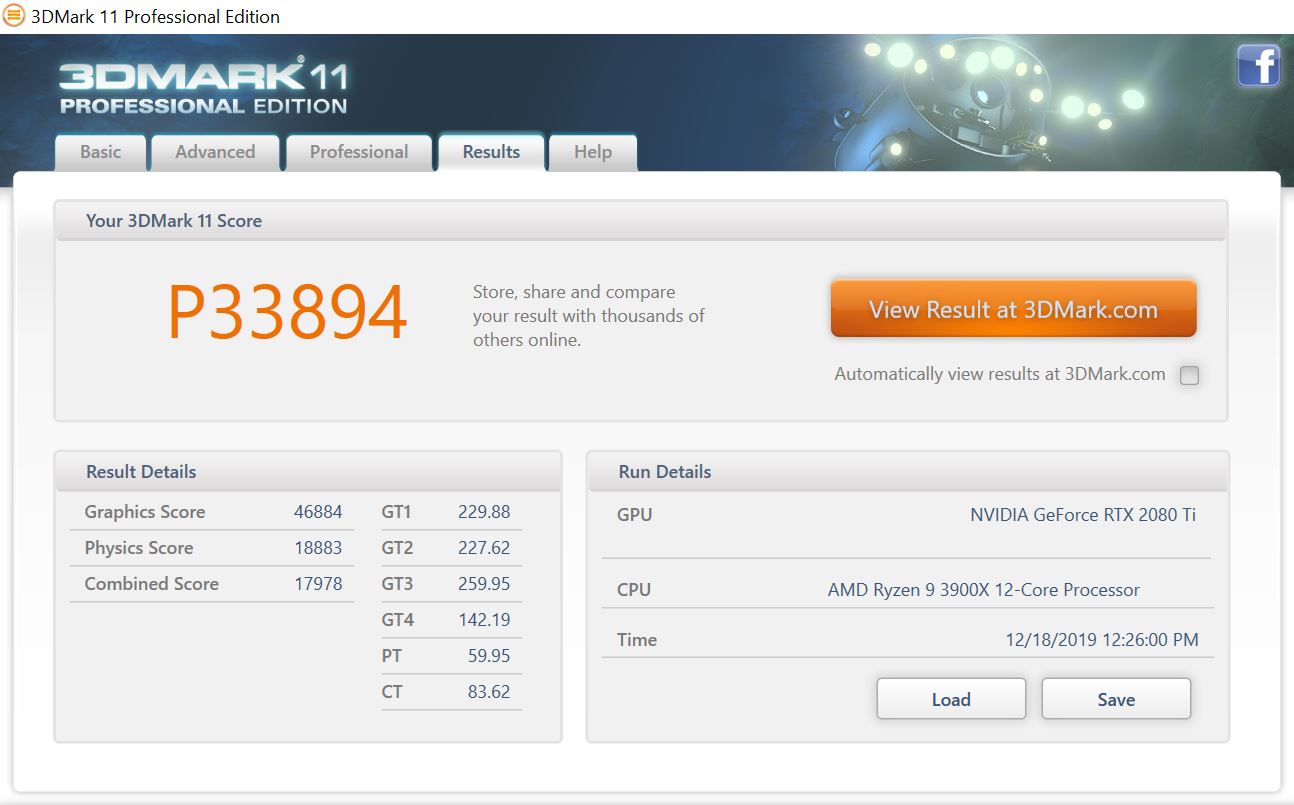
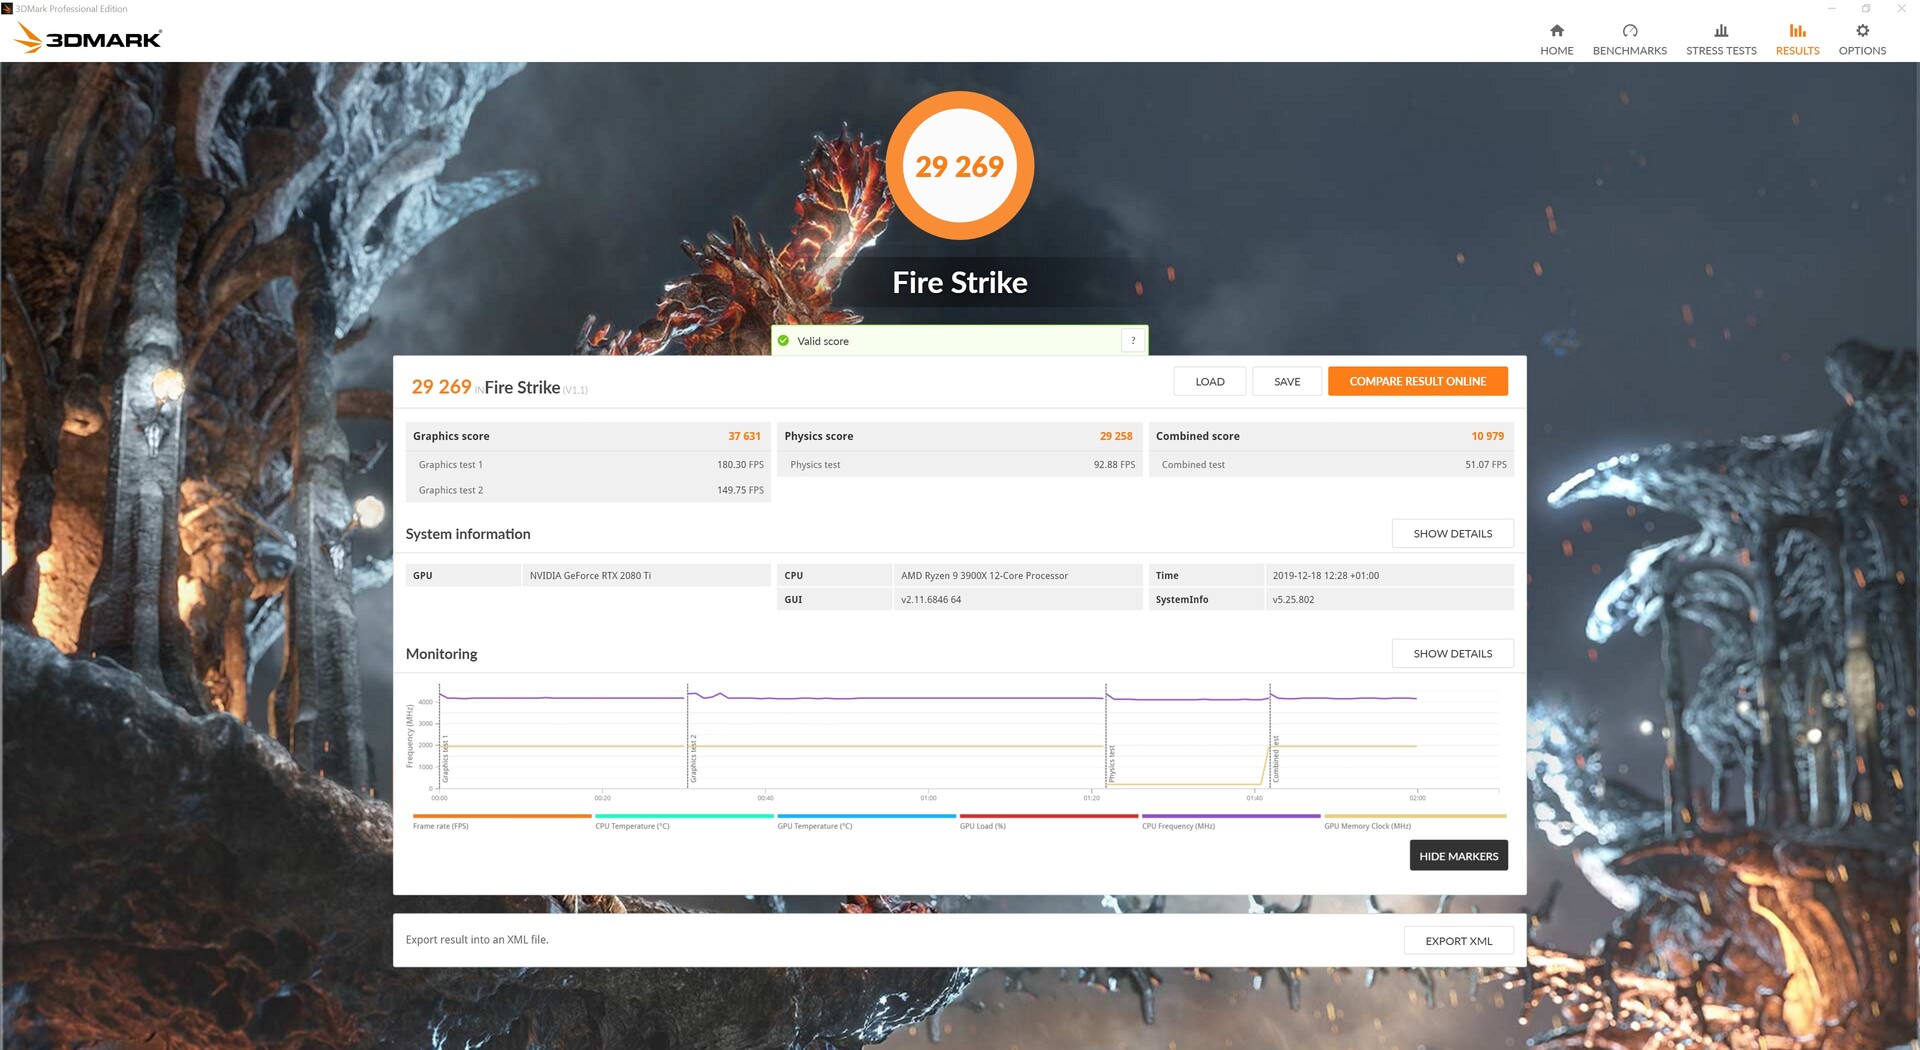
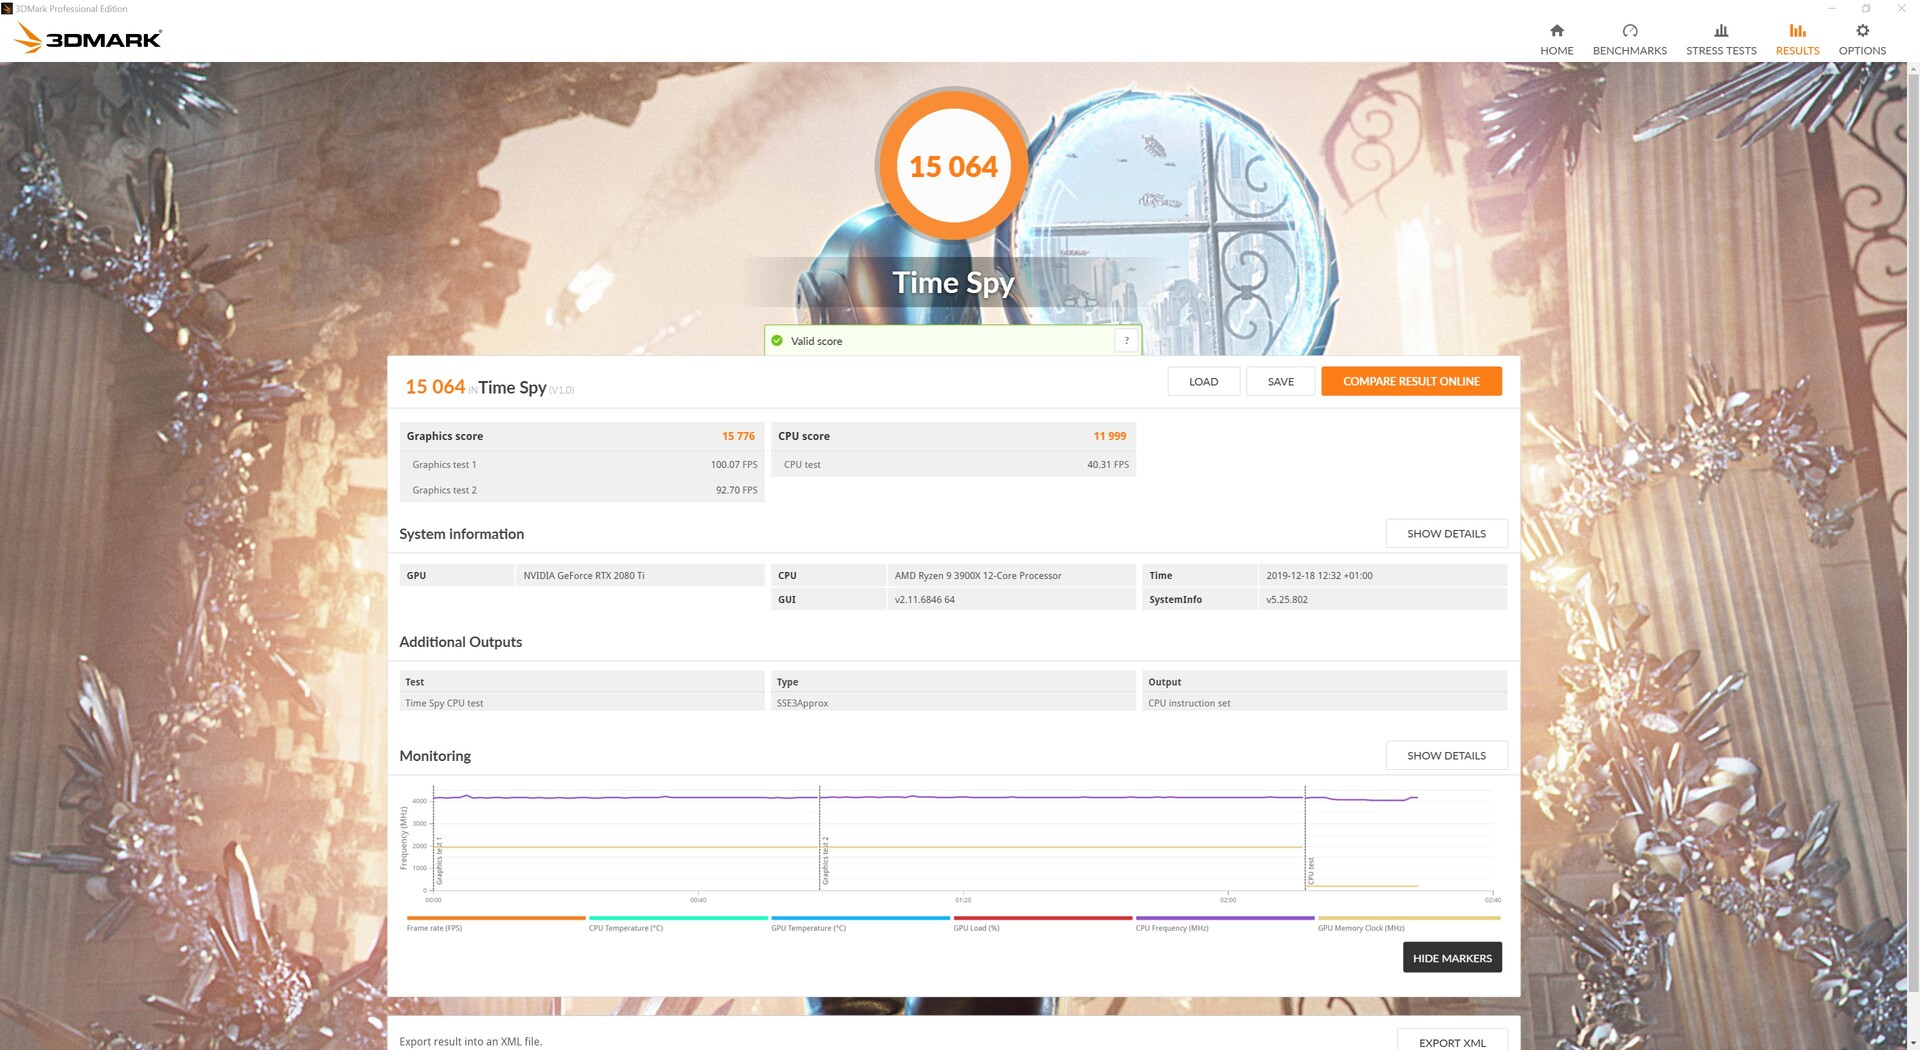
MSI RTX 2080 Ti Gaming X Trio
GeForce RTX 2080 Ti (Desktop), R9 3900X | |
KFA2 GeForce RTX 2080 Ti EX
GeForce RTX 2080 Ti (Desktop), R9 3900X, Corsair MP600 | |
AMD Radeon VII
Radeon VII, R7 2700X | |
MSI RTX 2080 Gaming X Trio
GeForce RTX 2080 (Desktop), R7 2700X | |
Nvidia GeForce RTX 2080 Super
GeForce RTX 2080 Super (Desktop), R7 2700X | |
Nvidia GeForce RTX 2070 Super
GeForce RTX 2070 Super (Desktop), R7 2700X | |
MSI RTX 2070 Gaming Z 8G
GeForce RTX 2070 (Desktop), R7 2700X | |
Nvidia GeForce RTX 2060 Super
GeForce RTX 2060 Super (Desktop), R7 2700X | |
MSI RTX 2060 Gaming Z 6G
GeForce RTX 2060 (Desktop), R7 2700X | |
AMD Radeon RX 5700 XT
Radeon RX 5700 XT (Desktop), R7 2700X | |
AMD Radeon RX 5700
Radeon RX 5700 (Desktop), R7 2700X | |
|
Nvidia Titan RTX
Titan RTX, R7 2700X, ADATA Premier Pro SP900NS38 512 GB | |
MSI RTX 2080 Ti Gaming X Trio
GeForce RTX 2080 Ti (Desktop), R9 3900X | |
KFA2 GeForce RTX 2080 Ti EX
GeForce RTX 2080 Ti (Desktop), R9 3900X, Corsair MP600 | |
MSI RTX 2080 Gaming X Trio
GeForce RTX 2080 (Desktop), R7 2700X | |
Nvidia GeForce RTX 2080 Super
GeForce RTX 2080 Super (Desktop), R7 2700X | |
Nvidia GeForce RTX 2070 Super
GeForce RTX 2070 Super (Desktop), R7 2700X | |
MSI RTX 2070 Gaming Z 8G
GeForce RTX 2070 (Desktop), R7 2700X | |
Nvidia GeForce RTX 2060 Super
GeForce RTX 2060 Super (Desktop), R7 2700X | |
AMD Radeon VII
Radeon VII, R7 2700X | |
AMD Radeon RX 5700 XT
Radeon RX 5700 XT (Desktop), R7 2700X | |
MSI RTX 2060 Gaming Z 6G
GeForce RTX 2060 (Desktop), R7 2700X | |
AMD Radeon RX 5700
Radeon RX 5700 (Desktop), R7 2700X | |
|
|
AMD Ryzen 9 3900X
Titan RTX, R9 3900X, Corsair MP600 | |
MSI RTX 2080 Ti Gaming X Trio
GeForce RTX 2080 Ti (Desktop), R9 3900X | |
Nvidia Titan RTX
Titan RTX, R7 2700X, ADATA Premier Pro SP900NS38 512 GB | |
KFA2 GeForce RTX 2080 Ti EX
GeForce RTX 2080 Ti (Desktop), R9 3900X, Corsair MP600 | |
MSI RTX 2080 Gaming X Trio
GeForce RTX 2080 (Desktop), R7 2700X | |
Nvidia GeForce RTX 2080 Super
GeForce RTX 2080 Super (Desktop), R7 2700X | |
Nvidia GeForce RTX 2070 Super
GeForce RTX 2070 Super (Desktop), R7 2700X | |
AMD Radeon VII
Radeon VII, R7 2700X | |
AMD Radeon RX 5700 XT
Radeon RX 5700 XT (Desktop), R7 2700X | |
MSI RTX 2070 Gaming Z 8G
GeForce RTX 2070 (Desktop), R7 2700X | |
Nvidia GeForce RTX 2060 Super
GeForce RTX 2060 Super (Desktop), R7 2700X | |
MSI RTX 2060 Gaming Z 6G
GeForce RTX 2060 (Desktop), R7 2700X | |
AMD Radeon RX 5700
Radeon RX 5700 (Desktop), R7 2700X | |
|
AMD Radeon VII
Radeon VII, R7 2700X | |
MSI RTX 2080 Ti Gaming X Trio
GeForce RTX 2080 Ti (Desktop), R9 3900X | |
AMD Ryzen 9 3900X
Titan RTX, R9 3900X, Corsair MP600 | |
Nvidia Titan RTX
Titan RTX, R7 2700X, ADATA Premier Pro SP900NS38 512 GB | |
KFA2 GeForce RTX 2080 Ti EX
GeForce RTX 2080 Ti (Desktop), R9 3900X, Corsair MP600 | |
AMD Radeon RX 5700 XT
Radeon RX 5700 XT (Desktop), R7 2700X | |
MSI RTX 2080 Gaming X Trio
GeForce RTX 2080 (Desktop), R7 2700X | |
Nvidia GeForce RTX 2080 Super
GeForce RTX 2080 Super (Desktop), R7 2700X | |
AMD Radeon RX 5700
Radeon RX 5700 (Desktop), R7 2700X | |
Nvidia GeForce RTX 2070 Super
GeForce RTX 2070 Super (Desktop), R7 2700X | |
MSI RTX 2070 Gaming Z 8G
GeForce RTX 2070 (Desktop), R7 2700X | |
Nvidia GeForce RTX 2060 Super
GeForce RTX 2060 Super (Desktop), R7 2700X | |
MSI RTX 2060 Gaming Z 6G
GeForce RTX 2060 (Desktop), R7 2700X | |
|
AMD Ryzen 9 3900X
Titan RTX, R9 3900X, Corsair MP600 | |
MSI RTX 2080 Ti Gaming X Trio
GeForce RTX 2080 Ti (Desktop), R9 3900X | |
Nvidia Titan RTX
Titan RTX, R7 2700X, ADATA Premier Pro SP900NS38 512 GB | |
AMD Radeon VII
Radeon VII, R7 2700X | |
KFA2 GeForce RTX 2080 Ti EX
GeForce RTX 2080 Ti (Desktop), R9 3900X, Corsair MP600 | |
AMD Radeon RX 5700 XT
Radeon RX 5700 XT (Desktop), R7 2700X | |
MSI RTX 2080 Gaming X Trio
GeForce RTX 2080 (Desktop), R7 2700X | |
Nvidia GeForce RTX 2080 Super
GeForce RTX 2080 Super (Desktop), R7 2700X | |
AMD Radeon RX 5700
Radeon RX 5700 (Desktop), R7 2700X | |
Nvidia GeForce RTX 2070 Super
GeForce RTX 2070 Super (Desktop), R7 2700X | |
MSI RTX 2070 Gaming Z 8G
GeForce RTX 2070 (Desktop), R7 2700X | |
Nvidia GeForce RTX 2060 Super
GeForce RTX 2060 Super (Desktop), R7 2700X | |
MSI RTX 2060 Gaming Z 6G
GeForce RTX 2060 (Desktop), R7 2700X | |
|
AMD Ryzen 9 3900X
Titan RTX, R9 3900X, Corsair MP600 | |
Nvidia Titan RTX
Titan RTX, R7 2700X, ADATA Premier Pro SP900NS38 512 GB | |
MSI RTX 2080 Ti Gaming X Trio
GeForce RTX 2080 Ti (Desktop), R9 3900X | |
KFA2 GeForce RTX 2080 Ti EX
GeForce RTX 2080 Ti (Desktop), R9 3900X, Corsair MP600 | |
Nvidia GeForce RTX 2080 Super
GeForce RTX 2080 Super (Desktop), R7 2700X | |
MSI RTX 2080 Gaming X Trio
GeForce RTX 2080 (Desktop), R7 2700X | |
Nvidia GeForce RTX 2070 Super
GeForce RTX 2070 Super (Desktop), R7 2700X | |
AMD Radeon VII
Radeon VII, R7 2700X | |
MSI RTX 2070 Gaming Z 8G
GeForce RTX 2070 (Desktop), R7 2700X | |
Nvidia GeForce RTX 2060 Super
GeForce RTX 2060 Super (Desktop), R7 2700X | |
AMD Radeon RX 5700 XT
Radeon RX 5700 XT (Desktop), R7 2700X | |
AMD Radeon RX 5700
Radeon RX 5700 (Desktop), R7 2700X | |
MSI RTX 2060 Gaming Z 6G
GeForce RTX 2060 (Desktop), R7 2700X | |
|
AMD Ryzen 9 3900X
Titan RTX, R9 3900X, Corsair MP600 | |
Nvidia Titan RTX
Titan RTX, R7 2700X, ADATA Premier Pro SP900NS38 512 GB | |
MSI RTX 2080 Ti Gaming X Trio
GeForce RTX 2080 Ti (Desktop), R9 3900X | |
AMD Radeon VII
Radeon VII, R7 2700X | |
KFA2 GeForce RTX 2080 Ti EX
GeForce RTX 2080 Ti (Desktop), R9 3900X, Corsair MP600 | |
Nvidia GeForce RTX 2080 Super
GeForce RTX 2080 Super (Desktop), R7 2700X | |
MSI RTX 2080 Gaming X Trio
GeForce RTX 2080 (Desktop), R7 2700X | |
Nvidia GeForce RTX 2070 Super
GeForce RTX 2070 Super (Desktop), R7 2700X | |
MSI RTX 2070 Gaming Z 8G
GeForce RTX 2070 (Desktop), R7 2700X | |
AMD Radeon RX 5700 XT
Radeon RX 5700 XT (Desktop), R7 2700X | |
AMD Radeon RX 5700
Radeon RX 5700 (Desktop), R7 2700X | |
Nvidia GeForce RTX 2060 Super
GeForce RTX 2060 Super (Desktop), R7 2700X | |
MSI RTX 2060 Gaming Z 6G
GeForce RTX 2060 (Desktop), R7 2700X | |
|
AMD Ryzen 9 3900X
Titan RTX, R9 3900X, Corsair MP600 | |
MSI RTX 2080 Ti Gaming X Trio
GeForce RTX 2080 Ti (Desktop), R9 3900X | |
Nvidia Titan RTX
Titan RTX, R7 2700X, ADATA Premier Pro SP900NS38 512 GB | |
KFA2 GeForce RTX 2080 Ti EX
GeForce RTX 2080 Ti (Desktop), R9 3900X, Corsair MP600 | |
AMD Radeon VII
Radeon VII, R7 2700X | |
Nvidia GeForce RTX 2080 Super
GeForce RTX 2080 Super (Desktop), R7 2700X | |
MSI RTX 2080 Gaming X Trio
GeForce RTX 2080 (Desktop), R7 2700X | |
AMD Radeon RX 5700 XT
Radeon RX 5700 XT (Desktop), R7 2700X | |
Nvidia GeForce RTX 2070 Super
GeForce RTX 2070 Super (Desktop), R7 2700X | |
MSI RTX 2070 Gaming Z 8G
GeForce RTX 2070 (Desktop), R7 2700X | |
AMD Radeon RX 5700
Radeon RX 5700 (Desktop), R7 2700X | |
Nvidia GeForce RTX 2060 Super
GeForce RTX 2060 Super (Desktop), R7 2700X | |
MSI RTX 2060 Gaming Z 6G
GeForce RTX 2060 (Desktop), R7 2700X | |
|
|
AMD Ryzen 9 3900X
Titan RTX, R9 3900X, Corsair MP600 | |
Nvidia Titan RTX
Titan RTX, R7 2700X, ADATA Premier Pro SP900NS38 512 GB | |
AMD Radeon RX 5700 XT
Radeon RX 5700 XT (Desktop), R7 2700X | |
MSI RTX 2080 Ti Gaming X Trio
GeForce RTX 2080 Ti (Desktop), R9 3900X | |
KFA2 GeForce RTX 2080 Ti EX
GeForce RTX 2080 Ti (Desktop), R9 3900X, Corsair MP600 | |
AMD Radeon RX 5700
Radeon RX 5700 (Desktop), R7 2700X | |
MSI RTX 2080 Gaming X Trio
GeForce RTX 2080 (Desktop), R7 2700X | |
Nvidia GeForce RTX 2080 Super
GeForce RTX 2080 Super (Desktop), R7 2700X | |
AMD Radeon VII
Radeon VII, R7 2700X | |
Nvidia GeForce RTX 2070 Super
GeForce RTX 2070 Super (Desktop), R7 2700X | |
MSI RTX 2070 Gaming Z 8G
GeForce RTX 2070 (Desktop), R7 2700X | |
MSI RTX 2060 Gaming Z 6G
GeForce RTX 2060 (Desktop), R7 2700X | |
Nvidia GeForce RTX 2060 Super
GeForce RTX 2060 Super (Desktop), R7 2700X | |
|
AMD Ryzen 9 3900X
Titan RTX, R9 3900X, Corsair MP600 | |
Nvidia Titan RTX
Titan RTX, R7 2700X, ADATA Premier Pro SP900NS38 512 GB | |
AMD Radeon RX 5700 XT
Radeon RX 5700 XT (Desktop), R7 2700X | |
AMD Radeon RX 5700
Radeon RX 5700 (Desktop), R7 2700X | |
AMD Radeon VII
Radeon VII, R7 2700X | |
MSI RTX 2080 Ti Gaming X Trio
GeForce RTX 2080 Ti (Desktop), R9 3900X | |
KFA2 GeForce RTX 2080 Ti EX
GeForce RTX 2080 Ti (Desktop), R9 3900X, Corsair MP600 | |
Nvidia GeForce RTX 2080 Super
GeForce RTX 2080 Super (Desktop), R7 2700X | |
MSI RTX 2080 Gaming X Trio
GeForce RTX 2080 (Desktop), R7 2700X | |
Nvidia GeForce RTX 2070 Super
GeForce RTX 2070 Super (Desktop), R7 2700X | |
MSI RTX 2070 Gaming Z 8G
GeForce RTX 2070 (Desktop), R7 2700X | |
Nvidia GeForce RTX 2060 Super
GeForce RTX 2060 Super (Desktop), R7 2700X | |
MSI RTX 2060 Gaming Z 6G
GeForce RTX 2060 (Desktop), R7 2700X | |
|
Nvidia Titan RTX
Titan RTX, R7 2700X, ADATA Premier Pro SP900NS38 512 GB | |
AMD Ryzen 9 3900X
Titan RTX, R9 3900X, Corsair MP600 | |
KFA2 GeForce RTX 2080 Ti EX
GeForce RTX 2080 Ti (Desktop), R9 3900X, Corsair MP600 | |
MSI RTX 2080 Ti Gaming X Trio
GeForce RTX 2080 Ti (Desktop), R9 3900X | |
Nvidia GeForce RTX 2080 Super
GeForce RTX 2080 Super (Desktop), R7 2700X | |
AMD Radeon RX 5700 XT
Radeon RX 5700 XT (Desktop), R7 2700X | |
Nvidia GeForce RTX 2070 Super
GeForce RTX 2070 Super (Desktop), R7 2700X | |
AMD Radeon RX 5700
Radeon RX 5700 (Desktop), R7 2700X | |
Nvidia GeForce RTX 2060 Super
GeForce RTX 2060 Super (Desktop), R7 2700X | |
MSI RTX 2060 Gaming Z 6G
GeForce RTX 2060 (Desktop), R7 2700X | |
|
AMD Ryzen 9 3900X
Titan RTX, R9 3900X, Corsair MP600 | |
Nvidia Titan RTX
Titan RTX, R7 2700X, ADATA Premier Pro SP900NS38 512 GB | |
MSI RTX 2080 Ti Gaming X Trio
GeForce RTX 2080 Ti (Desktop), R9 3900X | |
AMD Radeon RX 5700 XT
Radeon RX 5700 XT (Desktop), R7 2700X | |
KFA2 GeForce RTX 2080 Ti EX
GeForce RTX 2080 Ti (Desktop), R9 3900X, Corsair MP600 | |
AMD Radeon VII
Radeon VII, R7 2700X | |
Nvidia GeForce RTX 2080 Super
GeForce RTX 2080 Super (Desktop), R7 2700X | |
MSI RTX 2080 Gaming X Trio
GeForce RTX 2080 (Desktop), R7 2700X | |
AMD Radeon RX 5700
Radeon RX 5700 (Desktop), R7 2700X | |
Nvidia GeForce RTX 2070 Super
GeForce RTX 2070 Super (Desktop), R7 2700X | |
MSI RTX 2070 Gaming Z 8G
GeForce RTX 2070 (Desktop), R7 2700X | |
Nvidia GeForce RTX 2060 Super
GeForce RTX 2060 Super (Desktop), R7 2700X | |
MSI RTX 2060 Gaming Z 6G
GeForce RTX 2060 (Desktop), R7 2700X | |
|
AMD Ryzen 9 3900X
Titan RTX, R9 3900X, Corsair MP600 | |
MSI RTX 2080 Ti Gaming X Trio
GeForce RTX 2080 Ti (Desktop), R9 3900X | |
KFA2 GeForce RTX 2080 Ti EX
GeForce RTX 2080 Ti (Desktop), R9 3900X, Corsair MP600 | |
Nvidia Titan RTX
Titan RTX, R7 2700X, ADATA Premier Pro SP900NS38 512 GB | |
Nvidia GeForce RTX 2080 Super
GeForce RTX 2080 Super (Desktop), R7 2700X | |
Nvidia GeForce RTX 2070 Super
GeForce RTX 2070 Super (Desktop), R7 2700X | |
MSI RTX 2070 Gaming Z 8G
GeForce RTX 2070 (Desktop), R7 2700X | |
Nvidia GeForce RTX 2060 Super
GeForce RTX 2060 Super (Desktop), R7 2700X | |
MSI RTX 2060 Gaming Z 6G
GeForce RTX 2060 (Desktop), R7 2700X | |
AMD Radeon RX 5700 XT
Radeon RX 5700 XT (Desktop), R7 2700X | |
AMD Radeon VII
Radeon VII, R7 2700X | |
AMD Radeon RX 5700
Radeon RX 5700 (Desktop), R7 2700X | |
|
AMD Ryzen 9 3900X
Titan RTX, R9 3900X, Corsair MP600 | |
Nvidia Titan RTX
Titan RTX, R7 2700X, ADATA Premier Pro SP900NS38 512 GB | |
AMD Radeon VII
Radeon VII, R7 2700X | |
MSI RTX 2080 Ti Gaming X Trio
GeForce RTX 2080 Ti (Desktop), R9 3900X | |
KFA2 GeForce RTX 2080 Ti EX
GeForce RTX 2080 Ti (Desktop), R9 3900X, Corsair MP600 | |
AMD Radeon RX 5700 XT
Radeon RX 5700 XT (Desktop), R7 2700X | |
AMD Radeon RX 5700
Radeon RX 5700 (Desktop), R7 2700X | |
Nvidia GeForce RTX 2080 Super
GeForce RTX 2080 Super (Desktop), R7 2700X | |
Nvidia GeForce RTX 2070 Super
GeForce RTX 2070 Super (Desktop), R7 2700X | |
MSI RTX 2070 Gaming Z 8G
GeForce RTX 2070 (Desktop), R7 2700X | |
Nvidia GeForce RTX 2060 Super
GeForce RTX 2060 Super (Desktop), R7 2700X | |
MSI RTX 2060 Gaming Z 6G
GeForce RTX 2060 (Desktop), R7 2700X | |
|
AMD Ryzen 9 3900X
Titan RTX, R9 3900X, Corsair MP600 | |
Nvidia Titan RTX
Titan RTX, R7 2700X, ADATA Premier Pro SP900NS38 512 GB | |
MSI RTX 2080 Ti Gaming X Trio
GeForce RTX 2080 Ti (Desktop), R9 3900X | |
KFA2 GeForce RTX 2080 Ti EX
GeForce RTX 2080 Ti (Desktop), R9 3900X, Corsair MP600 | |
MSI RTX 2080 Gaming X Trio
GeForce RTX 2080 (Desktop), R7 2700X | |
Nvidia GeForce RTX 2080 Super
GeForce RTX 2080 Super (Desktop), R7 2700X | |
MSI RTX 2070 Gaming Z 8G
GeForce RTX 2070 (Desktop), R7 2700X | |
Nvidia GeForce RTX 2060 Super
GeForce RTX 2060 Super (Desktop), R7 2700X | |
Nvidia GeForce RTX 2070 Super
GeForce RTX 2070 Super (Desktop), R7 2700X | |
MSI RTX 2060 Gaming Z 6G
GeForce RTX 2060 (Desktop), R7 2700X | |
AMD Radeon RX 5700 XT
Radeon RX 5700 XT (Desktop), R7 2700X | |
AMD Radeon RX 5700
Radeon RX 5700 (Desktop), R7 2700X | |
AMD Radeon VII
Radeon VII, R7 2700X | |
|
AMD Ryzen 9 3900X
Titan RTX, R9 3900X, Corsair MP600 | |
Nvidia Titan RTX
Titan RTX, R7 2700X, ADATA Premier Pro SP900NS38 512 GB | |
AMD Radeon RX 5700 XT
Radeon RX 5700 XT (Desktop), R7 2700X | |
AMD Radeon VII
Radeon VII, R7 2700X | |
AMD Radeon RX 5700
Radeon RX 5700 (Desktop), R7 2700X | |
MSI RTX 2080 Ti Gaming X Trio
GeForce RTX 2080 Ti (Desktop), R9 3900X | |
KFA2 GeForce RTX 2080 Ti EX
GeForce RTX 2080 Ti (Desktop), R9 3900X, Corsair MP600 | |
Nvidia GeForce RTX 2080 Super
GeForce RTX 2080 Super (Desktop), R7 2700X | |
Nvidia GeForce RTX 2070 Super
GeForce RTX 2070 Super (Desktop), R7 2700X | |
MSI RTX 2070 Gaming Z 8G
GeForce RTX 2070 (Desktop), R7 2700X | |
Nvidia GeForce RTX 2060 Super
GeForce RTX 2060 Super (Desktop), R7 2700X | |
MSI RTX 2060 Gaming Z 6G
GeForce RTX 2060 (Desktop), R7 2700X | |
|
AMD Ryzen 9 3900X
Titan RTX, R9 3900X, Corsair MP600 | |
MSI RTX 2080 Ti Gaming X Trio
GeForce RTX 2080 Ti (Desktop), R9 3900X | |
KFA2 GeForce RTX 2080 Ti EX
GeForce RTX 2080 Ti (Desktop), R9 3900X, Corsair MP600 | |
Nvidia Titan RTX
Titan RTX, R7 2700X, ADATA Premier Pro SP900NS38 512 GB | |
Nvidia GeForce RTX 2080 Super
GeForce RTX 2080 Super (Desktop), R7 2700X | |
Nvidia GeForce RTX 2070 Super
GeForce RTX 2070 Super (Desktop), R7 2700X | |
MSI RTX 2070 Gaming Z 8G
GeForce RTX 2070 (Desktop), R7 2700X | |
Nvidia GeForce RTX 2060 Super
GeForce RTX 2060 Super (Desktop), R7 2700X | |
MSI RTX 2060 Gaming Z 6G
GeForce RTX 2060 (Desktop), R7 2700X | |
AMD Radeon RX 5700 XT
Radeon RX 5700 XT (Desktop), R7 2700X | |
AMD Radeon VII
Radeon VII, R7 2700X | |
AMD Radeon RX 5700
Radeon RX 5700 (Desktop), R7 2700X | |
|
|
AMD Ryzen 9 3900X
Titan RTX, R9 3900X, Corsair MP600 | |
Nvidia Titan RTX
Titan RTX, R7 2700X, ADATA Premier Pro SP900NS38 512 GB | |
AMD Radeon RX 5700 XT
Radeon RX 5700 XT (Desktop), R7 2700X | |
MSI RTX 2080 Ti Gaming X Trio
GeForce RTX 2080 Ti (Desktop), R9 3900X | |
AMD Radeon RX 5700
Radeon RX 5700 (Desktop), R7 2700X | |
KFA2 GeForce RTX 2080 Ti EX
GeForce RTX 2080 Ti (Desktop), R9 3900X, Corsair MP600 | |
AMD Radeon VII
Radeon VII, R7 2700X | |
Nvidia GeForce RTX 2080 Super
GeForce RTX 2080 Super (Desktop), R7 2700X | |
MSI RTX 2080 Gaming X Trio
GeForce RTX 2080 (Desktop), R7 2700X | |
Nvidia GeForce RTX 2070 Super
GeForce RTX 2070 Super (Desktop), R7 2700X | |
MSI RTX 2070 Gaming Z 8G
GeForce RTX 2070 (Desktop), R7 2700X | |
Nvidia GeForce RTX 2060 Super
GeForce RTX 2060 Super (Desktop), R7 2700X | |
MSI RTX 2060 Gaming Z 6G
GeForce RTX 2060 (Desktop), R7 2700X | |
|
AMD Ryzen 9 3900X
Titan RTX, R9 3900X, Corsair MP600 | |
Nvidia Titan RTX
Titan RTX, R7 2700X, ADATA Premier Pro SP900NS38 512 GB | |
AMD Radeon RX 5700 XT
Radeon RX 5700 XT (Desktop), R7 2700X | |
AMD Radeon RX 5700
Radeon RX 5700 (Desktop), R7 2700X | |
AMD Radeon VII
Radeon VII, R7 2700X | |
MSI RTX 2080 Ti Gaming X Trio
GeForce RTX 2080 Ti (Desktop), R9 3900X | |
Nvidia GeForce RTX 2080 Super
GeForce RTX 2080 Super (Desktop), R7 2700X | |
KFA2 GeForce RTX 2080 Ti EX
GeForce RTX 2080 Ti (Desktop), R9 3900X, Corsair MP600 | |
MSI RTX 2080 Gaming X Trio
GeForce RTX 2080 (Desktop), R7 2700X | |
Nvidia GeForce RTX 2070 Super
GeForce RTX 2070 Super (Desktop), R7 2700X | |
MSI RTX 2070 Gaming Z 8G
GeForce RTX 2070 (Desktop), R7 2700X | |
Nvidia GeForce RTX 2060 Super
GeForce RTX 2060 Super (Desktop), R7 2700X | |
MSI RTX 2060 Gaming Z 6G
GeForce RTX 2060 (Desktop), R7 2700X | |
|
Nvidia Titan RTX
Titan RTX, R7 2700X, ADATA Premier Pro SP900NS38 512 GB | |
AMD Ryzen 9 3900X
Titan RTX, R9 3900X, Corsair MP600 | |
MSI RTX 2080 Ti Gaming X Trio
GeForce RTX 2080 Ti (Desktop), R9 3900X | |
KFA2 GeForce RTX 2080 Ti EX
GeForce RTX 2080 Ti (Desktop), R9 3900X, Corsair MP600 | |
Nvidia GeForce RTX 2080 Super
GeForce RTX 2080 Super (Desktop), R7 2700X | |
AMD Radeon RX 5700 XT
Radeon RX 5700 XT (Desktop), R7 2700X | |
Nvidia GeForce RTX 2070 Super
GeForce RTX 2070 Super (Desktop), R7 2700X | |
AMD Radeon RX 5700
Radeon RX 5700 (Desktop), R7 2700X | |
Nvidia GeForce RTX 2060 Super
GeForce RTX 2060 Super (Desktop), R7 2700X | |
MSI RTX 2060 Gaming Z 6G
GeForce RTX 2060 (Desktop), R7 2700X | |
|
Nvidia Titan RTX
Titan RTX, R7 2700X, ADATA Premier Pro SP900NS38 512 GB | |
AMD Ryzen 9 3900X
Titan RTX, R9 3900X, Corsair MP600 | |
AMD Radeon VII
Radeon VII, R7 2700X | |
MSI RTX 2080 Ti Gaming X Trio
GeForce RTX 2080 Ti (Desktop), R9 3900X | |
KFA2 GeForce RTX 2080 Ti EX
GeForce RTX 2080 Ti (Desktop), R9 3900X, Corsair MP600 | |
AMD Radeon RX 5700 XT
Radeon RX 5700 XT (Desktop), R7 2700X | |
Nvidia GeForce RTX 2080 Super
GeForce RTX 2080 Super (Desktop), R7 2700X | |
MSI RTX 2080 Gaming X Trio
GeForce RTX 2080 (Desktop), R7 2700X | |
Nvidia GeForce RTX 2070 Super
GeForce RTX 2070 Super (Desktop), R7 2700X | |
AMD Radeon RX 5700
Radeon RX 5700 (Desktop), R7 2700X | |
MSI RTX 2070 Gaming Z 8G
GeForce RTX 2070 (Desktop), R7 2700X | |
Nvidia GeForce RTX 2060 Super
GeForce RTX 2060 Super (Desktop), R7 2700X | |
MSI RTX 2060 Gaming Z 6G
GeForce RTX 2060 (Desktop), R7 2700X | |
|
MSI RTX 2080 Ti Gaming X Trio
GeForce RTX 2080 Ti (Desktop), R9 3900X | |
KFA2 GeForce RTX 2080 Ti EX
GeForce RTX 2080 Ti (Desktop), R9 3900X, Corsair MP600 | |
AMD Ryzen 9 3900X
Titan RTX, R9 3900X, Corsair MP600 | |
MSI RTX 2080 Gaming X Trio
GeForce RTX 2080 (Desktop), R7 2700X | |
Nvidia GeForce RTX 2060 Super
GeForce RTX 2060 Super (Desktop), R7 2700X | |
MSI RTX 2070 Gaming Z 8G
GeForce RTX 2070 (Desktop), R7 2700X | |
Nvidia GeForce RTX 2080 Super
GeForce RTX 2080 Super (Desktop), R7 2700X | |
Nvidia Titan RTX
Titan RTX, R7 2700X, ADATA Premier Pro SP900NS38 512 GB | |
MSI RTX 2060 Gaming Z 6G
GeForce RTX 2060 (Desktop), R7 2700X | |
Nvidia GeForce RTX 2070 Super
GeForce RTX 2070 Super (Desktop), R7 2700X | |
AMD Radeon VII
Radeon VII, R7 2700X | |
AMD Radeon RX 5700 XT
Radeon RX 5700 XT (Desktop), R7 2700X | |
AMD Radeon RX 5700
Radeon RX 5700 (Desktop), R7 2700X | |
|
Nvidia Titan RTX
Titan RTX, R7 2700X, ADATA Premier Pro SP900NS38 512 GB | |
AMD Ryzen 9 3900X
Titan RTX, R9 3900X, Corsair MP600 | |
MSI RTX 2080 Ti Gaming X Trio
GeForce RTX 2080 Ti (Desktop), R9 3900X | |
AMD Radeon VII
Radeon VII, R7 2700X | |
KFA2 GeForce RTX 2080 Ti EX
GeForce RTX 2080 Ti (Desktop), R9 3900X, Corsair MP600 | |
Nvidia GeForce RTX 2080 Super
GeForce RTX 2080 Super (Desktop), R7 2700X | |
AMD Radeon RX 5700 XT
Radeon RX 5700 XT (Desktop), R7 2700X | |
MSI RTX 2080 Gaming X Trio
GeForce RTX 2080 (Desktop), R7 2700X | |
Nvidia GeForce RTX 2070 Super
GeForce RTX 2070 Super (Desktop), R7 2700X | |
AMD Radeon RX 5700
Radeon RX 5700 (Desktop), R7 2700X | |
MSI RTX 2070 Gaming Z 8G
GeForce RTX 2070 (Desktop), R7 2700X | |
Nvidia GeForce RTX 2060 Super
GeForce RTX 2060 Super (Desktop), R7 2700X | |
MSI RTX 2060 Gaming Z 6G
GeForce RTX 2060 (Desktop), R7 2700X | |
|
AMD Ryzen 9 3900X
Titan RTX, R9 3900X, Corsair MP600 | |
Nvidia Titan RTX
Titan RTX, R7 2700X, ADATA Premier Pro SP900NS38 512 GB | |
AMD Radeon RX 5700 XT
Radeon RX 5700 XT (Desktop), R7 2700X | |
MSI RTX 2080 Ti Gaming X Trio
GeForce RTX 2080 Ti (Desktop), R9 3900X | |
KFA2 GeForce RTX 2080 Ti EX
GeForce RTX 2080 Ti (Desktop), R9 3900X, Corsair MP600 | |
AMD Radeon RX 5700
Radeon RX 5700 (Desktop), R7 2700X | |
AMD Radeon VII
Radeon VII, R7 2700X | |
Nvidia GeForce RTX 2080 Super
GeForce RTX 2080 Super (Desktop), R7 2700X | |
MSI RTX 2080 Gaming X Trio
GeForce RTX 2080 (Desktop), R7 2700X | |
Nvidia GeForce RTX 2070 Super
GeForce RTX 2070 Super (Desktop), R7 2700X | |
MSI RTX 2070 Gaming Z 8G
GeForce RTX 2070 (Desktop), R7 2700X | |
MSI RTX 2060 Gaming Z 6G
GeForce RTX 2060 (Desktop), R7 2700X | |
Nvidia GeForce RTX 2060 Super
GeForce RTX 2060 Super (Desktop), R7 2700X | |
|
AMD Ryzen 9 3900X
Titan RTX, R9 3900X, Corsair MP600 | |
Nvidia Titan RTX
Titan RTX, R7 2700X, ADATA Premier Pro SP900NS38 512 GB | |
AMD Radeon VII
Radeon VII, R7 2700X | |
AMD Radeon RX 5700 XT
Radeon RX 5700 XT (Desktop), R7 2700X | |
AMD Radeon RX 5700
Radeon RX 5700 (Desktop), R7 2700X | |
MSI RTX 2080 Ti Gaming X Trio
GeForce RTX 2080 Ti (Desktop), R9 3900X | |
KFA2 GeForce RTX 2080 Ti EX
GeForce RTX 2080 Ti (Desktop), R9 3900X, Corsair MP600 | |
MSI RTX 2080 Gaming X Trio
GeForce RTX 2080 (Desktop), R7 2700X | |
Nvidia GeForce RTX 2080 Super
GeForce RTX 2080 Super (Desktop), R7 2700X | |
Nvidia GeForce RTX 2070 Super
GeForce RTX 2070 Super (Desktop), R7 2700X | |
MSI RTX 2070 Gaming Z 8G
GeForce RTX 2070 (Desktop), R7 2700X | |
Nvidia GeForce RTX 2060 Super
GeForce RTX 2060 Super (Desktop), R7 2700X | |
MSI RTX 2060 Gaming Z 6G
GeForce RTX 2060 (Desktop), R7 2700X | |
|
AMD Ryzen 9 3900X
Titan RTX, R9 3900X, Corsair MP600 | |
MSI RTX 2080 Ti Gaming X Trio
GeForce RTX 2080 Ti (Desktop), R9 3900X | |
Nvidia Titan RTX
Titan RTX, R7 2700X, ADATA Premier Pro SP900NS38 512 GB | |
KFA2 GeForce RTX 2080 Ti EX
GeForce RTX 2080 Ti (Desktop), R9 3900X, Corsair MP600 | |
MSI RTX 2080 Gaming X Trio
GeForce RTX 2080 (Desktop), R7 2700X | |
Nvidia GeForce RTX 2080 Super
GeForce RTX 2080 Super (Desktop), R7 2700X | |
Nvidia GeForce RTX 2070 Super
GeForce RTX 2070 Super (Desktop), R7 2700X | |
MSI RTX 2070 Gaming Z 8G
GeForce RTX 2070 (Desktop), R7 2700X | |
Nvidia GeForce RTX 2060 Super
GeForce RTX 2060 Super (Desktop), R7 2700X | |
MSI RTX 2060 Gaming Z 6G
GeForce RTX 2060 (Desktop), R7 2700X | |
AMD Radeon RX 5700 XT
Radeon RX 5700 XT (Desktop), R7 2700X | |
AMD Radeon VII
Radeon VII, R7 2700X | |
AMD Radeon RX 5700
Radeon RX 5700 (Desktop), R7 2700X | |
|
|
AMD Radeon VII
Radeon VII, R7 2700X | |
MSI RTX 2080 Ti Gaming X Trio
GeForce RTX 2080 Ti (Desktop), R9 3900X | |
KFA2 GeForce RTX 2080 Ti EX
GeForce RTX 2080 Ti (Desktop), R9 3900X, Corsair MP600 | |
Nvidia GeForce RTX 2080 Super
GeForce RTX 2080 Super (Desktop), R7 2700X | |
MSI RTX 2080 Gaming X Trio
GeForce RTX 2080 (Desktop), R7 2700X | |
Nvidia GeForce RTX 2070 Super
GeForce RTX 2070 Super (Desktop), R7 2700X | |
MSI RTX 2070 Gaming Z 8G
GeForce RTX 2070 (Desktop), R7 2700X | |
Nvidia GeForce RTX 2060 Super
GeForce RTX 2060 Super (Desktop), R7 2700X | |
AMD Radeon RX 5700 XT
Radeon RX 5700 XT (Desktop), R7 2700X | |
MSI RTX 2060 Gaming Z 6G
GeForce RTX 2060 (Desktop), R7 2700X | |
AMD Radeon RX 5700
Radeon RX 5700 (Desktop), R7 2700X | |
|
MSI RTX 2080 Ti Gaming X Trio
GeForce RTX 2080 Ti (Desktop), R9 3900X | |
KFA2 GeForce RTX 2080 Ti EX
GeForce RTX 2080 Ti (Desktop), R9 3900X, Corsair MP600 | |
MSI RTX 2080 Gaming X Trio
GeForce RTX 2080 (Desktop), R7 2700X | |
AMD Radeon VII
Radeon VII, R7 2700X | |
Nvidia GeForce RTX 2080 Super
GeForce RTX 2080 Super (Desktop), R7 2700X | |
Nvidia GeForce RTX 2070 Super
GeForce RTX 2070 Super (Desktop), R7 2700X | |
MSI RTX 2070 Gaming Z 8G
GeForce RTX 2070 (Desktop), R7 2700X | |
Nvidia GeForce RTX 2060 Super
GeForce RTX 2060 Super (Desktop), R7 2700X | |
MSI RTX 2060 Gaming Z 6G
GeForce RTX 2060 (Desktop), R7 2700X | |
|
AMD Radeon VII
Radeon VII, R7 2700X | |
MSI RTX 2080 Ti Gaming X Trio
GeForce RTX 2080 Ti (Desktop), R9 3900X | |
KFA2 GeForce RTX 2080 Ti EX
GeForce RTX 2080 Ti (Desktop), R9 3900X, Corsair MP600 | |
MSI RTX 2080 Gaming X Trio
GeForce RTX 2080 (Desktop), R7 2700X | |
Nvidia GeForce RTX 2080 Super
GeForce RTX 2080 Super (Desktop), R7 2700X | |
Nvidia GeForce RTX 2070 Super
GeForce RTX 2070 Super (Desktop), R7 2700X | |
MSI RTX 2070 Gaming Z 8G
GeForce RTX 2070 (Desktop), R7 2700X | |
Nvidia GeForce RTX 2060 Super
GeForce RTX 2060 Super (Desktop), R7 2700X | |
MSI RTX 2060 Gaming Z 6G
GeForce RTX 2060 (Desktop), R7 2700X | |
AMD Radeon RX 5700 XT
Radeon RX 5700 XT (Desktop), R7 2700X | |
AMD Radeon RX 5700
Radeon RX 5700 (Desktop), R7 2700X | |