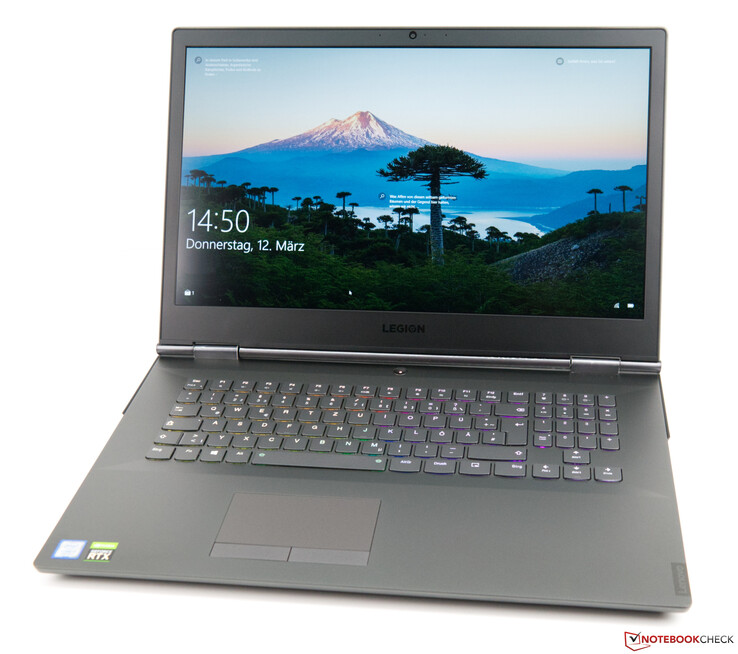
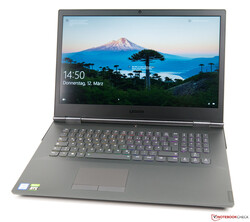
Test du Lenovo Legion Y740-17IRHg (i7-9750H, RTX 2080 Max-Q, FHD, 144 Hz) : PC portable de jeu efficace
Note | Date | Modèle | Poids | Épaisseur | Taille | Résolution | Prix |
|---|---|---|---|---|---|---|---|
| 84 % v7 (old) | 04/20 | Lenovo Legion Y740-17IRHg-81UJ001VGE i7-9750H, GeForce RTX 2080 Max-Q | 3 kg | 25.5 mm | 17.30" | 1920x1080 | |
| 86.7 % v7 (old) | 11/19 | Razer Blade Pro 17 4K UHD 120 Hz i7-9750H, GeForce RTX 2080 Max-Q | 2.8 kg | 19.9 mm | 17.30" | 3840x2160 | |
| 84.2 % v7 (old) | 03/20 | Alienware m17 R2 P41E i9-9980HK, GeForce RTX 2080 Max-Q | 2.6 kg | 20.5 mm | 17.30" | 1920x1080 | |
| 81.2 % v7 (old) | 01/20 | Asus ROG Zephyrus S GX701GXR i7-9750H, GeForce RTX 2080 Max-Q | 2.7 kg | 18.7 mm | 17.30" | 1920x1080 |
Top 10
» Le Top 10 des PC portables multimédia
» Le Top 10 des PC portables de jeu
» Le Top 10 des PC portables de jeu légers
» Le Top 10 des ordinateurs portables bureautiques
» Le Top 10 des PC portables bureautiques premium/professionnels
» Le Top 10 des Stations de travail mobiles
» Le Top 10 des Ultraportables
» Le Top 10 des Ultrabooks
» Le Top 10 des Convertibles
» Le Top 10 des Tablettes
» Le Top 10 des Tablettes Windows
» Le Top 10 des Smartphones
» Le Top 10 des PC Portables á moins de 300 euros
» Le Top 10 des PC Portables á moins de 500 euros
» Le Top 25 des meilleurs écrans d'ordinateurs
Comparaison des tailles
Sélection des ports
| |||||||||||||||||||||||||
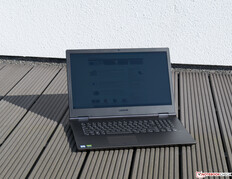
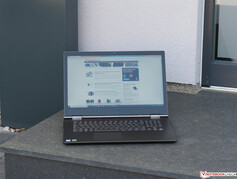
Homogénéité de la luminosité: 85 %
Valeur mesurée au centre, sur batterie: 310 cd/m²
Contraste: 1000:1 (Valeurs des noirs: 0.31 cd/m²)
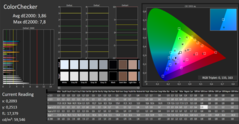
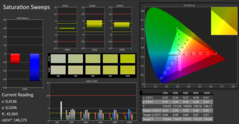
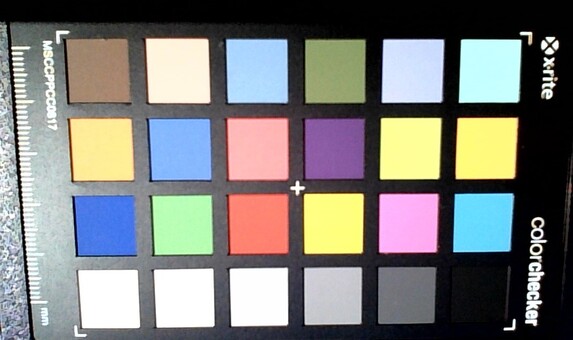
ΔE ColorChecker Calman: 3.86 | ∀{0.5-29.43 Ø4.77}
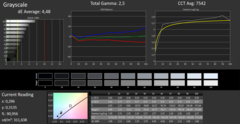
ΔE Greyscale Calman: 4.48 | ∀{0.09-98 Ø5}
93% sRGB (Argyll 1.6.3 3D)
60% AdobeRGB 1998 (Argyll 1.6.3 3D)
65.3% AdobeRGB 1998 (Argyll 3D)
92.7% sRGB (Argyll 3D)
63.8% Display P3 (Argyll 3D)
Gamma: 2.5
CCT: 7542 K
| Lenovo Legion Y740-17IRHg-81UJ001VGE AUO_B173HAN03, IPS, 1920x1080, 17.3" | Razer Blade Pro 17 4K UHD 120 Hz AU Optronics B173ZAN03.3, IPS, 3840x2160, 17.3" | Alienware m17 R2 P41E Chi Mei 173HCE, CMN175F, IPS, 1920x1080, 17.3" | Asus ROG Zephyrus S GX701GXR AU Optronics B173HAN05.1, IPS, 1920x1080, 17.3" | |
|---|---|---|---|---|
| Display | 31% | 9% | 8% | |
| Display P3 Coverage (%) | 63.8 | 84.8 33% | 70.8 11% | 70 10% |
| sRGB Coverage (%) | 92.7 | 99.9 8% | 98.5 6% | 96.6 4% |
| AdobeRGB 1998 Coverage (%) | 65.3 | 98.6 51% | 72.2 11% | 72.3 11% |
| Response Times | 5% | -3% | 48% | |
| Response Time Grey 50% / Grey 80% * (ms) | 16 ? | 15.2 ? 5% | 17.2 ? -8% | 5.6 ? 65% |
| Response Time Black / White * (ms) | 11 ? | 10.4 ? 5% | 10.8 ? 2% | 7.6 ? 31% |
| PWM Frequency (Hz) | 26320 ? | |||
| Screen | 4% | 31% | 18% | |
| Brightness middle (cd/m²) | 310 | 346.7 12% | 384.2 24% | 288 -7% |
| Brightness (cd/m²) | 281 | 332 18% | 357 27% | 276 -2% |
| Brightness Distribution (%) | 85 | 91 7% | 90 6% | 93 9% |
| Black Level * (cd/m²) | 0.31 | 0.27 13% | 0.29 6% | 0.24 23% |
| Contrast (:1) | 1000 | 1284 28% | 1325 33% | 1200 20% |
| Colorchecker dE 2000 * | 3.86 | 5.62 -46% | 1.35 65% | 1.92 50% |
| Colorchecker dE 2000 max. * | 7.8 | 9.36 -20% | 3.45 56% | 4.57 41% |
| Greyscale dE 2000 * | 4.48 | 5.5 -23% | 1.2 73% | 3.08 31% |
| Gamma | 2.5 88% | 2.25 98% | 2.23 99% | 2.42 91% |
| CCT | 7542 86% | 6175 105% | 6580 99% | 7055 92% |
| Color Space (Percent of AdobeRGB 1998) (%) | 60 | 87.2 45% | 65.5 9% | 65 8% |
| Color Space (Percent of sRGB) (%) | 93 | 100 8% | 98.5 6% | 96 3% |
| Colorchecker dE 2000 calibrated * | 3.81 | 1.42 | 1.14 | |
| Moyenne finale (programmes/paramètres) | 13% /
10% | 12% /
22% | 25% /
20% |
* ... Moindre est la valeur, meilleures sont les performances
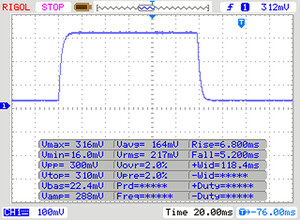
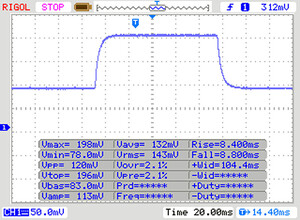
Temps de réponse de l'écran
| ↔ Temps de réponse noir à blanc | ||
|---|---|---|
| 11 ms ... hausse ↗ et chute ↘ combinées | ↗ 6 ms hausse | |
| ↘ 5 ms chute | ||
| L'écran montre de bons temps de réponse, mais insuffisant pour du jeu compétitif. En comparaison, tous les appareils testés affichent entre 0.1 (minimum) et 240 (maximum) ms. » 29 % des appareils testés affichent de meilleures performances. Cela signifie que les latences relevées sont meilleures que la moyenne (20.1 ms) de tous les appareils testés. | ||
| ↔ Temps de réponse gris 50% à gris 80% | ||
| 16 ms ... hausse ↗ et chute ↘ combinées | ↗ 8 ms hausse | |
| ↘ 8 ms chute | ||
| L'écran montre de bons temps de réponse, mais insuffisant pour du jeu compétitif. En comparaison, tous les appareils testés affichent entre 0.165 (minimum) et 636 (maximum) ms. » 29 % des appareils testés affichent de meilleures performances. Cela signifie que les latences relevées sont meilleures que la moyenne (31.5 ms) de tous les appareils testés. | ||
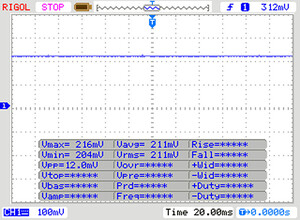
Scintillement / MLI (Modulation de largeur d'impulsion)
| Scintillement / MLI (Modulation de largeur d'impulsion) non décelé | |||
En comparaison, 53 % des appareils testés n'emploient pas MDI pour assombrir leur écran. Nous avons relevé une moyenne à 8053 (minimum : 5 - maximum : 343500) Hz dans le cas où une MDI était active. | |||
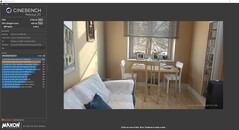
| 3DMark 11 - 1280x720 Performance Physics | |
| Alienware m17 R2 P41E | |
| Lenovo Legion Y740-17IRHg-81UJ001VGE | |
| Razer Blade Pro 17 4K UHD 120 Hz | |
| Moyenne Intel Core i7-9750H (9704 - 14337, n=80) | |
| Asus ROG Zephyrus S GX701GXR | |
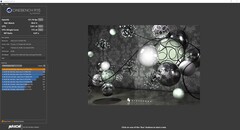
| Blender - v2.79 BMW27 CPU | |
| Moyenne Intel Core i7-9750H (342 - 495, n=21) | |
| Lenovo Legion Y740-17IRHg-81UJ001VGE | |
| Geekbench 4.4 | |
| 64 Bit Single-Core Score | |
| Moyenne Intel Core i7-9750H (4440 - 5511, n=27) | |
| Asus ROG Zephyrus S GX701GXR | |
| Lenovo Legion Y740-17IRHg-81UJ001VGE | |
| 64 Bit Multi-Core Score | |
| Lenovo Legion Y740-17IRHg-81UJ001VGE | |
| Asus ROG Zephyrus S GX701GXR | |
| Moyenne Intel Core i7-9750H (17054 - 25043, n=27) | |
| 7-Zip 18.03 | |
| 7z b 4 | |
| Lenovo Legion Y740-17IRHg-81UJ001VGE | |
| Moyenne Intel Core i7-9750H (28512 - 35174, n=21) | |
| 7z b 4 -mmt1 | |
| Moyenne Intel Core i7-9750H (4580 - 5090, n=21) | |
| Lenovo Legion Y740-17IRHg-81UJ001VGE | |
* ... Moindre est la valeur, meilleures sont les performances
| PCMark 8 Home Score Accelerated v2 | 5539 points | |
| PCMark 8 Creative Score Accelerated v2 | 8491 points | |
| PCMark 8 Work Score Accelerated v2 | 5949 points | |
| PCMark 10 Score | 5922 points | |
Aide | ||
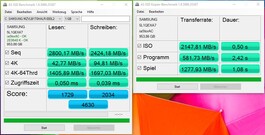
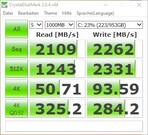
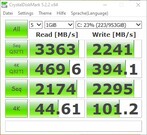
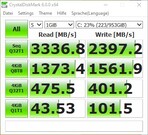
| Lenovo Legion Y740-17IRHg-81UJ001VGE Samsung SSD PM981 MZVLB1T0HALR | Razer Blade Pro 17 4K UHD 120 Hz Samsung SSD PM981 MZVLB1T0HALR | Alienware m17 R2 P41E 2x SK Hynix PC601 NVMe 512 GB (RAID 0) | Asus ROG Zephyrus S GX701GXR Samsung SSD PM981 MZVLB1T0HALR | Moyenne Samsung SSD PM981 MZVLB1T0HALR | Moyenne de la classe Gaming | |
|---|---|---|---|---|---|---|
| AS SSD | -10% | -25% | -7% | -5% | 53% | |
| Seq Read (MB/s) | 2800 | 1881 -33% | 1938 -31% | 1662 -41% | 1993 ? -29% | 5323 ? 90% |
| Seq Write (MB/s) | 2424 | 2354 -3% | 2094 -14% | 2266 -7% | 2036 ? -16% | 3893 ? 61% |
| 4K Read (MB/s) | 42.77 | 43.42 2% | 25.88 -39% | 46.86 10% | 46.4 ? 8% | 69.1 ? 62% |
| 4K Write (MB/s) | 94.8 | 104.1 10% | 100.8 6% | 101.1 7% | 109.7 ? 16% | 215 ? 127% |
| 4K-64 Read (MB/s) | 1406 | 1805 28% | 1217 -13% | 1419 1% | 1502 ? 7% | 1715 ? 22% |
| 4K-64 Write (MB/s) | 1697 | 1775 5% | 1137 -33% | 1746 3% | 1625 ? -4% | 2857 ? 68% |
| Access Time Read * (ms) | 0.05 | 0.049 2% | 0.051 -2% | 0.047 6% | 0.05158 ? -3% | 0.05906 ? -18% |
| Access Time Write * (ms) | 0.039 | 0.106 -172% | 0.107 -174% | 0.037 5% | 0.05581 ? -43% | 0.03713 ? 5% |
| Score Read (Points) | 1729 | 2037 18% | 1437 -17% | 1632 -6% | 1747 ? 1% | 2315 ? 34% |
| Score Write (Points) | 2034 | 2115 4% | 1447 -29% | 2074 2% | 1942 ? -5% | 3461 ? 70% |
| Score Total (Points) | 4630 | 5215 13% | 3624 -22% | 4576 -1% | 4588 ? -1% | 6896 ? 49% |
| Copy ISO MB/s (MB/s) | 2148 | 1877 -13% | 1926 -10% | 1398 -35% | 2280 ? 6% | 3002 ? 40% |
| Copy Program MB/s (MB/s) | 582 | 539 -7% | 626 8% | 438.9 -25% | 558 ? -4% | 962 ? 65% |
| Copy Game MB/s (MB/s) | 1278 | 1368 7% | 1533 20% | 996 -22% | 1302 ? 2% | 2090 ? 64% |
* ... Moindre est la valeur, meilleures sont les performances
| 3DMark 11 Performance | 20810 points | |
| 3DMark Ice Storm Standard Score | 181500 points | |
| 3DMark Cloud Gate Standard Score | 38493 points | |
| 3DMark Fire Strike Score | 16706 points | |
| 3DMark Fire Strike Extreme Score | 8320 points | |
| 3DMark Time Spy Score | 7475 points | |
Aide | ||
| The Witcher 3 | |
| 1920x1080 High Graphics & Postprocessing (Nvidia HairWorks Off) | |
| Moyenne de la classe Gaming (138 - 424, n=29, 2 dernières années) | |
| Razer Blade Pro 17 4K UHD 120 Hz | |
| Asus ROG Zephyrus S GX701GXR | |
| Alienware m17 R2 P41E | |
| Lenovo Legion Y740-17IRHg-81UJ001VGE | |
| Moyenne NVIDIA GeForce RTX 2080 Max-Q (117.3 - 179.9, n=19) | |
| 1920x1080 Ultra Graphics & Postprocessing (HBAO+) | |
| Moyenne de la classe Gaming (18.4 - 240, n=46, 2 dernières années) | |
| Razer Blade Pro 17 4K UHD 120 Hz | |
| Lenovo Legion Y740-17IRHg-81UJ001VGE | |
| Asus ROG Zephyrus S GX701GXR | |
| Moyenne NVIDIA GeForce RTX 2080 Max-Q (65.7 - 92.7, n=22) | |
| Alienware m17 R2 P41E | |
| Bas | Moyen | Élevé | Ultra | |
|---|---|---|---|---|
| BioShock Infinite (2013) | 330 | 295 | 278 | 166 |
| GTA V (2015) | 171 | 166 | 144 | 77.2 |
| The Witcher 3 (2015) | 299 | 234 | 145 | 81 |
| Dota 2 Reborn (2015) | 144.9 | 132.2 | 126.4 | 119.6 |
| Rise of the Tomb Raider (2016) | 246 | 185 | 139 | 126 |
| X-Plane 11.11 (2018) | 108 | 97.4 | 81.6 | |
| Metro Exodus (2019) | 150 | 97 | 75 | 59 |
Degré de la nuisance sonore
| Au repos |
| 30.3 / 30.3 / 30.5 dB(A) |
| Fortement sollicité |
| 40.8 / 40.8 dB(A) |
 | ||
30 dB silencieux 40 dB(A) audible 50 dB(A) bruyant |
||
min: | ||
(±) La température maximale du côté supérieur est de 40.7 °C / 105 F, par rapport à la moyenne de 40.4 °C / 105 F, allant de 21.2 à 68.8 °C pour la classe Gaming.
(±) Le fond chauffe jusqu'à un maximum de 42.2 °C / 108 F, contre une moyenne de 43.3 °C / 110 F
(+) En utilisation inactive, la température moyenne du côté supérieur est de 28.6 °C / 83 F, par rapport à la moyenne du dispositif de 33.9 °C / 93 F.
(±) En jouant à The Witcher 3, la température moyenne du côté supérieur est de 33.1 °C / 92 F, alors que la moyenne de l'appareil est de 33.9 °C / 93 F.
(+) Les repose-poignets et le pavé tactile sont plus froids que la température de la peau avec un maximum de 30 °C / 86 F et sont donc froids au toucher.
(±) La température moyenne de la zone de l'appui-paume de dispositifs similaires était de 28.8 °C / 83.8 F (-1.2 °C / #-2.2 F).
Lenovo Legion Y740-17IRHg-81UJ001VGE analyse audio
(-) | haut-parleurs pas très forts (69.2 dB)
Basses 100 - 315 Hz
(±) | basse réduite - en moyenne 6.3% inférieure à la médiane
(±) | la linéarité des basses est moyenne (11% delta à la fréquence précédente)
Médiums 400 - 2000 Hz
(+) | médiane équilibrée - seulement 3.8% de la médiane
(±) | la linéarité des médiums est moyenne (8.3% delta à la fréquence précédente)
Aiguës 2 - 16 kHz
(+) | des sommets équilibrés - à seulement 2.5% de la médiane
(±) | la linéarité des aigus est moyenne (7% delta à la fréquence précédente)
Globalement 100 - 16 000 Hz
(+) | le son global est linéaire (14.9% différence à la médiane)
Par rapport à la même classe
» 30% de tous les appareils testés de cette catégorie étaient meilleurs, 7% similaires, 64% pires
» Le meilleur avait un delta de 6%, la moyenne était de 18%, le pire était de 132%.
Par rapport à tous les appareils testés
» 20% de tous les appareils testés étaient meilleurs, 4% similaires, 76% pires
» Le meilleur avait un delta de 4%, la moyenne était de 24%, le pire était de 134%.
Asus ROG Zephyrus S GX701GXR analyse audio
(+) | les haut-parleurs peuvent jouer relativement fort (83# dB)
Basses 100 - 315 Hz
(±) | basse réduite - en moyenne 10.3% inférieure à la médiane
(±) | la linéarité des basses est moyenne (11.1% delta à la fréquence précédente)
Médiums 400 - 2000 Hz
(+) | médiane équilibrée - seulement 2.6% de la médiane
(+) | les médiums sont linéaires (4.3% delta à la fréquence précédente)
Aiguës 2 - 16 kHz
(+) | des sommets équilibrés - à seulement 3.3% de la médiane
(+) | les aigus sont linéaires (4.1% delta à la fréquence précédente)
Globalement 100 - 16 000 Hz
(+) | le son global est linéaire (12.5% différence à la médiane)
Par rapport à la même classe
» 15% de tous les appareils testés de cette catégorie étaient meilleurs, 3% similaires, 82% pires
» Le meilleur avait un delta de 6%, la moyenne était de 18%, le pire était de 132%.
Par rapport à tous les appareils testés
» 10% de tous les appareils testés étaient meilleurs, 2% similaires, 87% pires
» Le meilleur avait un delta de 4%, la moyenne était de 24%, le pire était de 134%.
| Éteint/en veille | |
| Au repos | |
| Fortement sollicité |
|
Légende:
min: | |
Points positifs
Points négatifs
Verdict
Le Lenovo Legion Y740-17 est un PC portable de jeu bien équipé et au placement tarifaire raisonnable. Les appareils comparables avec des spécifications similaires coûtent généralement plus de 3 000 €, alors que notre Legion Y740-17 peut être trouvé à environ 2 700 €. Pour ce prix, on aura un PC portable visuellement réussi, avec rétroéclairage RVB élégant. Mais le principal restent les composants. L’Intel Core i7-9750H est un choix sécurisé, et ce processeur six cœurs fournit de bonnes performances. La Nvidia GeForce RTX 2080 Max-Q a été choisie comme carte graphique, et avec ce processeur, même les jeux les plus récents tournent fluidement. L’écran, FHD et 144 Hz, avec G-Sync, montre que Lenovo a conçu l’appareil en pensant avant tout aux joueurs. Mais il s’avèrera également un bon choix pour un peu d’édition photo.
Le Lenovo Legion Y740-17 est un bon PC portable de jeu, qui vaut que l’on s’y attarde.
Le Lenovo Legion Y740-17 est un bon portable de jeu avec seulement quelques faiblesses mineures. L’autonomie par exemple est inférieure à la moyenne, et le touchpad aurait pu être un peu plus grand. Concernant les performances brutes, le Lenovo Legion Y740-17 a montré dans nos tests qu’il pouvait tenir tête à la concurrence.
La sélection des ports est des plus ordinaires, mais un DisplayPort grand format aurait été un bon ajout, qui aurait permis de se passer de câbles et adaptateurs supplémentaires.
L’intégralité de cette critique est disponible en anglais en suivant ce lien.
Lenovo Legion Y740-17IRHg-81UJ001VGE
- 03/26/2020 v7 (old)
Sebastian Bade


