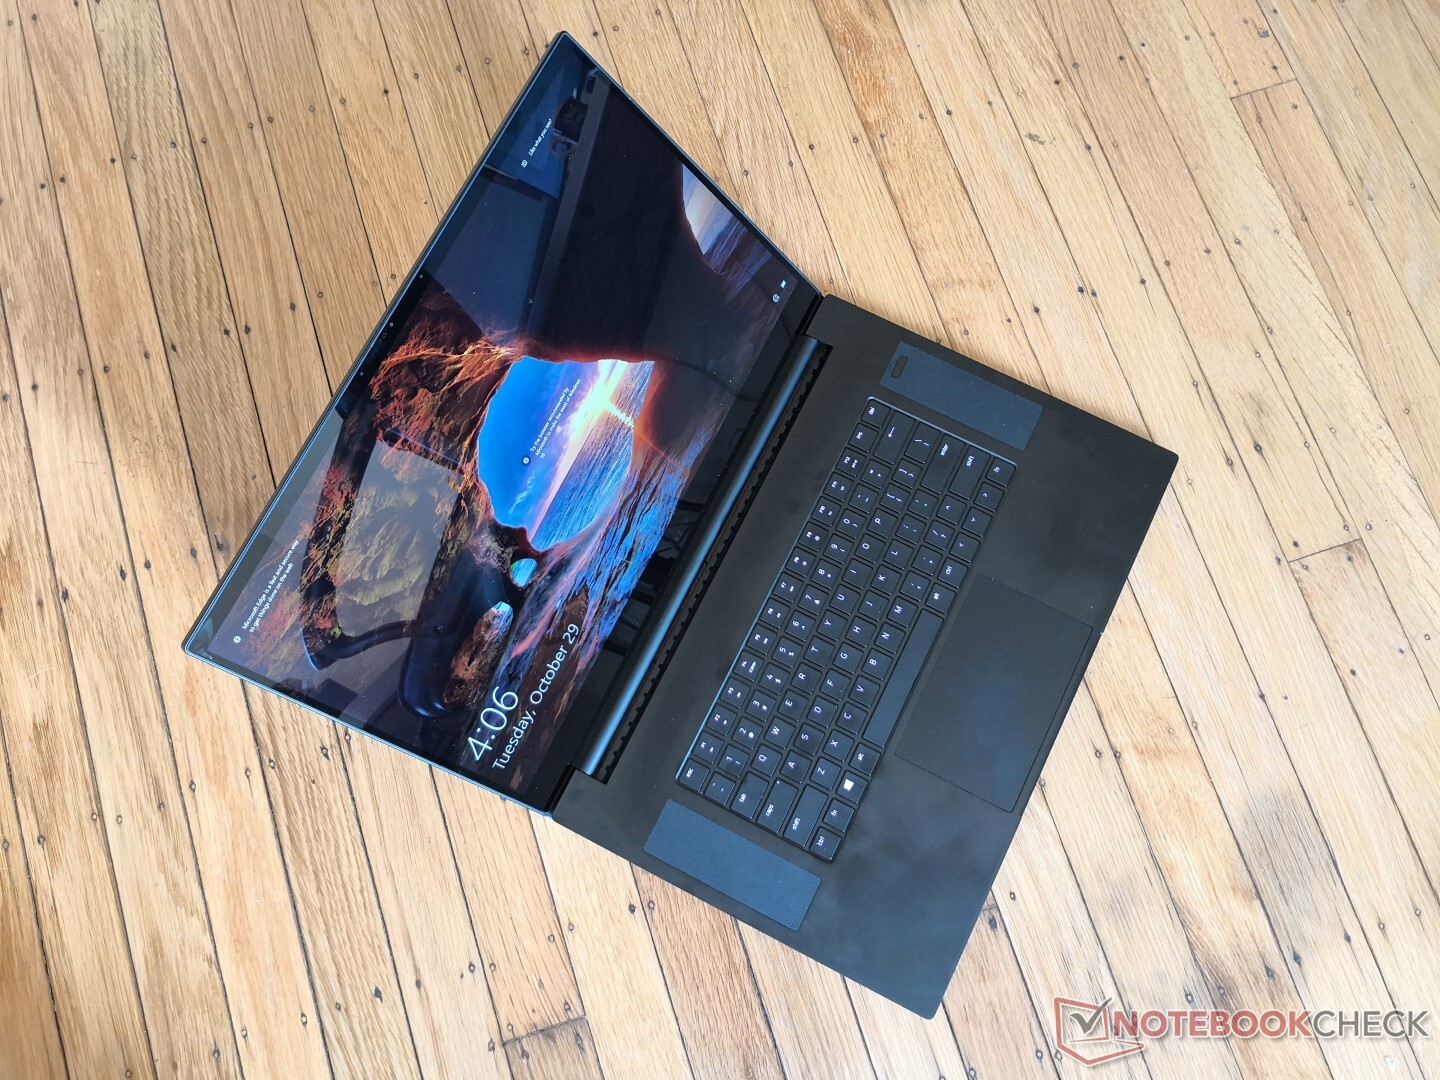
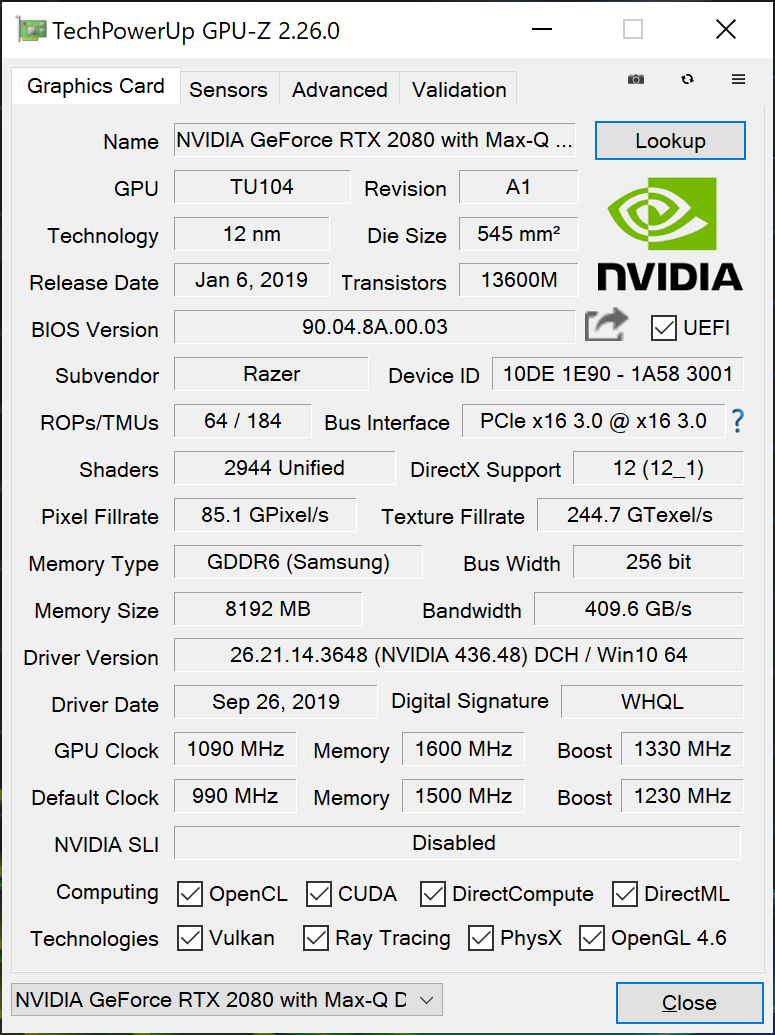
Test du Razer Blade Pro 17 (i7-9750H, RTX 2080 Max-Q, 4K UHD 120 Hz) : écran 4K de 17 pouces sans ghosting
Note | Date | Modèle | Poids | Épaisseur | Taille | Résolution | Prix |
|---|---|---|---|---|---|---|---|
| 86.7 % v7 (old) | 11/19 | Razer Blade Pro 17 4K UHD 120 Hz i7-9750H, GeForce RTX 2080 Max-Q | 2.8 kg | 19.9 mm | 17.30" | 3840x2160 | |
| 82.9 % v7 (old) | 07/19 | MSI GS75 Stealth 9SG i7-9750H, GeForce RTX 2080 Max-Q | 2.3 kg | 18.9 mm | 17.30" | 1920x1080 | |
| 85.6 % v6 (old) | 03/19 | Asus Zephyrus S GX701GX i7-8750H, GeForce RTX 2080 Max-Q | 2.6 kg | 19 mm | 17.30" | 1920x1080 | |
| 83.2 % v7 (old) | 10/19 | Lenovo Legion Y740-17IRH i7-9750H, GeForce RTX 2060 Mobile | 3 kg | 23 mm | 17.30" | 1920x1080 | |
| 86.1 % v7 (old) | 09/19 | Gigabyte Aero 17 XA RP77 i9-9980HK, GeForce RTX 2070 Max-Q | 2.5 kg | 21.4 mm | 17.30" | 3840x2160 |
| SD Card Reader | |
| average JPG Copy Test (av. of 3 runs) | |
| Gigabyte Aero 17 XA RP77 (Toshiba Exceria Pro SDXC 64 GB UHS-II) | |
| Eurocom Nightsky RX15 (Toshiba Exceria Pro SDXC 64 GB UHS-II) | |
| Razer Blade Pro 17 4K UHD 120 Hz (Toshiba Exceria Pro SDXC 64 GB UHS-II) | |
| Razer Blade Pro 2017 (Toshiba Exceria Pro SDXC 64 GB UHS-II) | |
| HP Pavilion Gaming 15-ec0017ng (Toshiba Exceria Pro SDXC 64 GB UHS-II) | |
| maximum AS SSD Seq Read Test (1GB) | |
| Gigabyte Aero 17 XA RP77 (Toshiba Exceria Pro SDXC 64 GB UHS-II) | |
| Eurocom Nightsky RX15 (Toshiba Exceria Pro SDXC 64 GB UHS-II) | |
| Razer Blade Pro 17 4K UHD 120 Hz (Toshiba Exceria Pro SDXC 64 GB UHS-II) | |
| Razer Blade Pro 2017 (Toshiba Exceria Pro SDXC 64 GB UHS-II) | |
| HP Pavilion Gaming 15-ec0017ng (Toshiba Exceria Pro SDXC 64 GB UHS-II) | |
| |||||||||||||||||||||||||
Homogénéité de la luminosité: 91 %
Valeur mesurée au centre, sur batterie: 346.7 cd/m²
Contraste: 1284:1 (Valeurs des noirs: 0.27 cd/m²)
ΔE ColorChecker Calman: 5.62 | ∀{0.5-29.43 Ø4.73}
calibrated: 3.81
ΔE Greyscale Calman: 5.5 | ∀{0.09-98 Ø4.97}
100% sRGB (Argyll 1.6.3 3D)
87.2% AdobeRGB 1998 (Argyll 1.6.3 3D)
98.6% AdobeRGB 1998 (Argyll 3D)
99.9% sRGB (Argyll 3D)
84.8% Display P3 (Argyll 3D)
Gamma: 2.25
CCT: 6175 K
| Razer Blade Pro 17 4K UHD 120 Hz AU Optronics B173ZAN03.3, IPS, 17.3", 3840x2160 | Razer Blade Pro 17 RTX 2080 Max-Q AU Optronics B173HAN04.0, IPS, 17.3", 1920x1080 | Razer Blade Pro 2017 Sharp LQ173D1JW33 (SHP145A), IGZO, 17.3", 3840x2160 | Gigabyte Aero 17 XA RP77 AU Optronics B173ZAN03.2, IPS, 17.3", 3840x2160 | Dell XPS 15 7590 9980HK GTX 1650 Samsung 156WR04, SDCA029, OLED, 15.6", 3840x2160 | MSI P65 Creator 9SF-657 AU Optronics AUO41EB, IPS, 15.6", 3840x2160 | |
|---|---|---|---|---|---|---|
| Display | -26% | 2% | 1% | -1% | 0% | |
| Display P3 Coverage (%) | 84.8 | 60.6 -29% | 88.9 5% | 86.8 2% | 88.1 4% | 84.4 0% |
| sRGB Coverage (%) | 99.9 | 89 -11% | 100 0% | 100 0% | 99.6 0% | 100 0% |
| AdobeRGB 1998 Coverage (%) | 98.6 | 62.1 -37% | 99.7 1% | 99.5 1% | 91.8 -7% | 98.5 0% |
| Response Times | 32% | -285% | -196% | 81% | -217% | |
| Response Time Grey 50% / Grey 80% * (ms) | 15.2 ? | 6.8 ? 55% | 60.8 ? -300% | 45.6 ? -200% | 2.3 ? 85% | 51 ? -236% |
| Response Time Black / White * (ms) | 10.4 ? | 9.6 ? 8% | 38.4 ? -269% | 30.4 ? -192% | 2.4 ? 77% | 31 ? -198% |
| PWM Frequency (Hz) | 204.9 ? | 59.5 ? | ||||
| Screen | 6% | -6% | 25% | 7% | -1% | |
| Brightness middle (cd/m²) | 346.7 | 299.3 -14% | 230 -34% | 667.3 92% | 421.2 21% | 445 28% |
| Brightness (cd/m²) | 332 | 294 -11% | 207 -38% | 633 91% | 417 26% | 462 39% |
| Brightness Distribution (%) | 91 | 94 3% | 83 -9% | 90 -1% | 94 3% | 83 -9% |
| Black Level * (cd/m²) | 0.27 | 0.29 -7% | 0.2 26% | 0.46 -70% | 0.5 -85% | |
| Contrast (:1) | 1284 | 1032 -20% | 1150 -10% | 1451 13% | 890 -31% | |
| Colorchecker dE 2000 * | 5.62 | 2.55 55% | 5.62 -0% | 3.53 37% | 6.06 -8% | 4.75 15% |
| Colorchecker dE 2000 max. * | 9.36 | 4.73 49% | 10.24 -9% | 6.88 26% | 11.89 -27% | 7.79 17% |
| Colorchecker dE 2000 calibrated * | 3.81 | 2.9 24% | 3.79 1% | |||
| Greyscale dE 2000 * | 5.5 | 3.5 36% | 4.54 17% | 0.9 84% | 2.8 49% | 4.49 18% |
| Gamma | 2.25 98% | 2.28 96% | 2.36 93% | 2.17 101% | 2.15 102% | 2.49 88% |
| CCT | 6175 105% | 7101 92% | 6625 98% | 6533 99% | 6235 104% | 7374 88% |
| Color Space (Percent of AdobeRGB 1998) (%) | 87.2 | 57 -35% | 88 1% | 87.1 0% | 81 -7% | 87 0% |
| Color Space (Percent of sRGB) (%) | 100 | 88.7 -11% | 100 0% | 100 0% | 99.6 0% | 100 0% |
| Moyenne finale (programmes/paramètres) | 4% /
3% | -96% /
-41% | -57% /
-7% | 29% /
17% | -73% /
-29% |
* ... Moindre est la valeur, meilleures sont les performances
Temps de réponse de l'écran
| ↔ Temps de réponse noir à blanc | ||
|---|---|---|
| 10.4 ms ... hausse ↗ et chute ↘ combinées | ↗ 5.2 ms hausse | 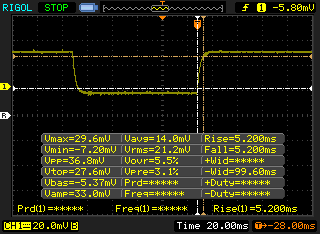 |
| ↘ 5.2 ms chute | ||
| L'écran montre de bons temps de réponse, mais insuffisant pour du jeu compétitif. En comparaison, tous les appareils testés affichent entre 0.1 (minimum) et 240 (maximum) ms. » 28 % des appareils testés affichent de meilleures performances. Cela signifie que les latences relevées sont meilleures que la moyenne (19.9 ms) de tous les appareils testés. | ||
| ↔ Temps de réponse gris 50% à gris 80% | ||
| 15.2 ms ... hausse ↗ et chute ↘ combinées | ↗ 8.4 ms hausse | 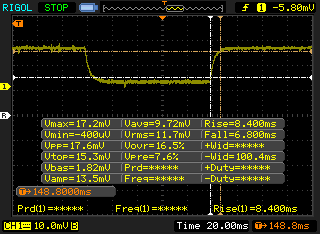 |
| ↘ 6.8 ms chute | ||
| L'écran montre de bons temps de réponse, mais insuffisant pour du jeu compétitif. En comparaison, tous les appareils testés affichent entre 0.165 (minimum) et 636 (maximum) ms. » 29 % des appareils testés affichent de meilleures performances. Cela signifie que les latences relevées sont meilleures que la moyenne (31.1 ms) de tous les appareils testés. | ||
Scintillement / MLI (Modulation de largeur d'impulsion)
| Scintillement / MLI (Modulation de largeur d'impulsion) non décelé | 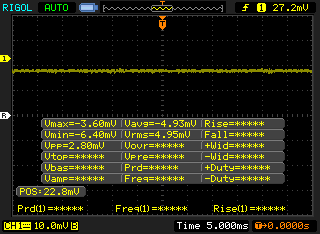 | ||
En comparaison, 52 % des appareils testés n'emploient pas MDI pour assombrir leur écran. Nous avons relevé une moyenne à 7798 (minimum : 5 - maximum : 343500) Hz dans le cas où une MDI était active. | |||

| Cinebench R11.5 | |
| CPU Single 64Bit | |
| Corsair One i160 | |
| MSI GE75 9SG | |
| Moyenne Intel Core i7-9750H (1.96 - 2.19, n=10) | |
| Razer Blade Pro 2017 | |
| CPU Multi 64Bit | |
| Corsair One i160 | |
| MSI GE75 9SG | |
| Moyenne Intel Core i7-9750H (11.3 - 14.1, n=10) | |
| Razer Blade Pro 2017 | |
| Cinebench R10 | |
| Rendering Multiple CPUs 32Bit | |
| Corsair One i160 | |
| Eurocom Nightsky RX15 | |
| MSI GE75 9SG | |
| Moyenne Intel Core i7-9750H (28251 - 36304, n=13) | |
| HP Pavilion Gaming 15-ec0017ng | |
| Rendering Single 32Bit | |
| Eurocom Nightsky RX15 | |
| Corsair One i160 | |
| MSI GE75 9SG | |
| Moyenne Intel Core i7-9750H (6659 - 7214, n=13) | |
| HP Pavilion Gaming 15-ec0017ng | |
| wPrime 2.10 - 1024m | |
| Moyenne Intel Core i7-9750H (n=1) | |
| MSI GE75 9SG | |
| Eurocom Nightsky RX15 | |
| Corsair One i160 | |
* ... Moindre est la valeur, meilleures sont les performances
| PCMark 8 Home Score Accelerated v2 | 4255 points | |
| PCMark 8 Work Score Accelerated v2 | 4755 points | |
| PCMark 10 Score | 6202 points | |
Aide | ||
| Razer Blade Pro 17 4K UHD 120 Hz Samsung SSD PM981 MZVLB1T0HALR | Razer Blade Pro 17 RTX 2080 Max-Q Samsung SSD PM981 MZVLB512HAJQ | Razer Blade Pro 17 RTX 2060 Samsung SSD PM981 MZVLB512HAJQ | Razer Blade Pro 2017 2x Samsung SSD PM951 MZVLV256HCHP (RAID 0) | MSI GS75 Stealth 9SG 2x Samsung SSD PM981 MZVLB1T0HALR (RAID 0) | Asus Zephyrus S GX701GX Samsung SSD PM981 MZVLB1T0HALR | |
|---|---|---|---|---|---|---|
| AS SSD | -11% | -6% | -22% | -3% | -4% | |
| Seq Read (MB/s) | 1881 | 1831 -3% | 1810 -4% | 2599 38% | 2855 52% | 911 -52% |
| Seq Write (MB/s) | 2354 | 1744 -26% | 1797 -24% | 588 -75% | 2687 14% | 2347 0% |
| 4K Read (MB/s) | 43.42 | 45.16 4% | 48.43 12% | 37.57 -13% | 30.31 -30% | 53 22% |
| 4K Write (MB/s) | 104.1 | 107.1 3% | 106 2% | 104.4 0% | 96.3 -7% | 122.5 18% |
| 4K-64 Read (MB/s) | 1805 | 1240 -31% | 1156 -36% | 1116 -38% | 1460 -19% | 1577 -13% |
| 4K-64 Write (MB/s) | 1775 | 1695 -5% | 1748 -2% | 513 -71% | 1224 -31% | 1734 -2% |
| Access Time Read * (ms) | 0.049 | 0.064 -31% | 0.057 -16% | 0.051 -4% | 0.054 -10% | 0.08 -63% |
| Access Time Write * (ms) | 0.106 | 0.037 65% | 0.035 67% | 0.036 66% | 0.038 64% | 0.031 71% |
| Score Read (Points) | 2037 | 1468 -28% | 1385 -32% | 1414 -31% | 1776 -13% | 1721 -16% |
| Score Write (Points) | 2115 | 1977 -7% | 2033 -4% | 676 -68% | 1589 -25% | 2091 -1% |
| Score Total (Points) | 5215 | 4197 -20% | 4135 -21% | 2715 -48% | 4259 -18% | 4771 -9% |
| Copy ISO MB/s (MB/s) | 1877 | 2086 11% | 1984 6% | 2226 19% | ||
| Copy Program MB/s (MB/s) | 539 | 425.5 -21% | 588 9% | 426.4 -21% | ||
| Copy Game MB/s (MB/s) | 1368 | 555 -59% | 835 -39% | 1152 -16% |
* ... Moindre est la valeur, meilleures sont les performances

| 3DMark 11 Performance | 22165 points | |
| 3DMark Cloud Gate Standard Score | 38524 points | |
| 3DMark Fire Strike Score | 18629 points | |
| 3DMark Time Spy Score | 7973 points | |
Aide | ||
| Bas | Moyen | Élevé | Ultra | 4K | |
|---|---|---|---|---|---|
| BioShock Infinite (2013) | 349.6 | 311.9 | 284.1 | 189.5 | |
| The Witcher 3 (2015) | 325 | 258.7 | 179.9 | 92.7 | 65.5 |
| Shadow of the Tomb Raider (2018) | 132 | 118 | 111 | 105 | 40 |
(±) En jouant à The Witcher 3, la température moyenne du côté supérieur est de 35.6 °C / 96 F, alors que la moyenne de l'appareil est de 33.9 °C / 93 F.
(+) Les repose-poignets et le pavé tactile atteignent la température maximale de la peau (34 °C / 93.2 F) et ne sont donc pas chauds.
(-) La température moyenne de la zone de l'appui-paume de dispositifs similaires était de 28.8 °C / 83.8 F (-5.2 °C / #-9.4 F).
| Éteint/en veille | |
| Au repos | |
| Fortement sollicité |
|
Légende:
min: | |
| Razer Blade Pro 17 4K UHD 120 Hz i7-9750H, GeForce RTX 2080 Max-Q, Samsung SSD PM981 MZVLB1T0HALR, IPS, 3840x2160, 17.3" | Razer Blade Pro 17 RTX 2080 Max-Q i7-9750H, GeForce RTX 2080 Max-Q, Samsung SSD PM981 MZVLB512HAJQ, IPS, 1920x1080, 17.3" | Razer Blade Pro 17 RTX 2060 i7-9750H, GeForce RTX 2060 Mobile, Samsung SSD PM981 MZVLB512HAJQ, IPS, 1920x1080, 17.3" | Razer Blade Pro 2017 i7-7820HK, GeForce GTX 1080 Mobile, 2x Samsung SSD PM951 MZVLV256HCHP (RAID 0), IGZO, 3840x2160, 17.3" | MSI GS75 Stealth 9SG i7-9750H, GeForce RTX 2080 Max-Q, 2x Samsung SSD PM981 MZVLB1T0HALR (RAID 0), IPS, 1920x1080, 17.3" | Asus Zephyrus S GX701GX i7-8750H, GeForce RTX 2080 Max-Q, Samsung SSD PM981 MZVLB1T0HALR, IPS, 1920x1080, 17.3" | |
|---|---|---|---|---|---|---|
| Power Consumption | 26% | 25% | -2% | 30% | 24% | |
| Idle Minimum * (Watt) | 34.2 | 16.2 53% | 16 53% | 31 9% | 13 62% | 19 44% |
| Idle Average * (Watt) | 37.2 | 20.4 45% | 21.7 42% | 36 3% | 17 54% | 22 41% |
| Idle Maximum * (Watt) | 50 | 26.1 48% | 26.1 48% | 44 12% | 25 50% | 30 40% |
| Load Average * (Watt) | 106.1 | 96.5 9% | 105.6 -0% | 107 -1% | 96 10% | 104 2% |
| Witcher 3 ultra * (Watt) | 178.7 | 182.9 -2% | 161.8 9% | 212 -19% | 156 13% | 167 7% |
| Load Maximum * (Watt) | 223.6 | 214.3 4% | 225.3 -1% | 258 -15% | 239 -7% | 203 9% |
* ... Moindre est la valeur, meilleures sont les performances
| Razer Blade Pro 17 4K UHD 120 Hz i7-9750H, GeForce RTX 2080 Max-Q, 70 Wh | Razer Blade Pro 17 RTX 2080 Max-Q i7-9750H, GeForce RTX 2080 Max-Q, 70 Wh | Razer Blade Pro 17 RTX 2060 i7-9750H, GeForce RTX 2060 Mobile, 70 Wh | Razer Blade Pro 2017 i7-7820HK, GeForce GTX 1080 Mobile, 99 Wh | MSI GS75 Stealth 9SG i7-9750H, GeForce RTX 2080 Max-Q, 80.25 Wh | Asus Zephyrus S GX701GX i7-8750H, GeForce RTX 2080 Max-Q, 76 Wh | |
|---|---|---|---|---|---|---|
| Autonomie de la batterie | 27% | 22% | -11% | 62% | 3% | |
| WiFi v1.3 (h) | 3.7 | 4.7 27% | 4.5 22% | 3.3 -11% | 6 62% | 3.8 3% |
| Reader / Idle (h) | 4.9 | 4.2 | 7.7 | 5 | ||
| Load (h) | 1.4 | 1.4 | 1.2 | 0.9 |
Points positifs
Points négatifs
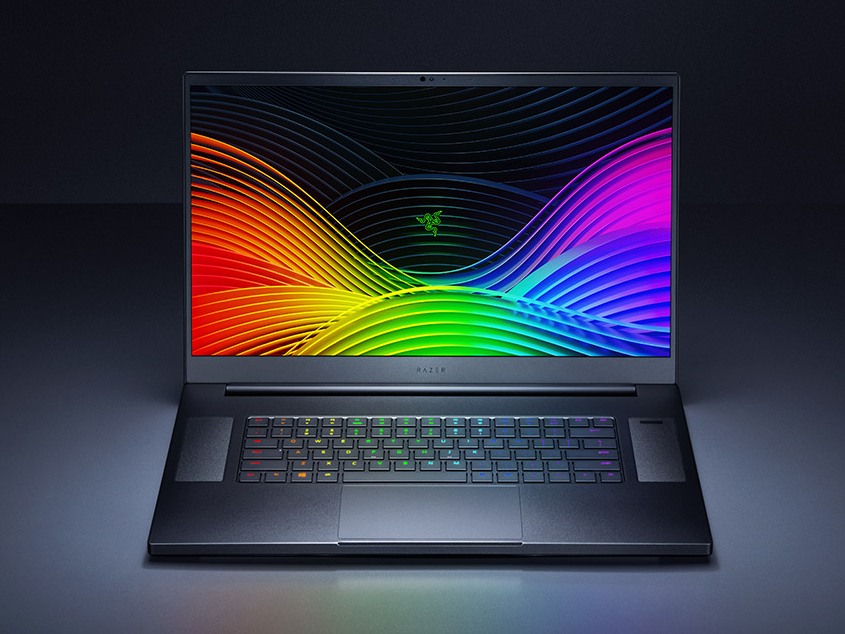
Le jeu n’a jamais semblé plus fluide ni plus net sur un portable de 17,3 pouces qu’avec la dalle ici présente. Avant, le jeu sur un écran 4K d’une telle taille aurait souffert de mauvais temps de réponse, d’une limite à 60 Hz, et d’un ghosting visible. La nouvelle dalle 120 Hz du Razer corrige tous ces défauts. Gardez à l’esprit qu’il n’est pas nécessaire d’atteindre 120 IPS stables pour exploiter les avantages d’une dalle 120 Hz, et nous nous attendons à ce que les portables de 17,3 pouces concurrents se mettent à proposer des versions 4K 120 Hz similaires dans le futur. Mais pour l’instant, le Razer Blade Pro 17 est le seul appareil à proposer une telle dalle.
Néanmoins, les petits bugs rencontrés avec la machine ont un peu gâché l’expérience globale. Les logiciels ou utilisations classiques comme GeForce Expérience ou la bascule graphique devraient marcher du premier coup, surtout sur une machine à 3 700 €. Ces problèmes devraient heureusement être des problèmes logiciels et non matériels, que nous espérons voir corrigés rapidement.
Nous aurions apprécié avoir le G-Sync sur des versions futures, qui se couplerait très bien avec la dalle 4K. La bascule graphique manuelle permet d’avoir à la fois Optimus et G-Sync, à la façon de certains Asus Zephyrus.
Pour la première fois, nous avons une expérience de jeu 4K fluide et sans ghosting sur un portable de 17,3 pouces à 120 Hz. La correction de quelques bugs qui ternissent l’ensemble et l’intégration du G-Sync sont les éléments à ajuster pour la prochaine version…
L’intégralité de cette critique est disponible en anglais en suivant ce lien.
Razer Blade Pro 17 4K UHD 120 Hz
- 10/31/2019 v7 (old)
Allen Ngo
Price comparison
