Notebookcheck Logo

Test du Zotac Magnus One avec Core i7 et GeForce RTX 3070

Système de jeu compact ! Depuis un certain temps, Zotac propose des ordinateurs très compacts. Avec la série Magnus One, il y a maintenant un autre représentant en matière de systèmes de jeu compacts. Les performances n'ont pas été négligées, puisque la GeForce RTX 3070 est une carte graphique de bureau à part entière avec beaucoup de puissance. Cet examen du Magnus One de Zotac vous révélera tout ce que le système a à offrir.

Avec la nouvelle série Magnus One, Zotac introduit un autre ordinateur de jeu compact dans son portefeuille. Cependant, il convient de mentionner dès le départ que le Zotac Magnus One est un système barebone. Cela signifie que la RAM, le stockage de masse et le système d'exploitation doivent être achetés séparément. Une approche similaire est adoptée par Zotac avec son ZBOX Magnus, qui est encore plus compact, cependant.

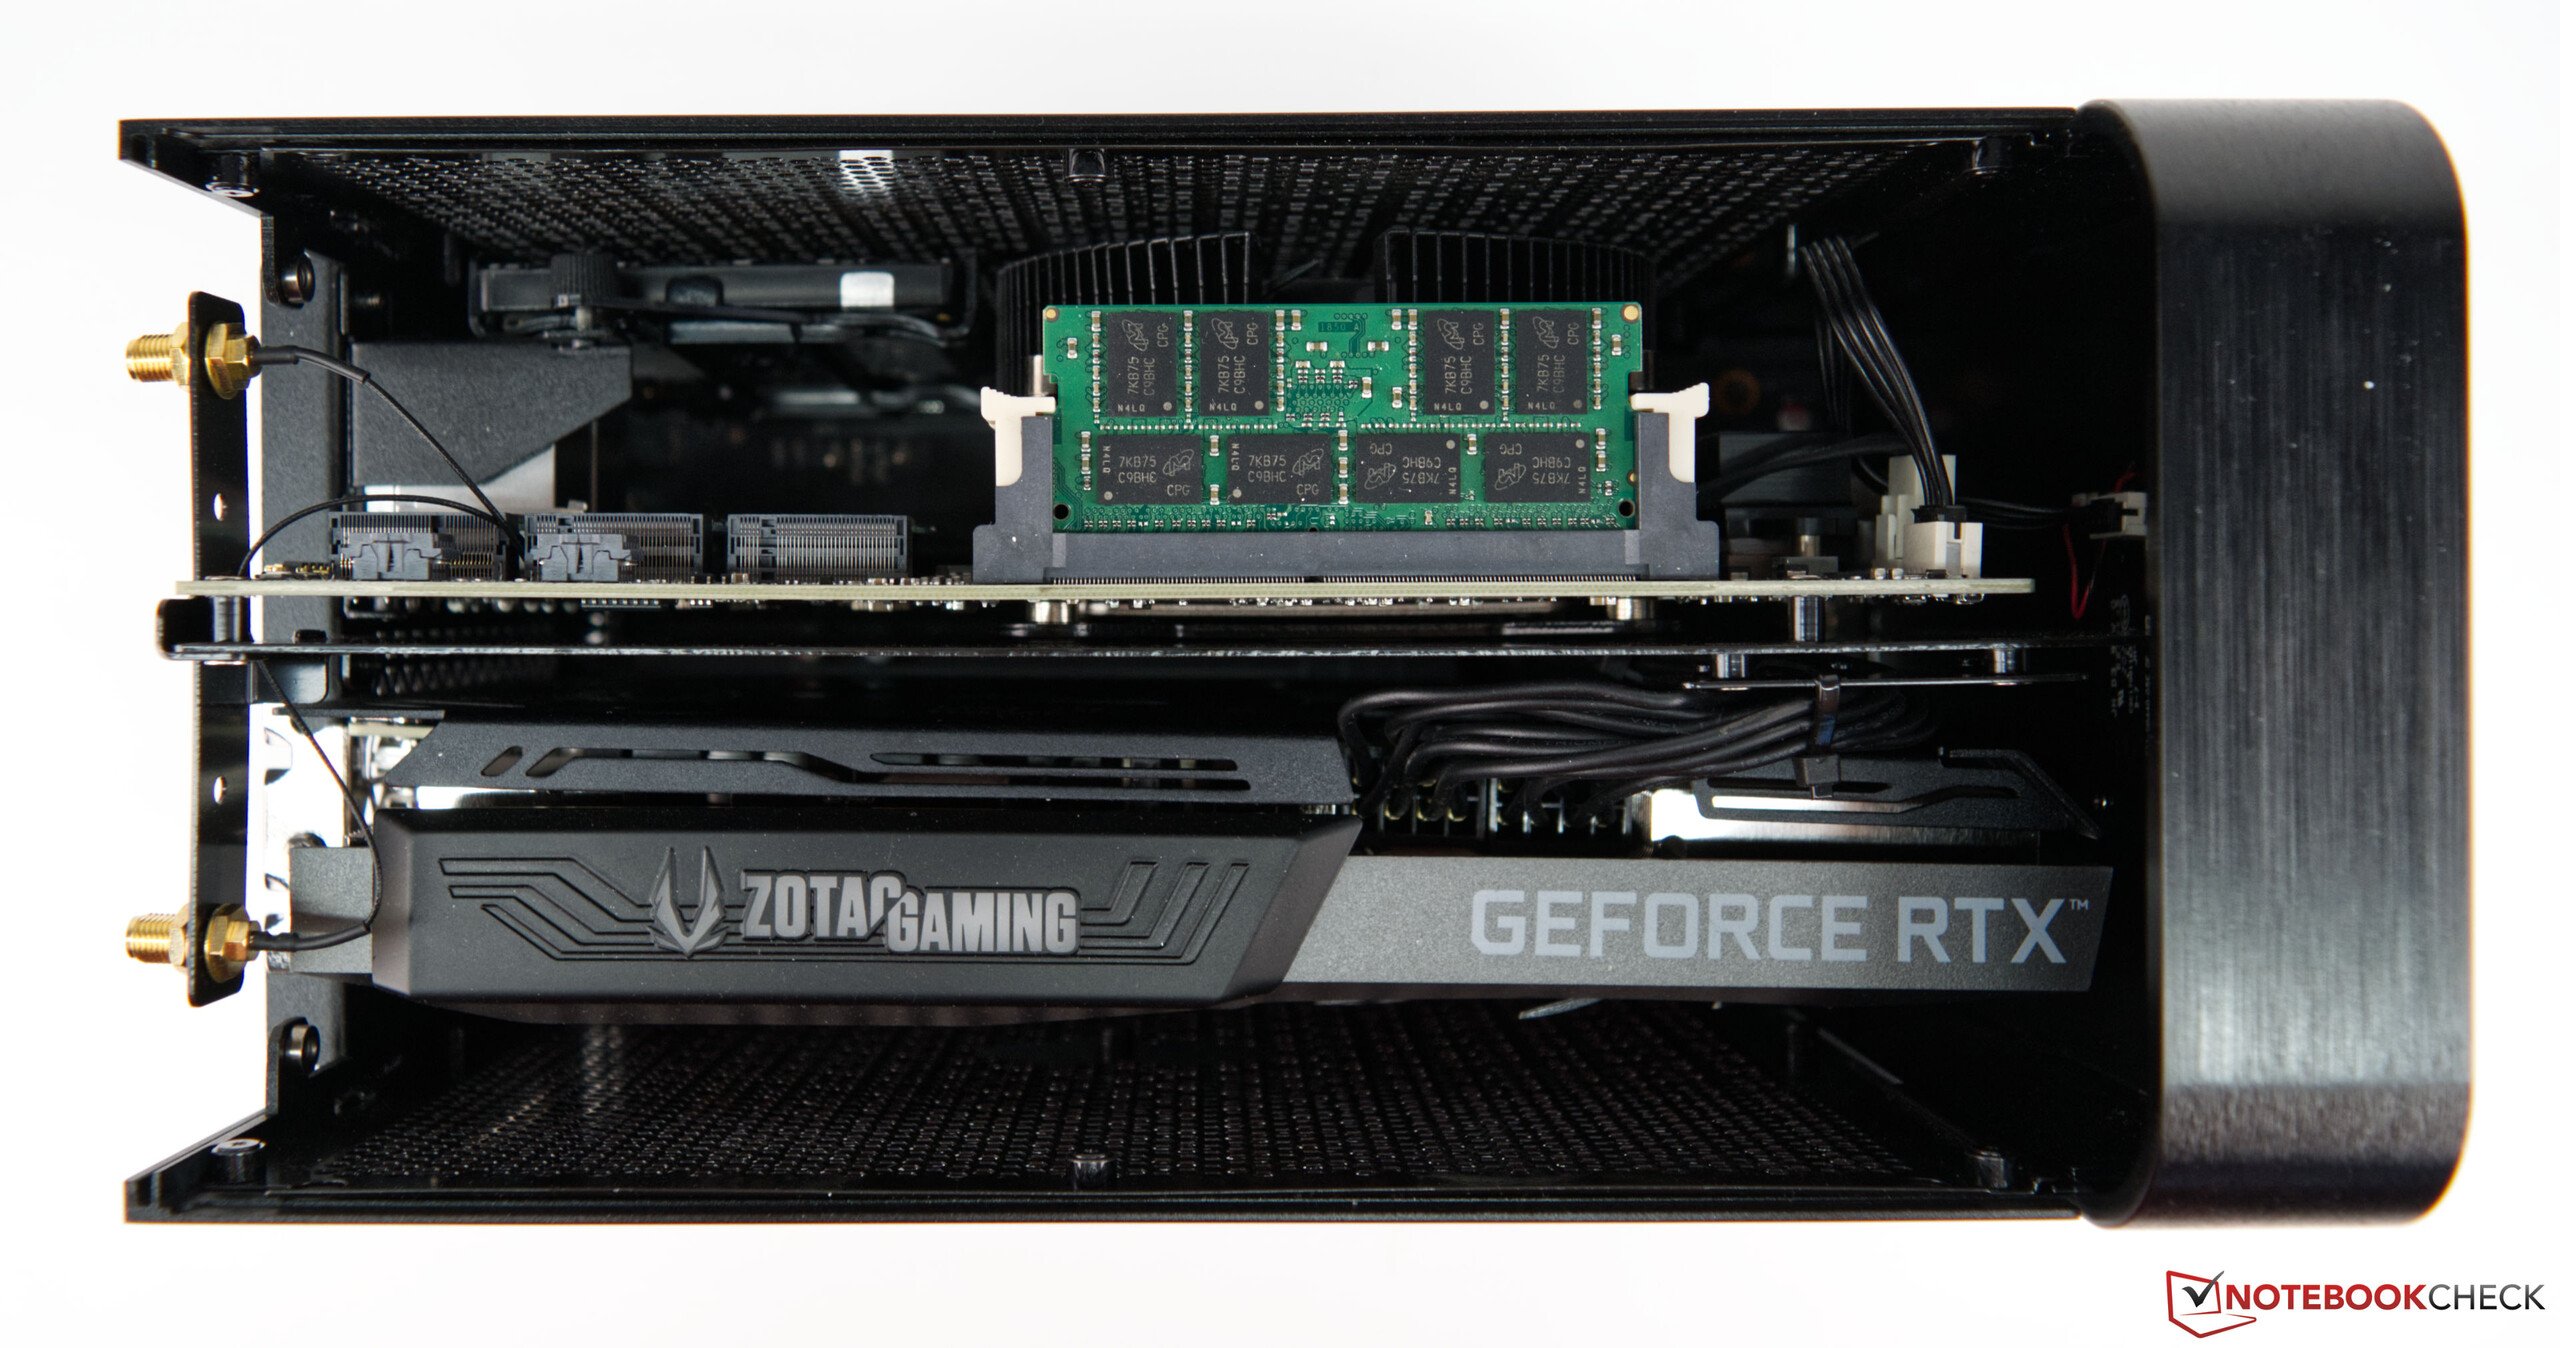
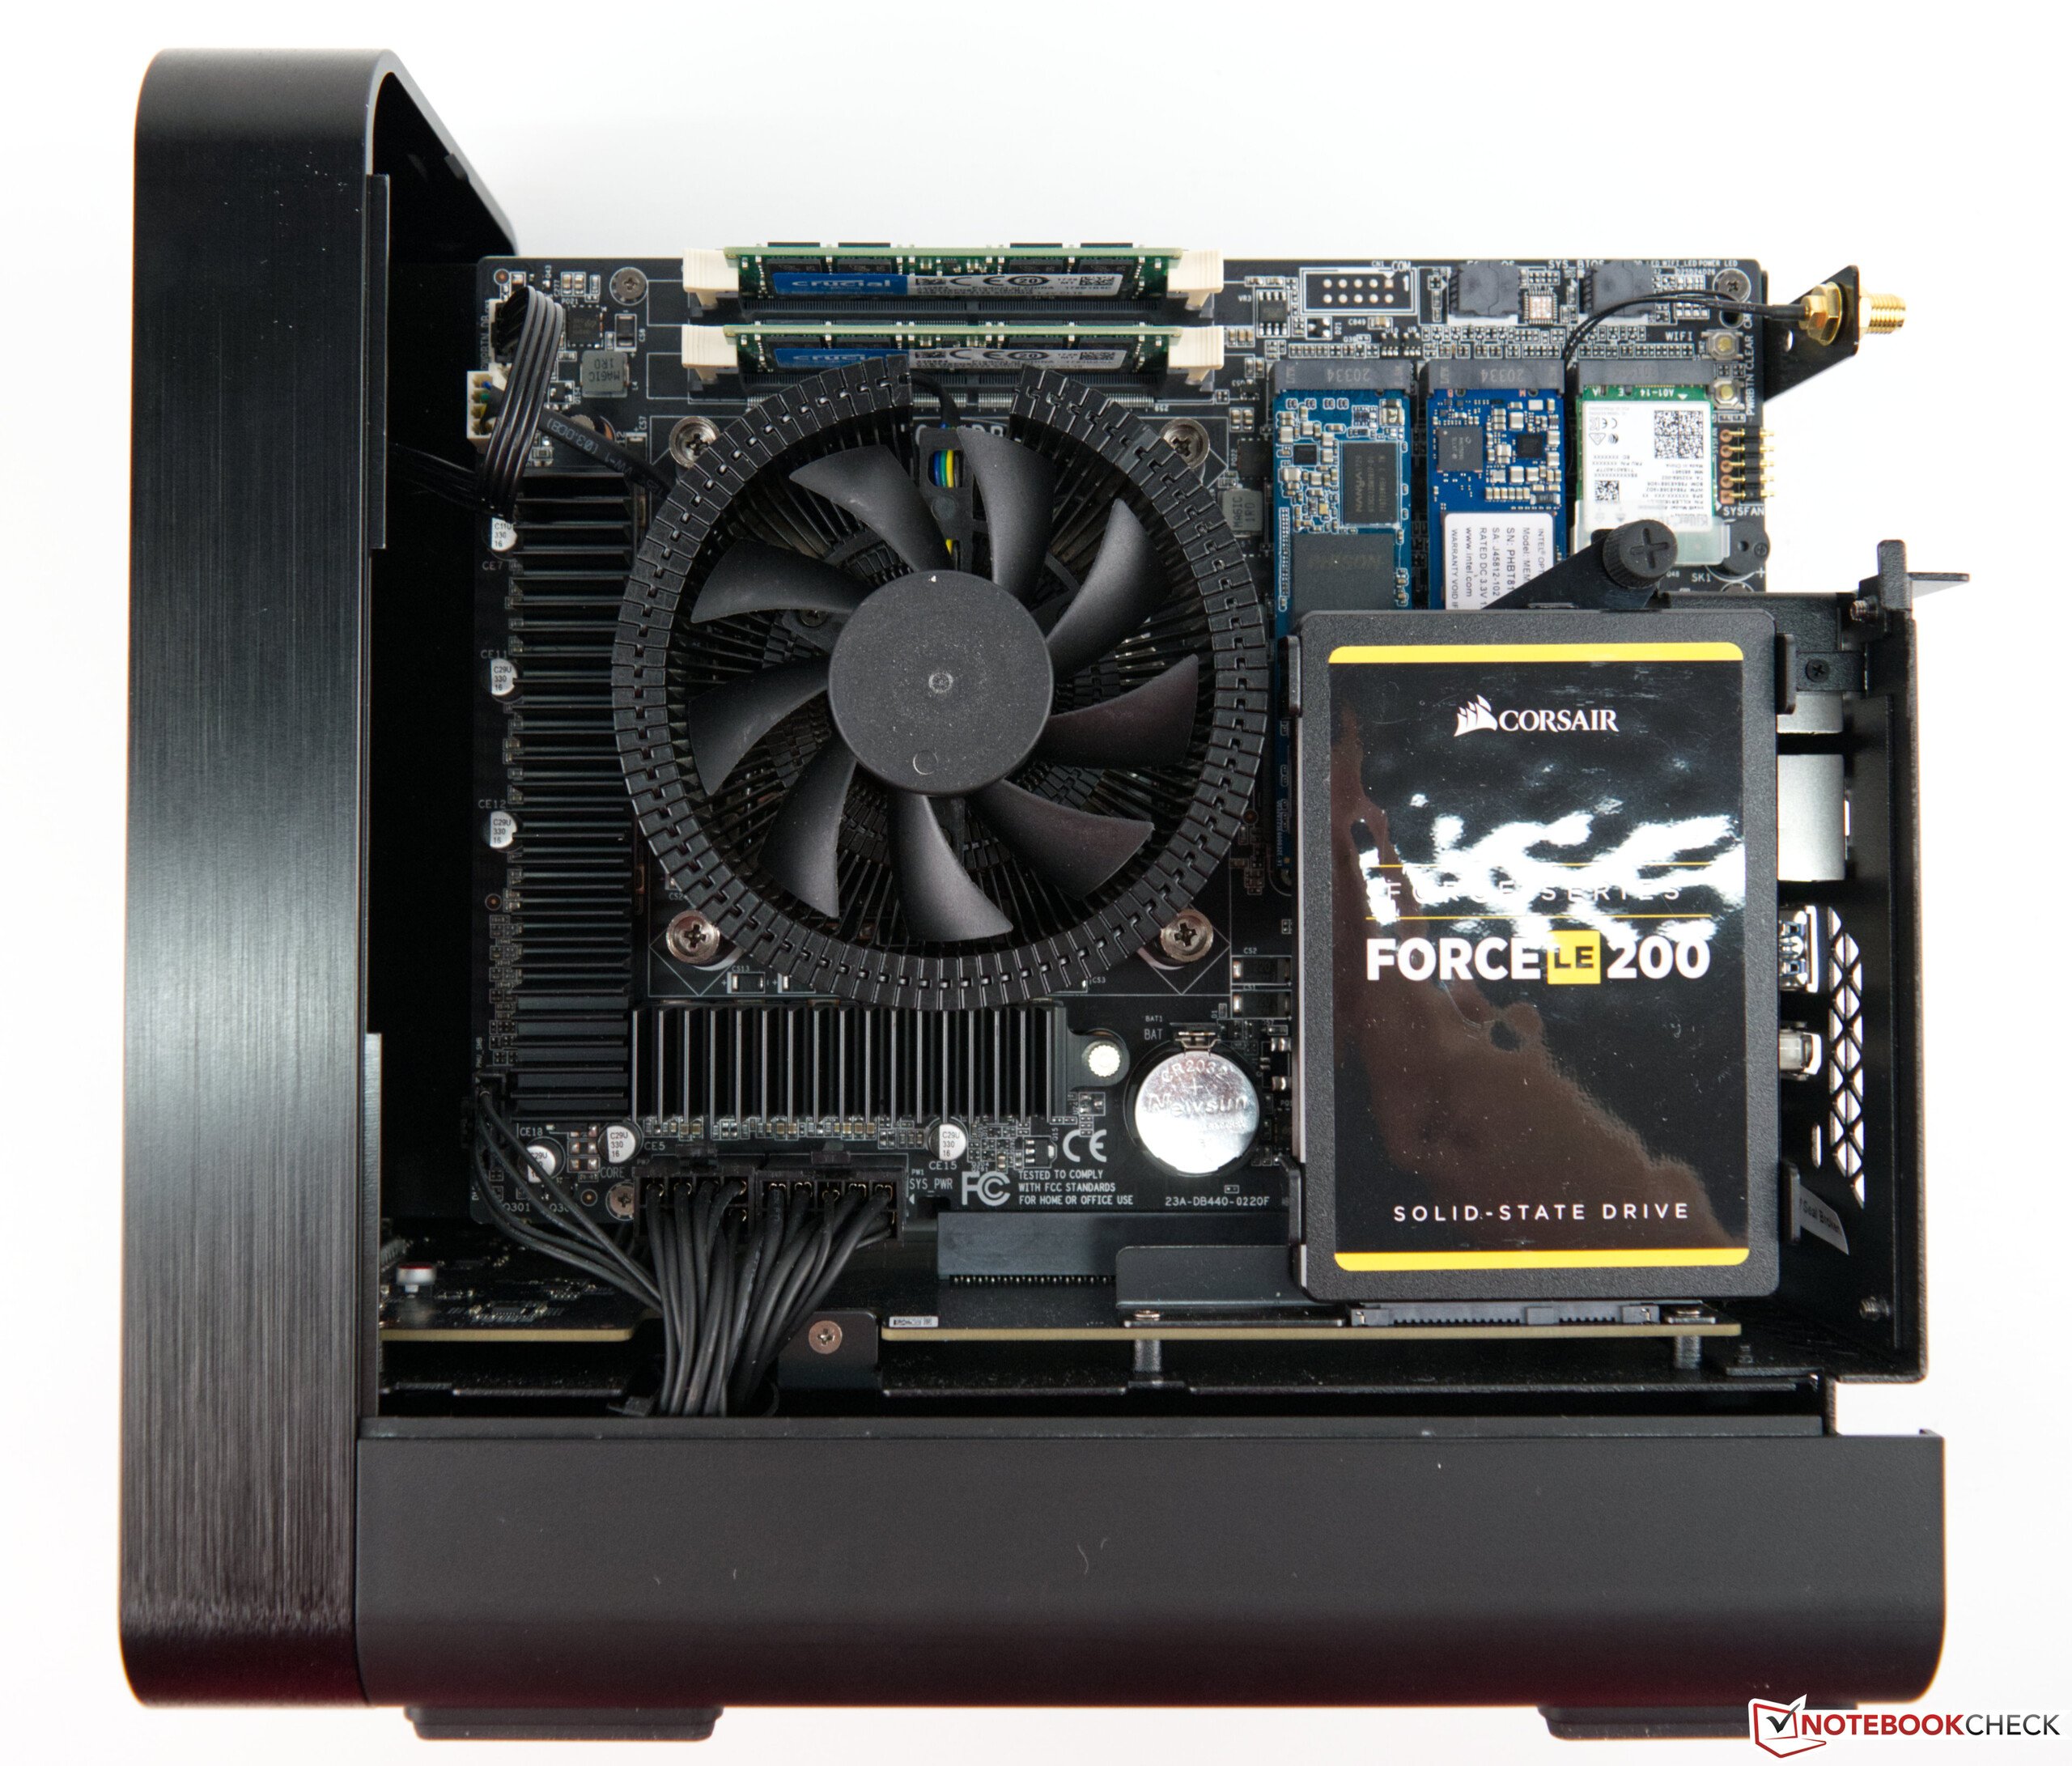
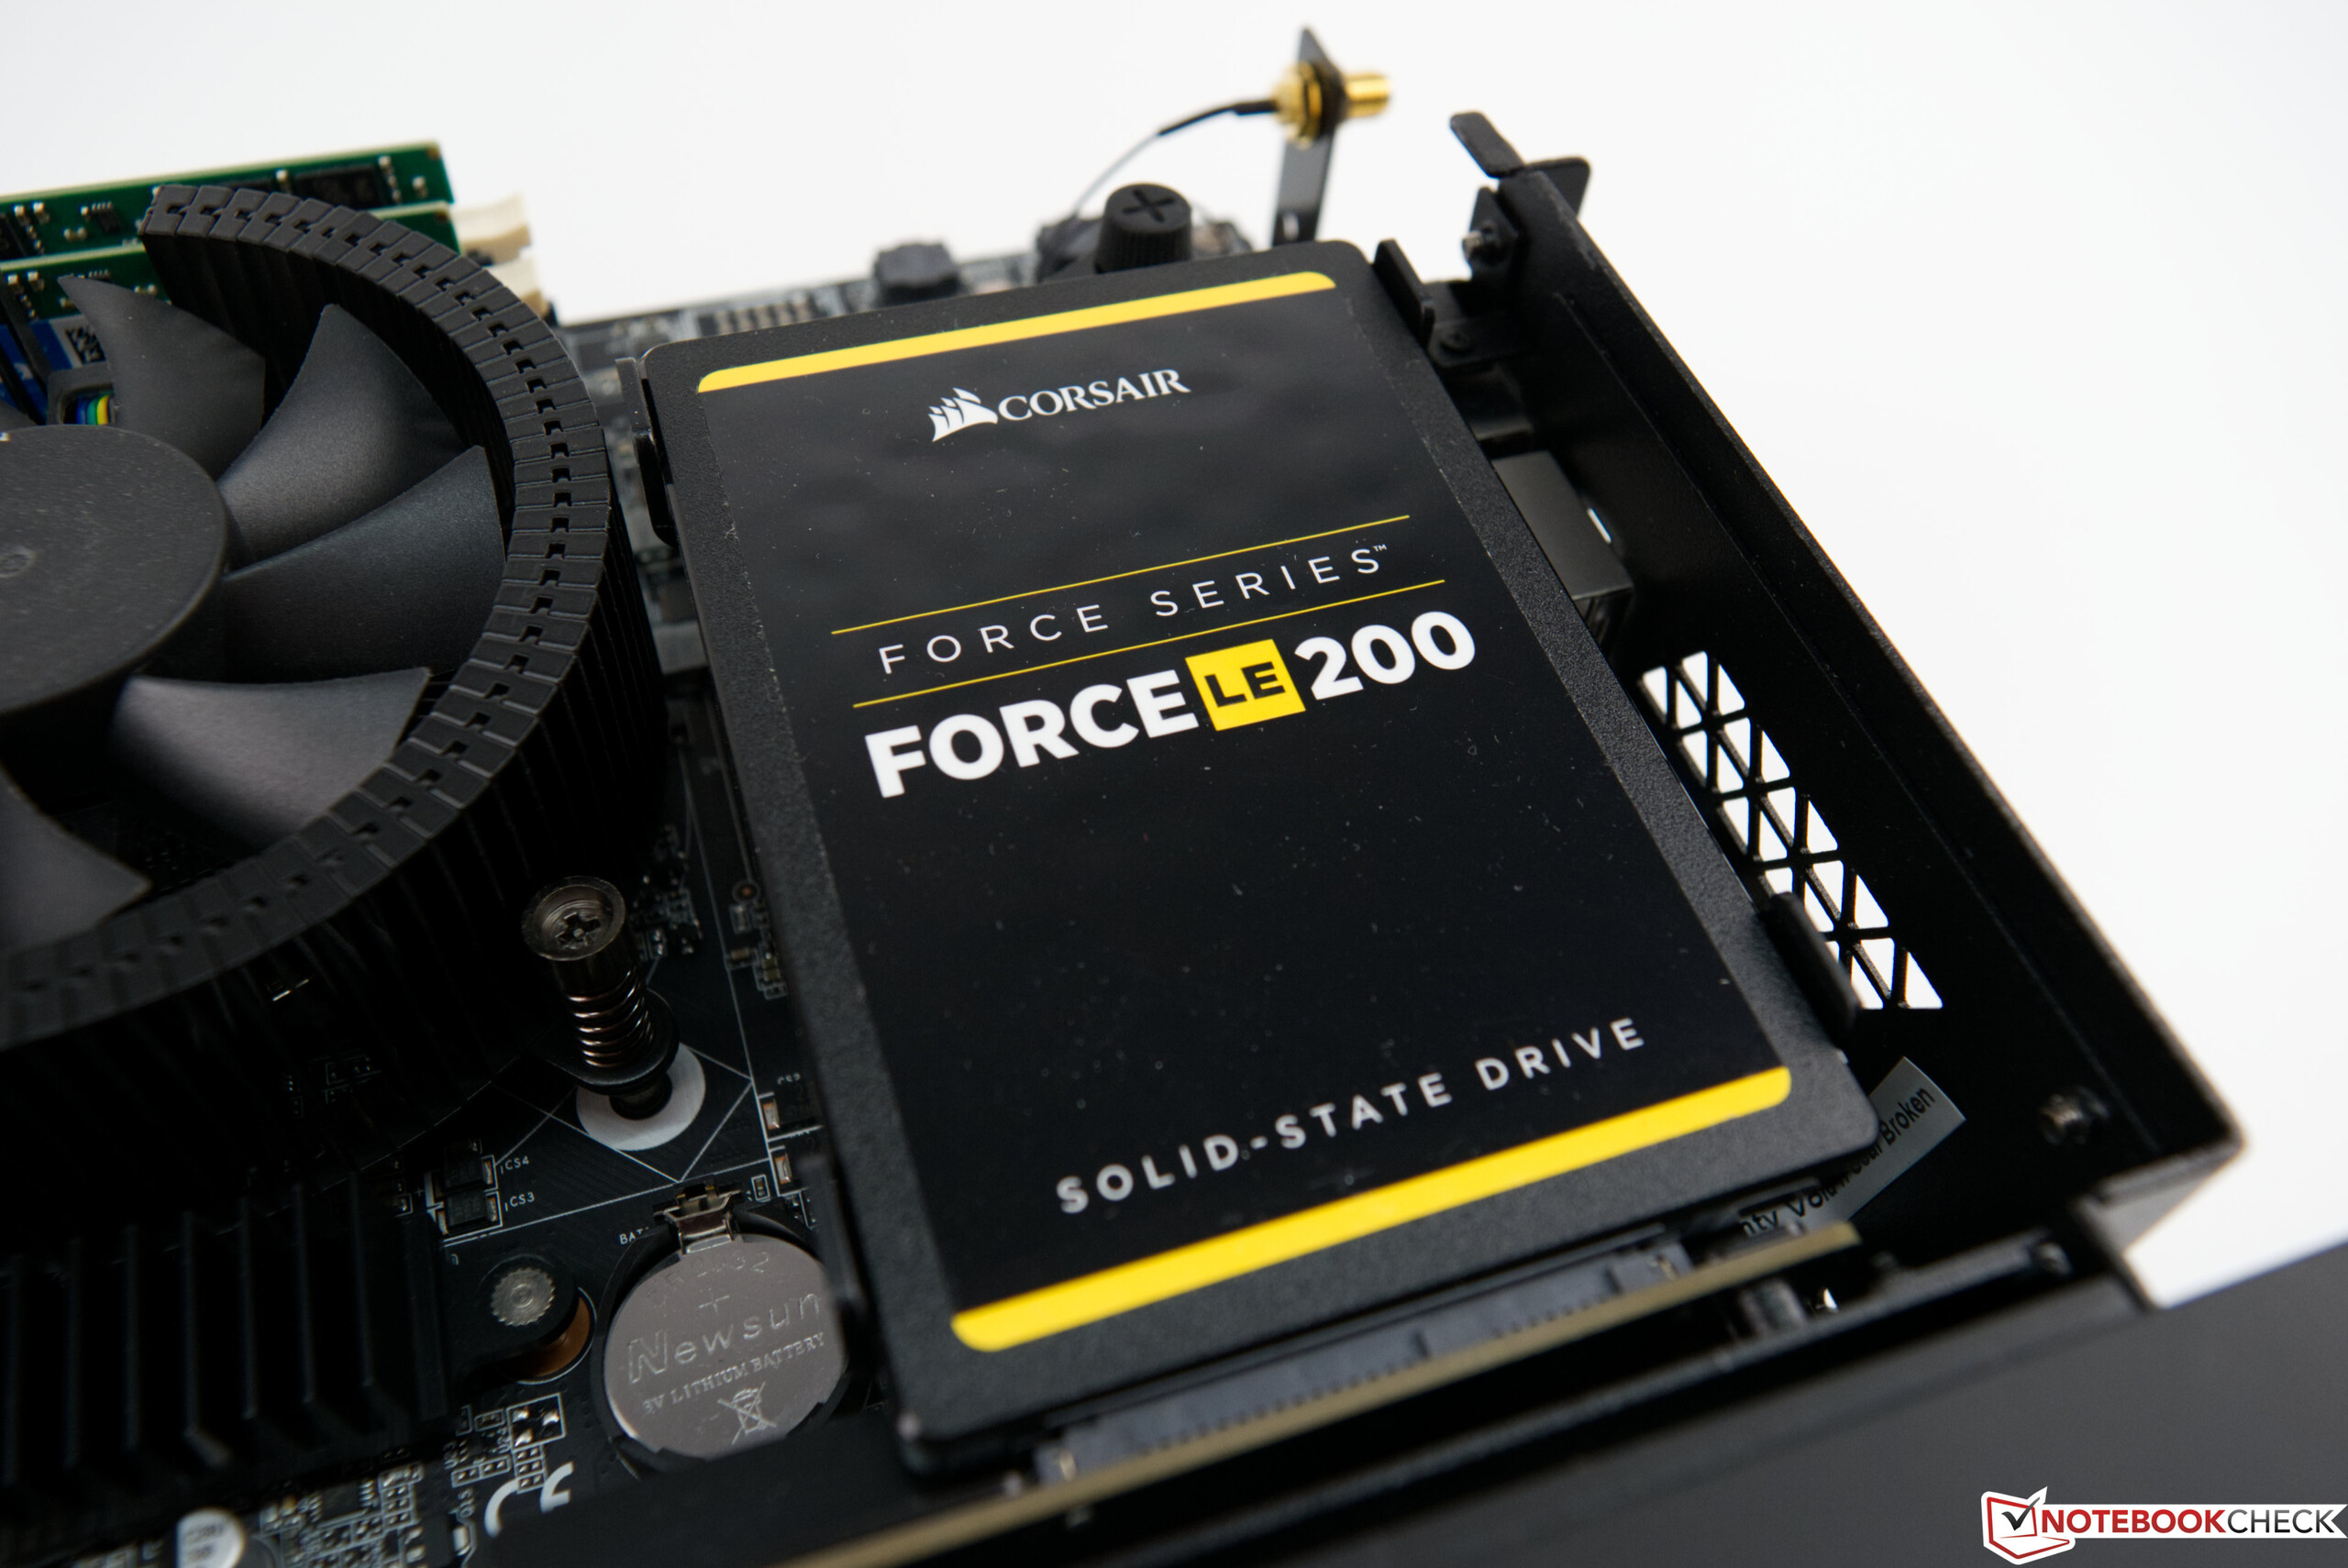
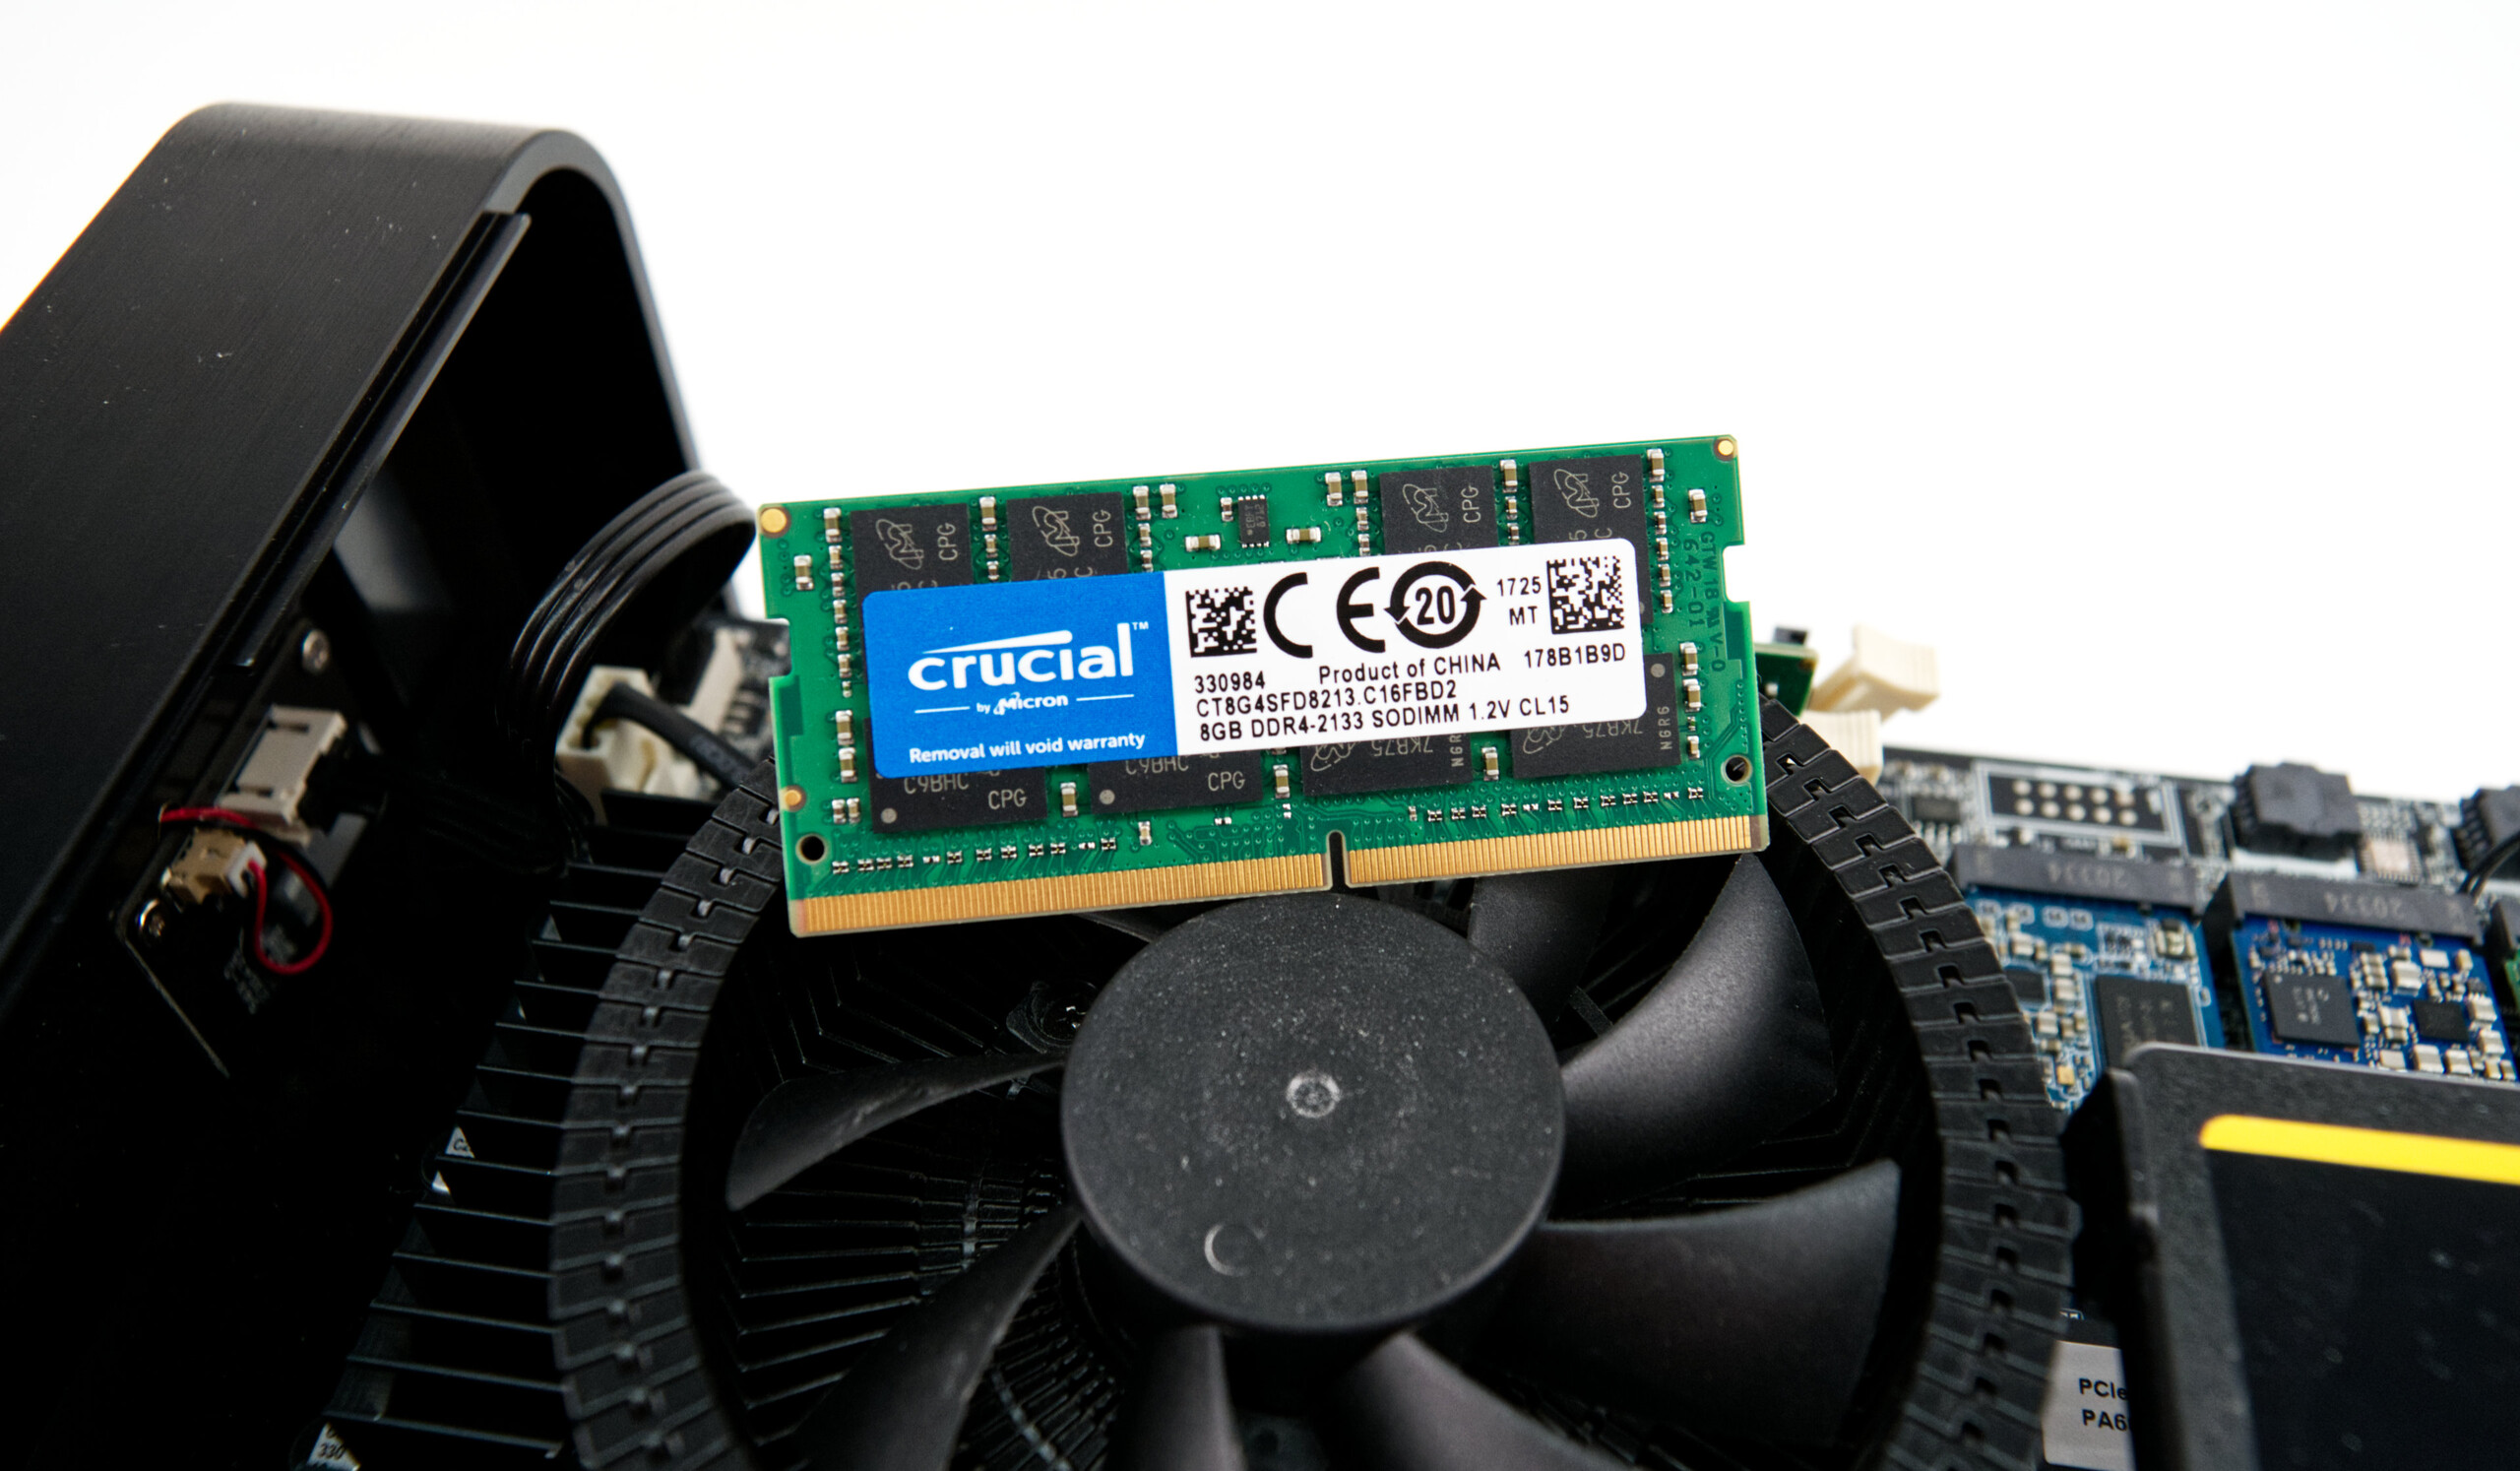
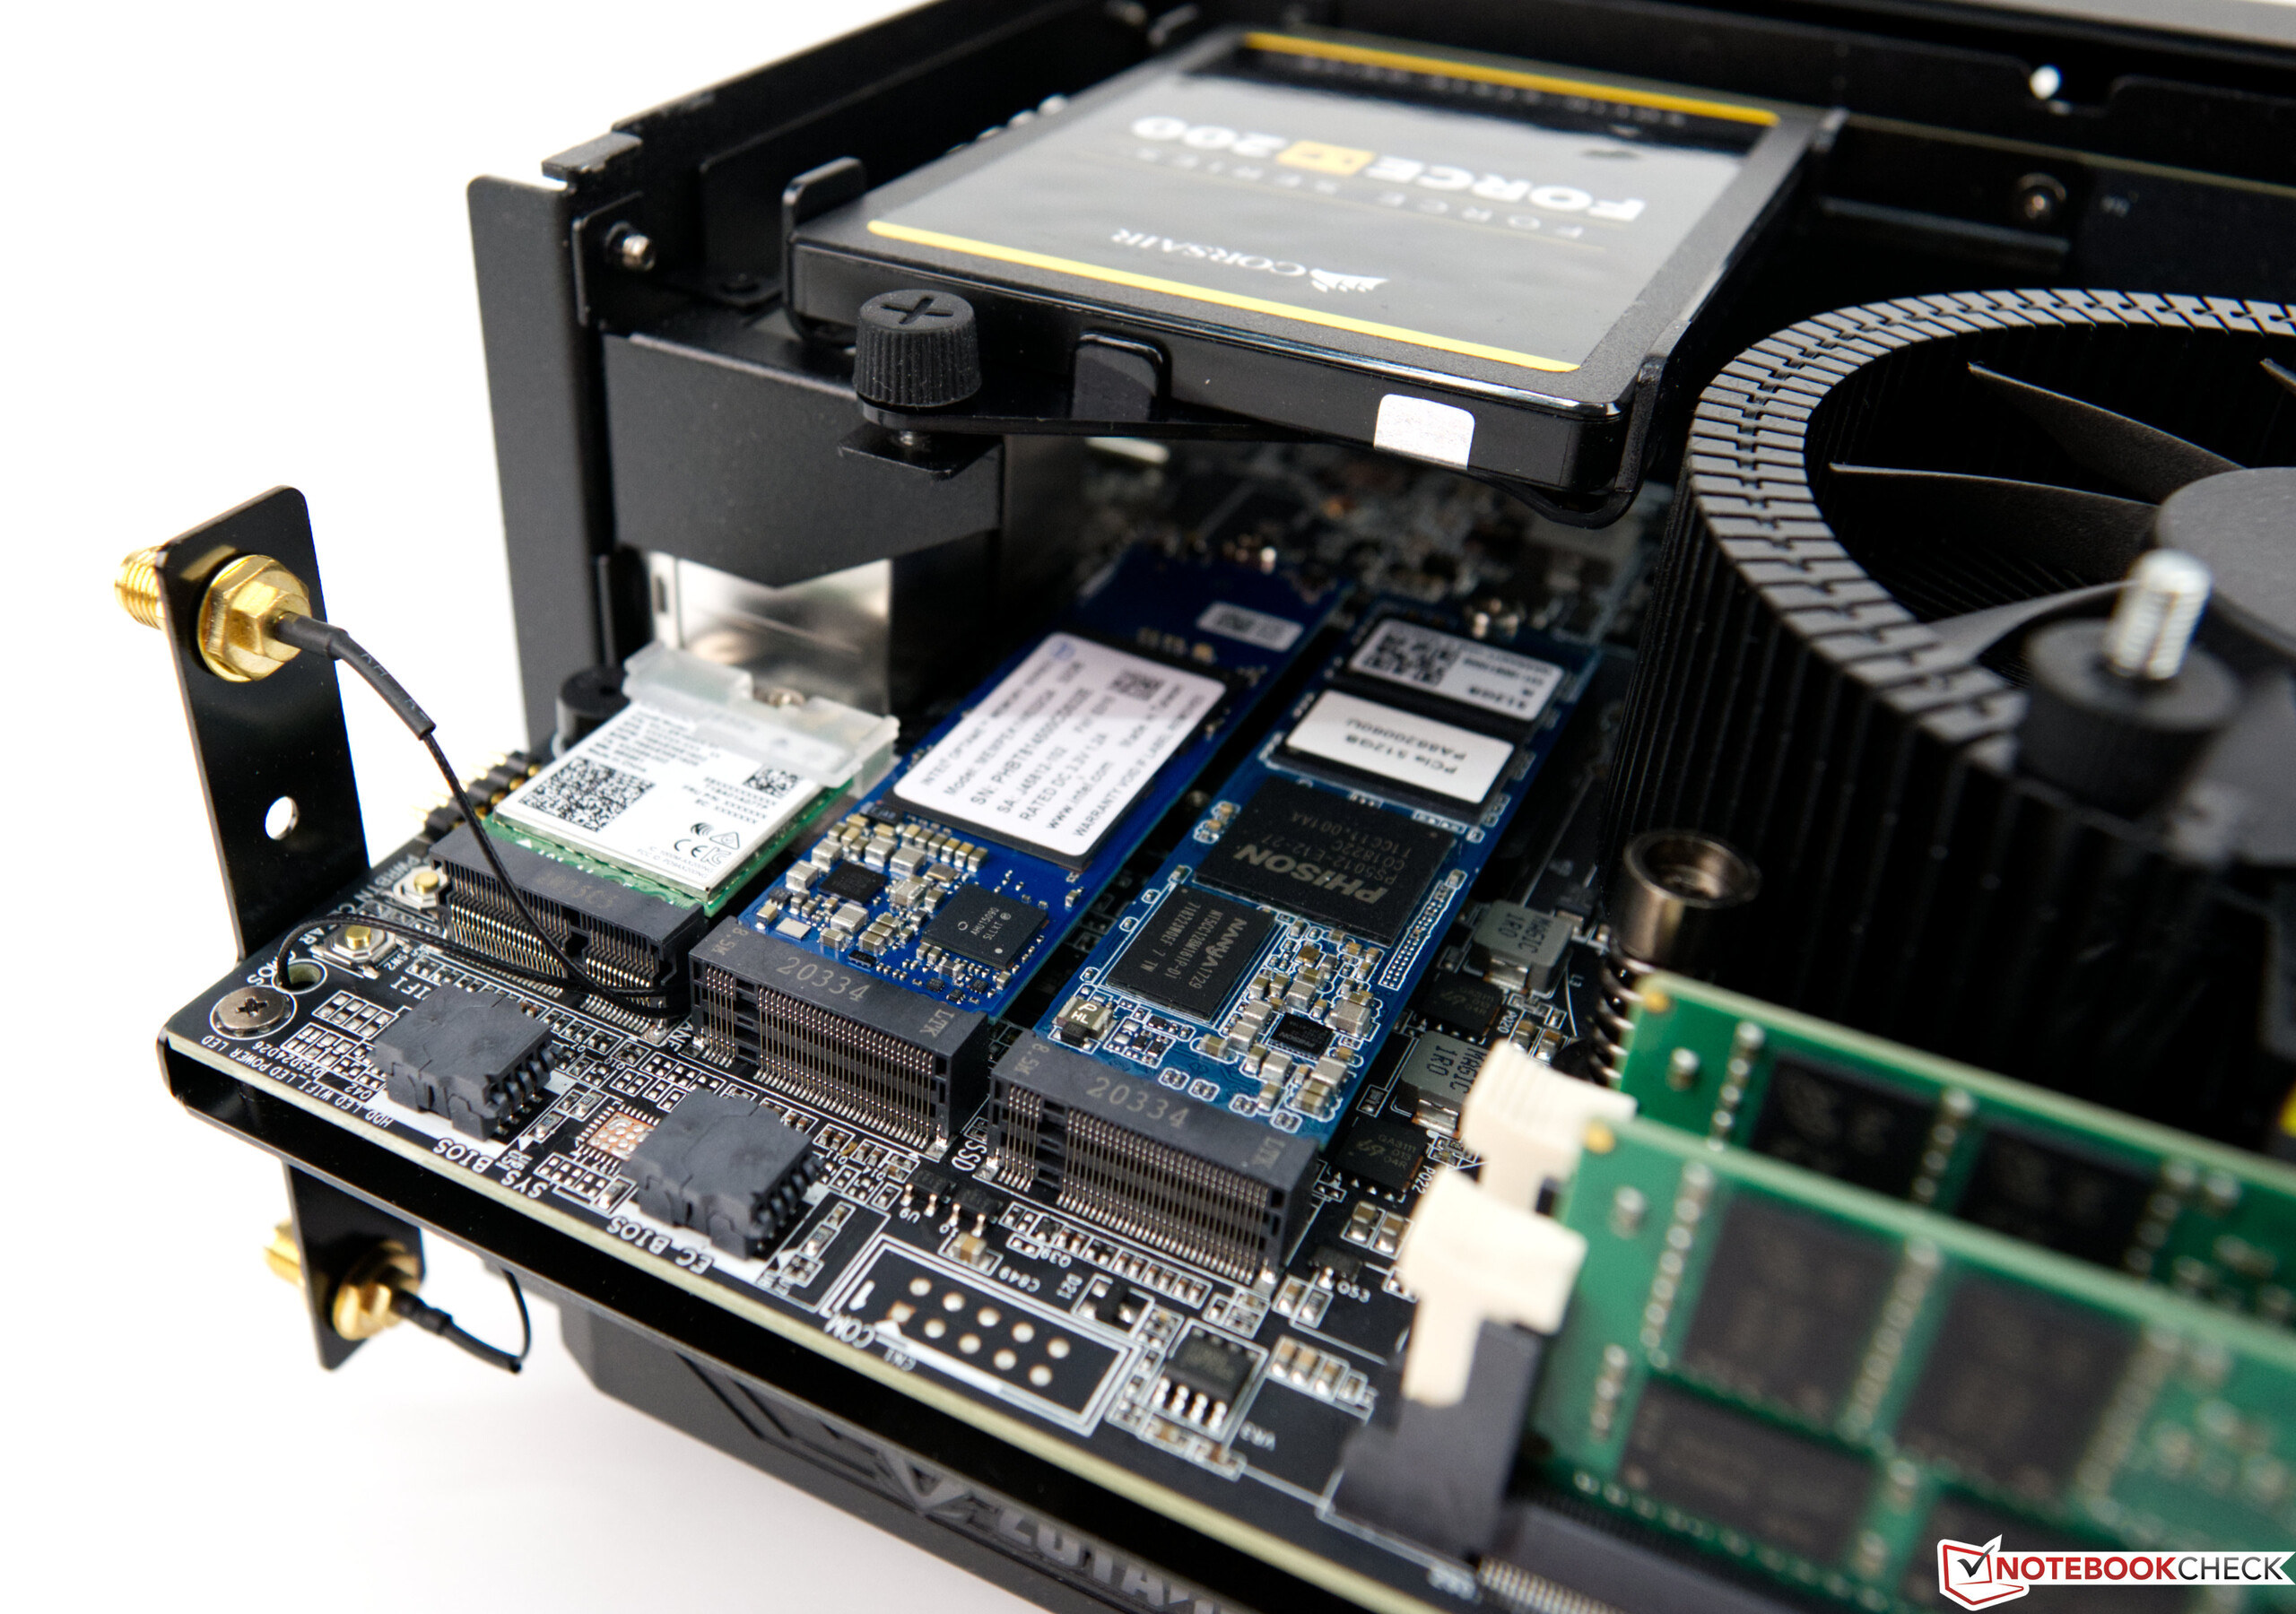
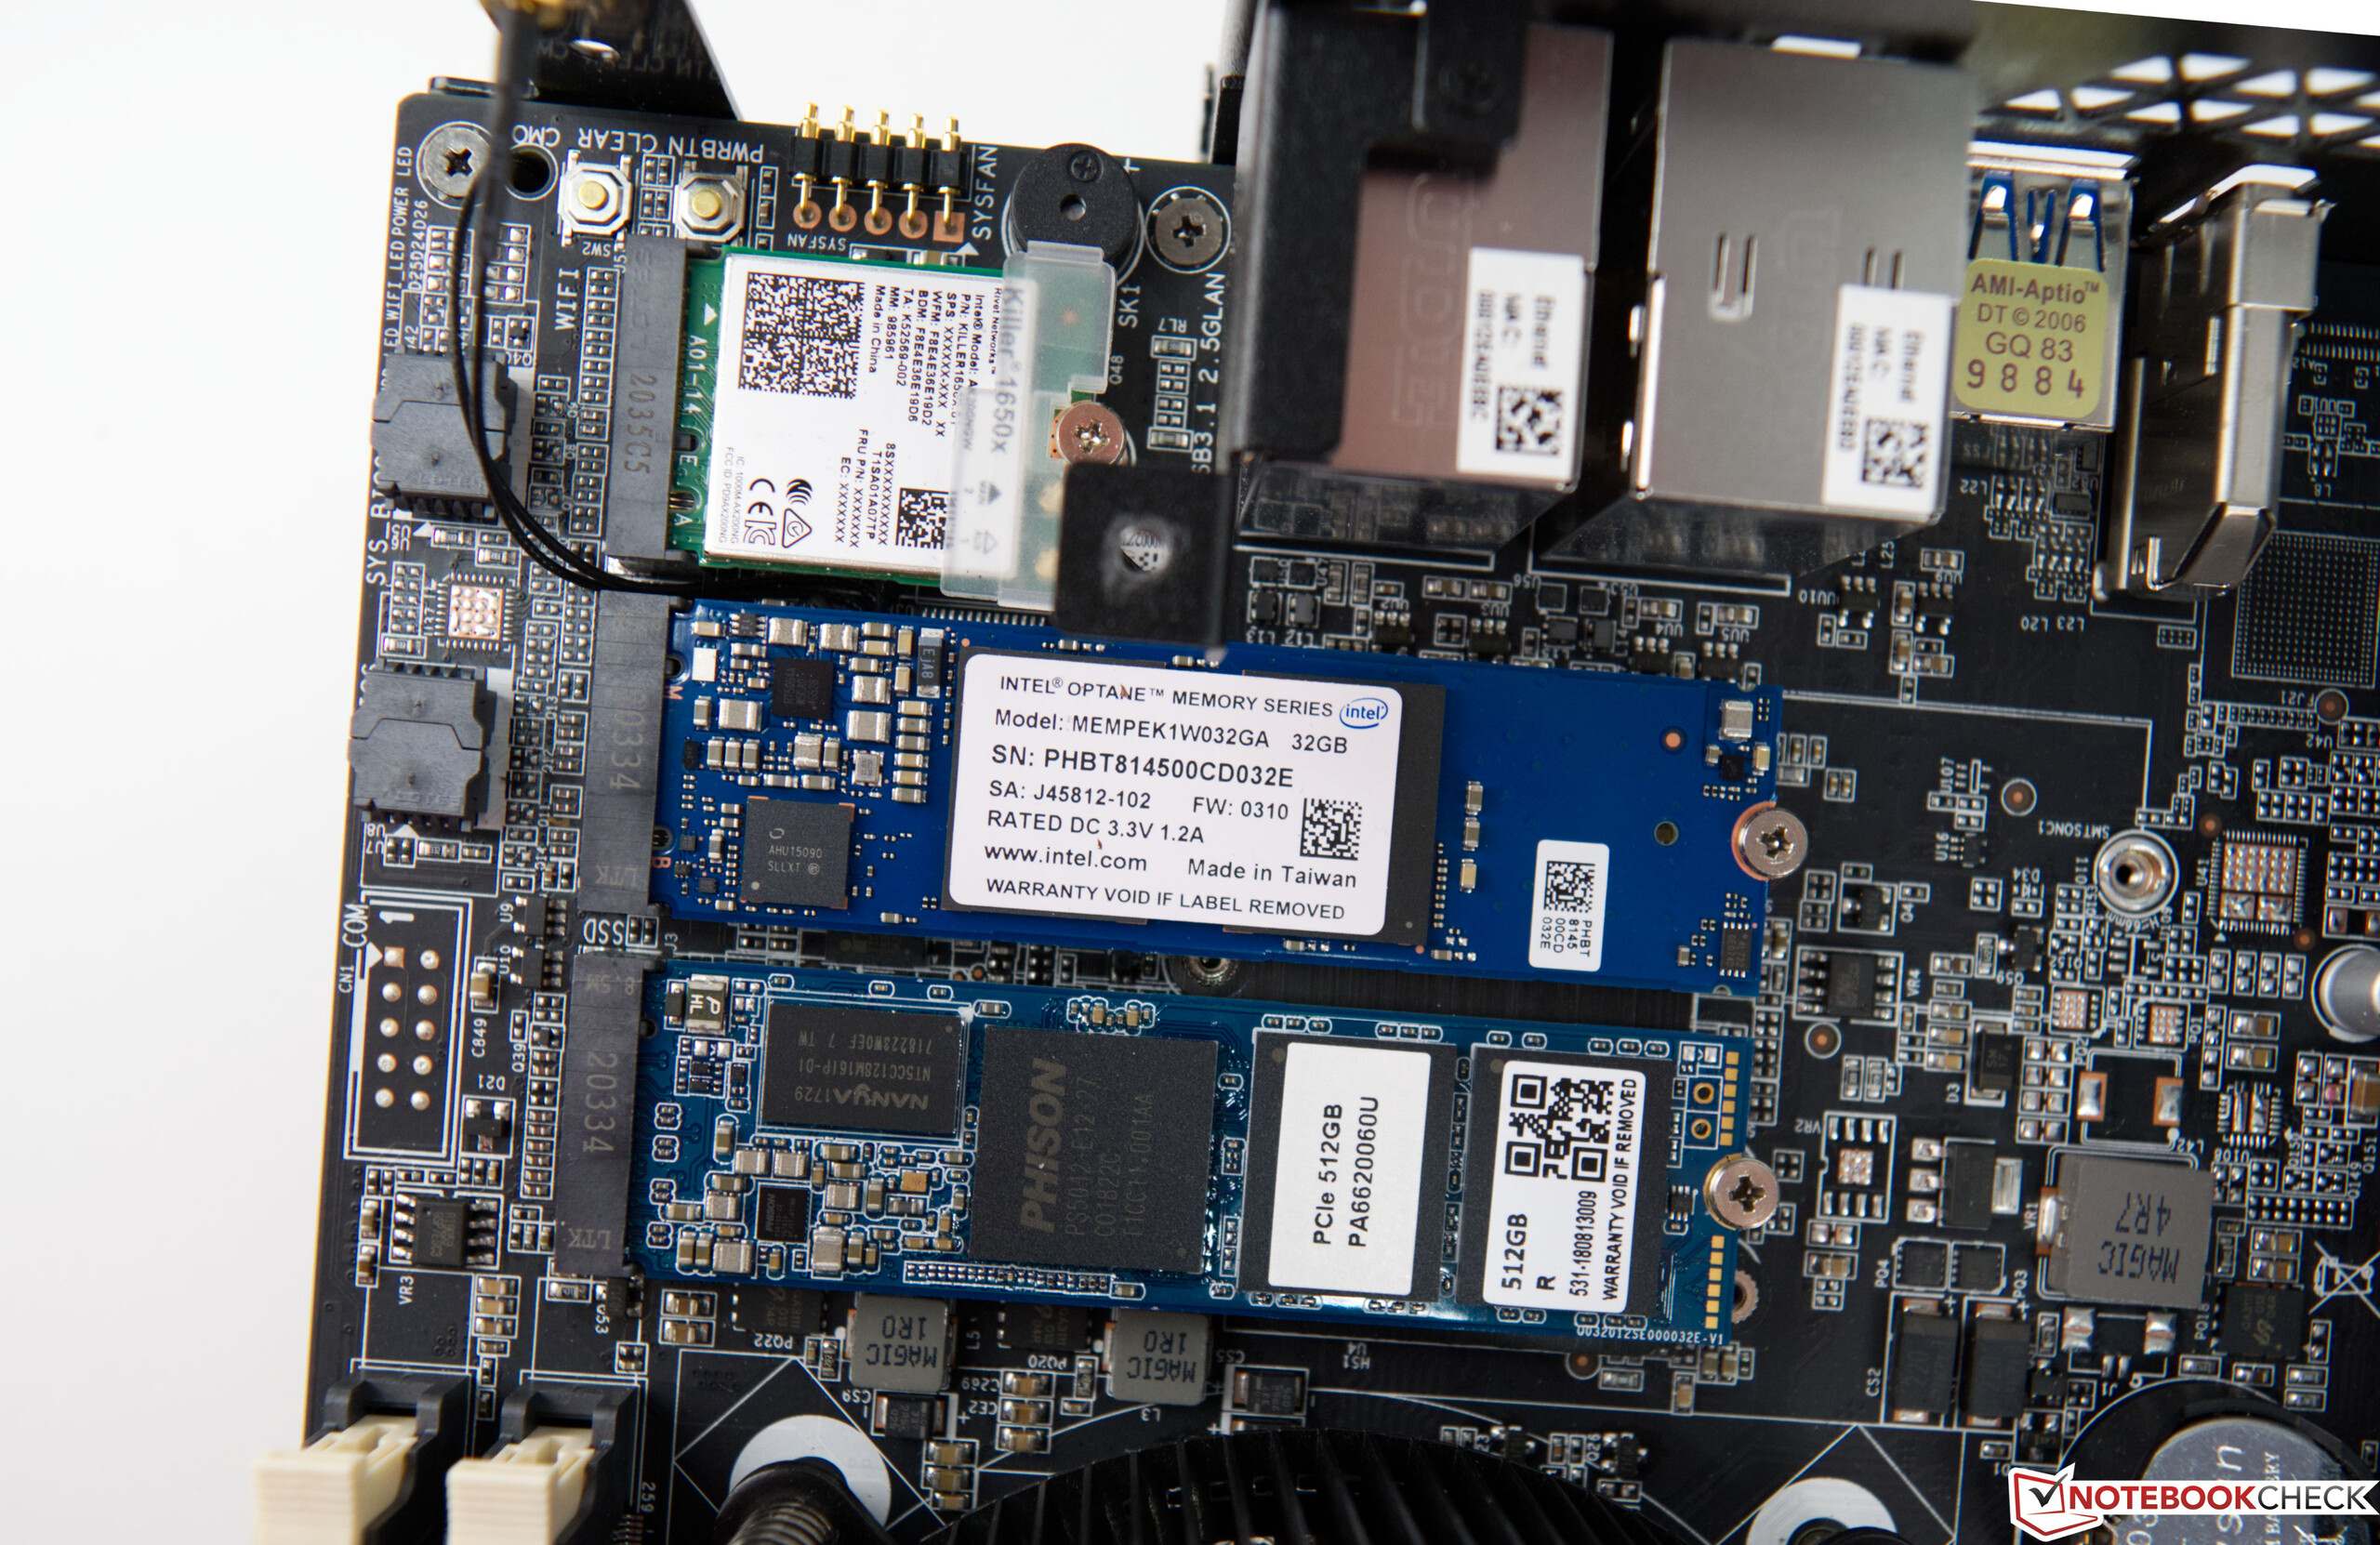
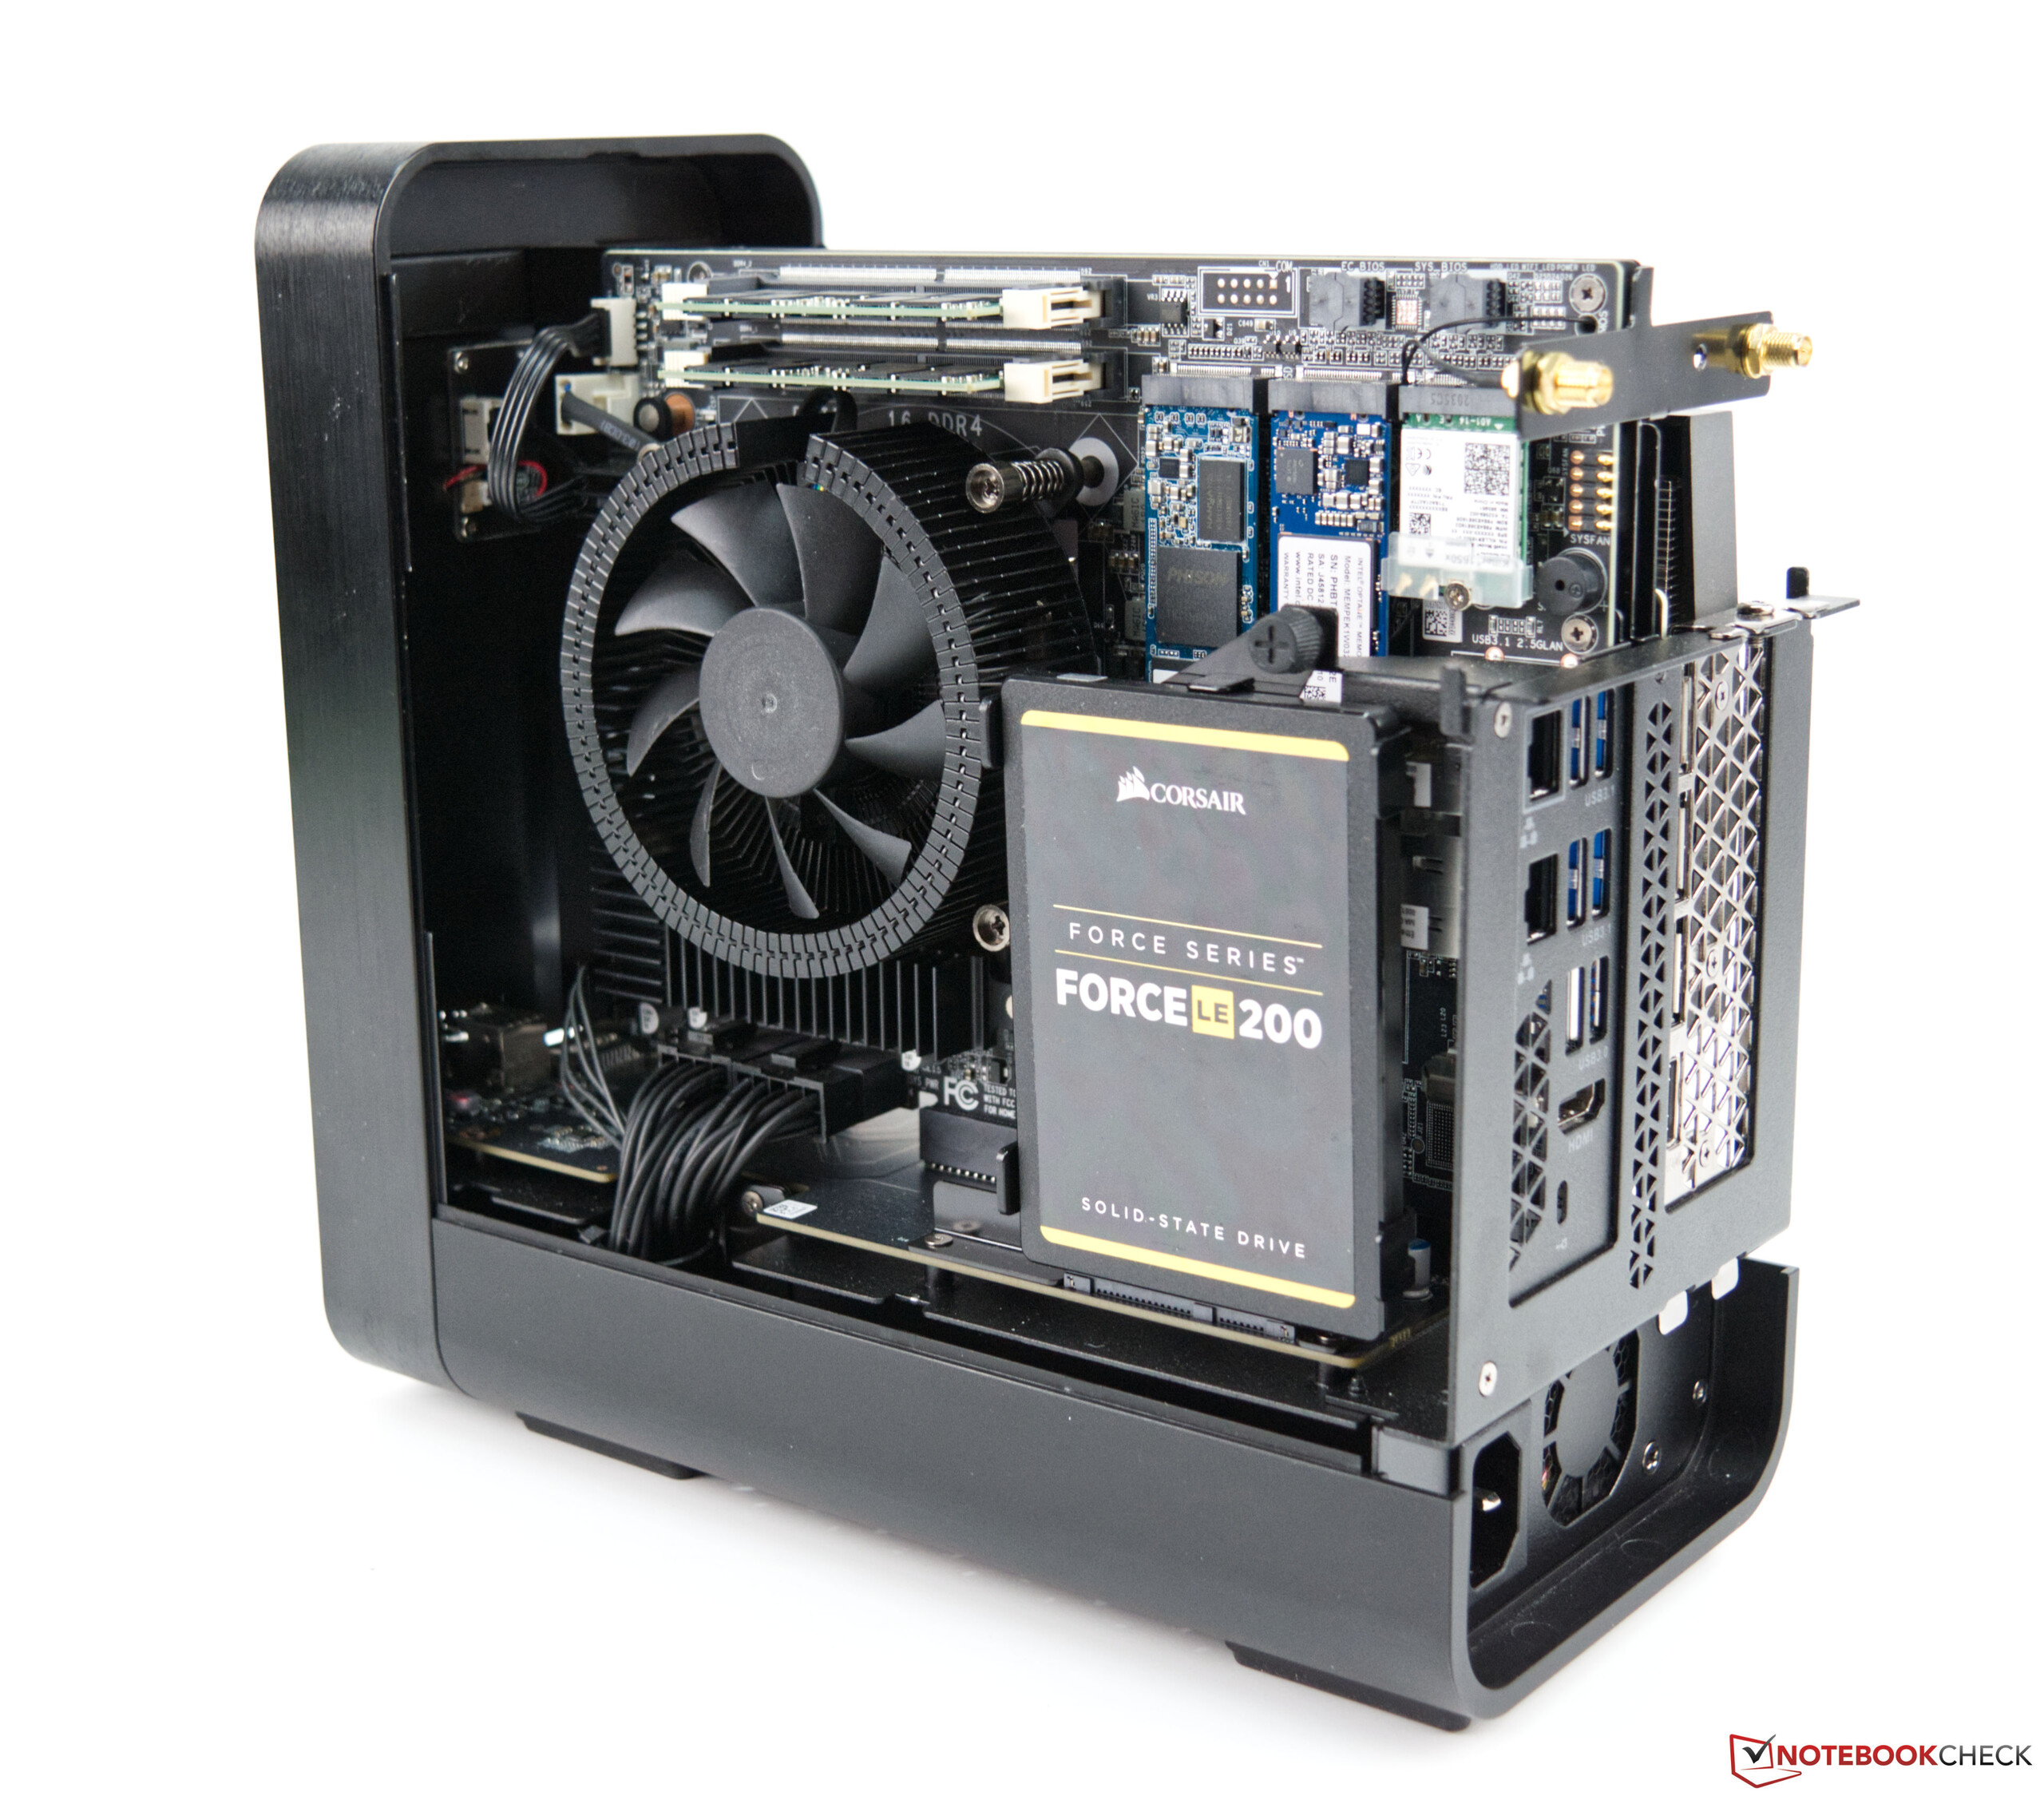
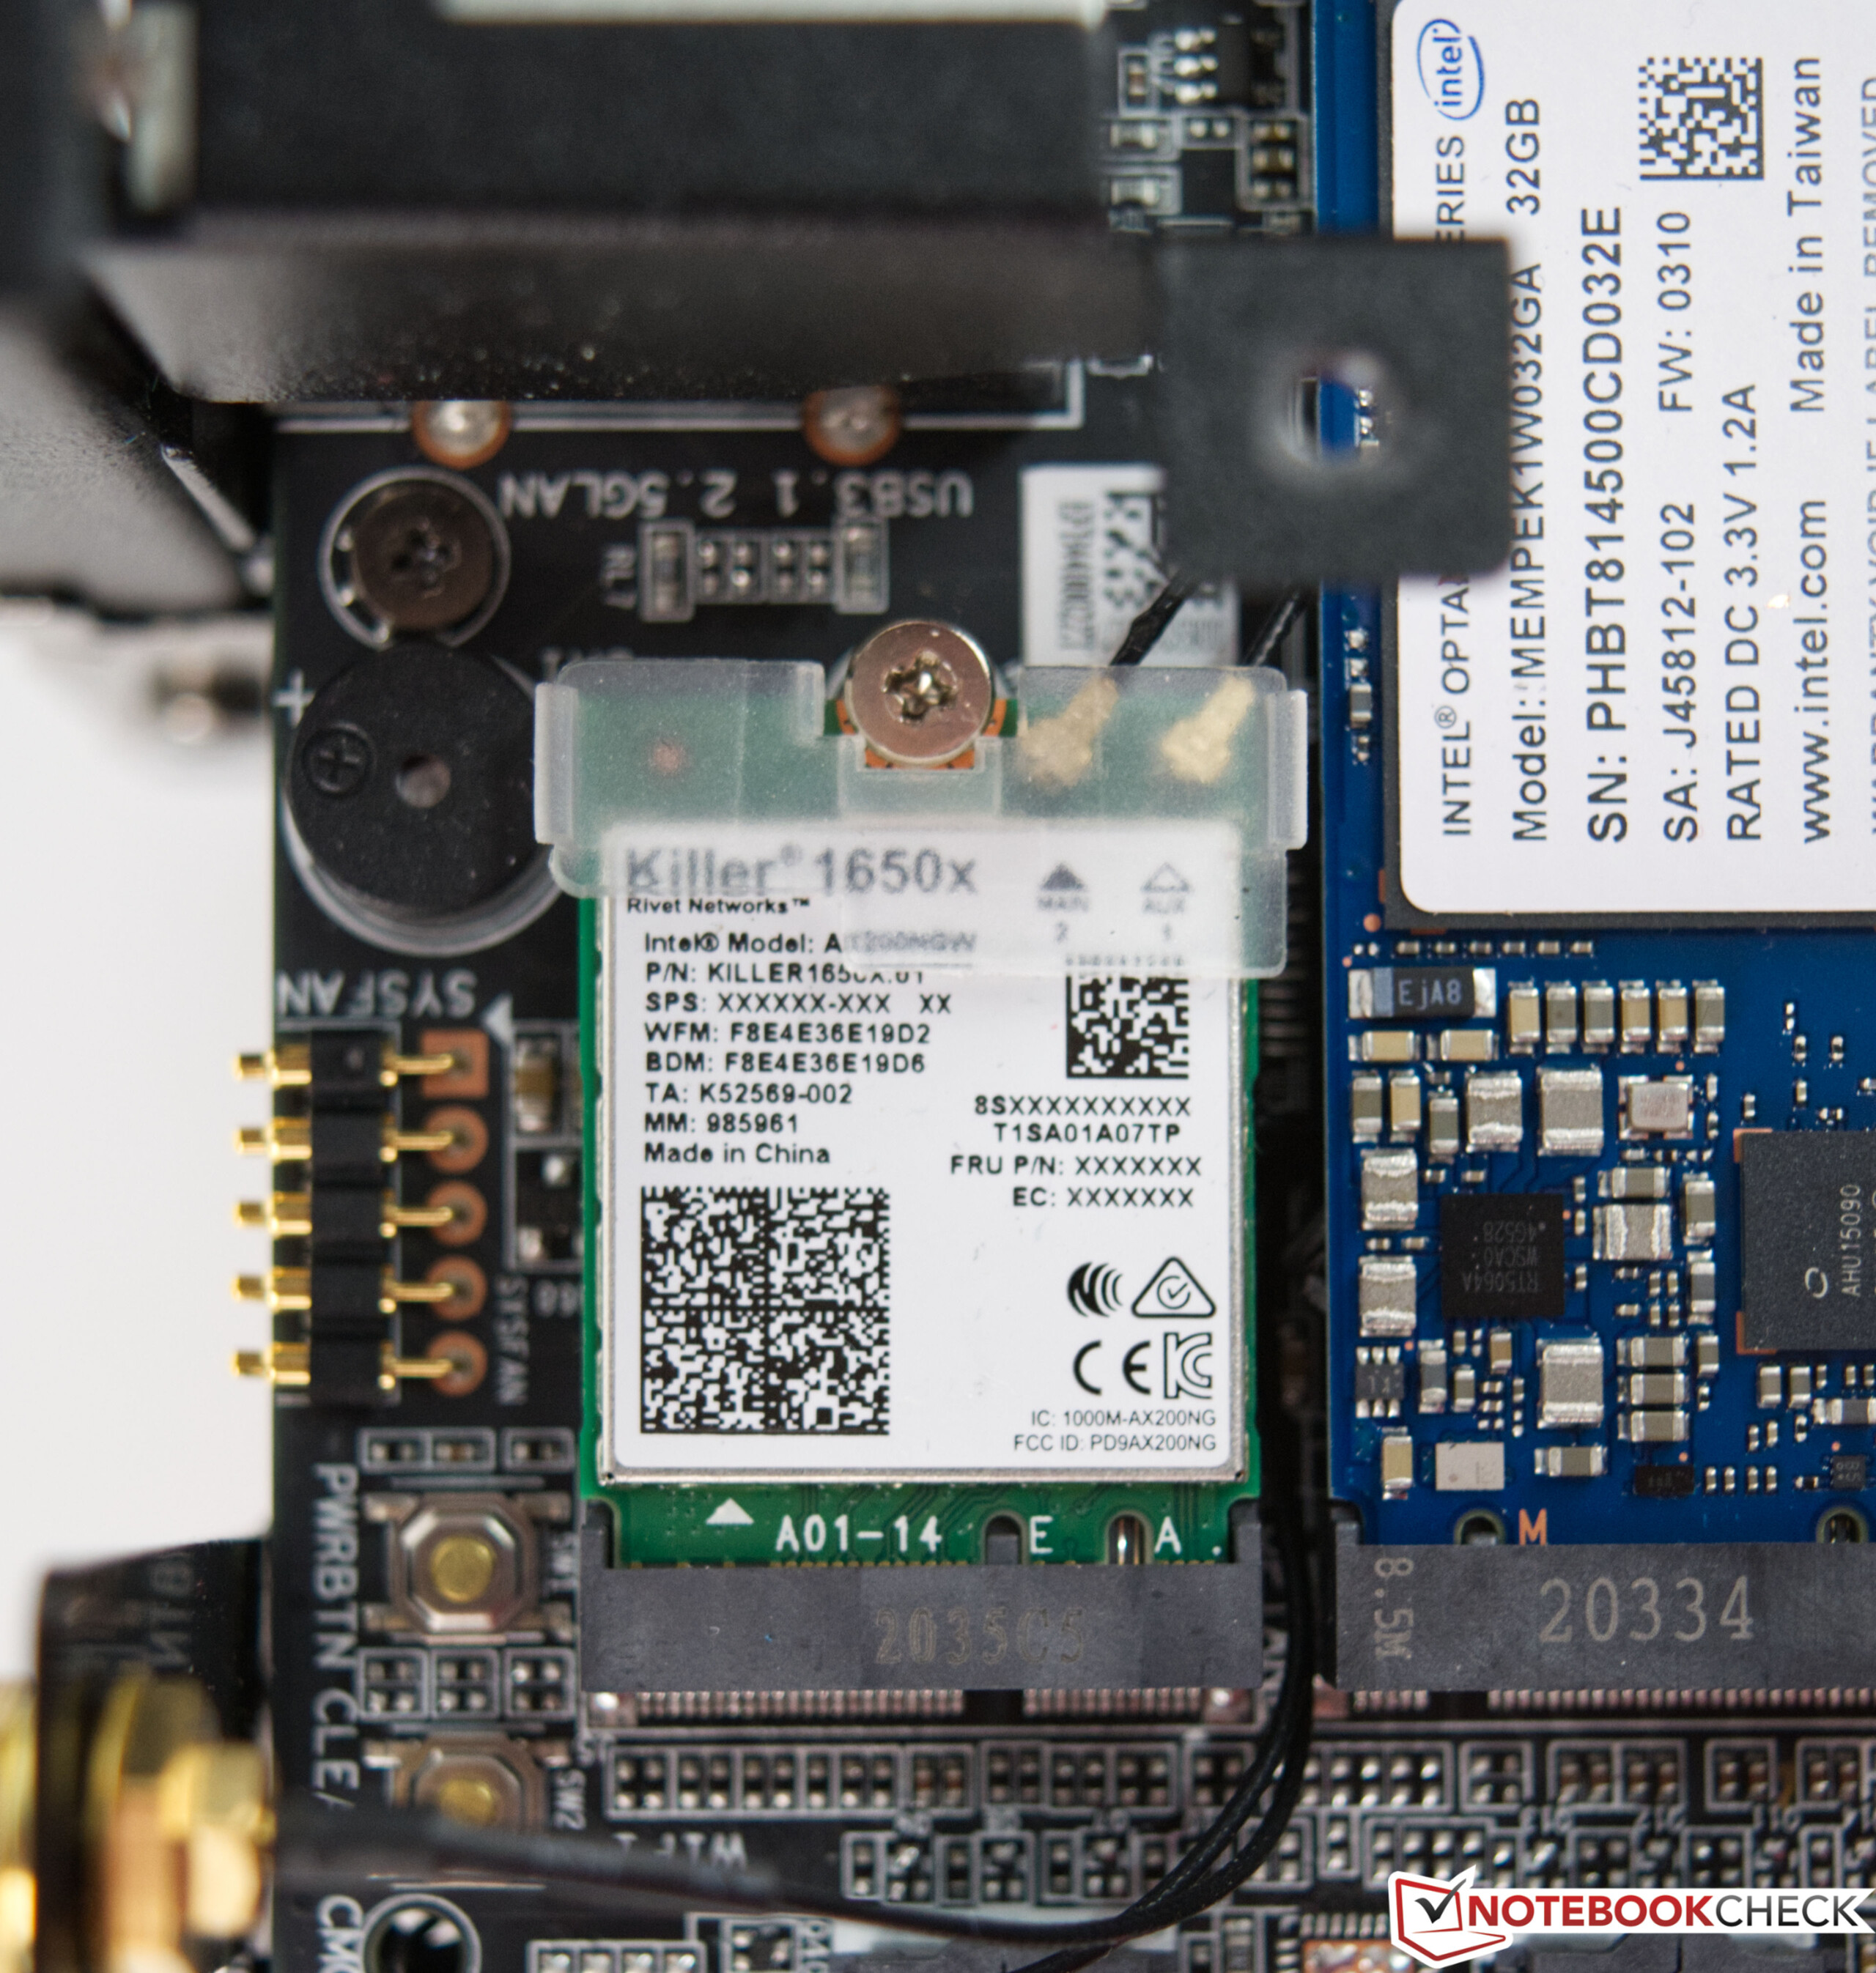
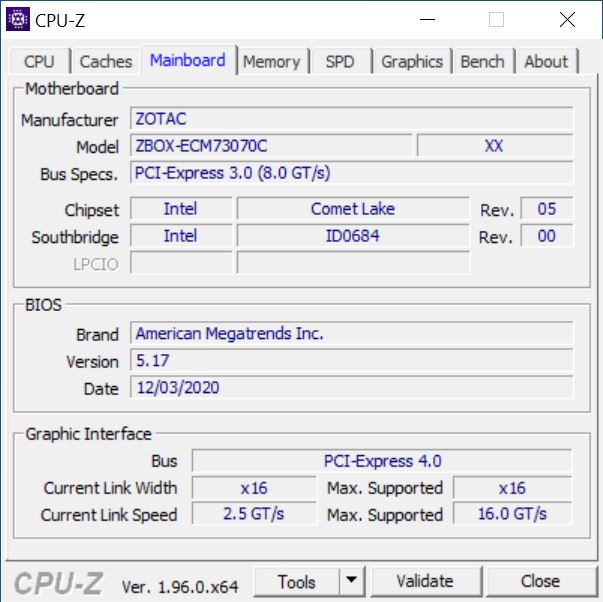
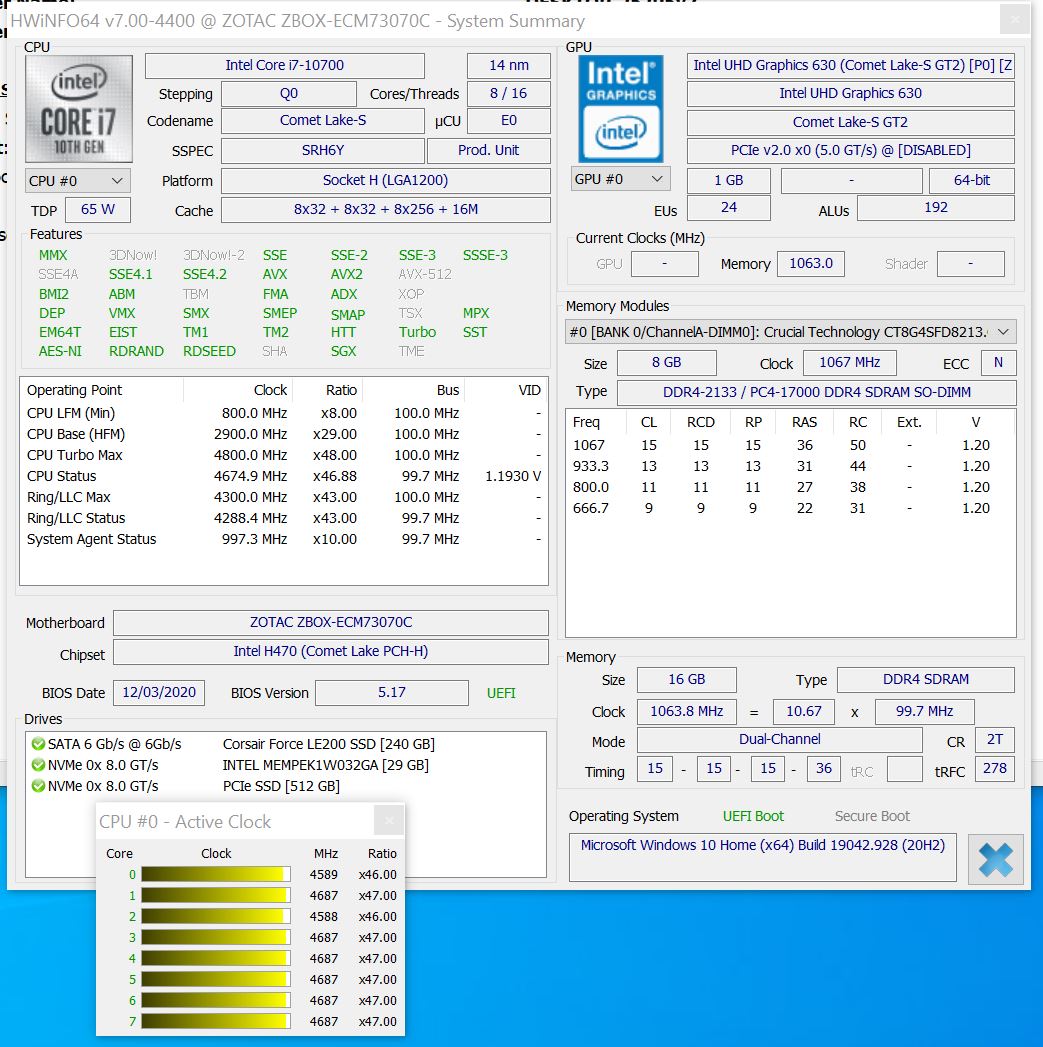
Ce boîtier très compact contient tout ce dont vous avez besoin pour un PC de jeu à part entière. Même le bloc d'alimentation se trouve à l'intérieur du boîtier, et il n'est pas nécessaire de le connecter séparément comme dans le MEK Mini. Une plateforme spécialement développée, basée sur le socket 1200 d'Intel, sert de base. Avec l'Intel Core i7-10700, vous disposez d'un processeur assez moderne qui fait bien son travail, puisque même les tâches exigeantes peuvent être très bien maîtrisées avec ses 8 cœurs et 16 threads. Le modèle de 65 watts est un bon choix, car le développement de la chaleur ne doit pas être négligé. En outre, le système est équipé d'une Zotac GeForce RTX 3070. En raison de l'espace limité, Zotac a décidé d'utiliser un module SO-DIMM pour la RAM, que l'on trouve principalement dans les ordinateurs portables. Vous pouvez choisir entre une variante conventionnelle de 2,5 pouces ou une variante M.2 pour le stockage de masse. Toutefois, il est également possible de combiner les deux. Les emplacements n'interfèrent pas les uns avec les autres

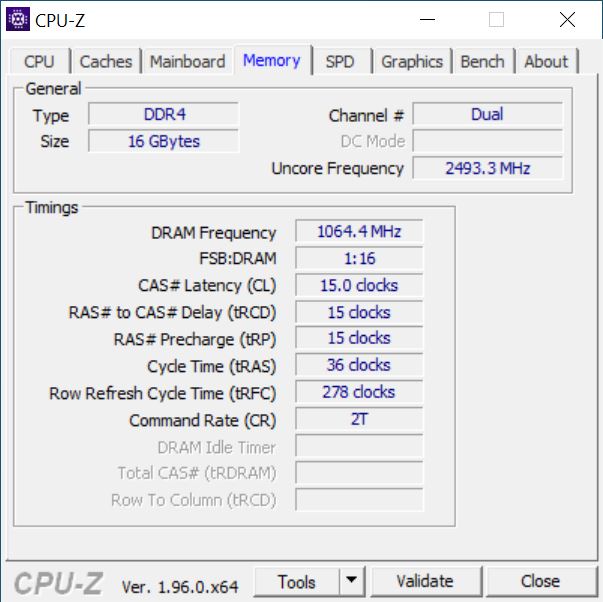
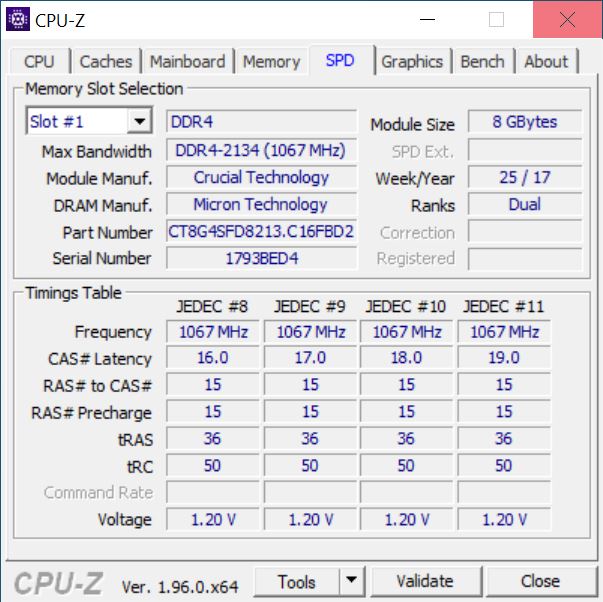
Zotac nous a fourni un Magnus One avec 16 Go de RAM DDR4 et des SSD offrant un total de 750 Go d'espace de stockage. Le système barebone avec la GeForce RTX 3070 est officiellement proposé par Zotac au prix de 1 499 euros (~1 825 dollars). Néanmoins, les modèles disponibles sont listés nettement au-dessus du MSRP (à partir de 1 650 euros (~$2 009)) au moment du test, ce qui est lié aux faibles niveaux de stock des cartes graphiques.

Zotac Magnus One
Zotac Magnus One
Zotac Magnus One
Zotac Magnus One
Zotac Magnus One
Zotac Magnus One
Zotac Magnus One
Zotac Magnus One
Zotac Magnus One
Zotac Magnus One
Zotac Magnus One
Zotac Magnus One
Zotac Magnus One
Zotac Magnus One
Zotac Magnus One
Zotac Magnus One
Zotac Magnus One

Benchmarks des processeurs

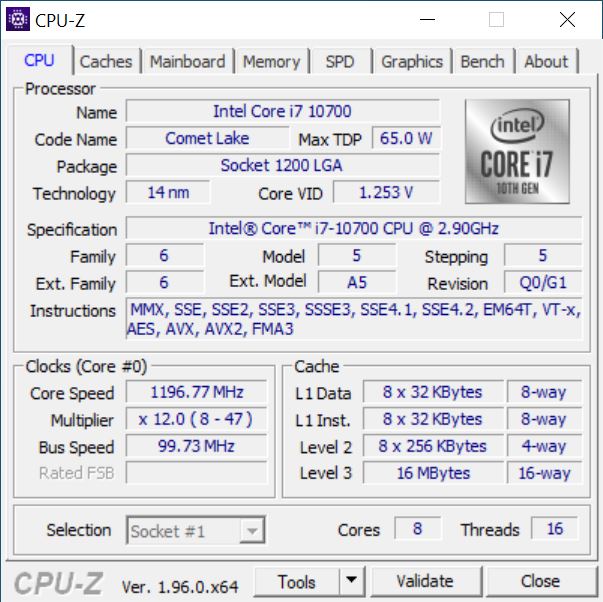
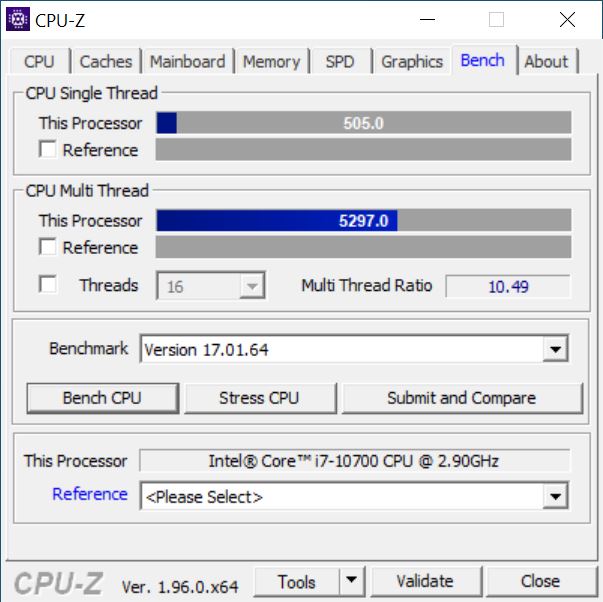
LeIntel Core i7-10700est un processeur octa-core dont le TDP est de 65 watts. La vitesse d'horloge de base est de 2,9 GHz et la vitesse maximale de boost est spécifiée à 4,8 GHz. Le Core i7-10700 obtient un résultat solide dans le Magnus One de Zotac, ne laissant pas de place pour plus en raison de la compacité de ce dernier. Néanmoins, le système se comporte bien et peut largement laisser leIntel Core i7-9700Kderrière dans les tests multithread. Dans les tests à un seul cœur, l'Intel Core i7-10700 de notre système de test est un peu à égalité avec l'Intel Core i5-10600KIntel Comet Lake i5-10600K Notebook Processor

.

Pour d'autres comparaisons et benchmarks, nous vous renvoyons à notretableau de comparaison des CPUProcesseurs mobiles - indice de référence ici.

CPU-Z
CPU-Z
CPU-Z
CPU-Z
CPU-Z
CPU-Z
CPU-Z
GPU-Z
GPU-Z
HWiNFO
Utilitaire Intel Extreme
Intel Extreme Utility (benchmark)
Cinebench R15
CPU Single 64Bit
AMD Ryzen 7 5800X, AMD Ryzen 7 5800X
R7 5800X, 3800 MHz
266 Points +36%
AMD Ryzen 5 5600X, AMD Ryzen 5 5600X
R5 5600X, 3700 MHz
254 Points +30%
Intel Core i9-10900K, Intel Core i9-10900K
i9-10900K, 3700 MHz
224 Points +14%
Intel Core i7-9700K, AMD Radeon RX Vega 64, Intel Core i7-9700K
i7-9700K, 3600 MHz
208 Points +6%
Intel Core i5-10600K, Intel Core i5-10600K
i5-10600K, 4100 MHz
205 Points +5%
Corsair One i160, Intel Core i9-9900K
i9-9900K, 3600 MHz
203 Points +4%
Zotac Magnus One (ECM73070C), Intel Core i7-10700
i7-10700, 2900 MHz
196 Points
Intel Core i5-10400F, Intel Core i5-10400F
i5-10400F, 2900 MHz
180 Points -8%
CPU Multi 64Bit
Intel Core i9-10900K, Intel Core i9-10900K
i9-10900K, 3700 MHz
2620 Points +80%
AMD Ryzen 7 5800X, AMD Ryzen 7 5800X
R7 5800X, 3800 MHz
2616 Points +80%
Corsair One i160, Intel Core i9-9900K
i9-9900K, 3600 MHz
1987 Points +37%
AMD Ryzen 5 5600X, AMD Ryzen 5 5600X
R5 5600X, 3700 MHz
1968 Points +35%
Zotac Magnus One (ECM73070C), Intel Core i7-10700
i7-10700, 2900 MHz
1455 Points
Intel Core i5-10600K, Intel Core i5-10600K
i5-10600K, 4100 MHz
1452 Points 0%
Intel Core i7-9700K, AMD Radeon RX Vega 64, Intel Core i7-9700K
i7-9700K, 3600 MHz
1433 Points -2%
Intel Core i5-10400F, Intel Core i5-10400F
i5-10400F, 2900 MHz
1332 Points -8%
Cinebench R20
CPU (Single Core)
AMD Ryzen 7 5800X, AMD Ryzen 7 5800X
R7 5800X, 3800 MHz
625 Points
AMD Ryzen 5 5600X, AMD Ryzen 5 5600X
R5 5600X, 3700 MHz
601 Points
Intel Core i9-10900K, Intel Core i9-10900K
i9-10900K, 3700 MHz
532 Points
Corsair One i160, Intel Core i9-9900K
i9-9900K, 3600 MHz
495 Points
Intel Core i7-9700K, AMD Radeon RX Vega 64, Intel Core i7-9700K
i7-9700K, 3600 MHz
475 Points
Intel Core i5-10600K, Intel Core i5-10600K
i5-10600K, 4100 MHz
464 Points
Intel Core i5-10400F, Intel Core i5-10400F
i5-10400F, 2900 MHz
438 Points
CPU (Multi Core)
Intel Core i9-10900K, Intel Core i9-10900K
i9-10900K, 3700 MHz
6381 Points
AMD Ryzen 7 5800X, AMD Ryzen 7 5800X
R7 5800X, 3800 MHz
6068 Points
Corsair One i160, Intel Core i9-9900K
i9-9900K, 3600 MHz
4816 Points
AMD Ryzen 5 5600X, AMD Ryzen 5 5600X
R5 5600X, 3700 MHz
4567 Points
Intel Core i5-10600K, Intel Core i5-10600K
i5-10600K, 4100 MHz
3443 Points
Intel Core i7-9700K, AMD Radeon RX Vega 64, Intel Core i7-9700K
i7-9700K, 3600 MHz
3250 Points
Intel Core i5-10400F, Intel Core i5-10400F
i5-10400F, 2900 MHz
3201 Points
Cinebench R11.5
CPU Single 64Bit
AMD Ryzen 7 5800X, AMD Ryzen 7 5800X
R7 5800X, 3800 MHz
3.09 Points +37%
AMD Ryzen 5 5600X, AMD Ryzen 5 5600X
R5 5600X, 3700 MHz
2.95 Points +31%
Intel Core i9-10900K, Intel Core i9-10900K
i9-10900K, 3700 MHz
2.56 Points +13%
Intel Core i7-9700K, AMD Radeon RX Vega 64, Intel Core i7-9700K
i7-9700K, 3600 MHz
2.37 Points +5%
Corsair One i160, Intel Core i9-9900K
i9-9900K, 3600 MHz
2.33 Points +3%
Zotac Magnus One (ECM73070C), Intel Core i7-10700
i7-10700, 2900 MHz
2.26 Points
Intel Core i5-10600K, Intel Core i5-10600K
i5-10600K, 4100 MHz
2.19 Points -3%
Intel Core i5-10400F, Intel Core i5-10400F
i5-10400F, 2900 MHz
2.03 Points -10%
CPU Multi 64Bit
AMD Ryzen 7 5800X, AMD Ryzen 7 5800X
R7 5800X, 3800 MHz
29.31 Points +76%
Intel Core i9-10900K, Intel Core i9-10900K
i9-10900K, 3700 MHz
29.03 Points +74%
Corsair One i160, Intel Core i9-9900K
i9-9900K, 3600 MHz
21.76 Points +30%
AMD Ryzen 5 5600X, AMD Ryzen 5 5600X
R5 5600X, 3700 MHz
21.75 Points +30%
Zotac Magnus One (ECM73070C), Intel Core i7-10700
i7-10700, 2900 MHz
16.7 Points
Intel Core i7-9700K, AMD Radeon RX Vega 64, Intel Core i7-9700K
i7-9700K, 3600 MHz
15.83 Points -5%
Intel Core i5-10600K, Intel Core i5-10600K
i5-10600K, 4100 MHz
15.76 Points -6%
Intel Core i5-10400F, Intel Core i5-10400F
i5-10400F, 2900 MHz
14.39 Points -14%
Cinebench R10
Rendering Single CPUs 64Bit
AMD Ryzen 7 5800X, AMD Ryzen 7 5800X
R7 5800X, 3800 MHz
13039 Points +32%
AMD Ryzen 5 5600X, AMD Ryzen 5 5600X
R5 5600X, 3700 MHz
12563 Points +27%
Intel Core i9-10900K, Intel Core i9-10900K
i9-10900K, 3700 MHz
10625 Points +7%
Corsair One i160, Intel Core i9-9900K
i9-9900K, 3600 MHz
10167 Points +3%
Zotac Magnus One (ECM73070C), Intel Core i7-10700
i7-10700, 2900 MHz
9898 Points
Intel Core i7-9700K, AMD Radeon RX Vega 64, Intel Core i7-9700K
i7-9700K, 3600 MHz
9774 Points -1%
Intel Core i5-10600K, Intel Core i5-10600K
i5-10600K, 4100 MHz
9594 Points -3%
Intel Core i5-10400F, Intel Core i5-10400F
i5-10400F, 2900 MHz
8849 Points -11%
Rendering Multiple CPUs 64Bit
AMD Ryzen 7 5800X, AMD Ryzen 7 5800X
R7 5800X, 3800 MHz
83426 Points +59%
Intel Core i9-10900K, Intel Core i9-10900K
i9-10900K, 3700 MHz
80495 Points +53%
AMD Ryzen 5 5600X, AMD Ryzen 5 5600X
R5 5600X, 3700 MHz
69545 Points +32%
Corsair One i160, Intel Core i9-9900K
i9-9900K, 3600 MHz
63009 Points +20%
Intel Core i7-9700K, AMD Radeon RX Vega 64, Intel Core i7-9700K
i7-9700K, 3600 MHz
53600 Points +2%
Zotac Magnus One (ECM73070C), Intel Core i7-10700
i7-10700, 2900 MHz
52577 Points
Intel Core i5-10600K, Intel Core i5-10600K
i5-10600K, 4100 MHz
51816 Points -1%
Intel Core i5-10400F, Intel Core i5-10400F
i5-10400F, 2900 MHz
47901 Points -9%
Blender - v2.79 BMW27 CPU
Intel Core i3-10100, Intel Core i3-10100
i3-10100, 3600 MHz
495.1 Seconds * -57%
Intel Core i5-10400F, Intel Core i5-10400F
i5-10400F, 2900 MHz
332.4 Seconds * -5%
Zotac Magnus One (ECM73070C), Intel Core i7-10700
i7-10700, 2900 MHz
315.4 Seconds *
Intel Core i7-9700K, AMD Radeon RX Vega 64, Intel Core i7-9700K
i7-9700K, 3600 MHz
307 Seconds * +3%
Intel Core i5-10600K, Intel Core i5-10600K
i5-10600K, 4100 MHz
302.4 Seconds * +4%
AMD Ryzen 5 5600X, AMD Ryzen 5 5600X
R5 5600X, 3700 MHz
260.2 Seconds * +18%
Corsair One i160, Intel Core i9-9900K
i9-9900K, 3600 MHz
223.8 Seconds * +29%
AMD Ryzen 7 5800X, AMD Ryzen 7 5800X
R7 5800X, 3800 MHz
196.8 Seconds * +38%
Intel Core i9-10900K, Intel Core i9-10900K
i9-10900K, 3700 MHz
167.3 Seconds * +47%
wPrime 2.10
32m
Intel Core i5-10400F, Intel Core i5-10400F
i5-10400F, 2900 MHz
6.25 s * -92%
Intel Core i5-10600K, Intel Core i5-10600K
i5-10600K, 4100 MHz
4.648 s * -43%
Intel Core i7-9700K, AMD Radeon RX Vega 64, Intel Core i7-9700K
i7-9700K, 3600 MHz
4.491 s * -38%
AMD Ryzen 5 5600X, AMD Ryzen 5 5600X
R5 5600X, 3700 MHz
3.891 s * -19%
Intel Core i9-10900K, Intel Core i9-10900K
i9-10900K, 3700 MHz
3.582 s * -10%
Corsair One i160, Intel Core i9-9900K
i9-9900K, 3600 MHz
3.276 s * -1%
Zotac Magnus One (ECM73070C), Intel Core i7-10700
i7-10700, 2900 MHz
3.257 s *
AMD Ryzen 7 5800X, AMD Ryzen 7 5800X
R7 5800X, 3800 MHz
3.037 s * +7%
1024m
Intel Core i5-10400F, Intel Core i5-10400F
i5-10400F, 2900 MHz
134.7 s * -13%
Intel Core i7-9700K, AMD Radeon RX Vega 64, Intel Core i7-9700K
i7-9700K, 3600 MHz
120.5 s * -1%
Zotac Magnus One (ECM73070C), Intel Core i7-10700
i7-10700, 2900 MHz
119.5 s *
AMD Ryzen 5 5600X, AMD Ryzen 5 5600X
R5 5600X, 3700 MHz
113.9 s * +5%
Intel Core i5-10600K, Intel Core i5-10600K
i5-10600K, 4100 MHz
113.2 s * +5%
Corsair One i160, Intel Core i9-9900K
i9-9900K, 3600 MHz
91.3 s * +24%
AMD Ryzen 7 5800X, AMD Ryzen 7 5800X
R7 5800X, 3800 MHz
86.1 s * +28%
Intel Core i9-10900K, Intel Core i9-10900K
i9-10900K, 3700 MHz
66.3 s * +45%
X264 HD Benchmark 4.0
Pass 1
AMD Ryzen 7 5800X, AMD Ryzen 7 5800X
R7 5800X, 3800 MHz
339 (338min - 341max) fps +44%
AMD Ryzen 5 5600X, AMD Ryzen 5 5600X
R5 5600X, 3700 MHz
320 (319min - 321max) fps +36%
Intel Core i9-10900K, Intel Core i9-10900K
i9-10900K, 3700 MHz
289.5 (289min - 291max) fps +23%
Intel Core i7-9700K, AMD Radeon RX Vega 64, Intel Core i7-9700K
i7-9700K, 3600 MHz
270 (270min - 271max) fps +14%
Corsair One i160, Intel Core i9-9900K
i9-9900K, 3600 MHz
267.5 (267min - 268max) fps +13%
Intel Core i5-10600K, Intel Core i5-10600K
i5-10600K, 4100 MHz
251.5 (250min - 253max) fps +7%
Zotac Magnus One (ECM73070C), Intel Core i7-10700
i7-10700, 2900 MHz
236 (235min - 257max) fps
Intel Core i5-10400F, Intel Core i5-10400F
i5-10400F, 2900 MHz
228.5 (228min - 231max) fps -3%
Pass 2
AMD Ryzen 7 5800X, AMD Ryzen 7 5800X
R7 5800X, 3800 MHz
152 (151min - 152max) fps +79%
Intel Core i9-10900K, Intel Core i9-10900K
i9-10900K, 3700 MHz
149 (149min - 149max) fps +76%
Corsair One i160, Intel Core i9-9900K
i9-9900K, 3600 MHz
117.5 (117min - 118max) fps +39%
AMD Ryzen 5 5600X, AMD Ryzen 5 5600X
R5 5600X, 3700 MHz
117 (117min - 117max) fps +38%
Intel Core i7-9700K, AMD Radeon RX Vega 64, Intel Core i7-9700K
i7-9700K, 3600 MHz
94.8 (94.7min - 95max) fps +12%
Intel Core i5-10600K, Intel Core i5-10600K
i5-10600K, 4100 MHz
88.2 (88min - 88.2max) fps +4%
Zotac Magnus One (ECM73070C), Intel Core i7-10700
i7-10700, 2900 MHz
84.8 (84.6min - 105max) fps
Intel Core i5-10400F, Intel Core i5-10400F
i5-10400F, 2900 MHz
81.2 (81min - 81.3max) fps -4%
WinRAR - Result
AMD Ryzen 7 5800X, AMD Ryzen 7 5800X
R7 5800X, 3800 MHz
15604 KB/s +138%
AMD Ryzen 5 5600X, AMD Ryzen 5 5600X
R5 5600X, 3700 MHz
13282 KB/s +103%
Intel Core i9-10900K, Intel Core i9-10900K
i9-10900K, 3700 MHz
9739 KB/s +49%
Corsair One i160, Intel Core i9-9900K
i9-9900K, 3600 MHz
7621 KB/s +16%
Intel Core i7-9700K, AMD Radeon RX Vega 64, Intel Core i7-9700K
i7-9700K, 3600 MHz
7396 KB/s +13%
Zotac Magnus One (ECM73070C), Intel Core i7-10700
i7-10700, 2900 MHz
6555 KB/s
Intel Core i5-10600K, Intel Core i5-10600K
i5-10600K, 4100 MHz
6536 KB/s 0%
TrueCrypt
AES Mean 100MB
AMD Ryzen 7 5800X, AMD Ryzen 7 5800X
R7 5800X, 3800 MHz
15 GB/s +46%
Intel Core i9-10900K, Intel Core i9-10900K
i9-10900K, 3700 MHz
14.6 GB/s +42%
Corsair One i160, Intel Core i9-9900K
i9-9900K, 3600 MHz
11.5 GB/s +12%
AMD Ryzen 5 5600X, AMD Ryzen 5 5600X
R5 5600X, 3700 MHz
10.7 GB/s +4%
Zotac Magnus One (ECM73070C), Intel Core i7-10700
i7-10700, 2900 MHz
10.3 GB/s
Intel Core i7-9700K, AMD Radeon RX Vega 64, Intel Core i7-9700K
i7-9700K, 3600 MHz
8.1 GB/s -21%
Intel Core i5-10600K, Intel Core i5-10600K
i5-10600K, 4100 MHz
8 GB/s -22%
Twofish Mean 100MB
Intel Core i9-10900K, Intel Core i9-10900K
i9-10900K, 3700 MHz
2.6 GB/s +44%
AMD Ryzen 7 5800X, AMD Ryzen 7 5800X
R7 5800X, 3800 MHz
2 GB/s +11%
Corsair One i160, Intel Core i9-9900K
i9-9900K, 3600 MHz
1.9 GB/s +6%
Zotac Magnus One (ECM73070C), Intel Core i7-10700
i7-10700, 2900 MHz
1.8 GB/s
AMD Ryzen 5 5600X, AMD Ryzen 5 5600X
R5 5600X, 3700 MHz
1.5 GB/s -17%
Intel Core i5-10600K, Intel Core i5-10600K
i5-10600K, 4100 MHz
1.4 GB/s -22%
Intel Core i7-9700K, AMD Radeon RX Vega 64, Intel Core i7-9700K
i7-9700K, 3600 MHz
1.3 GB/s -28%
Serpent Mean 100MB
Intel Core i9-10900K, Intel Core i9-10900K
i9-10900K, 3700 MHz
1.5 GB/s +36%
AMD Ryzen 7 5800X, AMD Ryzen 7 5800X
R7 5800X, 3800 MHz
1.3 GB/s +18%
Corsair One i160, Intel Core i9-9900K
i9-9900K, 3600 MHz
1.1 GB/s 0%
Zotac Magnus One (ECM73070C), Intel Core i7-10700
i7-10700, 2900 MHz
1.1 GB/s
AMD Ryzen 5 5600X, AMD Ryzen 5 5600X
R5 5600X, 3700 MHz
0.938 GB/s -15%
Intel Core i5-10600K, Intel Core i5-10600K
i5-10600K, 4100 MHz
0.82 GB/s -25%
Intel Core i7-9700K, AMD Radeon RX Vega 64, Intel Core i7-9700K
i7-9700K, 3600 MHz
0.774 GB/s -30%
Geekbench 5.5
Multi-Core
Intel Core i9-10900K, Intel Core i9-10900K
i9-10900K, 3700 MHz
11414 Points +40%
AMD Ryzen 7 5800X, AMD Ryzen 7 5800X
R7 5800X, 3800 MHz
11354 Points +39%
AMD Ryzen 5 5600X, AMD Ryzen 5 5600X
R5 5600X, 3700 MHz
8980 Points +10%
Zotac Magnus One (ECM73070C), Intel Core i7-10700
i7-10700, 2900 MHz
8173 Points
Intel Core i7-9700K, AMD Radeon RX Vega 64, Intel Core i7-9700K
i7-9700K, 3600 MHz
7440 Points -9%
Intel Core i5-10600K, Intel Core i5-10600K
i5-10600K, 4100 MHz
7248 Points -11%
Intel Core i5-10400F, Intel Core i5-10400F
i5-10400F, 2900 MHz
6372 Points -22%
Intel Core i5-10400F, Intel Core i5-10400F
i5-10400F, 2900 MHz
6358 Points -22%
Intel Core i3-10100, Intel Core i3-10100
i3-10100, 3600 MHz
4740 Points -42%
Single-Core
AMD Ryzen 7 5800X, AMD Ryzen 7 5800X
R7 5800X, 3800 MHz
1665 Points +28%
AMD Ryzen 5 5600X, AMD Ryzen 5 5600X
R5 5600X, 3700 MHz
1657 Points +28%
Intel Core i9-10900K, Intel Core i9-10900K
i9-10900K, 3700 MHz
1449 Points +12%
Intel Core i7-9700K, AMD Radeon RX Vega 64, Intel Core i7-9700K
i7-9700K, 3600 MHz
1300 Points 0%
Zotac Magnus One (ECM73070C), Intel Core i7-10700
i7-10700, 2900 MHz
1299 Points
Intel Core i5-10600K, Intel Core i5-10600K
i5-10600K, 4100 MHz
1286 Points -1%
Intel Core i5-10400F, Intel Core i5-10400F
i5-10400F, 2900 MHz
1223 Points -6%
Intel Core i5-10400F, Intel Core i5-10400F
i5-10400F, 2900 MHz
1217 Points -6%
Intel Core i3-10100, Intel Core i3-10100
i3-10100, 3600 MHz
1171 Points -10%
Geekbench 5.0
5.0 Multi-Core
Intel Core i9-10900K, Intel Core i9-10900K
i9-10900K, 3700 MHz
11407 Points +39%
AMD Ryzen 7 5800X, AMD Ryzen 7 5800X
R7 5800X, 3800 MHz
11246 Points +37%
AMD Ryzen 5 5600X, AMD Ryzen 5 5600X
R5 5600X, 3700 MHz
8926 Points +9%
Zotac Magnus One (ECM73070C), Intel Core i7-10700
i7-10700, 2900 MHz
8196 Points
Intel Core i5-10600K, Intel Core i5-10600K
i5-10600K, 4100 MHz
7237 Points -12%
Intel Core i5-10400F, Intel Core i5-10400F
i5-10400F, 2900 MHz
6349 Points -23%
Intel Core i3-10100, Intel Core i3-10100
i3-10100, 3600 MHz
4724 Points -42%
5.0 Single-Core
AMD Ryzen 7 5800X, AMD Ryzen 7 5800X
R7 5800X, 3800 MHz
1673 Points +28%
AMD Ryzen 5 5600X, AMD Ryzen 5 5600X
R5 5600X, 3700 MHz
1587 Points +22%
Intel Core i9-10900K, Intel Core i9-10900K
i9-10900K, 3700 MHz
1440 Points +10%
Zotac Magnus One (ECM73070C), Intel Core i7-10700
i7-10700, 2900 MHz
1304 Points
Intel Core i5-10600K, Intel Core i5-10600K
i5-10600K, 4100 MHz
1281 Points -2%
Intel Core i5-10400F, Intel Core i5-10400F
i5-10400F, 2900 MHz
1217 Points -7%
Intel Core i3-10100, Intel Core i3-10100
i3-10100, 3600 MHz
1167 Points -11%
Geekbench 4.4
64 Bit Single-Core Score
AMD Ryzen 7 5800X, AMD Ryzen 7 5800X
R7 5800X, 3800 MHz
7333 Points +28%
AMD Ryzen 5 5600X, AMD Ryzen 5 5600X
R5 5600X, 3700 MHz
6953 Points +21%
Intel Core i9-10900K, Intel Core i9-10900K
i9-10900K, 3700 MHz
6348 Points +11%
Intel Core i7-9700K, AMD Radeon RX Vega 64, Intel Core i7-9700K
i7-9700K, 3600 MHz
6043 Points +6%
Corsair One i160, Intel Core i9-9900K
i9-9900K, 3600 MHz
6014 Points +5%
Intel Core i5-10600K, Intel Core i5-10600K
i5-10600K, 4100 MHz
5821 Points +2%
Zotac Magnus One (ECM73070C), Intel Core i7-10700
i7-10700, 2900 MHz
5726 Points
Intel Core i5-10400F, Intel Core i5-10400F
i5-10400F, 2900 MHz
5587 Points -2%
Intel Core i3-10100, Intel Core i3-10100
i3-10100, 3600 MHz
5494 Points -4%
64 Bit Multi-Core Score
AMD Ryzen 7 5800X, AMD Ryzen 7 5800X
R7 5800X, 3800 MHz
44131 Points +37%
Intel Core i9-10900K, Intel Core i9-10900K
i9-10900K, 3700 MHz
43058 Points +34%
AMD Ryzen 5 5600X, AMD Ryzen 5 5600X
R5 5600X, 3700 MHz
35617 Points +11%
Corsair One i160, Intel Core i9-9900K
i9-9900K, 3600 MHz
33892 Points +5%
Zotac Magnus One (ECM73070C), Intel Core i7-10700
i7-10700, 2900 MHz
32174 Points
Intel Core i7-9700K, AMD Radeon RX Vega 64, Intel Core i7-9700K
i7-9700K, 3600 MHz
29659 Points -8%
Intel Core i5-10600K, Intel Core i5-10600K
i5-10600K, 4100 MHz
28391 Points -12%
Intel Core i5-10400F, Intel Core i5-10400F
i5-10400F, 2900 MHz
25403 Points -21%
Intel Core i3-10100, Intel Core i3-10100
i3-10100, 3600 MHz
18622 Points -42%
3DMark 11 - 1280x720 Performance Physics
AMD Ryzen 7 5800X, AMD Ryzen 7 5800X
R7 5800X, 3800 MHz
23381 Points +51%
Intel Core i9-10900K, Intel Core i9-10900K
i9-10900K, 3700 MHz
22140 Points +43%
AMD Ryzen 5 5600X, AMD Ryzen 5 5600X
R5 5600X, 3700 MHz
19649 Points +27%
Corsair One i160, Intel Core i9-9900K
i9-9900K, 3600 MHz
19169 Points +24%
Intel Core i7-9700K, AMD Radeon RX Vega 64, Intel Core i7-9700K
i7-9700K, 3600 MHz
16091 Points +4%
Intel Core i5-10600K, Intel Core i5-10600K
i5-10600K, 4100 MHz
15961 Points +3%
Zotac Magnus One (ECM73070C), Intel Core i7-10700
i7-10700, 2900 MHz
15497 Points
Intel Core i5-10400F, Intel Core i5-10400F
i5-10400F, 2900 MHz
14539 Points -6%
7-Zip 18.03
7z b 4
AMD Ryzen 7 5800X, AMD Ryzen 7 5800X
R7 5800X, 3800 MHz
74306 MIPS +73%
Intel Core i9-10900K, Intel Core i9-10900K
i9-10900K, 3700 MHz
70968 MIPS +65%
AMD Ryzen 5 5600X, AMD Ryzen 5 5600X
R5 5600X, 3700 MHz
56607 MIPS +32%
Corsair One i160, Intel Core i9-9900K
i9-9900K, 3600 MHz
53166 MIPS +24%
Zotac Magnus One (ECM73070C), Intel Core i7-10700
i7-10700, 2900 MHz
43007 MIPS
Intel Core i5-10600K, Intel Core i5-10600K
i5-10600K, 4100 MHz
40379 MIPS -6%
Intel Core i5-10400F, Intel Core i5-10400F
i5-10400F, 2900 MHz
36731 MIPS -15%
Intel Core i3-10100, Intel Core i3-10100
i3-10100, 3600 MHz
24319 MIPS -43%
7z b 4 -mmt1
AMD Ryzen 7 5800X, AMD Ryzen 7 5800X
R7 5800X, 3800 MHz
6970 MIPS +32%
AMD Ryzen 5 5600X, AMD Ryzen 5 5600X
R5 5600X, 3700 MHz
6594 MIPS +25%
Intel Core i9-10900K, Intel Core i9-10900K
i9-10900K, 3700 MHz
5954 MIPS +12%
Corsair One i160, Intel Core i9-9900K
i9-9900K, 3600 MHz
5311 MIPS 0%
Zotac Magnus One (ECM73070C), Intel Core i7-10700
i7-10700, 2900 MHz
5293 MIPS
Intel Core i5-10600K, Intel Core i5-10600K
i5-10600K, 4100 MHz
5289 MIPS 0%
Intel Core i5-10400F, Intel Core i5-10400F
i5-10400F, 2900 MHz
5064 MIPS -4%
Intel Core i3-10100, Intel Core i3-10100
i3-10100, 3600 MHz
4797 MIPS -9%
HWBOT x265 Benchmark v2.2 - 4k Preset
Intel Core i9-10900K, Intel Core i9-10900K
i9-10900K, 3700 MHz
21 fps +81%
AMD Ryzen 7 5800X, AMD Ryzen 7 5800X
R7 5800X, 3800 MHz
20.8 fps +79%
Corsair One i160, Intel Core i9-9900K
i9-9900K, 3600 MHz
15.8 fps +36%
AMD Ryzen 5 5600X, AMD Ryzen 5 5600X
R5 5600X, 3700 MHz
15.7 fps +35%
Intel Core i7-9700K, AMD Radeon RX Vega 64, Intel Core i7-9700K
i7-9700K, 3600 MHz
13 fps +12%
Intel Core i5-10600K, Intel Core i5-10600K
i5-10600K, 4100 MHz
12.2 fps +5%
Zotac Magnus One (ECM73070C), Intel Core i7-10700
i7-10700, 2900 MHz
11.6 fps
Intel Core i5-10400F, Intel Core i5-10400F
i5-10400F, 2900 MHz
11.2 fps -3%
Intel Core i3-10100, Intel Core i3-10100
i3-10100, 3600 MHz
7.7 fps -34%
R Benchmark 2.5 - Overall mean
Intel Core i3-10100, Intel Core i3-10100
i3-10100, 3600 MHz
0.652 sec * -11%
Intel Core i5-10400F, Intel Core i5-10400F
i5-10400F, 2900 MHz
0.618 sec * -5%
Intel Core i5-10600K, Intel Core i5-10600K
i5-10600K, 4100 MHz
0.593 sec * -1%
Zotac Magnus One (ECM73070C), Intel Core i7-10700
i7-10700, 2900 MHz
0.588 sec *
Intel Core i9-10900K, Intel Core i9-10900K
i9-10900K, 3700 MHz
0.528 sec * +10%
AMD Ryzen 5 5600X, AMD Ryzen 5 5600X
R5 5600X, 3700 MHz
0.4778 sec * +19%
AMD Ryzen 7 5800X, AMD Ryzen 7 5800X
R7 5800X, 3800 MHz
0.4509 sec * +23%
LibreOffice - 20 Documents To PDF
Intel Core i9-10900K, Intel Core i9-10900K
i9-10900K, 3700 MHz
76 s * -28%
Zotac Magnus One (ECM73070C), Intel Core i7-10700
i7-10700, 2900 MHz
59.5 s *
Intel Core i3-10100, Intel Core i3-10100
i3-10100, 3600 MHz
58.1 s * +2%
Intel Core i5-10400F, Intel Core i5-10400F
i5-10400F, 2900 MHz
57.1 s * +4%
Intel Core i5-10600K, Intel Core i5-10600K
i5-10600K, 4100 MHz
46.06 s * +23%
AMD Ryzen 5 5600X, AMD Ryzen 5 5600X
R5 5600X, 3700 MHz
45.14 s * +24%
AMD Ryzen 7 5800X, AMD Ryzen 7 5800X
R7 5800X, 3800 MHz
43.31 s * +27%
WebXPRT 3 - Overall
AMD Ryzen 7 5800X, AMD Ryzen 7 5800X
R7 5800X, 3800 MHz
296 Points +21%
AMD Ryzen 5 5600X, AMD Ryzen 5 5600X
R5 5600X, 3700 MHz
286 Points +17%
Intel Core i9-10900K, Intel Core i9-10900K
i9-10900K, 3700 MHz
255 Points +5%
Zotac Magnus One (ECM73070C), Intel Core i7-10700
i7-10700, 2900 MHz
244 Points
Intel Core i5-10600K, Intel Core i5-10600K
i5-10600K, 4100 MHz
239 Points -2%
Intel Core i5-10400F, Intel Core i5-10400F
i5-10400F, 2900 MHz
215 Points -12%
Intel Core i3-10100, Intel Core i3-10100
i3-10100, 3600 MHz
213 Points -13%
Mozilla Kraken 1.1 - Total
Intel Core i5-10400F, Intel Core i5-10400F
i5-10400F, 2900 MHz
849 ms * -13%
Intel Core i3-10100, Intel Core i3-10100
i3-10100, 3600 MHz
838 ms * -11%
Intel Core i5-10600K, Intel Core i5-10600K
i5-10600K, 4100 MHz
760 ms * -1%
Zotac Magnus One (ECM73070C), Intel Core i7-10700
i7-10700, 2900 MHz
752 ms *
Intel Core i9-10900K, Intel Core i9-10900K
i9-10900K, 3700 MHz
709 ms * +6%
AMD Ryzen 5 5600X, AMD Ryzen 5 5600X
R5 5600X, 3700 MHz
578 ms * +23%
AMD Ryzen 7 5800X, AMD Ryzen 7 5800X
R7 5800X, 3800 MHz
558 ms * +26%
3DMark
3840x2160 Fire Strike Ultra Physics
Intel Core i3-10100, Intel Core i3-10100
i3-10100, 3600 MHz
34056 Points +58%
AMD Ryzen 7 5800X, AMD Ryzen 7 5800X
R7 5800X, 3800 MHz
31095 Points +44%
Intel Core i9-10900K, Intel Core i9-10900K
i9-10900K, 3700 MHz
29374 Points +36%
AMD Ryzen 5 5600X, AMD Ryzen 5 5600X
R5 5600X, 3700 MHz
26038 Points +21%
Corsair One i160, Intel Core i9-9900K
i9-9900K, 3600 MHz
24544 Points +14%
Zotac Magnus One (ECM73070C), Intel Core i7-10700
i7-10700, 2900 MHz
21542 Points
Intel Core i5-10600K, Intel Core i5-10600K
i5-10600K, 4100 MHz
19942 Points -7%
Intel Core i7-9700K, AMD Radeon RX Vega 64, Intel Core i7-9700K
i7-9700K, 3600 MHz
18796 Points -13%
Intel Core i5-10400F, Intel Core i5-10400F
i5-10400F, 2900 MHz
18082 Points -16%
1920x1080 Fire Strike Physics
Intel Core i3-10100, Intel Core i3-10100
i3-10100, 3600 MHz
35894 Points +79%
AMD Ryzen 7 5800X, AMD Ryzen 7 5800X
R7 5800X, 3800 MHz
30938 Points +54%
Intel Core i9-10900K, Intel Core i9-10900K
i9-10900K, 3700 MHz
29805 Points +48%
AMD Ryzen 5 5600X, AMD Ryzen 5 5600X
R5 5600X, 3700 MHz
25990 Points +29%
Corsair One i160, Intel Core i9-9900K
i9-9900K, 3600 MHz
24697 Points +23%
Zotac Magnus One (ECM73070C), Intel Core i7-10700
i7-10700, 2900 MHz
20080 Points
Intel Core i5-10600K, Intel Core i5-10600K
i5-10600K, 4100 MHz
20040 Points 0%
Intel Core i7-9700K, AMD Radeon RX Vega 64, Intel Core i7-9700K
i7-9700K, 3600 MHz
18780 Points -6%
2560x1440 Time Spy CPU
Intel Core i9-10900K, Intel Core i9-10900K
i9-10900K, 3700 MHz
14326 Points +67%
AMD Ryzen 7 5800X, AMD Ryzen 7 5800X
R7 5800X, 3800 MHz
11599 Points +35%
Corsair One i160, Intel Core i9-9900K
i9-9900K, 3600 MHz
10867 Points +27%
AMD Ryzen 5 5600X, AMD Ryzen 5 5600X
R5 5600X, 3700 MHz
8911 Points +4%
Zotac Magnus One (ECM73070C), Intel Core i7-10700
i7-10700, 2900 MHz
8580 Points
Intel Core i7-9700K, AMD Radeon RX Vega 64, Intel Core i7-9700K
i7-9700K, 3600 MHz
8349 Points -3%
Intel Core i5-10600K, Intel Core i5-10600K
i5-10600K, 4100 MHz
8290 Points -3%
Intel Core i5-10400F, Intel Core i5-10400F
i5-10400F, 2900 MHz
7548 Points -12%
Intel Core i3-10100, Intel Core i3-10100
i3-10100, 3600 MHz
5333 Points -38%

* ... Moindre est la valeur, meilleures sont les performances

Zotac Magnus One dans la boucle multiple de Cinebench R15

L'Intel Core i7-10700 connaît une légère baisse de performance après la première exécution, mais elle devient de plus en plus stable dans la suite du test. Néanmoins, les performances sont à un niveau élevé avec une moyenne de 1 338 points

1184.71284.71384.7Tooltip
Zotac Magnus One (ECM73070C): Ø1338 (1184.66-1454.54)

Performance des applications

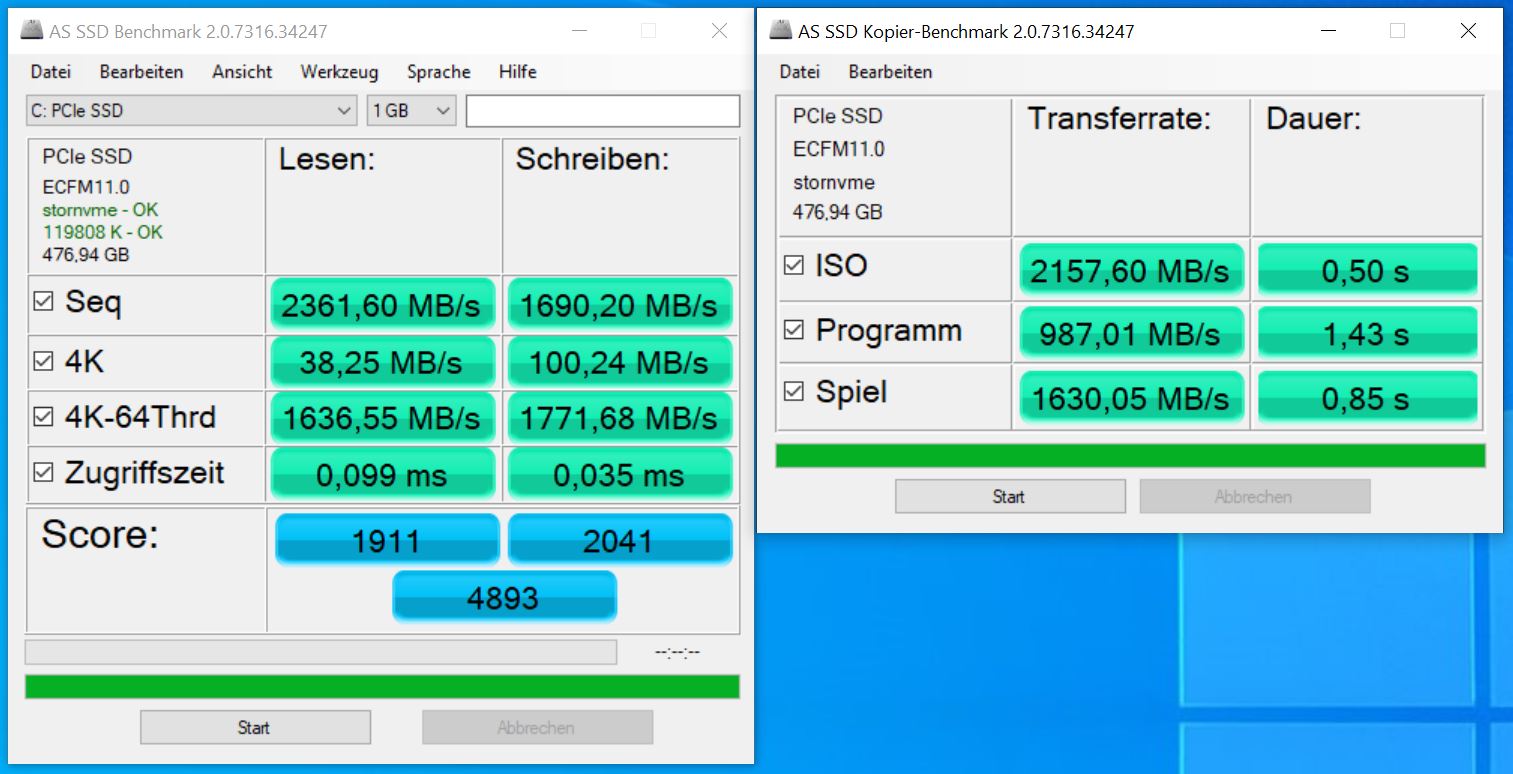
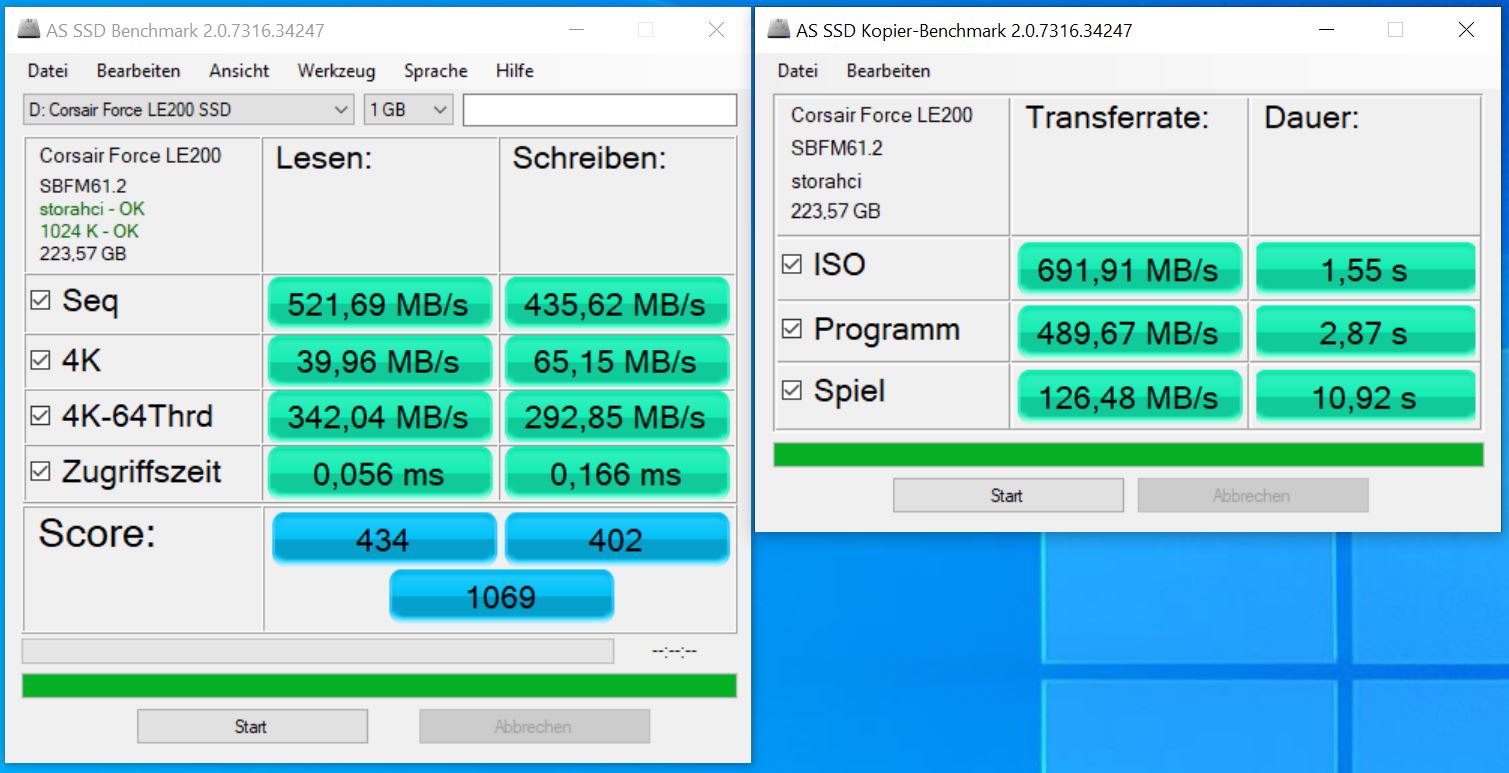
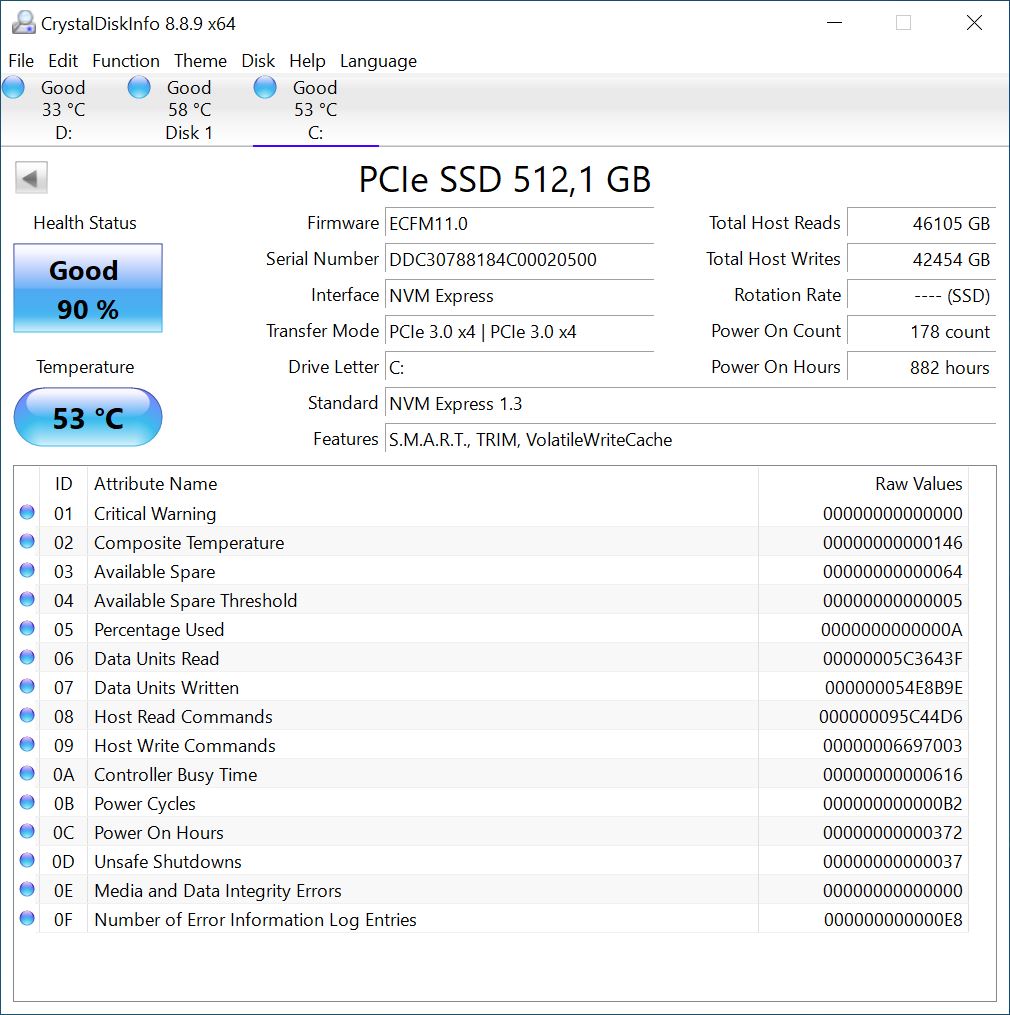
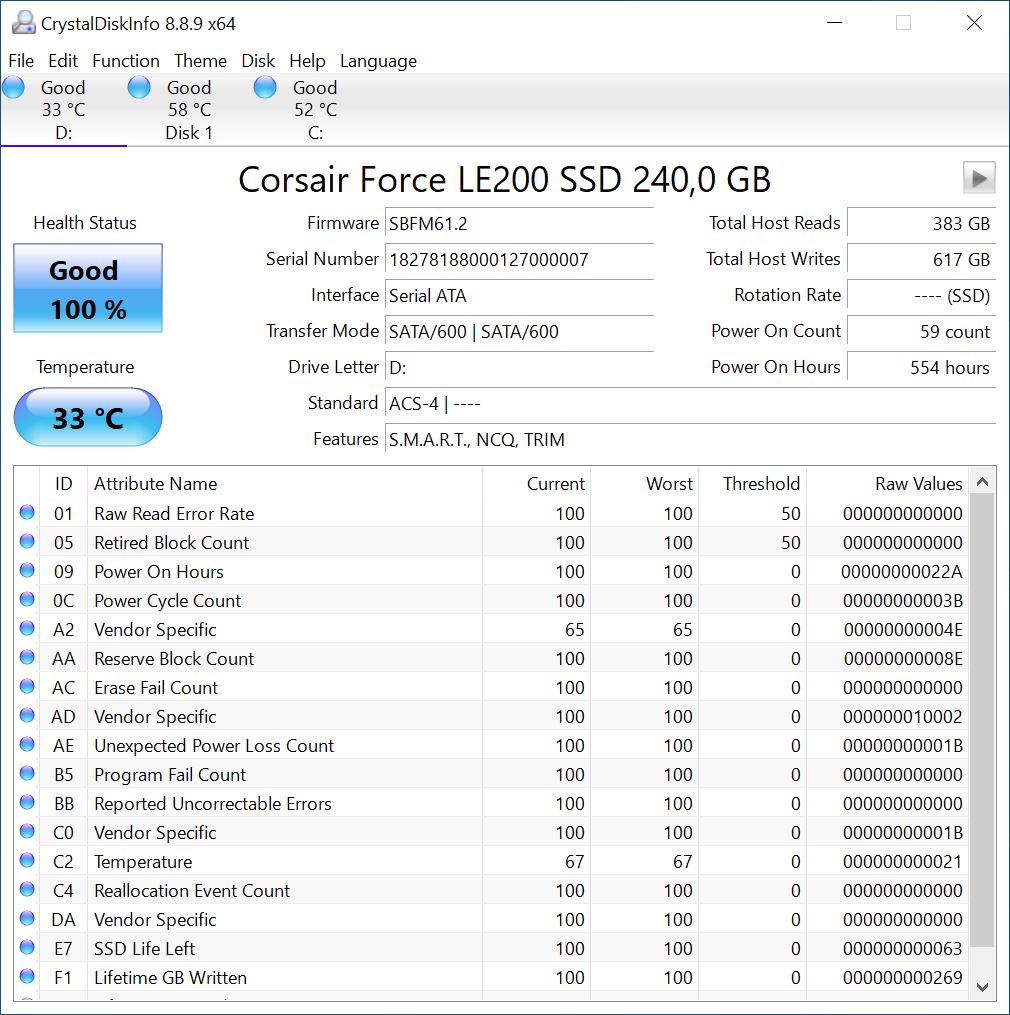
Notre configuration de test de la Magnus One obtient des taux relativement bons dans nos benchmarks d'application. Néanmoins, nous nous attendions à de meilleures performances en raison des composants intégrés. Comparé à nos autres systèmes de test, le Magnus One est souvent à la traîne. Nous apprécions le fait qu'il ne dispose pas d'un disque dur conventionnel. Toutefois, les utilisateurs ont la liberté de choisir le type de périphérique de stockage de masse qu'ils souhaitent utiliser. Les captures d'écran ci-jointes donnent une idée approximative des performances auxquelles on peut s'attendre. Le boîtier peut accueillir un total de trois périphériques de stockage de masse

AS SSD PCIe SSD (512 GB)
AS SSD SATA SSD (240 GB)
CDI PCIe SSD (512 GB)
CDI SATA SSD (240 GB)
PCMark 10
Score
AMD Ryzen 5 5600X, AMD Ryzen 5 5600X
NVIDIA Titan RTX
8270 Points +27%
AMD Ryzen 7 5800X, AMD Ryzen 7 5800X
NVIDIA Titan RTX
8252 Points +27%
Intel Core i3-10100, Intel Core i3-10100
NVIDIA Titan RTX
7926 Points +22%
Intel Core i9-10900K, Intel Core i9-10900K
NVIDIA Titan RTX
7641 Points +18%
Intel Core i5-10600K, Intel Core i5-10600K
NVIDIA Titan RTX
7279 Points +12%
Intel Core i7-9700K, AMD Radeon RX Vega 64, Intel Core i7-9700K
AMD Radeon RX Vega 64
6797 Points +5%
Intel Core i5-10400F, Intel Core i5-10400F
NVIDIA Titan RTX
6551 Points +1%
Zotac Magnus One (ECM73070C), Intel Core i7-10700
NVIDIA GeForce RTX 3070
6499 Points
Digital Content Creation
Intel Core i3-10100, Intel Core i3-10100
NVIDIA Titan RTX
14158 Points +39%
AMD Ryzen 7 5800X, AMD Ryzen 7 5800X
NVIDIA Titan RTX
13130 Points +29%
Intel Core i9-10900K, Intel Core i9-10900K
NVIDIA Titan RTX
12754 Points +26%
AMD Ryzen 5 5600X, AMD Ryzen 5 5600X
NVIDIA Titan RTX
12414 Points +22%
Intel Core i5-10600K, Intel Core i5-10600K
NVIDIA Titan RTX
11150 Points +10%
Zotac Magnus One (ECM73070C), Intel Core i7-10700
NVIDIA GeForce RTX 3070
10161 Points
Intel Core i5-10400F, Intel Core i5-10400F
NVIDIA Titan RTX
9845 Points -3%
Intel Core i7-9700K, AMD Radeon RX Vega 64, Intel Core i7-9700K
AMD Radeon RX Vega 64
9206 Points -9%
Productivity
AMD Ryzen 7 5800X, AMD Ryzen 7 5800X
NVIDIA Titan RTX
11069 Points +49%
AMD Ryzen 5 5600X, AMD Ryzen 5 5600X
NVIDIA Titan RTX
10963 Points +47%
Intel Core i3-10100, Intel Core i3-10100
NVIDIA Titan RTX
9414 Points +26%
Intel Core i5-10600K, Intel Core i5-10600K
NVIDIA Titan RTX
9361 Points +26%
Intel Core i7-9700K, AMD Radeon RX Vega 64, Intel Core i7-9700K
AMD Radeon RX Vega 64
9332 Points +25%
Intel Core i9-10900K, Intel Core i9-10900K
NVIDIA Titan RTX
9057 Points +22%
Intel Core i5-10400F, Intel Core i5-10400F
NVIDIA Titan RTX
8191 Points +10%
Zotac Magnus One (ECM73070C), Intel Core i7-10700
NVIDIA GeForce RTX 3070
7447 Points
Essentials
AMD Ryzen 7 5800X, AMD Ryzen 7 5800X
NVIDIA Titan RTX
11386 Points +16%
AMD Ryzen 5 5600X, AMD Ryzen 5 5600X
NVIDIA Titan RTX
11280 Points +15%
Intel Core i9-10900K, Intel Core i9-10900K
NVIDIA Titan RTX
10483 Points +6%
Intel Core i3-10100, Intel Core i3-10100
NVIDIA Titan RTX
10138 Points +3%
Intel Core i5-10600K, Intel Core i5-10600K
NVIDIA Titan RTX
10028 Points +2%
Intel Core i7-9700K, AMD Radeon RX Vega 64, Intel Core i7-9700K
AMD Radeon RX Vega 64
9922 Points +1%
Zotac Magnus One (ECM73070C), Intel Core i7-10700
NVIDIA GeForce RTX 3070
9846 Points
Intel Core i5-10400F, Intel Core i5-10400F
NVIDIA Titan RTX
9465 Points -4%
SPECviewperf 12
1900x1060 Solidworks (sw-03)
AMD Ryzen 7 5800X, AMD Ryzen 7 5800X
NVIDIA Titan RTX
199.1 fps +142%
AMD Ryzen 5 5600X, AMD Ryzen 5 5600X
NVIDIA Titan RTX
194 fps +136%
Intel Core i9-10900K, Intel Core i9-10900K
NVIDIA Titan RTX
172.2 fps +109%
Intel Core i5-10600K, Intel Core i5-10600K
NVIDIA Titan RTX
158.2 fps +92%
Intel Core i3-10100, Intel Core i3-10100
NVIDIA Titan RTX
153.8 fps +87%
Intel Core i5-10400F, Intel Core i5-10400F
NVIDIA Titan RTX
146.7 fps +78%
Intel Core i7-9700K, AMD Radeon RX Vega 64, Intel Core i7-9700K
AMD Radeon RX Vega 64
82.5 fps 0%
Zotac Magnus One (ECM73070C), Intel Core i7-10700
NVIDIA GeForce RTX 3070
82.3 fps
1900x1060 Siemens NX (snx-02)
Intel Core i3-10100, Intel Core i3-10100
NVIDIA Titan RTX
268 fps +2133%
AMD Ryzen 7 5800X, AMD Ryzen 7 5800X
NVIDIA Titan RTX
266.3 fps +2119%
AMD Ryzen 5 5600X, AMD Ryzen 5 5600X
NVIDIA Titan RTX
266 fps +2117%
Intel Core i9-10900K, Intel Core i9-10900K
NVIDIA Titan RTX
263.3 fps +2094%
Intel Core i5-10400F, Intel Core i5-10400F
NVIDIA Titan RTX
260.2 fps +2068%
Intel Core i5-10600K, Intel Core i5-10600K
NVIDIA Titan RTX
259.1 fps +2059%
Intel Core i7-9700K, AMD Radeon RX Vega 64, Intel Core i7-9700K
AMD Radeon RX Vega 64
28.85 fps +140%
Zotac Magnus One (ECM73070C), Intel Core i7-10700
NVIDIA GeForce RTX 3070
12 fps
1900x1060 Showcase (showcase-01)
Intel Core i5-10600K, Intel Core i5-10600K
NVIDIA Titan RTX
196.1 fps +19%
Intel Core i5-10400F, Intel Core i5-10400F
NVIDIA Titan RTX
194.2 fps +18%
Intel Core i3-10100, Intel Core i3-10100
NVIDIA Titan RTX
193.3 fps +17%
Intel Core i9-10900K, Intel Core i9-10900K
NVIDIA Titan RTX
192.4 fps +17%
AMD Ryzen 5 5600X, AMD Ryzen 5 5600X
NVIDIA Titan RTX
191.9 fps +16%
AMD Ryzen 7 5800X, AMD Ryzen 7 5800X
NVIDIA Titan RTX
190.6 fps +16%
Zotac Magnus One (ECM73070C), Intel Core i7-10700
NVIDIA GeForce RTX 3070
165 fps
Intel Core i7-9700K, AMD Radeon RX Vega 64, Intel Core i7-9700K
AMD Radeon RX Vega 64
115.1 fps -30%
1900x1060 Medical (medical-01)
Intel Core i5-10600K, Intel Core i5-10600K
NVIDIA Titan RTX
94.6 fps +93%
Intel Core i9-10900K, Intel Core i9-10900K
NVIDIA Titan RTX
94.5 fps +93%
Intel Core i5-10400F, Intel Core i5-10400F
NVIDIA Titan RTX
94.3 fps +92%
Intel Core i3-10100, Intel Core i3-10100
NVIDIA Titan RTX
92.5 fps +89%
AMD Ryzen 7 5800X, AMD Ryzen 7 5800X
NVIDIA Titan RTX
88.4 fps +80%
AMD Ryzen 5 5600X, AMD Ryzen 5 5600X
NVIDIA Titan RTX
88.3 fps +80%
Intel Core i7-9700K, AMD Radeon RX Vega 64, Intel Core i7-9700K
AMD Radeon RX Vega 64
51 fps +4%
Zotac Magnus One (ECM73070C), Intel Core i7-10700
NVIDIA GeForce RTX 3070
49 fps
1900x1060 Maya (maya-04)
AMD Ryzen 7 5800X, AMD Ryzen 7 5800X
NVIDIA Titan RTX
233.8 fps +17%
AMD Ryzen 5 5600X, AMD Ryzen 5 5600X
NVIDIA Titan RTX
226 fps +13%
Zotac Magnus One (ECM73070C), Intel Core i7-10700
NVIDIA GeForce RTX 3070
200 fps
Intel Core i9-10900K, Intel Core i9-10900K
NVIDIA Titan RTX
188.7 fps -6%
Intel Core i5-10600K, Intel Core i5-10600K
NVIDIA Titan RTX
169.4 fps -15%
Intel Core i3-10100, Intel Core i3-10100
NVIDIA Titan RTX
161.9 fps -19%
Intel Core i5-10400F, Intel Core i5-10400F
NVIDIA Titan RTX
155.1 fps -22%
Intel Core i7-9700K, AMD Radeon RX Vega 64, Intel Core i7-9700K
AMD Radeon RX Vega 64
84.1 fps -58%
1900x1060 Energy (energy-01)
Intel Core i5-10600K, Intel Core i5-10600K
NVIDIA Titan RTX
28.77 fps +120%
Intel Core i9-10900K, Intel Core i9-10900K
NVIDIA Titan RTX
28.72 fps +119%
Intel Core i5-10400F, Intel Core i5-10400F
NVIDIA Titan RTX
28.62 fps +118%
Intel Core i3-10100, Intel Core i3-10100
NVIDIA Titan RTX
28.54 fps +118%
AMD Ryzen 7 5800X, AMD Ryzen 7 5800X
NVIDIA Titan RTX
27.85 fps +113%
AMD Ryzen 5 5600X, AMD Ryzen 5 5600X
NVIDIA Titan RTX
27.75 fps +112%
Zotac Magnus One (ECM73070C), Intel Core i7-10700
NVIDIA GeForce RTX 3070
13.1 fps
Intel Core i7-9700K, AMD Radeon RX Vega 64, Intel Core i7-9700K
AMD Radeon RX Vega 64
5.21 fps -60%
1900x1060 Creo (creo-01)
AMD Ryzen 7 5800X, AMD Ryzen 7 5800X
NVIDIA Titan RTX
175.2 fps +185%
AMD Ryzen 5 5600X, AMD Ryzen 5 5600X
NVIDIA Titan RTX
169.7 fps +176%
Intel Core i9-10900K, Intel Core i9-10900K
NVIDIA Titan RTX
157.2 fps +156%
Intel Core i5-10600K, Intel Core i5-10600K
NVIDIA Titan RTX
142.7 fps +132%
Intel Core i3-10100, Intel Core i3-10100
NVIDIA Titan RTX
135.8 fps +121%
Intel Core i5-10400F, Intel Core i5-10400F
NVIDIA Titan RTX
133.6 fps +117%
Intel Core i7-9700K, AMD Radeon RX Vega 64, Intel Core i7-9700K
AMD Radeon RX Vega 64
62.5 fps +2%
Zotac Magnus One (ECM73070C), Intel Core i7-10700
NVIDIA GeForce RTX 3070
61.5 fps
1900x1060 Catia (catia-04)
AMD Ryzen 7 5800X, AMD Ryzen 7 5800X
NVIDIA Titan RTX
267.4 fps +129%
AMD Ryzen 5 5600X, AMD Ryzen 5 5600X
NVIDIA Titan RTX
263.4 fps +125%
Intel Core i9-10900K, Intel Core i9-10900K
NVIDIA Titan RTX
225.2 fps +92%
Intel Core i5-10600K, Intel Core i5-10600K
NVIDIA Titan RTX
215.5 fps +84%
Intel Core i3-10100, Intel Core i3-10100
NVIDIA Titan RTX
207.7 fps +78%
Intel Core i5-10400F, Intel Core i5-10400F
NVIDIA Titan RTX
197.8 fps +69%
Intel Core i7-9700K, AMD Radeon RX Vega 64, Intel Core i7-9700K
AMD Radeon RX Vega 64
158.6 fps +36%
Zotac Magnus One (ECM73070C), Intel Core i7-10700
NVIDIA GeForce RTX 3070
117 fps
1900x1060 3ds Max (3dsmax-05)
AMD Ryzen 5 5600X, AMD Ryzen 5 5600X
NVIDIA Titan RTX
299.9 fps +41%
Intel Core i9-10900K, Intel Core i9-10900K
NVIDIA Titan RTX
297.4 fps +40%
Intel Core i5-10600K, Intel Core i5-10600K
NVIDIA Titan RTX
296.9 fps +39%
AMD Ryzen 7 5800X, AMD Ryzen 7 5800X
NVIDIA Titan RTX
296 fps +39%
Intel Core i5-10400F, Intel Core i5-10400F
NVIDIA Titan RTX
291.3 fps +37%
Intel Core i3-10100, Intel Core i3-10100
NVIDIA Titan RTX
288.4 fps +35%
Zotac Magnus One (ECM73070C), Intel Core i7-10700
NVIDIA GeForce RTX 3070
213 fps
Intel Core i7-9700K, AMD Radeon RX Vega 64, Intel Core i7-9700K
AMD Radeon RX Vega 64
130.8 fps -39%
SPECviewperf 13
Solidworks (sw-04)
AMD Ryzen 7 5800X, AMD Ryzen 7 5800X
NVIDIA Titan RTX
199.9 fps +75%
AMD Ryzen 5 5600X, AMD Ryzen 5 5600X
NVIDIA Titan RTX
195.1 fps +71%
Intel Core i9-10900K, Intel Core i9-10900K
NVIDIA Titan RTX
166.2 fps +46%
Intel Core i5-10600K, Intel Core i5-10600K
NVIDIA Titan RTX
153.9 fps +35%
Intel Core i3-10100, Intel Core i3-10100
NVIDIA Titan RTX
148.1 fps +30%
Intel Core i5-10400F, Intel Core i5-10400F
NVIDIA Titan RTX
141.6 fps +24%
Zotac Magnus One (ECM73070C), Intel Core i7-10700
NVIDIA GeForce RTX 3070
114 fps
Intel Core i7-9700K, AMD Radeon RX Vega 64, Intel Core i7-9700K
AMD Radeon RX Vega 64
100.5 fps -12%
Siemens NX (snx-03)
Intel Core i3-10100, Intel Core i3-10100
NVIDIA Titan RTX
482.9 fps +2105%
AMD Ryzen 7 5800X, AMD Ryzen 7 5800X
NVIDIA Titan RTX
481.9 fps +2100%
AMD Ryzen 5 5600X, AMD Ryzen 5 5600X
NVIDIA Titan RTX
480.1 fps +2092%
Intel Core i9-10900K, Intel Core i9-10900K
NVIDIA Titan RTX
472.9 fps +2059%
Intel Core i5-10600K, Intel Core i5-10600K
NVIDIA Titan RTX
469.1 fps +2042%
Intel Core i5-10400F, Intel Core i5-10400F
NVIDIA Titan RTX
467.8 fps +2036%
Intel Core i7-9700K, AMD Radeon RX Vega 64, Intel Core i7-9700K
AMD Radeon RX Vega 64
51.5 fps +135%
Zotac Magnus One (ECM73070C), Intel Core i7-10700
NVIDIA GeForce RTX 3070
21.9 fps
Showcase (showcase-02)
Intel Core i5-10600K, Intel Core i5-10600K
NVIDIA Titan RTX
195.1 fps +18%
Intel Core i9-10900K, Intel Core i9-10900K
NVIDIA Titan RTX
194.1 fps +18%
Intel Core i5-10400F, Intel Core i5-10400F
NVIDIA Titan RTX
193.9 fps +18%
Intel Core i3-10100, Intel Core i3-10100
NVIDIA Titan RTX
193.2 fps +17%
AMD Ryzen 7 5800X, AMD Ryzen 7 5800X
NVIDIA Titan RTX
192 fps +16%
AMD Ryzen 5 5600X, AMD Ryzen 5 5600X
NVIDIA Titan RTX
190.8 fps +16%
Zotac Magnus One (ECM73070C), Intel Core i7-10700
NVIDIA GeForce RTX 3070
165 fps
Intel Core i7-9700K, AMD Radeon RX Vega 64, Intel Core i7-9700K
AMD Radeon RX Vega 64
115 fps -30%
Medical (medical-02)
AMD Ryzen 7 5800X, AMD Ryzen 7 5800X
NVIDIA Titan RTX
90.8 fps +16%
AMD Ryzen 5 5600X, AMD Ryzen 5 5600X
NVIDIA Titan RTX
90.6 fps +16%
Intel Core i3-10100, Intel Core i3-10100
NVIDIA Titan RTX
90 fps +15%
Intel Core i5-10600K, Intel Core i5-10600K
NVIDIA Titan RTX
89.7 fps +15%
Intel Core i9-10900K, Intel Core i9-10900K
NVIDIA Titan RTX
88.7 fps +13%
Intel Core i5-10400F, Intel Core i5-10400F
NVIDIA Titan RTX
87.3 fps +11%
Zotac Magnus One (ECM73070C), Intel Core i7-10700
NVIDIA GeForce RTX 3070
78.3 fps
Intel Core i7-9700K, AMD Radeon RX Vega 64, Intel Core i7-9700K
AMD Radeon RX Vega 64
38.31 fps -51%
Maya (maya-05)
AMD Ryzen 7 5800X, AMD Ryzen 7 5800X
NVIDIA Titan RTX
459.6 fps +25%
AMD Ryzen 5 5600X, AMD Ryzen 5 5600X
NVIDIA Titan RTX
453.6 fps +24%
Intel Core i9-10900K, Intel Core i9-10900K
NVIDIA Titan RTX
405.9 fps +11%
Intel Core i3-10100, Intel Core i3-10100
NVIDIA Titan RTX
388 fps +6%
Intel Core i5-10600K, Intel Core i5-10600K
NVIDIA Titan RTX
387.5 fps +6%
Zotac Magnus One (ECM73070C), Intel Core i7-10700
NVIDIA GeForce RTX 3070
367 fps
Intel Core i5-10400F, Intel Core i5-10400F
NVIDIA Titan RTX
364.3 fps -1%
Intel Core i7-9700K, AMD Radeon RX Vega 64, Intel Core i7-9700K
AMD Radeon RX Vega 64
199.5 fps -46%
Energy (energy-02)
Intel Core i5-10600K, Intel Core i5-10600K
NVIDIA Titan RTX
53.3 fps +89%
Intel Core i9-10900K, Intel Core i9-10900K
NVIDIA Titan RTX
53.2 fps +89%
Intel Core i5-10400F, Intel Core i5-10400F
NVIDIA Titan RTX
53 fps +88%
AMD Ryzen 7 5800X, AMD Ryzen 7 5800X
NVIDIA Titan RTX
52.3 fps +85%
AMD Ryzen 5 5600X, AMD Ryzen 5 5600X
NVIDIA Titan RTX
52.2 fps +85%
Intel Core i3-10100, Intel Core i3-10100
NVIDIA Titan RTX
52.2 fps +85%
Zotac Magnus One (ECM73070C), Intel Core i7-10700
NVIDIA GeForce RTX 3070
28.2 fps
Intel Core i7-9700K, AMD Radeon RX Vega 64, Intel Core i7-9700K
AMD Radeon RX Vega 64
7.55 fps -73%
Creo (creo-02)
AMD Ryzen 7 5800X, AMD Ryzen 7 5800X
NVIDIA Titan RTX
353.3 fps +47%
AMD Ryzen 5 5600X, AMD Ryzen 5 5600X
NVIDIA Titan RTX
350 fps +45%
Intel Core i3-10100, Intel Core i3-10100
NVIDIA Titan RTX
338.7 fps +41%
Intel Core i9-10900K, Intel Core i9-10900K
NVIDIA Titan RTX
336.3 fps +40%
Intel Core i5-10600K, Intel Core i5-10600K
NVIDIA Titan RTX
331.7 fps +38%
Intel Core i5-10400F, Intel Core i5-10400F
NVIDIA Titan RTX
328.5 fps +36%
Zotac Magnus One (ECM73070C), Intel Core i7-10700
NVIDIA GeForce RTX 3070
241 fps
Intel Core i7-9700K, AMD Radeon RX Vega 64, Intel Core i7-9700K
AMD Radeon RX Vega 64
108.9 fps -55%
Catia (catia-05)
AMD Ryzen 5 5600X, AMD Ryzen 5 5600X
NVIDIA Titan RTX
427.8 fps +150%
AMD Ryzen 7 5800X, AMD Ryzen 7 5800X
NVIDIA Titan RTX
415.1 fps +143%
Intel Core i9-10900K, Intel Core i9-10900K
NVIDIA Titan RTX
362.1 fps +112%
Intel Core i5-10600K, Intel Core i5-10600K
NVIDIA Titan RTX
341.7 fps +100%
Intel Core i3-10100, Intel Core i3-10100
NVIDIA Titan RTX
324.6 fps +90%
Intel Core i5-10400F, Intel Core i5-10400F
NVIDIA Titan RTX
314.8 fps +84%
Intel Core i7-9700K, AMD Radeon RX Vega 64, Intel Core i7-9700K
AMD Radeon RX Vega 64
236 fps +38%
Zotac Magnus One (ECM73070C), Intel Core i7-10700
NVIDIA GeForce RTX 3070
171 fps
3ds Max (3dsmax-06)
AMD Ryzen 5 5600X, AMD Ryzen 5 5600X
NVIDIA Titan RTX
298.8 fps +40%
AMD Ryzen 7 5800X, AMD Ryzen 7 5800X
NVIDIA Titan RTX
297.6 fps +40%
Intel Core i5-10600K, Intel Core i5-10600K
NVIDIA Titan RTX
294.4 fps +38%
Intel Core i9-10900K, Intel Core i9-10900K
NVIDIA Titan RTX
292.5 fps +37%
Intel Core i5-10400F, Intel Core i5-10400F
NVIDIA Titan RTX
288.3 fps +35%
Intel Core i3-10100, Intel Core i3-10100
NVIDIA Titan RTX
288.2 fps +35%
Zotac Magnus One (ECM73070C), Intel Core i7-10700
NVIDIA GeForce RTX 3070
213 fps
Intel Core i7-9700K, AMD Radeon RX Vega 64, Intel Core i7-9700K
AMD Radeon RX Vega 64
131 fps -38%

3D et performances de jeu

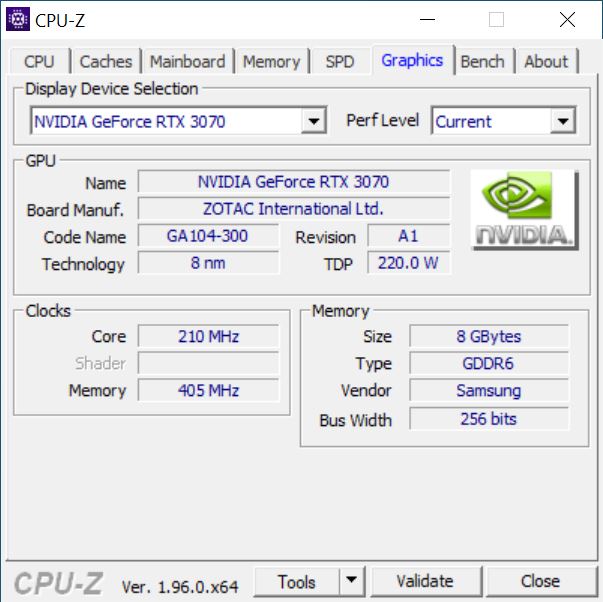
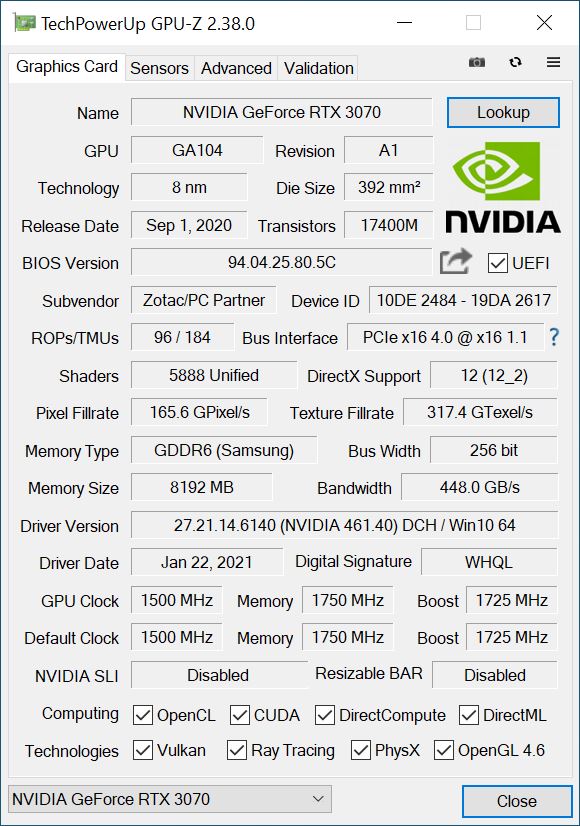
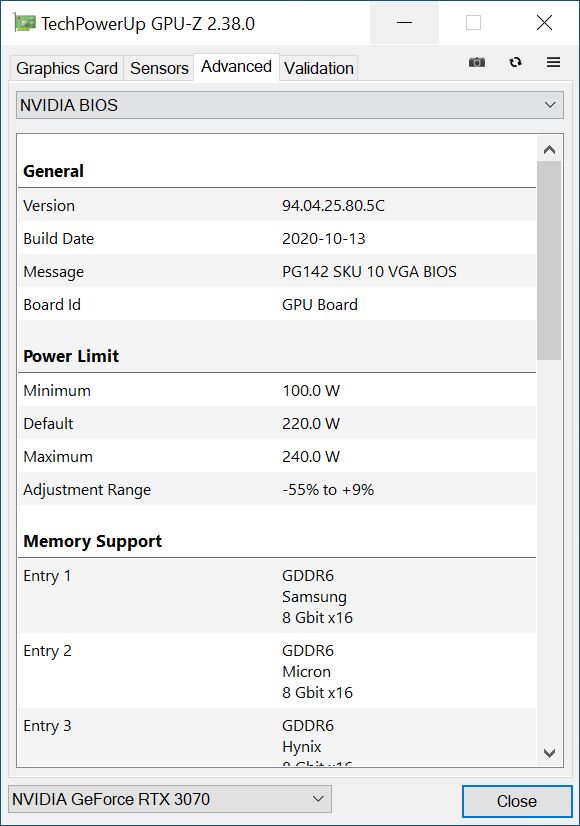
Une GeForce NvidiaRTX 3070qui provient directement du portefeuille interne de Zotac est responsable des bonnes performances 3D. Le système a livré une performance solide dans le test et a obtenu un score global un peu meilleur que dans les tests précédents qui n'examinaient que le CPU. En termes de performance pure, le Magnus One avec le GeForce RTX 3070 se classe juste derrière notre système de test basé sur le AMD Ryzen 9 5900X légèrement plus rapide et le MSI GeForce RTX 3070 Ventus 3X. Cependant, la performance légèrement inférieure ne peut pas être décrite comme étant perceptible. Néanmoins, la RTX 3070 a la vie facile face à la génération précédente équipée de la RTX 2070 Super. Il est possible d'améliorer les performances de 30 %, ce qui est tout à fait perceptible dans les jeux. L'équipement du Magnus One permet certainement de profiter de nombreux jeux en 2160p, même si le jeu en 1440p devrait être l'objectif principal.

Pour plus de comparaisons et de benchmarks concernant les performances de la RTX 3070, veuillez consulter notre tableau comparatif des GPU

.
Borderlands 3 - 1920x1080 Badass Overall Quality (DX11)
Zotac Magnus One (ECM73070C)
NVIDIA GeForce RTX 3070, i7-10700, Phison 512GB PA6620060U
98.8 fps
MSI GeForce RTX 3070 Ventus 3X
NVIDIA GeForce RTX 3070, R9 5900X, Intel Optane 905P 480GB 2.5
95.3 fps -4%
Moyenne NVIDIA GeForce RTX 2070 Super (Desktop)
  (74.3 - 86, n=5)
80.9 fps -18%
Nvidia GeForce RTX 2070 Super
GeForce RTX 2070 Super (Desktop), R9 3900X
79.4 fps -20%
KFA2 GeForce RTX 2070 Super Work The Frames
GeForce RTX 2070 Super (Desktop), R9 3900X
79 fps -20%
Moyenne NVIDIA GeForce RTX 2070 (Desktop)
  (70.9 - 74.4, n=2)
72.7 fps -26%
Moyenne NVIDIA GeForce RTX 2060 Super (Desktop)
  (68.6 - 74.1, n=4)
71.2 fps -28%
Metro Exodus - 1920x1080 Ultra Quality AF:16x
MSI GeForce RTX 3070 Ventus 3X
NVIDIA GeForce RTX 3070, R9 5900X, Intel Optane 905P 480GB 2.5
93.7 (46.52min - 161.6max) fps +1%
Zotac Magnus One (ECM73070C)
NVIDIA GeForce RTX 3070, i7-10700, Phison 512GB PA6620060U
93.1 (45.73min - 151.06max) fps
Moyenne NVIDIA GeForce RTX 2070 Super (Desktop)
  (67.8 - 79.1, n=5)
72.3 fps -22%
KFA2 GeForce RTX 2070 Super Work The Frames
GeForce RTX 2070 Super (Desktop), R9 3900X
70 (33min - 128max) fps -25%
Nvidia GeForce RTX 2070 Super
GeForce RTX 2070 Super (Desktop), R7 2700X
67.8 (36min - 110max) fps -27%
Moyenne NVIDIA GeForce RTX 2060 Super (Desktop)
  (58 - 67.4, n=4)
62.3 fps -33%
Moyenne NVIDIA GeForce RTX 2070 (Desktop)
  (33.4 - 62.8, n=4)
54.4 fps -42%
Far Cry New Dawn - 1920x1080 Ultra Preset
MSI GeForce RTX 3070 Ventus 3X
NVIDIA GeForce RTX 3070, R9 5900X, Intel Optane 905P 480GB 2.5
116 (77min - 187max) fps +22%
Moyenne NVIDIA GeForce RTX 2070 Super (Desktop)
  (80 - 133, n=5)
105.6 fps +11%
Moyenne NVIDIA GeForce RTX 2060 Super (Desktop)
  (85 - 121, n=4)
105.5 fps +11%
KFA2 GeForce RTX 2070 Super Work The Frames
GeForce RTX 2070 Super (Desktop), R9 3900X
98 (69min - 151max) fps +3%
Zotac Magnus One (ECM73070C)
NVIDIA GeForce RTX 3070, i7-10700, Phison 512GB PA6620060U
95 (66min - 149max) fps
Moyenne NVIDIA GeForce RTX 2070 (Desktop)
  (79 - 94, n=3)
87.7 fps -8%
Nvidia GeForce RTX 2070 Super
GeForce RTX 2070 Super (Desktop), R7 2700X
87 (63min - 135max) fps -8%
Far Cry 5 - 1920x1080 Ultra Preset AA:T
MSI GeForce RTX 3070 Ventus 3X
NVIDIA GeForce RTX 3070, R9 5900X, Intel Optane 905P 480GB 2.5
143 (108min - 192max) fps +22%
Moyenne NVIDIA GeForce RTX 2070 Super (Desktop)
  (99 - 148, n=5)
121.8 fps +4%
Zotac Magnus One (ECM73070C)
NVIDIA GeForce RTX 3070, i7-10700, Phison 512GB PA6620060U
117 (89min - 155max) fps
Moyenne NVIDIA GeForce RTX 2060 Super (Desktop)
  (99 - 130, n=4)
116.3 fps -1%
KFA2 GeForce RTX 2070 Super Work The Frames
GeForce RTX 2070 Super (Desktop), R9 3900X
110 (86min - 143max) fps -6%
Moyenne NVIDIA GeForce RTX 2070 (Desktop)
  (86 - 105, n=4)
99.8 fps -15%
Nvidia GeForce RTX 2070 Super
GeForce RTX 2070 Super (Desktop), R7 2700X
99 (76min - 132max) fps -15%
X-Plane 11.11 - 1920x1080 high (fps_test=3)
Moyenne NVIDIA GeForce RTX 2060 Super (Desktop)
  (77 - 158.2, n=4)
120 fps +32%
Moyenne NVIDIA GeForce RTX 2070 Super (Desktop)
  (66.8 - 157.3, n=6)
104.8 fps +15%
MSI GeForce RTX 3070 Ventus 3X
NVIDIA GeForce RTX 3070, R9 5900X, Intel Optane 905P 480GB 2.5
95.4 fps +5%
Moyenne NVIDIA GeForce RTX 2070 (Desktop)
  ()
92.7 fps +2%
KFA2 GeForce RTX 2070 Super Work The Frames
GeForce RTX 2070 Super (Desktop), R9 3900X
91.9 fps +1%
Zotac Magnus One (ECM73070C)
NVIDIA GeForce RTX 3070, i7-10700, Phison 512GB PA6620060U
91 fps
Nvidia GeForce RTX 2070 Super
GeForce RTX 2070 Super (Desktop), R7 2700X
76 fps -16%
Final Fantasy XV Benchmark - 1920x1080 High Quality
MSI GeForce RTX 3070 Ventus 3X
NVIDIA GeForce RTX 3070, R9 5900X, Intel Optane 905P 480GB 2.5
122 fps +9%
Zotac Magnus One (ECM73070C)
NVIDIA GeForce RTX 3070, i7-10700, Phison 512GB PA6620060U
112 fps
Moyenne NVIDIA GeForce RTX 2070 Super (Desktop)
  (75.5 - 120, n=6)
99.5 fps -11%
Nvidia GeForce RTX 2070 Super
GeForce RTX 2070 Super (Desktop), R7 2700X
89 (45min - 141max) fps -21%
Moyenne NVIDIA GeForce RTX 2060 Super (Desktop)
  (79 - 93.8, n=4)
86.4 fps -23%
Moyenne NVIDIA GeForce RTX 2070 (Desktop)
  (60.8 - 90.6, n=5)
81.9 fps -27%
KFA2 GeForce RTX 2070 Super Work The Frames
GeForce RTX 2070 Super (Desktop), R9 3900X
75.5 (49min - 135max) fps -33%
Dota 2 Reborn - 1920x1080 ultra (3/3) best looking
Moyenne NVIDIA GeForce RTX 2060 Super (Desktop)
  (109.8 - 241, n=4)
180.3 fps +39%
Moyenne NVIDIA GeForce RTX 2070 Super (Desktop)
  (103.2 - 236, n=6)
154.6 fps +19%
KFA2 GeForce RTX 2070 Super Work The Frames
GeForce RTX 2070 Super (Desktop), R9 3900X
136.7 (117.4min) fps +5%
MSI GeForce RTX 3070 Ventus 3X
NVIDIA GeForce RTX 3070, R9 5900X, Intel Optane 905P 480GB 2.5
136.3 (108.9min) fps +5%
Moyenne NVIDIA GeForce RTX 2070 (Desktop)
  ()
130.3 fps 0%
Zotac Magnus One (ECM73070C)
NVIDIA GeForce RTX 3070, i7-10700, Phison 512GB PA6620060U
129.7 (113.4min) fps
Nvidia GeForce RTX 2070 Super
GeForce RTX 2070 Super (Desktop), R7 2700X
107.7 (90.5min) fps -17%
The Witcher 3 - 1920x1080 Ultra Graphics & Postprocessing (HBAO+)
MSI GeForce RTX 3070 Ventus 3X
NVIDIA GeForce RTX 3070, R9 5900X, Intel Optane 905P 480GB 2.5
121 (112min - 134max) fps 0%
Zotac Magnus One (ECM73070C)
NVIDIA GeForce RTX 3070, i7-10700, Phison 512GB PA6620060U
121 fps
Moyenne NVIDIA GeForce RTX 2070 Super (Desktop)
  (95.6 - 109.6, n=6)
100.9 fps -17%
KFA2 GeForce RTX 2070 Super Work The Frames
GeForce RTX 2070 Super (Desktop), R9 3900X
99.4 (89min - 109max) fps -18%
Nvidia GeForce RTX 2070 Super
GeForce RTX 2070 Super (Desktop), R7 2700X
97 (83min - 109max) fps -20%
Moyenne NVIDIA GeForce RTX 2060 Super (Desktop)
  (79 - 91.1, n=5)
84.8 fps -30%
Moyenne NVIDIA GeForce RTX 2070 (Desktop)
  (40.9 - 95, n=5)
79.2 fps -35%
3DMark
Fire Strike Extreme Graphics
MSI GeForce RTX 3070 Ventus 3X
NVIDIA GeForce RTX 3070, R9 5900X, Intel Optane 905P 480GB 2.5
15722 Points +1%
Zotac Magnus One (ECM73070C)
NVIDIA GeForce RTX 3070, i7-10700, Phison 512GB PA6620060U
15597 Points
KFA2 GeForce RTX 2070 Super Work The Frames
GeForce RTX 2070 Super (Desktop), R9 3900X
11976 Points -23%
Nvidia GeForce RTX 2070 Super
GeForce RTX 2070 Super (Desktop), R9 3900X
11951 Points -23%
Moyenne NVIDIA GeForce RTX 2070 Super (Desktop)
  (11382 - 12044, n=7)
11850 Points -24%
Nvidia GeForce RTX 2070 Super
GeForce RTX 2070 Super (Desktop), R7 2700X
11634 Points -25%
Moyenne NVIDIA GeForce RTX 2070 (Desktop)
  (9979 - 11423, n=5)
10987 Points -30%
Moyenne NVIDIA GeForce RTX 2060 Super (Desktop)
  (10182 - 10726, n=6)
10498 Points -33%
1920x1080 Fire Strike Graphics
MSI GeForce RTX 3070 Ventus 3X
NVIDIA GeForce RTX 3070, R9 5900X, Intel Optane 905P 480GB 2.5
31020 Points +3%
Zotac Magnus One (ECM73070C)
NVIDIA GeForce RTX 3070, i7-10700, Phison 512GB PA6620060U
30090 Points
Moyenne NVIDIA GeForce RTX 2070 Super (Desktop)
  (22819 - 25799, n=8)
24645 Points -18%
Nvidia GeForce RTX 2070 Super
GeForce RTX 2070 Super (Desktop), R9 3900X
24640 Points -18%
KFA2 GeForce RTX 2070 Super Work The Frames
GeForce RTX 2070 Super (Desktop), R9 3900X
24637 Points -18%
Nvidia GeForce RTX 2070 Super
GeForce RTX 2070 Super (Desktop), R7 2700X
24151 Points -20%
Moyenne NVIDIA GeForce RTX 2070 (Desktop)
  (16770 - 24242, n=6)
21999 Points -27%
Moyenne NVIDIA GeForce RTX 2060 Super (Desktop)
  (20522 - 22764, n=7)
21970 Points -27%
2560x1440 Time Spy Graphics
MSI GeForce RTX 3070 Ventus 3X
NVIDIA GeForce RTX 3070, R9 5900X, Intel Optane 905P 480GB 2.5
13111 Points +3%
Zotac Magnus One (ECM73070C)
NVIDIA GeForce RTX 3070, i7-10700, Phison 512GB PA6620060U
12668 Points
Nvidia GeForce RTX 2070 Super
GeForce RTX 2070 Super (Desktop), R7 2700X
10094 Points -20%
KFA2 GeForce RTX 2070 Super Work The Frames
GeForce RTX 2070 Super (Desktop), R9 3900X
9871 Points -22%
Moyenne NVIDIA GeForce RTX 2070 Super (Desktop)
  (9564 - 10094, n=8)
9846 Points -22%
Nvidia GeForce RTX 2070 Super
GeForce RTX 2070 Super (Desktop), R9 3900X
9623 Points -24%
Moyenne NVIDIA GeForce RTX 2070 (Desktop)
  (7445 - 9656, n=6)
8952 Points -29%
Moyenne NVIDIA GeForce RTX 2060 Super (Desktop)
  (8396 - 8795, n=7)
8631 Points -32%
3DMark 11
1280x720 Performance GPU
MSI GeForce RTX 3070 Ventus 3X
NVIDIA GeForce RTX 3070, R9 5900X, Intel Optane 905P 480GB 2.5
43005 Points +5%
Zotac Magnus One (ECM73070C)
NVIDIA GeForce RTX 3070, i7-10700, Phison 512GB PA6620060U
40950 Points
Nvidia GeForce RTX 2070 Super
GeForce RTX 2070 Super (Desktop), R9 3900X
35377 Points -14%
Moyenne NVIDIA GeForce RTX 2070 Super (Desktop)
  (33257 - 37235, n=7)
34830 Points -15%
Nvidia GeForce RTX 2070 Super
GeForce RTX 2070 Super (Desktop), R7 2700X
33293 Points -19%
KFA2 GeForce RTX 2070 Super Work The Frames
GeForce RTX 2070 Super (Desktop), R9 3900X
33257 Points -19%
Moyenne NVIDIA GeForce RTX 2070 (Desktop)
  (22174 - 32373, n=7)
29866 Points -27%
Moyenne NVIDIA GeForce RTX 2060 Super (Desktop)
  (29148 - 30099, n=6)
29642 Points -28%
1280x720 Performance
MSI GeForce RTX 3070 Ventus 3X
NVIDIA GeForce RTX 3070, R9 5900X, Intel Optane 905P 480GB 2.5
33248 Points +14%
Zotac Magnus One (ECM73070C)
NVIDIA GeForce RTX 3070, i7-10700, Phison 512GB PA6620060U
29057 Points
Nvidia GeForce RTX 2070 Super
GeForce RTX 2070 Super (Desktop), R9 3900X
28994 Points 0%
Moyenne NVIDIA GeForce RTX 2070 Super (Desktop)
  (24879 - 35274, n=7)
28582 Points -2%
KFA2 GeForce RTX 2070 Super Work The Frames
GeForce RTX 2070 Super (Desktop), R9 3900X
27896 Points -4%
Moyenne NVIDIA GeForce RTX 2060 Super (Desktop)
  (22211 - 30486, n=6)
26110 Points -10%
Nvidia GeForce RTX 2070 Super
GeForce RTX 2070 Super (Desktop), R7 2700X
25183 Points -13%
Moyenne NVIDIA GeForce RTX 2070 (Desktop)
  (15341 - 27206, n=7)
23703 Points -18%
Unigine Superposition
1280x720 720p Low
Moyenne NVIDIA GeForce RTX 2070 Super (Desktop)
  (26742 - 45424, n=3)
38495 Points +41%
Moyenne NVIDIA GeForce RTX 2060 Super (Desktop)
  (26634 - 40961, n=3)
35859 Points +31%
MSI GeForce RTX 3070 Ventus 3X
NVIDIA GeForce RTX 3070, R9 5900X, Intel Optane 905P 480GB 2.5
34602 Points +27%
Zotac Magnus One (ECM73070C)
NVIDIA GeForce RTX 3070, i7-10700, Phison 512GB PA6620060U
27330 Points
Nvidia GeForce RTX 2070 Super
GeForce RTX 2070 Super (Desktop), R9 3900X
26742 Points -2%
1920x1080 1080p High
MSI GeForce RTX 3070 Ventus 3X
NVIDIA GeForce RTX 3070, R9 5900X, Intel Optane 905P 480GB 2.5
17244 Points +1%
Zotac Magnus One (ECM73070C)
NVIDIA GeForce RTX 3070, i7-10700, Phison 512GB PA6620060U
17054 Points
Moyenne NVIDIA GeForce RTX 2070 Super (Desktop)
  (13655 - 13832, n=3)
13765 Points -19%
Nvidia GeForce RTX 2070 Super
GeForce RTX 2070 Super (Desktop), R9 3900X
13655 Points -20%
Moyenne NVIDIA GeForce RTX 2060 Super (Desktop)
  (11421 - 11785, n=3)
11649 Points -32%
1920x1080 1080p Extreme
MSI GeForce RTX 3070 Ventus 3X
NVIDIA GeForce RTX 3070, R9 5900X, Intel Optane 905P 480GB 2.5
8365 Points +1%
Zotac Magnus One (ECM73070C)
NVIDIA GeForce RTX 3070, i7-10700, Phison 512GB PA6620060U
8276 Points
Moyenne NVIDIA GeForce RTX 2070 Super (Desktop)
  (6161 - 6178, n=3)
6169 Points -25%
Nvidia GeForce RTX 2070 Super
GeForce RTX 2070 Super (Desktop), R9 3900X
6167 Points -25%
Moyenne NVIDIA GeForce RTX 2060 Super (Desktop)
  (5049 - 5143, n=3)
5105 Points -38%
3840x2160 4k Optimized
MSI GeForce RTX 3070 Ventus 3X
NVIDIA GeForce RTX 3070, R9 5900X, Intel Optane 905P 480GB 2.5
10673 Points +1%
Zotac Magnus One (ECM73070C)
NVIDIA GeForce RTX 3070, i7-10700, Phison 512GB PA6620060U
10544 Points
Nvidia GeForce RTX 2070 Super
GeForce RTX 2070 Super (Desktop), R9 3900X
8111 Points -23%
Moyenne NVIDIA GeForce RTX 2070 Super (Desktop)
  (8096 - 8111, n=3)
8101 Points -23%
Moyenne NVIDIA GeForce RTX 2060 Super (Desktop)
  (6747 - 6863, n=3)
6811 Points -35%
7680x4320 8k Optimized
MSI GeForce RTX 3070 Ventus 3X
NVIDIA GeForce RTX 3070, R9 5900X, Intel Optane 905P 480GB 2.5
4639 Points +1%
Zotac Magnus One (ECM73070C)
NVIDIA GeForce RTX 3070, i7-10700, Phison 512GB PA6620060U
4587 Points
Nvidia GeForce RTX 2070 Super
GeForce RTX 2070 Super (Desktop), R9 3900X
3434 Points -25%
Moyenne NVIDIA GeForce RTX 2070 Super (Desktop)
  (3419 - 3435, n=3)
3429 Points -25%
Moyenne NVIDIA GeForce RTX 2060 Super (Desktop)
  (2873 - 2914, n=3)
2900 Points -37%
Bas Moyen Élevé UltraQHD4K
GTA V (2015) 180 173 161 95.6 91.6 110
The Witcher 3 (2015) 367 316 235 121 84
Dota 2 Reborn (2015) 164.2 143.8 138.2 129.7 127.4
Final Fantasy XV Benchmark (2018) 167 146 112 89.2 54.8
X-Plane 11.11 (2018) 124 110 91 78.8
Far Cry 5 (2018) 150 133 126 117 112 70
Strange Brigade (2018) 430 311 253 222 165 97.1
Far Cry New Dawn (2019) 126 110 106 95 92 70
Metro Exodus (2019) 166 136 116 93.1 76.1 49
Borderlands 3 (2019) 149 132 118 98.8 75.5 42.7

Émissions

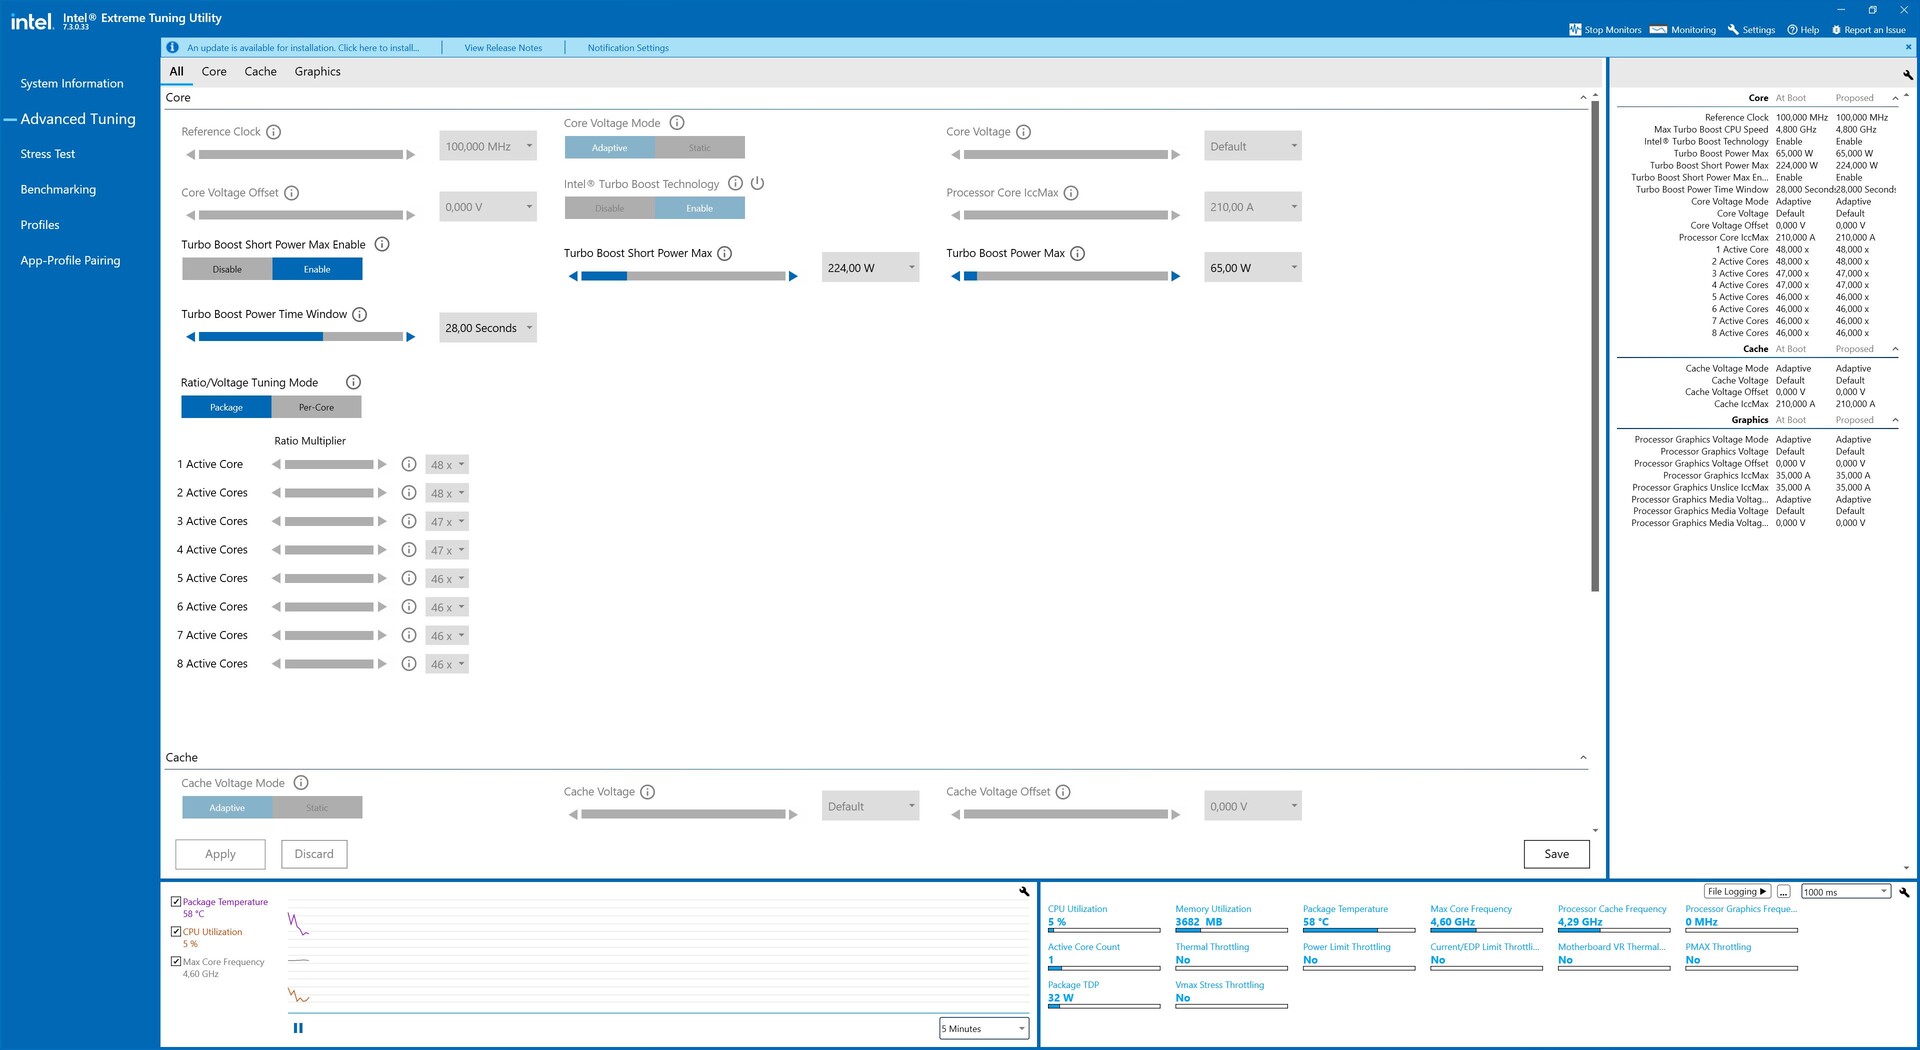
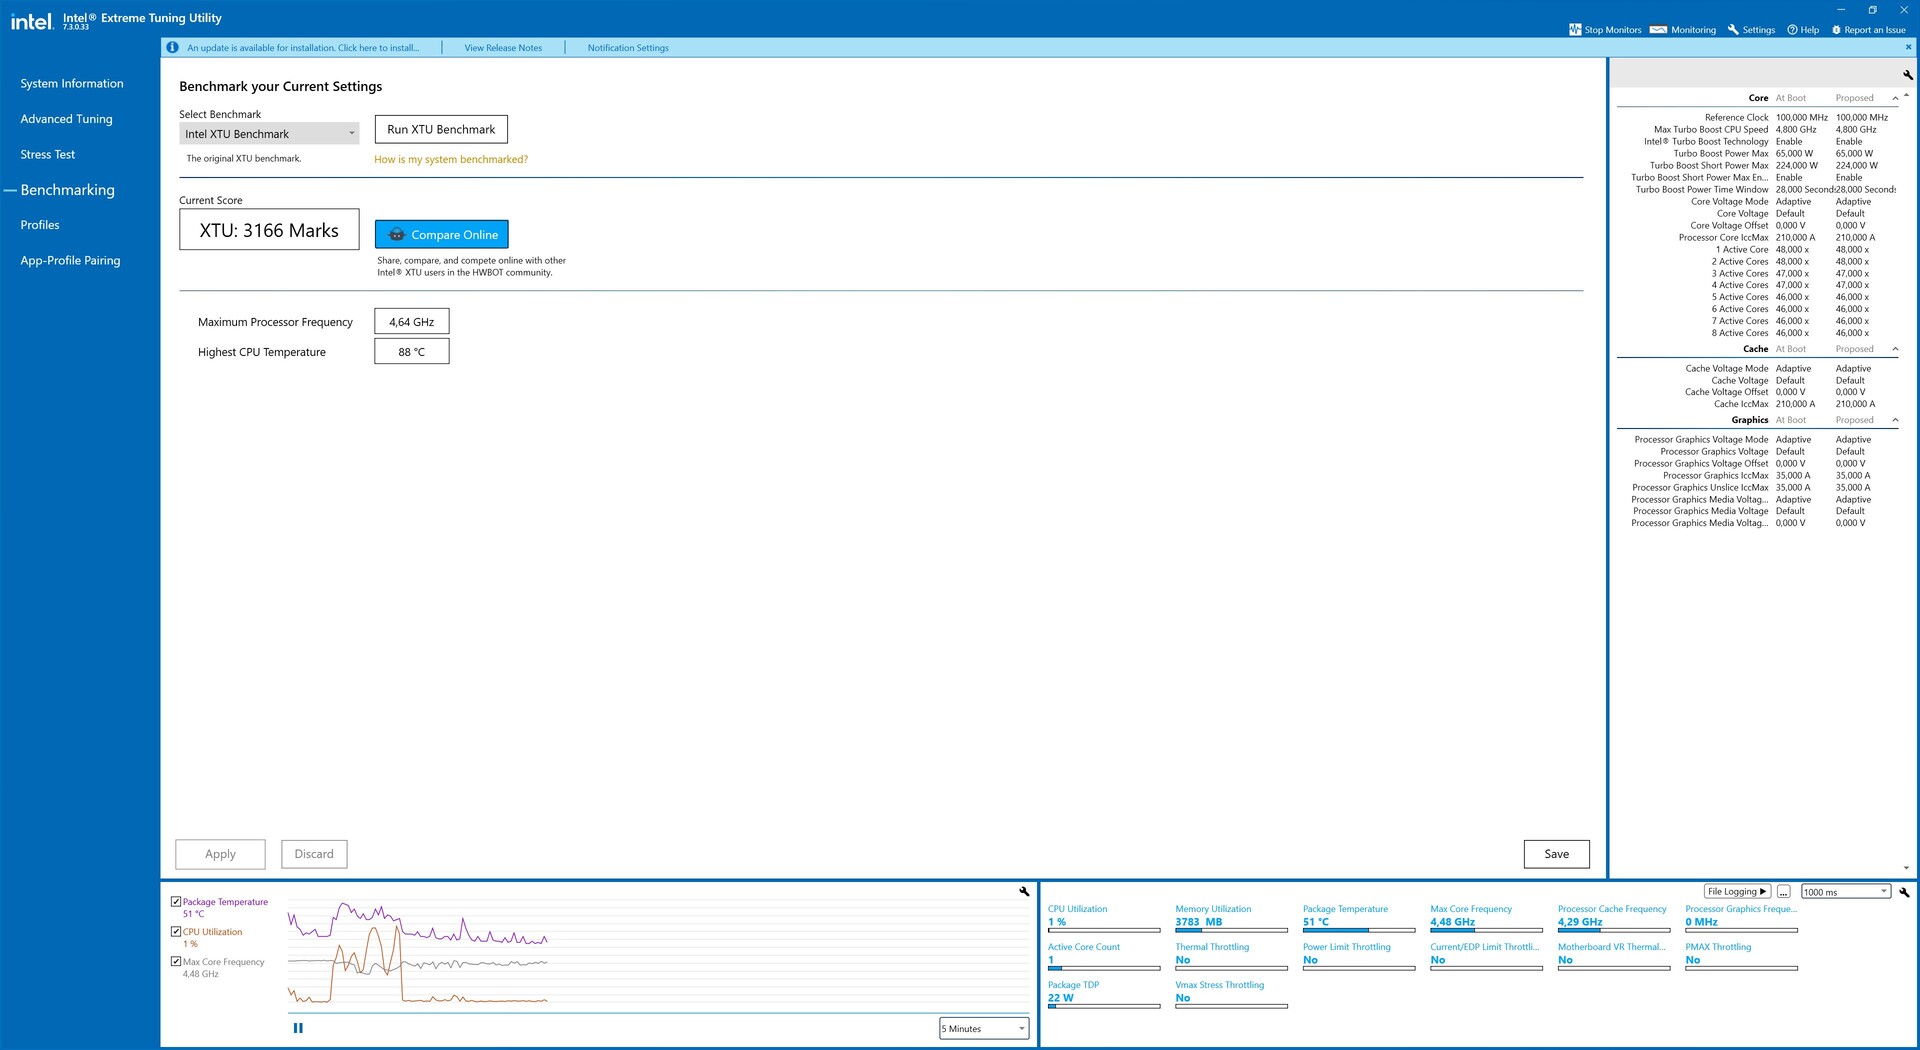
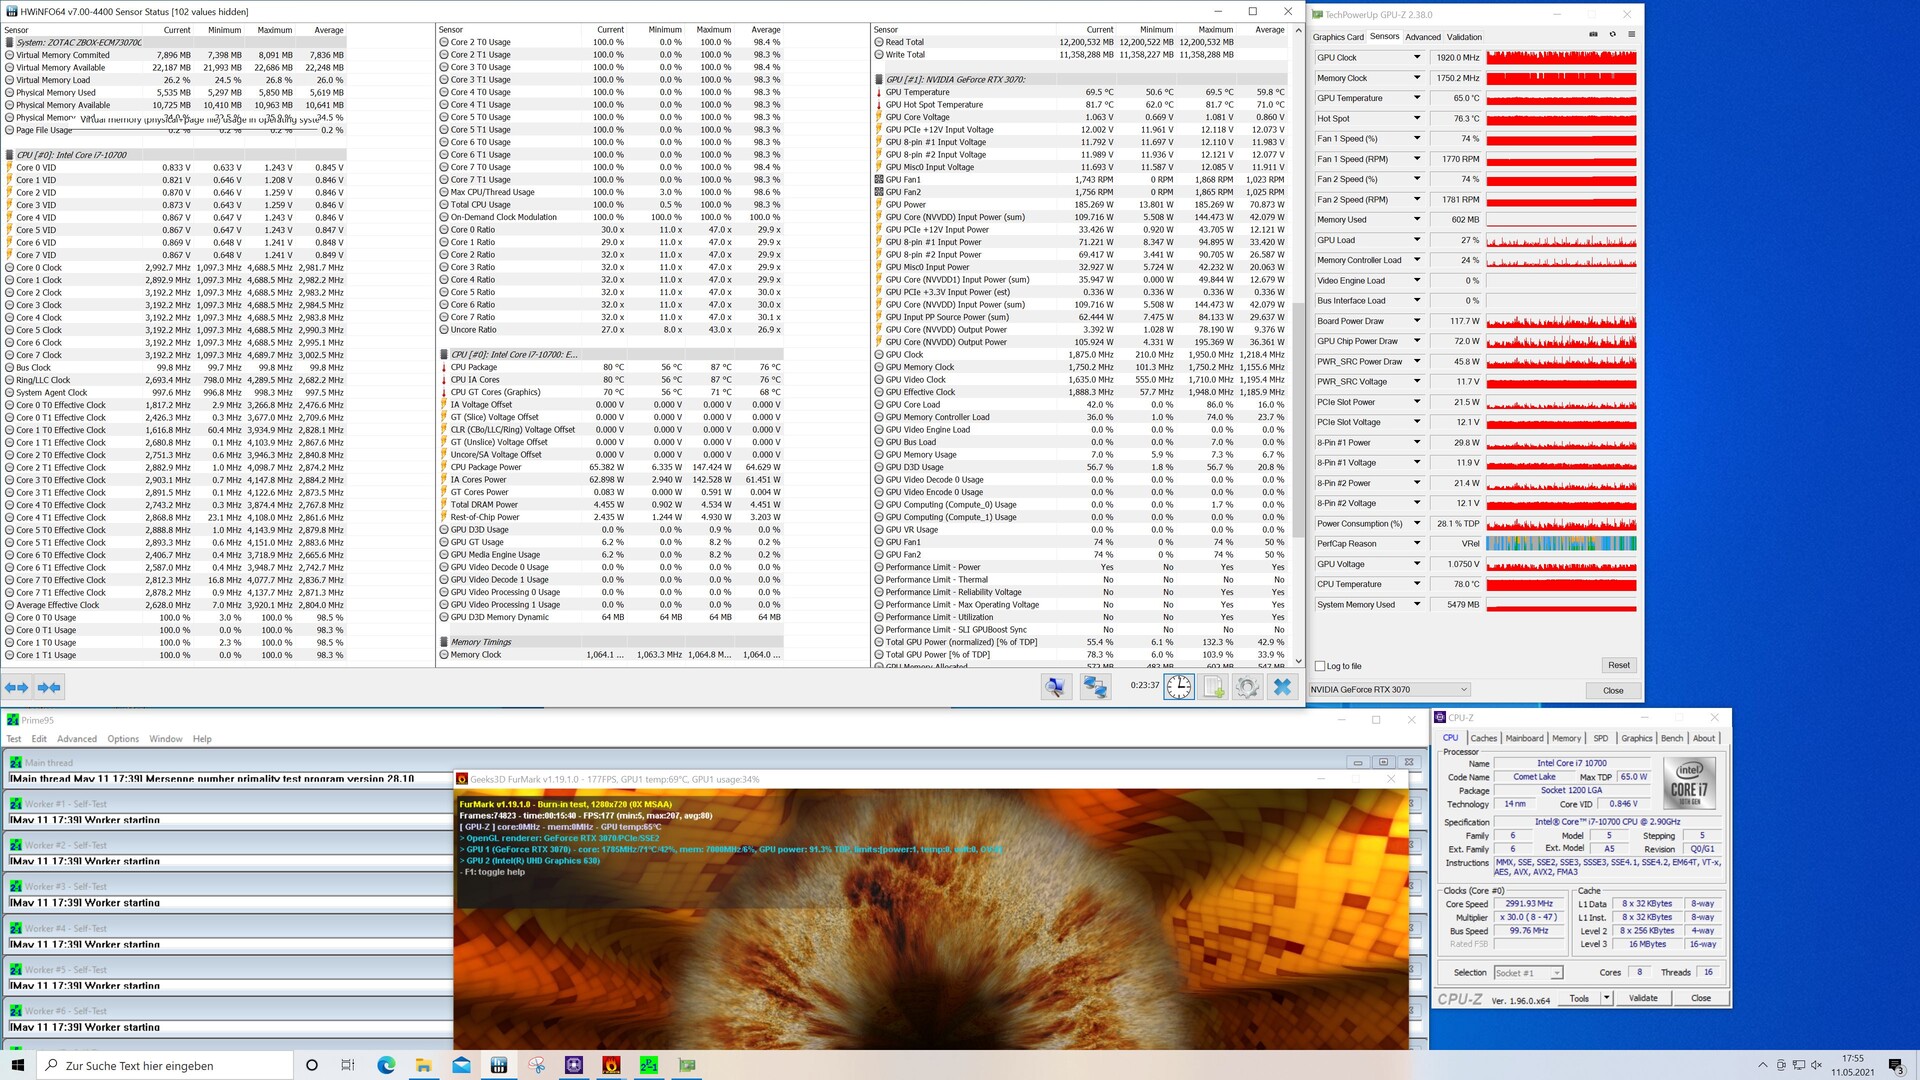
Le Zotac Magnus One au test de stress

Zotac Magnus One au test de résistance

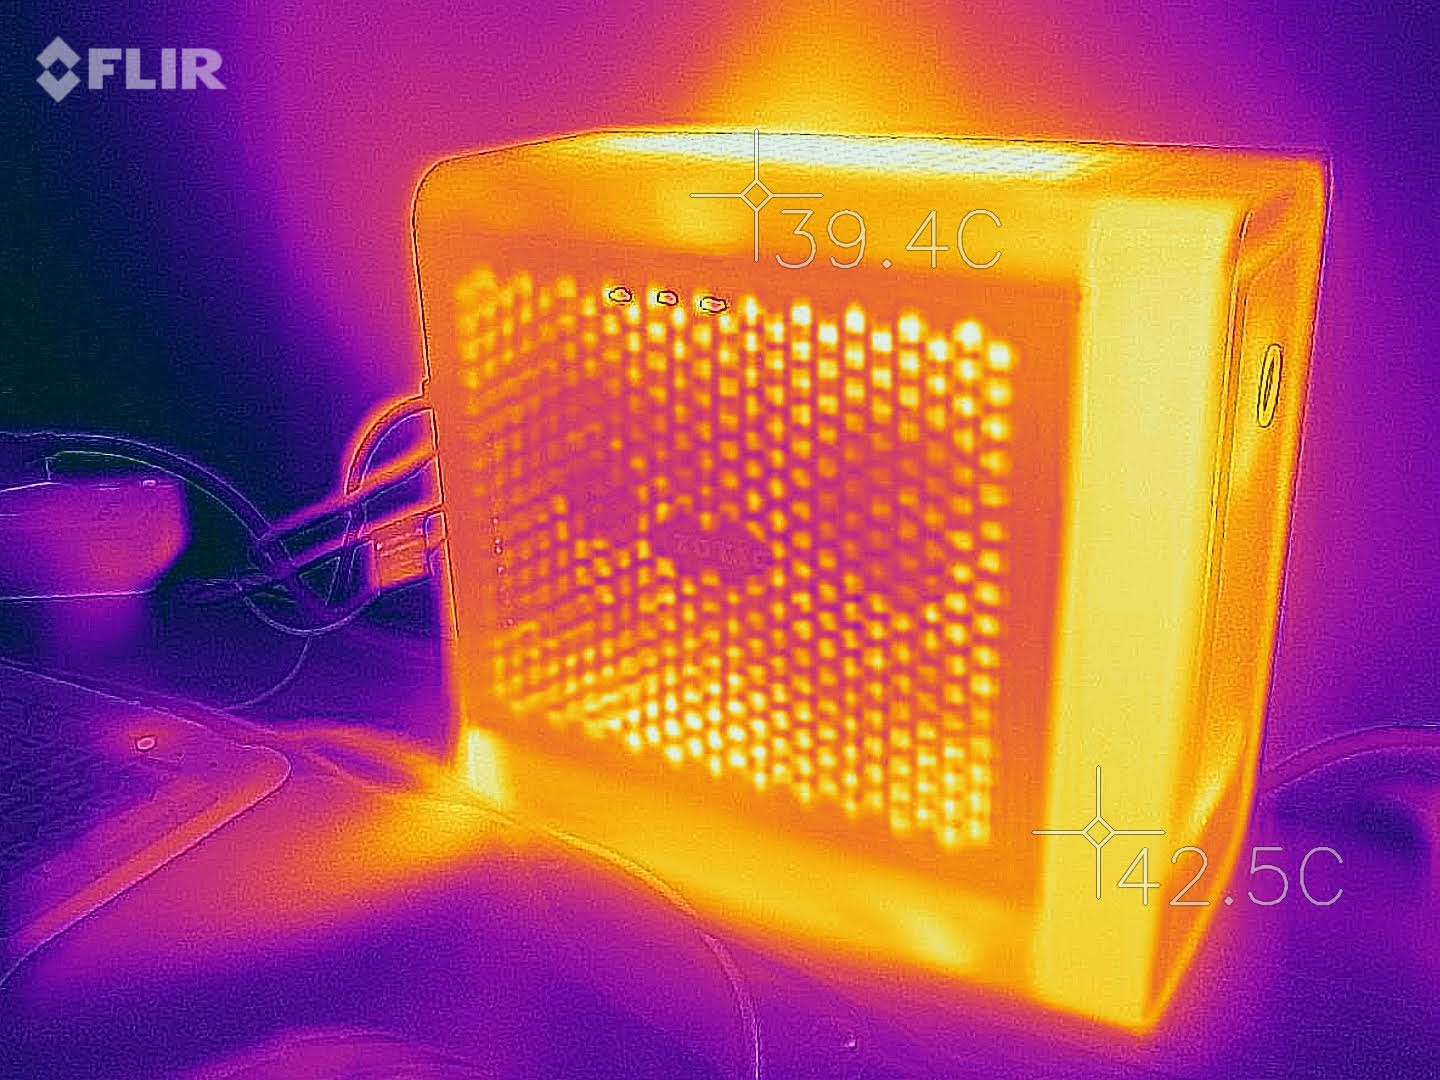
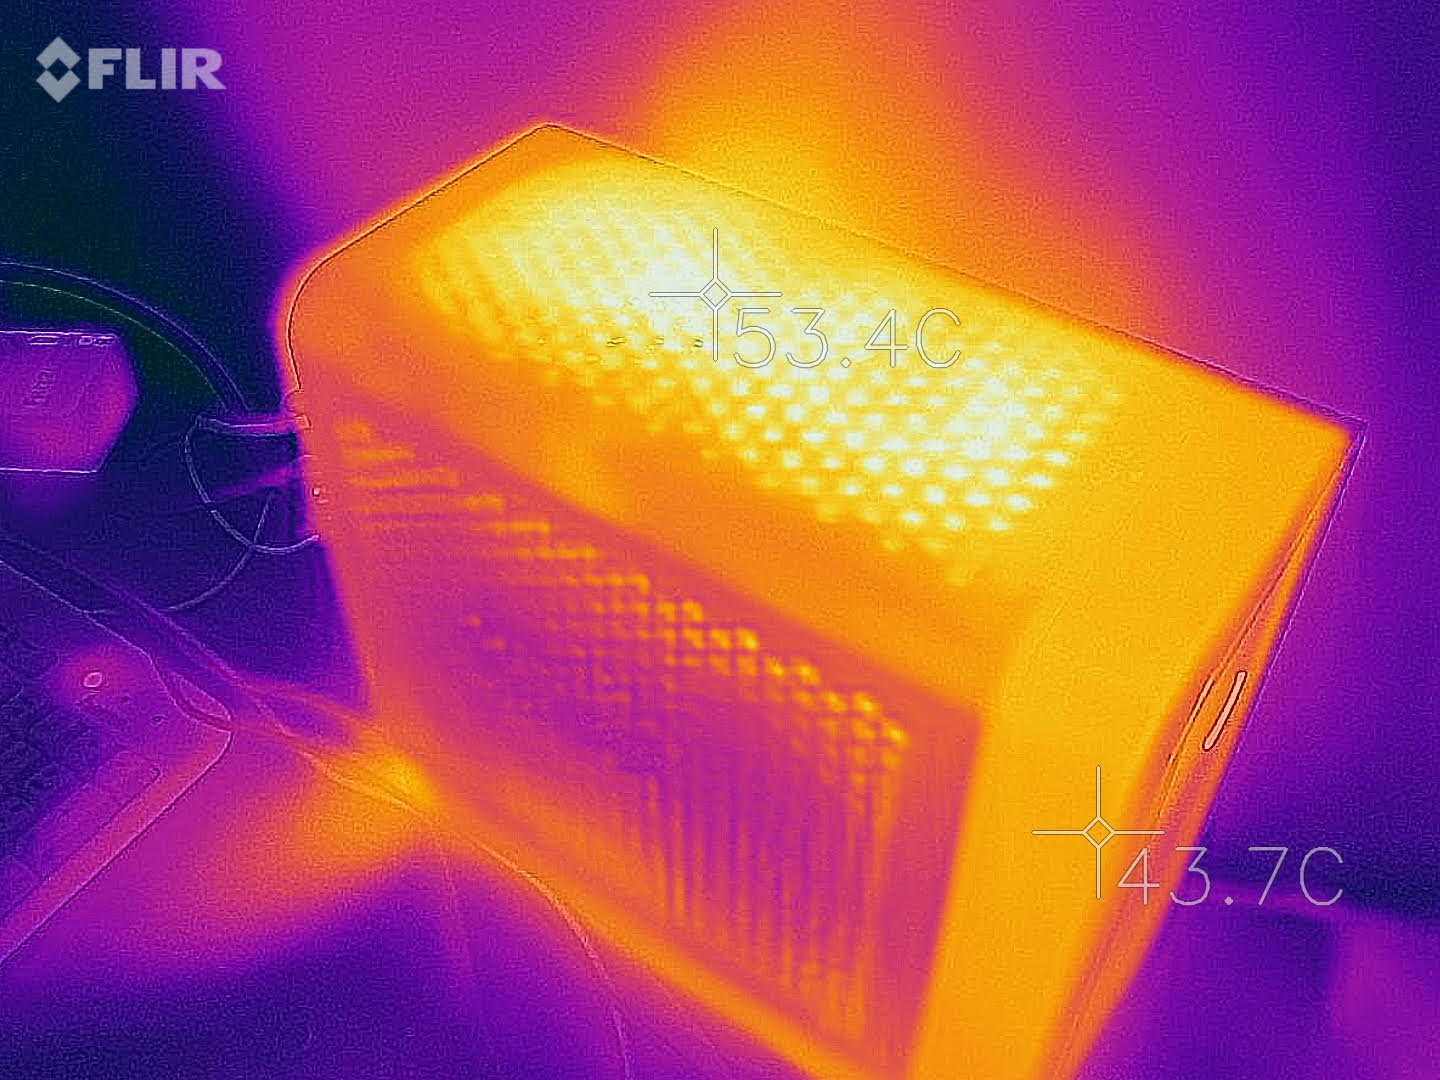
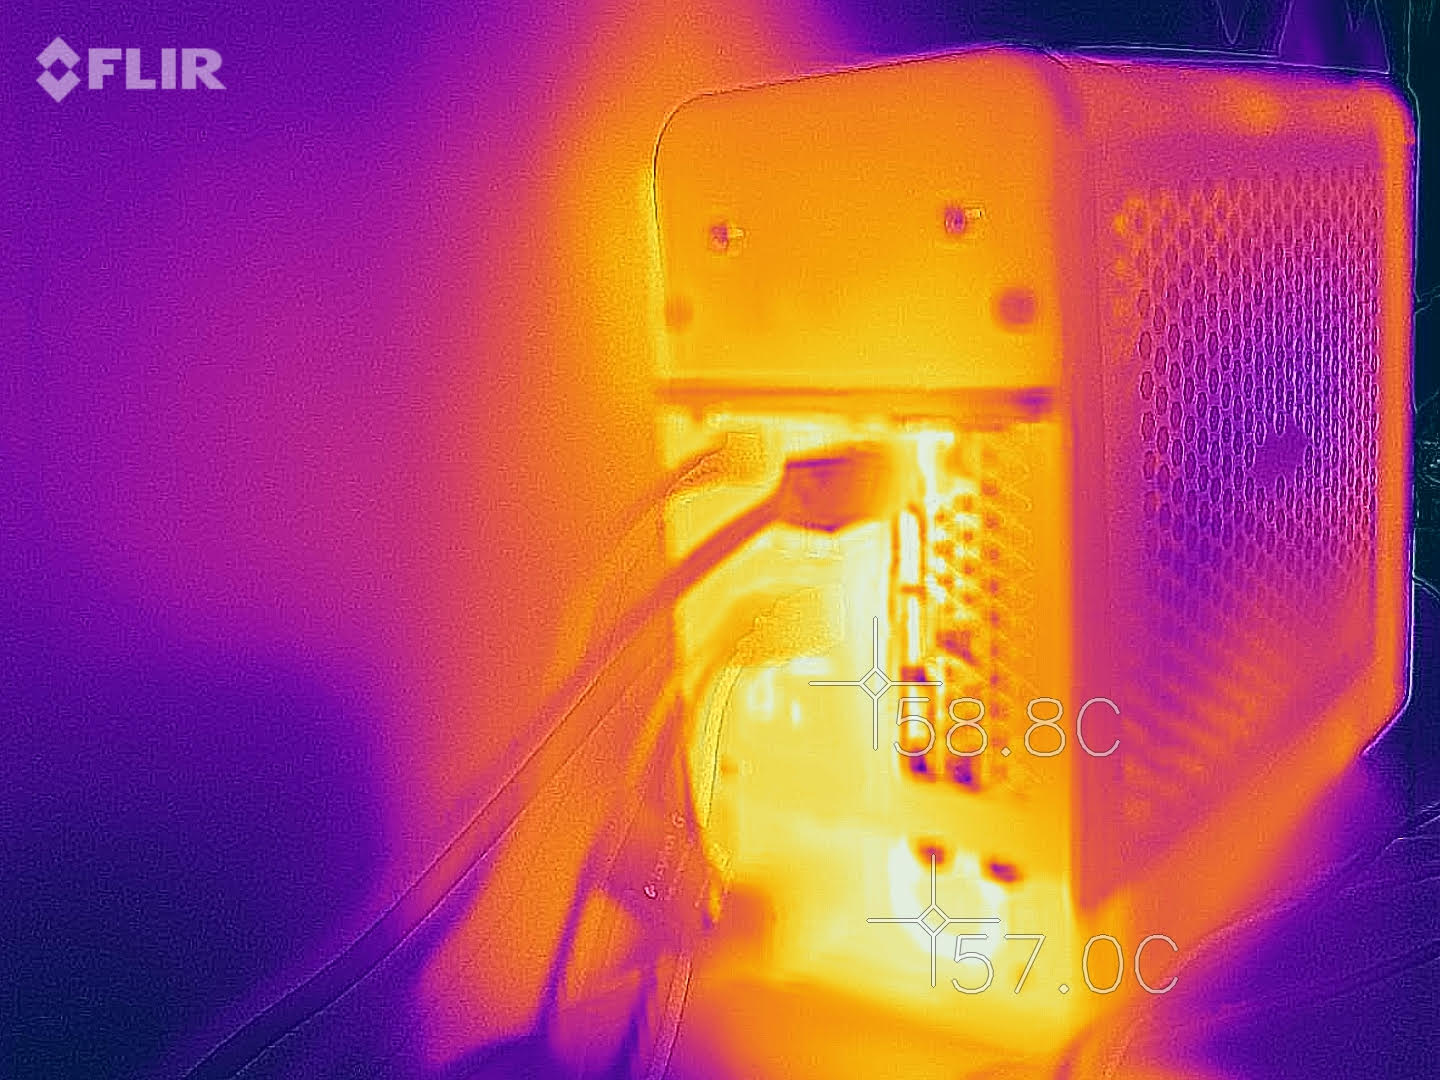
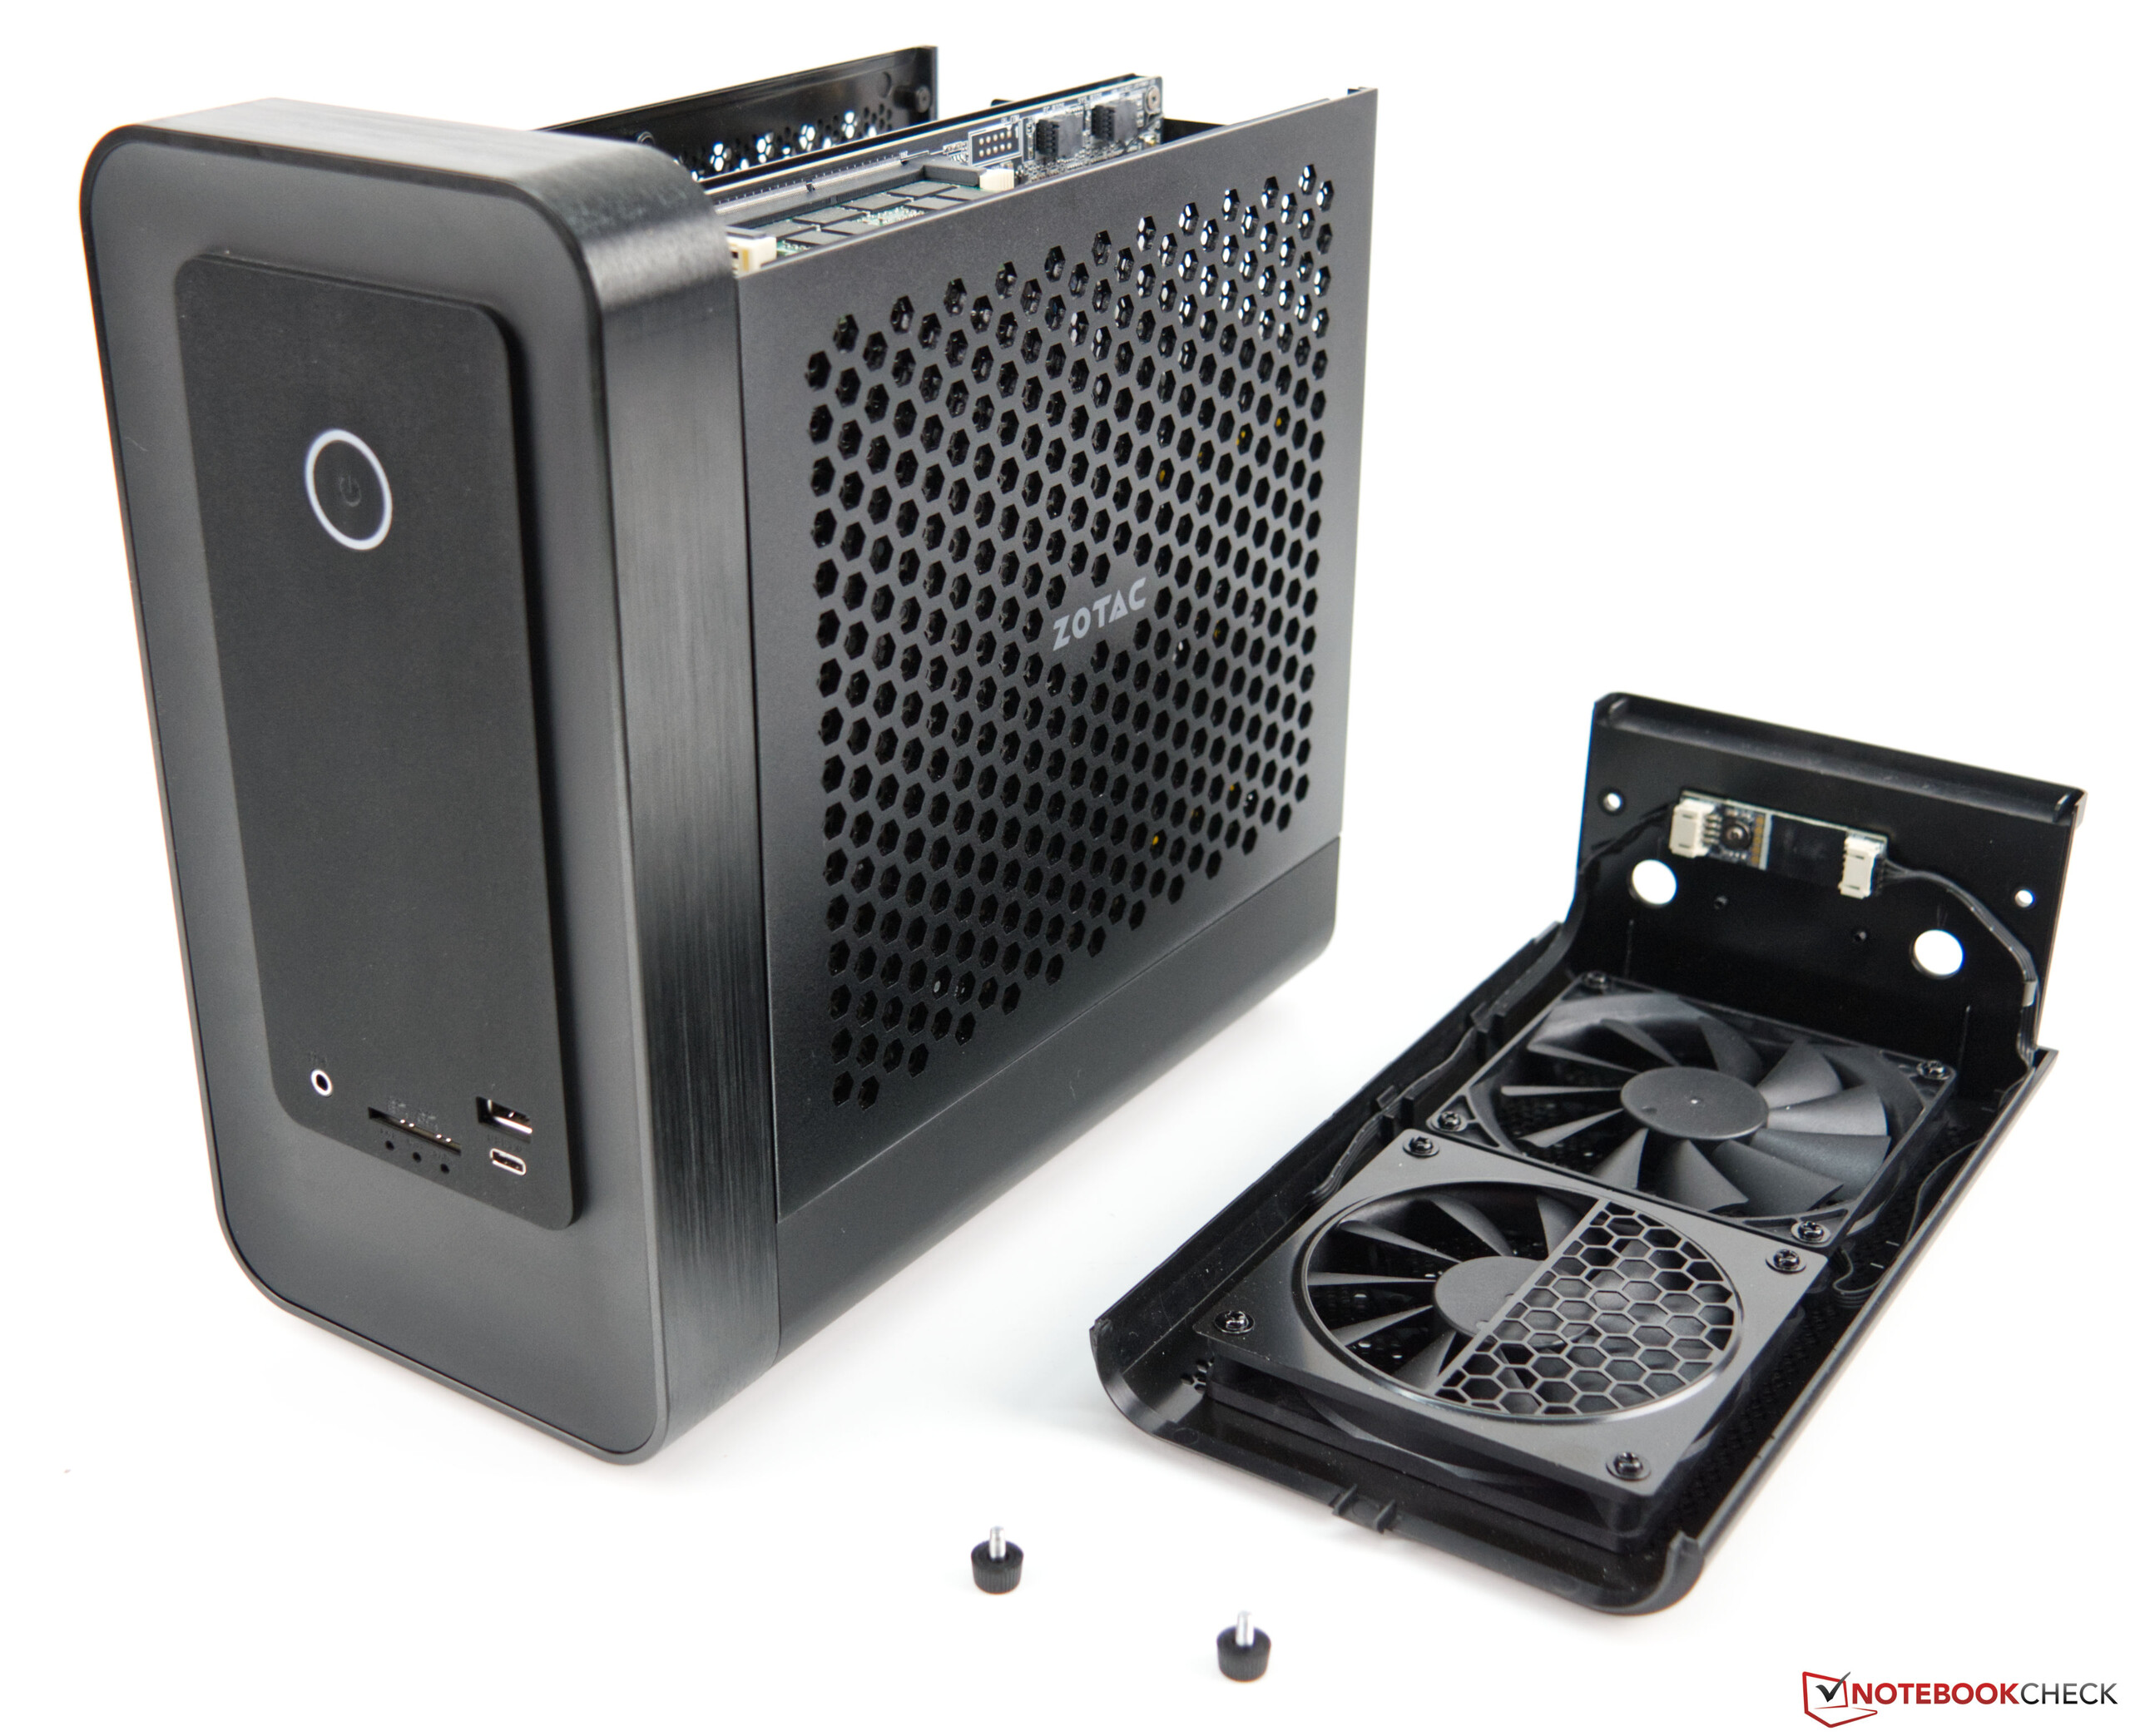
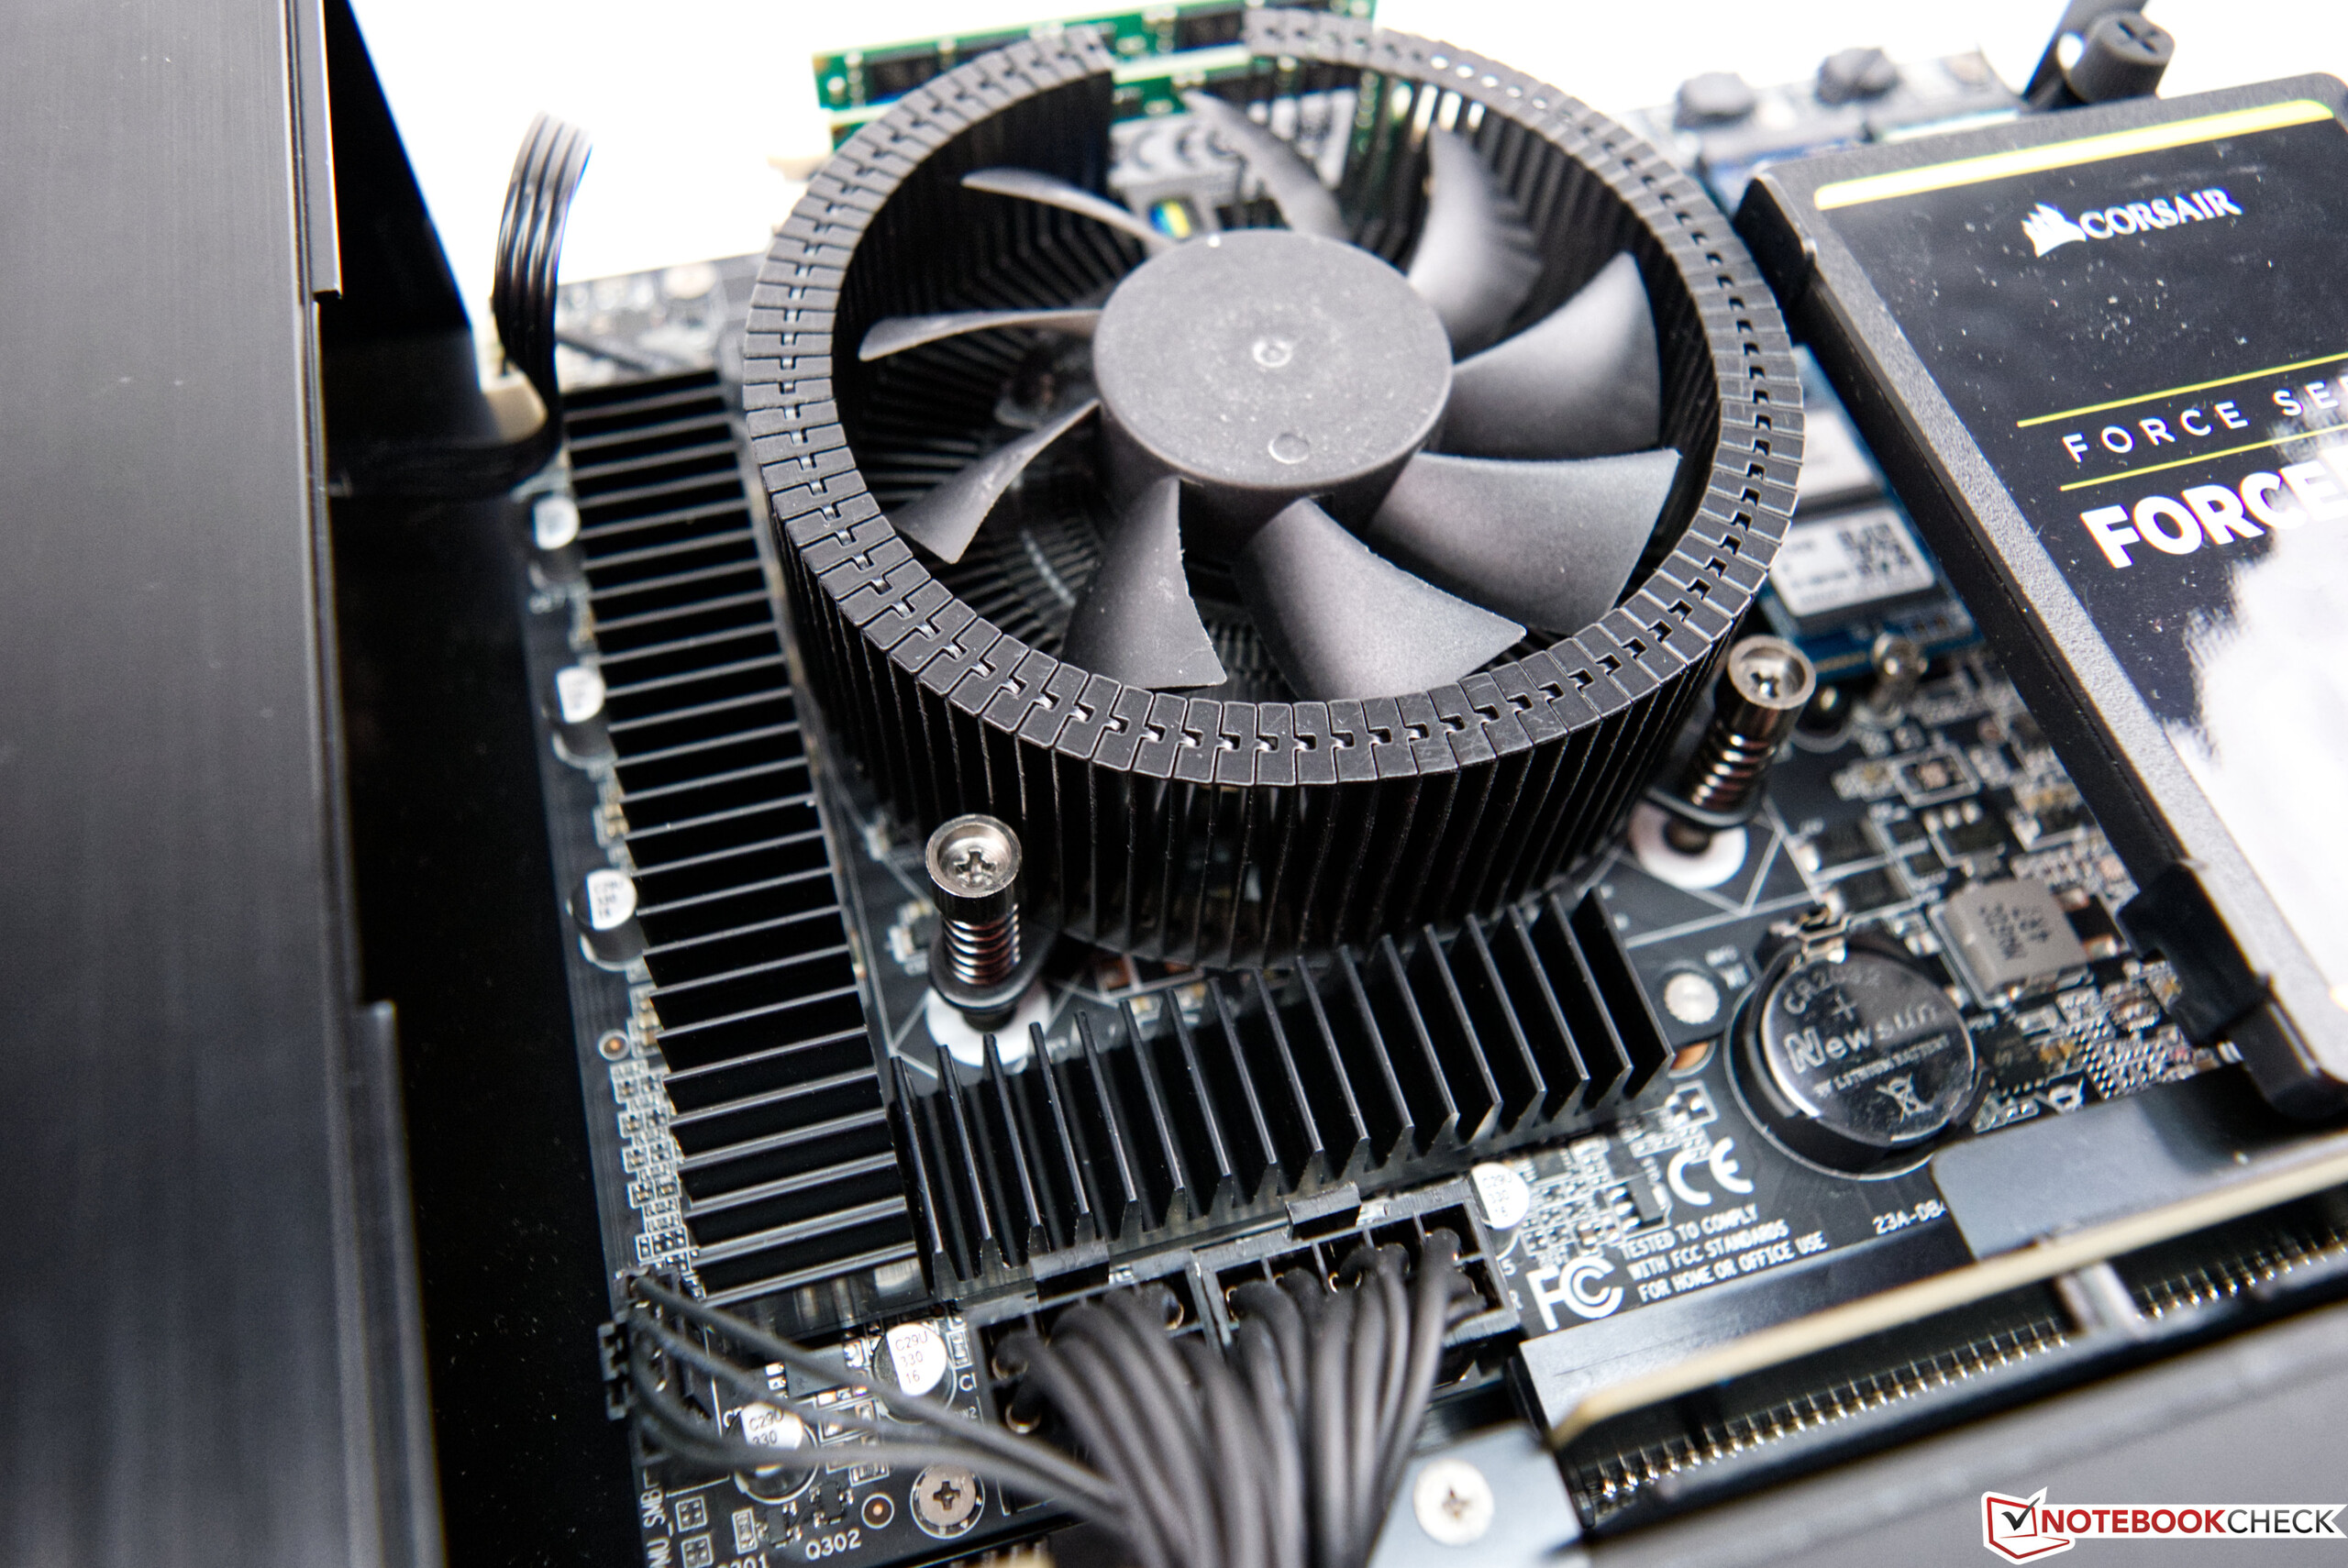
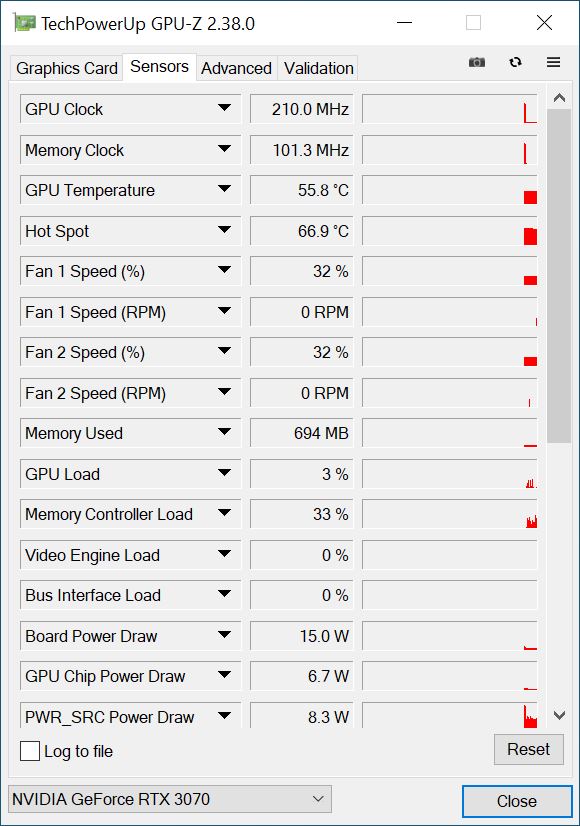
La conception compacte nécessite un système de refroidissement astucieux. Zotac utilise ici le fameux "effet cheminée" et installe deux ventilateurs en haut qui transportent la chaleur résiduelle résultante hors du boîtier. Néanmoins, l'Intel Core i7-10700 chauffe jusqu'à un maximum de 87 °C (~187 °F) pendant le test de stress. De plus, la température de la RTX 3070 de GeForce a grimpéjusqu'à presque 81 °C (~178 °F) pendant le test destress.

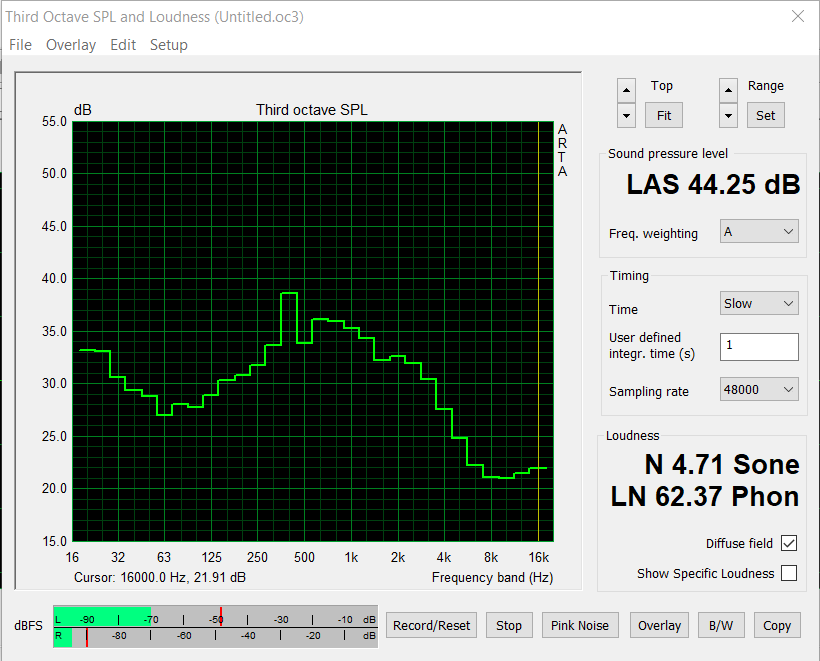
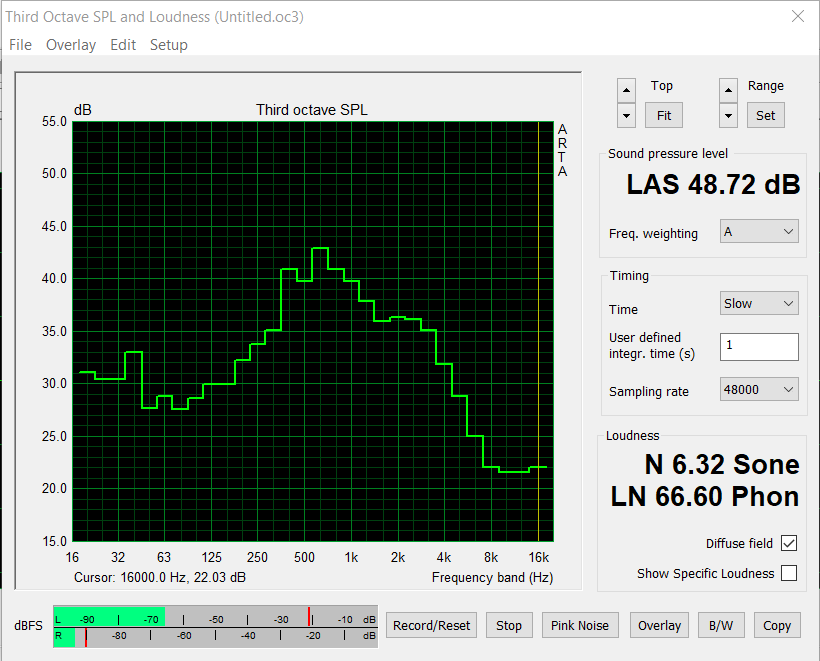
Tout cela reste dans des limites acceptables, et il n'y a aucune raison de s'inquiéter. Même pendant les longues sessions de jeu, il n'y a pas eu de baisse notable des performances qui aurait pu indiquer que les températures étaient trop élevées.

Pour un système de bureau, cependant, le Magnus One est clairement audible sous charge en raison de sa situation de refroidissement. Nous n'avons mesuré que 33,5 dB(A) en utilisation inactive, bien qu'il soit devenu considérablement plus fort à 48,7 dB(A) lors des jeux. Le niveau sonore était un peu plus bas dans le test de stress à 44,2 dB(A). À ce stade, nous aimerions souligner le fait que nous n'avons pas remarqué de bruit de ventilateur à haute fréquence ou de gémissement de bobine

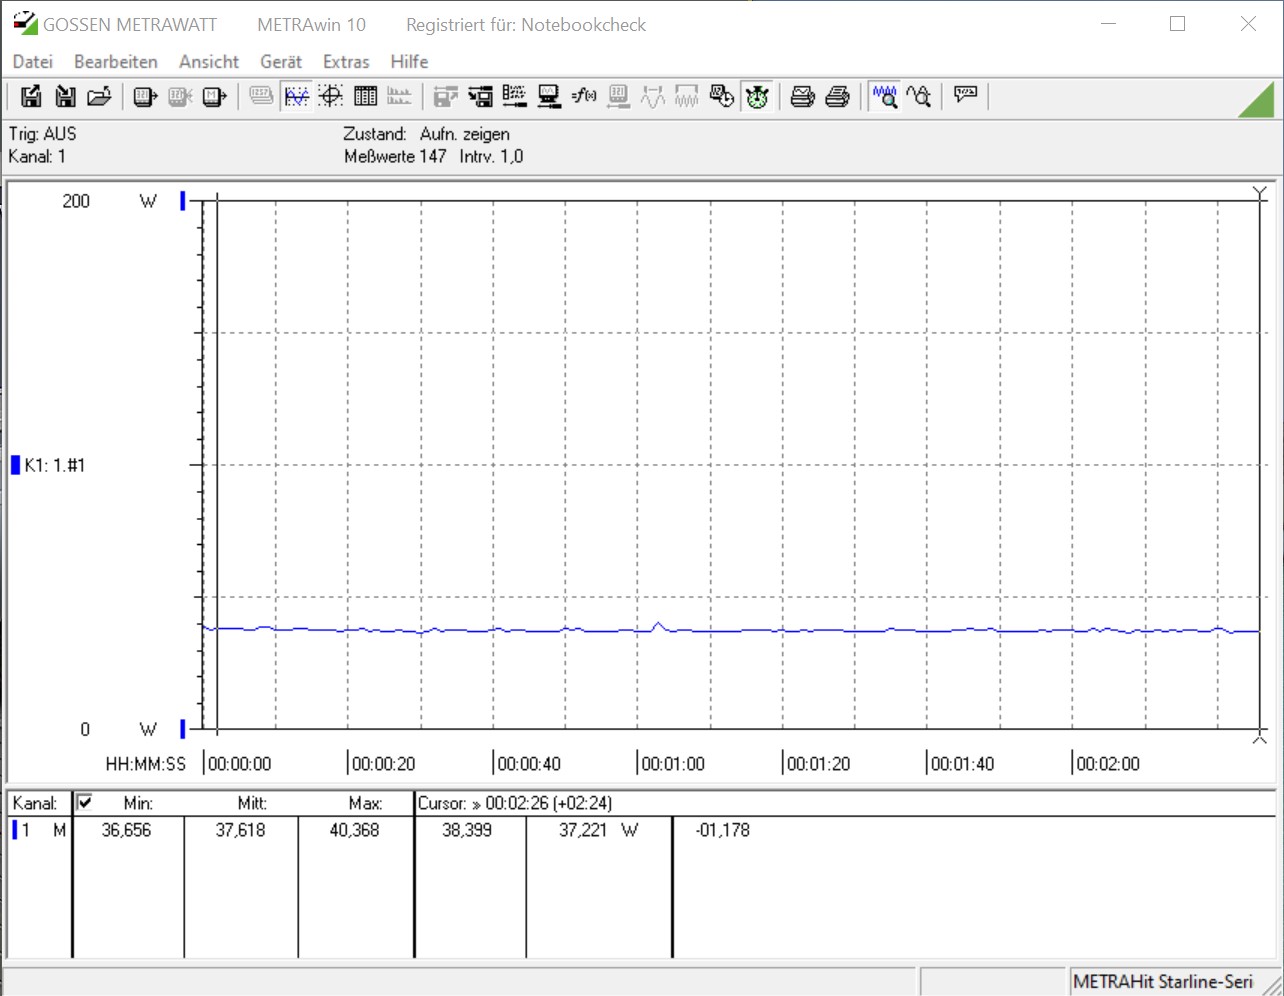
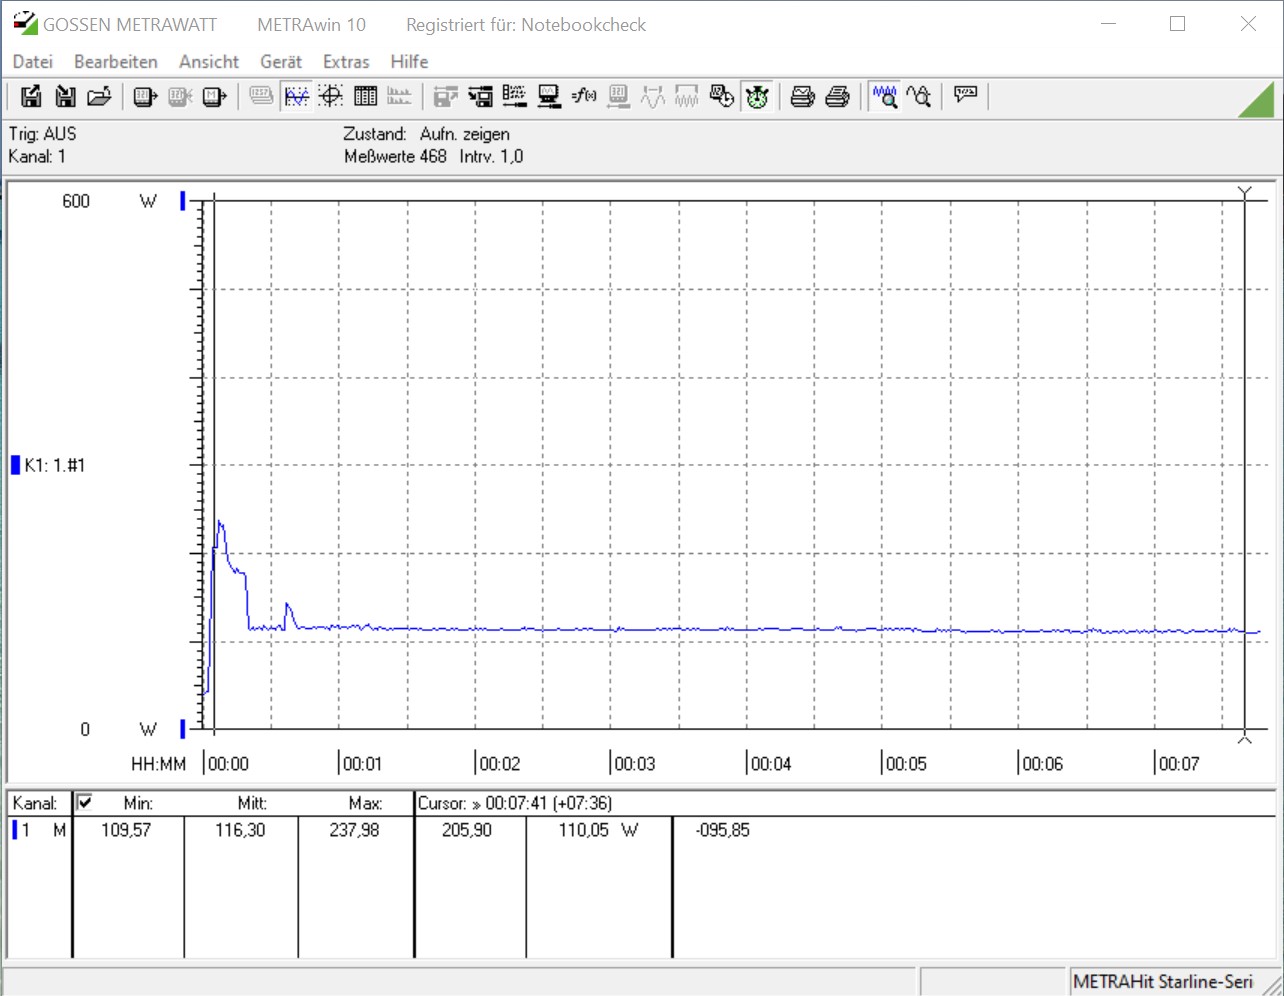
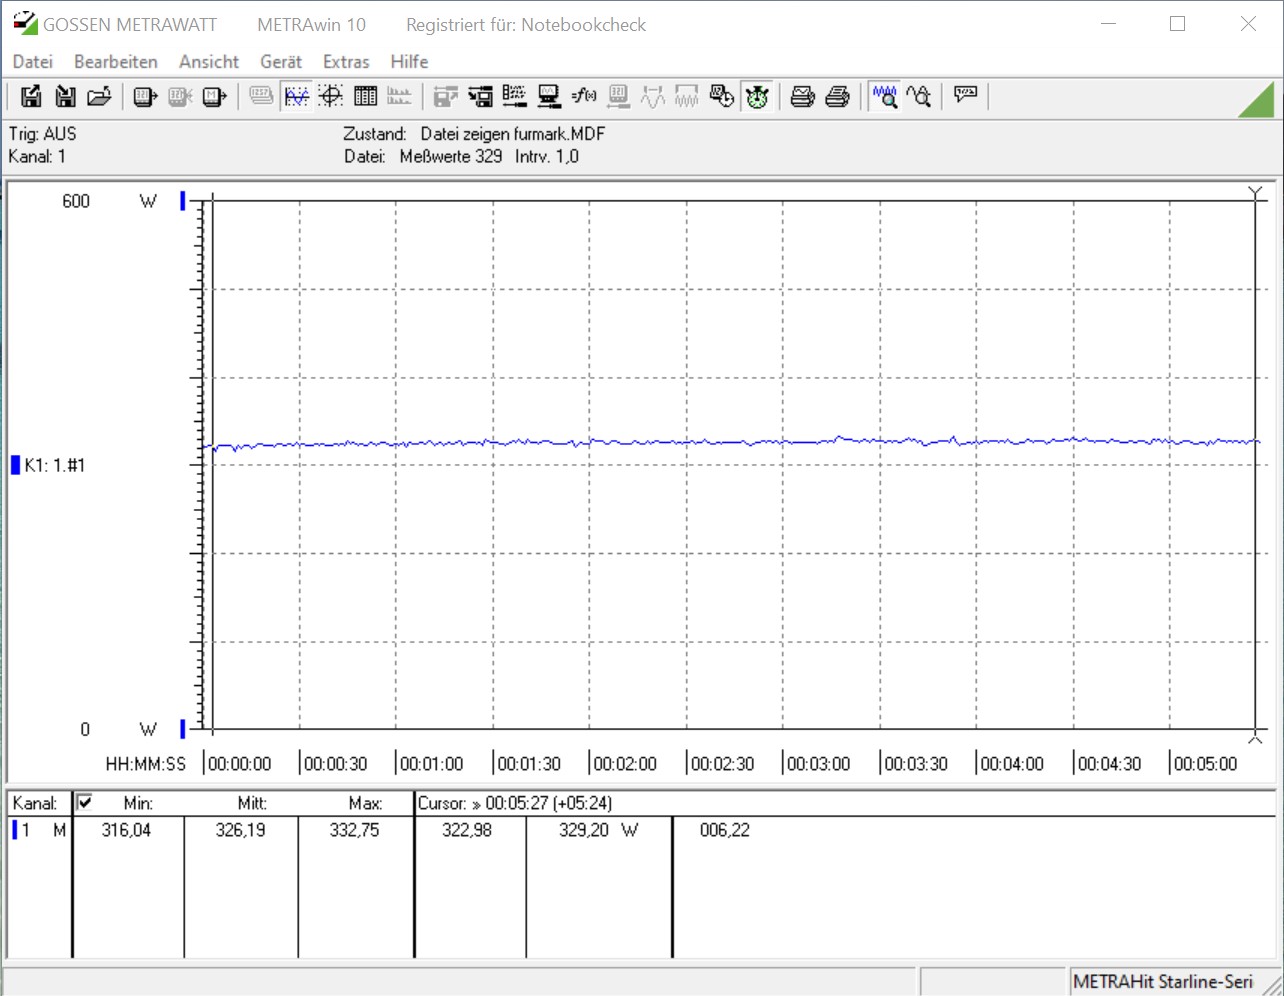
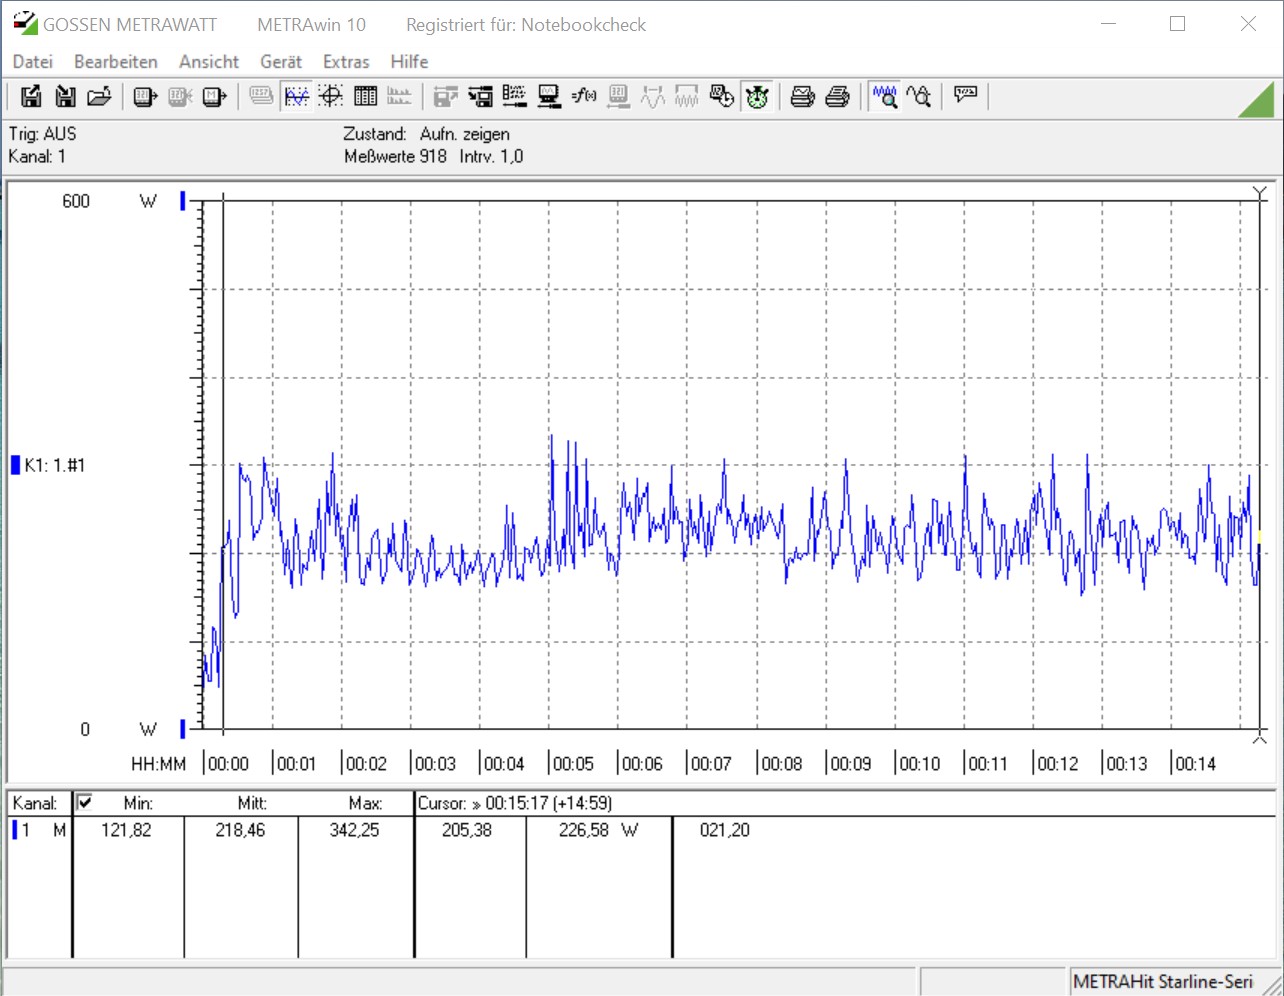
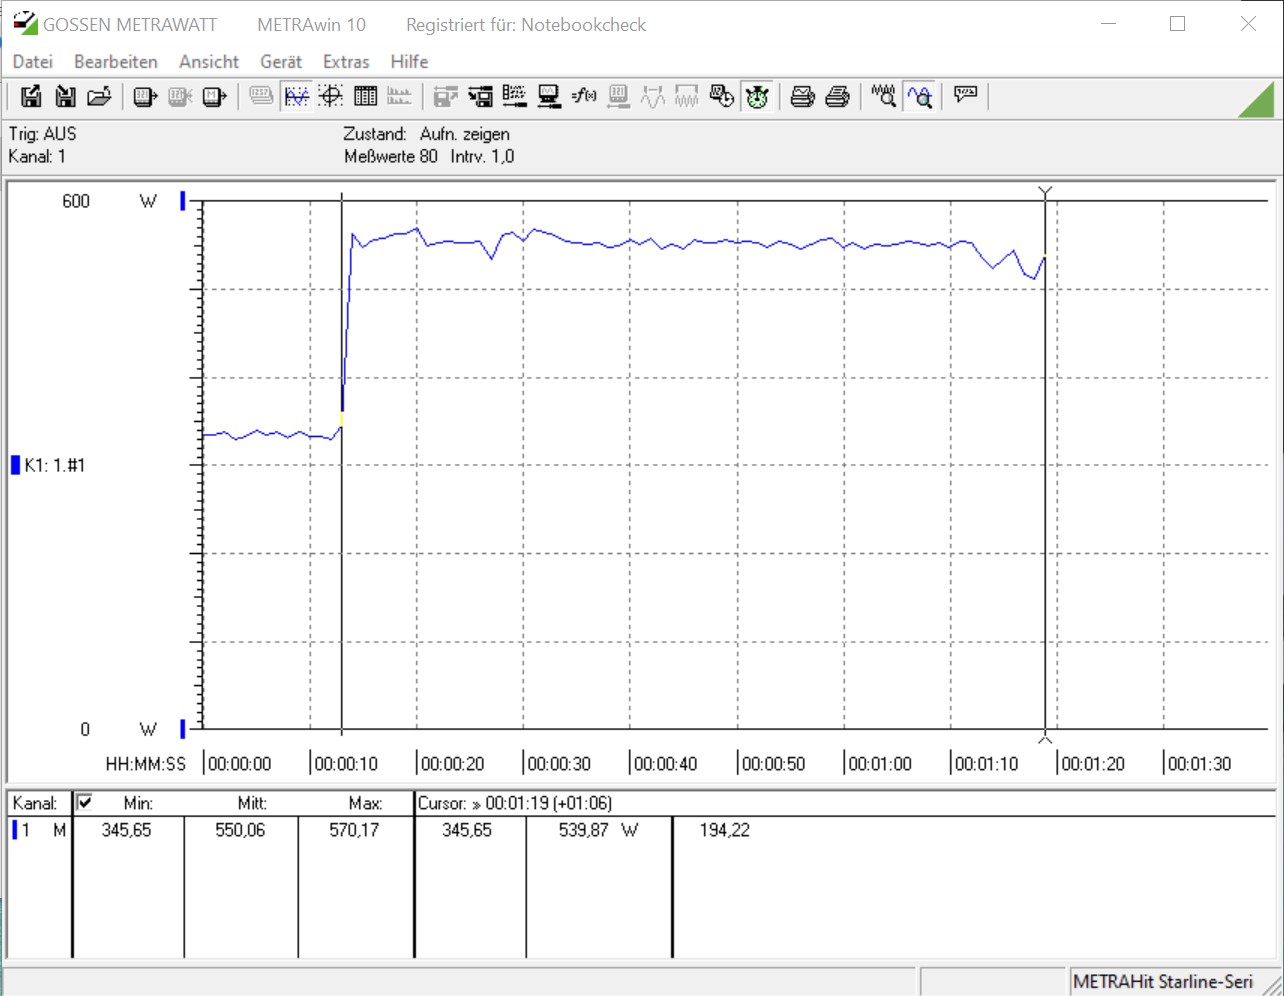
D'un côté, le Magnus One est relativement économique en termes de consommation d'énergie, mais d'un autre côté, il est aussi très gourmand en énergie lorsqu'il s'agit de jouer. Notre appareil de mesure a montré une moyenne de 550 watts dans le test de jeu. L'alimentation installée est spécifiée à 500 watts. Néanmoins, il n'y a eu aucun plantage pendant le test qui pourrait indiquer une surcharge.

Power Consumption
1920x1080 The Witcher 3 ultra (external Monitor)
Zotac Magnus One (ECM73070C)
NVIDIA GeForce RTX 3070, i7-10700, Phison 512GB PA6620060U (Idle: 37.6 W)
550 (346min - 570max) Watt *
AMD Ryzen 7 5800X
NVIDIA Titan RTX, R7 5800X, Intel Optane 905P 480GB 2.5 (Idle: 77.5 W)
418.7 (403min - 452max) Watt * +24%
AMD Ryzen 5 5600X
NVIDIA Titan RTX, R5 5600X, Intel Optane 905P 480GB 2.5 (Idle: 79.23 W)
409.2 (381min - 434max) Watt * +26%
Intel Core i5-10600K
NVIDIA Titan RTX, i5-10600K (Idle: 52.2 W)
386.9 (380min - 404max) Watt * +30%
Intel Core i7-9700K, AMD Radeon RX Vega 64
RX Vega 64, i7-9700K
365.3 (316min - 388max) Watt * +34%
MSI GeForce RTX 3070 Ventus 3X
NVIDIA GeForce RTX 3070, R9 5900X, Intel Optane 905P 480GB 2.5 (Idle: 91.46 W)
316.5 (309min - 329max) Watt * +42%
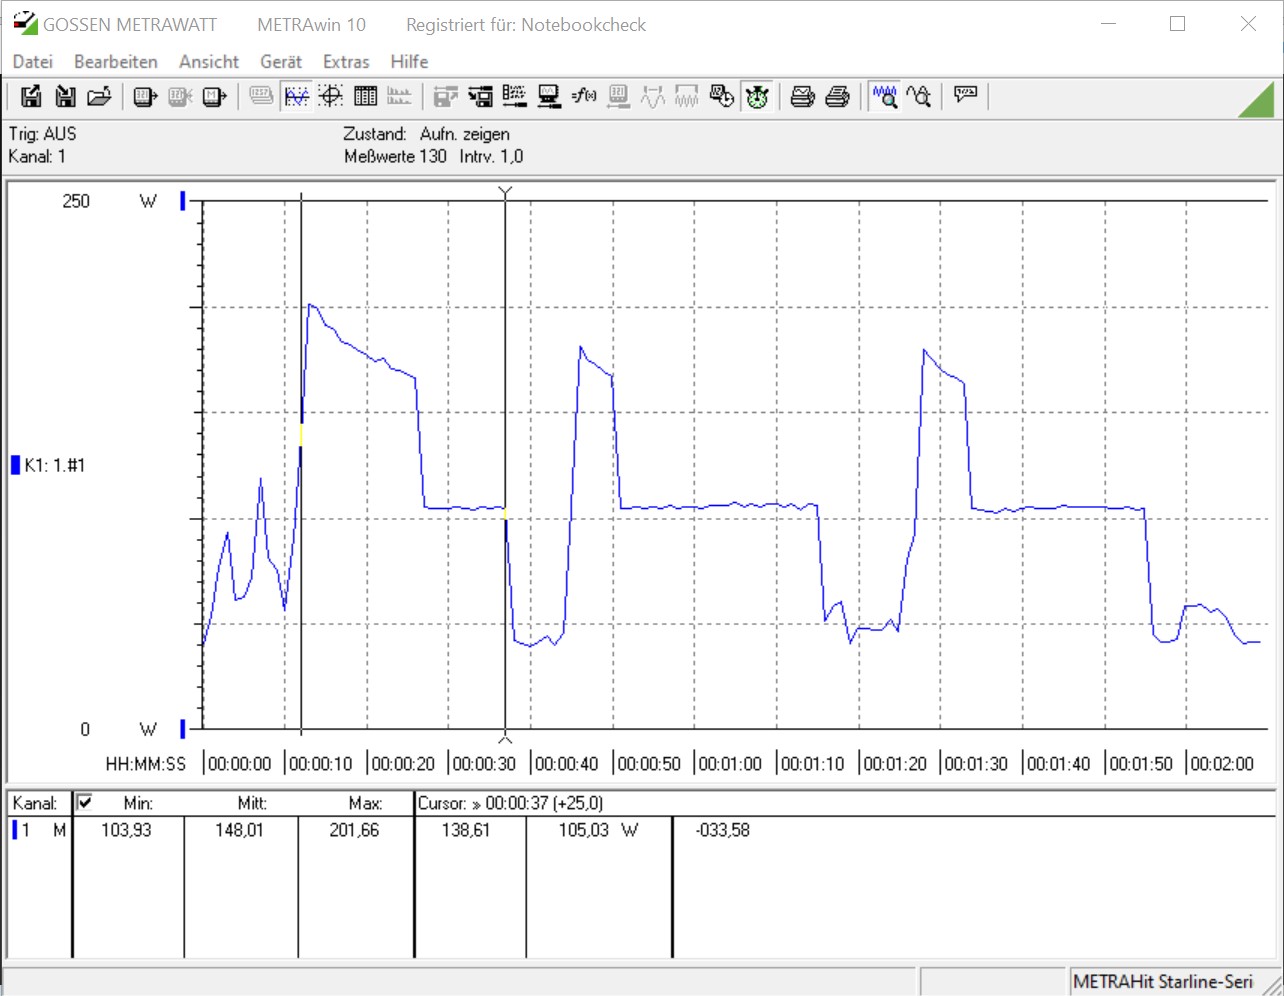
Prime95 V2810 Stress (external Monitor)
AMD Ryzen 7 5800X
NVIDIA Titan RTX, R7 5800X, Intel Optane 905P 480GB 2.5 (Idle: 77.5 W)
242.3 (222min - 254max) Watt * -108%
Intel Core i7-9700K, AMD Radeon RX Vega 64
RX Vega 64, i7-9700K
222.4 (193min - 249max) Watt * -91%
Intel Core i5-10600K
NVIDIA Titan RTX, i5-10600K (Idle: 52.2 W)
204.4 (191min - 261max) Watt * -76%
AMD Ryzen 5 5600X
NVIDIA Titan RTX, R5 5600X, Intel Optane 905P 480GB 2.5 (Idle: 79.23 W)
175.8 (170min - 179max) Watt * -51%
Zotac Magnus One (ECM73070C)
NVIDIA GeForce RTX 3070, i7-10700, Phison 512GB PA6620060U (Idle: 37.6 W)
116.3 (110min - 238max) Watt *
Cinebench R15 Multi (external Monitor)
AMD Ryzen 7 5800X
NVIDIA Titan RTX, R7 5800X, Intel Optane 905P 480GB 2.5 (Idle: 77.5 W)
220.7 (219min - 222max) Watt * -49%
Intel Core i7-9700K, AMD Radeon RX Vega 64
RX Vega 64, i7-9700K
202.6 (190min - 207max) Watt * -37%
Intel Core i5-10600K
NVIDIA Titan RTX, i5-10600K (Idle: 52.2 W)
172.5 (170min - 176max) Watt * -17%
AMD Ryzen 5 5600X
NVIDIA Titan RTX, R5 5600X, Intel Optane 905P 480GB 2.5 (Idle: 79.23 W)
170.1 (165min - 210max) Watt * -15%
Zotac Magnus One (ECM73070C)
NVIDIA GeForce RTX 3070, i7-10700, Phison 512GB PA6620060U (Idle: 37.6 W)
148 (104min - 202max) Watt *
Temperatures - CPU Temperature Prime95
AMD Ryzen 7 5800X
NVIDIA Titan RTX, R7 5800X, Intel Optane 905P 480GB 2.5
90.6 °C
Intel Core i5-10600K
NVIDIA Titan RTX, i5-10600K
70 °C

* ... Moindre est la valeur, meilleures sont les performances

Consommation électrique en mode veille
Prime95 consommation d'énergie
Consommation électrique du FurMark
Consommation électrique Prime95 et FurMark
Consommation électrique de Cinebench R15 Multi
La consommation d'énergie de Witcher 3
Prime95 et test de stress FurMark
Bruit du système (au ralenti)
Bruit du système (Prime95 et FurMark)
Bruit du système (The Witcher 3)


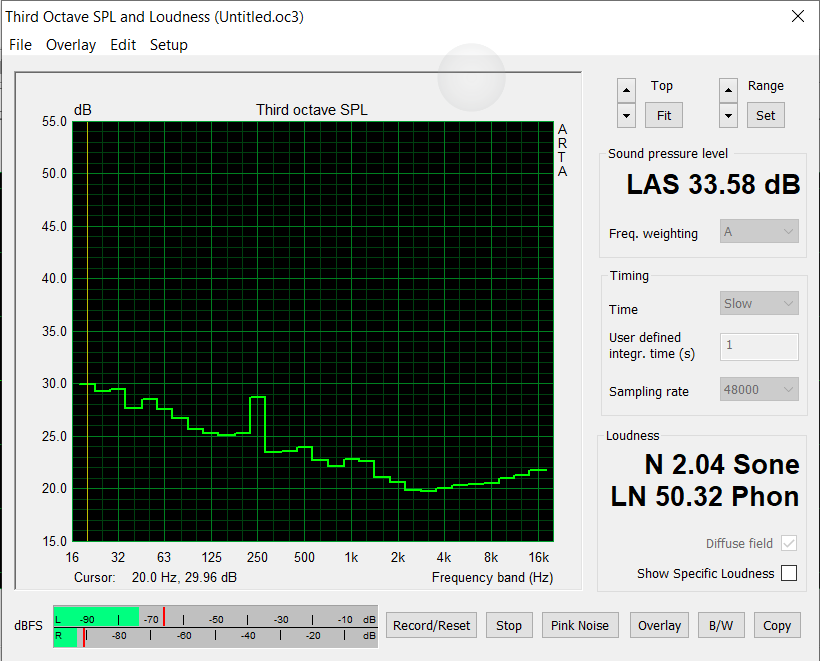
Degré de la nuisance sonore

Au repos
33.58 / / dB(A)
Fortement sollicité
44.25 / 48.72 dB(A)
  red to green bar
 
 
30 dB
silencieux
40 dB(A)
audible
50 dB(A)
bruyant
 
min: dark, med: mid, max: light   Earthworks M23R, Arta (à 15 cm de distance)   bruit ambiant: 30 dB(A)

Points positifs

+ boîtier stable et de haute qualité
+ design sobre et moderne
+ entièrement adapté au 1440p
+ nombreux ports
+ de la place pour trois périphériques de stockage de masse
+ rTX 3070 à part entière (version de bureau)

Points négatifs

- seulement un adaptateur d'alimentation de 500 watts
- clairement audible sous charge

Verdict : bonnes performances et bonne connectivité

Le Zotac Magnus One, fourni par Zotac Allemagne

Le Magnus One de Zotac est un appareil compact qui offre de très bonnes performances dans le plus petit des espaces. Notez qu'il s'agit d'un système barebone où la RAM, le stockage de masse et le système d'exploitation ne font pas partie du PDSF de 1 499 euros (~1 825 $). Cependant, au moment du test, les prix de vente réalistes commencent à 1 650 euros (~2 009 $) et plus. Les utilisateurs qui peuvent mettre la main sur le Magnus One à un bon prix pourraient même faire une bonne affaire, puisque la RTX 3070 de GeForce coûte déjà à elle seule bien plus de 1 000 euros (~$1 218). L'Intel Core i7-10700 n'est pas la dernière version des processeurs Core, mais ce n'est pas un problème dans l'utilisation quotidienne. Dans l'ensemble, le petit Core i7-10700, qui n'a pas été limité en termes de TDP, s'intègre bien dans le système global. Cependant, le Magnus One obtient de meilleurs résultats dans nos benchmarks 3D et jeux que dans les tests de CPU dédiés. AMD est un peu mieux positionné ici avec la série Ryzen 5000. Peut-être que Zotac envisagera de développer un système basé sur AMD également.

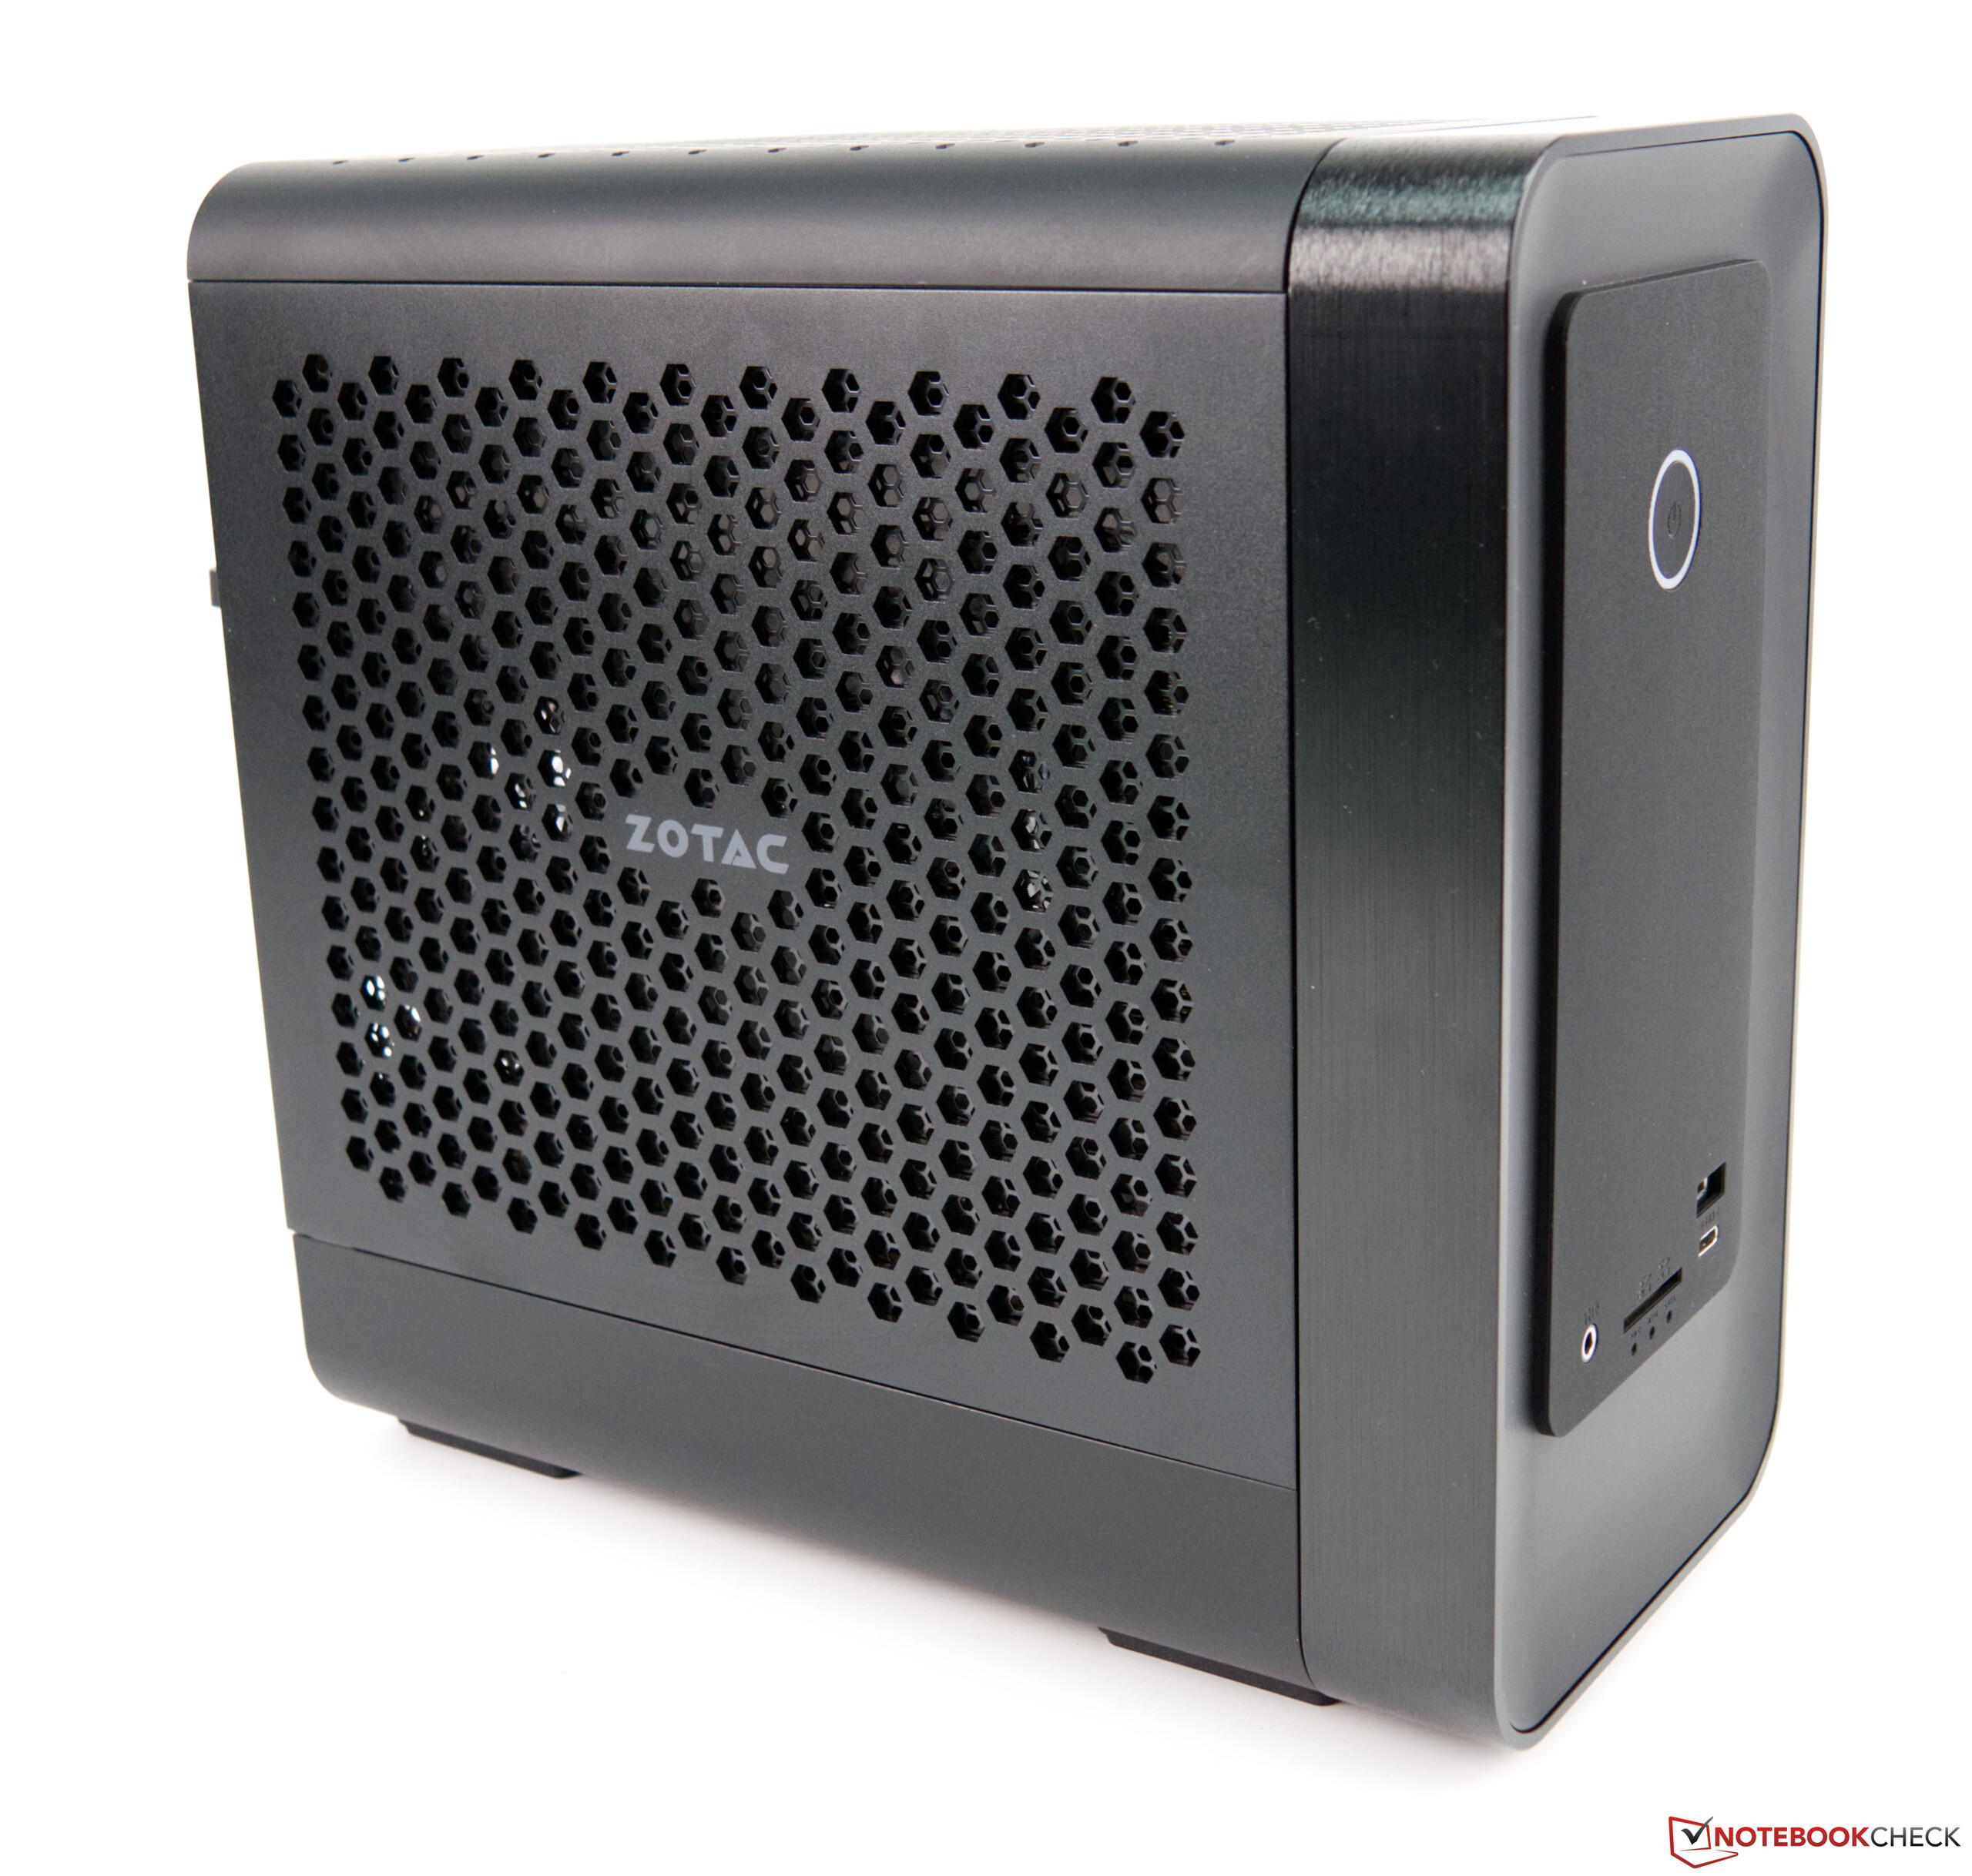
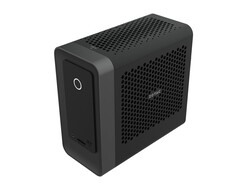
Le Magnus One est un système puissant et compact qui attire le regard même sans RGB.

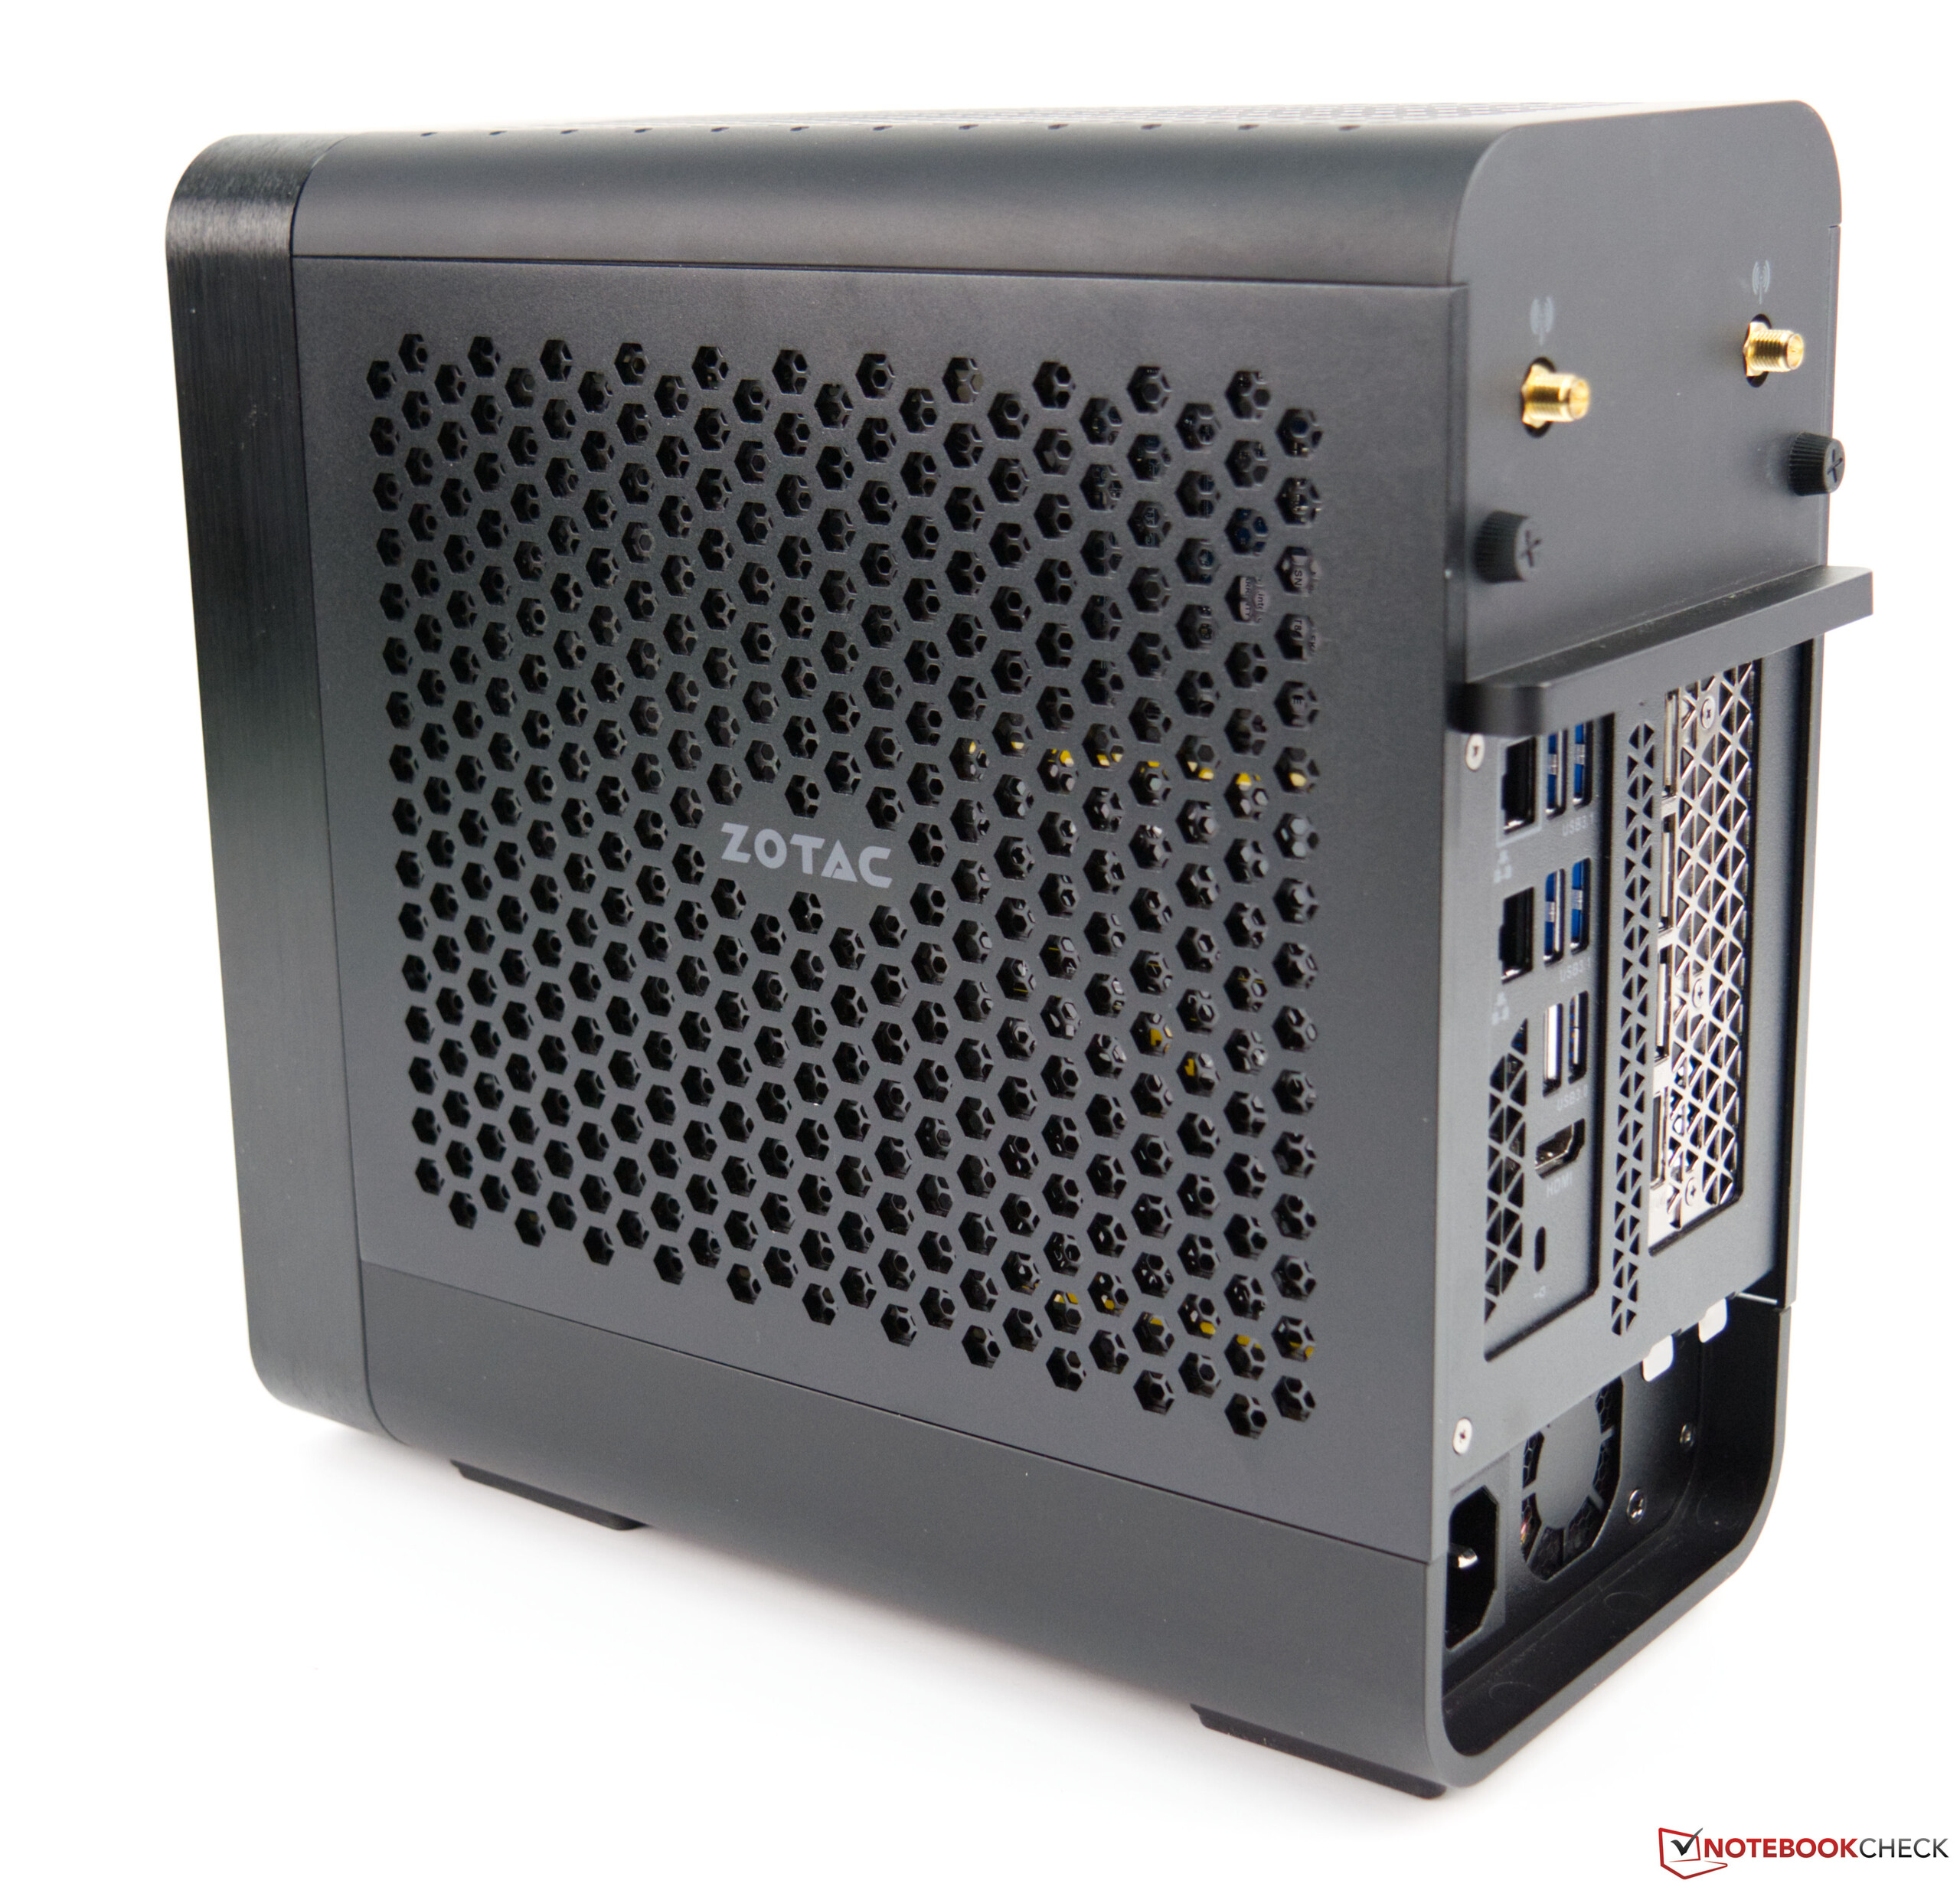
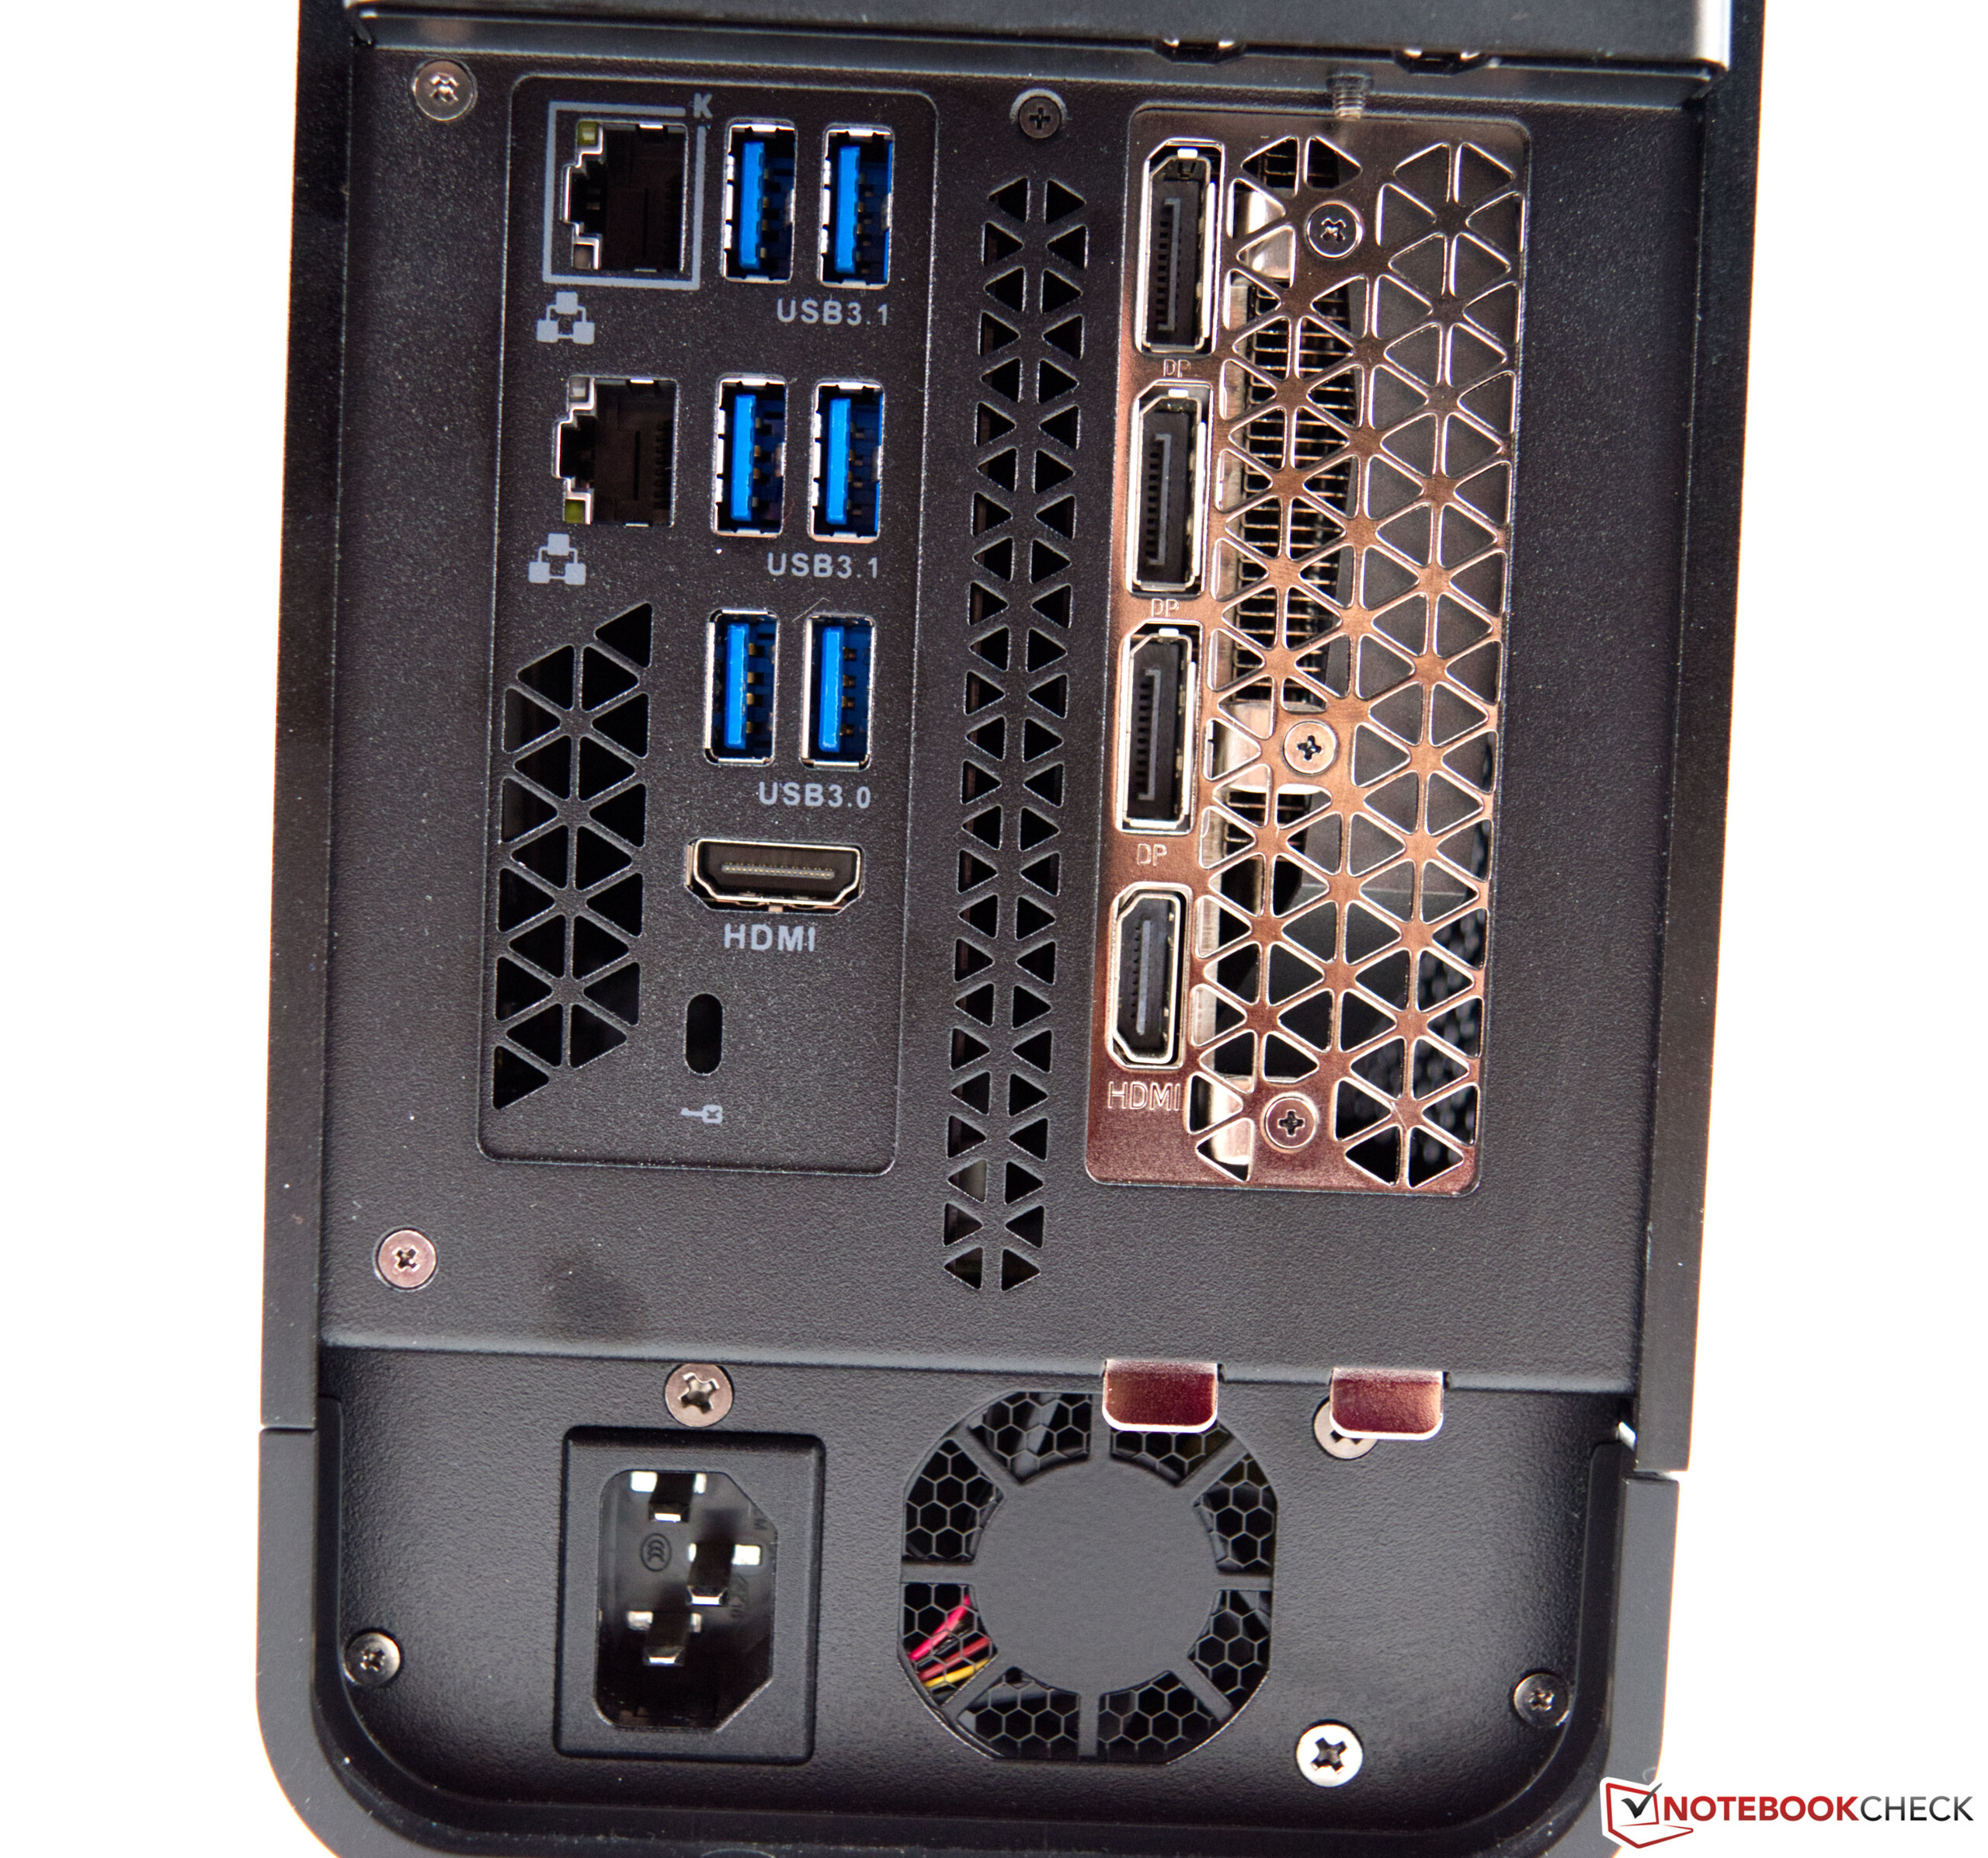
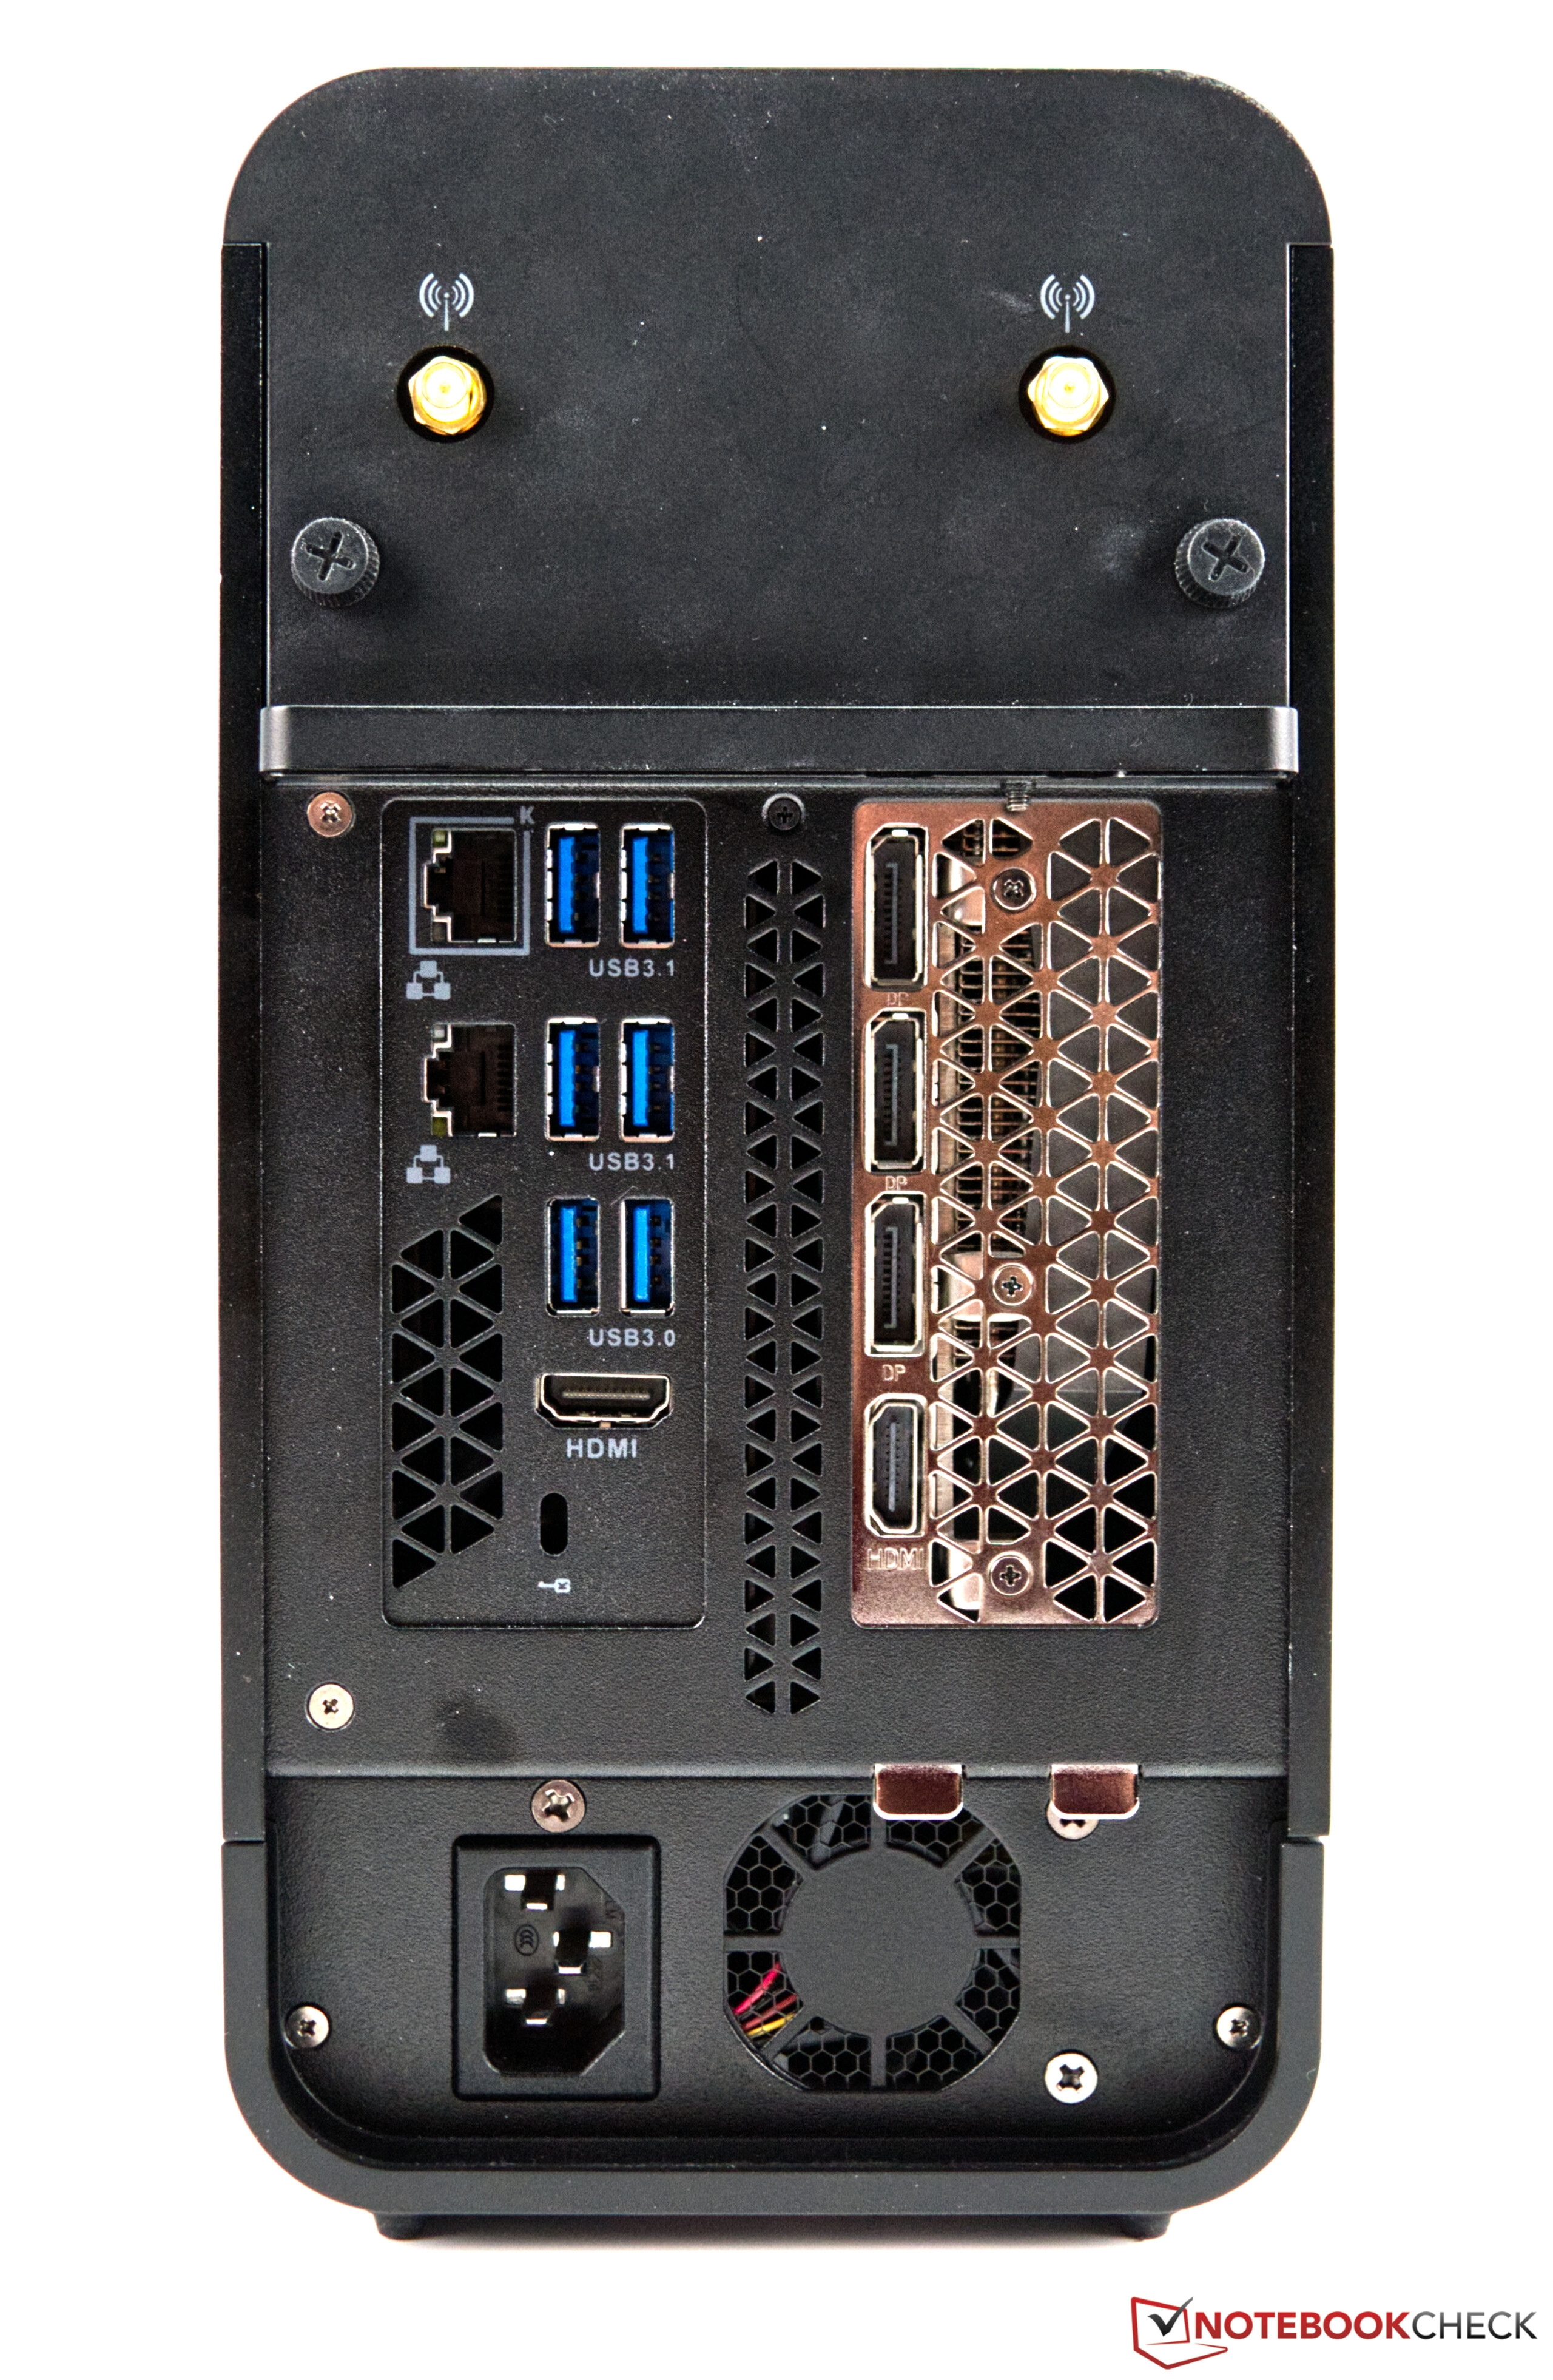
Le boîtier du PC est beau sans beaucoup de cloches et de sifflets, et les lunettes RGB ont été complètement abandonnées aussi. Ce n'est pas forcément une mauvaise chose, car de nombreux utilisateurs recherchent un boîtier sobre, et Zotac a réussi à le créer avec le Magnus One. En outre, le choix des matériaux est très bon, puisque le boîtier est principalement constitué de métal. La sélection des ports est également polyvalente et ne laisse pratiquement rien à désirer. Néanmoins, nous devons critiquer le refroidissement un peu gênant en charge.

Il n'y a pas beaucoup d'alternatives au Magnus One de Zotac, car les fabricants populaires se concentrent généralement sur les systèmes complets. À titre de comparaison, vous pouvez toutefois jeter un coup d'œil à la série MEG Trident X de MSI. Elle offre une configuration similaire dans un boîtier attrayant et compact.

Please share our article, every link counts!
> Revues et rapports de ordinateurs portatifs et smartphones, ordiphones > Critiques > Test du Zotac Magnus One avec Core i7 et GeForce RTX 3070
Sebastian Bade, 2021-06-10 (Update: 2021-06-11)