Un nouveau regard sur le Vermeer - test des AMD Ryzen 9 5950X et AMD Ryzen 5 5600X
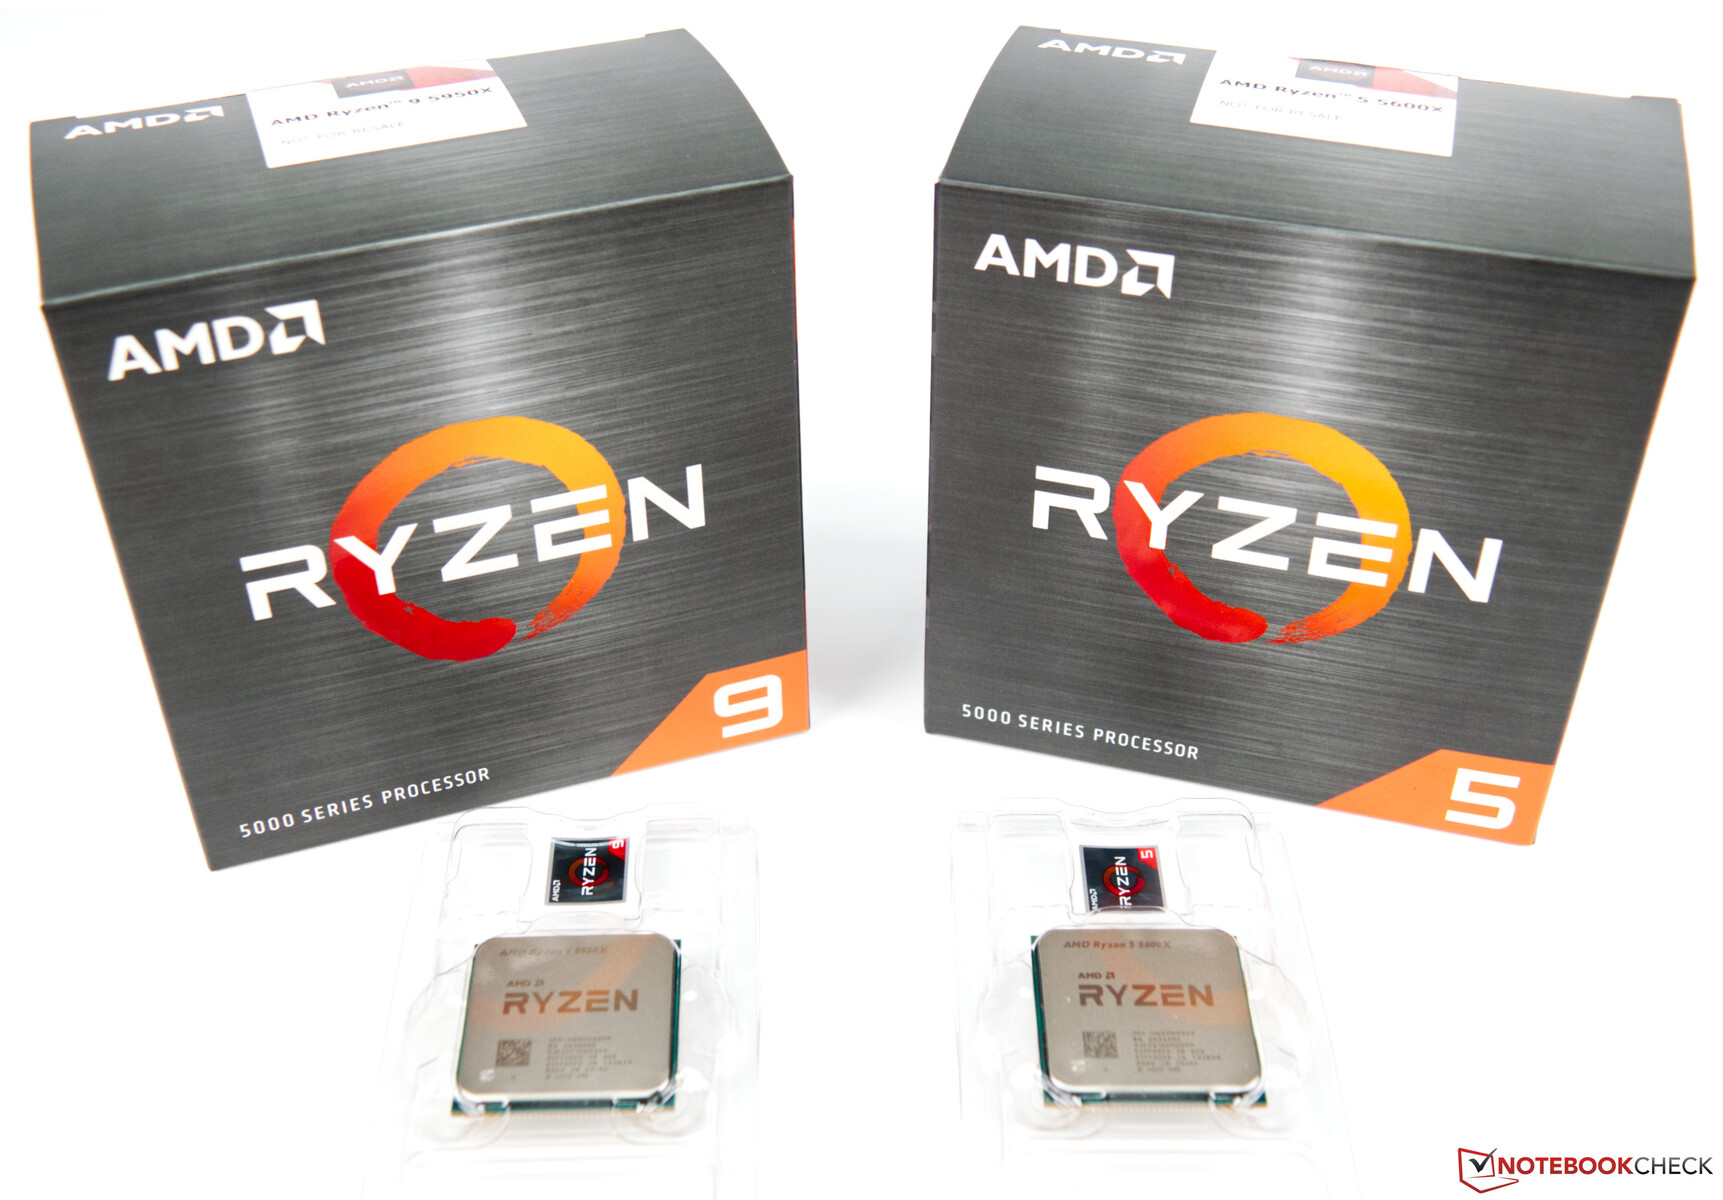
Après avoir précédemment évalué en profondeur l'AMD Ryzen 9 5900X et l'AMD Ryzen 7 5800X, nous allons, dans cette étude, nous pencher sur l'AMD Ryzen 9 5950X et l'AMD Ryzen 5 5600X. Avec ces processeurs, AMD étend le haut et le bas de la nouvellesérie Vermeer dans sonnouveau portefeuille.
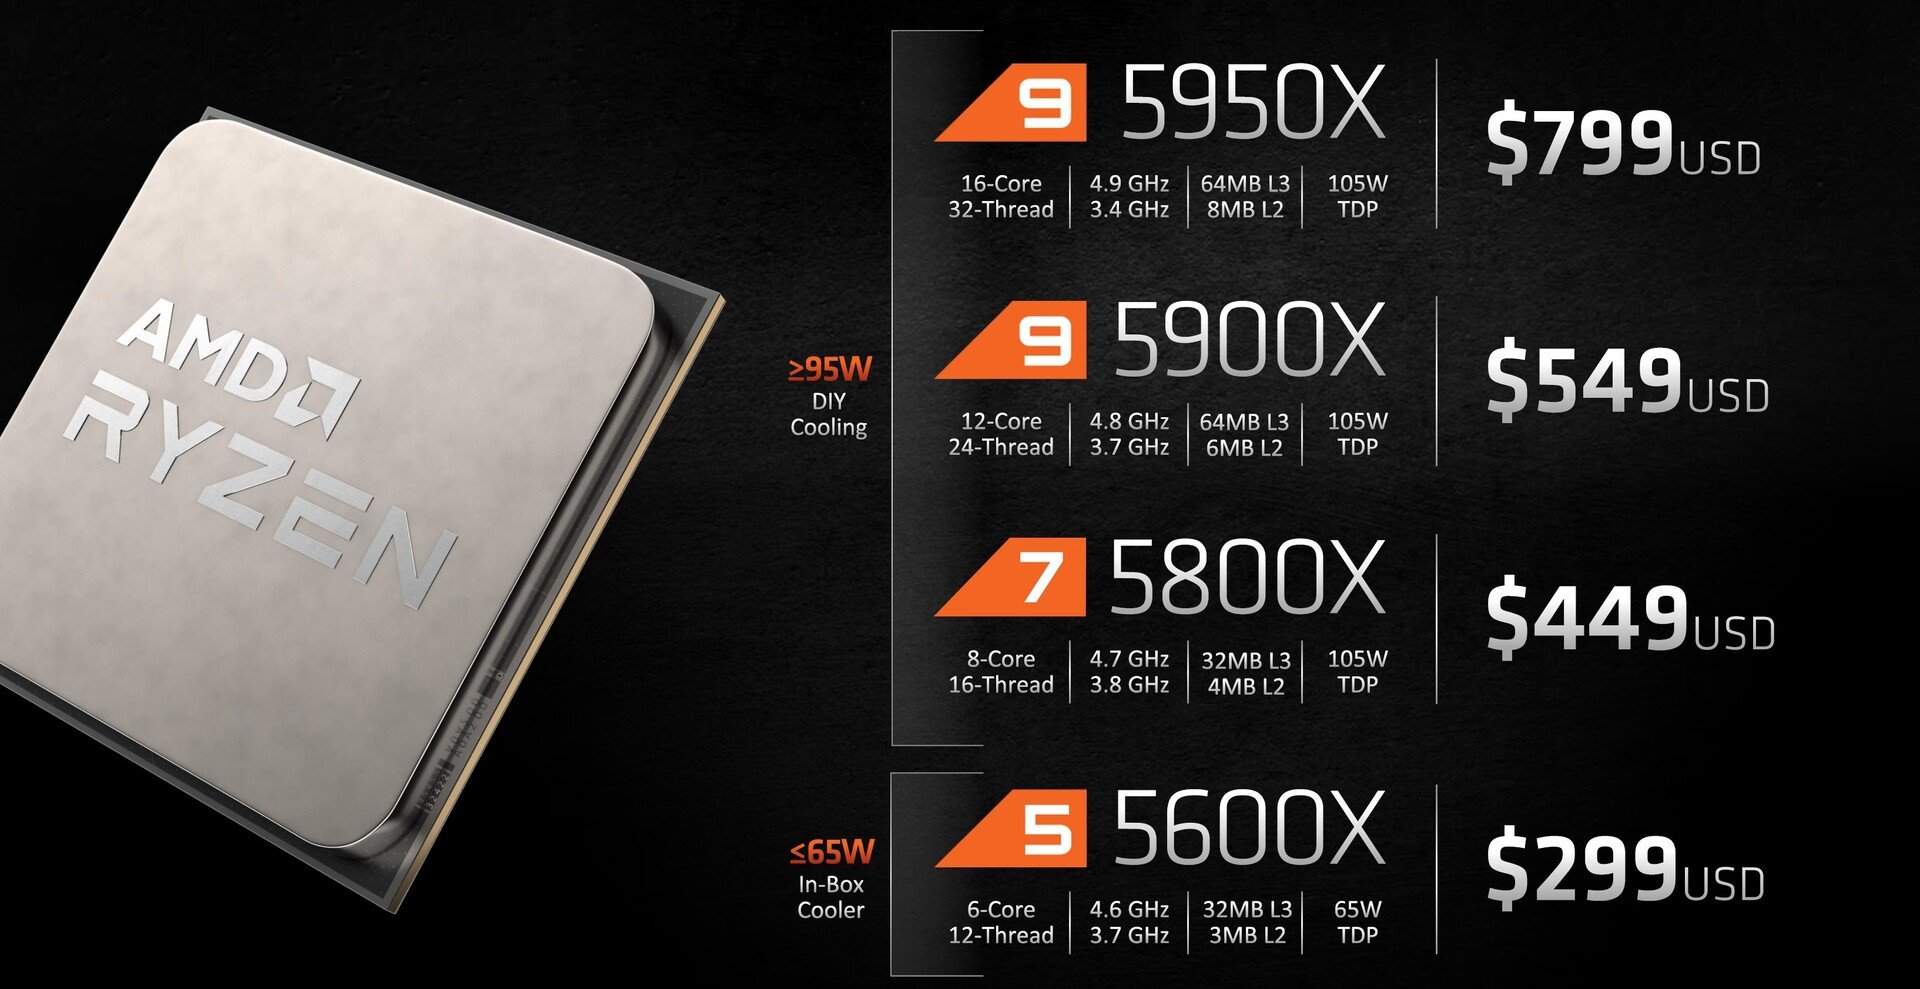
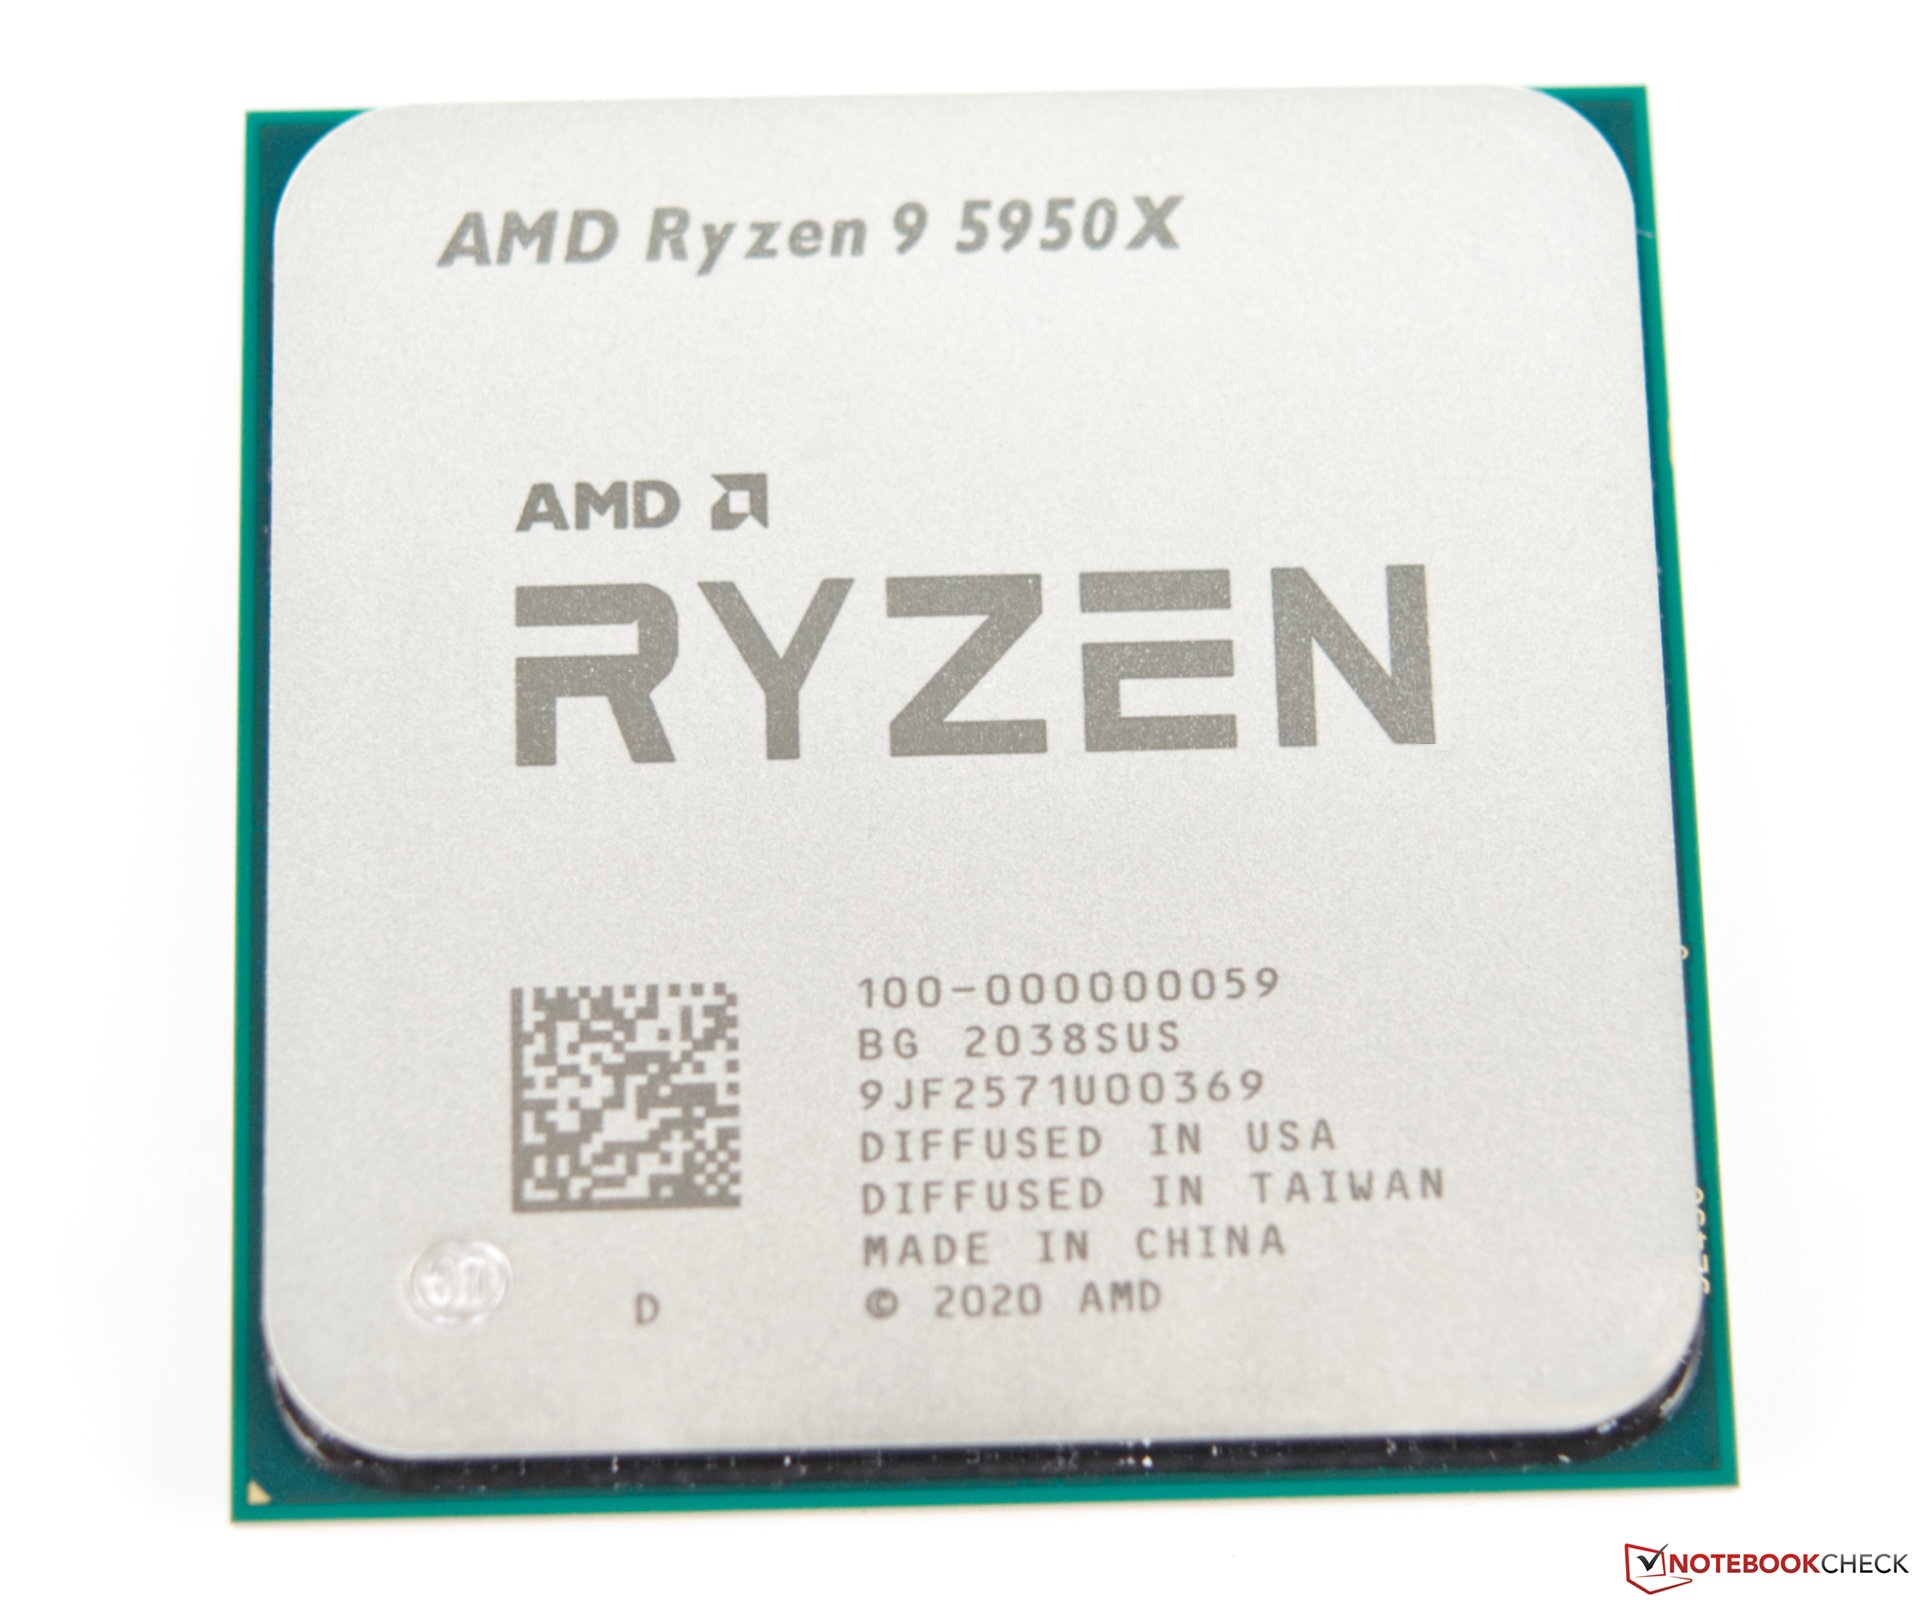
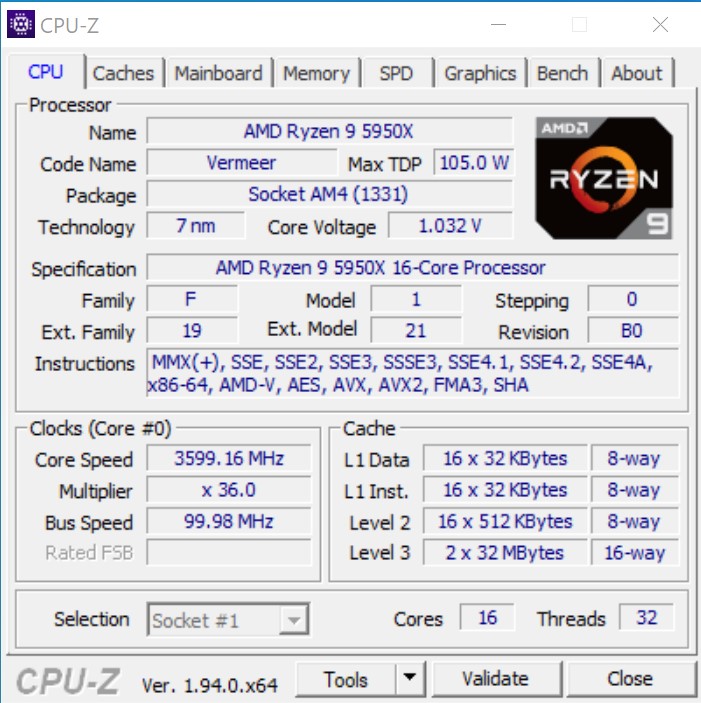
L'AMD Ryzen 9 5950X est le successeur de l'AMD Ryzen 9 3950X et offre également 16 noyaux et 32 fils. Les nombreuses innovations de l'architecture Vermeer promettent également un saut de performance décent. En même temps, le nouveau modèle haut de gamme ne consomme pas plus d'énergie que son prédécesseur, puisque AMD spécifie également un TDP de 105 watts. Nous expliquerons plus tard si cette valeur se reflète également dans la réalité.
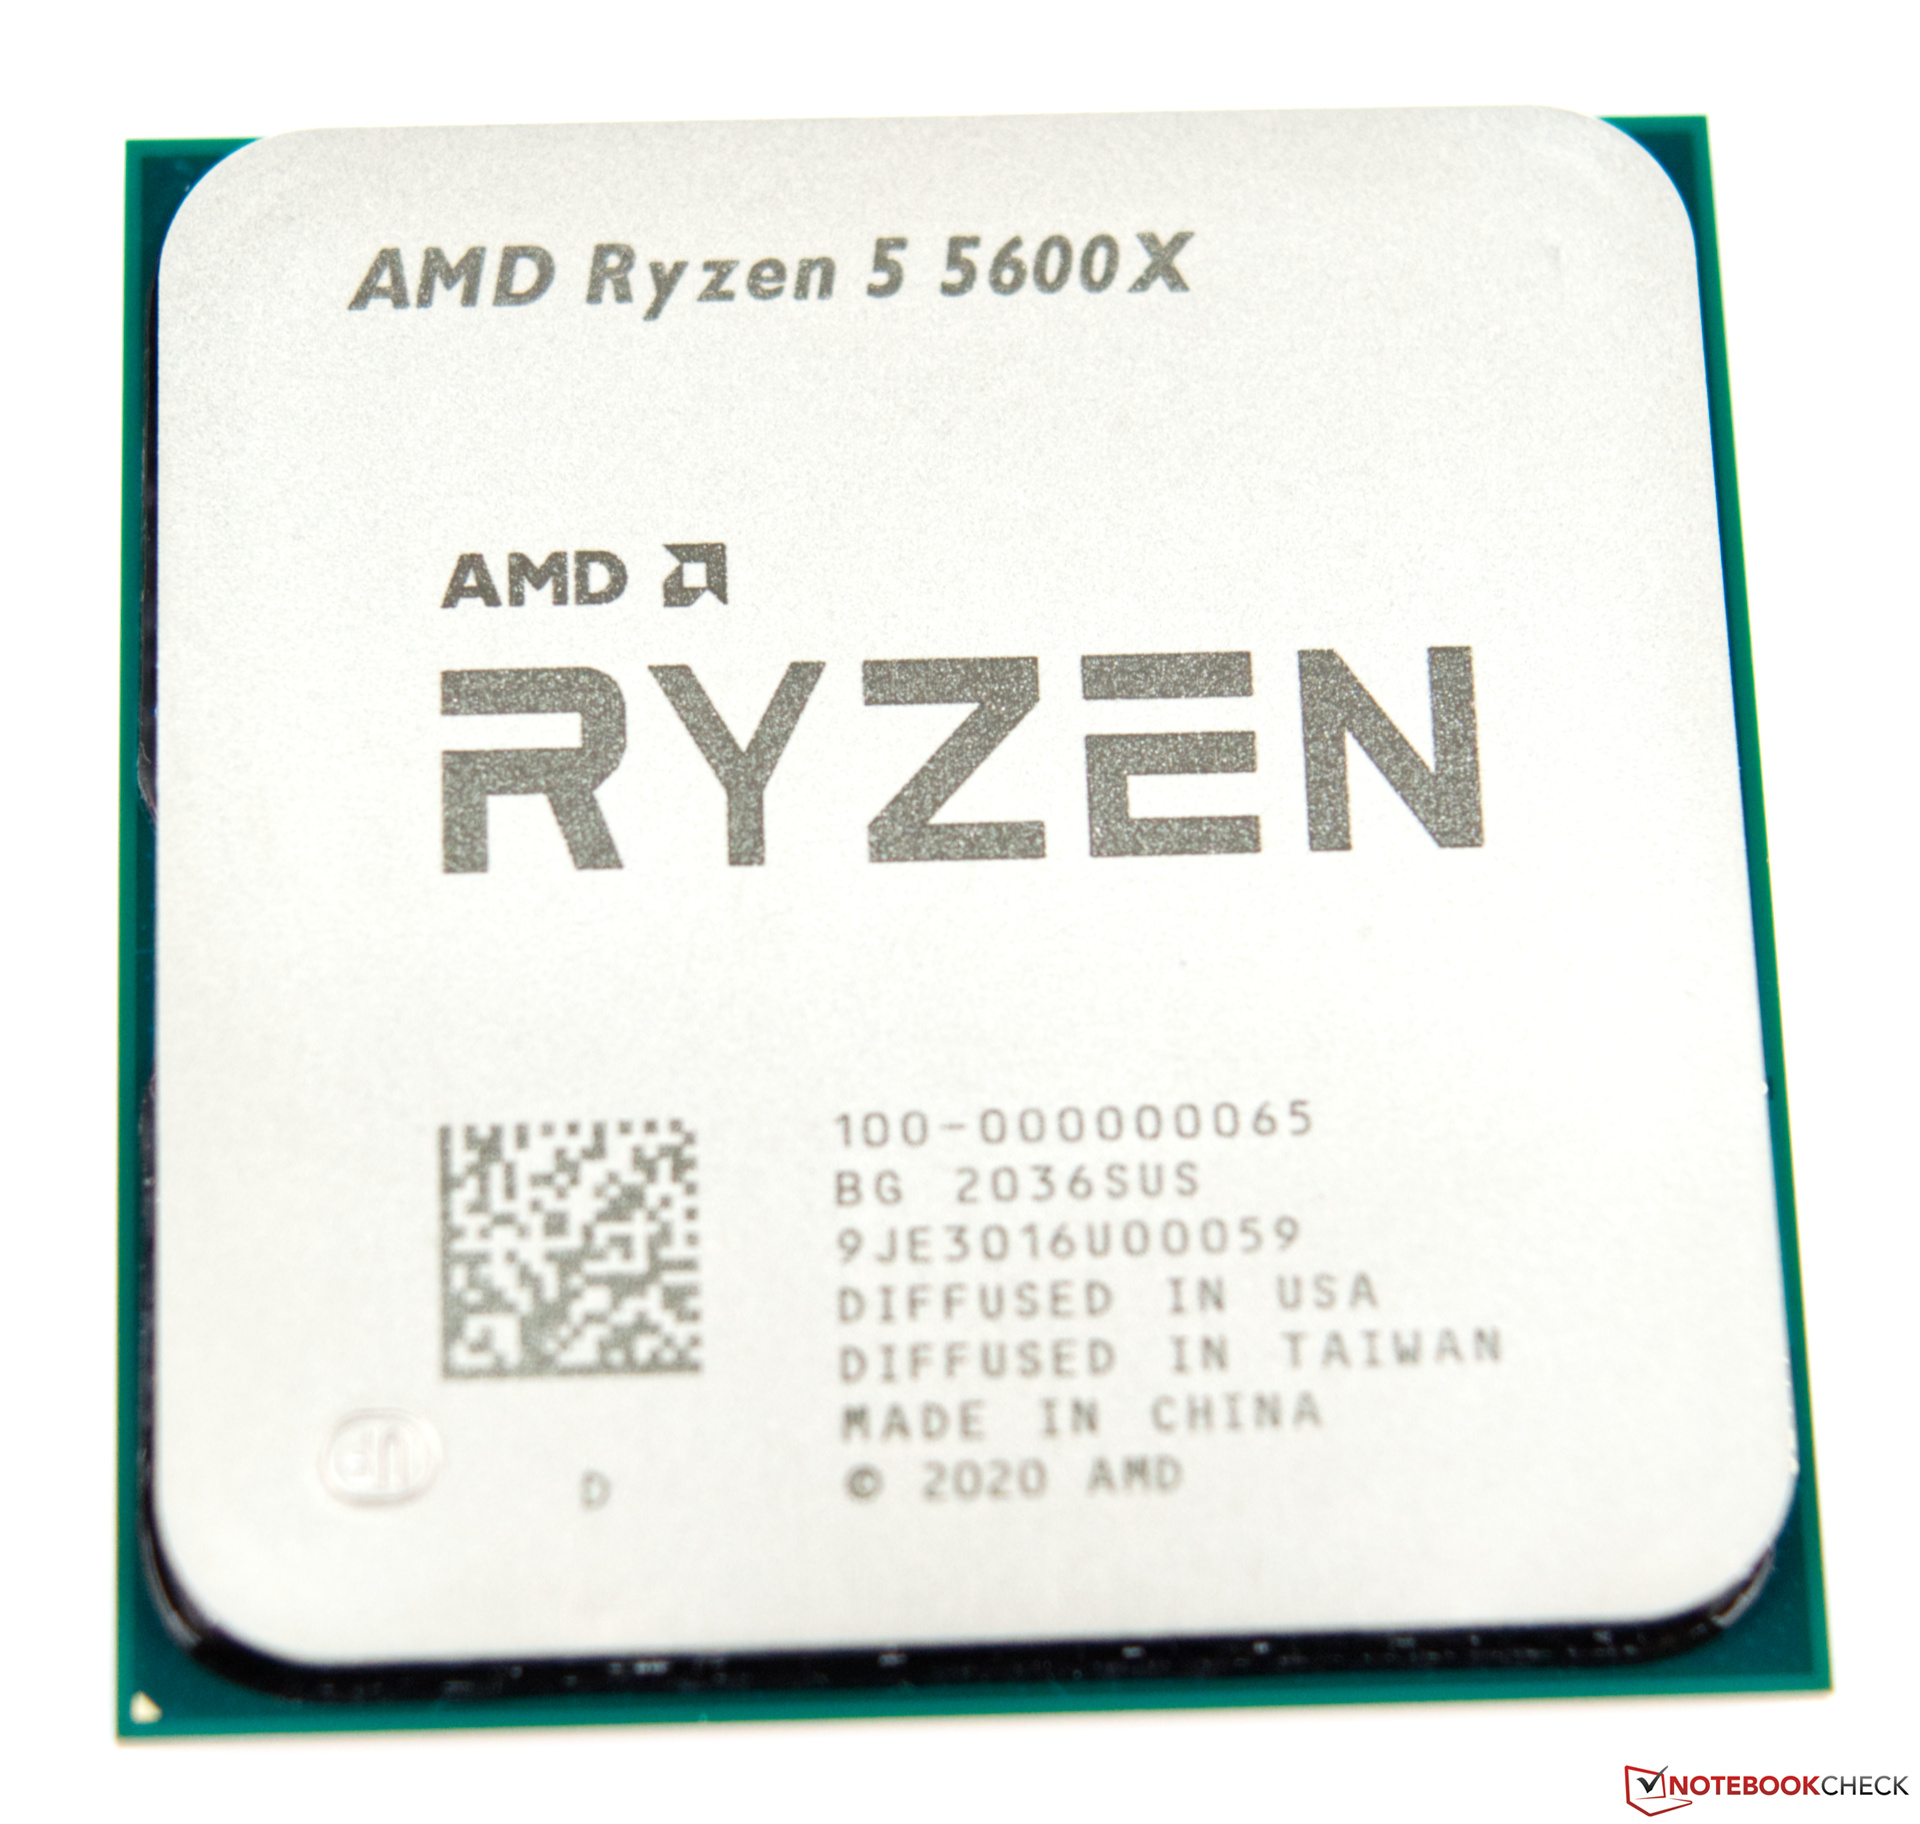
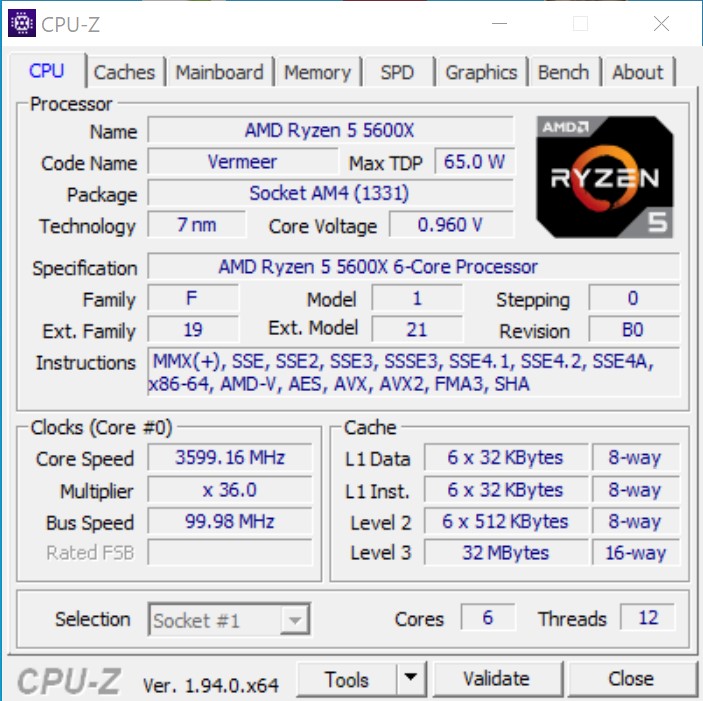
Enfin, l'AMD Ryzen 5 5600X est non seulement le plus petit Ryzen avec 6 noyaux et 12 fils, mais avec un TDP de 65 watts, également le plus efficace, si l'on compare les spécifications purement techniques.
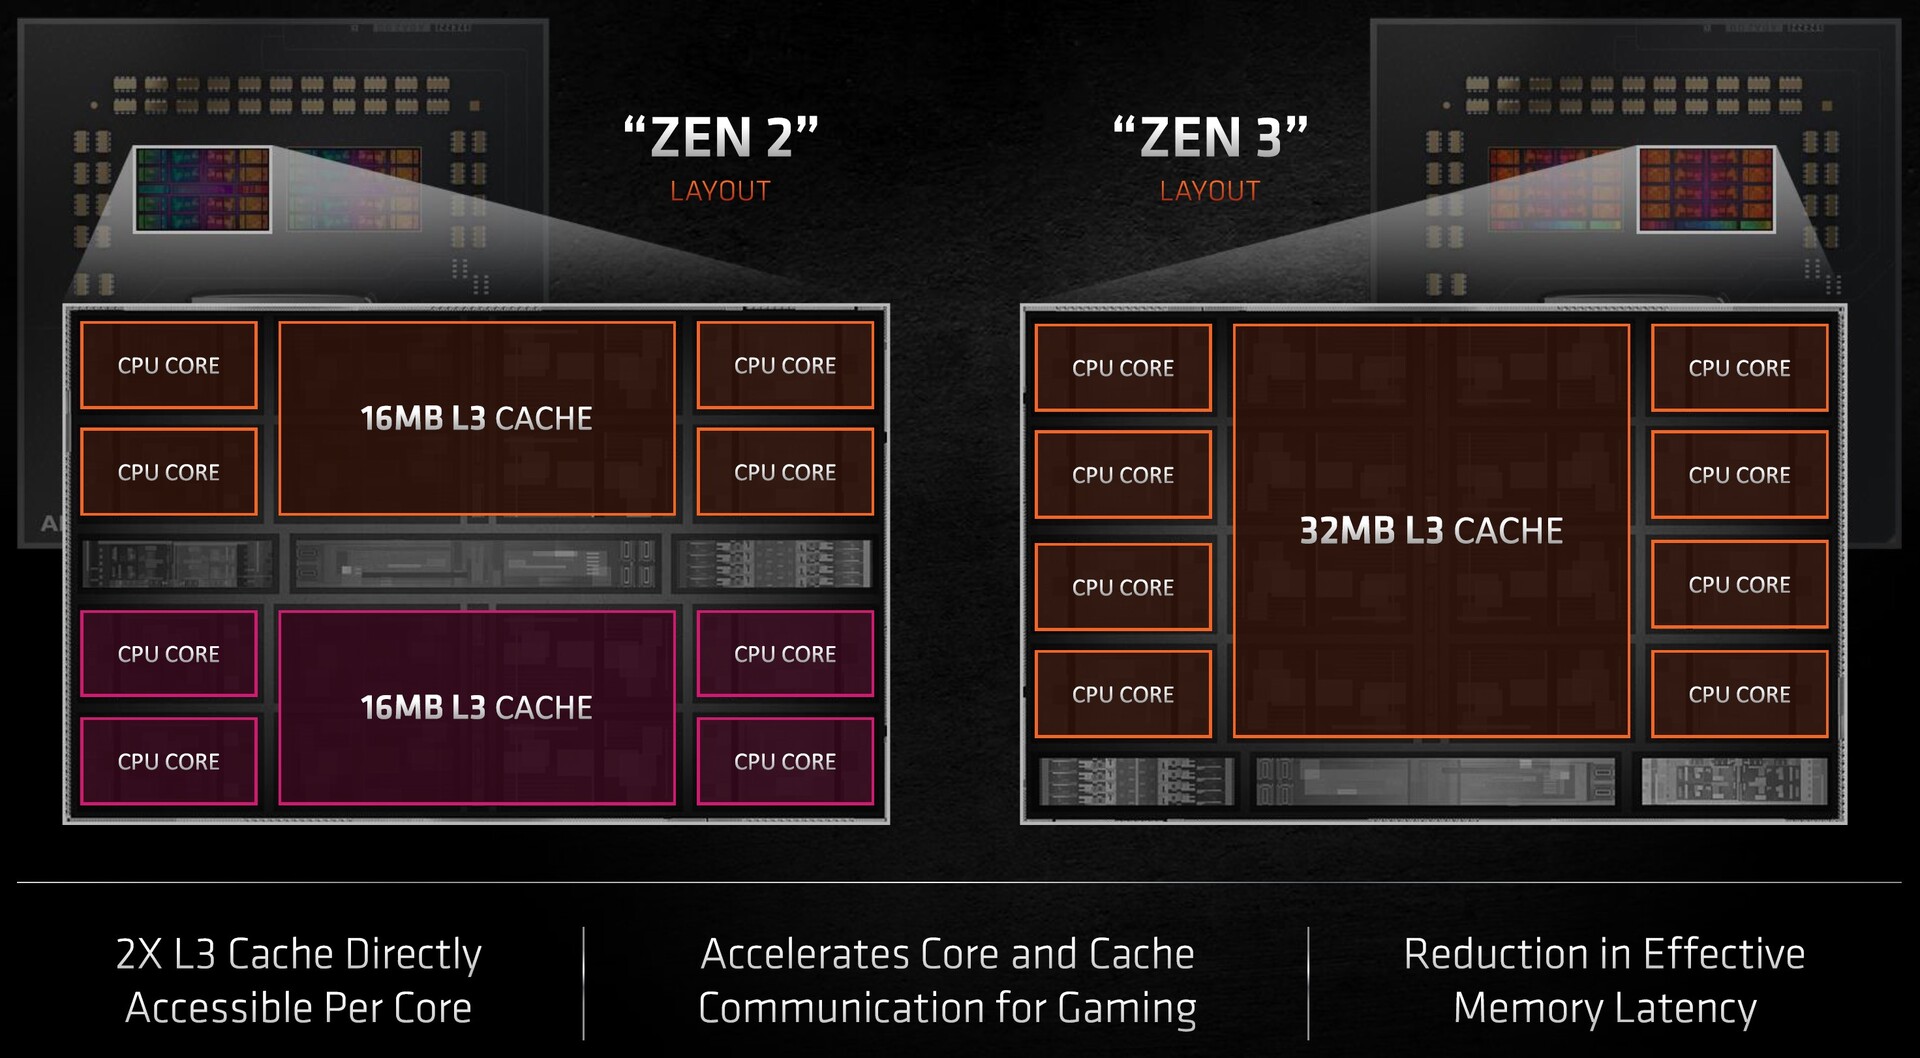
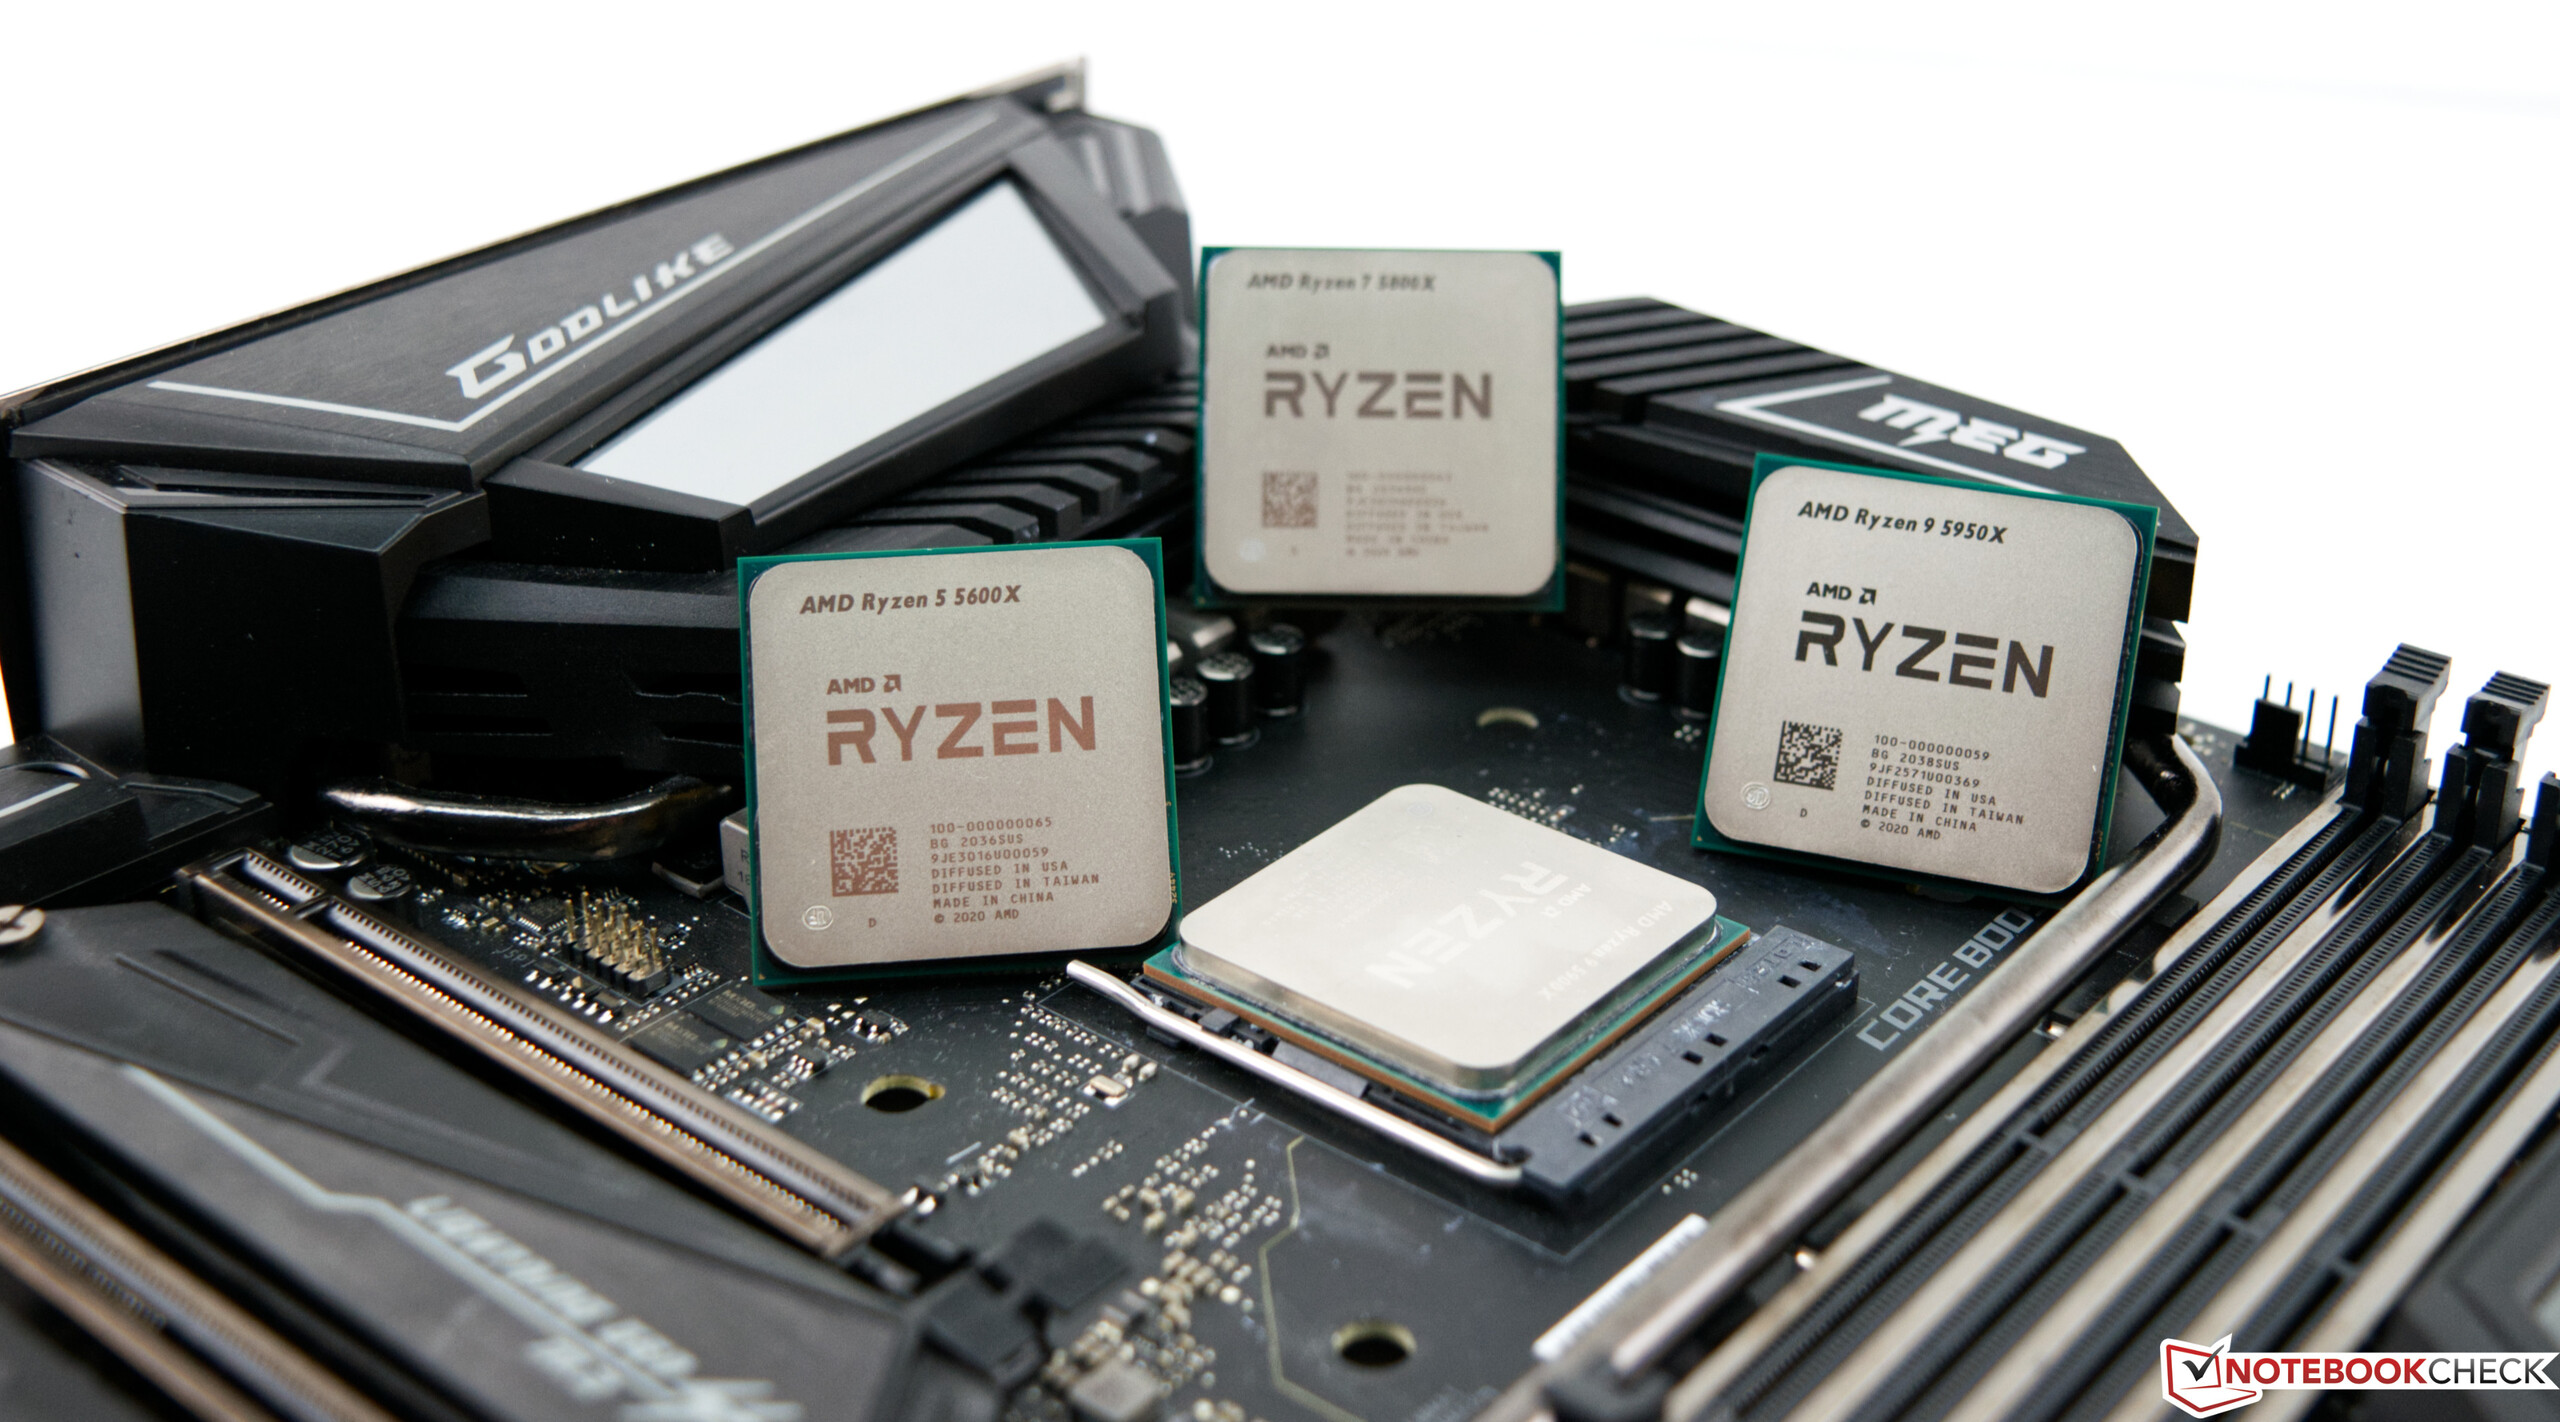
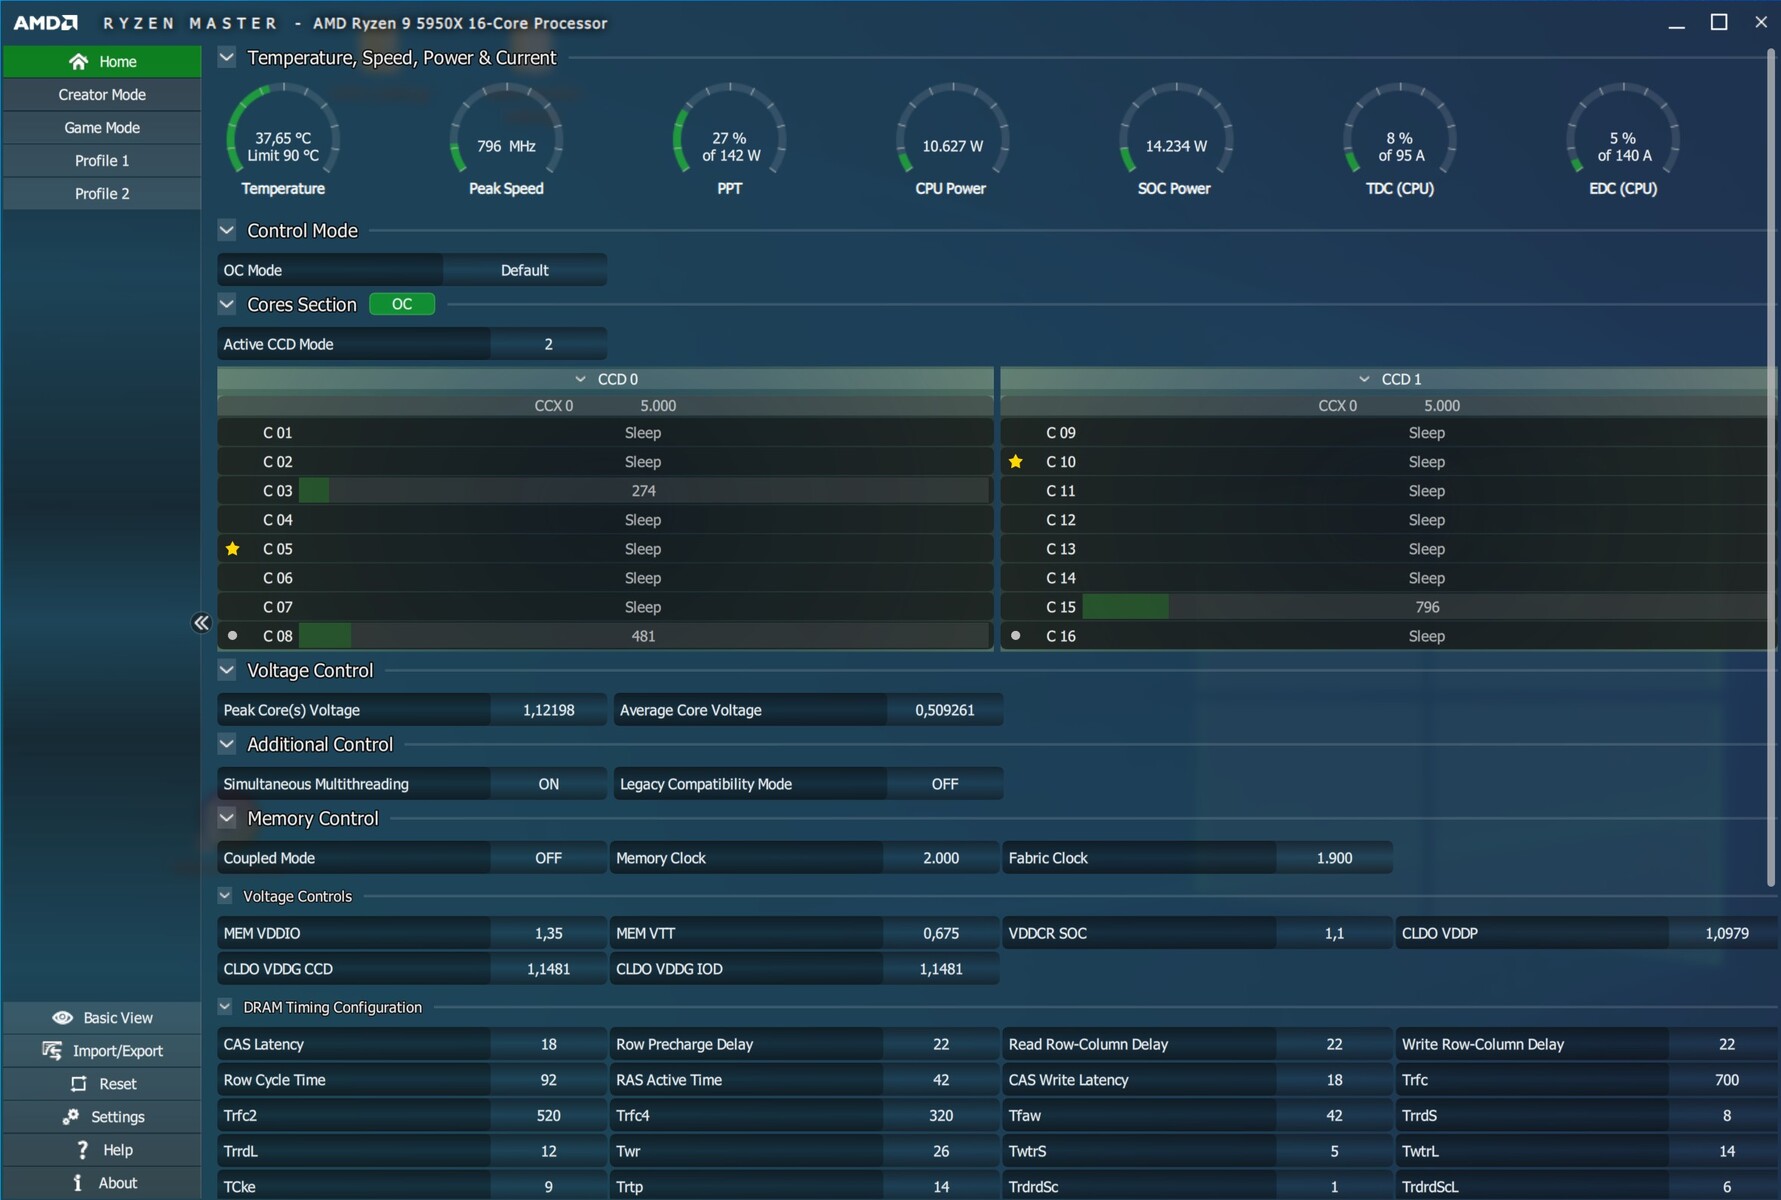
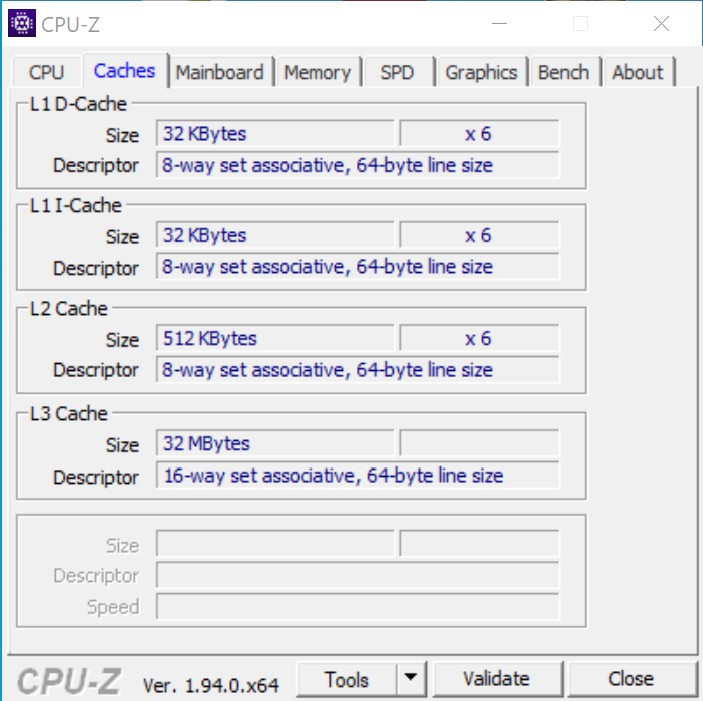
En ce qui concerne sa composition interne, comme le modèle haut de gamme, le Ryzen 9 5950X utilise 2 CCD à 8 coeurs chacun. Dans le Ryzen 5 5600X, seuls 6 noyaux d'un CCD sont actifs. Par rapport à Intel (PL2 250 watts), le modèle haut de gamme est également beaucoup plus efficace avec 142 watts lorsqu' il utilise le PL2. Nous avons déjà évalué d'autres innovations de l'architecture Zen-3 lors de ce test.
Vue d'ensemble des processeurs AMD Ryzen
| Modèle | Cores/Threads | Vitesse de l'horloge | Turbo Speed | L3 Cache | TDP | Prix de lancement |
|---|---|---|---|---|---|---|
| Ryzen 9 5950X | 16/32 | 3,4 GHz | 4,9 GHz | 64MB | 105Watt | 799USD |
| Ryzen 9 3950X | 16/32 | 3,5 GHz | 4,7 GHz | 64 MB | 105 Watt | 749 USD |
| Ryzen 9 5900X | 12/24 | 3,7 GHz | 4,8 GHz | 64MB | 105Watt | 549USD |
| Ryzen 9 3900XT | 12/24 | 3,8 GHz | 4,7 GHz | 64 MB | 105 Watt | 499 USD |
| Ryzen 9 3900X | 12/24 | 3,8 GHz | 4,6 GHz | 64 MB | 105 Watt | 499 USD |
| Ryzen 7 5800X | 8/16 | 3,8 GHz | 4,7 GHz | 32 MB | 105Watt | 449USD |
| Ryzen 7 3800XT | 8/16 | 3,9 GHz | 4,7 GHz | 32 MB | 105 Watt | 399 USD |
| Ryzen 7 3800X | 8/16 | 3,9 GHz | 4,5 GHz | 32 MB | 105 Watt | 399 USD |
| Ryzen 7 3700X | 8/16 | 3,6 GHz | 4,4 GHz | 32 MB | 65 Watt | 329 USD |
| Ryzen 5 5600X | 6/12 | 3,7 GHz | 4,6 GHz | 32MB | 65Watt | 299USD |
| Ryzen 5 3600XT | 6/12 | 3,8 GHz | 4.5 GHz | 32 MB | 95 Watt | 249 USD |
| Ryzen 5 3600X | 6/12 | 3,8 GHz | 4,4 GHz | 32 MB | 95 Watt | 229 USD |
| Ryzen 5 3600 | 6/12 | 3,6 GHz | 4,2 GHz | 32 MB | 65 Watt | 199 USD |
Détails de notre système de test
Nous utilisons le système suivant pour les critères de référence ci-dessous :
- Tableau de référence Raijintek Pean
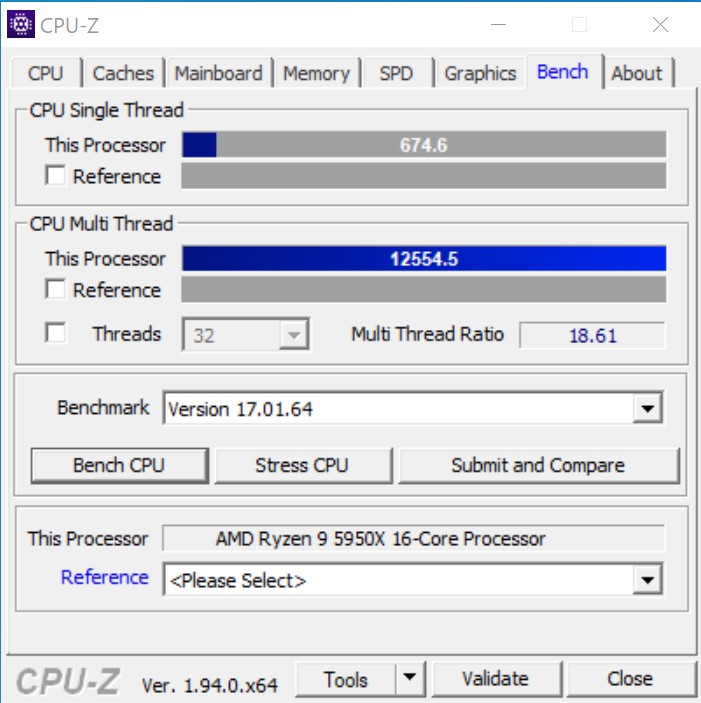
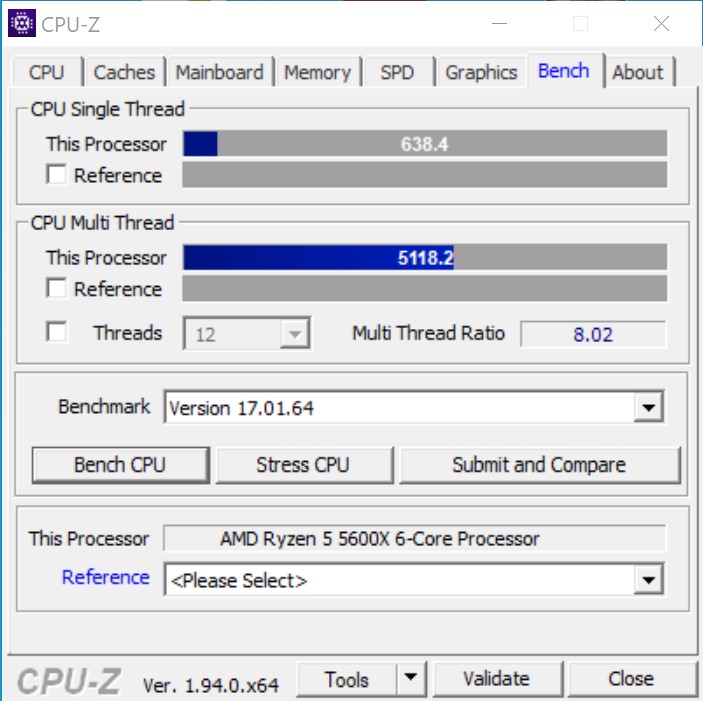
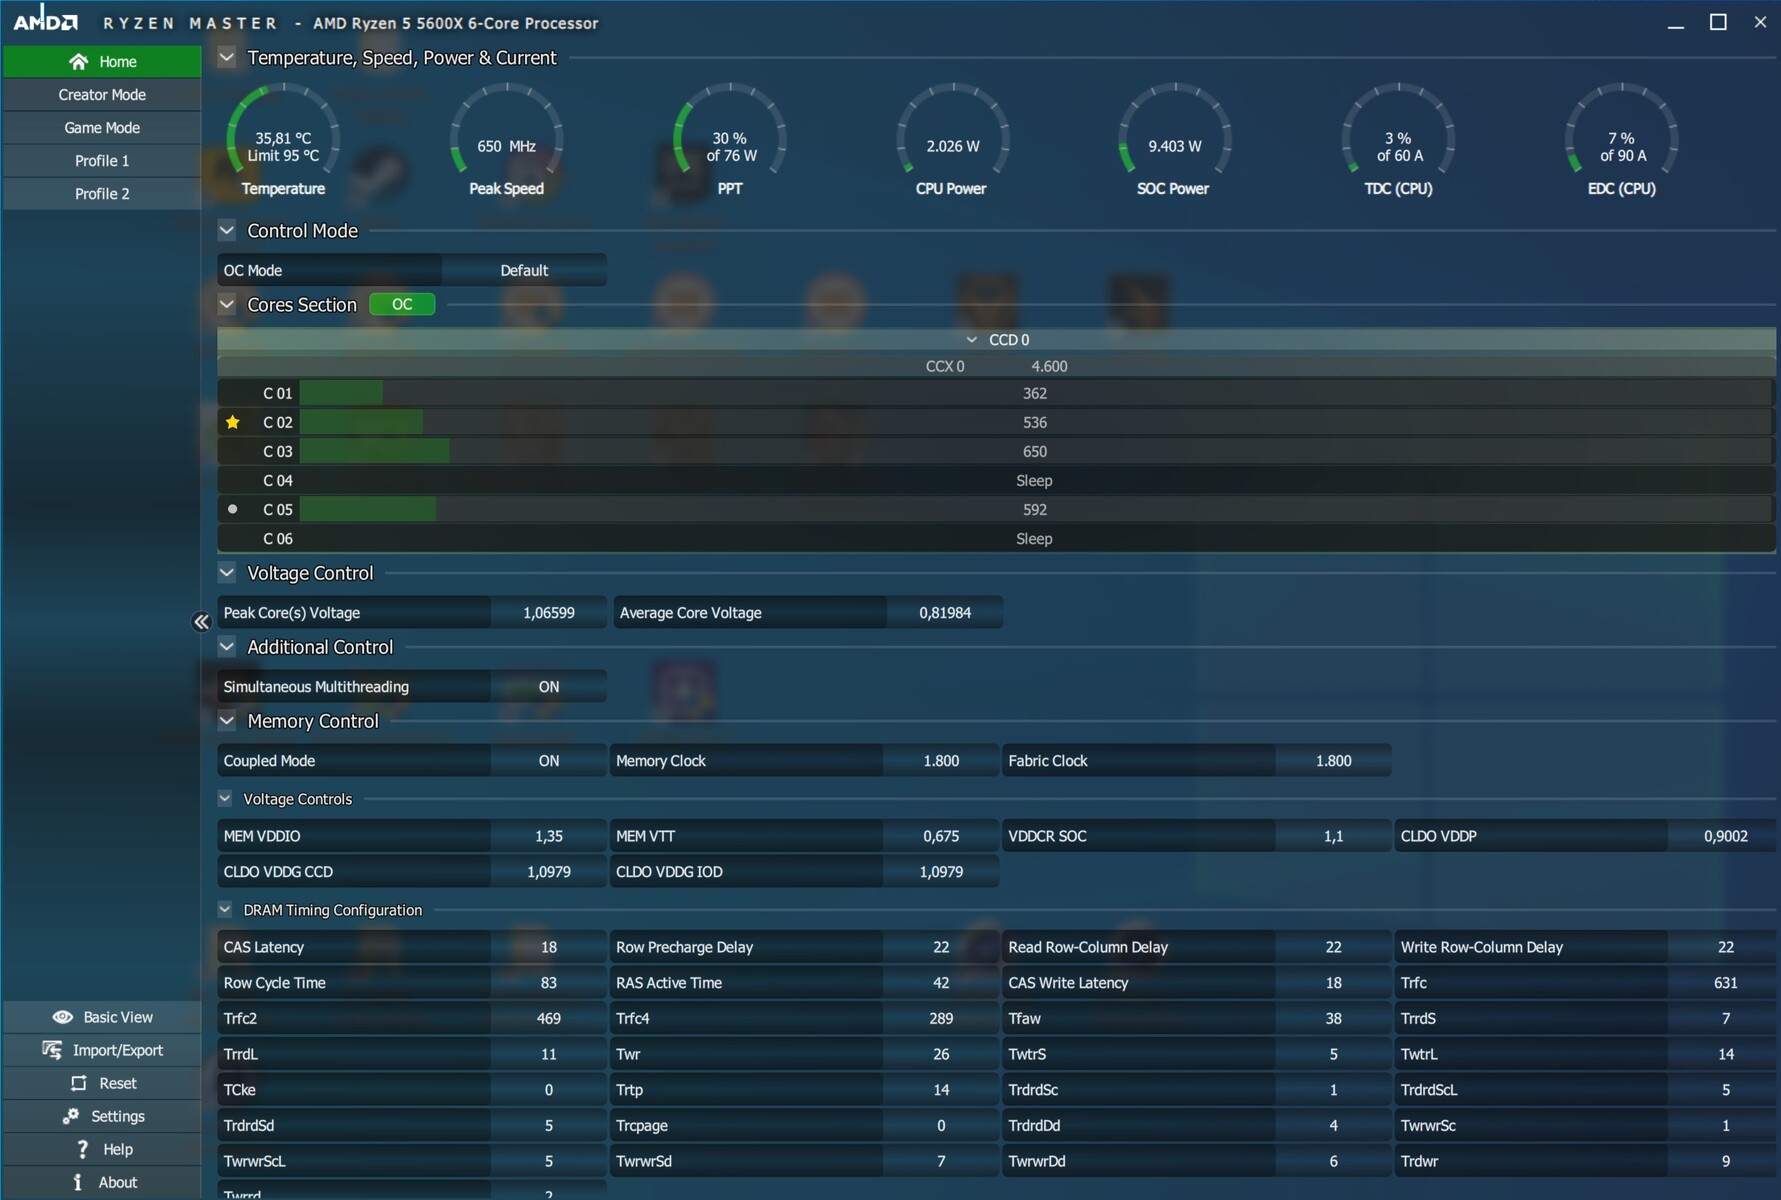
- AMD Ryzen 9 5950X, AMD Ryzen 5 5600X
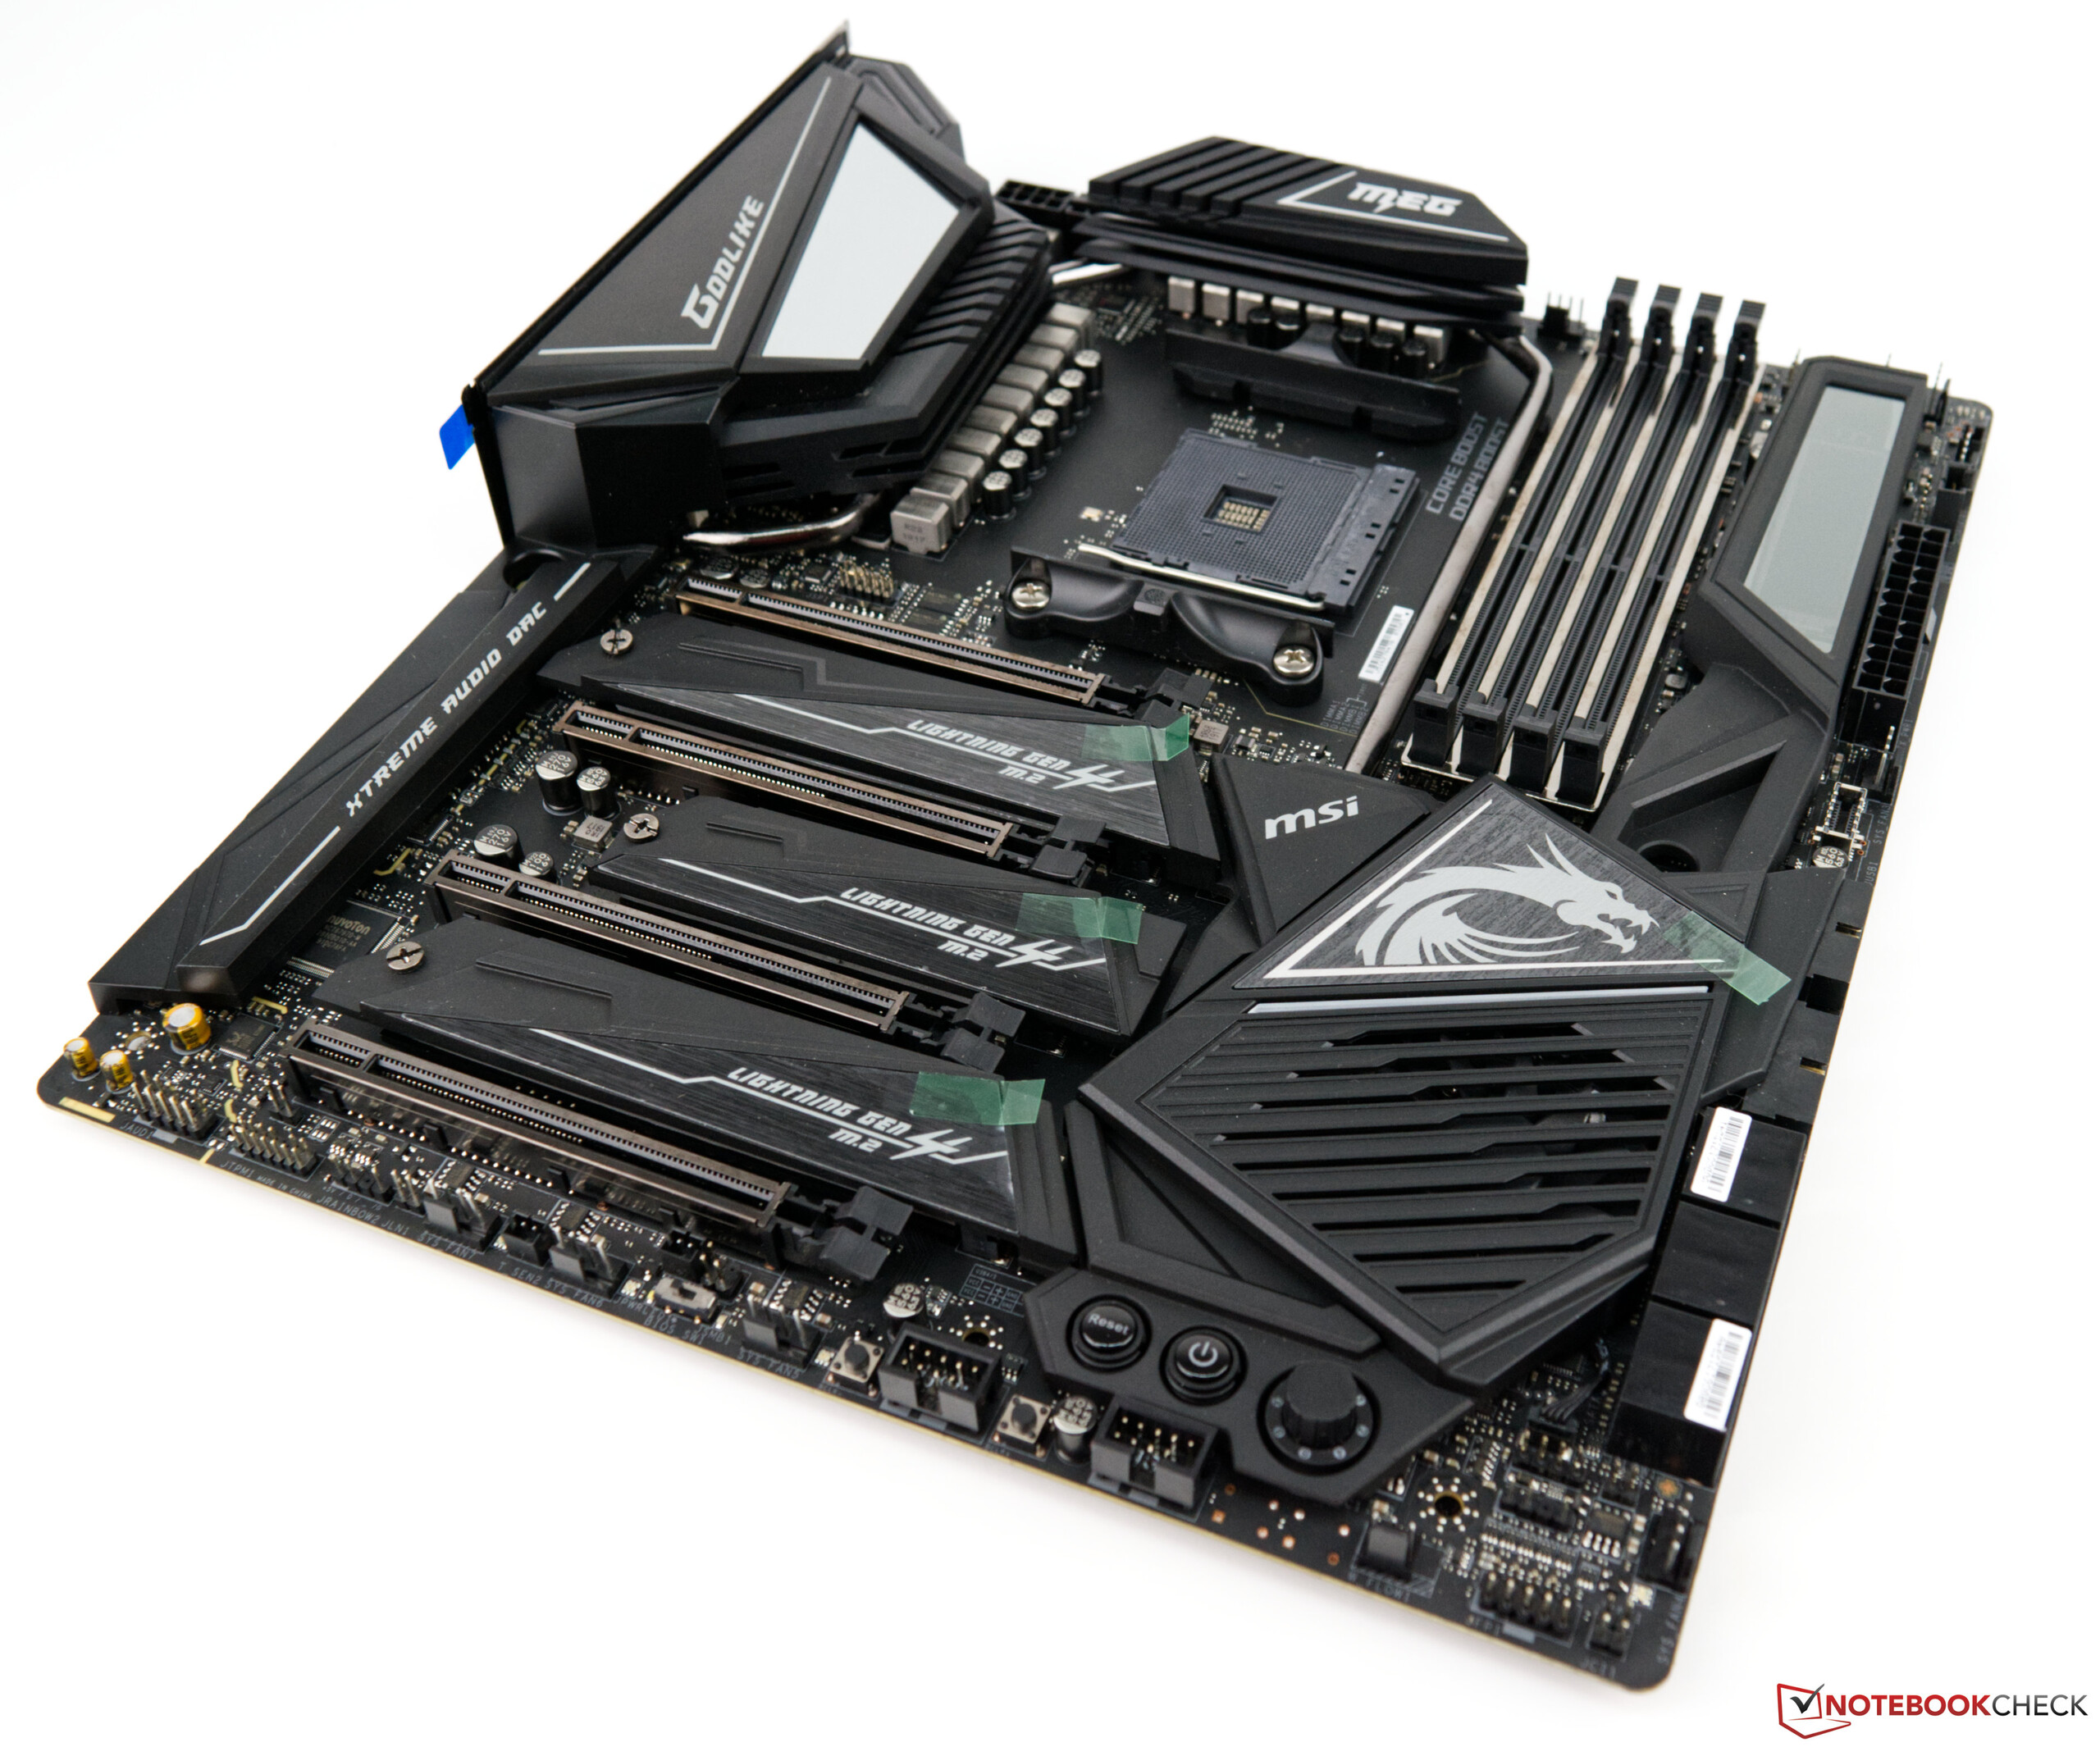
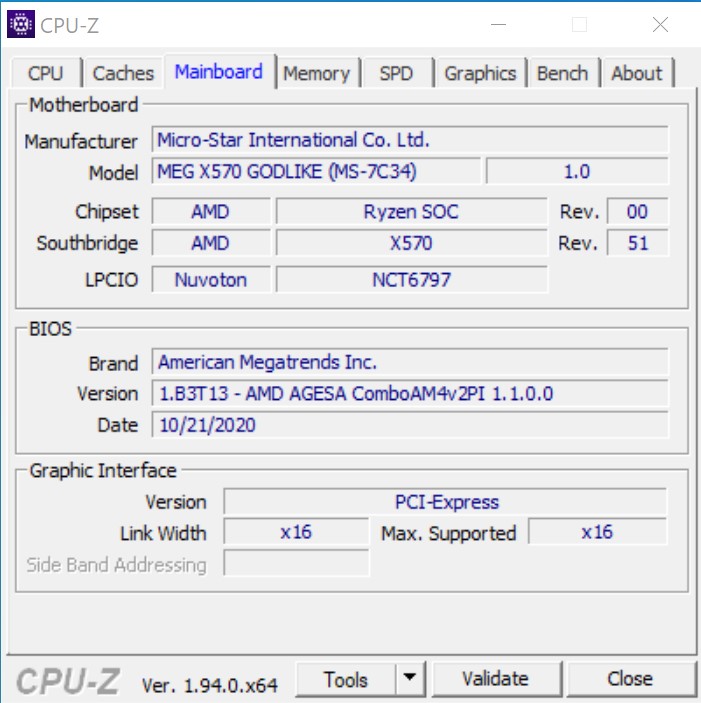
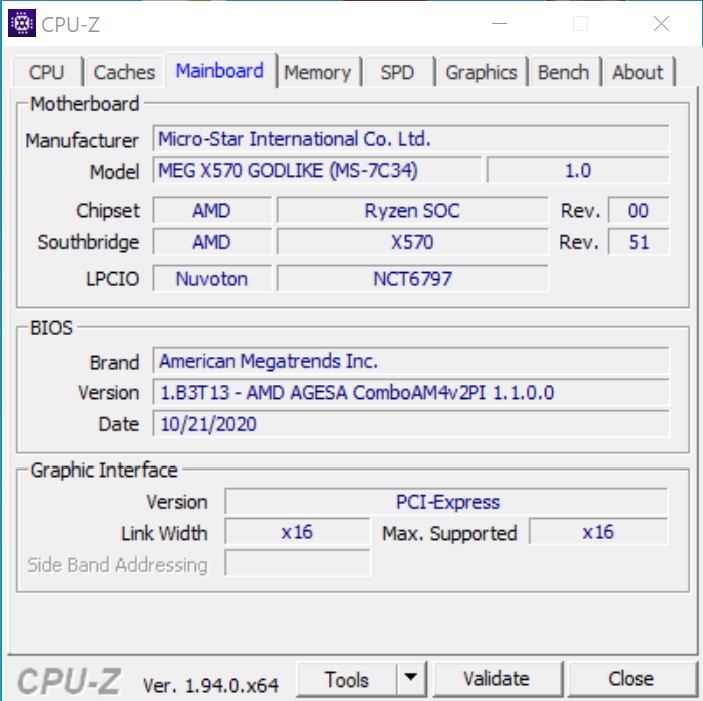
- MSI MEG X570 Godlike
- Alphacool Eisbear 280 AiO
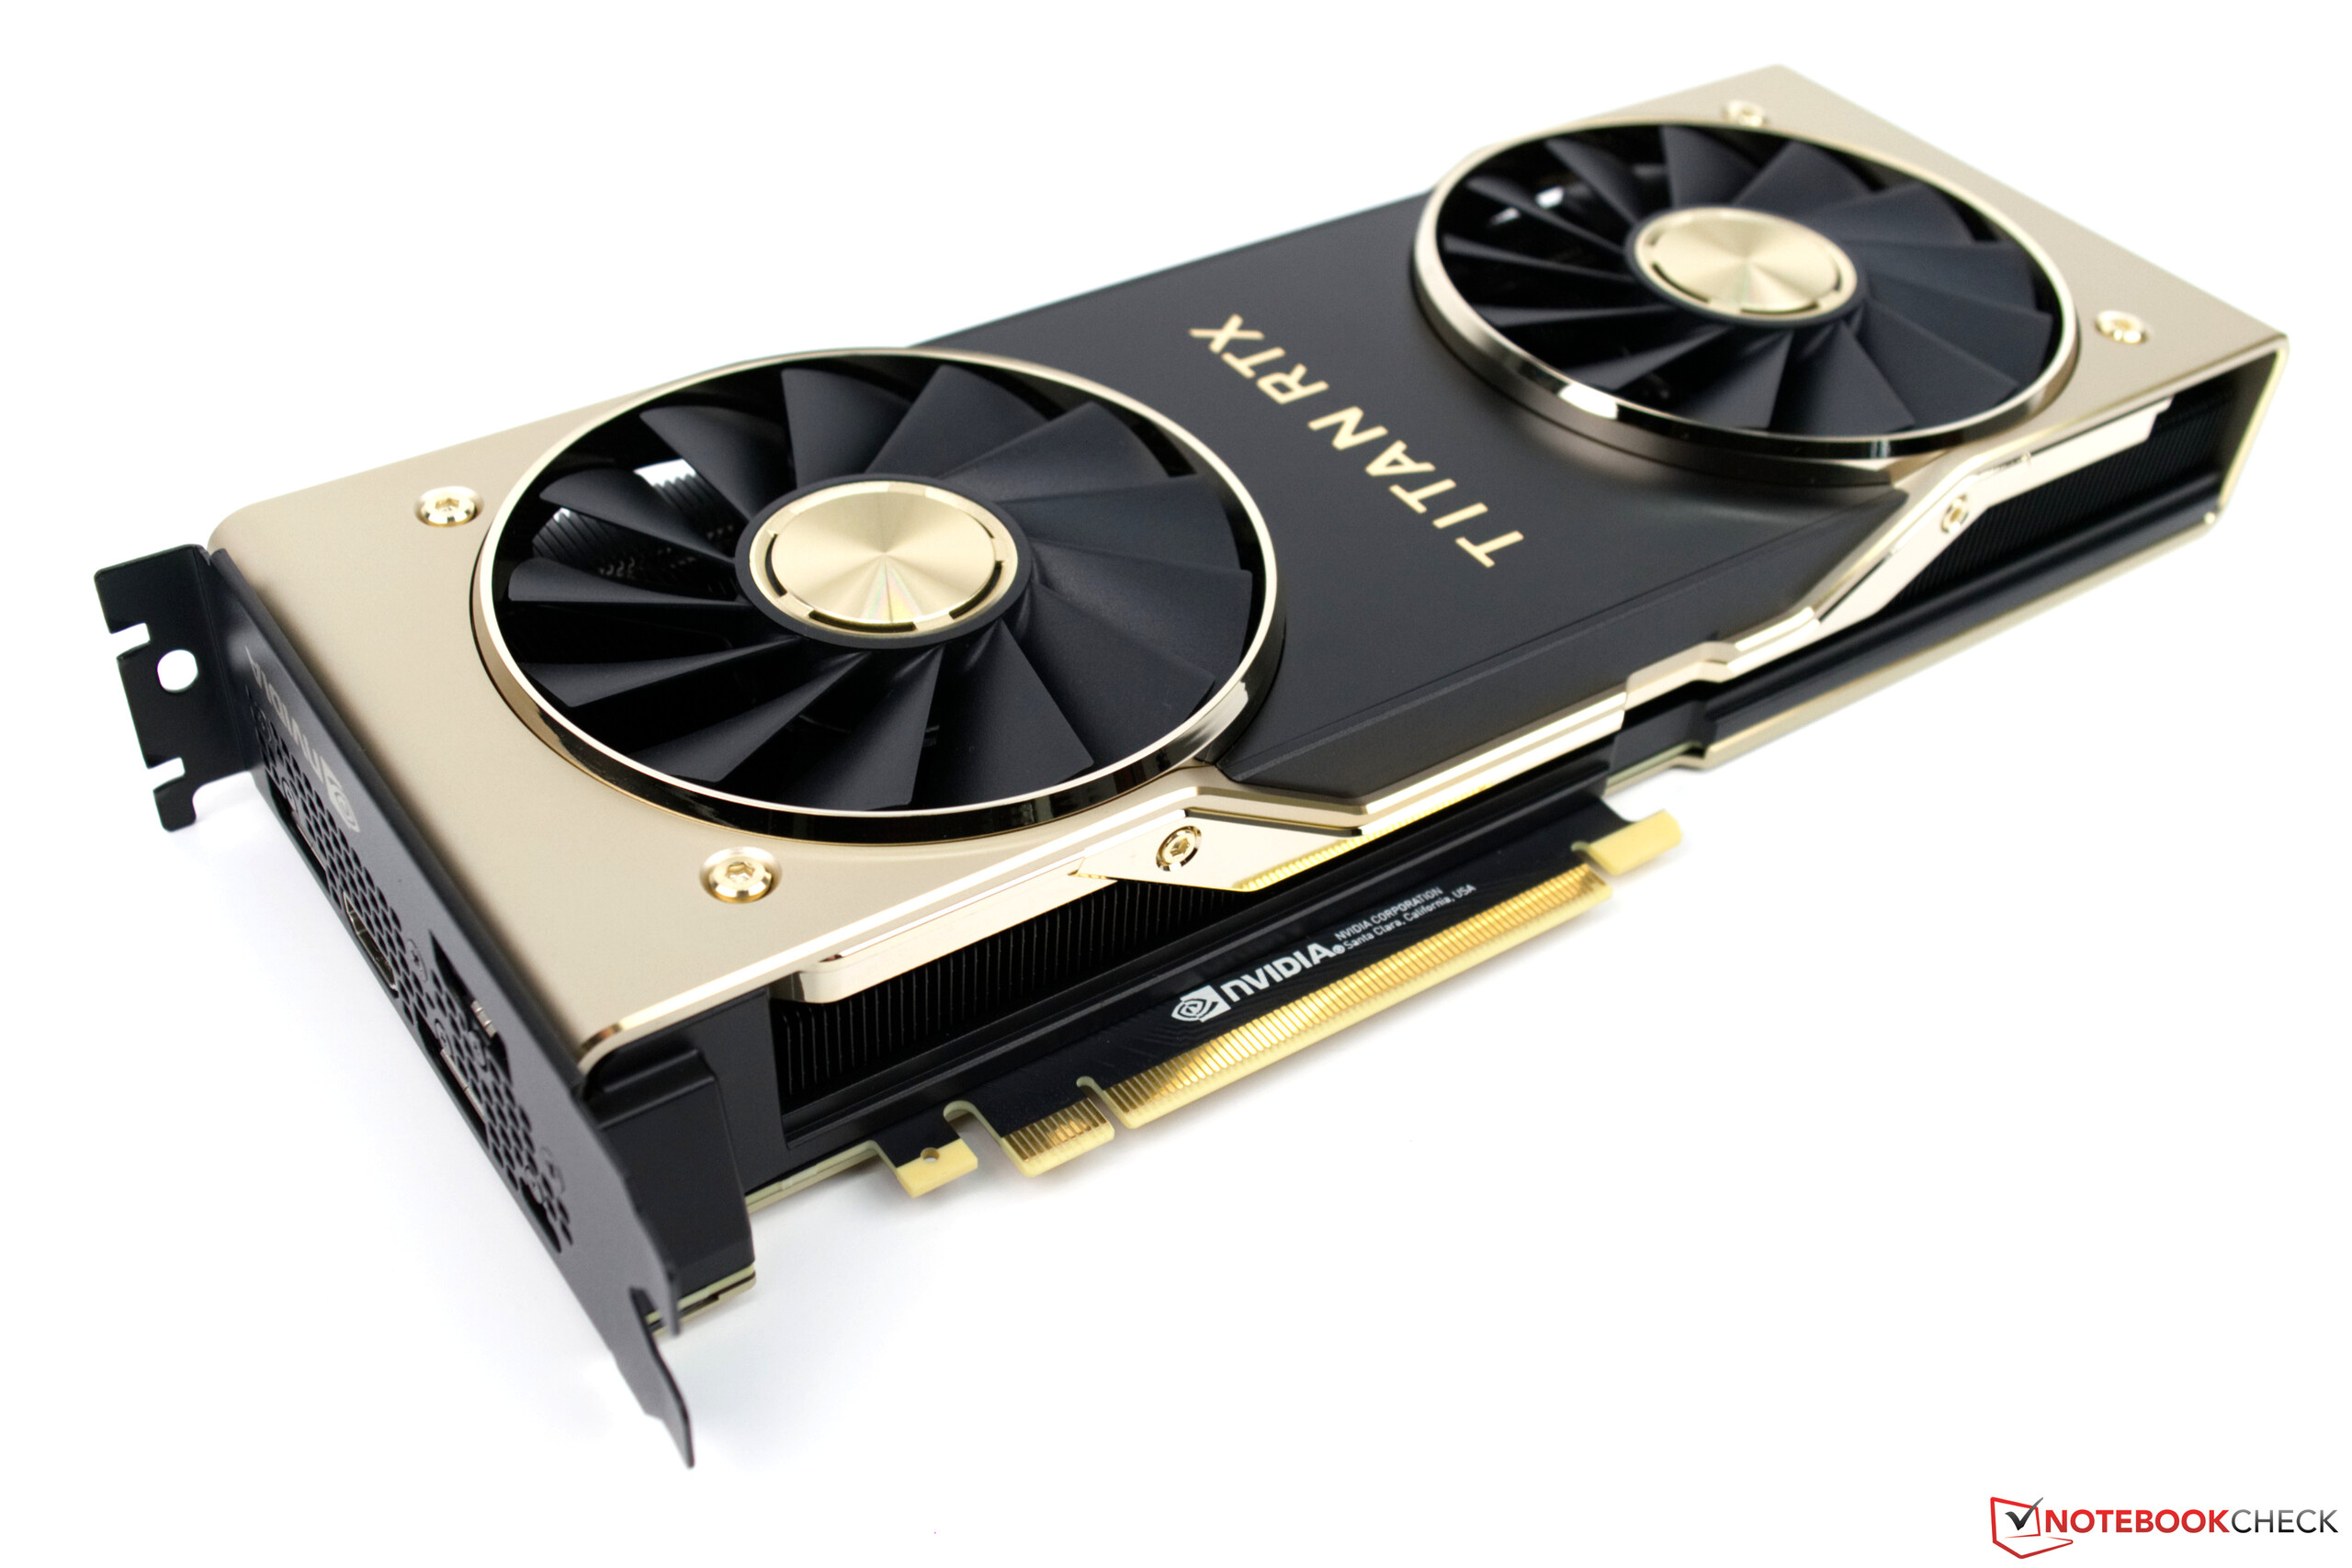
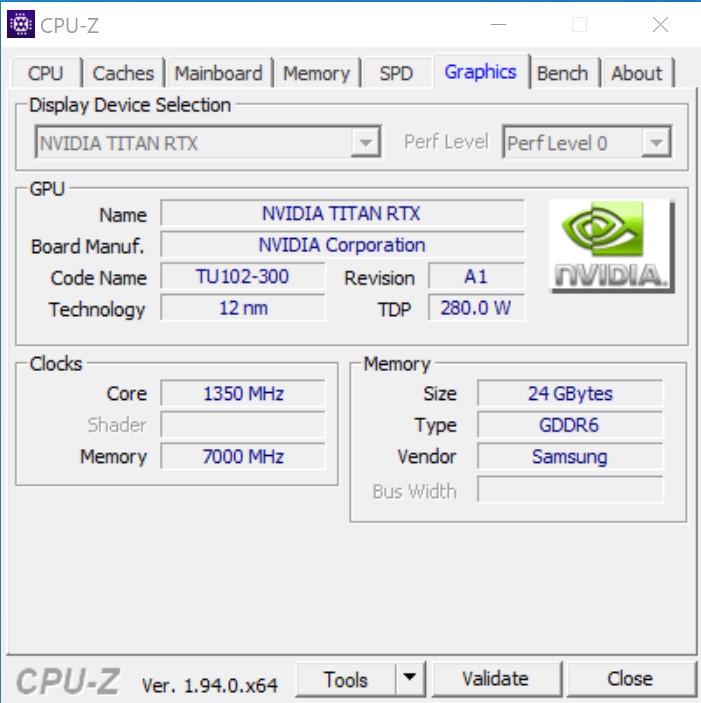
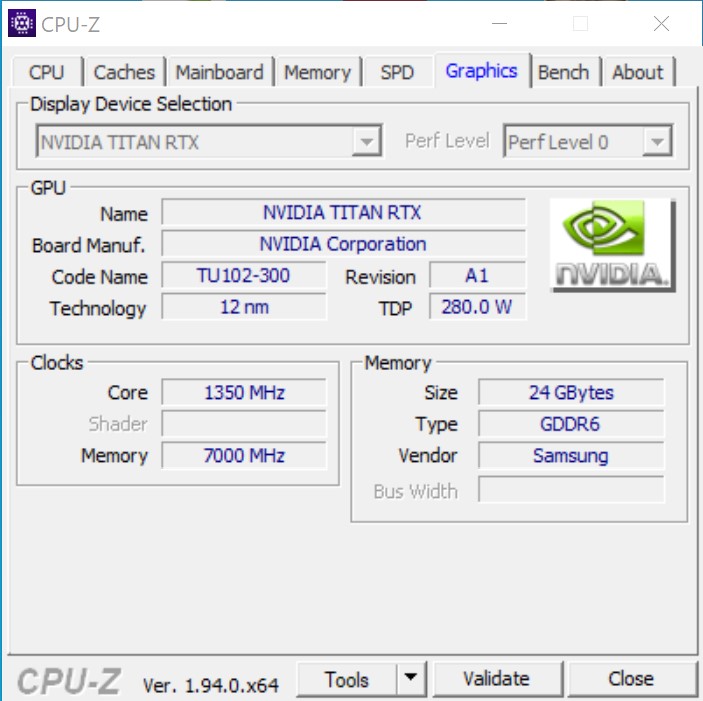
- Nvidia Titan RTX
- Alimentation électrique du Corsair HX 1200i
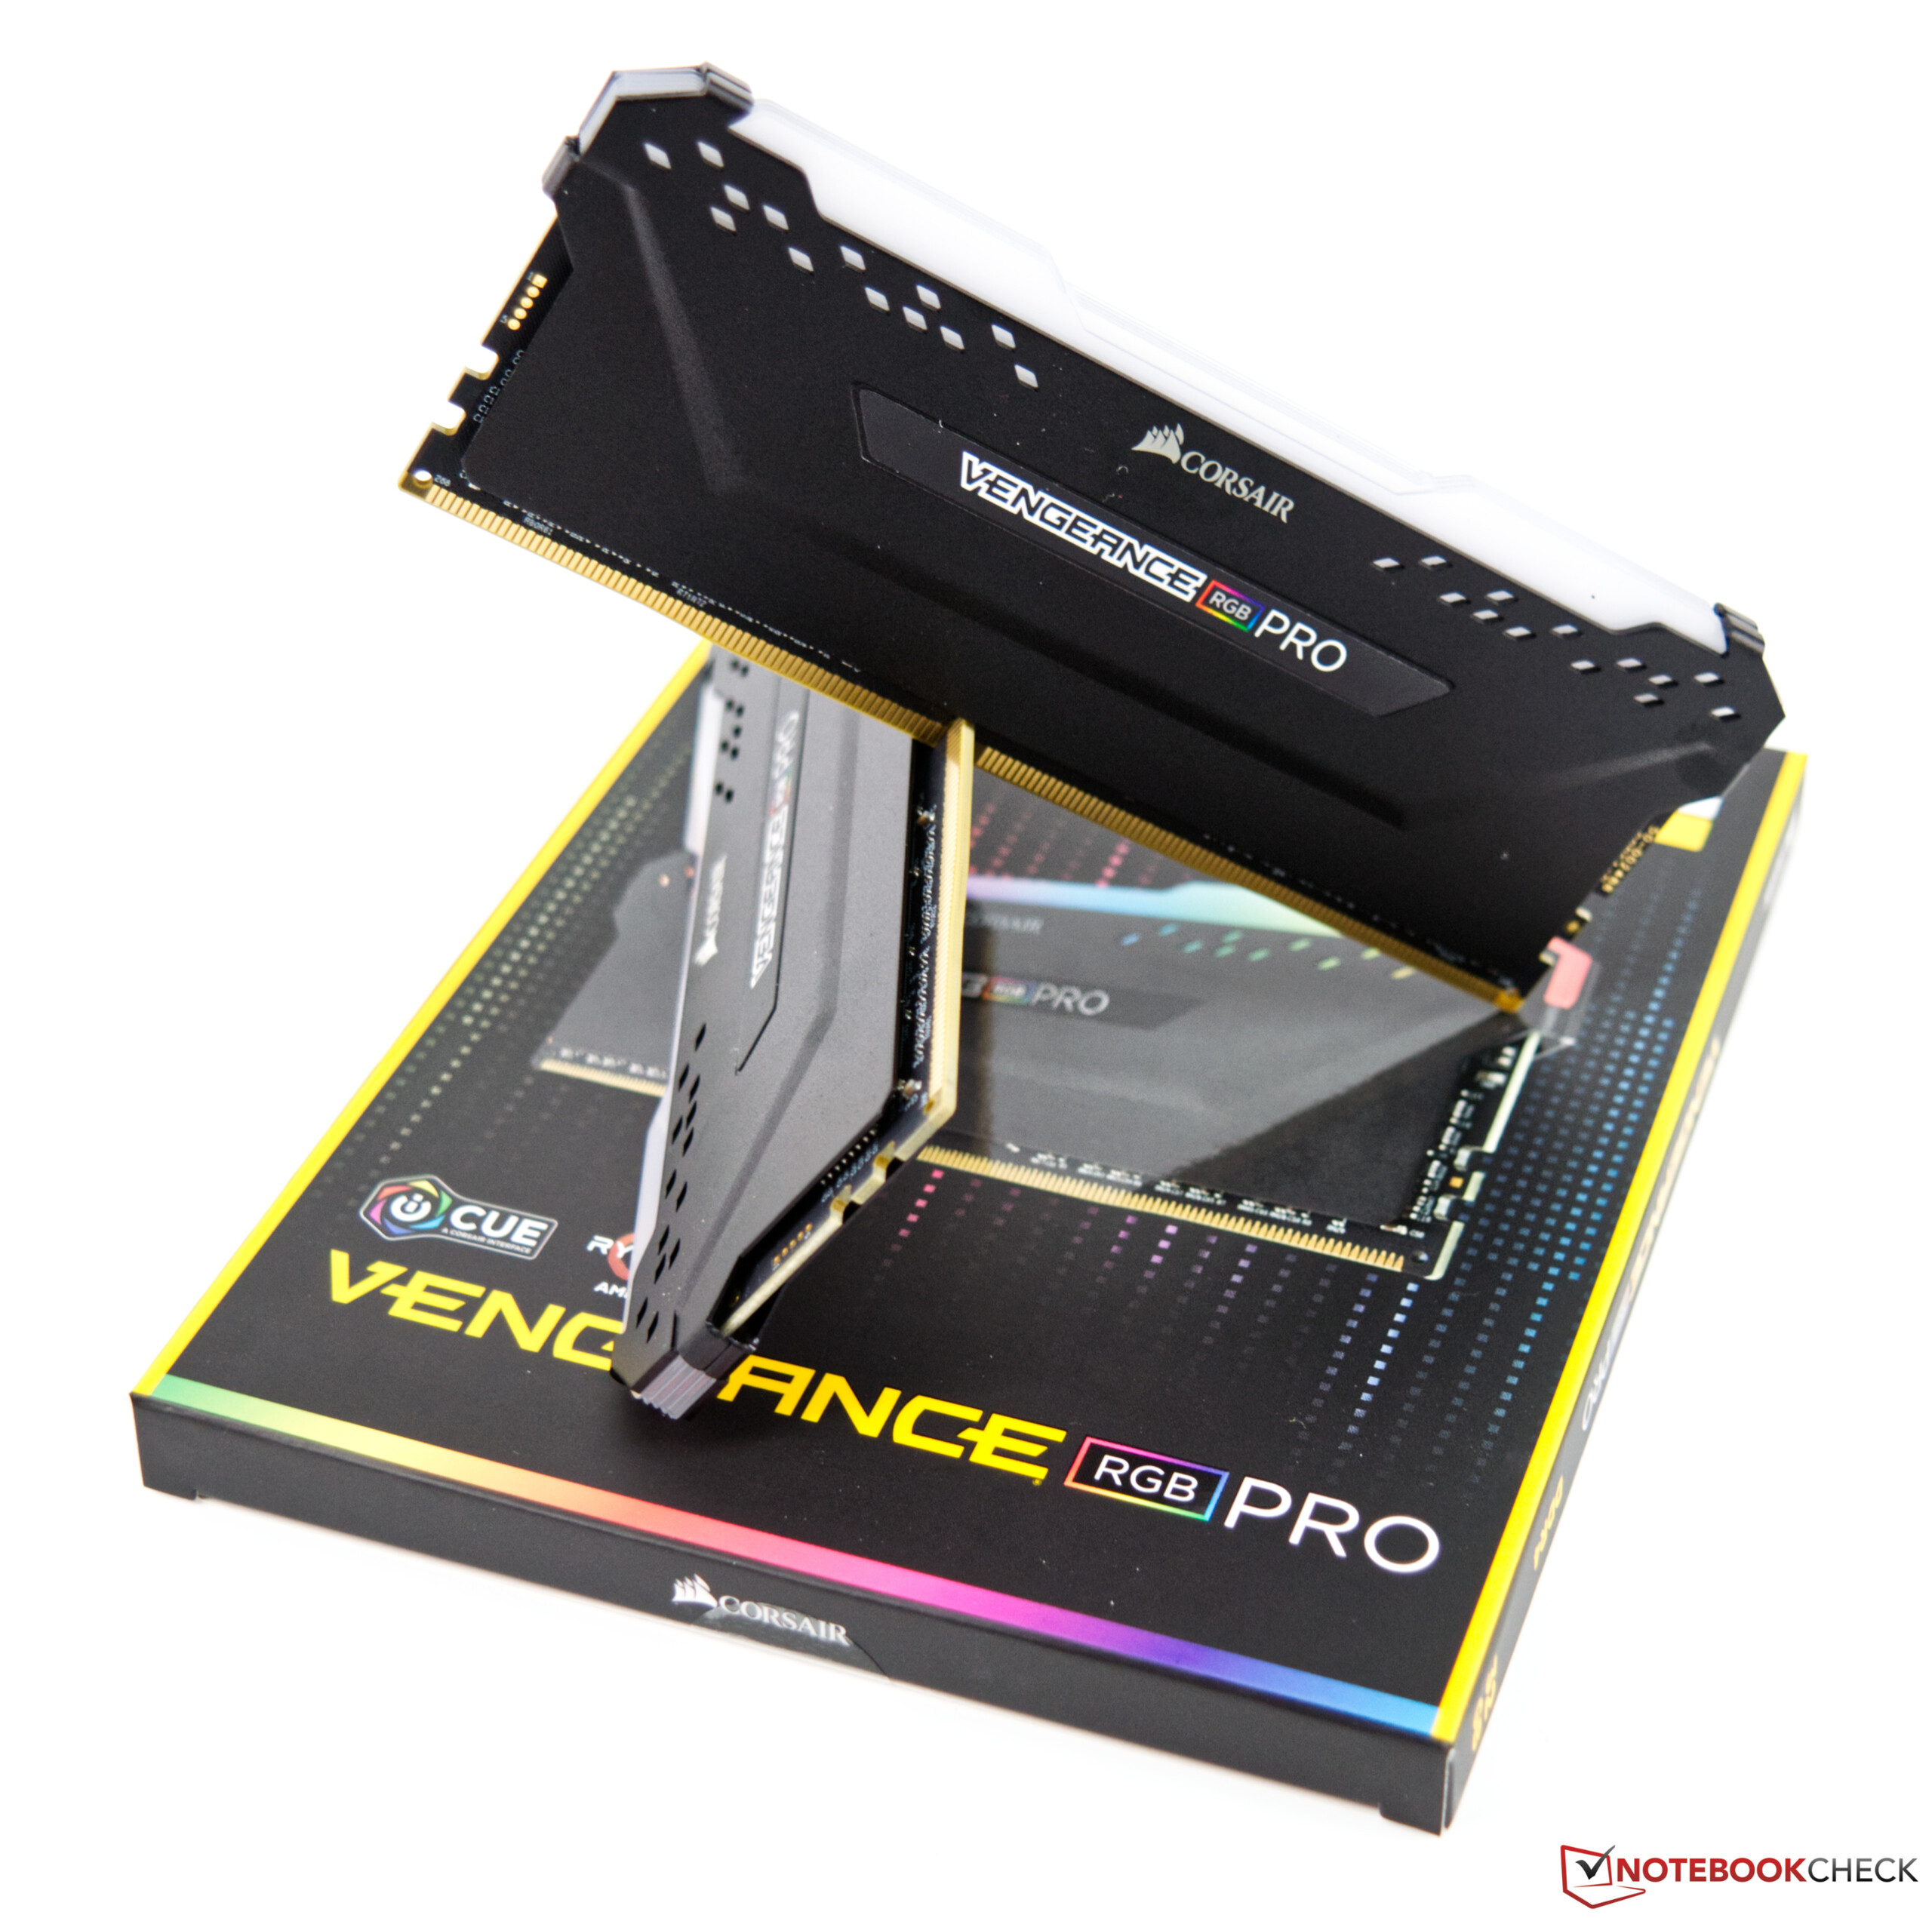
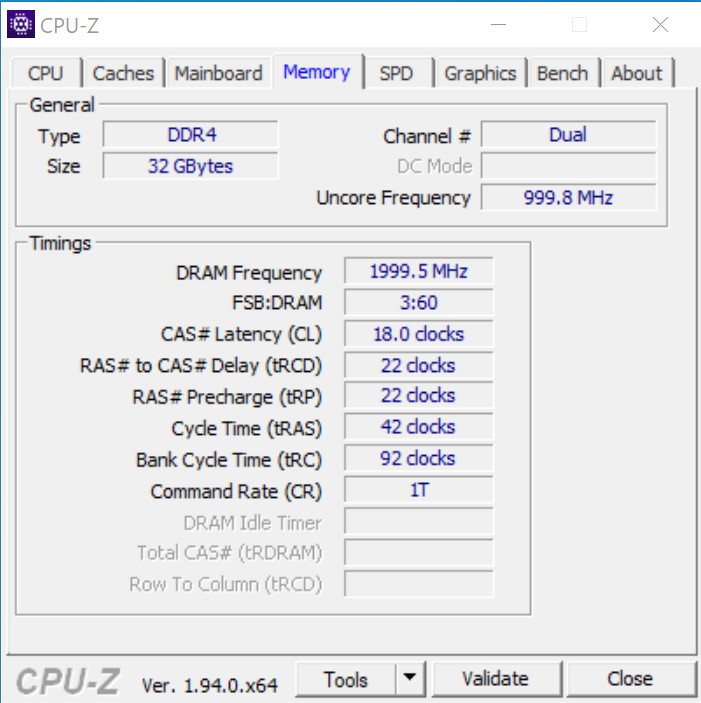
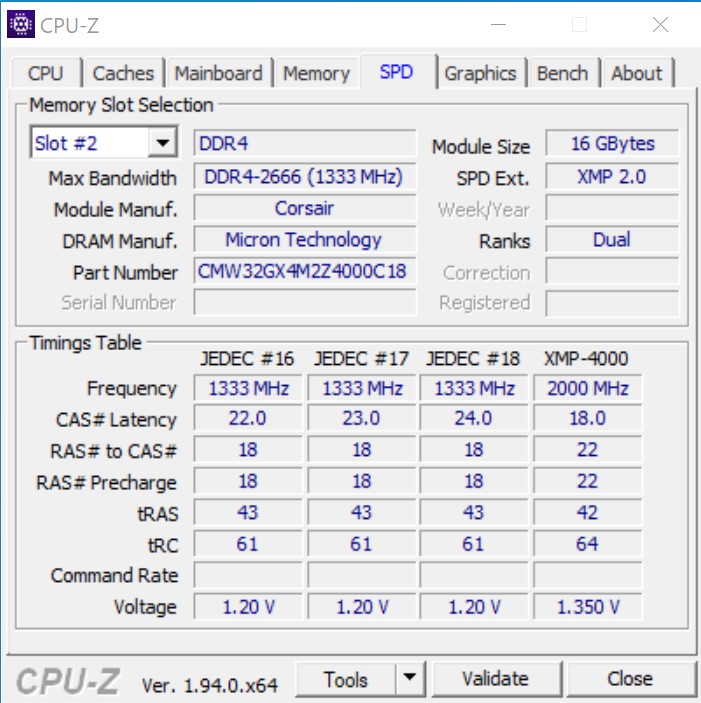
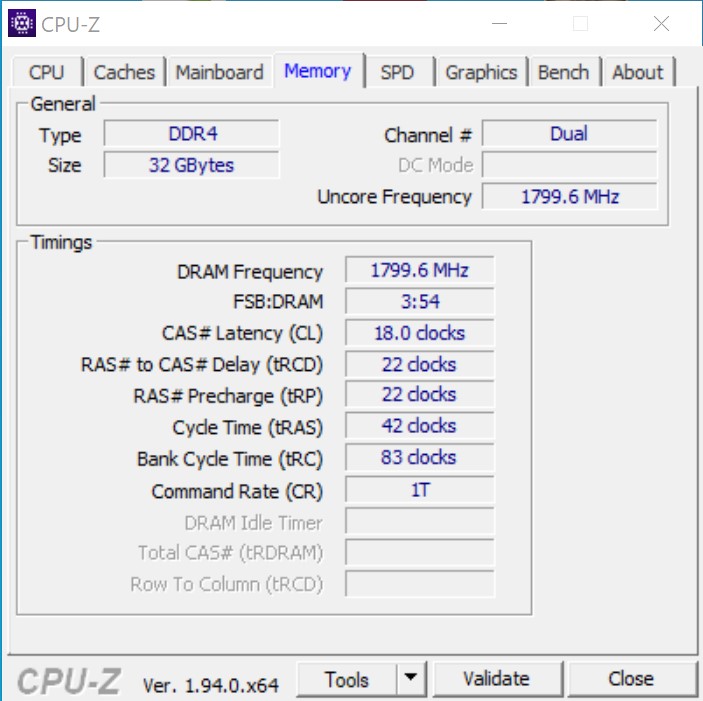
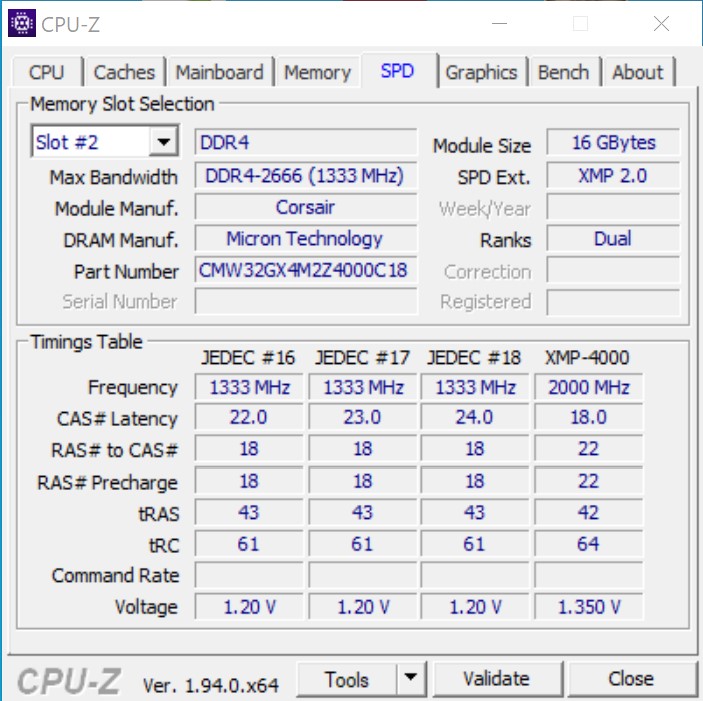
- Kit de stockage DDR4-4000 Corsair Vengeance RGB Pro 2 x 16 GB
- Intel Optane 905P 480GB PCIe SSD
- Microsoft Windows 10 Professional 64-Bit (Version 2004)
A ce stade, nous voudrions remercier Caseking de nous avoir prêté le Raijintek Pean, qui a également été individualisé par des gravures au laser. AMD Direct a fourni la carte mère, qui a été incluse dans le dossier de presse lors de la sortie des processeurs AMD Ryzen 9 3900X et AMD Ryzen 7 3700X Zen 2. Comme refroidissement, nous utilisons l'Alphacool Eisbear 280 qu'Alphacool nous a fourni. Nous tenons également à remercier Corsair pour son soutien à la mémoire de travail


Repères pour les transformateurs
Nous avons déjà pu déterminer que les innovations de l'architecture Zen 3 ont été couronnées de succès. Avec le processeur 16 cœurs, AMD augmente une fois de plus la mise, et pas seulement les performances multi-cœurs. En raison de l'augmentation du Boost, les performances du simple cœur sont également accrues par rapport à l'AMD Ryzen 9 5900X. Le processeur ne s'arrête pas à 4,9 GHz, mais dépasse même souvent la limite de 5 GHz. Comme prévu, l'AMD Ryzen 5 5600X se place derrière ses grands frères et sœurs. Cependant, les performances du processeur à 6 cœurs ne doivent pas être sous-estimées, car il dépasse souvent même le Core i9-10900K d'Intel dans la comparaison avec un seul cœur. En ce qui concerne les performances multi-cœurs, il est presque suffisant de se rapprocher de l'AMD Ryzen 7 3700X, même si celui-ci offre deux cœurs supplémentaires.
Vous pouvez trouver des critères de référence supplémentaires sur les transformateurs ici
AMD Ryzen 9 5950X
AMD Ryzen 5 5600X
| Cinebench R20 | |
| CPU (Single Core) | |
| AMD Ryzen 9 5950X | |
| AMD Ryzen 9 5900X | |
| AMD Ryzen 7 5800X | |
| AMD Ryzen 5 5600X | |
| Intel Core i9-10900K | |
| AMD Ryzen 9 3950X | |
| AMD Ryzen 9 3900X | |
| AMD Ryzen 7 3700X | |
| AMD Ryzen 3 3300X | |
| CPU (Multi Core) | |
| AMD Ryzen 9 5950X | |
| AMD Ryzen 9 3950X | |
| AMD Ryzen 9 5900X | |
| AMD Ryzen 9 3900X | |
| Intel Core i9-10900K | |
| AMD Ryzen 7 5800X | |
| AMD Ryzen 7 3700X | |
| AMD Ryzen 5 5600X | |
| AMD Ryzen 3 3300X | |
| Cinebench R15 | |
| CPU Single 64Bit | |
| AMD Ryzen 9 5950X | |
| AMD Ryzen 9 5900X | |
| AMD Ryzen 7 5800X | |
| AMD Ryzen 5 5600X | |
| Intel Core i9-10900K | |
| AMD Ryzen 9 3900X | |
| AMD Ryzen 9 3950X | |
| AMD Ryzen 7 3700X | |
| AMD Ryzen 3 3300X | |
| CPU Multi 64Bit | |
| AMD Ryzen 9 5950X | |
| AMD Ryzen 9 3950X | |
| AMD Ryzen 9 5900X | |
| AMD Ryzen 9 3900X | |
| Intel Core i9-10900K | |
| AMD Ryzen 7 5800X | |
| AMD Ryzen 7 3700X | |
| AMD Ryzen 5 5600X | |
| AMD Ryzen 3 3300X | |
| Cinebench R11.5 | |
| CPU Single 64Bit | |
| AMD Ryzen 9 5900X | |
| AMD Ryzen 9 5950X | |
| AMD Ryzen 7 5800X | |
| AMD Ryzen 5 5600X | |
| Intel Core i9-10900K | |
| AMD Ryzen 9 3950X | |
| AMD Ryzen 9 3900X | |
| AMD Ryzen 7 3700X | |
| AMD Ryzen 3 3300X | |
| CPU Multi 64Bit | |
| AMD Ryzen 9 5950X | |
| AMD Ryzen 9 3950X | |
| AMD Ryzen 9 5900X | |
| AMD Ryzen 9 3900X | |
| AMD Ryzen 7 5800X | |
| Intel Core i9-10900K | |
| AMD Ryzen 7 3700X | |
| AMD Ryzen 5 5600X | |
| AMD Ryzen 3 3300X | |
| Cinebench R10 | |
| Rendering Single CPUs 64Bit | |
| AMD Ryzen 9 5950X | |
| AMD Ryzen 7 5800X | |
| AMD Ryzen 9 5900X | |
| AMD Ryzen 5 5600X | |
| Intel Core i9-10900K | |
| AMD Ryzen 9 3950X | |
| AMD Ryzen 9 3900X | |
| AMD Ryzen 3 3300X | |
| AMD Ryzen 7 3700X | |
| Rendering Multiple CPUs 64Bit | |
| AMD Ryzen 9 5950X | |
| AMD Ryzen 9 5900X | |
| AMD Ryzen 9 3950X | |
| AMD Ryzen 7 5800X | |
| Intel Core i9-10900K | |
| AMD Ryzen 9 3900X | |
| AMD Ryzen 5 5600X | |
| AMD Ryzen 7 3700X | |
| AMD Ryzen 3 3300X | |
| Blender - v2.79 BMW27 CPU | |
| AMD Ryzen 3 3300X | |
| AMD Ryzen 5 5600X | |
| AMD Ryzen 7 5800X | |
| AMD Ryzen 7 3700X | |
| Intel Core i9-10900K | |
| AMD Ryzen 9 3900X | |
| AMD Ryzen 9 5900X | |
| AMD Ryzen 9 3950X | |
| AMD Ryzen 9 5950X | |
| X264 HD Benchmark 4.0 | |
| Pass 1 | |
| AMD Ryzen 7 5800X | |
| AMD Ryzen 9 5950X | |
| AMD Ryzen 9 5900X | |
| AMD Ryzen 5 5600X | |
| Intel Core i9-10900K | |
| AMD Ryzen 7 3700X | |
| AMD Ryzen 9 3900X | |
| AMD Ryzen 9 3950X | |
| AMD Ryzen 3 3300X | |
| Pass 2 | |
| AMD Ryzen 9 5950X | |
| AMD Ryzen 9 5900X | |
| AMD Ryzen 9 3950X | |
| AMD Ryzen 7 5800X | |
| Intel Core i9-10900K | |
| AMD Ryzen 9 3900X | |
| AMD Ryzen 5 5600X | |
| AMD Ryzen 7 3700X | |
| AMD Ryzen 3 3300X | |
| WinRAR - Result | |
| AMD Ryzen 7 5800X | |
| AMD Ryzen 9 5900X | |
| AMD Ryzen 5 5600X | |
| AMD Ryzen 9 5950X | |
| Intel Core i9-10900K | |
| AMD Ryzen 9 3900X | |
| AMD Ryzen 7 3700X | |
| AMD Ryzen 9 3950X | |
| AMD Ryzen 3 3300X | |
| TrueCrypt | |
| AES Mean 100MB | |
| AMD Ryzen 9 5950X | |
| AMD Ryzen 9 5900X | |
| AMD Ryzen 7 5800X | |
| Intel Core i9-10900K | |
| AMD Ryzen 7 3700X | |
| AMD Ryzen 9 3900X | |
| AMD Ryzen 9 3950X | |
| AMD Ryzen 5 5600X | |
| AMD Ryzen 3 3300X | |
| Twofish Mean 100MB | |
| AMD Ryzen 9 5950X | |
| AMD Ryzen 9 3950X | |
| AMD Ryzen 9 3900X | |
| AMD Ryzen 9 5900X | |
| Intel Core i9-10900K | |
| AMD Ryzen 7 3700X | |
| AMD Ryzen 7 5800X | |
| AMD Ryzen 5 5600X | |
| AMD Ryzen 3 3300X | |
| Serpent Mean 100MB | |
| AMD Ryzen 9 5950X | |
| AMD Ryzen 9 3950X | |
| AMD Ryzen 9 5900X | |
| AMD Ryzen 9 3900X | |
| Intel Core i9-10900K | |
| AMD Ryzen 7 5800X | |
| AMD Ryzen 7 3700X | |
| AMD Ryzen 5 5600X | |
| AMD Ryzen 3 3300X | |
| Geekbench 5.5 | |
| Multi-Core | |
| AMD Ryzen 9 5950X | |
| AMD Ryzen 9 5900X | |
| AMD Ryzen 9 3950X | |
| Intel Core i9-10900K | |
| AMD Ryzen 7 5800X | |
| AMD Ryzen 9 3900X | |
| AMD Ryzen 5 5600X | |
| AMD Ryzen 7 3700X | |
| AMD Ryzen 3 3300X | |
| Single-Core | |
| AMD Ryzen 9 5950X | |
| AMD Ryzen 9 5900X | |
| AMD Ryzen 7 5800X | |
| AMD Ryzen 5 5600X | |
| Intel Core i9-10900K | |
| AMD Ryzen 9 3950X | |
| AMD Ryzen 7 3700X | |
| AMD Ryzen 3 3300X | |
| AMD Ryzen 9 3900X | |
| Geekbench 5.0 | |
| 5.0 Multi-Core | |
| AMD Ryzen 9 5950X | |
| AMD Ryzen 9 3950X | |
| AMD Ryzen 9 5900X | |
| Intel Core i9-10900K | |
| AMD Ryzen 7 5800X | |
| AMD Ryzen 9 3900X | |
| AMD Ryzen 5 5600X | |
| AMD Ryzen 3 3300X | |
| 5.0 Single-Core | |
| AMD Ryzen 9 5950X | |
| AMD Ryzen 7 5800X | |
| AMD Ryzen 9 5900X | |
| AMD Ryzen 5 5600X | |
| Intel Core i9-10900K | |
| AMD Ryzen 9 3950X | |
| AMD Ryzen 3 3300X | |
| AMD Ryzen 9 3900X | |
| Geekbench 4.4 | |
| 64 Bit Single-Core Score | |
| AMD Ryzen 7 5800X | |
| AMD Ryzen 9 5900X | |
| AMD Ryzen 9 5950X | |
| AMD Ryzen 5 5600X | |
| Intel Core i9-10900K | |
| AMD Ryzen 9 3900X | |
| AMD Ryzen 7 3700X | |
| AMD Ryzen 3 3300X | |
| AMD Ryzen 9 3950X | |
| 64 Bit Multi-Core Score | |
| AMD Ryzen 9 5950X | |
| AMD Ryzen 9 5900X | |
| AMD Ryzen 9 3950X | |
| AMD Ryzen 7 5800X | |
| AMD Ryzen 9 3900X | |
| Intel Core i9-10900K | |
| AMD Ryzen 5 5600X | |
| AMD Ryzen 7 3700X | |
| AMD Ryzen 3 3300X | |
| 3DMark 11 - 1280x720 Performance Physics | |
| AMD Ryzen 9 5950X | |
| AMD Ryzen 9 5900X | |
| AMD Ryzen 7 5800X | |
| Intel Core i9-10900K | |
| AMD Ryzen 9 3950X | |
| AMD Ryzen 5 5600X | |
| AMD Ryzen 9 3900X | |
| AMD Ryzen 7 3700X | |
| AMD Ryzen 3 3300X | |
| 7-Zip 18.03 | |
| 7z b 4 | |
| AMD Ryzen 9 5950X | |
| AMD Ryzen 9 3950X | |
| AMD Ryzen 9 5900X | |
| AMD Ryzen 9 3900X | |
| AMD Ryzen 7 5800X | |
| Intel Core i9-10900K | |
| AMD Ryzen 7 3700X | |
| AMD Ryzen 5 5600X | |
| AMD Ryzen 3 3300X | |
| 7z b 4 -mmt1 | |
| AMD Ryzen 9 5950X | |
| AMD Ryzen 7 5800X | |
| AMD Ryzen 9 5900X | |
| AMD Ryzen 5 5600X | |
| Intel Core i9-10900K | |
| AMD Ryzen 9 3900X | |
| AMD Ryzen 9 3950X | |
| AMD Ryzen 7 3700X | |
| AMD Ryzen 3 3300X | |
| HWBOT x265 Benchmark v2.2 - 4k Preset | |
| AMD Ryzen 9 5950X | |
| AMD Ryzen 9 5900X | |
| Intel Core i9-10900K | |
| AMD Ryzen 9 3900X | |
| AMD Ryzen 7 5800X | |
| AMD Ryzen 9 3950X | |
| AMD Ryzen 5 5600X | |
| AMD Ryzen 7 3700X | |
| AMD Ryzen 3 3300X | |
| R Benchmark 2.5 - Overall mean | |
| AMD Ryzen 9 3900X | |
| AMD Ryzen 3 3300X | |
| Intel Core i9-10900K | |
| AMD Ryzen 9 3950X | |
| AMD Ryzen 5 5600X | |
| AMD Ryzen 9 5950X | |
| AMD Ryzen 9 5900X | |
| AMD Ryzen 7 5800X | |
| LibreOffice - 20 Documents To PDF | |
| Intel Core i9-10900K | |
| AMD Ryzen 9 3900X | |
| AMD Ryzen 9 3950X | |
| AMD Ryzen 3 3300X | |
| AMD Ryzen 9 5900X | |
| AMD Ryzen 9 5950X | |
| AMD Ryzen 5 5600X | |
| AMD Ryzen 7 5800X | |
| WebXPRT 3 - Overall | |
| AMD Ryzen 7 5800X | |
| AMD Ryzen 9 5950X | |
| AMD Ryzen 5 5600X | |
| AMD Ryzen 9 5900X | |
| Intel Core i9-10900K | |
| AMD Ryzen 9 3950X | |
| AMD Ryzen 3 3300X | |
| Mozilla Kraken 1.1 - Total | |
| AMD Ryzen 3 3300X | |
| Intel Core i9-10900K | |
| AMD Ryzen 9 3950X | |
| AMD Ryzen 5 5600X | |
| AMD Ryzen 9 5900X | |
| AMD Ryzen 7 5800X | |
| AMD Ryzen 9 5950X | |
| 3DMark | |
| 3840x2160 Fire Strike Ultra Physics | |
| AMD Ryzen 9 5950X | |
| AMD Ryzen 9 5900X | |
| AMD Ryzen 9 3950X | |
| AMD Ryzen 7 5800X | |
| Intel Core i9-10900K | |
| AMD Ryzen 9 3900X | |
| AMD Ryzen 5 5600X | |
| AMD Ryzen 7 3700X | |
| AMD Ryzen 3 3300X | |
| 1920x1080 Fire Strike Physics | |
| AMD Ryzen 9 5950X | |
| AMD Ryzen 9 5900X | |
| AMD Ryzen 9 3950X | |
| AMD Ryzen 7 5800X | |
| Intel Core i9-10900K | |
| AMD Ryzen 9 3900X | |
| AMD Ryzen 5 5600X | |
| AMD Ryzen 7 3700X | |
| AMD Ryzen 3 3300X | |
| 2560x1440 Time Spy CPU | |
| Intel Core i9-10900K | |
| AMD Ryzen 9 5950X | |
| AMD Ryzen 9 5900X | |
| AMD Ryzen 9 3950X | |
| AMD Ryzen 9 3900X | |
| AMD Ryzen 7 5800X | |
| AMD Ryzen 7 3700X | |
| AMD Ryzen 5 5600X | |
| AMD Ryzen 3 3300X | |
* ... Moindre est la valeur, meilleures sont les performances
Test de charge avec le Cinebench R15 Multi Loop
Lors du test de charge avec la multi-boucle Cinebench R15, ni l'AMD Ryzen 9 5950X ni l'AMD Ryzen 5 5600X n'ont de problèmes. L'AiO intégré ainsi que le radiateur de 280 millimètres (11 pouces) n'ont aucun problème pour refroidir les processeurs de manière fiable. D'ailleurs, il est nettement plus facilede refroidir l'AMD Ryzen 5 5600X grâce à sa consommation d'énergie plus faible.
Les performances de jeu des processeurs Ryzen 3000
Depuis le 11/5/2020, il est officiel qu'AMD offre le processeur de jeu le plus rapide à ce jour. Néanmoins, le Ryzen 9 5950X d'AMD est toujours capable d'augmenter le nombre de FPS du Nvidia Titan RTX dans certains jeux. Cependant, cela ne fait pas de différence notable pour le plaisir du jeu. Avec l'augmentation des paramètres de résolution et de qualité, les avantages des processeurs commencent à fondre, de sorte que même l'AMD Ryzen 5 5600X est capable de suivre l'AMD Ryzen 9 5950X. Si vous ne vous souciez que des performances de jeu, vous ne vous trompez pas pour l'instant si vous vous décidez pour le processeur d'entrée de gamme. Les créateurs de contenu ainsi que les diffuseurs de flux, par exemple, peuvent se passer d'un PC séparé pour la diffusion en continu, s'ils choisissent l'AMD Ryzen 9 5950X. Cela offre des ressources suffisantes pour gérer le flux en ligne en plus du jeu pur.
| 3DMark 11 - 1280x720 Performance GPU | |
| Intel Core i7-10700K | |
| Intel Core i9-10900K | |
| AMD Ryzen 9 5950X | |
| AMD Ryzen 7 5800X | |
| AMD Ryzen 5 5600X | |
| AMD Ryzen 7 3800XT | |
| AMD Ryzen 3 3300X | |
| AMD Ryzen 9 5900X | |
| AMD Ryzen 3 3100 | |
| AMD Ryzen 9 3950X | |
| AMD Ryzen 5 1600 | |
| AMD Ryzen 3 3100 | |
| AMD Ryzen 9 3900X | |
| AMD Ryzen 7 2700X | |
| Unigine Heaven 4.0 | |
| Extreme Preset DX11 | |
| AMD Ryzen 9 5900X | |
| AMD Ryzen 9 5950X | |
| AMD Ryzen 7 5800X | |
| AMD Ryzen 9 3900X | |
| AMD Ryzen 5 5600X | |
| AMD Ryzen 7 2700X | |
| Extreme Preset OpenGL | |
| AMD Ryzen 7 5800X | |
| AMD Ryzen 9 5900X | |
| AMD Ryzen 9 5950X | |
| AMD Ryzen 9 3900X | |
| AMD Ryzen 5 5600X | |
| AMD Ryzen 7 2700X | |
| Unigine Valley 1.0 | |
| 1920x1080 Extreme HD Preset OpenGL AA:x8 | |
| AMD Ryzen 9 5900X | |
| AMD Ryzen 7 5800X | |
| AMD Ryzen 9 5950X | |
| AMD Ryzen 5 5600X | |
| AMD Ryzen 9 3900X | |
| AMD Ryzen 7 2700X | |
| 1920x1080 Extreme HD DirectX AA:x8 | |
| AMD Ryzen 9 5950X | |
| AMD Ryzen 9 5900X | |
| AMD Ryzen 7 5800X | |
| AMD Ryzen 5 5600X | |
| AMD Ryzen 9 3900X | |
| AMD Ryzen 7 2700X | |
| Unigine Superposition | |
| 1280x720 720p Low | |
| AMD Ryzen 7 5800X | |
| AMD Ryzen 5 5600X | |
| AMD Ryzen 9 5950X | |
| AMD Ryzen 9 5900X | |
| AMD Ryzen 9 3900X | |
| 1920x1080 1080p Extreme | |
| AMD Ryzen 9 5900X | |
| AMD Ryzen 7 5800X | |
| AMD Ryzen 9 5950X | |
| AMD Ryzen 5 5600X | |
| AMD Ryzen 9 3900X | |
| 7680x4320 8k Optimized | |
| AMD Ryzen 9 5900X | |
| AMD Ryzen 5 5600X | |
| AMD Ryzen 7 5800X | |
| AMD Ryzen 9 5950X | |
| AMD Ryzen 9 3900X | |
Ryzen 9 5950X with Nvidia Titan RTX
| Bas | Moyen | Élevé | Ultra | QHD | 4K | |
|---|---|---|---|---|---|---|
| GTA V (2015) | 187 | 186 | 182 | 121 | 113 | 134 |
| The Witcher 3 (2015) | 594 | 420 | 271 | 141 | 102 | |
| Dota 2 Reborn (2015) | 214.5 | 192.3 | 193.3 | 179.2 | 161.6 | |
| Final Fantasy XV Benchmark (2018) | 225 | 183 | 141 | 105 | 63.4 | |
| X-Plane 11.11 (2018) | 168 | 152 | 117 | 101 | ||
| Far Cry 5 (2018) | 201 | 174 | 166 | 154 | 137 | 80 |
| Strange Brigade (2018) | 604 | 350 | 286 | 241 | 183 | 110 |
| Shadow of the Tomb Raider (2018) | 225.1 | 184.2 | 177.9 | 166.1 | 120.1 | 66.4 |
| Far Cry New Dawn (2019) | 165 | 142 | 123 | 115 | 82 | |
| Metro Exodus (2019) | 232 | 172 | 133 | 106 | 86.1 | 56.4 |
| Borderlands 3 (2019) | 217 | 182 | 141 | 117 | 84.4 | 46.6 |
Ryzen 5 5600X with Nvidia Titan RTX
| Bas | Moyen | Élevé | Ultra | QHD | 4K | |
|---|---|---|---|---|---|---|
| GTA V (2015) | 187 | 186 | 181 | 118 | 109 | 133 |
| The Witcher 3 (2015) | 570 | 413 | 268 | 139 | 101 | |
| Dota 2 Reborn (2015) | 228.9 | 200.7 | 191 | 180 | 168.3 | |
| Final Fantasy XV Benchmark (2018) | 225 | 179 | 138 | 104 | 63.2 | |
| X-Plane 11.11 (2018) | 172 | 156 | 123 | 105 | ||
| Far Cry 5 (2018) | 200 | 171 | 166 | 153 | 135 | 80 |
| Strange Brigade (2018) | 643 | 351 | 286 | 243 | 184 | 110 |
| Shadow of the Tomb Raider (2018) | 217 | 185 | 178 | 165 | 121 | 66.5 |
| Far Cry New Dawn (2019) | 164 | 144 | 136 | 123 | 116 | 81 |
| Metro Exodus (2019) | 236 | 172 | 133 | 107 | 85.4 | 54.6 |
| Borderlands 3 (2019) | 214 | 177 | 138 | 115 | 83.9 | 46.5 |
Exécution de la demande
Comme nous l'avons déjà vu dans les benchmarks CPU, tous les nouveaux processeurs Vermeer sont sur une très bonne trajectoire en termes de performances. Cela se reflète également dans nos tests d'application et de rendu. L'ensemble du système fonctionne très rapidement, même si le SSD n'utilise pas la toute dernière norme PCI Express 4.0. Cependant, dans l'utilisation quotidienne, ce n'est pas un inconvénient, puisque l'Intel Optane 905P appartient toujours aux SSD PCIe les plus rapides.
Dans le PCMark 10, l'AMD Ryzen 9 5950X arrive en tête et présente un léger avantage de 4 % par rapport à l'AMD Ryzen 9 5900X. Le Ryzen 5 5600X, plus petit, est à la hauteur des yeux du Ryzen 7 5800X
d'AMD, mais il est nettement meilleur que l'ancien modèle haut de gamme, le Ryzen 9 3950X d'AMD. Les processeurs Intel ne se trouvent qu'au milieu du champ avec un désavantage de 15% par rapport au Ryzen 9 5950X.
Dans les tests de rendu, le résultat global semble plus mitigé, puisque la carte graphique est ici le facteur limitant. Cependant, il est possible de voir dans certains tests qu'avec un nombre croissant de cœurs, les performances augmentent également, bien que le nombre de cœurs CPU n'ait pas d'importance dans certaines charges de travail. Dans ce cas, vous devez peser soigneusement ce qui est le plus important pour vous, si vous n'êtes pas prêt à toujours choisir le modèle le plus performant.
| PCMark 10 - Score | |
| AMD Ryzen 9 5950X, NVIDIA Titan RTX, Intel Optane 905P 480GB 2.5 | |
| AMD Ryzen 9 5900X, NVIDIA Titan RTX, Intel Optane 905P 480GB 2.5 | |
| AMD Ryzen 5 5600X, NVIDIA Titan RTX, Intel Optane 905P 480GB 2.5 | |
| AMD Ryzen 7 5800X, NVIDIA Titan RTX, Intel Optane 905P 480GB 2.5 | |
| AMD Ryzen 9 3950X, NVIDIA Titan RTX, Intel Optane 905P 480GB 2.5 | |
| AMD Ryzen 7 3800XT, NVIDIA Titan RTX, Intel Optane 905P 480GB 2.5 | |
| Intel Core i9-10900K, NVIDIA Titan RTX, WDC PC SN720 SDAQNTW-512G | |
| Intel Core i7-10700K, NVIDIA Titan RTX, Intel Optane 905P 480GB 2.5 | |
| AMD Ryzen 9 3900X, NVIDIA Titan RTX, Corsair MP600 | |
| AMD Ryzen 3 3300X, NVIDIA Titan RTX, Intel Optane 905P 480GB 2.5 | |
| AMD Ryzen 3 3100, NVIDIA Titan RTX, Intel Optane 905P 480GB 2.5 | |
| AMD Ryzen 5 1600, NVIDIA Titan RTX, Intel Optane 905P 480GB 2.5 | |
| AS SSD | |
| Score Total | |
| AMD Ryzen 5 5600X, NVIDIA Titan RTX, Intel Optane 905P 480GB 2.5 | |
| AMD Ryzen 9 5950X, NVIDIA Titan RTX, Intel Optane 905P 480GB 2.5 | |
| AMD Ryzen 7 5800X, NVIDIA Titan RTX, Intel Optane 905P 480GB 2.5 | |
| AMD Ryzen 9 5900X, NVIDIA Titan RTX, Intel Optane 905P 480GB 2.5 | |
| AMD Ryzen 7 3800XT, NVIDIA Titan RTX, Intel Optane 905P 480GB 2.5 | |
| Intel Core i7-10700K, NVIDIA Titan RTX, Intel Optane 905P 480GB 2.5 | |
| Score Write | |
| AMD Ryzen 5 5600X, NVIDIA Titan RTX, Intel Optane 905P 480GB 2.5 | |
| AMD Ryzen 9 5950X, NVIDIA Titan RTX, Intel Optane 905P 480GB 2.5 | |
| AMD Ryzen 7 5800X, NVIDIA Titan RTX, Intel Optane 905P 480GB 2.5 | |
| AMD Ryzen 9 5900X, NVIDIA Titan RTX, Intel Optane 905P 480GB 2.5 | |
| AMD Ryzen 7 3800XT, NVIDIA Titan RTX, Intel Optane 905P 480GB 2.5 | |
| Intel Core i7-10700K, NVIDIA Titan RTX, Intel Optane 905P 480GB 2.5 | |
| Score Read | |
| AMD Ryzen 5 5600X, NVIDIA Titan RTX, Intel Optane 905P 480GB 2.5 | |
| AMD Ryzen 9 5950X, NVIDIA Titan RTX, Intel Optane 905P 480GB 2.5 | |
| AMD Ryzen 7 5800X, NVIDIA Titan RTX, Intel Optane 905P 480GB 2.5 | |
| AMD Ryzen 9 5900X, NVIDIA Titan RTX, Intel Optane 905P 480GB 2.5 | |
| AMD Ryzen 7 3800XT, NVIDIA Titan RTX, Intel Optane 905P 480GB 2.5 | |
| Intel Core i7-10700K, NVIDIA Titan RTX, Intel Optane 905P 480GB 2.5 | |
| Access Time Write | |
| Intel Core i7-10700K, NVIDIA Titan RTX, Intel Optane 905P 480GB 2.5 | |
| AMD Ryzen 7 3800XT, NVIDIA Titan RTX, Intel Optane 905P 480GB 2.5 | |
| AMD Ryzen 7 5800X, NVIDIA Titan RTX, Intel Optane 905P 480GB 2.5 | |
| AMD Ryzen 5 5600X, NVIDIA Titan RTX, Intel Optane 905P 480GB 2.5 | |
| AMD Ryzen 9 5900X, NVIDIA Titan RTX, Intel Optane 905P 480GB 2.5 | |
| AMD Ryzen 9 5950X, NVIDIA Titan RTX, Intel Optane 905P 480GB 2.5 | |
| Access Time Read | |
| AMD Ryzen 7 3800XT, NVIDIA Titan RTX, Intel Optane 905P 480GB 2.5 | |
| Intel Core i7-10700K, NVIDIA Titan RTX, Intel Optane 905P 480GB 2.5 | |
| AMD Ryzen 7 5800X, NVIDIA Titan RTX, Intel Optane 905P 480GB 2.5 | |
| AMD Ryzen 5 5600X, NVIDIA Titan RTX, Intel Optane 905P 480GB 2.5 | |
| AMD Ryzen 9 5900X, NVIDIA Titan RTX, Intel Optane 905P 480GB 2.5 | |
| AMD Ryzen 9 5950X, NVIDIA Titan RTX, Intel Optane 905P 480GB 2.5 | |
| 4K-64 Write | |
| AMD Ryzen 5 5600X, NVIDIA Titan RTX, Intel Optane 905P 480GB 2.5 | |
| AMD Ryzen 9 5950X, NVIDIA Titan RTX, Intel Optane 905P 480GB 2.5 | |
| AMD Ryzen 7 5800X, NVIDIA Titan RTX, Intel Optane 905P 480GB 2.5 | |
| AMD Ryzen 9 5900X, NVIDIA Titan RTX, Intel Optane 905P 480GB 2.5 | |
| AMD Ryzen 7 3800XT, NVIDIA Titan RTX, Intel Optane 905P 480GB 2.5 | |
| Intel Core i7-10700K, NVIDIA Titan RTX, Intel Optane 905P 480GB 2.5 | |
| 4K-64 Read | |
| AMD Ryzen 5 5600X, NVIDIA Titan RTX, Intel Optane 905P 480GB 2.5 | |
| AMD Ryzen 9 5950X, NVIDIA Titan RTX, Intel Optane 905P 480GB 2.5 | |
| AMD Ryzen 7 5800X, NVIDIA Titan RTX, Intel Optane 905P 480GB 2.5 | |
| AMD Ryzen 9 5900X, NVIDIA Titan RTX, Intel Optane 905P 480GB 2.5 | |
| Intel Core i7-10700K, NVIDIA Titan RTX, Intel Optane 905P 480GB 2.5 | |
| AMD Ryzen 7 3800XT, NVIDIA Titan RTX, Intel Optane 905P 480GB 2.5 | |
| 4K Write | |
| AMD Ryzen 9 5900X, NVIDIA Titan RTX, Intel Optane 905P 480GB 2.5 | |
| AMD Ryzen 7 5800X, NVIDIA Titan RTX, Intel Optane 905P 480GB 2.5 | |
| AMD Ryzen 9 5950X, NVIDIA Titan RTX, Intel Optane 905P 480GB 2.5 | |
| AMD Ryzen 5 5600X, NVIDIA Titan RTX, Intel Optane 905P 480GB 2.5 | |
| AMD Ryzen 7 3800XT, NVIDIA Titan RTX, Intel Optane 905P 480GB 2.5 | |
| Intel Core i7-10700K, NVIDIA Titan RTX, Intel Optane 905P 480GB 2.5 | |
| 4K Read | |
| AMD Ryzen 7 5800X, NVIDIA Titan RTX, Intel Optane 905P 480GB 2.5 | |
| AMD Ryzen 9 5900X, NVIDIA Titan RTX, Intel Optane 905P 480GB 2.5 | |
| AMD Ryzen 9 5950X, NVIDIA Titan RTX, Intel Optane 905P 480GB 2.5 | |
| AMD Ryzen 5 5600X, NVIDIA Titan RTX, Intel Optane 905P 480GB 2.5 | |
| AMD Ryzen 7 3800XT, NVIDIA Titan RTX, Intel Optane 905P 480GB 2.5 | |
| Intel Core i7-10700K, NVIDIA Titan RTX, Intel Optane 905P 480GB 2.5 | |
| Seq Write | |
| AMD Ryzen 5 5600X, NVIDIA Titan RTX, Intel Optane 905P 480GB 2.5 | |
| AMD Ryzen 7 3800XT, NVIDIA Titan RTX, Intel Optane 905P 480GB 2.5 | |
| AMD Ryzen 7 5800X, NVIDIA Titan RTX, Intel Optane 905P 480GB 2.5 | |
| Intel Core i7-10700K, NVIDIA Titan RTX, Intel Optane 905P 480GB 2.5 | |
| AMD Ryzen 9 5900X, NVIDIA Titan RTX, Intel Optane 905P 480GB 2.5 | |
| AMD Ryzen 9 5950X, NVIDIA Titan RTX, Intel Optane 905P 480GB 2.5 | |
| Seq Read | |
| AMD Ryzen 5 5600X, NVIDIA Titan RTX, Intel Optane 905P 480GB 2.5 | |
| AMD Ryzen 7 5800X, NVIDIA Titan RTX, Intel Optane 905P 480GB 2.5 | |
| AMD Ryzen 9 5900X, NVIDIA Titan RTX, Intel Optane 905P 480GB 2.5 | |
| AMD Ryzen 7 3800XT, NVIDIA Titan RTX, Intel Optane 905P 480GB 2.5 | |
| Intel Core i7-10700K, NVIDIA Titan RTX, Intel Optane 905P 480GB 2.5 | |
| AMD Ryzen 9 5950X, NVIDIA Titan RTX, Intel Optane 905P 480GB 2.5 | |
* ... Moindre est la valeur, meilleures sont les performances
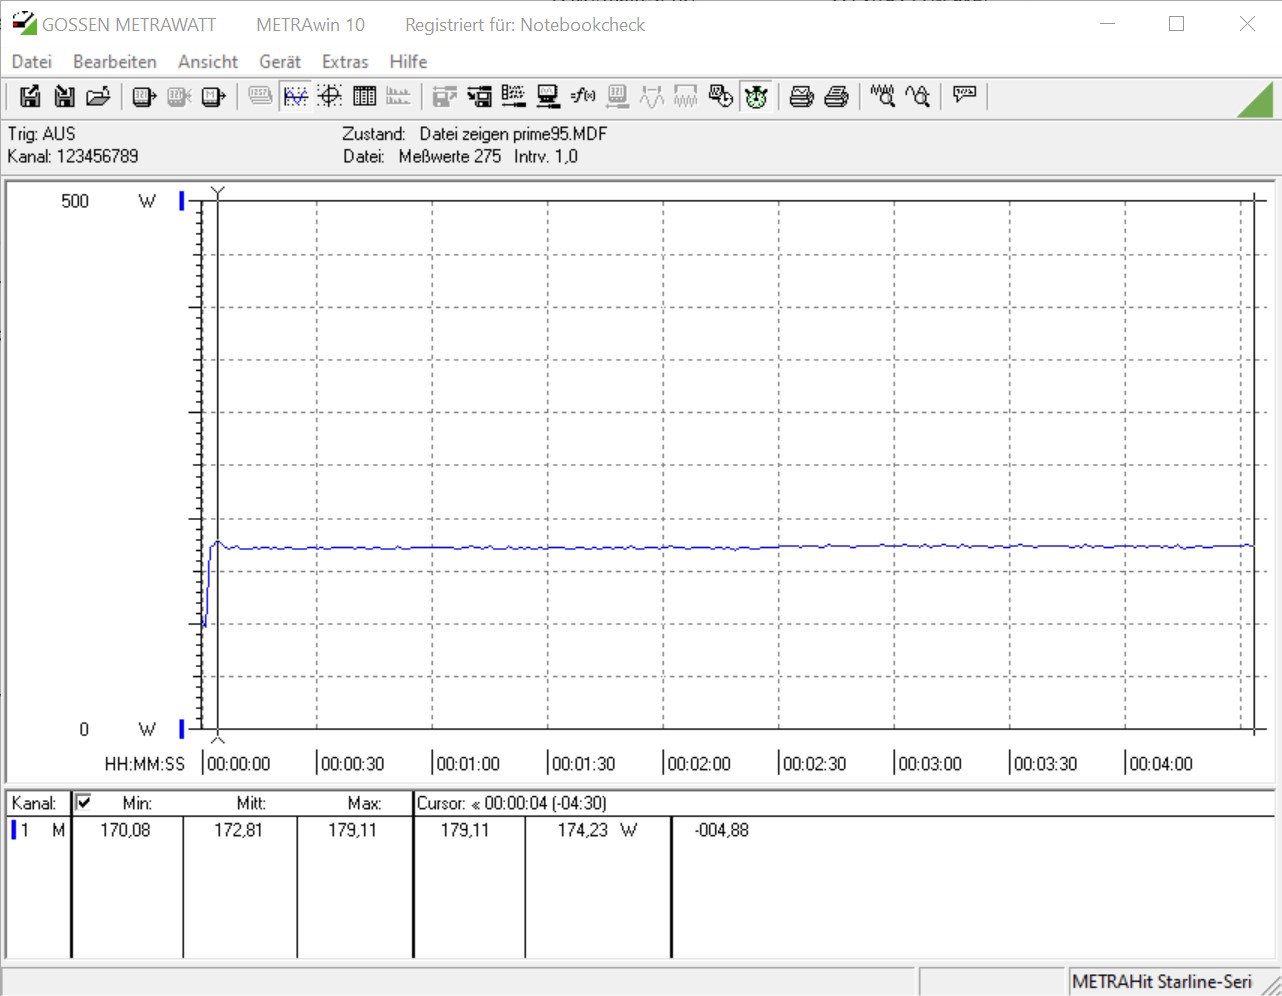
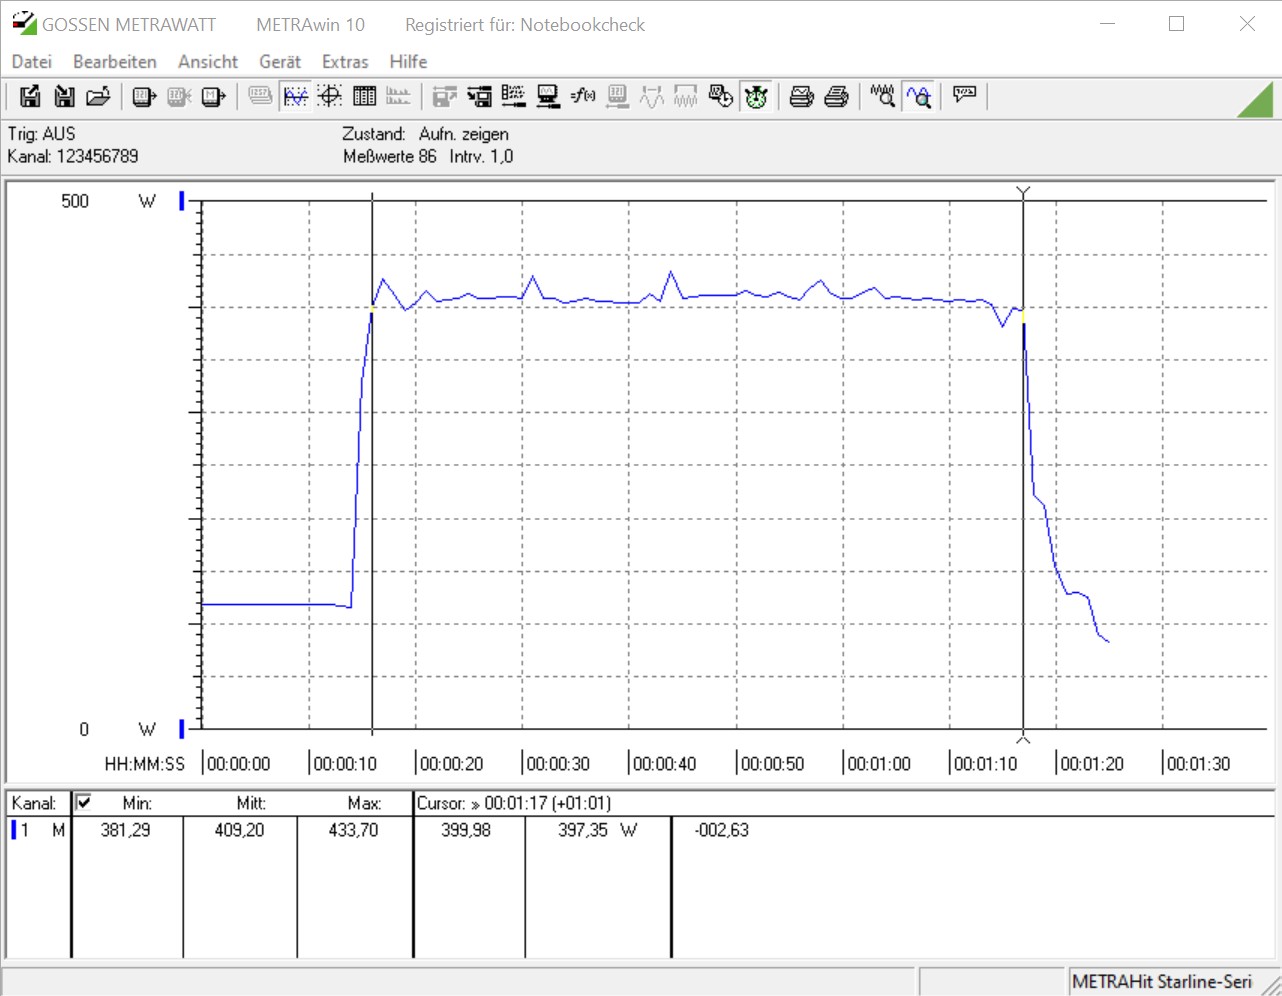
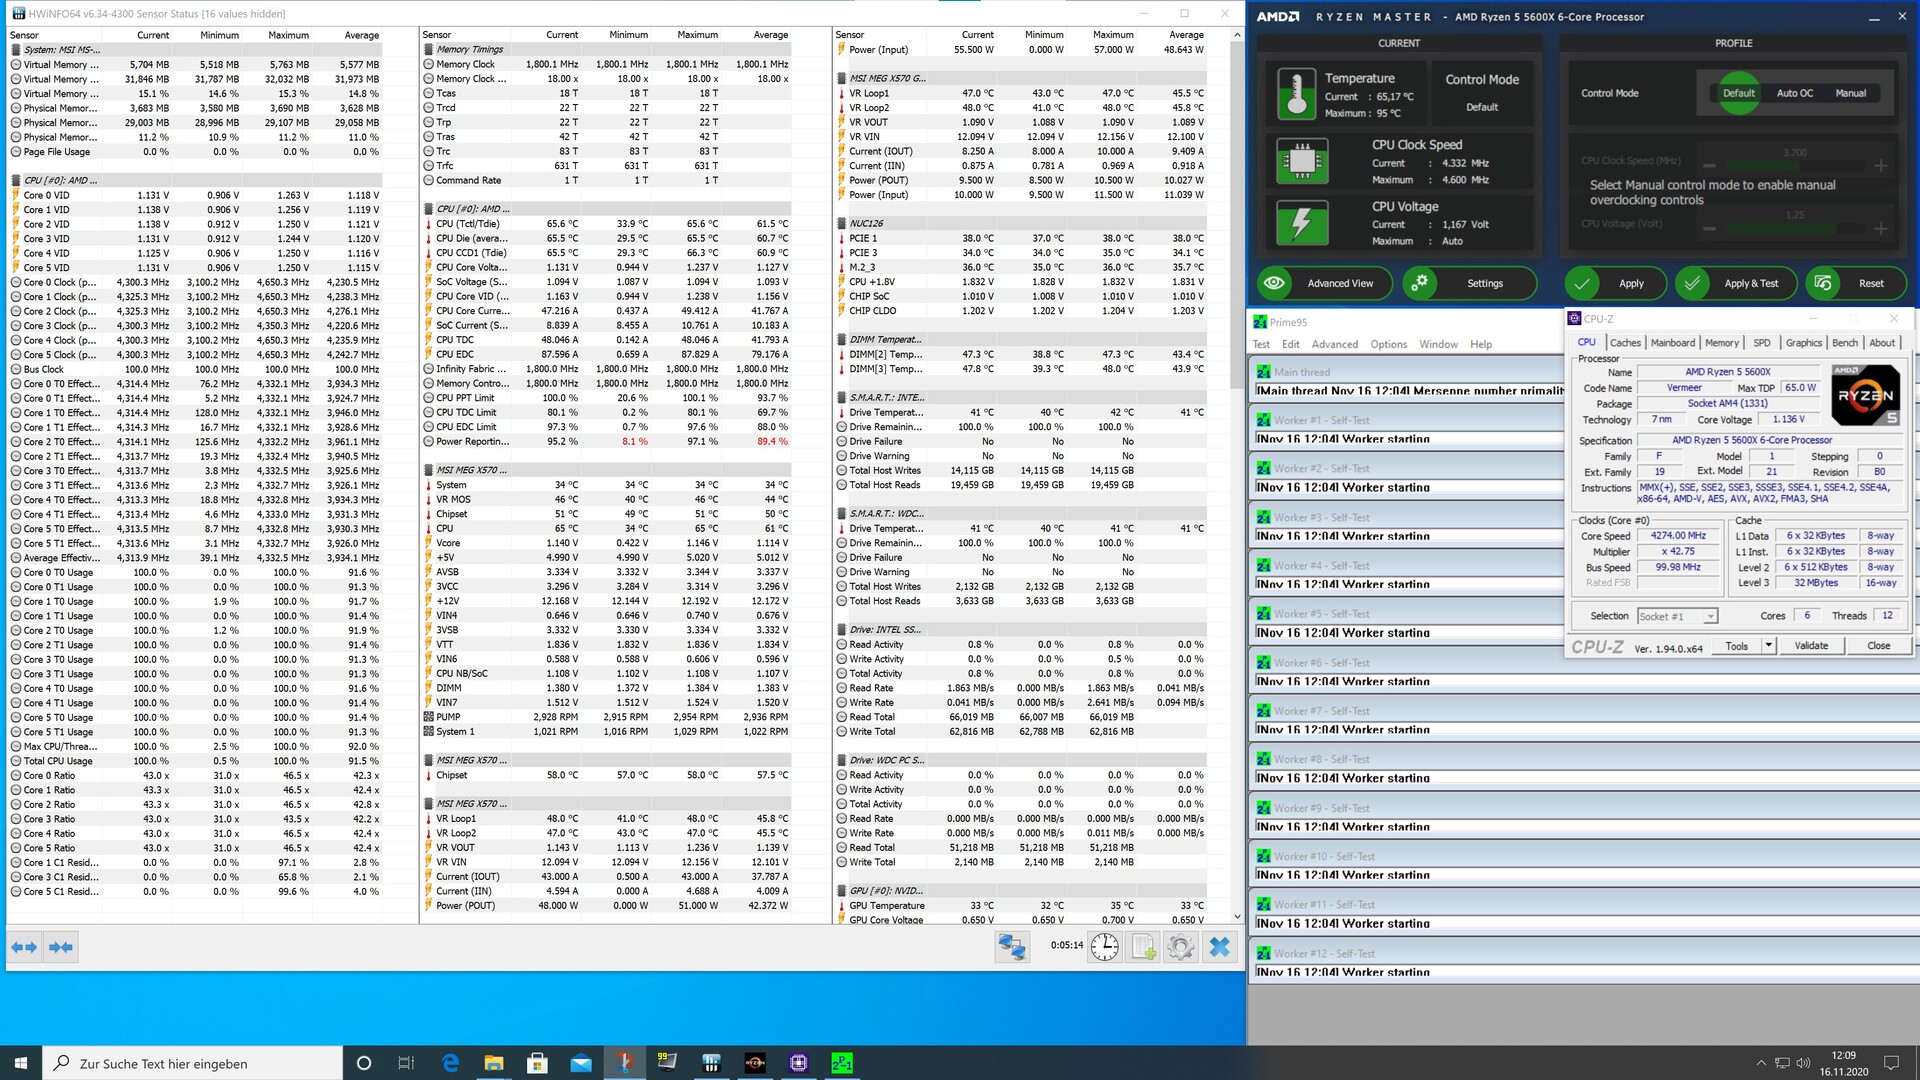
Consommation d'énergie
Comme déjà pour le Ryzen 9 5900X et le Ryzen 7 5800X auparavant, AMD spécifie également un TDP de 105 watts pour le Ryzen 9 5950X. Avec cela, il reste dans les spécifications de la plate-forme X570, puisque AMD n'a pas introduit de nouveau chipset avec la génération Vermeer. Cependant, les 105 watts ne sont finalement pas suffisants, puisque la limite de puissance du processeur se situe à 142 watts, ce que le processeur à 16 cœurs consomme en effet sous charge.
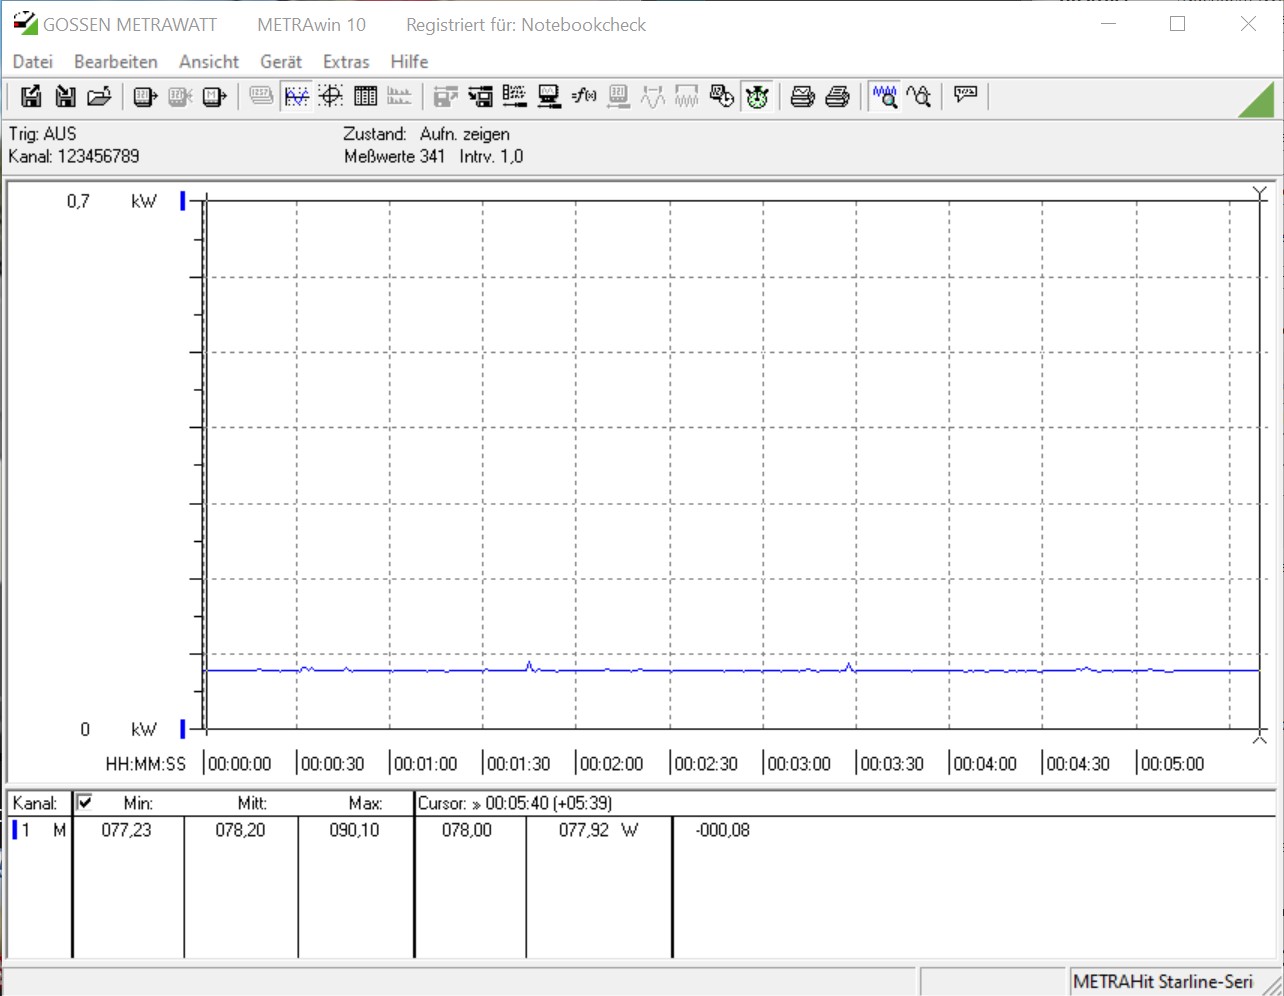
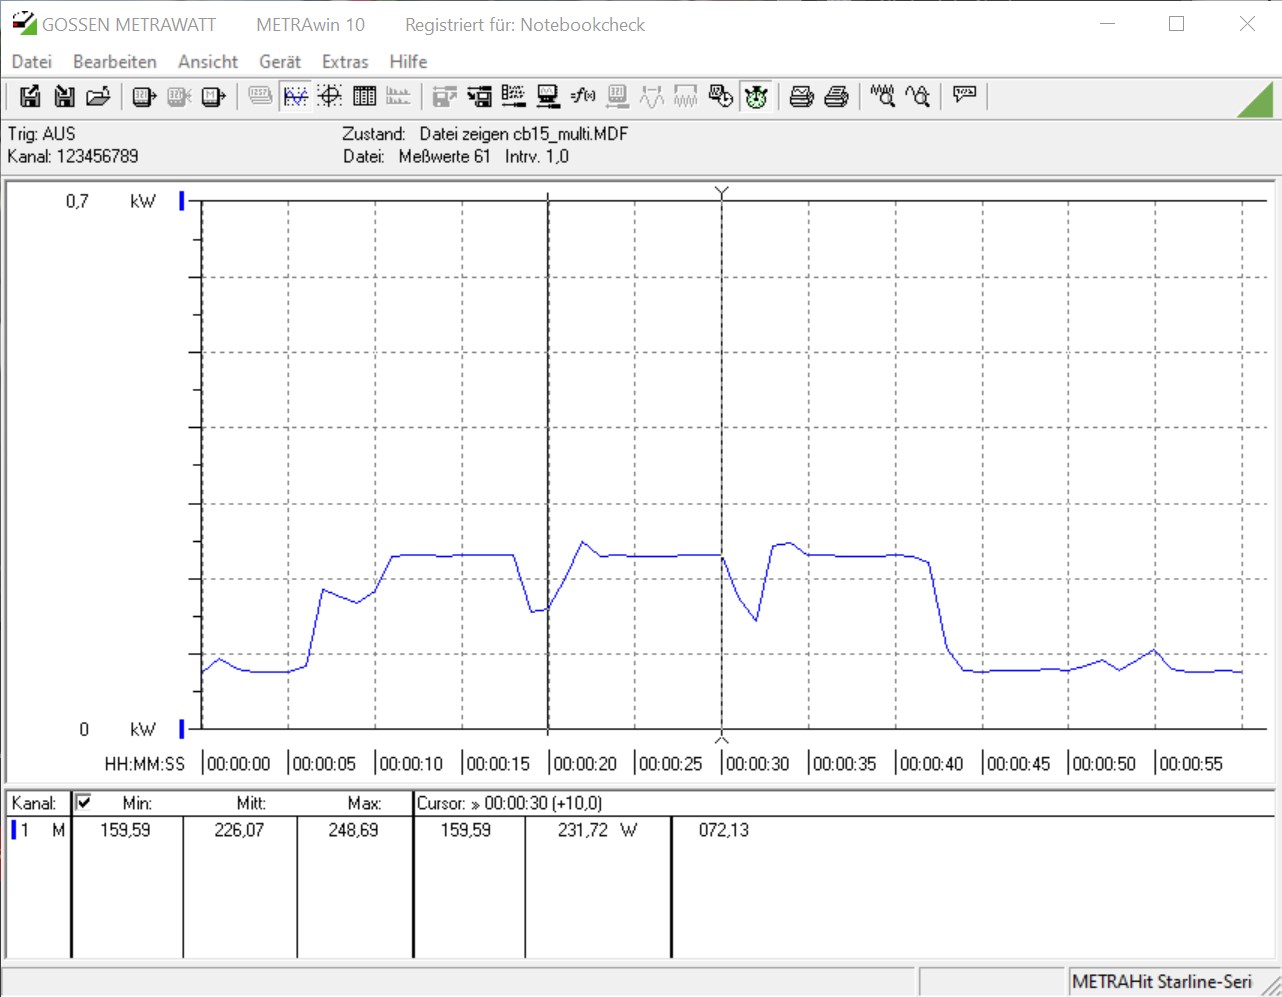
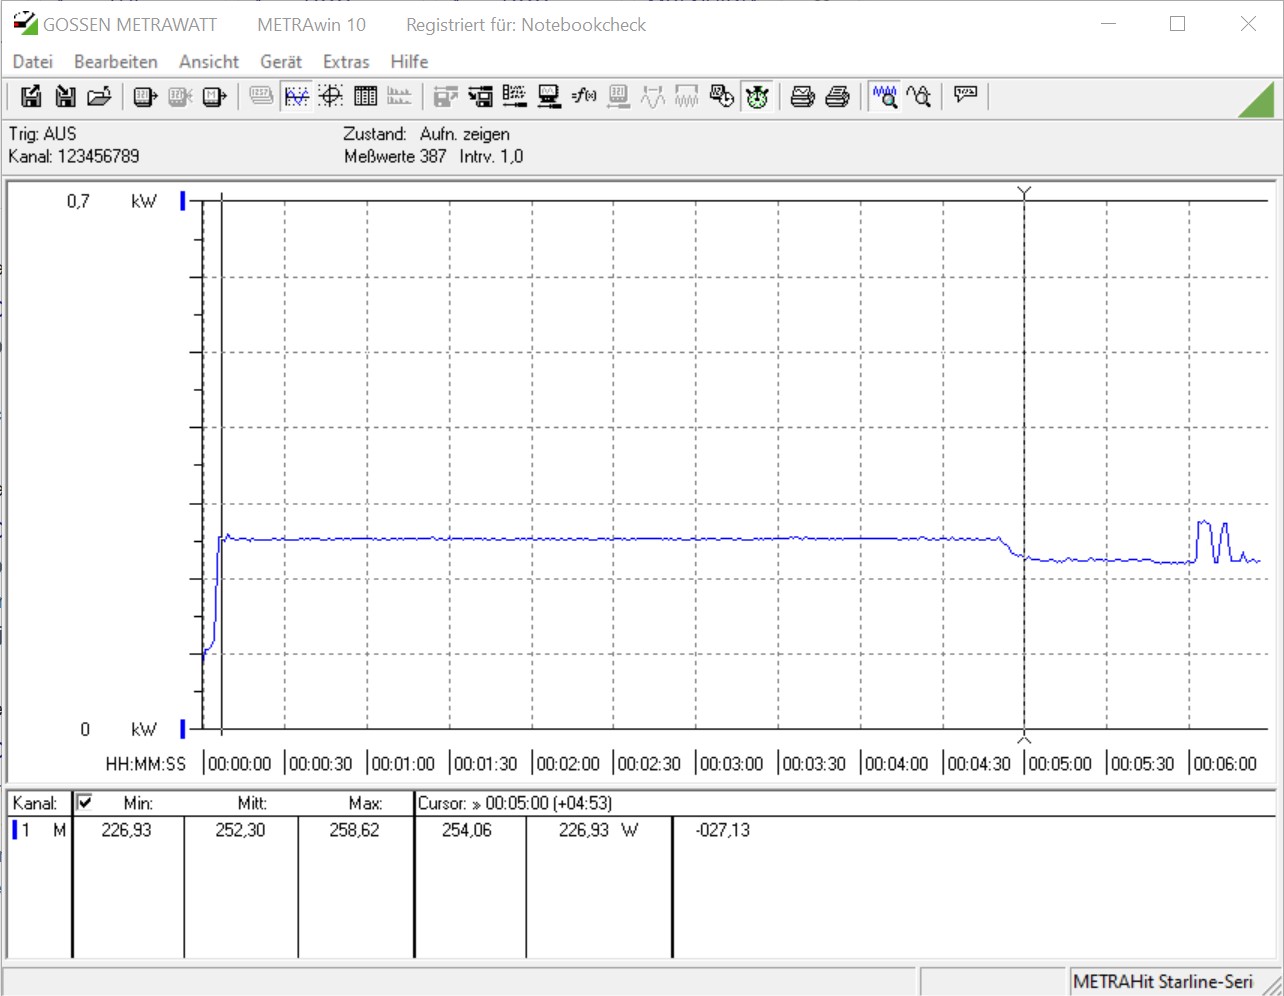
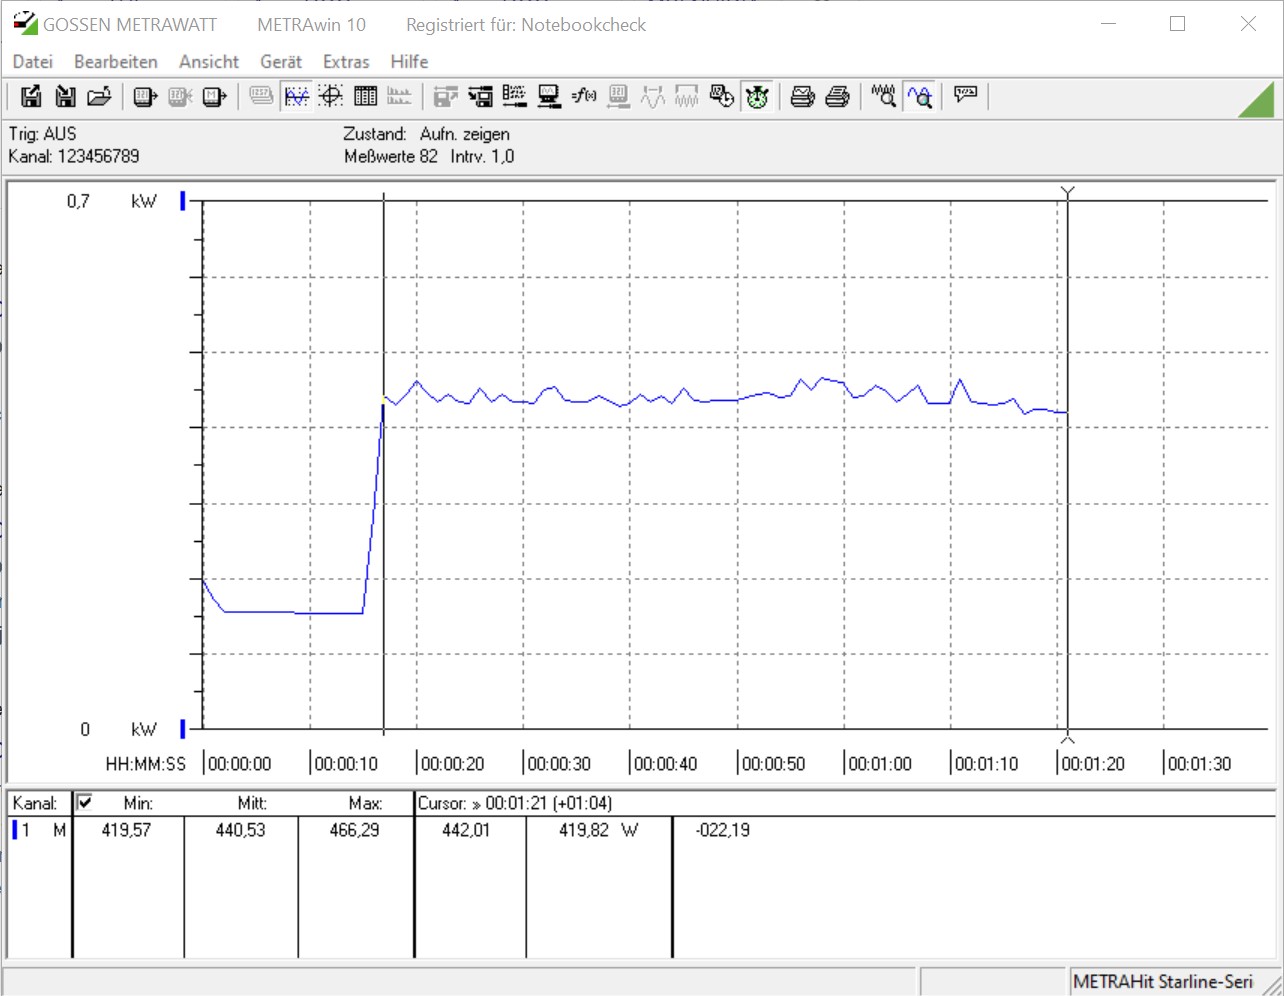
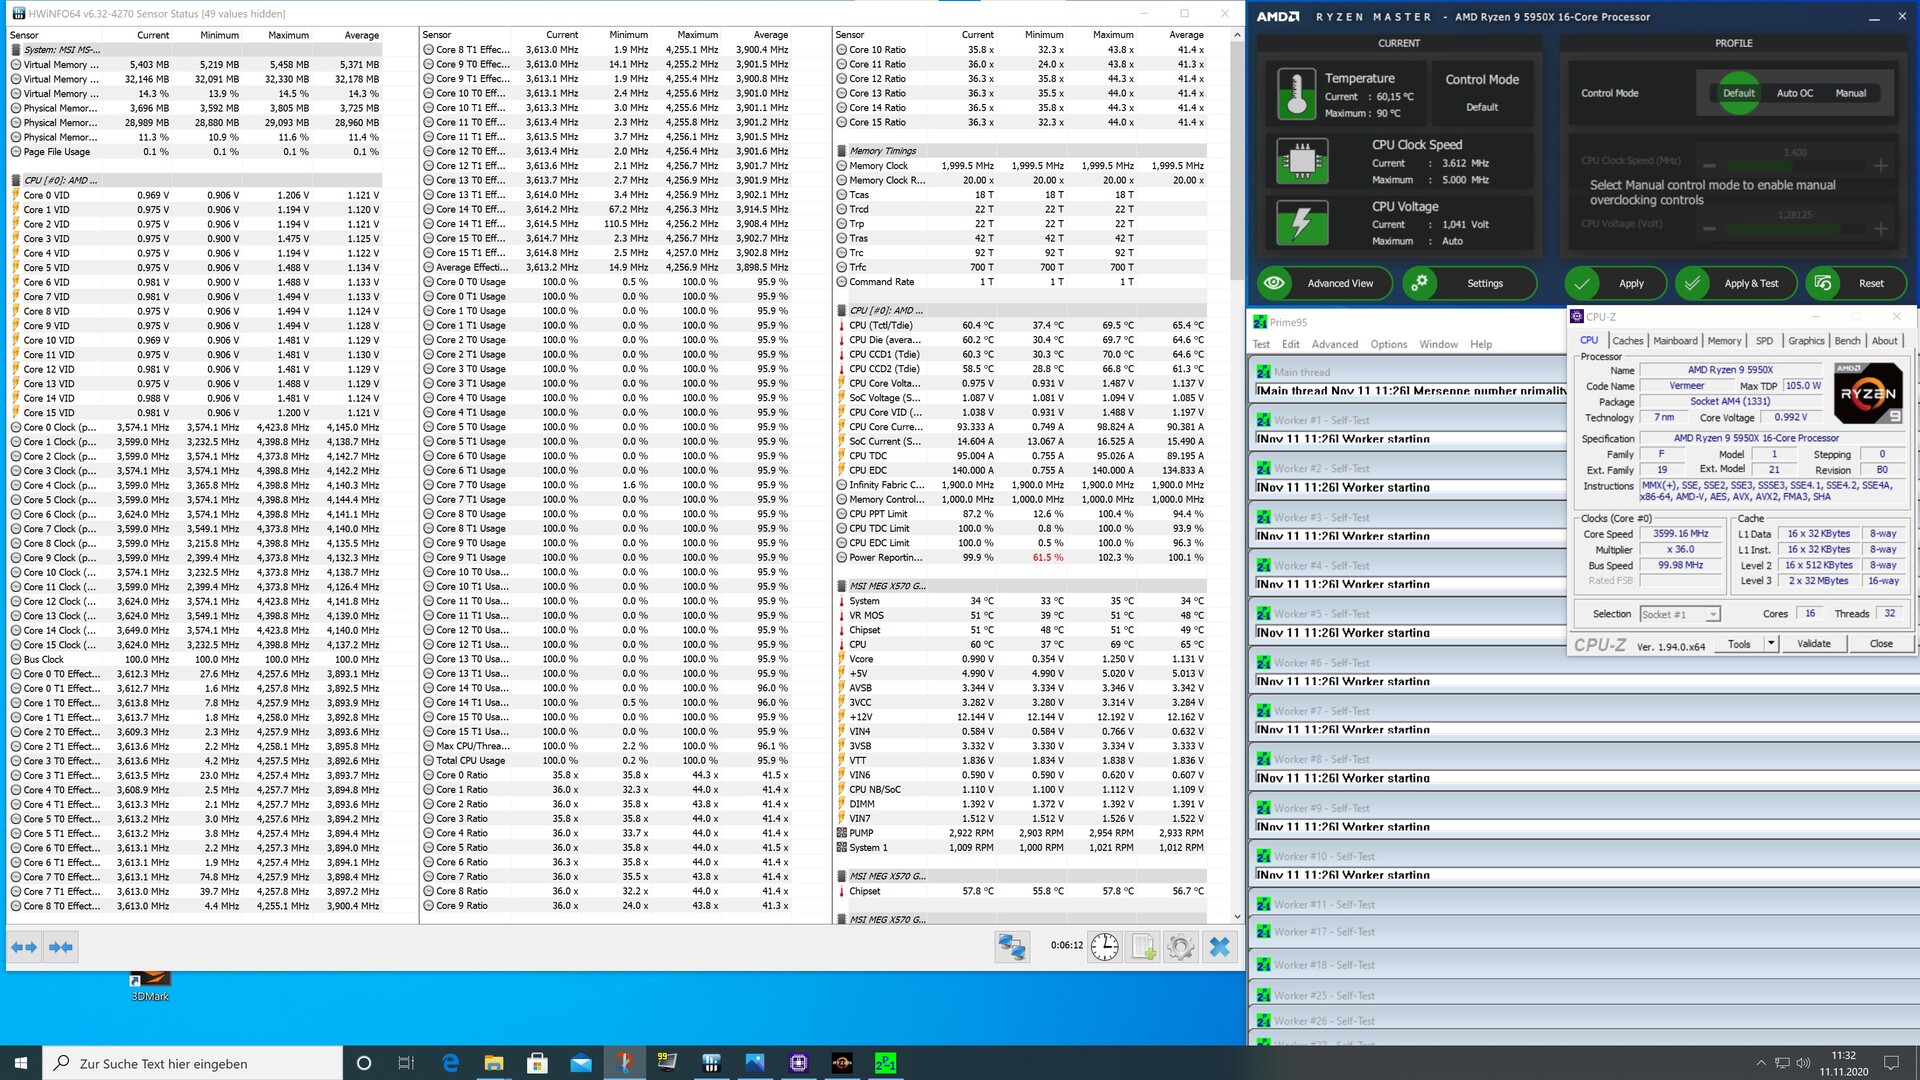
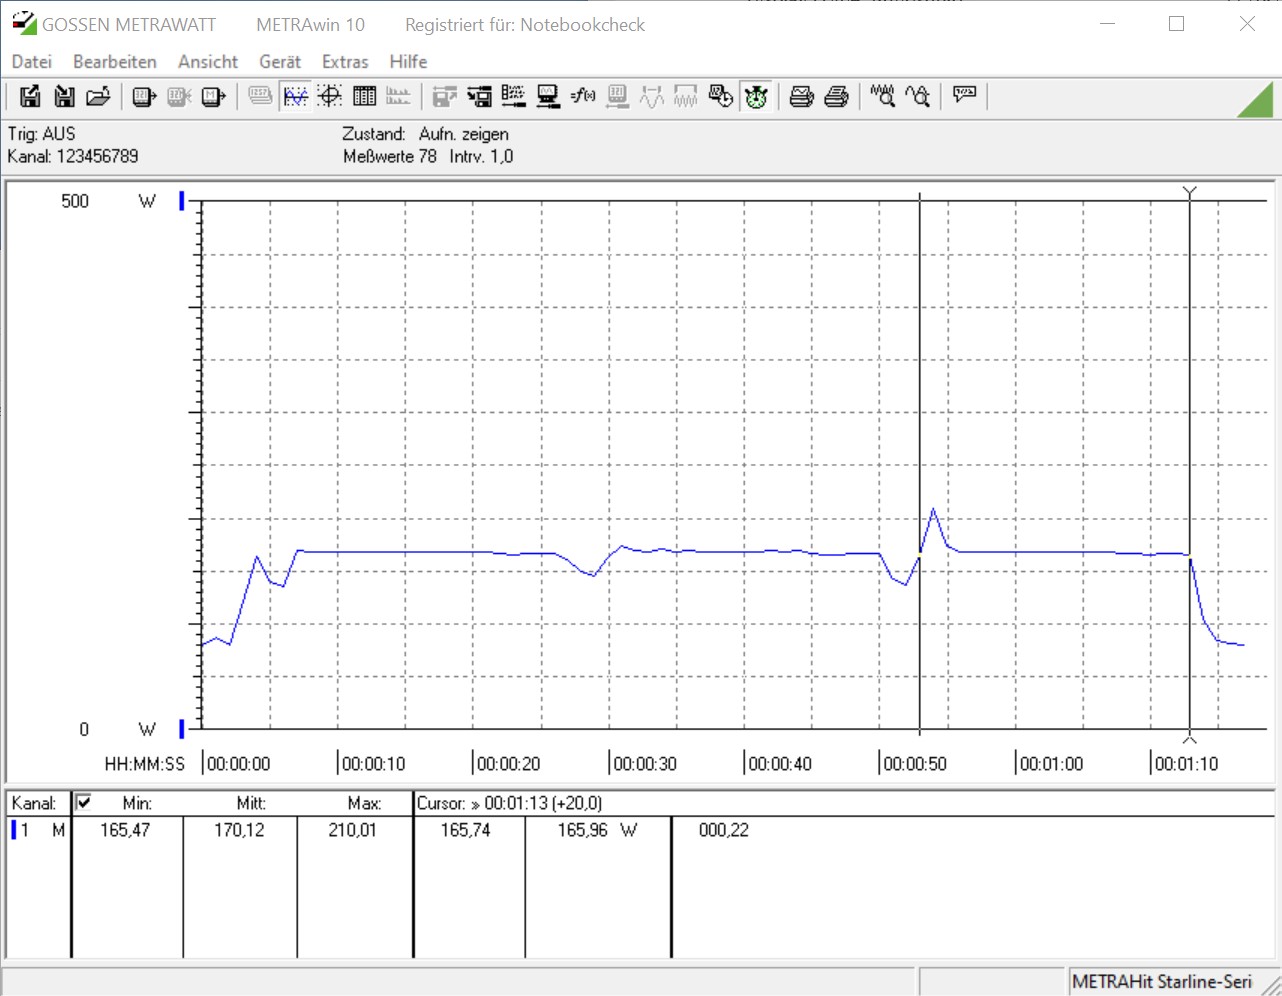
Sans charge, il n'y a pas de changement par rapport aux deux autres processeurs Vermeer, et nous mesurons un peu moins de 80 watts entre la prise de courant et l'alimentation avec notre appareil de mesure. Sous charge, la consommation augmente. Dans le multi-test Cinebench R15, nous déterminons 226 watts pour le processeur à 16 cœurs. Avec le Ryzen 5 5600X, la consommation du système de test se situe à 170 watts dans le même test. C'est un bon résultat pour les deux candidats. Dans les jeux, le Ryzen 9 5950X d'AMD est en tête du peloton avec 440 watts. Cependant, à 439 watts, notre système de test avec l'AMD Ryzen 5 5900X n'est pas beaucoup plus frugal. Avec l'AMD Ryzen 5 5600X, la consommation d'énergie diminue légèrement d'environ 30 watts. Cependant, à pleine charge, vous devez également calculer environ 280 watts pour la carte graphique, qui joue toujours un rôle pendant le test de jeu.
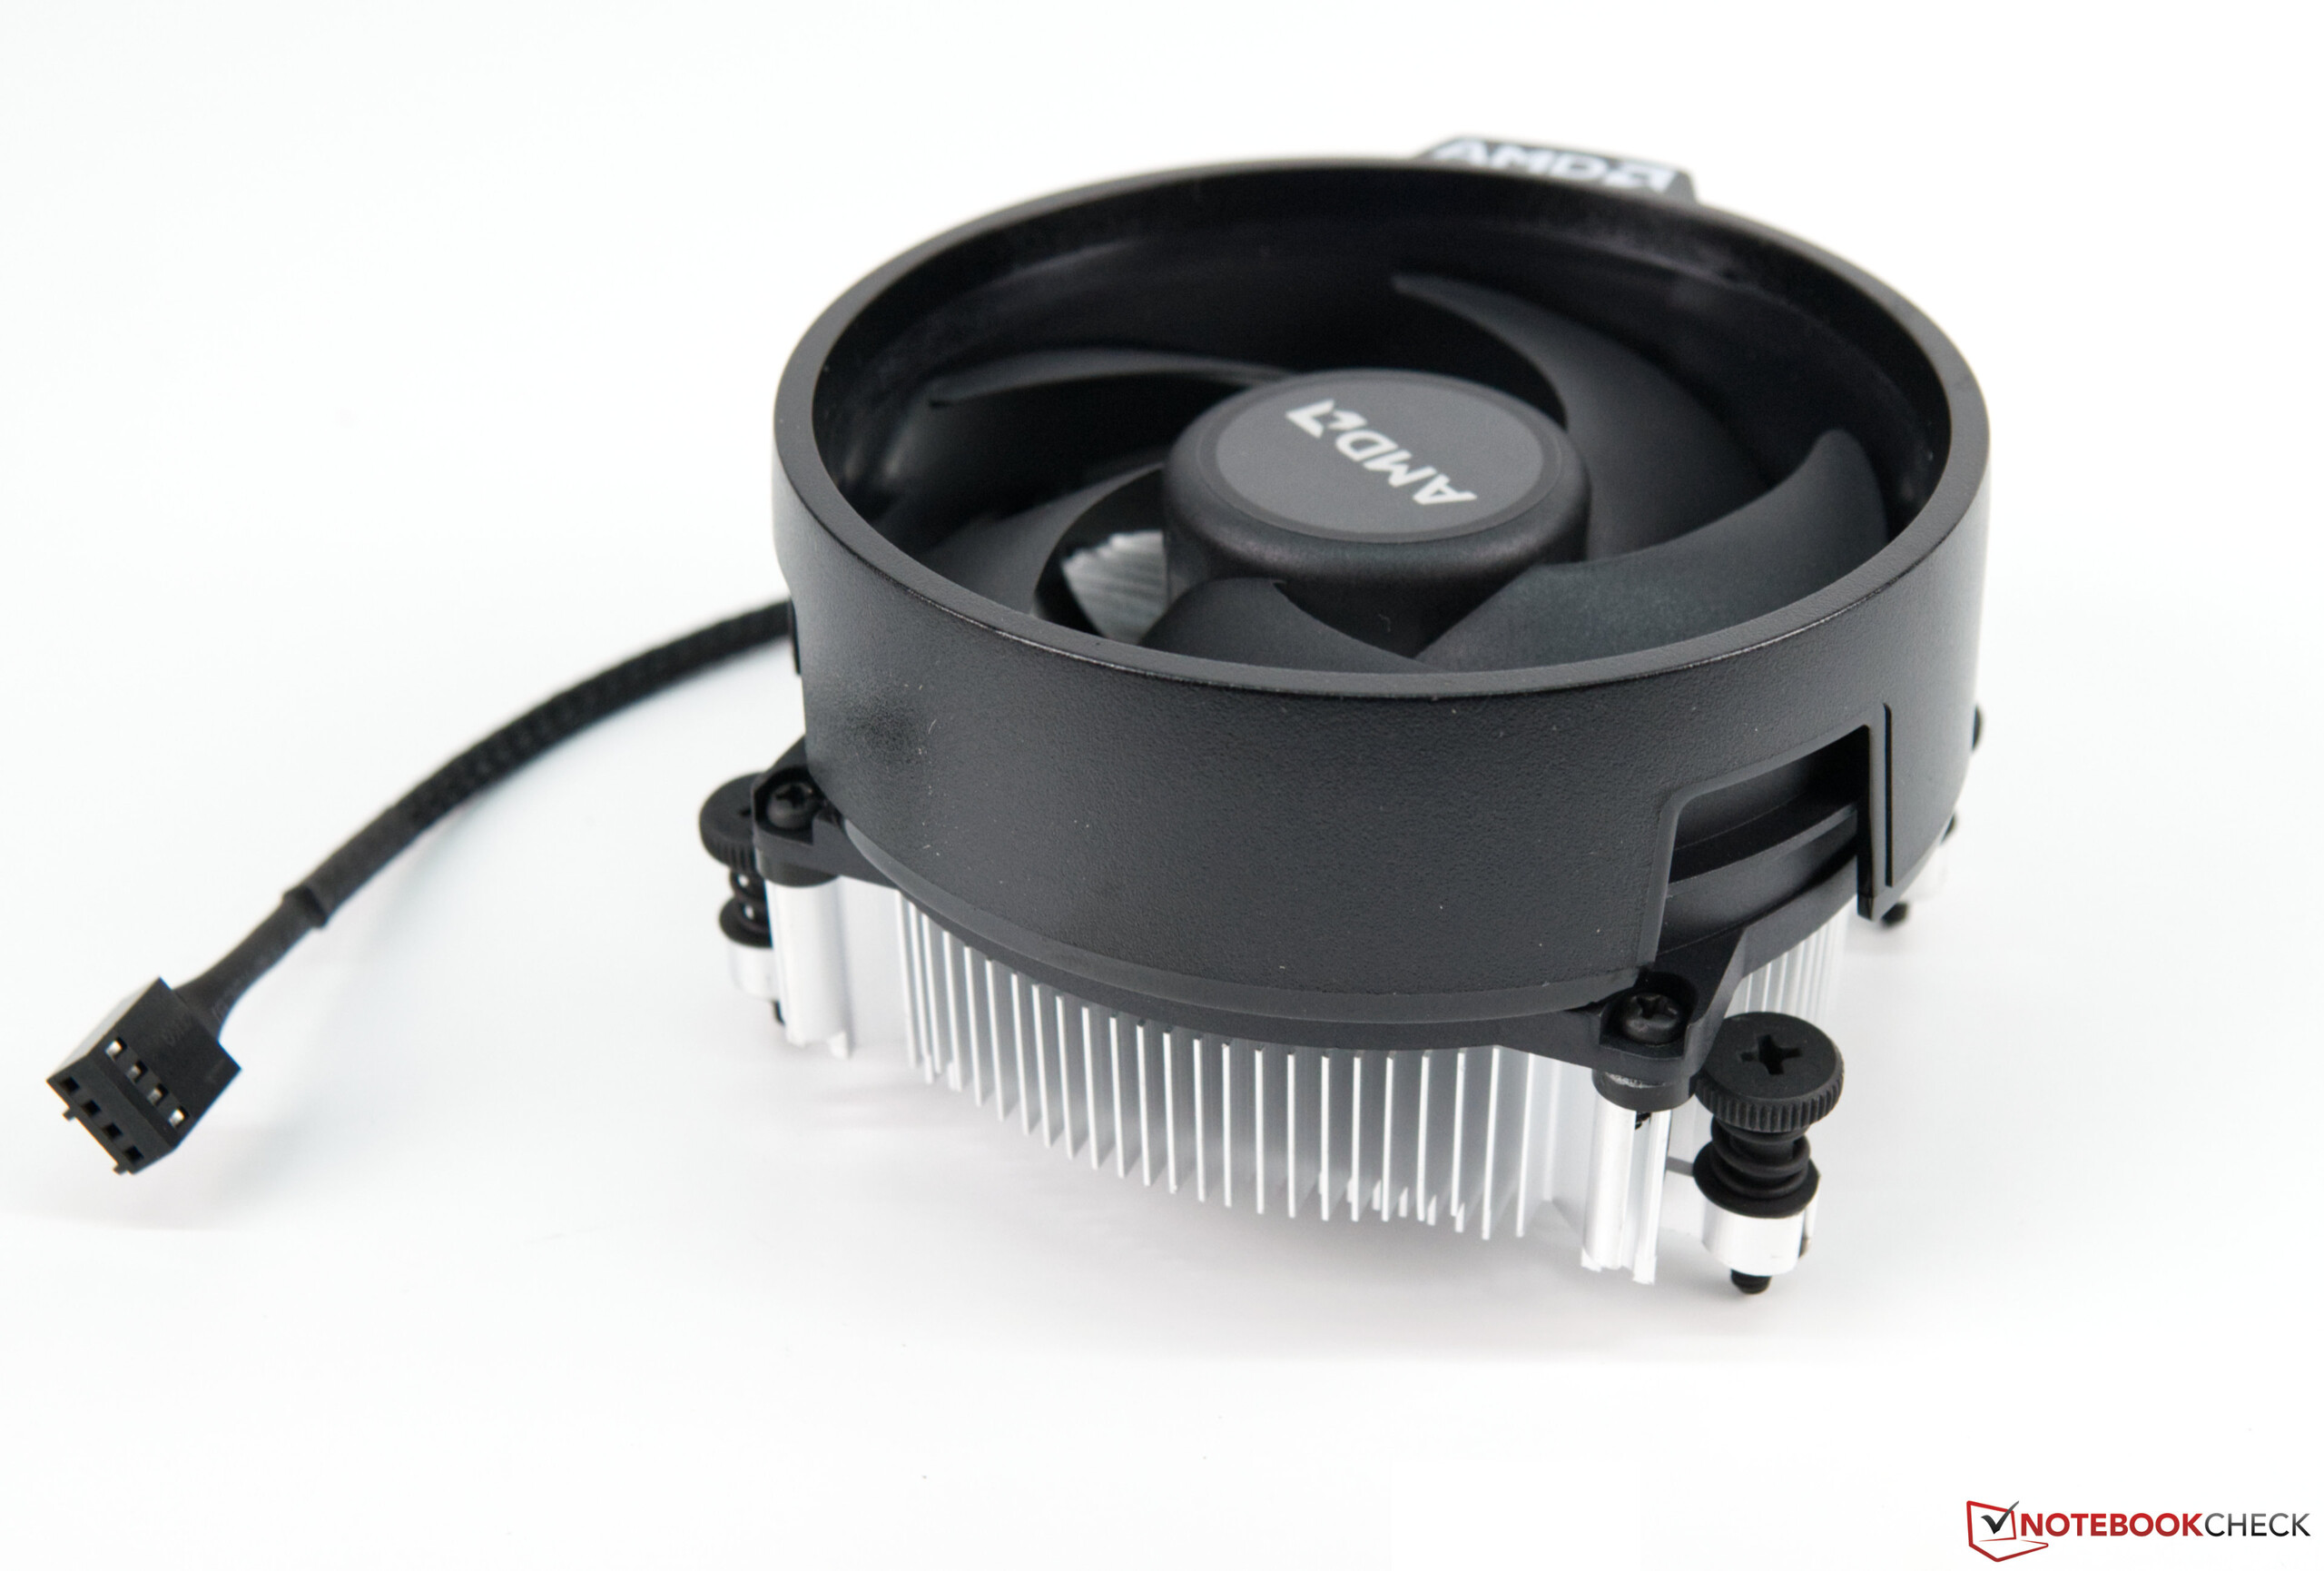
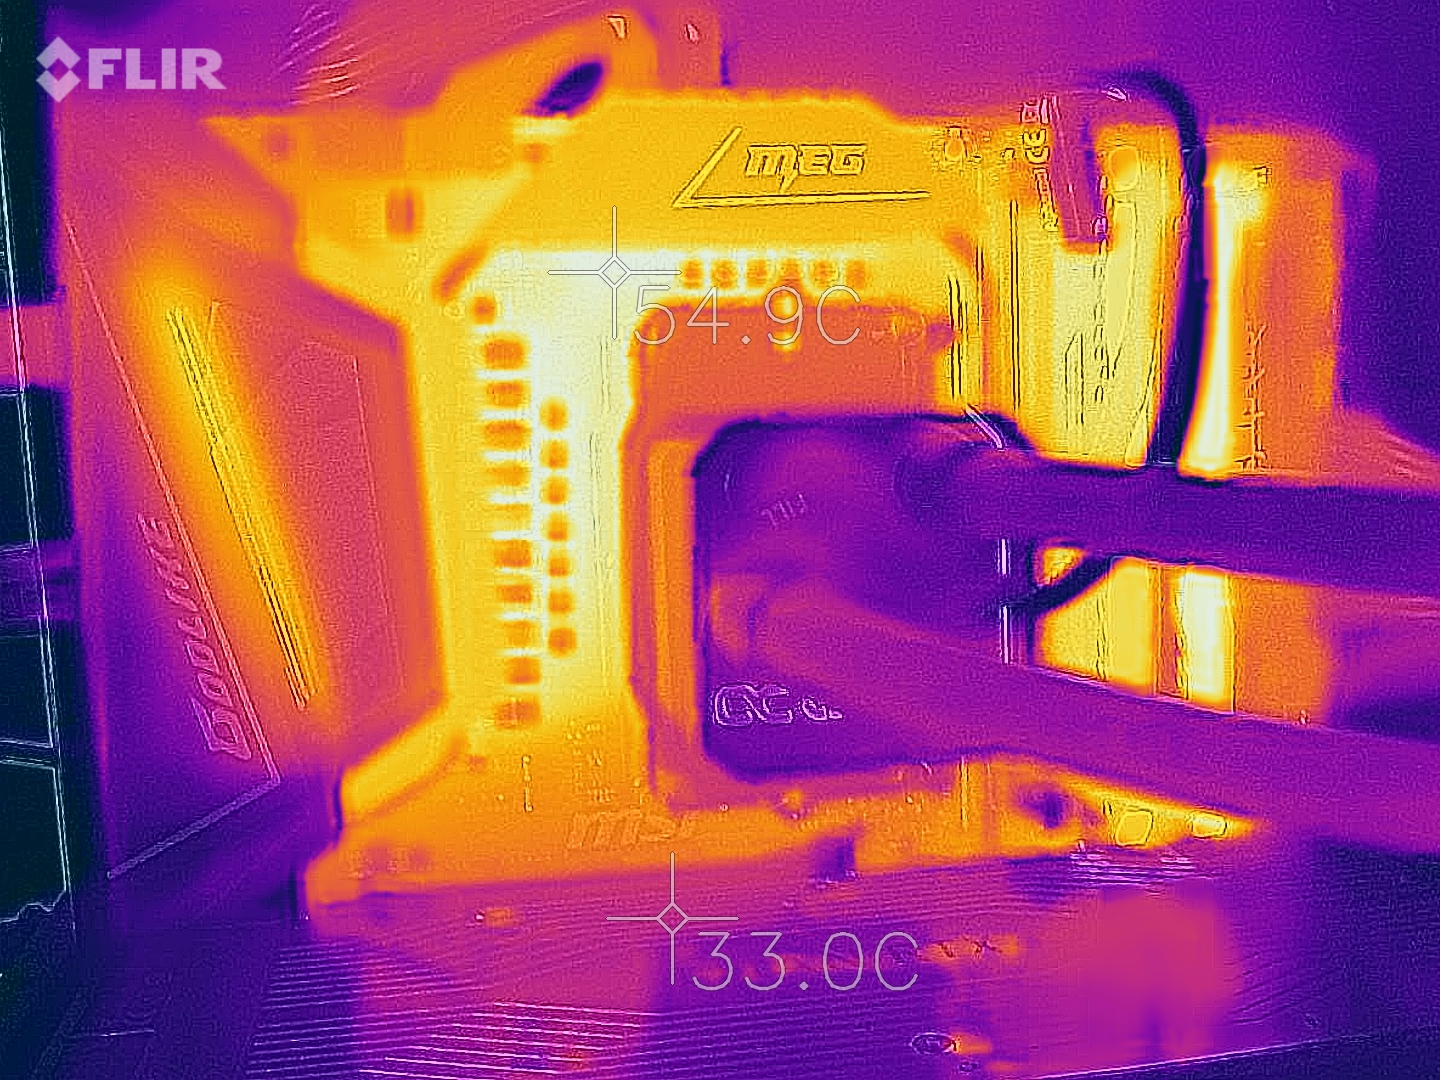
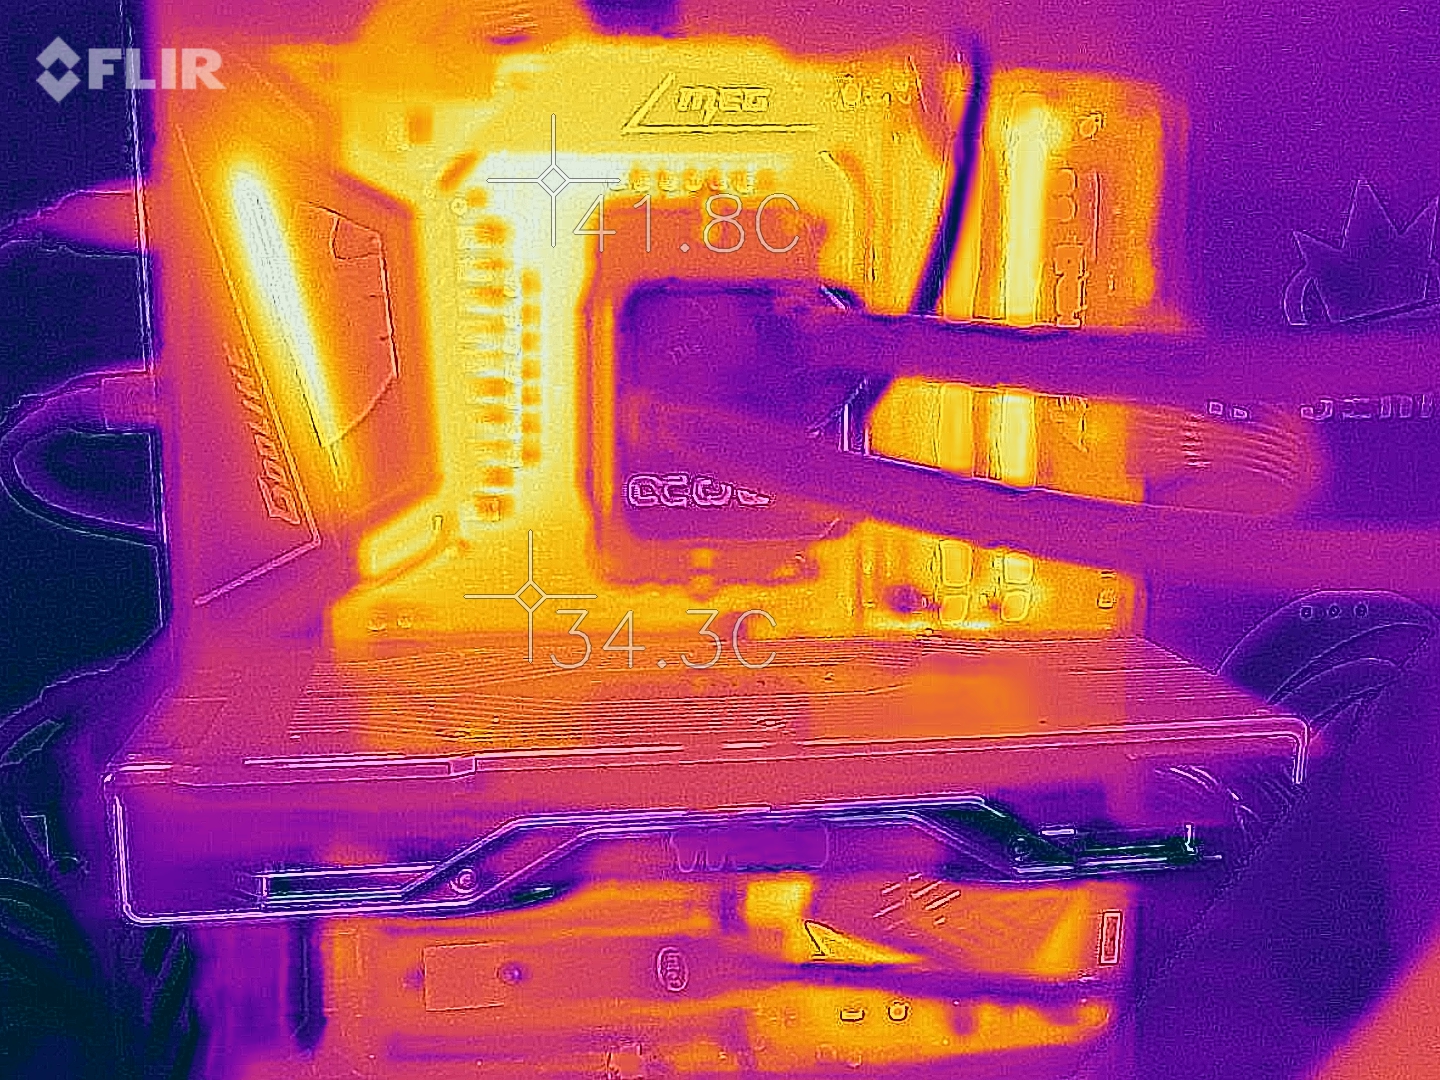
Il n'y a aucune inquiétude à avoir quant aux températures. Lors du test de stress, le Ryzen 9 5950X a atteint à peine 70 °C, alors que le Ryzen 5 5600X est resté légèrement plus froid à près de 66 °C. L'AiO d'Alphacool qui a été utilisé n'a donc aucun problème pour maintenir le modèle haut de gamme au frais de manière fiable. AMD comprend un petit refroidisseur en boîte avec le Ryzen 5 5600X.
AMD Ryzen 9 5950X
AMD Ryzen 5 5600X
| Power Consumption / The Witcher 3 ultra (external Monitor) | |
| AMD Ryzen 9 5950X, NVIDIA Titan RTX (Idle: 78 W) | |
| AMD Ryzen 9 5900X, NVIDIA Titan RTX (Idle: 78.1 W) | |
| AMD Ryzen 7 2700X, NVIDIA Titan RTX | |
| AMD Ryzen 9 3950X, NVIDIA Titan RTX (Idle: 95 W) | |
| AMD Ryzen 9 3900X, NVIDIA Titan RTX (Idle: 87.4 W) | |
| AMD Ryzen 7 5800X, NVIDIA Titan RTX (Idle: 77.5 W) | |
| AMD Ryzen 7 3800XT, NVIDIA Titan RTX (Idle: 96.1 W) | |
| AMD Ryzen 5 5600X, NVIDIA Titan RTX (Idle: 79.23 W) | |
| AMD Ryzen 5 1600, NVIDIA Titan RTX (Idle: 85.9 W) | |
| Intel Core i7-10700K, NVIDIA Titan RTX (Idle: 67.7 W) | |
| AMD Ryzen 3 3300X, NVIDIA Titan RTX (Idle: 88.8 W) | |
| Intel Core i9-10900K, NVIDIA Titan RTX (Idle: 52.3 W) | |
| AMD Ryzen 3 3100, NVIDIA Titan RTX (Idle: 86 W) | |
| Power Consumption / Prime95 V2810 Stress (external Monitor) | |
| Intel Core i9-10900K, NVIDIA Titan RTX (Idle: 52.3 W) | |
| AMD Ryzen 9 5950X, NVIDIA Titan RTX (Idle: 78 W) | |
| AMD Ryzen 7 5800X, NVIDIA Titan RTX (Idle: 77.5 W) | |
| AMD Ryzen 9 5900X, NVIDIA Titan RTX (Idle: 78.1 W) | |
| Intel Core i7-10700K, NVIDIA Titan RTX (Idle: 67.7 W) | |
| AMD Ryzen 9 3950X, NVIDIA Titan RTX (Idle: 95 W) | |
| AMD Ryzen 9 3900X, NVIDIA Titan RTX (Idle: 87.4 W) | |
| AMD Ryzen 7 3800XT, NVIDIA Titan RTX (Idle: 96.1 W) | |
| AMD Ryzen 5 1600, NVIDIA Titan RTX (Idle: 85.9 W) | |
| AMD Ryzen 5 5600X, NVIDIA Titan RTX (Idle: 79.23 W) | |
| AMD Ryzen 3 3300X, NVIDIA Titan RTX (Idle: 88.8 W) | |
| AMD Ryzen 3 3100, NVIDIA Titan RTX (Idle: 86 W) | |
| Power Consumption / Cinebench R15 Multi (external Monitor) | |
| Intel Core i9-10900K, NVIDIA Titan RTX (Idle: 52.3 W) | |
| AMD Ryzen 9 5900X, NVIDIA Titan RTX (Idle: 78.1 W) | |
| AMD Ryzen 9 5950X, NVIDIA Titan RTX (Idle: 78 W) | |
| AMD Ryzen 7 5800X, NVIDIA Titan RTX (Idle: 77.5 W) | |
| AMD Ryzen 9 3950X, NVIDIA Titan RTX (Idle: 95 W) | |
| AMD Ryzen 9 3900X, NVIDIA Titan RTX (Idle: 87.4 W) | |
| Intel Core i7-10700K, NVIDIA Titan RTX (Idle: 67.7 W) | |
| AMD Ryzen 7 3800XT, NVIDIA Titan RTX (Idle: 96.1 W) | |
| AMD Ryzen 5 5600X, NVIDIA Titan RTX (Idle: 79.23 W) | |
| AMD Ryzen 5 1600, NVIDIA Titan RTX (Idle: 85.9 W) | |
| AMD Ryzen 3 3300X, NVIDIA Titan RTX (Idle: 88.8 W) | |
| AMD Ryzen 3 3100, NVIDIA Titan RTX (Idle: 86 W) | |
| Power Consumption / Cinebench R20 Multi (external Monitor) | |
| AMD Ryzen 9 5950X, NVIDIA Titan RTX (78) | |
| AMD Ryzen 5 5600X, NVIDIA Titan RTX (79.23) | |
| Power Consumption / Cinebench R20 Single (external Monitor) | |
| AMD Ryzen 9 5950X, NVIDIA Titan RTX (78) | |
| AMD Ryzen 5 5600X, NVIDIA Titan RTX (79.23) | |
* ... Moindre est la valeur, meilleures sont les performances
Points positifs
Points négatifs
Verdict - AMD Ryzen 5000 très rapide
Après le premier examen de la nouvelle série Ryzen 5000, nous étions déjà positivement surpris par les performances. La faiblesse antérieure des performances du monocoeur par rapport à Intel est une chose du passé depuis l'introduction de la nouvelle famille Ryzen 5000. Même le petit Ryzen 5 5600X est capable de dépasser facilement un Intel Core i9-10900K. En même temps, nous devons attendre de savoir si Intel est capable de contrer avec Rocket Lake
dans un avenir proche.
Mais d'ici là, AMD est capable de porter la couronne du processeur de jeu le plus rapide. Nous l'avons déjà attesté pour l'AMD Ryzen 9 5900X
. L'AMD Ryzen 9 5950X est même capable de faire mieux en termes de performances à fil unique. Cependant, rien d'autre ne peut rivaliser avec l'AMD Ryzen 9 5950X en termes de performances multi-fil. AMD a même clairement déclassé l'AMD Ryzen 9 3950X.
Si vous pouvez parler du prix, le modèle haut de gamme est actuellement coté à 899 euros (~1063 $). C'est 100 euros (~118 $) de plus que le prix de détail recommandé lors de l'introduction, ce qui est dû au manque actuel de disponibilité. Pour le modèle d'entrée de gamme, la disponibilité n'est pas beaucoup plus élevée, ce qui fait que les prix actuels sont beaucoup plus élevés que le prix de détail recommandé de 299 euros (~$353). Ceux qui envisagent d'acheter un nouveau Ryzen 5000 devraient planifier à long terme à ce stade, car il est actuellement trop cher. Une fois que les stocks dans les magasins se seront un peu reconstitués, les prix devraient revenir à des niveaux plus raisonnables. Mais pour l'instant, il y a un problème de disponibilité : les nouvelles cartes graphiques AMD Radeon RX 6800 ne sont pas non plus disponibles, et les cartes GeForce RTX 3000 de Nvidia ne semblent pas non plus avoir changé.
AMD place la barre plus haut pour les processeurs de jeu les plus puissants, et les vitesses d'horloge spécifiées sont presque toujours largement dépassées.
Les chanceux qui pourront encore s'emparer d'un des nouveaux processeurs Ryzen pourront confirmer l'augmentation sensible des performances. Cependant, chacun doit décider lui-même quel processeur lui convient le mieux. S'il s'agit purement d'un jeu, l'AMD Ryzen 5 5600X est suffisant. Mais si vous voulez également faire du traitement vidéo, l'AMD Ryzen 7 5800X sera utile. Et pour les créateurs de contenu, les modèles Ryzen 9 qui peuvent également remplacer un PC de streaming supplémentaire valent la peine d'être achetés.

