Courte critique du PC portable HP ProBook 650 G2
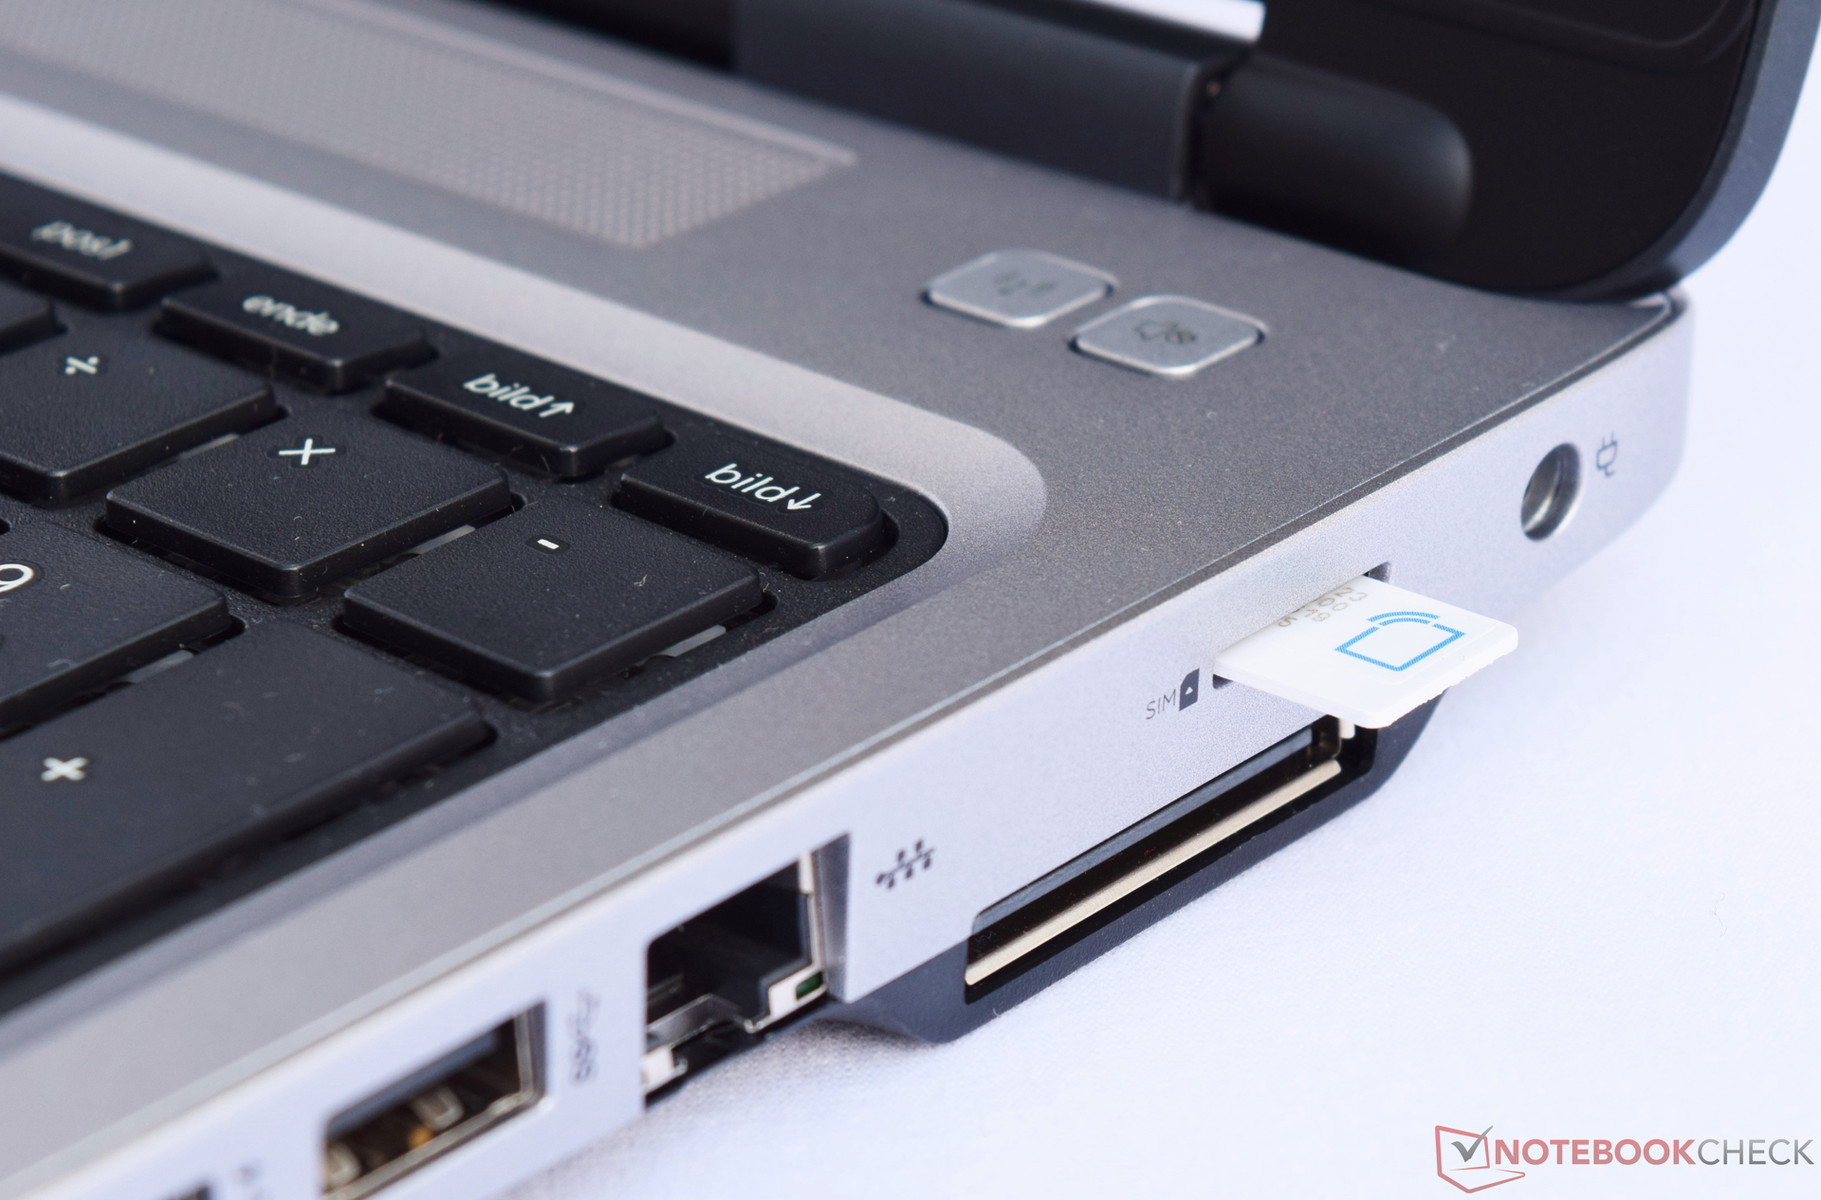
| SD Card Reader | |
| average JPG Copy Test (av. of 3 runs) | |
| Dell Latitude 15 E5570 | |
| Lenovo ThinkPad L560-20F10026GE | |
| Acer TravelMate P658-M-537B | |
| HP ProBook 650 G2-T9X61ET | |
| Toshiba Tecra Z50-C-10P | |
| maximum AS SSD Seq Read Test (1GB) | |
| HP ProBook 650 G2-T9X61ET | |
| Lenovo ThinkPad L560-20F10026GE | |
| Toshiba Tecra Z50-C-10P | |
| Networking | |
| Wi-Fi Client 1m | |
| Wi-Fi Server 1m |
| |||||||||||||||||||||||||
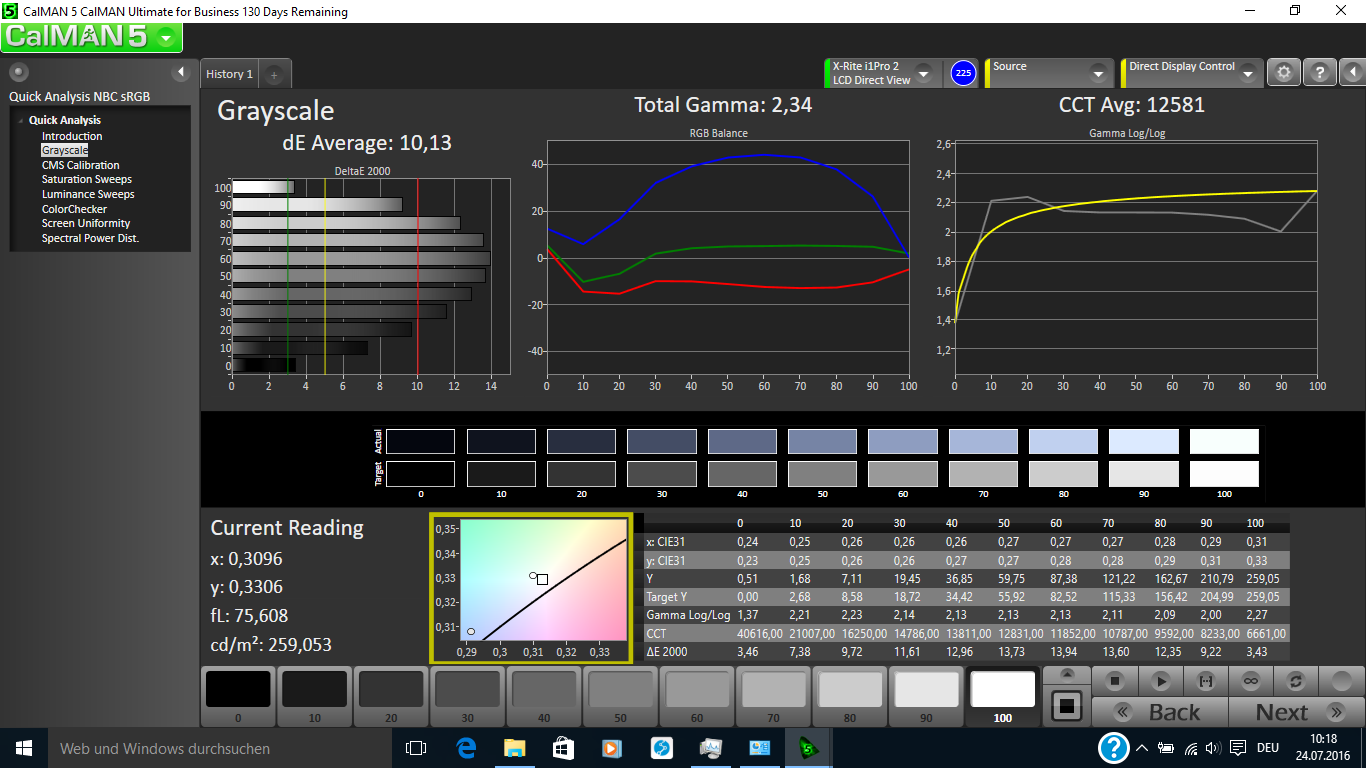
Homogénéité de la luminosité: 85 %
Valeur mesurée au centre, sur batterie: 247 cd/m²
Contraste: 405:1 (Valeurs des noirs: 0.61 cd/m²)
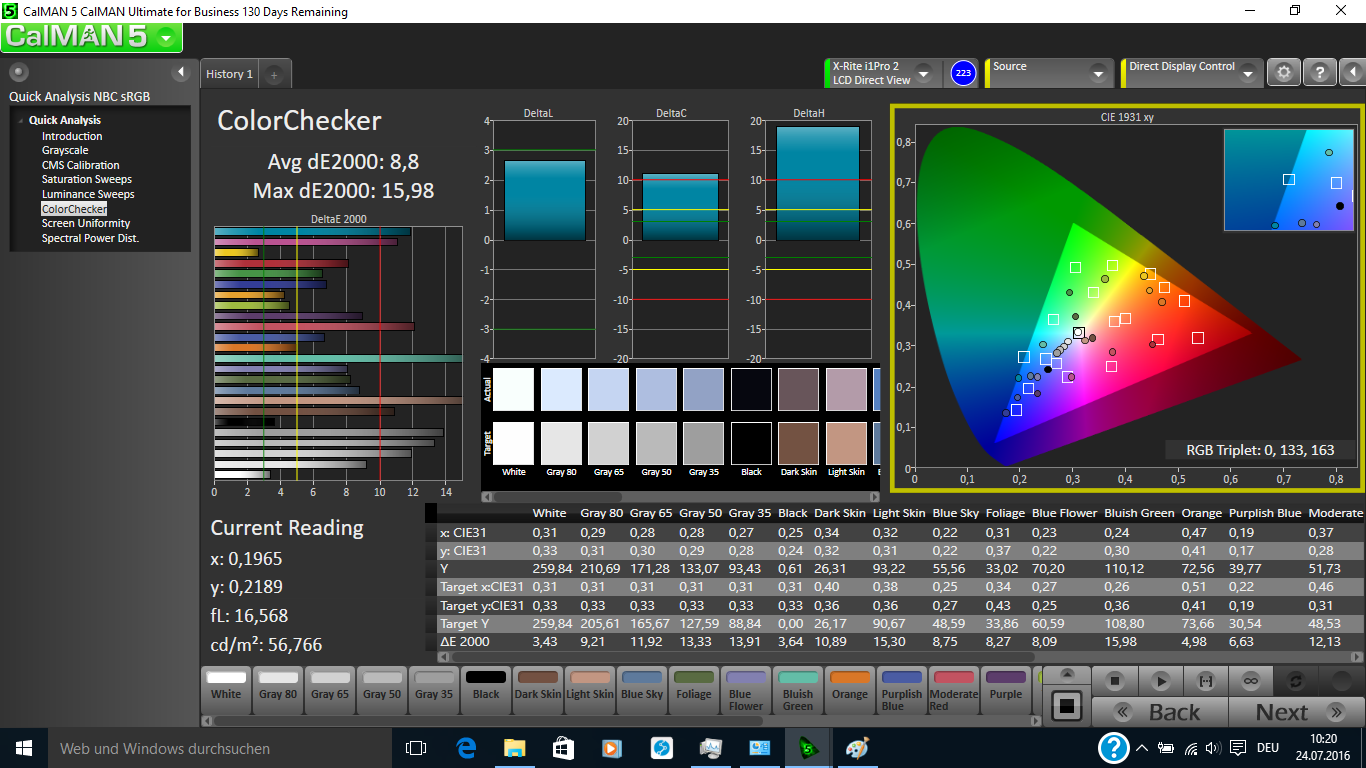
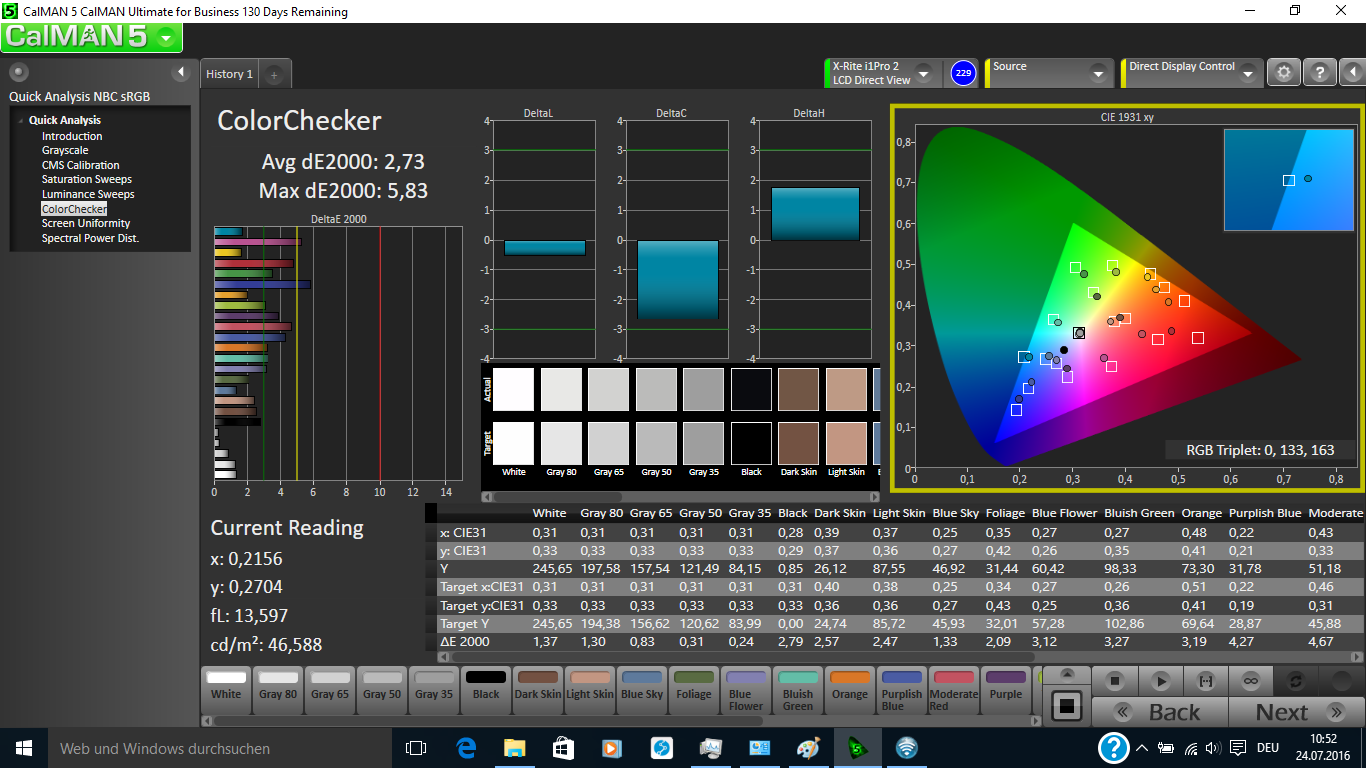
ΔE ColorChecker Calman: 8.8 | ∀{0.5-29.43 Ø4.73}
ΔE Greyscale Calman: 10.13 | ∀{0.09-98 Ø4.97}
62.2% sRGB (Argyll 1.6.3 3D)
39.6% AdobeRGB 1998 (Argyll 1.6.3 3D)
43% AdobeRGB 1998 (Argyll 3D)
62.3% sRGB (Argyll 3D)
41.59% Display P3 (Argyll 3D)
Gamma: 2.34
CCT: 12581 K
| HP ProBook 650 G2-T9X61ET TN LED, 1366x768, 15.6" | Lenovo ThinkPad L560-20F10026GE AH-IPS, 1920x1080, 15.6" | Dell Latitude 15 E5570 TN LED, 1366x768, 15.6" | Toshiba Tecra Z50-C-10P IPS-Panel, 1920x1080, 15.6" | Acer TravelMate P658-M-537B IPS, 1920x1080, 15.6" | HP ProBook 650 G1 H5G74E TN LED, 1366x768, 15.6" | |
|---|---|---|---|---|---|---|
| Display | -6% | -3% | 46% | 48% | ||
| Display P3 Coverage (%) | 41.59 | 39 -6% | 40.48 -3% | 65.4 57% | 66.6 60% | |
| sRGB Coverage (%) | 62.3 | 58.3 -6% | 60.9 -2% | 84.6 36% | 85.7 38% | |
| AdobeRGB 1998 Coverage (%) | 43 | 40.33 -6% | 41.82 -3% | 61.8 44% | 62.8 46% | |
| Response Times | 8% | 0% | 35% | 14% | ||
| Response Time Grey 50% / Grey 80% * (ms) | 40.4 ? | 39.2 ? 3% | 47 ? -16% | 20 ? 50% | 38 ? 6% | |
| Response Time Black / White * (ms) | 32 ? | 28 ? 12% | 27 ? 16% | 26 ? 19% | 25 ? 22% | |
| PWM Frequency (Hz) | 200 ? | 50 ? | ||||
| Screen | 20% | -1% | 50% | 31% | -13% | |
| Brightness middle (cd/m²) | 247 | 262 6% | 228 -8% | 288 17% | 308 25% | 197 -20% |
| Brightness (cd/m²) | 223 | 250 12% | 236 6% | 277 24% | 319 43% | 186 -17% |
| Brightness Distribution (%) | 85 | 92 8% | 90 6% | 83 -2% | 71 -16% | 82 -4% |
| Black Level * (cd/m²) | 0.61 | 0.29 52% | 0.56 8% | 0.27 56% | 0.61 -0% | 0.63 -3% |
| Contrast (:1) | 405 | 903 123% | 407 0% | 1067 163% | 505 25% | 313 -23% |
| Colorchecker dE 2000 * | 8.8 | 8.49 4% | 10.02 -14% | 4.7 47% | 4.51 49% | 10.48 -19% |
| Colorchecker dE 2000 max. * | 15.98 | 17.99 -13% | 15.93 -0% | 11.7 27% | 10.19 36% | |
| Greyscale dE 2000 * | 10.13 | 8.11 20% | 10.66 -5% | 3.1 69% | 2.91 71% | 10.68 -5% |
| Gamma | 2.34 94% | 2.37 93% | 2.48 89% | 2.7 81% | 2.4 92% | 2.31 95% |
| CCT | 12581 52% | 6300 103% | 11800 55% | 6603 98% | 6740 96% | 12387 52% |
| Color Space (Percent of AdobeRGB 1998) (%) | 39.6 | 37.07 -6% | 39 -2% | 61.9 56% | 56 41% | 35.2 -11% |
| Color Space (Percent of sRGB) (%) | 62.2 | 57.94 -7% | 61 -2% | 90.3 45% | 86 38% | |
| Moyenne finale (programmes/paramètres) | 7% /
13% | -1% /
-1% | 44% /
47% | 31% /
32% | -13% /
-13% |
* ... Moindre est la valeur, meilleures sont les performances
Temps de réponse de l'écran
| ↔ Temps de réponse noir à blanc | ||
|---|---|---|
| 32 ms ... hausse ↗ et chute ↘ combinées | ↗ 18.8 ms hausse | 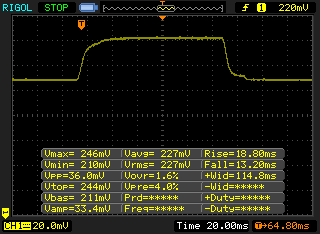 |
| ↘ 13.2 ms chute | ||
| L'écran souffre de latences très élevées, à éviter pour le jeu. En comparaison, tous les appareils testés affichent entre 0.1 (minimum) et 240 (maximum) ms. » 86 % des appareils testés affichent de meilleures performances. Cela signifie que les latences relevées sont moins bonnes que la moyenne (19.9 ms) de tous les appareils testés. | ||
| ↔ Temps de réponse gris 50% à gris 80% | ||
| 40.4 ms ... hausse ↗ et chute ↘ combinées | ↗ 19.6 ms hausse | 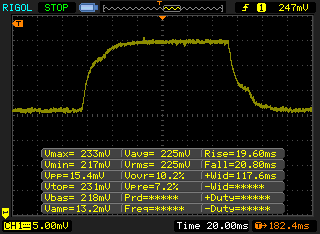 |
| ↘ 20.8 ms chute | ||
| L'écran souffre de latences très élevées, à éviter pour le jeu. En comparaison, tous les appareils testés affichent entre 0.165 (minimum) et 636 (maximum) ms. » 63 % des appareils testés affichent de meilleures performances. Cela signifie que les latences relevées sont moins bonnes que la moyenne (31.1 ms) de tous les appareils testés. | ||
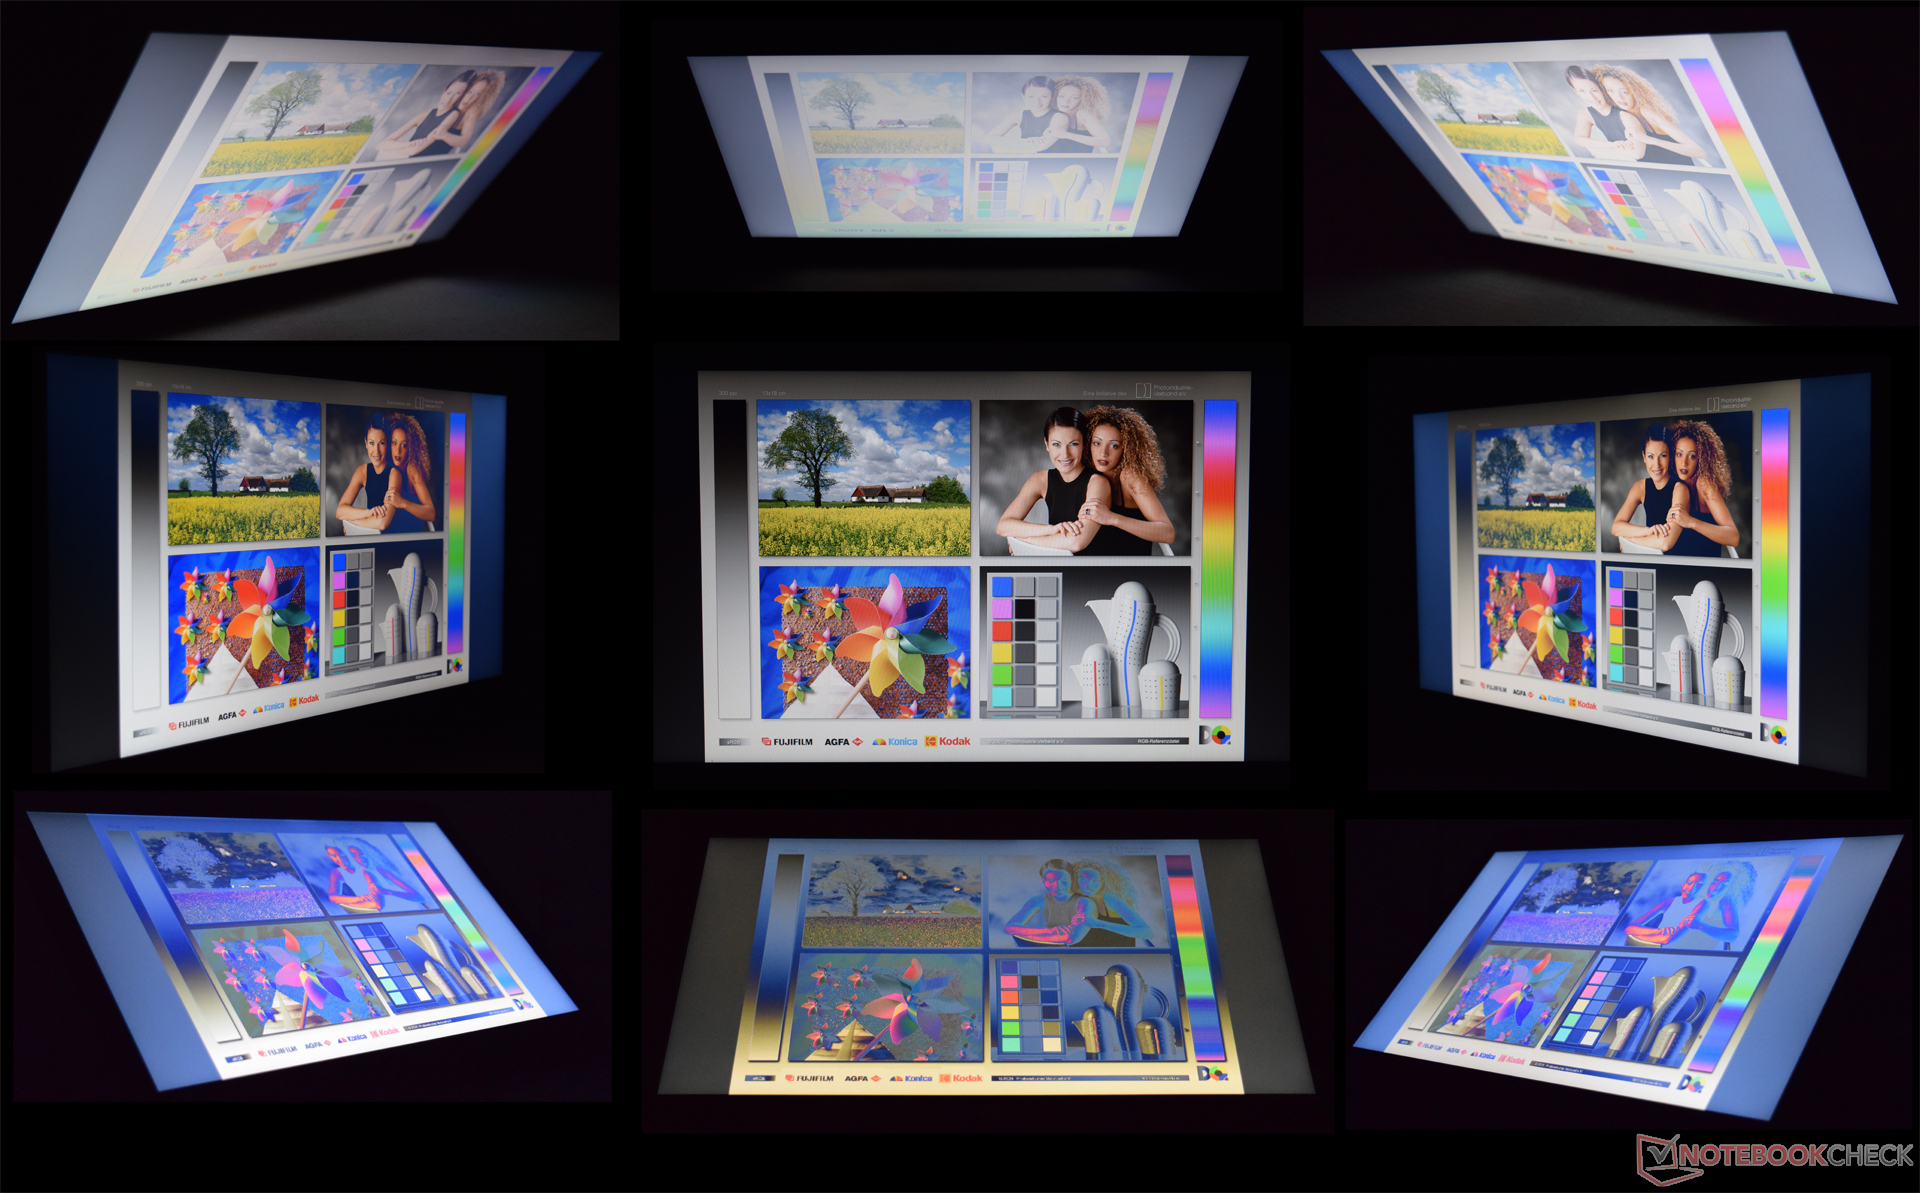
Scintillement / MLI (Modulation de largeur d'impulsion)
| Scintillement / MLI (Modulation de largeur d'impulsion) décelé | 200 Hz | ≤ 90 Niveau de luminosité |  |
Le rétroéclairage de l'écran scintille à la fréquence de 200 Hz (certainement du fait de l'utilisation d'une MDI - Modulation de largeur d'impulsion) à un niveau de luminosité inférieur ou égal à 90 % . Aucun scintillement ne devrait être perceptible au-dessus de cette valeur. La fréquence de rafraîchissement de 200 Hz est relativement faible, les personnes les plus sensibles devraient percevoir un scintillement et être sujettes à une fatigue oculaire accrue (avec le niveau de luminosité indiqué) En comparaison, 52 % des appareils testés n'emploient pas MDI pour assombrir leur écran. Nous avons relevé une moyenne à 7798 (minimum : 5 - maximum : 343500) Hz dans le cas où une MDI était active. | |||
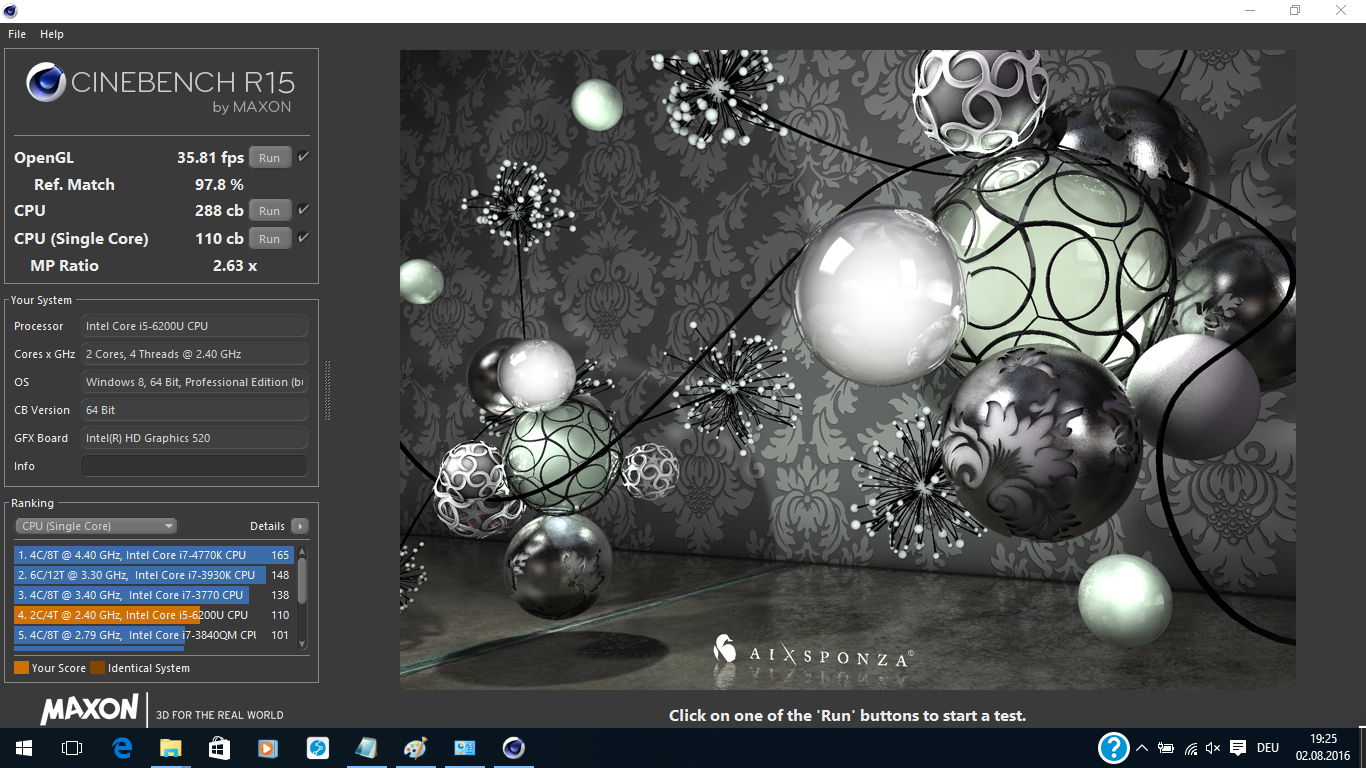
| Cinebench R15 | |
| CPU Single 64Bit | |
| Dell Latitude 15 E5570 | |
| Lenovo ThinkPad L560-20F10026GE | |
| HP ProBook 650 G2-T9X61ET | |
| Toshiba Tecra Z50-C-10P | |
| HP ProBook 650 G1 H5G74E | |
| Acer TravelMate P658-M-537B | |
| CPU Multi 64Bit | |
| Dell Latitude 15 E5570 | |
| Lenovo ThinkPad L560-20F10026GE | |
| HP ProBook 650 G2-T9X61ET | |
| Toshiba Tecra Z50-C-10P | |
| HP ProBook 650 G1 H5G74E | |
| Acer TravelMate P658-M-537B | |
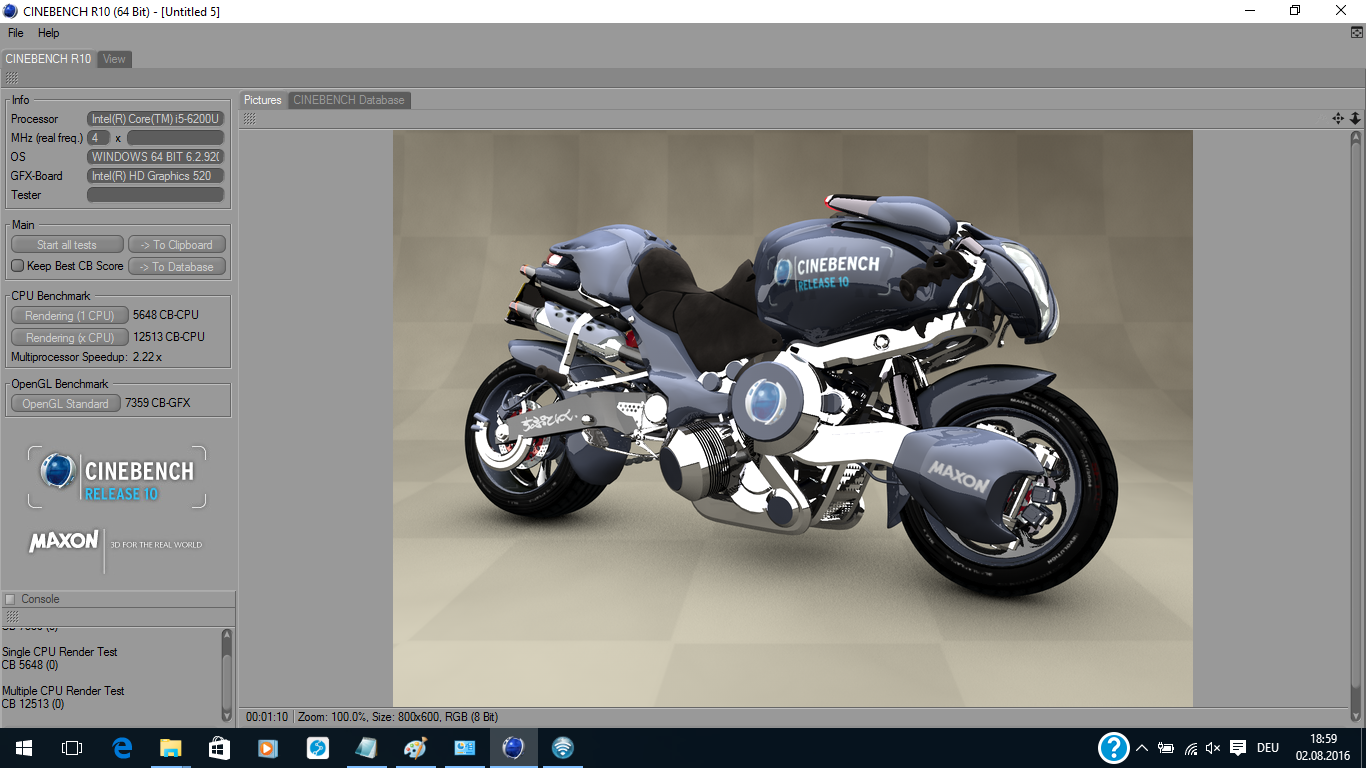
| Cinebench R10 | |
| Rendering Single CPUs 64Bit | |
| HP ProBook 650 G2-T9X61ET | |
| Lenovo ThinkPad L560-20F10026GE | |
| HP ProBook 650 G1 H5G74E | |
| Rendering Multiple CPUs 64Bit | |
| Lenovo ThinkPad L560-20F10026GE | |
| HP ProBook 650 G2-T9X61ET | |
| HP ProBook 650 G1 H5G74E | |
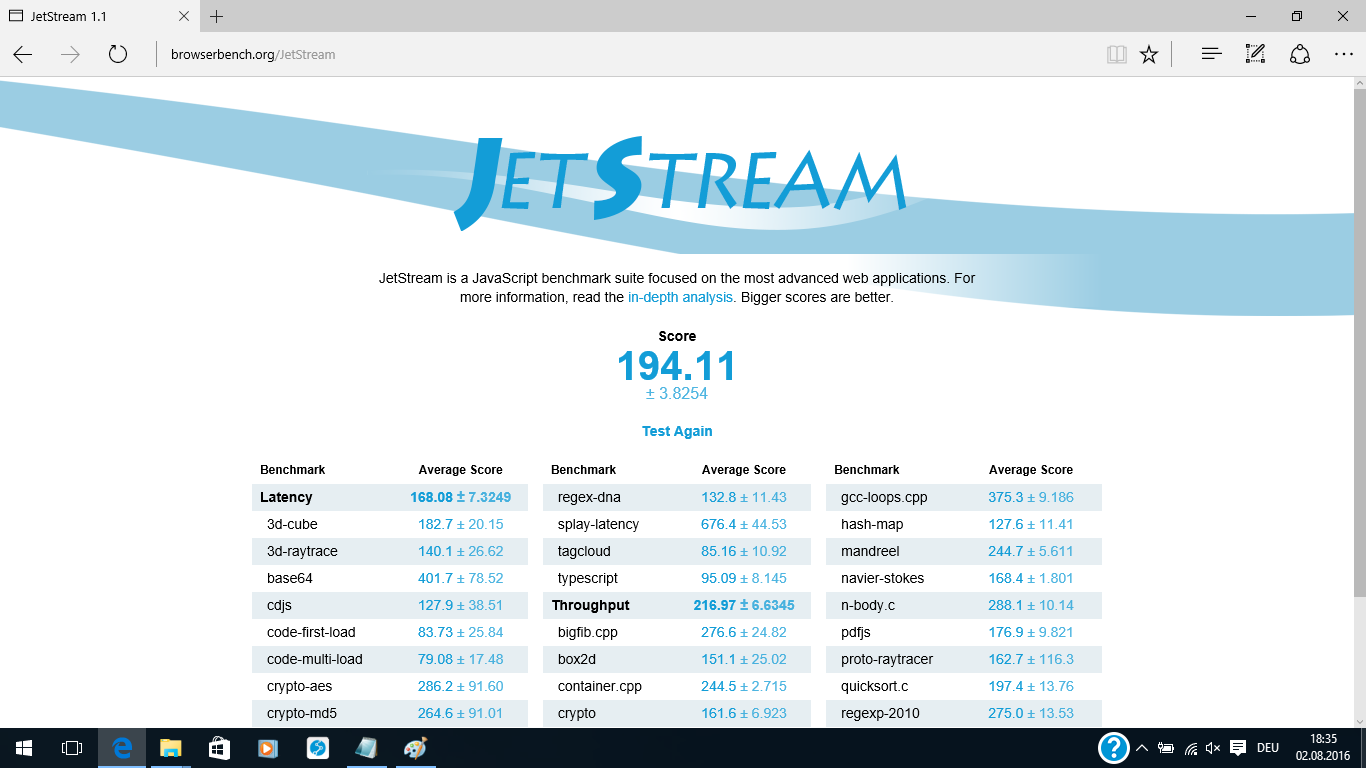
| JetStream 1.1 - 1.1 Total | |
| HP ProBook 650 G2-T9X61ET | |
| Dell Latitude 15 E5570 | |
| Lenovo ThinkPad L560-20F10026GE | |
| Toshiba Tecra Z50-C-10P | |
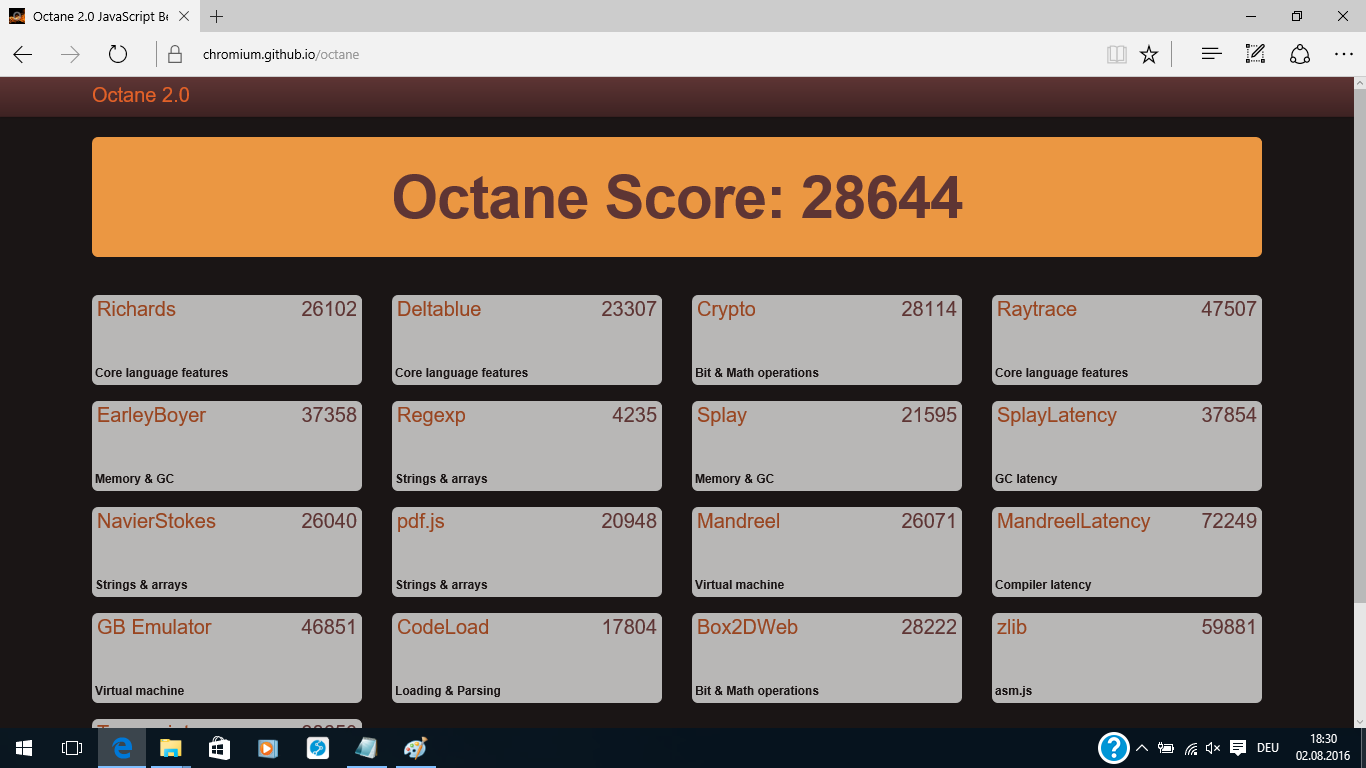
| Octane V2 - Total Score | |
| HP ProBook 650 G2-T9X61ET | |
| Dell Latitude 15 E5570 | |
| Lenovo ThinkPad L560-20F10026GE | |
| Acer TravelMate P658-M-537B | |
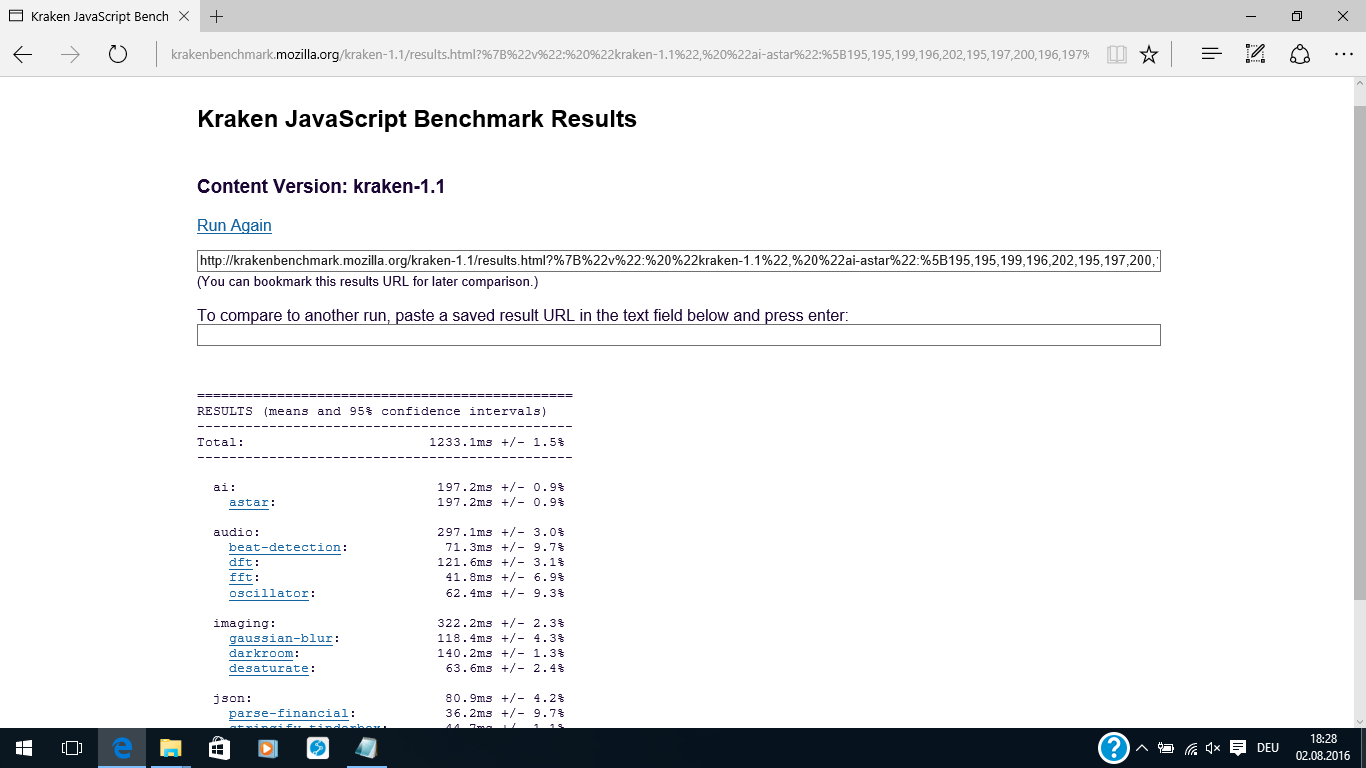
| Mozilla Kraken 1.1 - Total | |
| Acer TravelMate P658-M-537B | |
| Lenovo ThinkPad L560-20F10026GE | |
| Dell Latitude 15 E5570 | |
| HP ProBook 650 G2-T9X61ET | |
* ... Moindre est la valeur, meilleures sont les performances
| PCMark 8 | |
| Home Score Accelerated v2 | |
| Acer TravelMate P658-M-537B | |
| Dell Latitude 15 E5570 | |
| HP ProBook 650 G2-T9X61ET | |
| Toshiba Tecra Z50-C-10P | |
| Lenovo ThinkPad L560-20F10026GE | |
| Work Score Accelerated v2 | |
| Acer TravelMate P658-M-537B | |
| Dell Latitude 15 E5570 | |
| HP ProBook 650 G2-T9X61ET | |
| Lenovo ThinkPad L560-20F10026GE | |
| Toshiba Tecra Z50-C-10P | |
| Creative Score Accelerated v2 | |
| HP ProBook 650 G2-T9X61ET | |
| Dell Latitude 15 E5570 | |
| Lenovo ThinkPad L560-20F10026GE | |
| PCMark Vantage Result | 8328 points | |
| PCMark 7 Score | 2988 points | |
| PCMark 8 Home Score Accelerated v2 | 3229 points | |
| PCMark 8 Creative Score Accelerated v2 | 3649 points | |
| PCMark 8 Work Score Accelerated v2 | 4191 points | |
Aide | ||
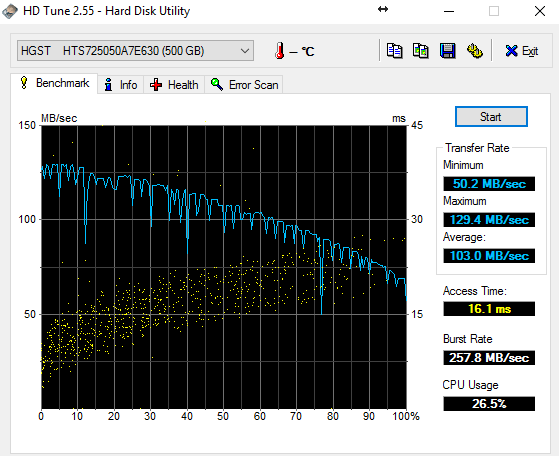
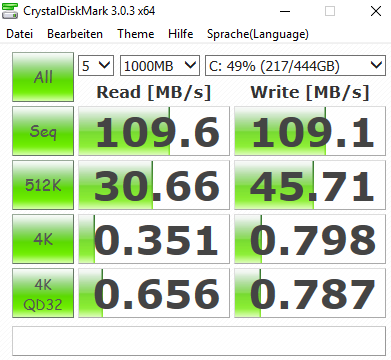
| HP ProBook 650 G2-T9X61ET Hitachi Travelstar Z7K500 HTS725050A7E630 | Lenovo ThinkPad L560-20F10026GE WDC Slim WD10SPCX-21KHST0 | Dell Latitude 15 E5570 Samsung SSD PM871 MZ7LN128HCHP | Toshiba Tecra Z50-C-10P Toshiba HG6 THNSNJ256G8NU | Acer TravelMate P658-M-537B Kingston RBU-SNS8152S3256GG2 | |
|---|---|---|---|---|---|
| CrystalDiskMark 3.0 | 33% | 11784% | 3372% | 9846% | |
| Read Seq (MB/s) | 109.6 | 113.6 4% | 474.7 333% | 512 367% | 479.1 337% |
| Write Seq (MB/s) | 109.1 | 111.7 2% | 155 42% | 415.8 281% | 333.1 205% |
| Read 512 (MB/s) | 30.66 | 39.65 29% | 393.6 1184% | 404.4 1219% | 418 1263% |
| Write 512 (MB/s) | 45.71 | 55.3 21% | 119.7 162% | 382.2 736% | 320.5 601% |
| Read 4k (MB/s) | 0.351 | 0.488 39% | 34 9587% | 24.05 6752% | 25.66 7211% |
| Write 4k (MB/s) | 0.798 | 1.022 28% | 96.6 12005% | 87.6 10877% | 64.7 8008% |
| Read 4k QD32 (MB/s) | 0.656 | 1.367 108% | 383.3 58330% | 226.2 34382% | |
| Write 4k QD32 (MB/s) | 0.787 | 1.036 32% | 100.2 12632% | 211.4 26761% |

| 3DMark | |
| 1280x720 Cloud Gate Standard Graphics | |
| Acer TravelMate P658-M-537B | |
| Dell Latitude 15 E5570 | |
| HP ProBook 650 G2-T9X61ET | |
| Lenovo ThinkPad L560-20F10026GE | |
| Toshiba Tecra Z50-C-10P | |
| HP ProBook 650 G1 H5G74E | |
| 1920x1080 Fire Strike Graphics | |
| Dell Latitude 15 E5570 | |
| HP ProBook 650 G2-T9X61ET | |
| Lenovo ThinkPad L560-20F10026GE | |
| Toshiba Tecra Z50-C-10P | |
| HP ProBook 650 G1 H5G74E | |
| 1280x720 Ice Storm Standard Score | |
| Acer TravelMate P658-M-537B | |
| Dell Latitude 15 E5570 | |
| HP ProBook 650 G2-T9X61ET | |
| Lenovo ThinkPad L560-20F10026GE | |
| HP ProBook 650 G1 H5G74E | |
| Toshiba Tecra Z50-C-10P | |
| 3DMark 11 | |
| 1280x720 Performance GPU | |
| Acer TravelMate P658-M-537B | |
| HP ProBook 650 G2-T9X61ET | |
| Dell Latitude 15 E5570 | |
| Lenovo ThinkPad L560-20F10026GE | |
| Toshiba Tecra Z50-C-10P | |
| HP ProBook 650 G1 H5G74E | |
| 1280x720 Performance | |
| Acer TravelMate P658-M-537B | |
| Dell Latitude 15 E5570 | |
| HP ProBook 650 G2-T9X61ET | |
| Lenovo ThinkPad L560-20F10026GE | |
| Toshiba Tecra Z50-C-10P | |
| HP ProBook 650 G1 H5G74E | |
| 3DMark 06 - 1280x1024 Standard Score AA:0x AF:0x | |
| HP ProBook 650 G2-T9X61ET | |
| HP ProBook 650 G1 H5G74E | |
| 3DMark 2001SE Standard | 20229 points | |
| 3DMark 03 Standard | 15594 points | |
| 3DMark 05 Standard | 11700 points | |
| 3DMark 06 Standard Score | 8423 points | |
| 3DMark 11 Performance | 1414 points | |
| 3DMark Ice Storm Standard Score | 47002 points | |
| 3DMark Cloud Gate Standard Score | 5045 points | |
| 3DMark Fire Strike Score | 677 points | |
| 3DMark Fire Strike Extreme Score | 317 points | |
Aide | ||
| Bas | Moyen | Élevé | Ultra | |
|---|---|---|---|---|
| BioShock Infinite (2013) | 36.4 | 22.3 | 18.5 | |
| Battlefield 4 (2013) | 35.1 | 27.6 | 16.7 | |
| Rise of the Tomb Raider (2016) | 13.5 | 10.1 |
Degré de la nuisance sonore
| Au repos |
| 30.9 / 30.9 / 31.3 dB(A) |
| Disque dur |
| 30.9 dB(A) |
| Fortement sollicité |
| 33.8 / 36.7 dB(A) |
 | ||
30 dB silencieux 40 dB(A) audible 50 dB(A) bruyant |
||
min: | ||
| HP ProBook 650 G2-T9X61ET 6200U, HD Graphics 520, Hitachi Travelstar Z7K500 HTS725050A7E630 | Lenovo ThinkPad L560-20F10026GE 6200U, HD Graphics 520, WDC Slim WD10SPCX-21KHST0 | Dell Latitude 15 E5570 6300U, HD Graphics 520, Samsung SSD PM871 MZ7LN128HCHP | Toshiba Tecra Z50-C-10P 6200U, HD Graphics 520, Toshiba HG6 THNSNJ256G8NU | Acer TravelMate P658-M-537B 6200U, HD Graphics 520, Kingston RBU-SNS8152S3256GG2 | HP ProBook 650 G1 H5G74E 4000M, HD Graphics 4600, Hitachi Travelstar Z7K500 HTS725050A7E630 | |
|---|---|---|---|---|---|---|
| Noise | 3% | -5% | -2% | -9% | -2% | |
| arrêt / environnement * (dB) | 29 | 29.4 -1% | 31.2 -8% | 31.2 -8% | 31.2 -8% | |
| Idle Minimum * (dB) | 30.9 | 30.1 3% | 31.2 -1% | 32.4 -5% | 32.5 -5% | 31.6 -2% |
| Idle Average * (dB) | 30.9 | 30.1 3% | 33.2 -7% | 32.4 -5% | 32.5 -5% | 31.6 -2% |
| Idle Maximum * (dB) | 31.3 | 30.1 4% | 34.3 -10% | 32.4 -4% | 35 -12% | 31.6 -1% |
| Load Average * (dB) | 33.8 | 33.4 1% | 36.6 -8% | 33.5 1% | 42 -24% | 35.6 -5% |
| Load Maximum * (dB) | 36.7 | 34.7 5% | 34.7 5% | 33.5 9% | 37.5 -2% | 36.7 -0% |
* ... Moindre est la valeur, meilleures sont les performances
(+) La température maximale du côté supérieur est de 37.4 °C / 99 F, par rapport à la moyenne de 34.3 °C / 94 F, allant de 21.2 à 62.5 °C pour la classe Office.
(+) Le fond chauffe jusqu'à un maximum de 38.3 °C / 101 F, contre une moyenne de 36.8 °C / 98 F
(+) En utilisation inactive, la température moyenne du côté supérieur est de 28.3 °C / 83 F, par rapport à la moyenne du dispositif de 29.5 °C / 85 F.
(+) Les repose-poignets et le pavé tactile sont plus froids que la température de la peau avec un maximum de 29 °C / 84.2 F et sont donc froids au toucher.
(±) La température moyenne de la zone de l'appui-paume de dispositifs similaires était de 27.5 °C / 81.5 F (-1.5 °C / #-2.7 F).
| HP ProBook 650 G2-T9X61ET | Lenovo ThinkPad L560-20F10026GE | Dell Latitude 15 E5570 | Toshiba Tecra Z50-C-10P | Acer TravelMate P658-M-537B | HP ProBook 650 G1 H5G74E | |
|---|---|---|---|---|---|---|
| Heat | ||||||
| Maximum Upper Side * (°C) | 37.4 | 37.2 1% | 37.3 -0% | 36 4% | 35.2 6% | 32.7 13% |
| Maximum Bottom * (°C) | 38.3 | 36 6% | 41.5 -8% | 50 -31% | 38 1% | 46.1 -20% |
| Idle Upper Side * (°C) | 30.1 | 30.7 -2% | 34.2 -14% | 23.9 21% | 29.5 2% | 27.7 8% |
| Idle Bottom * (°C) | 31.1 | 32.8 -5% | 38.8 -25% | 23.8 23% | 29 7% | 30.5 2% |
* ... Moindre est la valeur, meilleures sont les performances
| Éteint/en veille | |
| Au repos | |
| Fortement sollicité |
|
Légende:
min: | |
| HP ProBook 650 G2-T9X61ET 6200U, HD Graphics 520, Hitachi Travelstar Z7K500 HTS725050A7E630, TN LED, 1366x768, 15.6" | Lenovo ThinkPad L560-20F10026GE 6200U, HD Graphics 520, WDC Slim WD10SPCX-21KHST0, AH-IPS, 1920x1080, 15.6" | Dell Latitude 15 E5570 6300U, HD Graphics 520, Samsung SSD PM871 MZ7LN128HCHP, TN LED, 1366x768, 15.6" | Toshiba Tecra Z50-C-10P 6200U, HD Graphics 520, Toshiba HG6 THNSNJ256G8NU, IPS-Panel, 1920x1080, 15.6" | Acer TravelMate P658-M-537B 6200U, HD Graphics 520, Kingston RBU-SNS8152S3256GG2, IPS, 1920x1080, 15.6" | HP ProBook 650 G1 H5G74E 4000M, HD Graphics 4600, Hitachi Travelstar Z7K500 HTS725050A7E630, TN LED, 1366x768, 15.6" | |
|---|---|---|---|---|---|---|
| Power Consumption | -8% | -3% | -11% | -40% | -21% | |
| Idle Minimum * (Watt) | 4.6 | 5 -9% | 4.5 2% | 4.7 -2% | 6.6 -43% | 4.6 -0% |
| Idle Average * (Watt) | 6.8 | 7.9 -16% | 7.6 -12% | 8 -18% | 10.4 -53% | 8.2 -21% |
| Idle Maximum * (Watt) | 7.5 | 8.6 -15% | 8.7 -16% | 9.8 -31% | 12.7 -69% | 9.4 -25% |
| Load Average * (Watt) | 26.3 | 27.5 -5% | 28.5 -8% | 29.7 -13% | 36 -37% | 37.1 -41% |
| Load Maximum * (Watt) | 35.1 | 33.7 4% | 29.2 17% | 32.6 7% | 35 -0% | 41.5 -18% |
* ... Moindre est la valeur, meilleures sont les performances
| HP ProBook 650 G2-T9X61ET 6200U, HD Graphics 520, 48 Wh | Lenovo ThinkPad L560-20F10026GE 6200U, HD Graphics 520, 48 Wh | Dell Latitude 15 E5570 6300U, HD Graphics 520, 62 Wh | Toshiba Tecra Z50-C-10P 6200U, HD Graphics 520, 44 Wh | Acer TravelMate P658-M-537B 6200U, HD Graphics 520, 55 Wh | HP ProBook 650 G1 H5G74E 4000M, HD Graphics 4600, 55 Wh | |
|---|---|---|---|---|---|---|
| Autonomie de la batterie | -15% | 43% | -13% | 8% | -35% | |
| Reader / Idle (h) | 11.5 | 11.6 1% | 20.5 78% | 14 22% | 7.7 -33% | |
| H.264 (h) | 6.4 | 4.6 -28% | 9.5 48% | |||
| WiFi v1.3 (h) | 6.8 | 6.8 0% | 10.5 54% | 5.9 -13% | 8.5 25% | |
| Load (h) | 2.7 | 1.8 -33% | 2.5 -7% | 2.1 -22% | 1.7 -37% | |
| WiFi (h) | 5.3 |
Points positifs
Points négatifs
Après environ deux ans, Hewlett Packard présente le successeur du ProBook 650 G1 – le ProBook 650 G2. Le PC portable professionnel endurant de 15 pouces qui est ici testé coûte 1 150 €. A ce prix, l’acheteur aura un ordinateur qui peut faire face aux exigences moyennes des tâches bureautiques. HP a mis en place les fonctionnalités de sécurité usuelles, et a équipé ce modèle d’un modem LTE. Le saut technologique entre un CPU Haswell et une architecture Skylake moderne illustre clairement les avancées techniques de ces dernières années. Cela est vrai en particulier pour la consommation d’énergie, qui permet une bonne autonomie.
Le ProBook 650 G2 de HP convainc grâce à de solides performances. Ce constat est littéralement gâché par la qualité de son écran, inférieure à la moyenne, qui ne devrait tout simplement ne plus exister dans cette gamme de prix.
Le ProBook G2 saura être un bon compagnon au quotidien au bureau. Nous recommandons de prendre la version avec l’écran HD pour ceux qui envisagent sérieusement de l’acquérir. Il serait également judicieux d’augmenter la mémoire vive, et d’installer un SSD pour une meilleure réactivité et mieux tirer profit de la puissance existante du portable.
Pour plus de détails, vous trouverez la version complète (en anglais) de ce test ici.
HP ProBook 650 G2-T9X61ET
- 08/11/2016 v5.1 (old)
Sebastian Bade