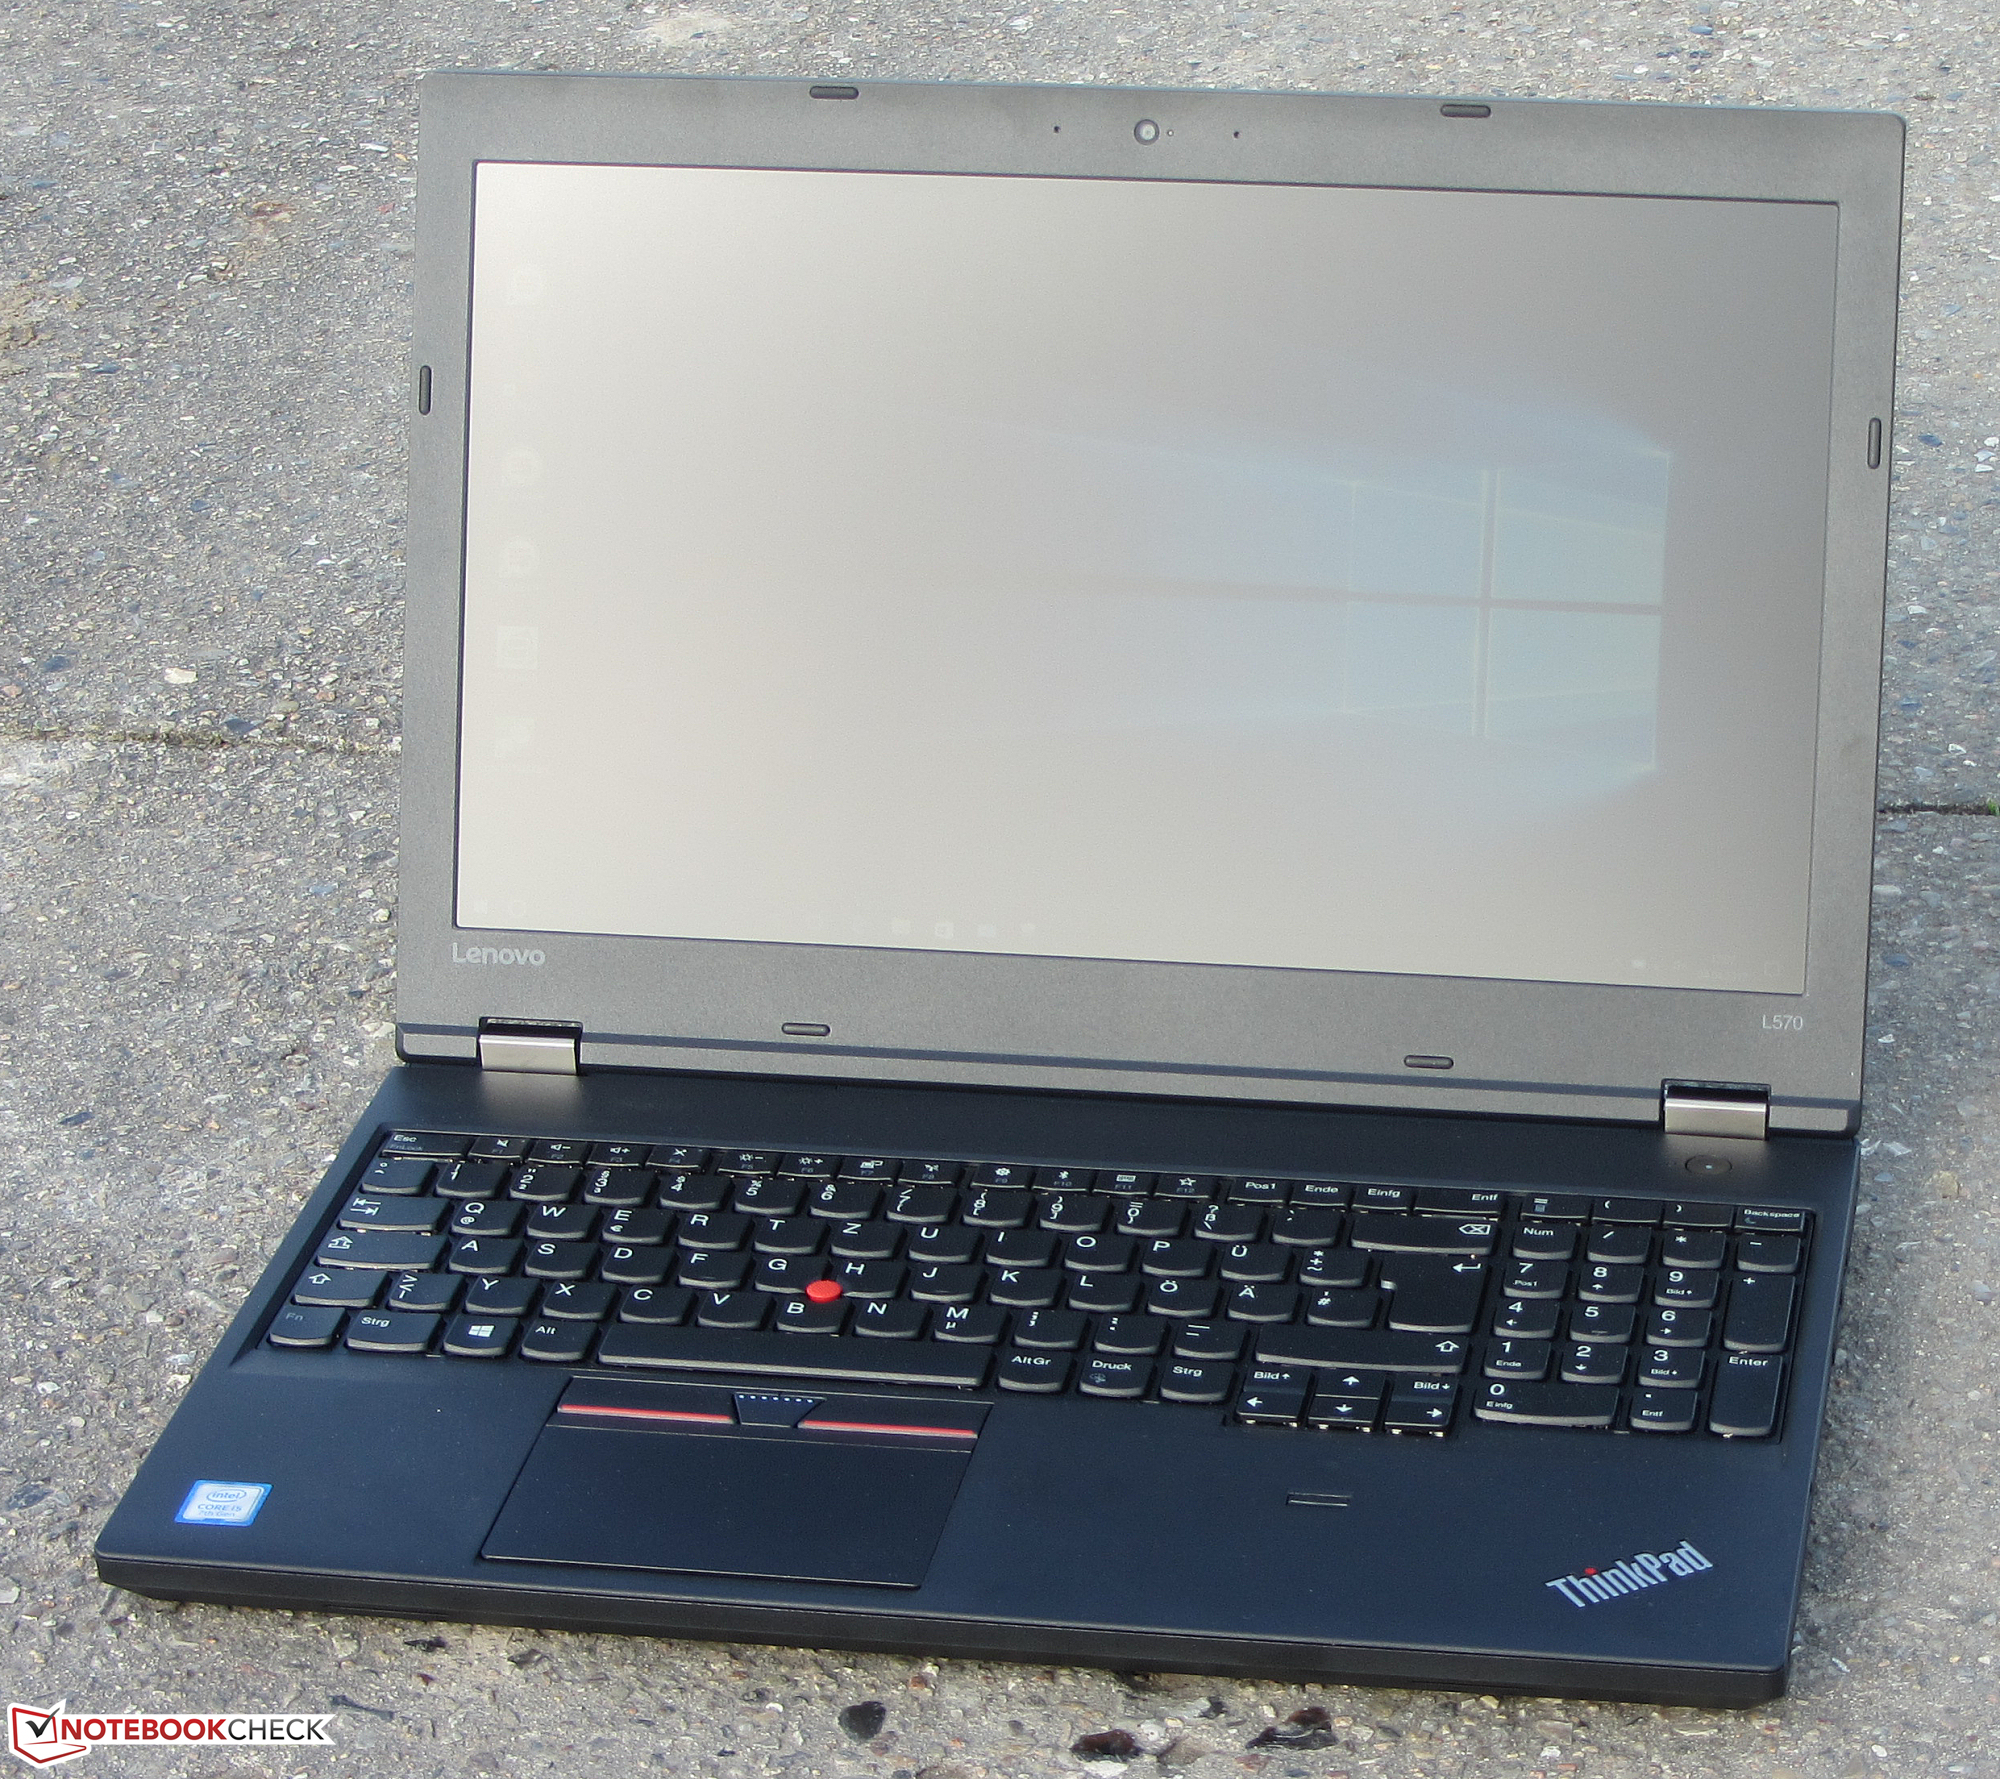
Courte critique du PC portable Lenovo ThinkPad L570 (7200U, Full HD)
| SD Card Reader | |
| average JPG Copy Test (av. of 3 runs) | |
| Dell Latitude 15 E5570 | |
| Lenovo ThinkPad L560-20F10026GE | |
| HP ProBook 450 G4 Y8B60EA | |
| Lenovo Thinkpad L570 20J9S01600 | |
| HP Probook 650 G3 Z2W44ET | |
| Lenovo ThinkPad E570-20H6S00000 | |
| Dell Vostro 15-5568 | |
| maximum AS SSD Seq Read Test (1GB) | |
| HP ProBook 450 G4 Y8B60EA | |
| HP Probook 650 G3 Z2W44ET | |
| Lenovo ThinkPad E570-20H6S00000 | |
| Lenovo ThinkPad L560-20F10026GE | |
| Dell Vostro 15-5568 | |
| Networking | |
| iperf3 transmit AX12 | |
| Lenovo Thinkpad L570 20J9S01600 | |
| HP Probook 650 G3 Z2W44ET (jseb) | |
| Lenovo ThinkPad E570-20H6S00000 | |
| Dell Vostro 15-5568 | |
| iperf3 receive AX12 | |
| HP Probook 650 G3 Z2W44ET (jseb) | |
| Lenovo ThinkPad E570-20H6S00000 | |
| Lenovo Thinkpad L570 20J9S01600 | |
| Dell Vostro 15-5568 | |
| |||||||||||||||||||||||||
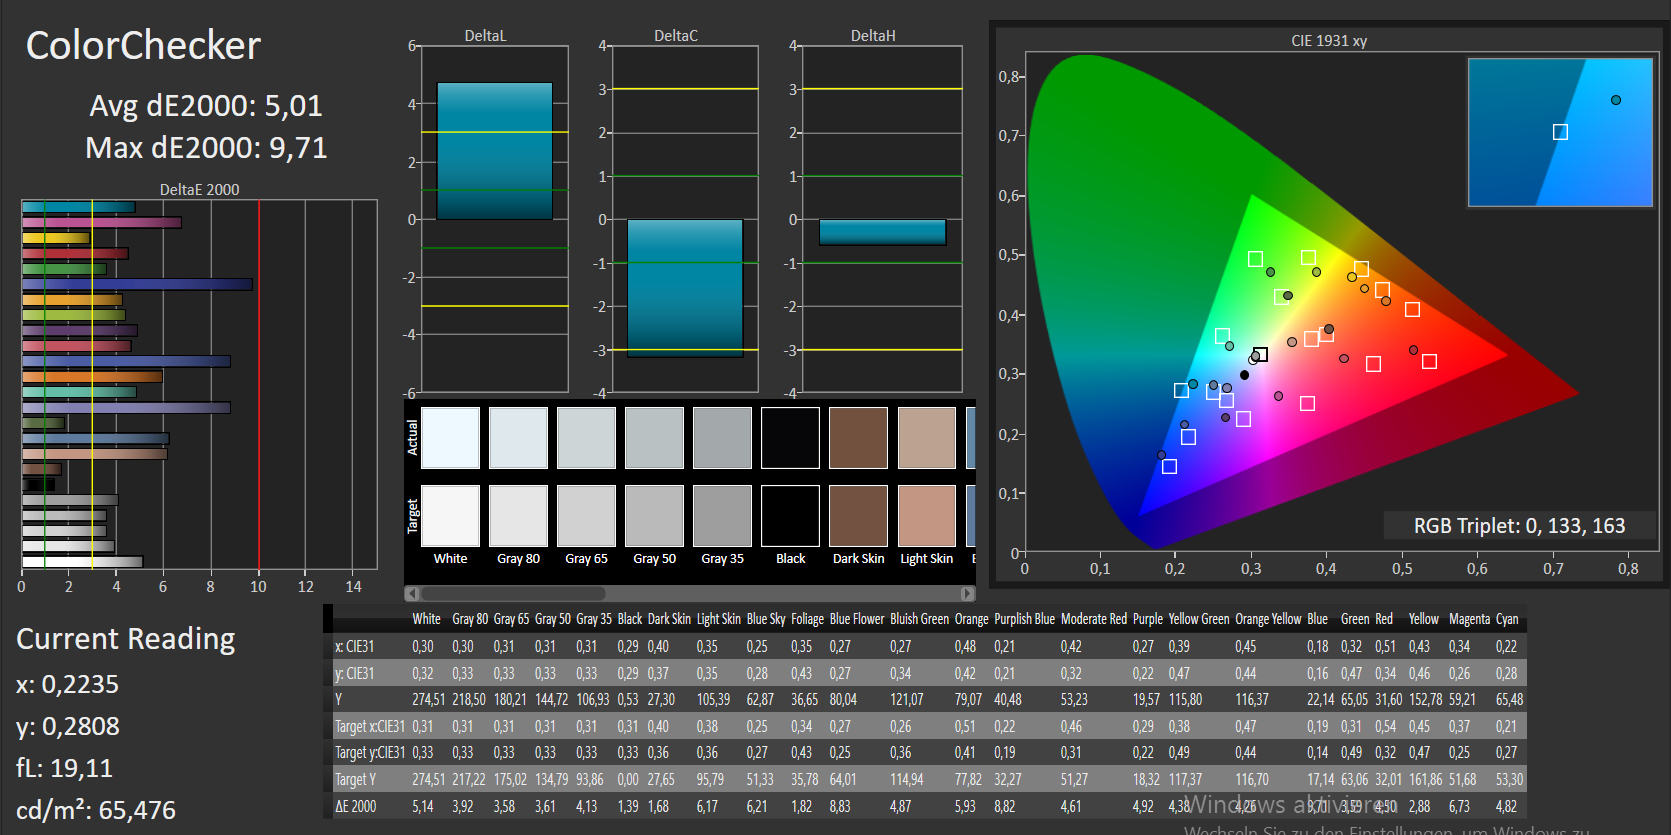
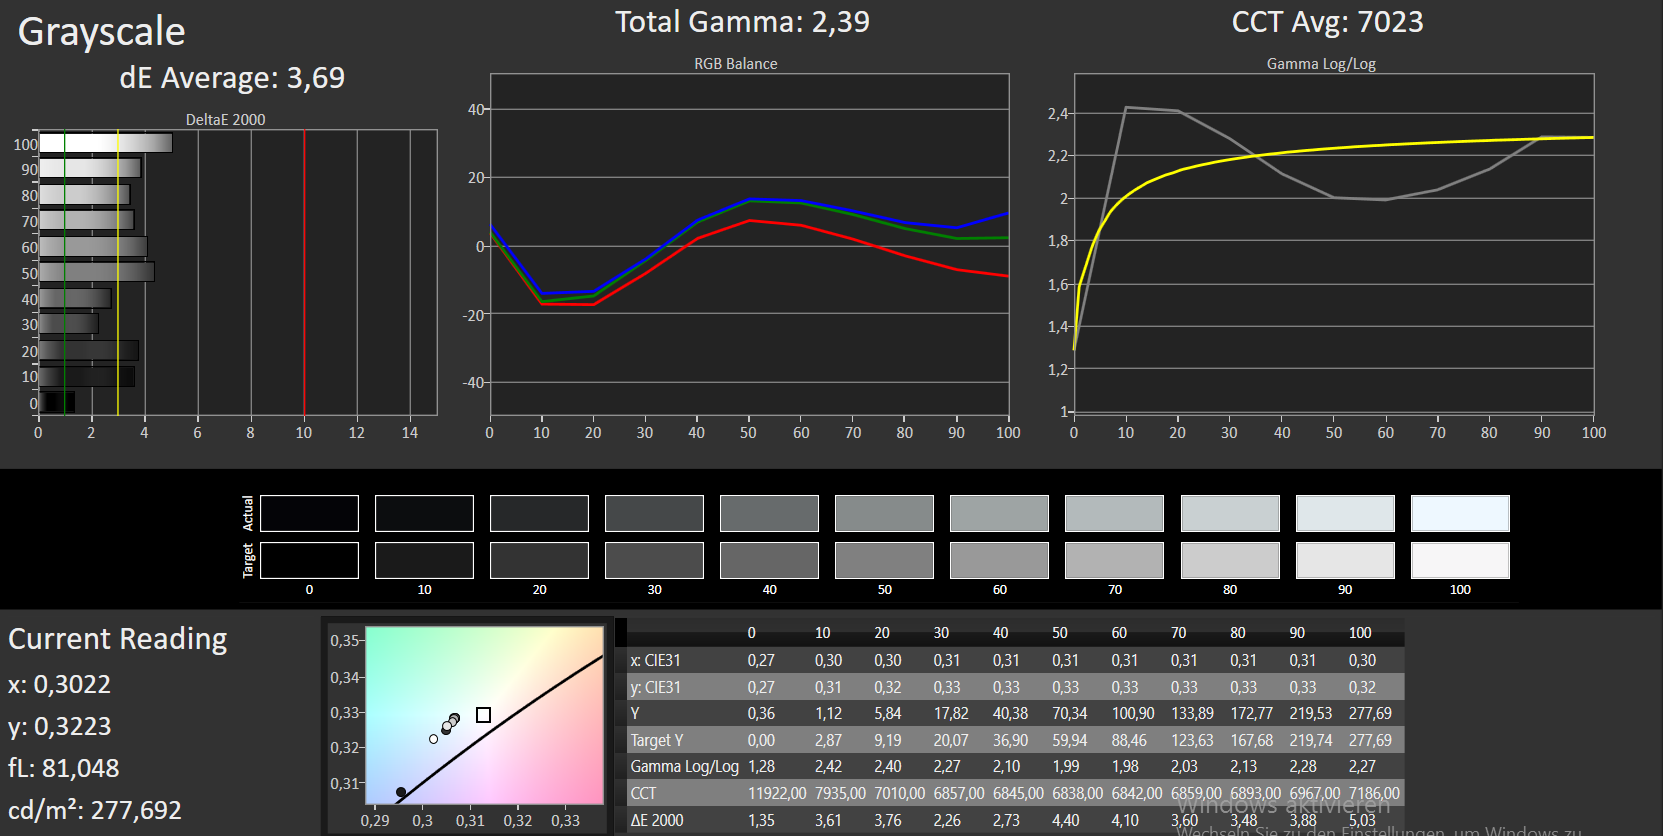
Homogénéité de la luminosité: 85 %
Valeur mesurée au centre, sur batterie: 272 cd/m²
Contraste: 613:1 (Valeurs des noirs: 0.45 cd/m²)
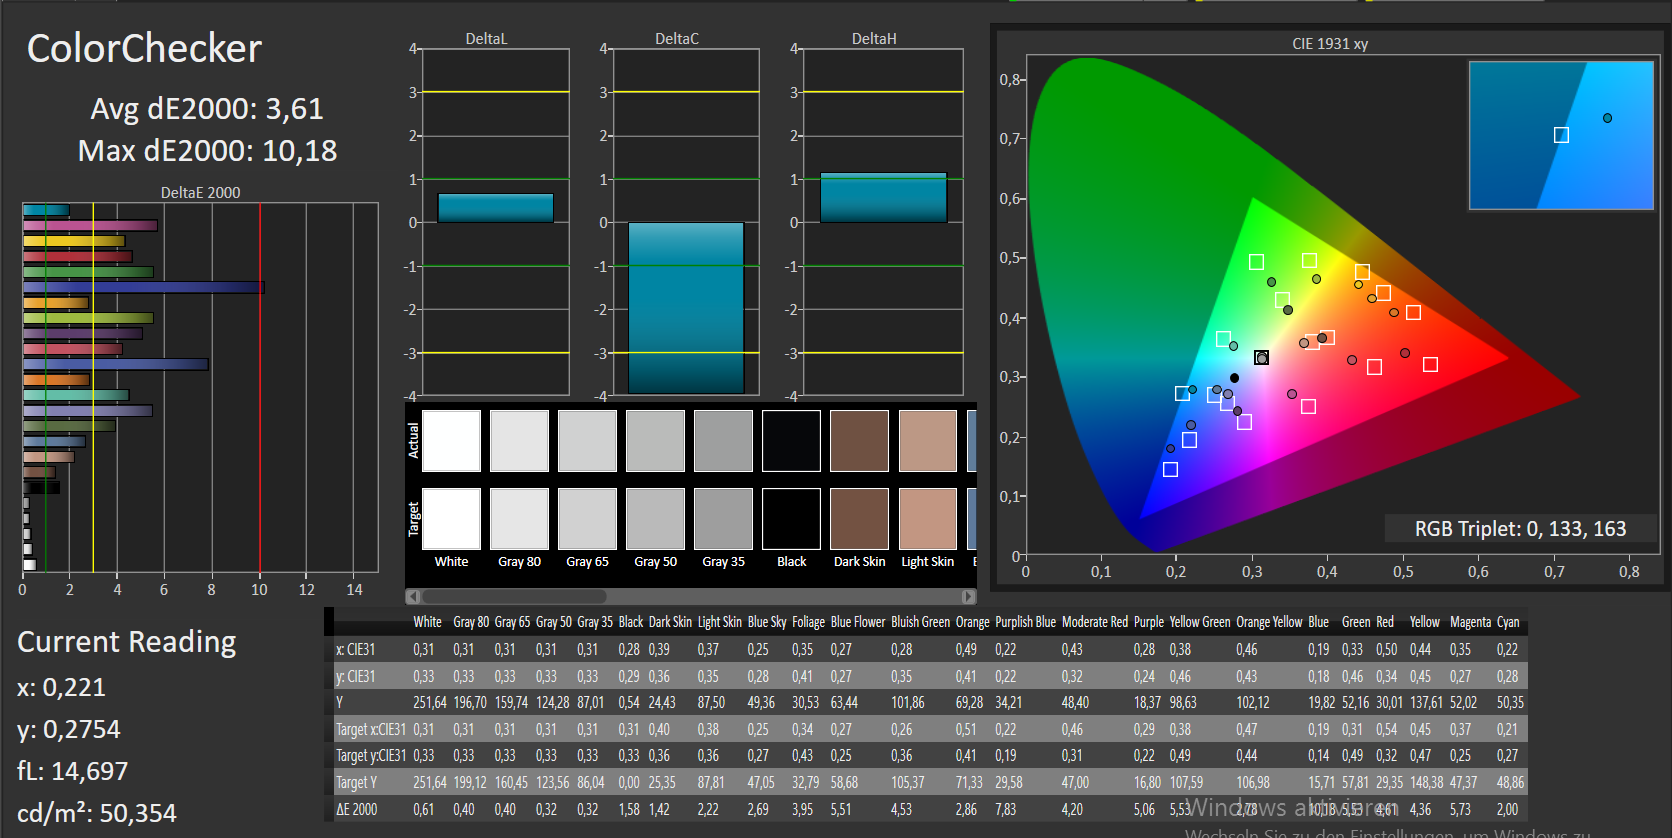
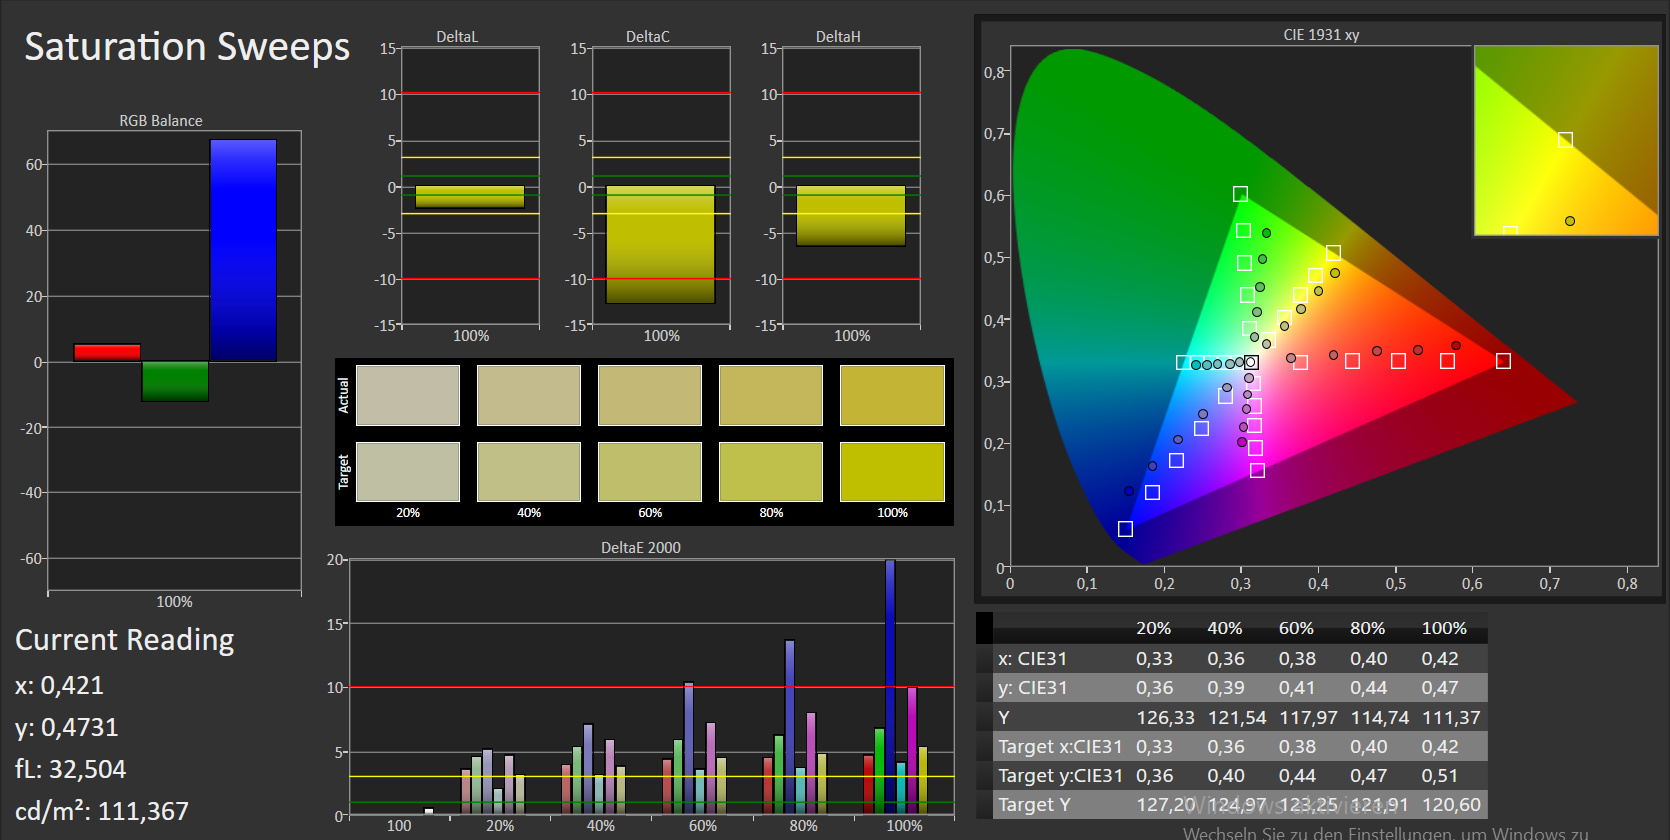
ΔE ColorChecker Calman: 5.01 | ∀{0.5-29.43 Ø4.72}
ΔE Greyscale Calman: 3.69 | ∀{0.09-98 Ø4.97}
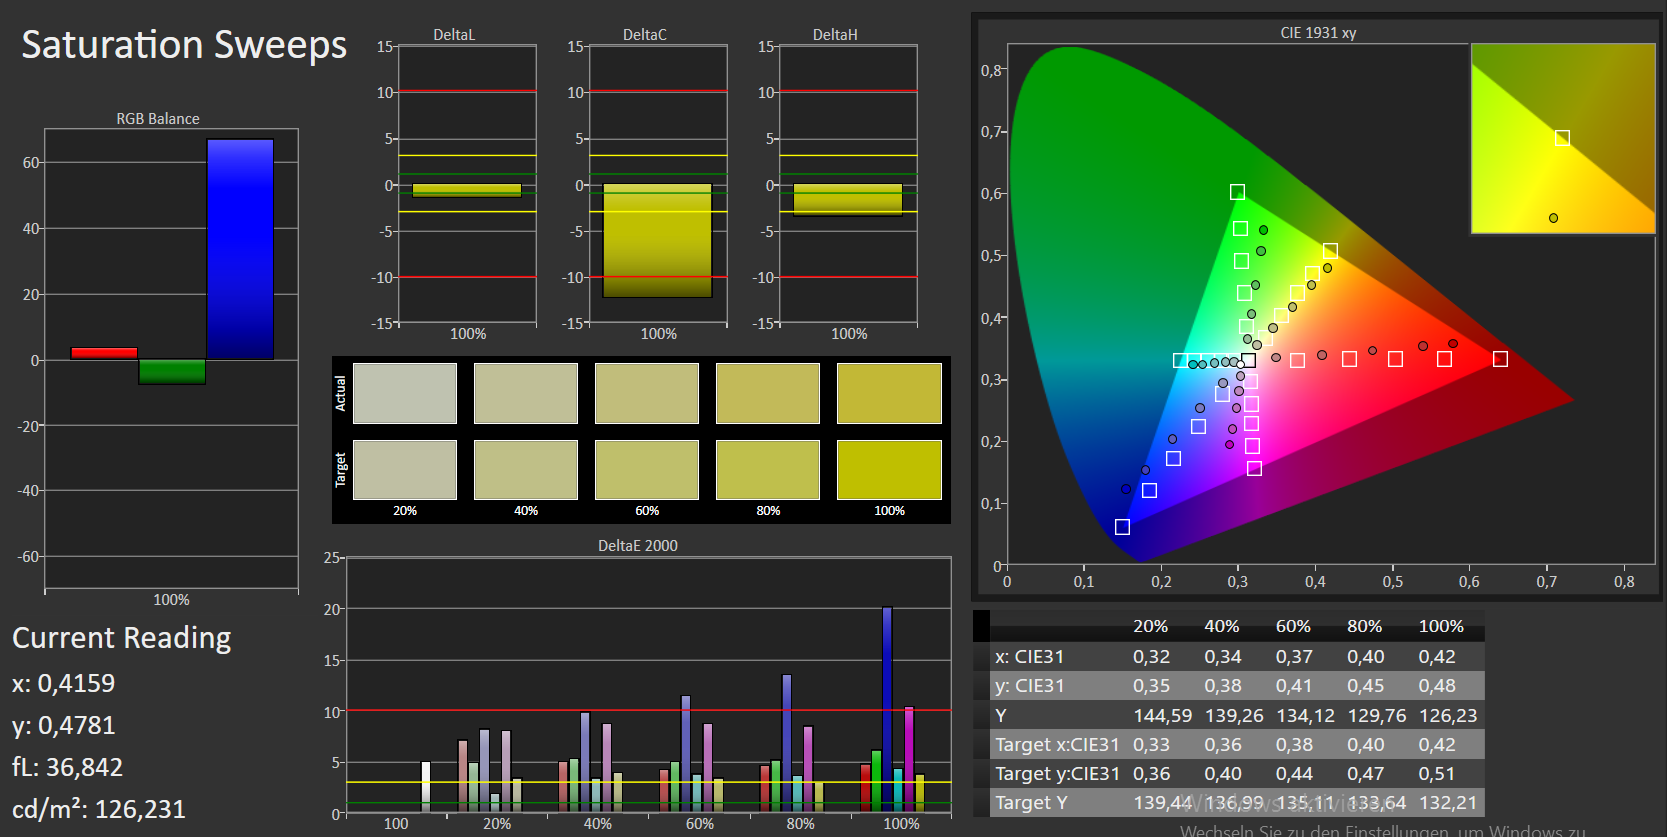
56.3% sRGB (Argyll 1.6.3 3D)
36% AdobeRGB 1998 (Argyll 1.6.3 3D)
38.97% AdobeRGB 1998 (Argyll 3D)
56.4% sRGB (Argyll 3D)
37.68% Display P3 (Argyll 3D)
Gamma: 2.39
CCT: 7023 K
| Lenovo Thinkpad L570 20J9S01600 IPS, 1920x1080, 15.6" | Lenovo ThinkPad L560-20F10026GE AH-IPS, 1920x1080, 15.6" | HP Probook 650 G3 Z2W44ET TN LED, 1920x1080, 15.6" | Dell Latitude 15 E5570 TN LED, 1366x768, 15.6" | Lenovo ThinkPad E570-20H6S00000 IPS LED, 1920x1080, 15.6" | HP ProBook 450 G4 Y8B60EA TN LED, 1920x1080, 15.6" | Dell Vostro 15-5568 TN LED, 1920x1080, 15.6" | |
|---|---|---|---|---|---|---|---|
| Display | 3% | 45% | 7% | 3% | 6% | ||
| Display P3 Coverage (%) | 37.68 | 39 4% | 55.2 46% | 40.48 7% | 38.65 3% | 39.89 6% | |
| sRGB Coverage (%) | 56.4 | 58.3 3% | 81.1 44% | 60.9 8% | 58 3% | 59.5 5% | |
| AdobeRGB 1998 Coverage (%) | 38.97 | 40.33 3% | 57 46% | 41.82 7% | 39.94 2% | 41.24 6% | |
| Response Times | -73% | -67% | -77% | -69% | -96% | -79% | |
| Response Time Grey 50% / Grey 80% * (ms) | 43 ? | 39.2 ? 9% | 38 ? 12% | 47 ? -9% | 44.8 ? -4% | 51 ? -19% | 47.6 ? -11% |
| Response Time Black / White * (ms) | 11 ? | 28 ? -155% | 27 ? -145% | 27 ? -145% | 25.6 ? -133% | 30 ? -173% | 27.2 ? -147% |
| PWM Frequency (Hz) | 200 ? | 50 ? | |||||
| Screen | -18% | -35% | -41% | 10% | -46% | -44% | |
| Brightness middle (cd/m²) | 276 | 262 -5% | 351 27% | 228 -17% | 242 -12% | 214 -22% | 229 -17% |
| Brightness (cd/m²) | 252 | 250 -1% | 345 37% | 236 -6% | 243 -4% | 201 -20% | 222 -12% |
| Brightness Distribution (%) | 85 | 92 8% | 95 12% | 90 6% | 75 -12% | 77 -9% | 82 -4% |
| Black Level * (cd/m²) | 0.45 | 0.29 36% | 0.65 -44% | 0.56 -24% | 0.24 47% | 0.43 4% | 0.56 -24% |
| Contrast (:1) | 613 | 903 47% | 540 -12% | 407 -34% | 1008 64% | 498 -19% | 409 -33% |
| Colorchecker dE 2000 * | 5.01 | 8.49 -69% | 11.02 -120% | 10.02 -100% | 4.65 7% | 10.68 -113% | 10.36 -107% |
| Colorchecker dE 2000 max. * | 9.71 | 17.99 -85% | 17.68 -82% | 15.93 -64% | 9.64 1% | 18.07 -86% | 14.95 -54% |
| Greyscale dE 2000 * | 3.69 | 8.11 -120% | 13.14 -256% | 10.66 -189% | 3.39 8% | 11.32 -207% | 10.9 -195% |
| Gamma | 2.39 92% | 2.37 93% | 2.7 81% | 2.48 89% | 2.7 81% | 2.26 97% | 2.21 100% |
| CCT | 7023 93% | 6300 103% | 16626 39% | 11800 55% | 6246 104% | 12204 53% | 10084 64% |
| Color Space (Percent of AdobeRGB 1998) (%) | 36 | 37.07 3% | 52 44% | 39 8% | 36.69 2% | 38 6% | 37.69 5% |
| Color Space (Percent of sRGB) (%) | 56.3 | 57.94 3% | 81 44% | 61 8% | 57.66 2% | 59 5% | 57.92 3% |
| Moyenne finale (programmes/paramètres) | -29% /
-21% | -19% /
-23% | -37% /
-36% | -19% /
-2% | -45% /
-42% | -62% /
-50% |
* ... Moindre est la valeur, meilleures sont les performances
Scintillement / MLI (Modulation de largeur d'impulsion)
| Scintillement / MLI (Modulation de largeur d'impulsion) non décelé | ≤ 90 Niveau de luminosité | |
En comparaison, 52 % des appareils testés n'emploient pas MDI pour assombrir leur écran. Nous avons relevé une moyenne à 7781 (minimum : 5 - maximum : 343500) Hz dans le cas où une MDI était active. | ||
Temps de réponse de l'écran
| ↔ Temps de réponse noir à blanc | ||
|---|---|---|
| 11 ms ... hausse ↗ et chute ↘ combinées | ↗ 7 ms hausse | 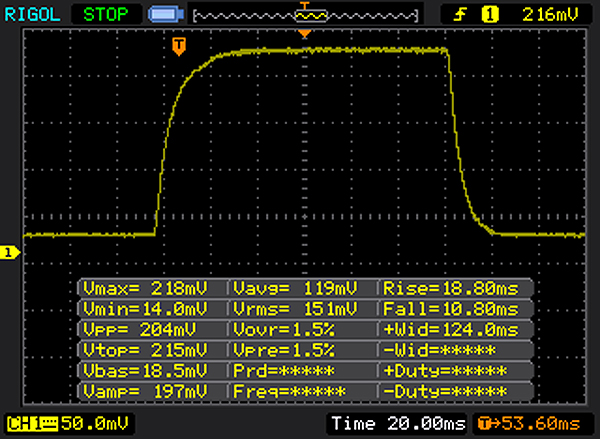 |
| ↘ 4 ms chute | ||
| L'écran montre de bons temps de réponse, mais insuffisant pour du jeu compétitif. En comparaison, tous les appareils testés affichent entre 0.1 (minimum) et 240 (maximum) ms. » 29 % des appareils testés affichent de meilleures performances. Cela signifie que les latences relevées sont meilleures que la moyenne (19.8 ms) de tous les appareils testés. | ||
| ↔ Temps de réponse gris 50% à gris 80% | ||
| 43 ms ... hausse ↗ et chute ↘ combinées | ↗ 24 ms hausse | 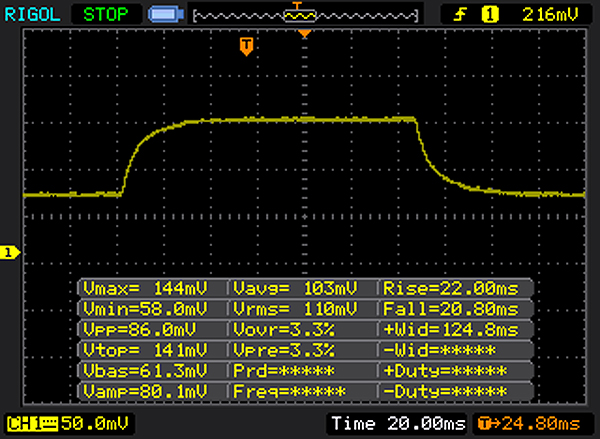 |
| ↘ 19 ms chute | ||
| L'écran souffre de latences très élevées, à éviter pour le jeu. En comparaison, tous les appareils testés affichent entre 0.165 (minimum) et 636 (maximum) ms. » 71 % des appareils testés affichent de meilleures performances. Cela signifie que les latences relevées sont moins bonnes que la moyenne (31 ms) de tous les appareils testés. | ||

| Cinebench R10 | |
| Rendering Multiple CPUs 32Bit | |
| Lenovo Thinkpad L570 20J9S01600 | |
| HP Probook 650 G3 Z2W44ET | |
| Dell Latitude 15 E5570 | |
| Lenovo ThinkPad L560-20F10026GE | |
| Rendering Single 32Bit | |
| Lenovo Thinkpad L570 20J9S01600 | |
| HP Probook 650 G3 Z2W44ET | |
| Dell Latitude 15 E5570 | |
| Lenovo ThinkPad L560-20F10026GE | |
| Geekbench 3 | |
| 32 Bit Multi-Core Score | |
| Lenovo Thinkpad L570 20J9S01600 | |
| HP Probook 650 G3 Z2W44ET | |
| Dell Latitude 15 E5570 | |
| 32 Bit Single-Core Score | |
| Lenovo Thinkpad L570 20J9S01600 | |
| Dell Latitude 15 E5570 | |
| HP Probook 650 G3 Z2W44ET | |
| Geekbench 4.0 | |
| 64 Bit Multi-Core Score | |
| Lenovo Thinkpad L570 20J9S01600 | |
| HP Probook 650 G3 Z2W44ET | |
| 64 Bit Single-Core Score | |
| Lenovo Thinkpad L570 20J9S01600 | |
| HP Probook 650 G3 Z2W44ET | |
| Geekbench 4.4 | |
| 64 Bit Multi-Core Score | |
| Lenovo Thinkpad L570 20J9S01600 | |
| 64 Bit Single-Core Score | |
| Lenovo Thinkpad L570 20J9S01600 | |
| PCMark 7 Score | 5464 points | |
| PCMark 8 Home Score Accelerated v2 | 3520 points | |
| PCMark 8 Creative Score Accelerated v2 | 3293 points | |
| PCMark 8 Work Score Accelerated v2 | 4600 points | |
Aide | ||

| Lenovo Thinkpad L570 20J9S01600 Samsung PM961 NVMe MZVLW512HMJP | Lenovo ThinkPad L560-20F10026GE WDC Slim WD10SPCX-21KHST0 | HP Probook 650 G3 Z2W44ET Hitachi Travelstar Z7K500 HTS725050A7E630 | Dell Latitude 15 E5570 Samsung SSD PM871 MZ7LN128HCHP | Lenovo ThinkPad E570-20H6S00000 Toshiba THNSF5256GPUK | HP Spectre x360 13-ac033dx Samsung PM961 NVMe MZVLW512HMJP | Lenovo ThinkPad X1 Carbon 2017-20HQS03P00 Samsung PM961 NVMe MZVLW512HMJP | HP Spectre 13-v131ng Samsung PM961 NVMe MZVLW512HMJP | Lenovo ThinkPad T470-20HD002HGE Samsung PM961 NVMe MZVLW512HMJP | HP ProBook 450 G4 Y8B60EA SanDisk SD8SNAT256G1002 | Dell Vostro 15-5568 SanDisk X400 256GB, SATA (SD8SB8U-256G) | |
|---|---|---|---|---|---|---|---|---|---|---|---|
| CrystalDiskMark 3.0 | -96% | -97% | -59% | -28% | 8% | 16% | -6% | -6% | -55% | ||
| Read Seq (MB/s) | 1412 | 113.6 -92% | 109.4 -92% | 474.7 -66% | 1140 -19% | 2065 46% | 1827 29% | 1090 -23% | 1155 -18% | 497.8 -65% | |
| Write Seq (MB/s) | 1110 | 111.7 -90% | 99.9 -91% | 155 -86% | 468.1 -58% | 1550 40% | 1383 25% | 1088 -2% | 1076 -3% | 466.8 -58% | |
| Read 512 (MB/s) | 833 | 39.65 -95% | 16.34 -98% | 393.6 -53% | 759 -9% | 865 4% | 814 -2% | 753 -10% | 811 -3% | 363.4 -56% | |
| Write 512 (MB/s) | 920 | 55.3 -94% | 43.45 -95% | 119.7 -87% | 414 -55% | 1229 34% | 1098 19% | 911 -1% | 862 -6% | 368.5 -60% | |
| Read 4k (MB/s) | 56.8 | 0.488 -99% | 0.337 -99% | 34 -40% | 34.3 -40% | 54.7 -4% | 61 7% | 57.5 1% | 55.5 -2% | 29.02 -49% | |
| Write 4k (MB/s) | 138.9 | 1.022 -99% | 0.866 -99% | 96.6 -30% | 123.4 -11% | 139.4 0% | 172.2 24% | 140.2 1% | 134.6 -3% | 56 -60% | |
| Read 4k QD32 (MB/s) | 539 | 1.367 -100% | 0.826 -100% | 383.3 -29% | 530 -2% | 518 -4% | 601 12% | 497.1 -8% | 496.2 -8% | 296 -45% | |
| Write 4k QD32 (MB/s) | 444.8 | 1.036 -100% | 0.859 -100% | 100.2 -77% | 319.2 -28% | 225.6 -49% | 495.6 11% | 416 -6% | 425.4 -4% | 229.4 -48% |
| 3DMark 06 Standard Score | 7810 points | |
| 3DMark 11 Performance | 1550 points | |
| 3DMark Ice Storm Standard Score | 52860 points | |
| 3DMark Cloud Gate Standard Score | 5745 points | |
| 3DMark Fire Strike Score | 764 points | |
| 3DMark Fire Strike Extreme Score | 343 points | |
Aide | ||
| Bas | Moyen | Élevé | Ultra | |
|---|---|---|---|---|
| Tomb Raider (2013) | 62.7 | 31.4 | 18.4 | 9.7 |
| BioShock Infinite (2013) | 40.3 | 23.9 | 19.8 | 6.9 |
| Battlefield 4 (2013) | 31 | 23 | 15.6 | 6.2 |
Degré de la nuisance sonore
| Au repos |
| 30.3 / 30.3 / 30.3 dB(A) |
| Lecteur DVD |
| 38.2 / dB(A) |
| Fortement sollicité |
| 33.2 / 33.1 dB(A) |
 | ||
30 dB silencieux 40 dB(A) audible 50 dB(A) bruyant |
||
min: | ||
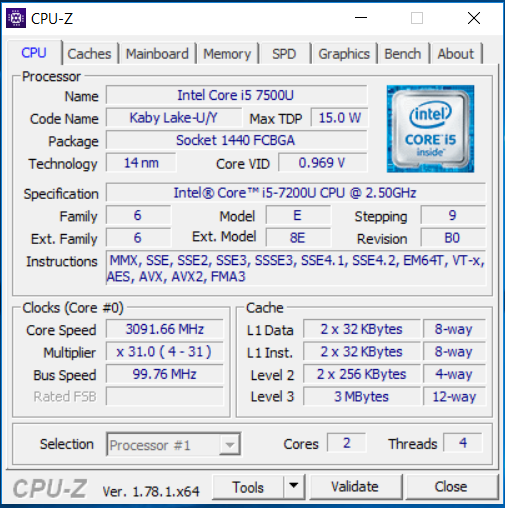
| Lenovo Thinkpad L570 20J9S01600 i5-7200U, HD Graphics 620 | Lenovo ThinkPad L560-20F10026GE 6200U, HD Graphics 520 | HP Probook 650 G3 Z2W44ET i5-7200U, HD Graphics 620 | Dell Latitude 15 E5570 6300U, HD Graphics 520 | Lenovo ThinkPad E570-20H6S00000 i5-7200U, GeForce GTX 950M | HP ProBook 450 G4 Y8B60EA i7-7500U, GeForce 930MX | Dell Vostro 15-5568 i5-7200U, HD Graphics 620 | |
|---|---|---|---|---|---|---|---|
| Noise | 0% | -3% | -7% | -1% | -11% | 0% | |
| arrêt / environnement * (dB) | 30.3 | 29.4 3% | 30.7 -1% | 31.2 -3% | 29 4% | 31.6 -4% | 29 4% |
| Idle Minimum * (dB) | 30.3 | 30.1 1% | 31.5 -4% | 31.2 -3% | 29 4% | 32.6 -8% | 29 4% |
| Idle Average * (dB) | 30.3 | 30.1 1% | 31.5 -4% | 33.2 -10% | 29 4% | 32.6 -8% | 29 4% |
| Idle Maximum * (dB) | 30.3 | 30.1 1% | 31.5 -4% | 34.3 -13% | 29 4% | 33 -9% | 29 4% |
| Load Average * (dB) | 33.2 | 33.4 -1% | 34.6 -4% | 36.6 -10% | 34.3 -3% | 38.9 -17% | 33.9 -2% |
| Load Maximum * (dB) | 33.1 | 34.7 -5% | 33.3 -1% | 34.7 -5% | 40.1 -21% | 38.9 -18% | 37 -12% |
* ... Moindre est la valeur, meilleures sont les performances
(+) La température maximale du côté supérieur est de 36.1 °C / 97 F, par rapport à la moyenne de 34.3 °C / 94 F, allant de 21.2 à 62.5 °C pour la classe Office.
(+) Le fond chauffe jusqu'à un maximum de 33.1 °C / 92 F, contre une moyenne de 36.8 °C / 98 F
(+) En utilisation inactive, la température moyenne du côté supérieur est de 22.6 °C / 73 F, par rapport à la moyenne du dispositif de 29.5 °C / 85 F.
(+) Les repose-poignets et le pavé tactile sont plus froids que la température de la peau avec un maximum de 28 °C / 82.4 F et sont donc froids au toucher.
(±) La température moyenne de la zone de l'appui-paume de dispositifs similaires était de 27.5 °C / 81.5 F (-0.5 °C / #-0.9 F).
| Lenovo Thinkpad L570 20J9S01600 i5-7200U, HD Graphics 620 | Lenovo ThinkPad L560-20F10026GE 6200U, HD Graphics 520 | HP Probook 650 G3 Z2W44ET i5-7200U, HD Graphics 620 | Dell Latitude 15 E5570 6300U, HD Graphics 520 | Lenovo ThinkPad E570-20H6S00000 i5-7200U, GeForce GTX 950M | HP ProBook 450 G4 Y8B60EA i7-7500U, GeForce 930MX | Dell Vostro 15-5568 i5-7200U, HD Graphics 620 | |
|---|---|---|---|---|---|---|---|
| Heat | -20% | 3% | -33% | -21% | -24% | -18% | |
| Maximum Upper Side * (°C) | 36.1 | 37.2 -3% | 31.9 12% | 37.3 -3% | 46.6 -29% | 44.3 -23% | 38 -5% |
| Maximum Bottom * (°C) | 33.1 | 36 -9% | 32.1 3% | 41.5 -25% | 49.1 -48% | 46.3 -40% | 39 -18% |
| Idle Upper Side * (°C) | 23.7 | 30.7 -30% | 23.5 1% | 34.2 -44% | 24.6 -4% | 27.8 -17% | 25.7 -8% |
| Idle Bottom * (°C) | 24.1 | 32.8 -36% | 25.3 -5% | 38.8 -61% | 25.1 -4% | 27.7 -15% | 33.8 -40% |
* ... Moindre est la valeur, meilleures sont les performances
Lenovo Thinkpad L570 20J9S01600 analyse audio
(-) | haut-parleurs pas très forts (70 dB)
Basses 100 - 315 Hz
(±) | basse réduite - en moyenne 13.2% inférieure à la médiane
(+) | les basses sont linéaires (4.8% delta à la fréquence précédente)
Médiums 400 - 2000 Hz
(+) | médiane équilibrée - seulement 4.1% de la médiane
(+) | les médiums sont linéaires (4.1% delta à la fréquence précédente)
Aiguës 2 - 16 kHz
(+) | des sommets équilibrés - à seulement 1.4% de la médiane
(+) | les aigus sont linéaires (2.5% delta à la fréquence précédente)
Globalement 100 - 16 000 Hz
(±) | la linéarité du son global est moyenne (15.2% de différence avec la médiane)
Par rapport à la même classe
» 14% de tous les appareils testés de cette catégorie étaient meilleurs, 4% similaires, 82% pires
» Le meilleur avait un delta de 7%, la moyenne était de 21%, le pire était de 53%.
Par rapport à tous les appareils testés
» 21% de tous les appareils testés étaient meilleurs, 4% similaires, 74% pires
» Le meilleur avait un delta de 4%, la moyenne était de 24%, le pire était de 134%.
Apple MacBook 12 (Early 2016) 1.1 GHz analyse audio
(+) | les haut-parleurs peuvent jouer relativement fort (83.6# dB)
Basses 100 - 315 Hz
(±) | basse réduite - en moyenne 11.3% inférieure à la médiane
(±) | la linéarité des basses est moyenne (14.2% delta à la fréquence précédente)
Médiums 400 - 2000 Hz
(+) | médiane équilibrée - seulement 2.4% de la médiane
(+) | les médiums sont linéaires (5.5% delta à la fréquence précédente)
Aiguës 2 - 16 kHz
(+) | des sommets équilibrés - à seulement 2% de la médiane
(+) | les aigus sont linéaires (4.5% delta à la fréquence précédente)
Globalement 100 - 16 000 Hz
(+) | le son global est linéaire (10.2% différence à la médiane)
Par rapport à la même classe
» 7% de tous les appareils testés de cette catégorie étaient meilleurs, 2% similaires, 91% pires
» Le meilleur avait un delta de 5%, la moyenne était de 18%, le pire était de 53%.
Par rapport à tous les appareils testés
» 5% de tous les appareils testés étaient meilleurs, 1% similaires, 94% pires
» Le meilleur avait un delta de 4%, la moyenne était de 24%, le pire était de 134%.
| Éteint/en veille | |
| Au repos | |
| Fortement sollicité |
|
Légende:
min: | |
| Lenovo Thinkpad L570 20J9S01600 i5-7200U, HD Graphics 620 | Lenovo ThinkPad L560-20F10026GE 6200U, HD Graphics 520 | HP Probook 650 G3 Z2W44ET i5-7200U, HD Graphics 620 | Dell Latitude 15 E5570 6300U, HD Graphics 520 | Lenovo ThinkPad E570-20H6S00000 i5-7200U, GeForce GTX 950M | HP ProBook 450 G4 Y8B60EA i7-7500U, GeForce 930MX | Dell Vostro 15-5568 i5-7200U, HD Graphics 620 | |
|---|---|---|---|---|---|---|---|
| Power Consumption | -11% | 2% | -5% | -32% | -23% | -4% | |
| Idle Minimum * (Watt) | 4 | 5 -25% | 4 -0% | 4.5 -13% | 2.8 30% | 3.8 5% | 3.3 17% |
| Idle Average * (Watt) | 7.4 | 7.9 -7% | 6.9 7% | 7.6 -3% | 6.3 15% | 6.6 11% | 6.8 8% |
| Idle Maximum * (Watt) | 7.7 | 8.6 -12% | 7.6 1% | 8.7 -13% | 6.9 10% | 11.3 -47% | 7.7 -0% |
| Load Average * (Watt) | 30.6 | 27.5 10% | 29 5% | 28.5 7% | 51.6 -69% | 38 -24% | 30.9 -1% |
| Load Maximum * (Watt) | 28.2 | 33.7 -20% | 28.7 -2% | 29.2 -4% | 69.7 -147% | 45 -60% | 40.3 -43% |
* ... Moindre est la valeur, meilleures sont les performances
| Lenovo Thinkpad L570 20J9S01600 i5-7200U, HD Graphics 620, 48 Wh | Lenovo ThinkPad L560-20F10026GE 6200U, HD Graphics 520, 48 Wh | HP Probook 650 G3 Z2W44ET i5-7200U, HD Graphics 620, 48 Wh | Dell Latitude 15 E5570 6300U, HD Graphics 520, 62 Wh | Lenovo ThinkPad E570-20H6S00000 i5-7200U, GeForce GTX 950M, 41 Wh | HP ProBook 450 G4 Y8B60EA i7-7500U, GeForce 930MX, 45 Wh | Dell Vostro 15-5568 i5-7200U, HD Graphics 620, 42 Wh | |
|---|---|---|---|---|---|---|---|
| Autonomie de la batterie | -31% | -5% | 15% | -11% | -13% | -14% | |
| Reader / Idle (h) | 19.4 | 11.6 -40% | 12.8 -34% | 20.5 6% | 14.7 -24% | 12.4 -36% | 16.9 -13% |
| H.264 (h) | 8.2 | 4.6 -44% | 6.7 -18% | 9.5 16% | 8.5 4% | ||
| WiFi v1.3 (h) | 8.9 | 6.8 -24% | 7.8 -12% | 10.5 18% | 7.7 -13% | 8.6 -3% | 6 -33% |
| Load (h) | 2.1 | 1.8 -14% | 3 43% | 2.5 19% | 2.2 5% | 2.1 0% | 1.8 -14% |
Points positifs
Points négatifs
Comparé à son prédécesseur, le ThinkPad L570 est avant tout une mise à niveau Kaby Lake. Il n’offre qu’une légère amélioration des performances, par rapport à son prédécesseur Skylake, mais permet une autonomie bien plus élevée, d’au moins une journée de travail.
L’autonomie augmente avec Kaby Lake.
Comme il se doit pour un ordinateur de travail, l’appareil chauffe peu et reste silencieux. Les ventilateurs ne se mettent pas soudainement en route sans raison, ce qui était critiqué sur le L560.
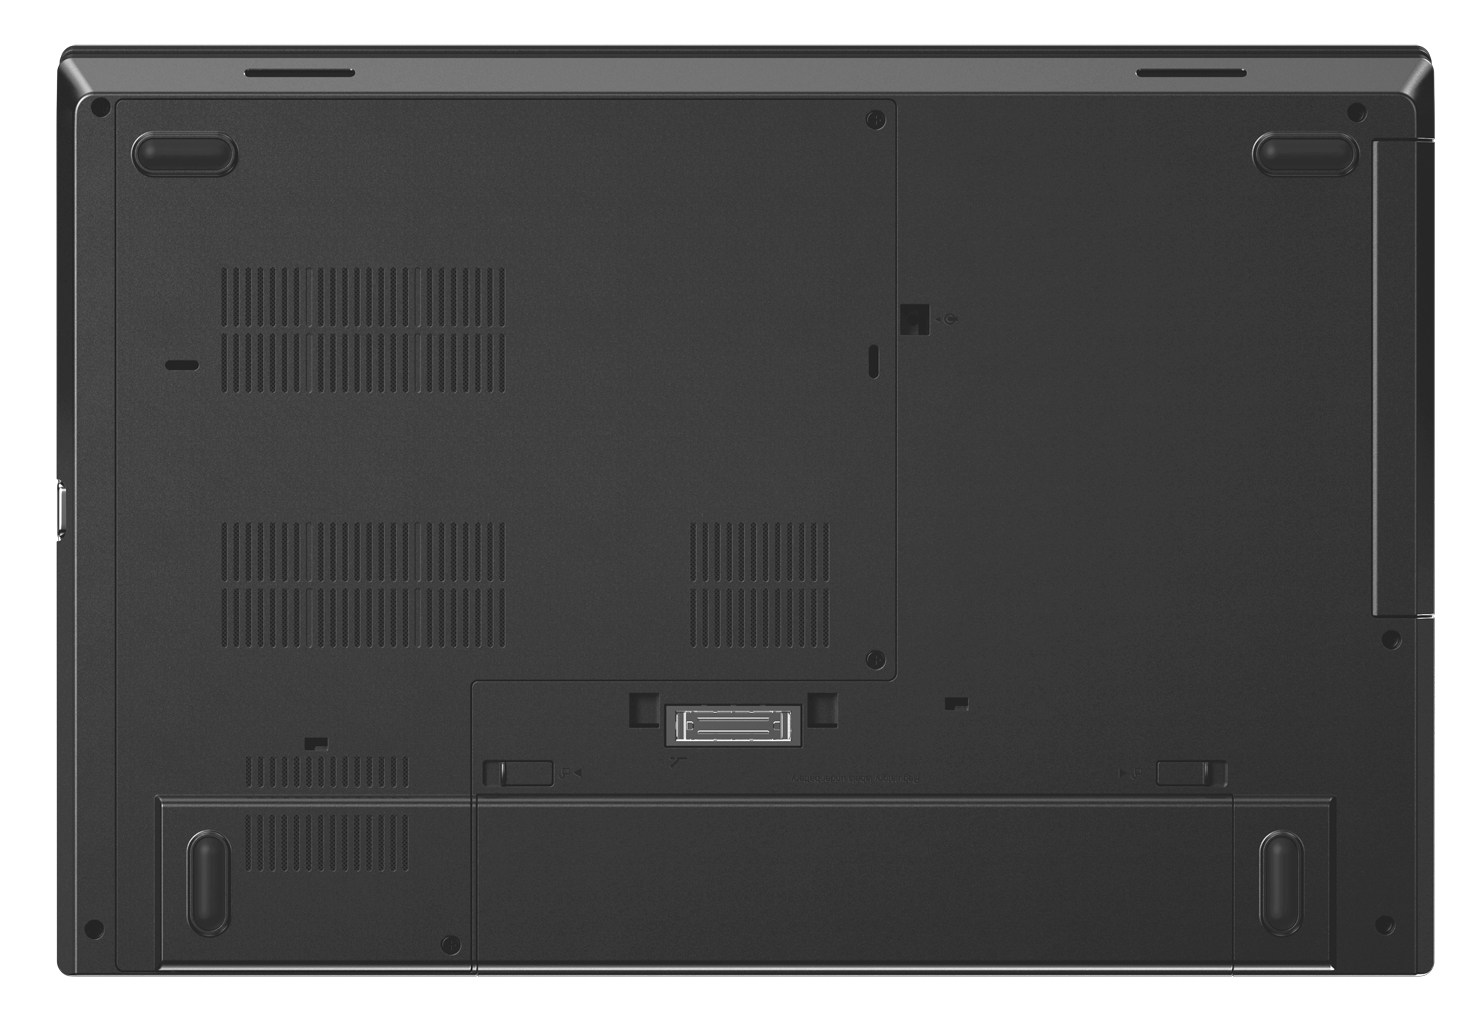
Le SSD NVMe permet au système d’être réactif. Grâce à la trappe de maintenance, il n’est pas difficile de le remplacer. De plus le ThinkPad est conçu pour pouvoir évoluer : un emplacement supplémentaire M.2 2242 peut être installé, avec un modem LTE (les antennes sont présentes) ou un second SSD.
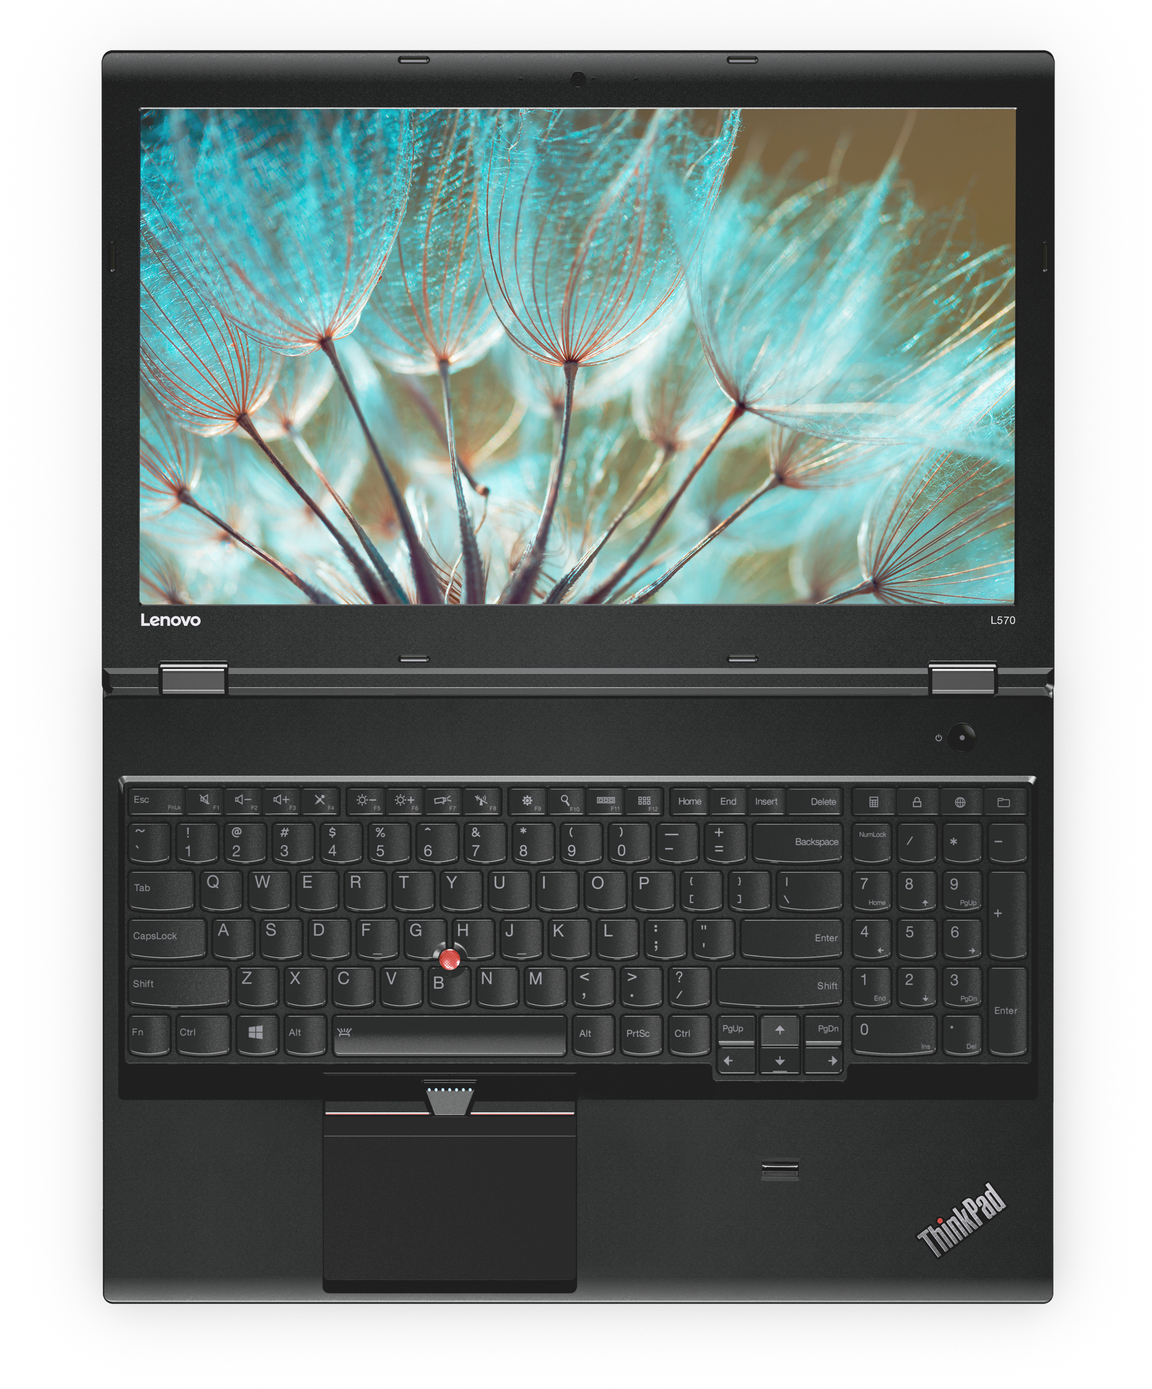
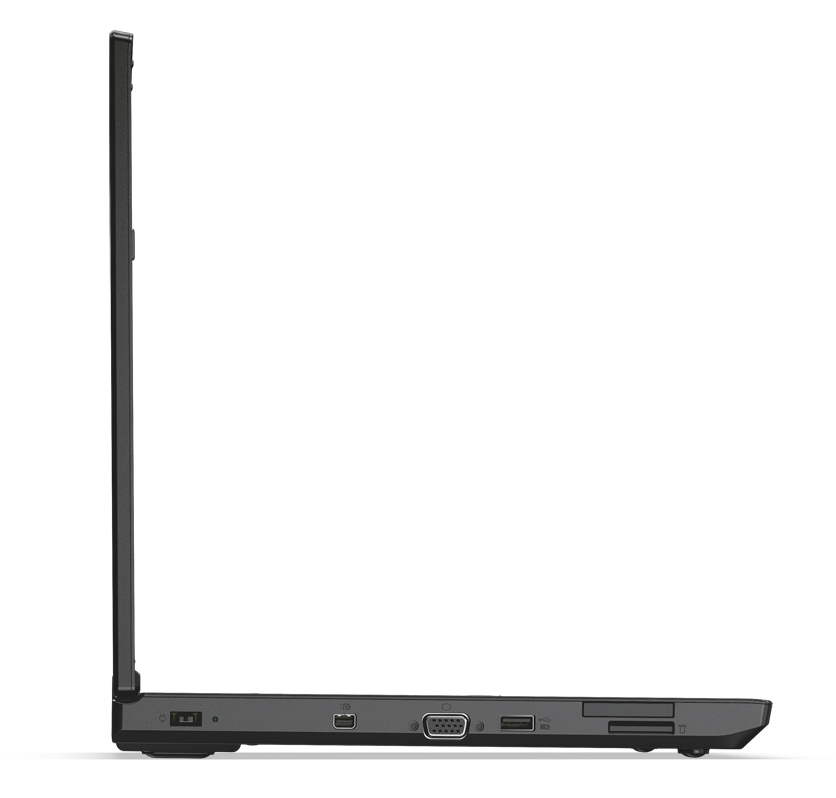
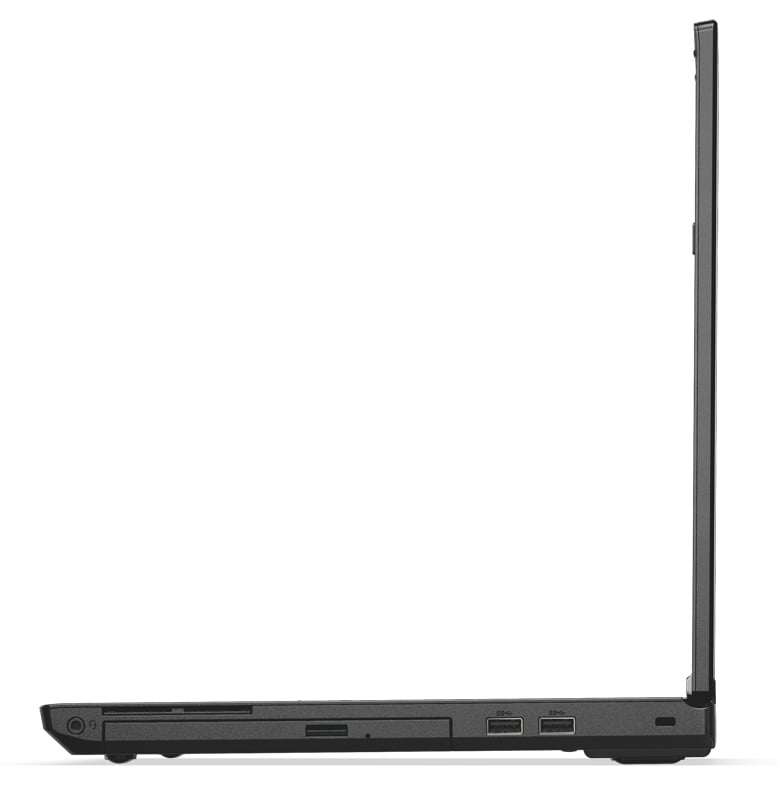
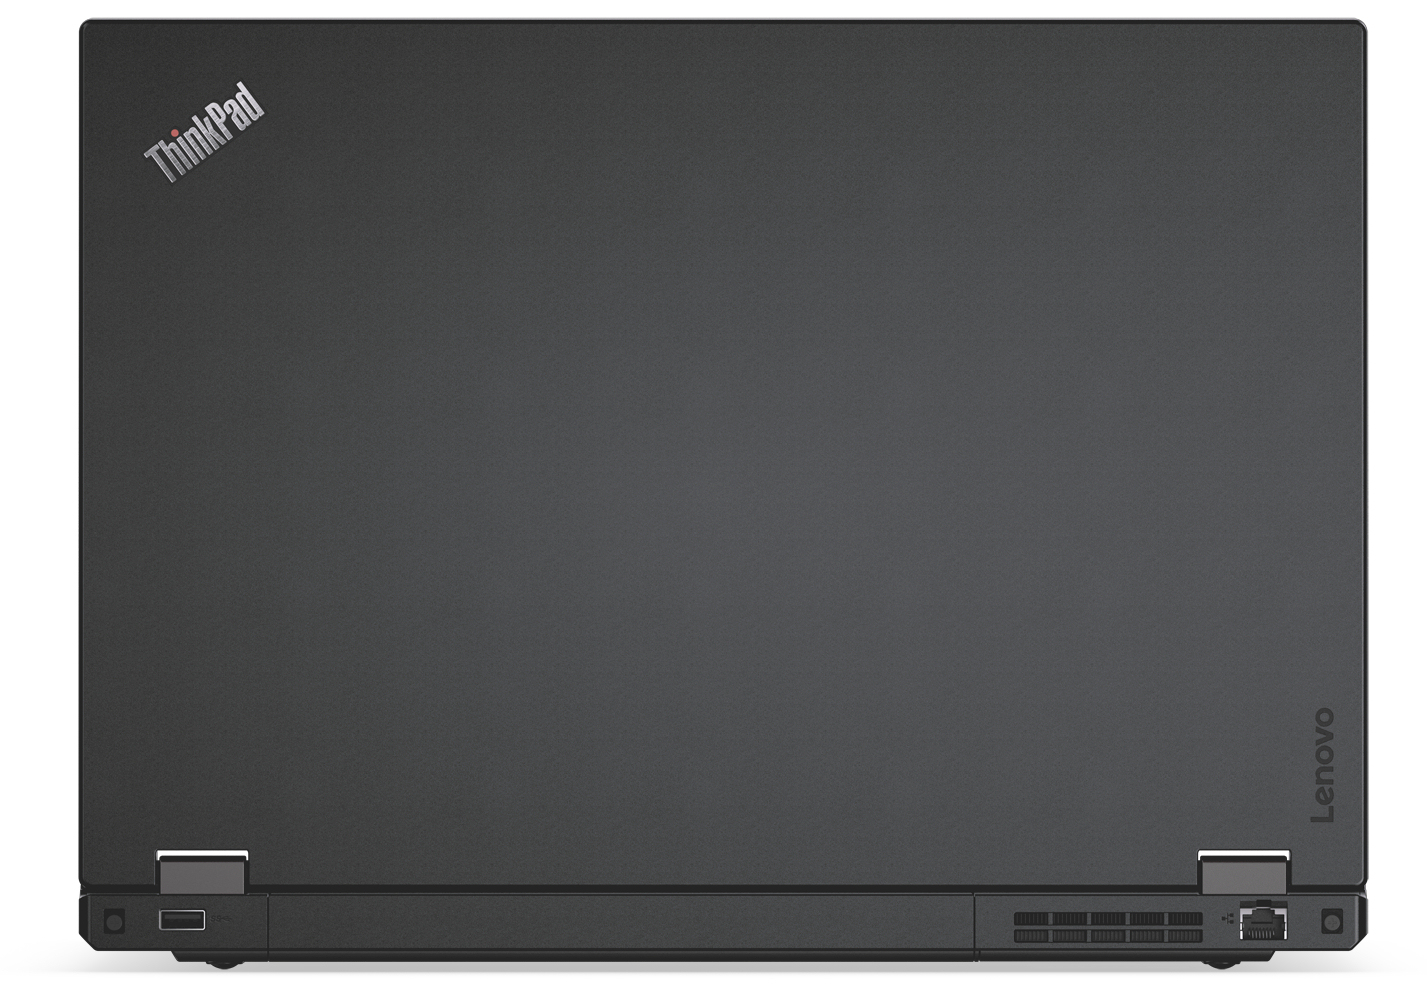
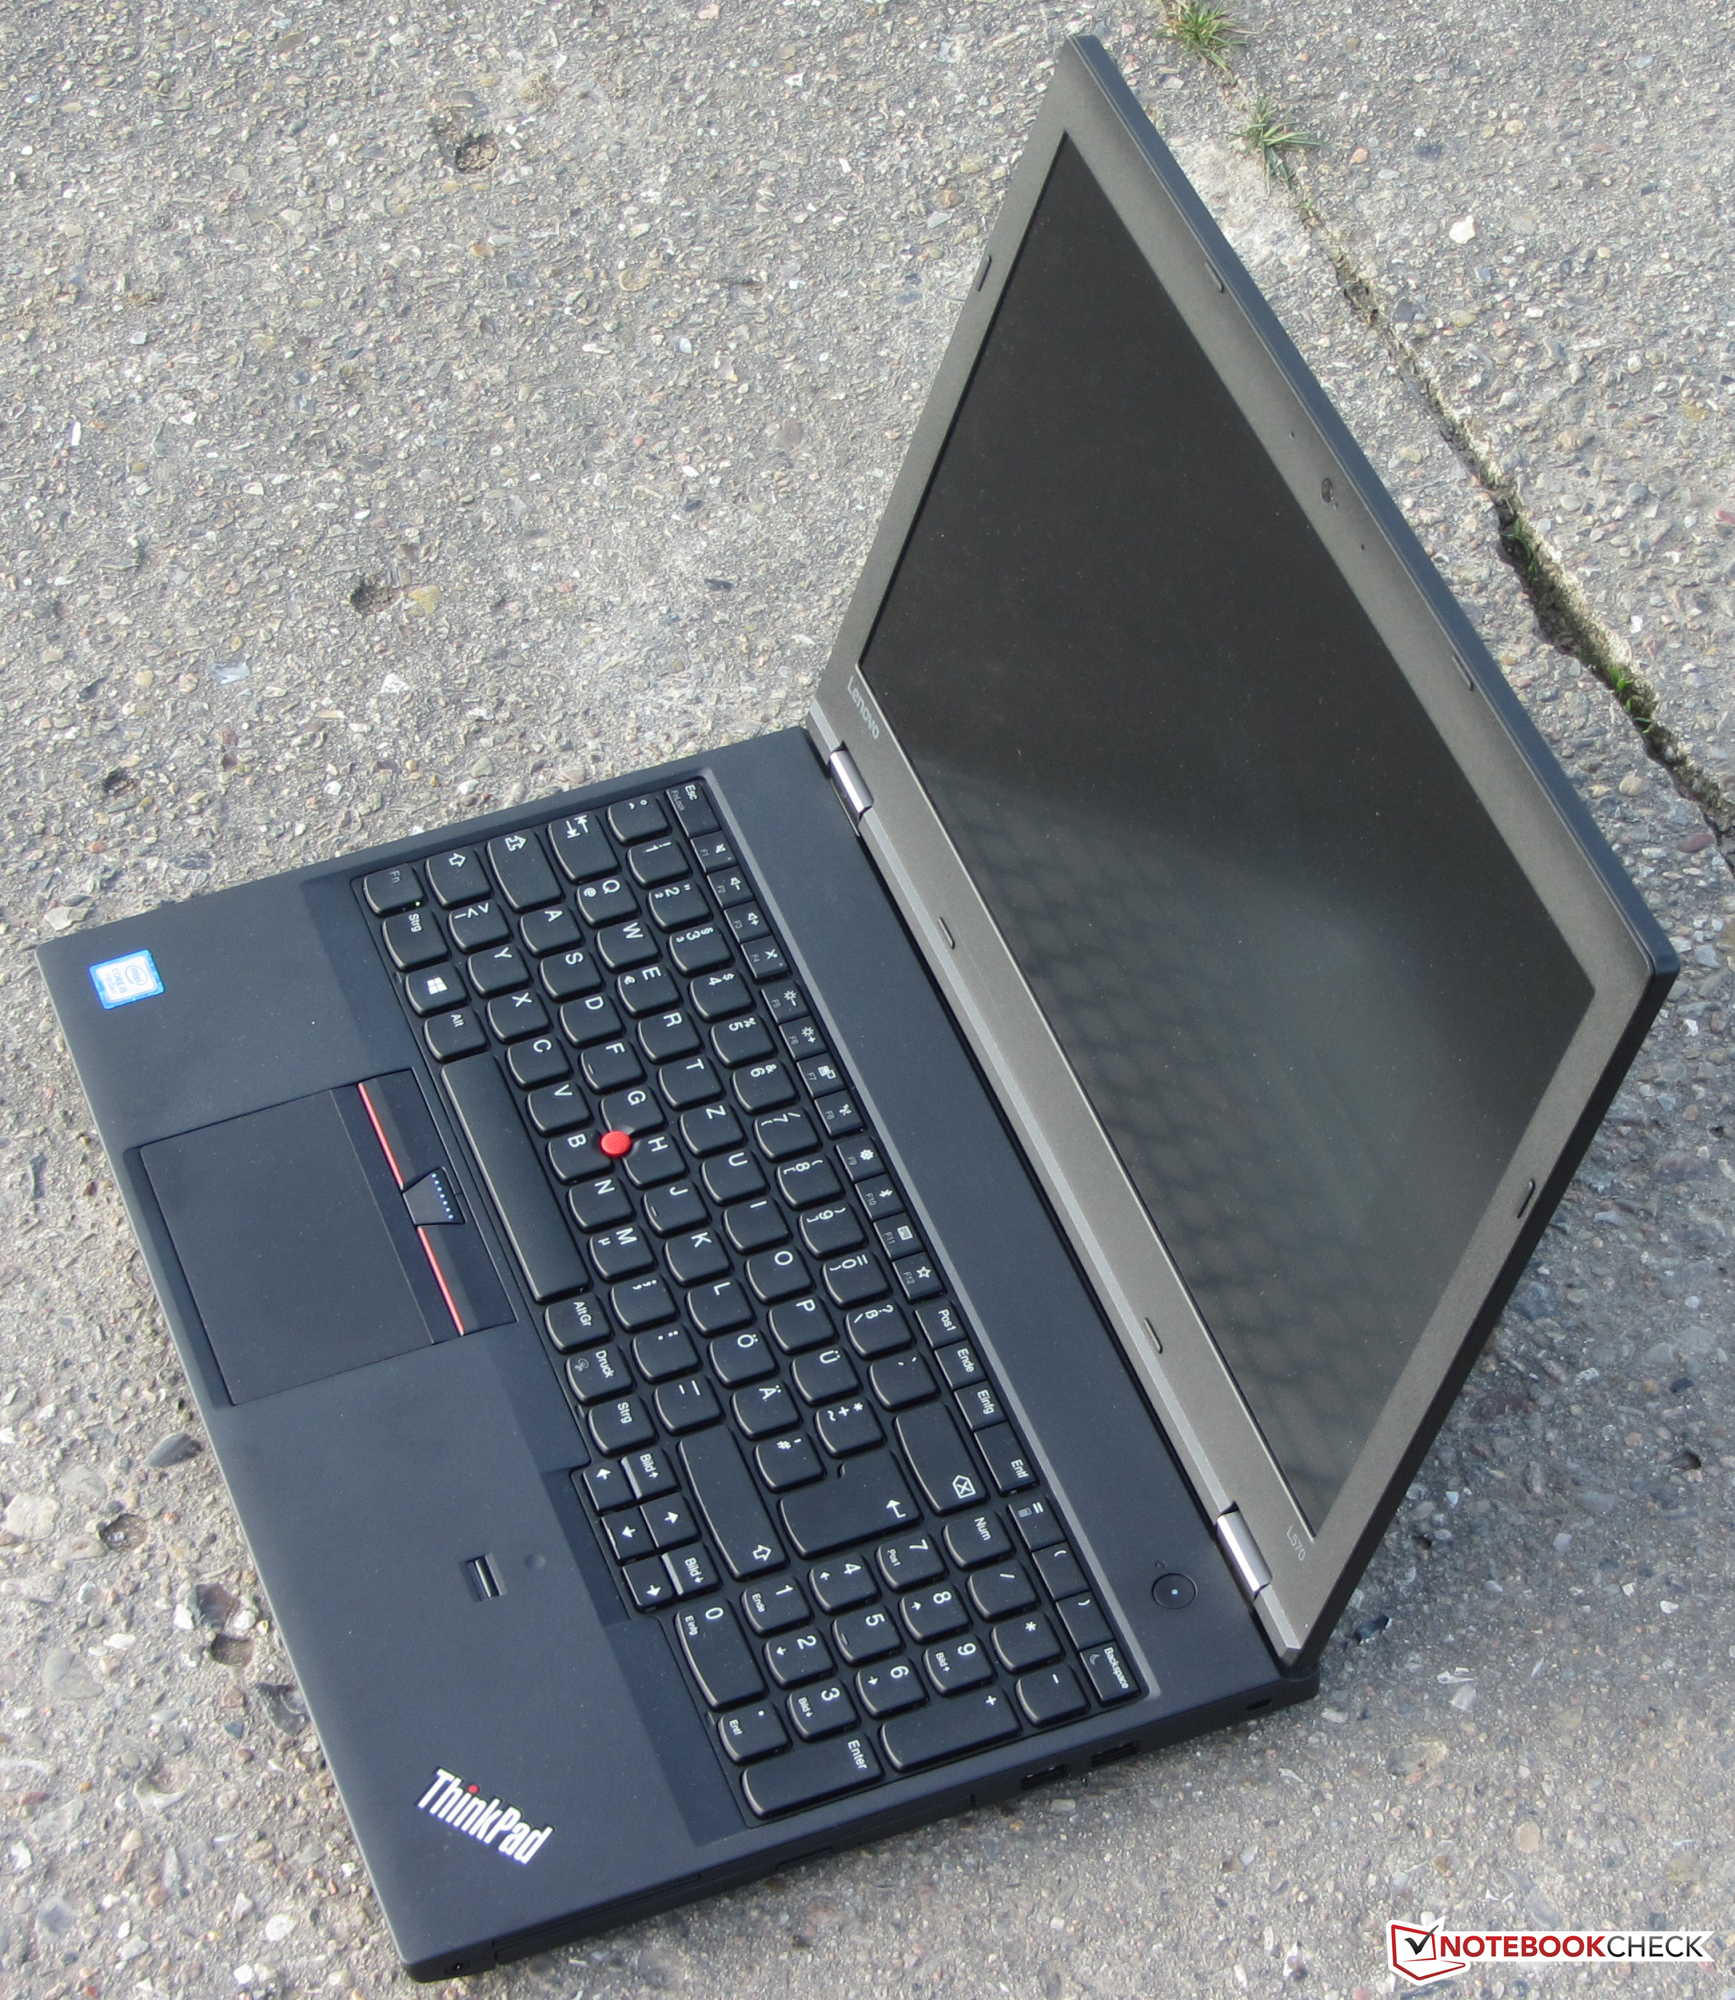
Le châssis n’a pas évolué : c’est le même que sur le ThinkPad L560. Lenovo aurait pu faire un effort à cet égard. Ce châssis n’est pas le plus solide qui soit : pour un portable de travail, il devrait faire mieux, l’appareil devant pouvoir être utilisé en déplacements. Le clavier, le clickpad et le trackpoint sont à la hauteur de ce que fait d’habitude Lenovo. Et ce même si le rétroéclairage du clavier est absent – comme sur son prédécesseur.
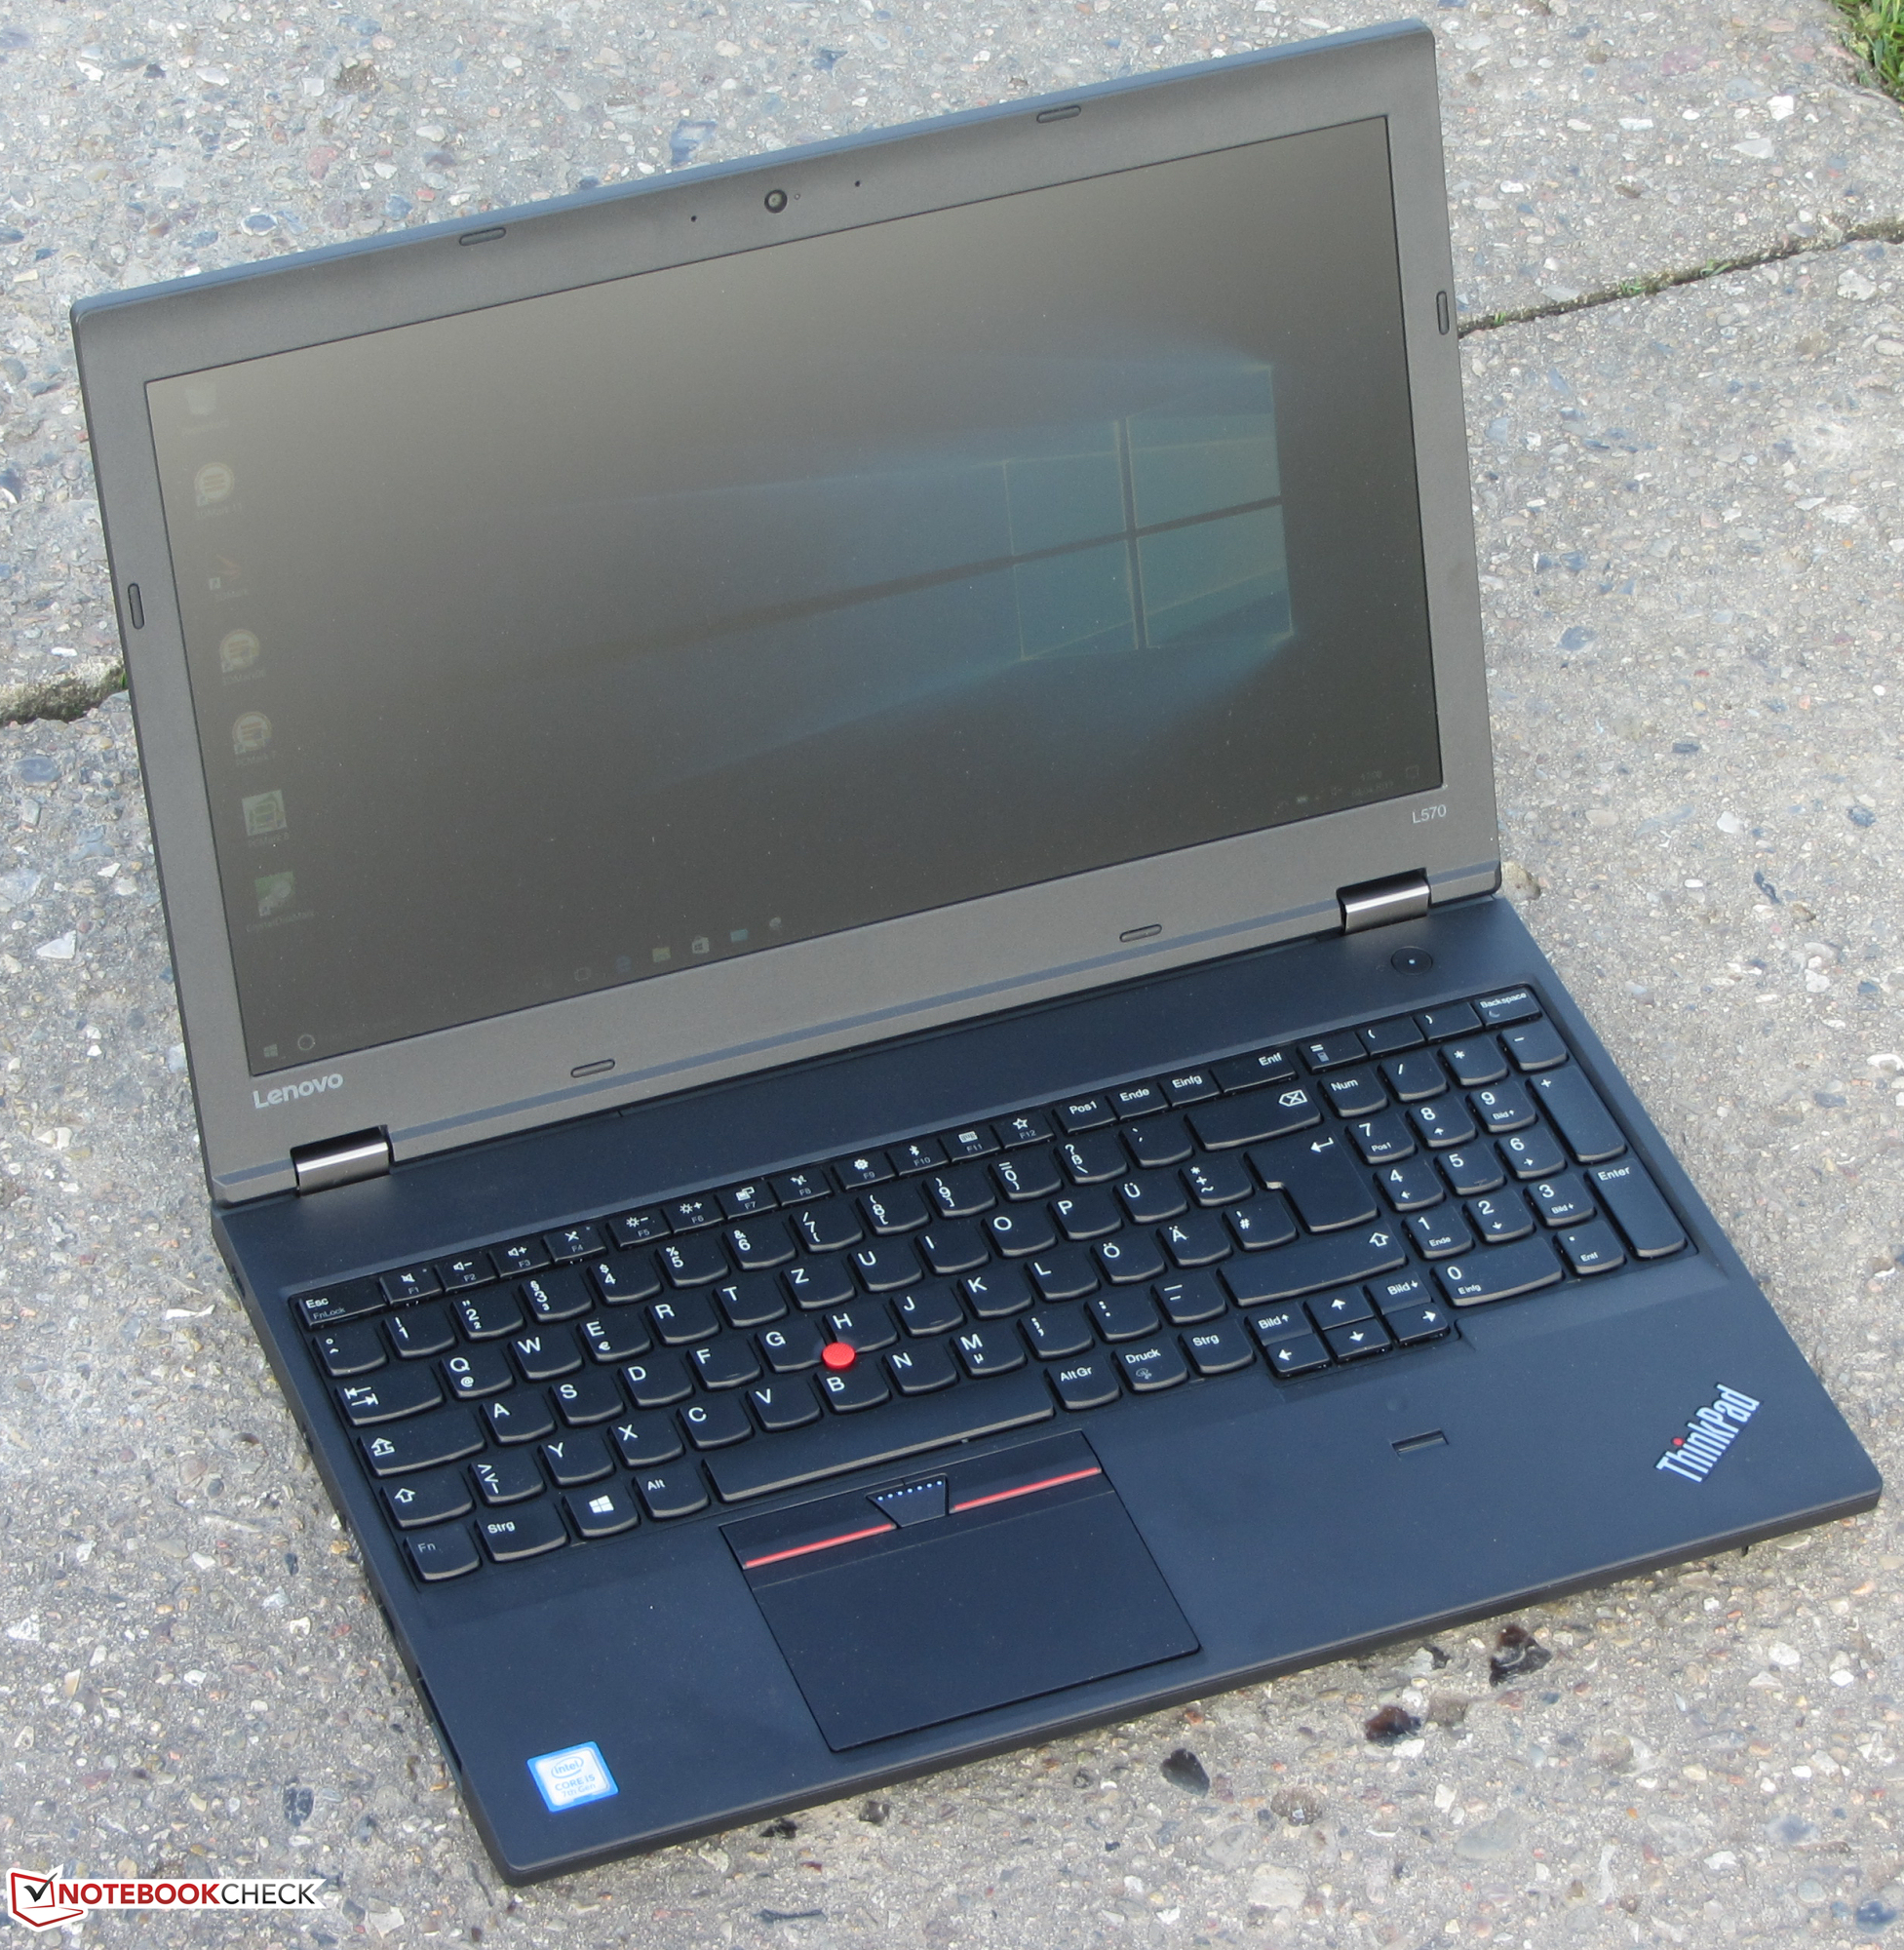
Le ThinkPad est équipé d’un écran Full HD avec des angles de vue stables et une surface mate. La luminosité et le contraste sont dans la moyenne, mais pas assez élevés pour un portable à ce prix.
L’intégralité de cette critique est disponible en anglais sur cette page.
Lenovo Thinkpad L570 20J9S01600
- 04/14/2017 v6 (old)
Sascha Mölck