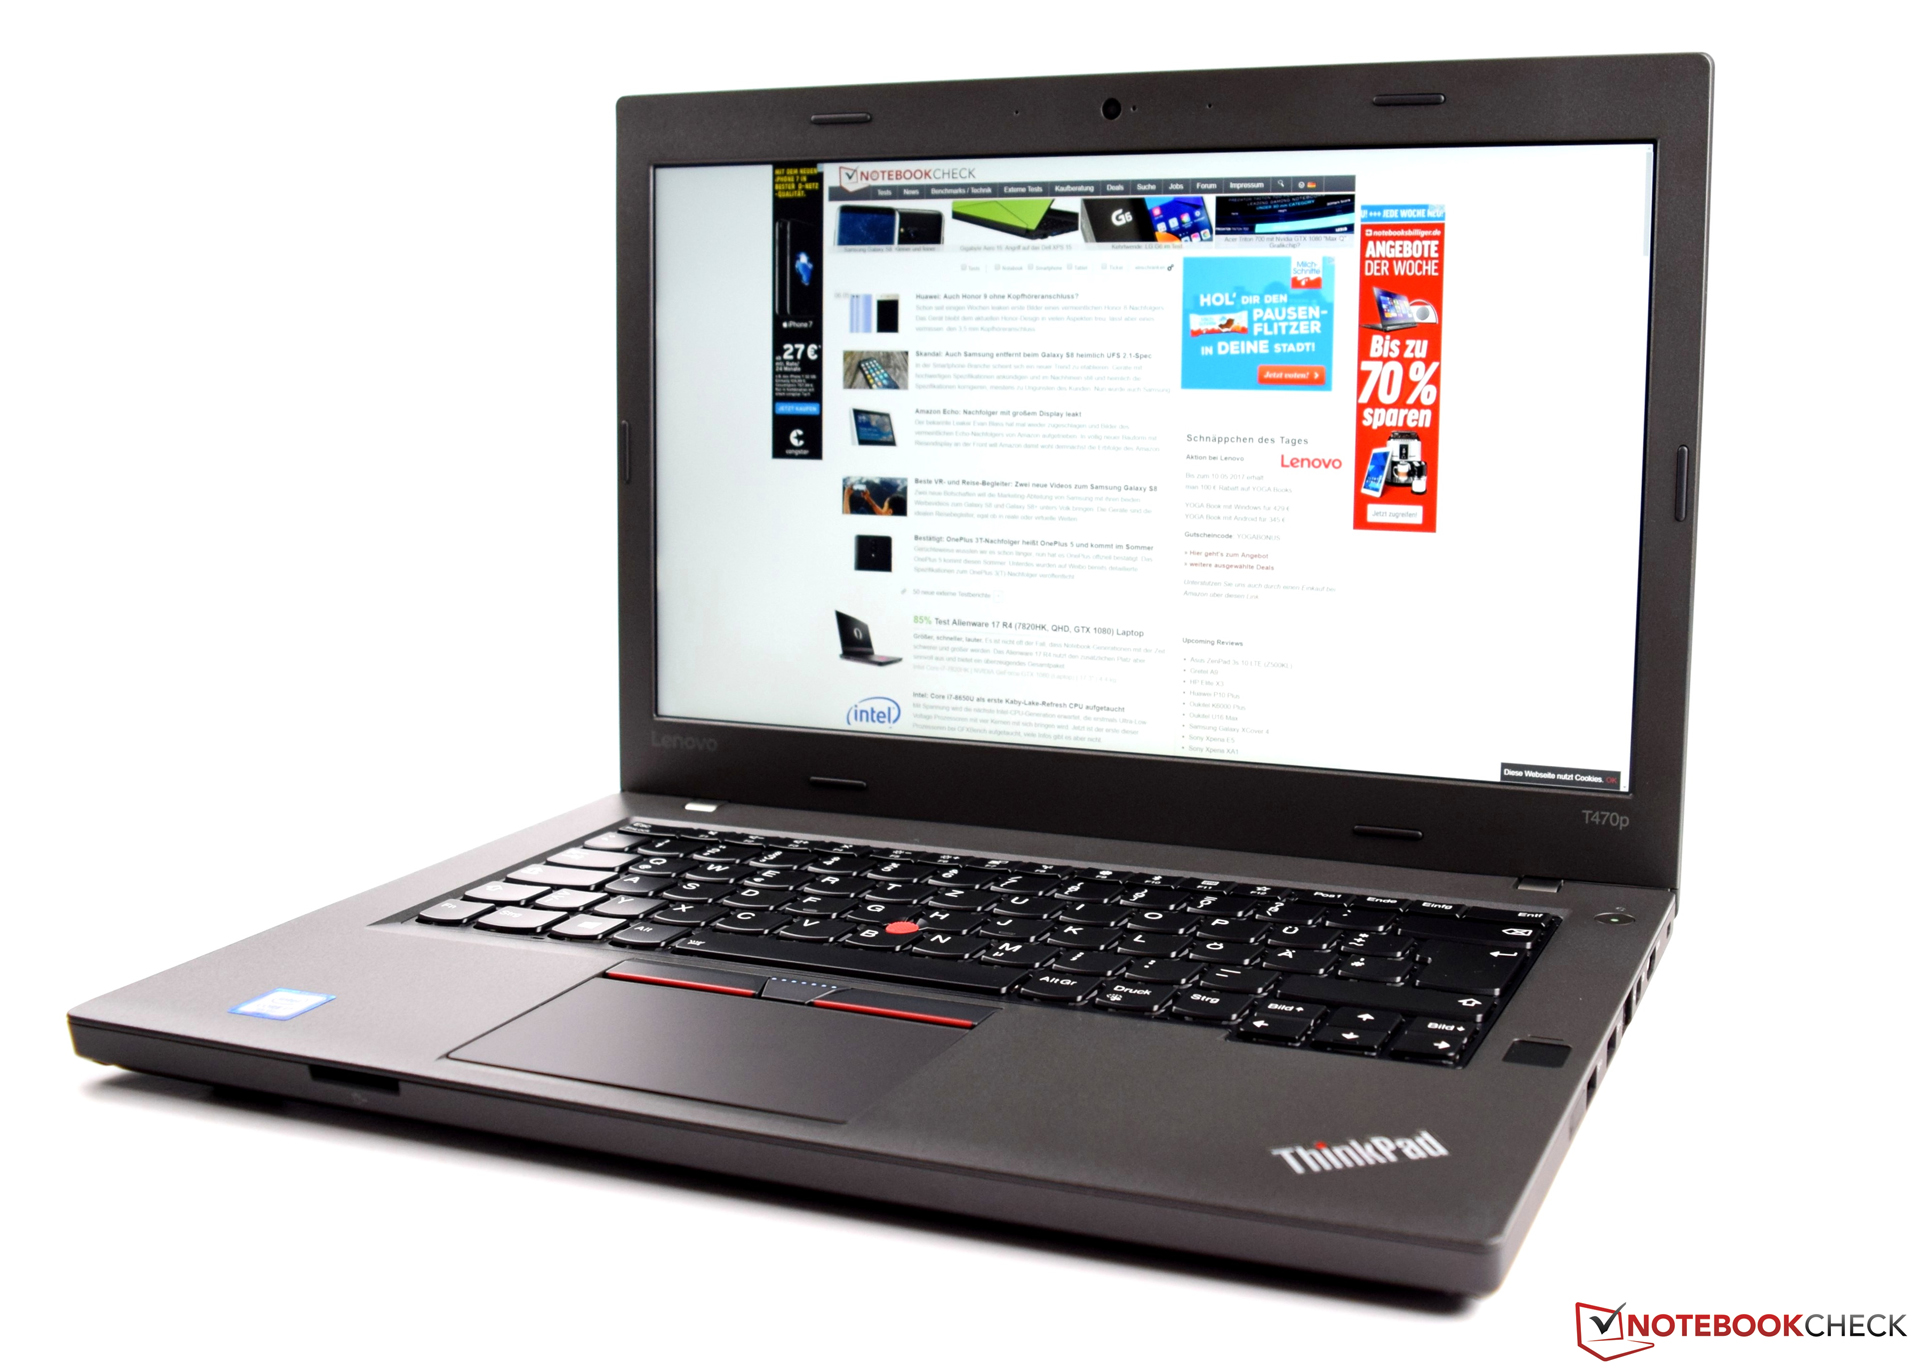
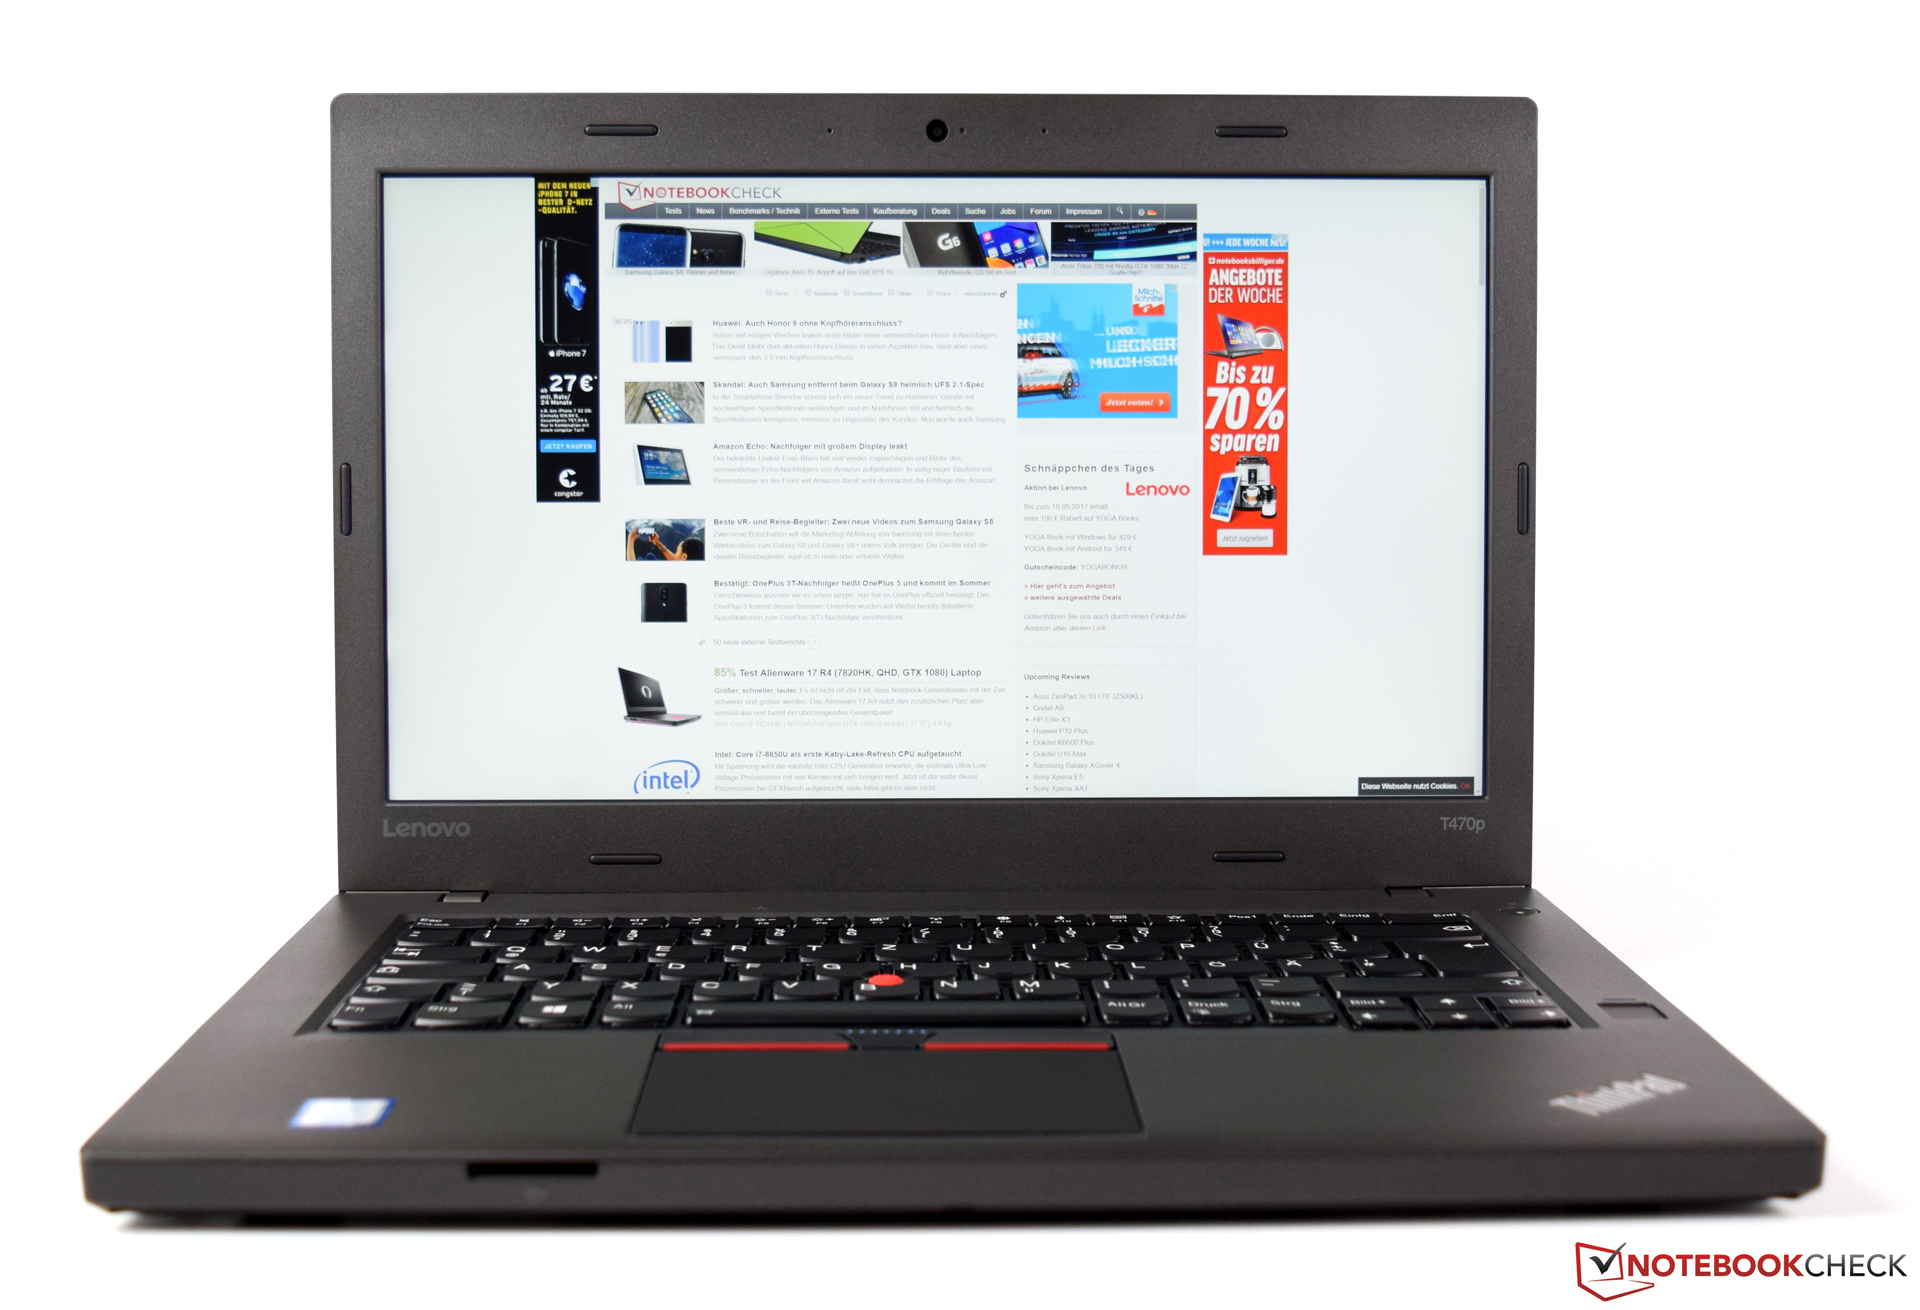
Courte critique du PC portable Lenovo ThinkPad T470p (Core i7, GeForce 940MX)
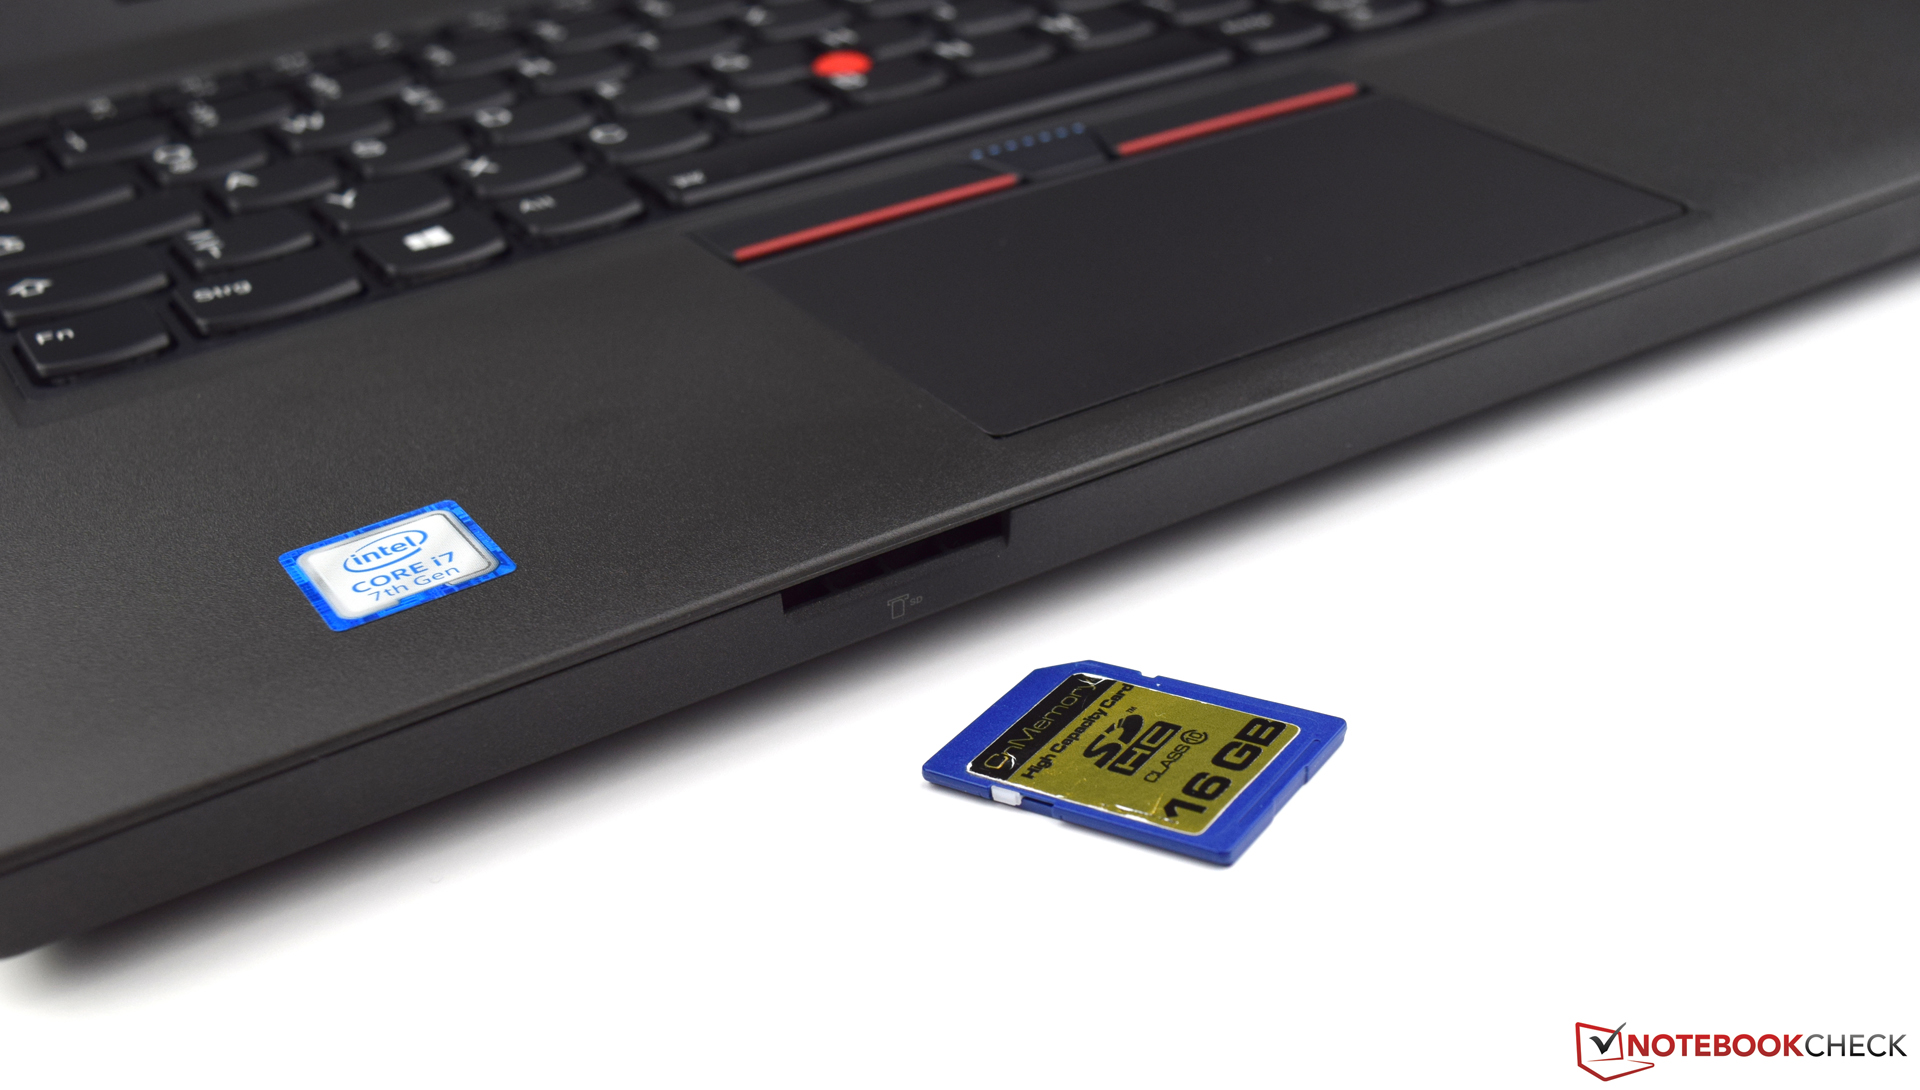
| SD Card Reader | |
| average JPG Copy Test (av. of 3 runs) | |
| Dell Latitude 14 E5470 | |
| Dell Latitude 5480 | |
| Lenovo ThinkPad T470-20HD002HGE | |
| HP EliteBook 840 G4-Z2V49ET ABD | |
| Lenovo ThinkPad T470p-20J7S00000 | |
| Lenovo ThinkPad T460p-20FXS05500 | |
| maximum AS SSD Seq Read Test (1GB) | |
| Dell Latitude 5480 | |
| Dell Latitude 14 E5470 | |
| Lenovo ThinkPad T470-20HD002HGE | |
| Lenovo ThinkPad T470p-20J7S00000 | |
| HP EliteBook 840 G4-Z2V49ET ABD | |
| Lenovo ThinkPad T460p-20FXS05500 | |
| Networking | |
| iperf3 transmit AX12 | |
| Lenovo ThinkPad T470-20HD002HGE | |
| HP EliteBook 840 G4-Z2V49ET ABD (jseb) | |
| Lenovo ThinkPad T470p-20J7S00000 | |
| Dell Latitude 5480 | |
| Dell Latitude 14 E5470 (jseb) | |
| iperf3 receive AX12 | |
| Lenovo ThinkPad T470-20HD002HGE | |
| Dell Latitude 5480 | |
| Dell Latitude 14 E5470 (jseb) | |
| HP EliteBook 840 G4-Z2V49ET ABD (jseb) | |
| Lenovo ThinkPad T470p-20J7S00000 | |
| |||||||||||||||||||||||||
Homogénéité de la luminosité: 87 %
Valeur mesurée au centre, sur batterie: 267 cd/m²
Contraste: 1084:1 (Valeurs des noirs: 0.25 cd/m²)
ΔE ColorChecker Calman: 6.68 | ∀{0.5-29.43 Ø4.73}
ΔE Greyscale Calman: 9.21 | ∀{0.09-98 Ø4.97}
94.72% sRGB (Argyll 1.6.3 3D)
61.49% AdobeRGB 1998 (Argyll 1.6.3 3D)
69.5% AdobeRGB 1998 (Argyll 3D)
94.9% sRGB (Argyll 3D)
69.3% Display P3 (Argyll 3D)
Gamma: 2.42
CCT: 6018 K
| Lenovo ThinkPad T470p-20J7S00000 IPS, 2560x1440, 14" | Lenovo ThinkPad T460p-20FXS05500 IPS-Panel, 2560x1440, 14" | Dell Latitude 14 E5470 AH-IPS, WLED, 1920x1080, 14" | Dell Latitude 5480 IPS, 1920x1080, 14" | HP EliteBook 840 G4-Z2V49ET ABD TN, 1920x1080, 14" | Lenovo ThinkPad T470-20HD002HGE IPS, 1920x1080, 14" | |
|---|---|---|---|---|---|---|
| Display | -1% | -9% | -39% | -17% | -38% | |
| Display P3 Coverage (%) | 69.3 | 66.9 -3% | 64.8 -6% | 40.62 -41% | 55.8 -19% | 41.6 -40% |
| sRGB Coverage (%) | 94.9 | 96.5 2% | 84.8 -11% | 61.2 -36% | 80.7 -15% | 61.9 -35% |
| AdobeRGB 1998 Coverage (%) | 69.5 | 68.8 -1% | 62 -11% | 41.96 -40% | 57.7 -17% | 43.06 -38% |
| Response Times | 17% | 15% | 20% | 20% | -3% | |
| Response Time Grey 50% / Grey 80% * (ms) | 52.8 ? | 38.4 ? 27% | 39 ? 26% | 32.8 ? 38% | 39 ? 26% | 41.6 ? 21% |
| Response Time Black / White * (ms) | 26.8 ? | 24.8 ? 7% | 26 ? 3% | 26.4 ? 1% | 23 ? 14% | 34 ? -27% |
| PWM Frequency (Hz) | 220 | |||||
| Screen | 11% | -2% | -4% | -35% | -4% | |
| Brightness middle (cd/m²) | 271 | 290 7% | 323 19% | 215.9 -20% | 346 28% | 306 13% |
| Brightness (cd/m²) | 266 | 280 5% | 316 19% | 205 -23% | 317 19% | 287 8% |
| Brightness Distribution (%) | 87 | 93 7% | 79 -9% | 90 3% | 86 -1% | 88 1% |
| Black Level * (cd/m²) | 0.25 | 0.31 -24% | 0.57 -128% | 0.22 12% | 0.86 -244% | 0.3 -20% |
| Contrast (:1) | 1084 | 935 -14% | 567 -48% | 981 -10% | 402 -63% | 1020 -6% |
| Colorchecker dE 2000 * | 6.68 | 3.88 42% | 3.68 45% | 5.1 24% | 8.64 -29% | 6.2 7% |
| Colorchecker dE 2000 max. * | 12.96 | 8.19 37% | 8.33 36% | 15.6 -20% | 13.58 -5% | 13.6 -5% |
| Greyscale dE 2000 * | 9.21 | 5.47 41% | 2.99 68% | 4 57% | 11.24 -22% | 5.8 37% |
| Gamma | 2.42 91% | 2.33 94% | 2.49 88% | 2.41 91% | 2.62 84% | 2.04 108% |
| CCT | 6018 108% | 6469 100% | 6572 99% | 6856 95% | 12530 52% | 6277 104% |
| Color Space (Percent of AdobeRGB 1998) (%) | 61.49 | 63.3 3% | 55 -11% | 41.96 -32% | 52 -15% | 39.62 -36% |
| Color Space (Percent of sRGB) (%) | 94.72 | 96.64 2% | 85 -10% | 61.15 -35% | 80 -16% | 61.44 -35% |
| Moyenne finale (programmes/paramètres) | 9% /
9% | 1% /
-1% | -8% /
-8% | -11% /
-24% | -15% /
-10% |
* ... Moindre est la valeur, meilleures sont les performances
Temps de réponse de l'écran
| ↔ Temps de réponse noir à blanc | ||
|---|---|---|
| 26.8 ms ... hausse ↗ et chute ↘ combinées | ↗ 6.4 ms hausse | 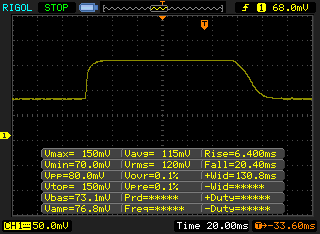 |
| ↘ 20.4 ms chute | ||
| L'écran souffre de latences relativement élevées, insuffisant pour le jeu. En comparaison, tous les appareils testés affichent entre 0.1 (minimum) et 240 (maximum) ms. » 67 % des appareils testés affichent de meilleures performances. Cela signifie que les latences relevées sont moins bonnes que la moyenne (19.9 ms) de tous les appareils testés. | ||
| ↔ Temps de réponse gris 50% à gris 80% | ||
| 52.8 ms ... hausse ↗ et chute ↘ combinées | ↗ 19.6 ms hausse | 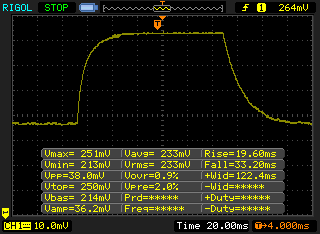 |
| ↘ 33.2 ms chute | ||
| L'écran souffre de latences très élevées, à éviter pour le jeu. En comparaison, tous les appareils testés affichent entre 0.165 (minimum) et 636 (maximum) ms. » 89 % des appareils testés affichent de meilleures performances. Cela signifie que les latences relevées sont moins bonnes que la moyenne (31.1 ms) de tous les appareils testés. | ||
Scintillement / MLI (Modulation de largeur d'impulsion)
| Scintillement / MLI (Modulation de largeur d'impulsion) non décelé | ||
En comparaison, 52 % des appareils testés n'emploient pas MDI pour assombrir leur écran. Nous avons relevé une moyenne à 7798 (minimum : 5 - maximum : 343500) Hz dans le cas où une MDI était active. | ||
| Cinebench R15 | |
| CPU Single 64Bit | |
| Dell Latitude 5480 | |
| Lenovo ThinkPad T470p-20J7S00000 | |
| Lenovo ThinkPad T460p-20FXS05500 | |
| Dell Latitude 14 E5470 | |
| Lenovo ThinkPad T470-20HD002HGE | |
| HP EliteBook 840 G4-Z2V49ET ABD | |
| CPU Multi 64Bit | |
| Lenovo ThinkPad T470p-20J7S00000 | |
| Lenovo ThinkPad T460p-20FXS05500 | |
| Dell Latitude 14 E5470 | |
| Dell Latitude 5480 | |
| HP EliteBook 840 G4-Z2V49ET ABD | |
| Lenovo ThinkPad T470-20HD002HGE | |
| JetStream 1.1 - 1.1 Total | |
| Lenovo ThinkPad T470p-20J7S00000 | |
| Lenovo ThinkPad T460p-20FXS05500 | |
| Dell Latitude 14 E5470 | |
| Lenovo ThinkPad T470-20HD002HGE | |
| Octane V2 - Total Score | |
| Lenovo ThinkPad T470p-20J7S00000 | |
| Lenovo ThinkPad T460p-20FXS05500 | |
| Dell Latitude 14 E5470 | |
| Mozilla Kraken 1.1 - Total | |
| Lenovo ThinkPad T470-20HD002HGE | |
| Dell Latitude 14 E5470 | |
| Lenovo ThinkPad T460p-20FXS05500 | |
| Lenovo ThinkPad T470p-20J7S00000 | |
* ... Moindre est la valeur, meilleures sont les performances

| PCMark 8 | |
| Home Score Accelerated v2 | |
| Dell Latitude 5480 | |
| Lenovo ThinkPad T470p-20J7S00000 | |
| Lenovo ThinkPad T470-20HD002HGE | |
| HP EliteBook 840 G4-Z2V49ET ABD | |
| Dell Latitude 14 E5470 | |
| Lenovo ThinkPad T460p-20FXS05500 | |
| Work Score Accelerated v2 | |
| Dell Latitude 5480 | |
| Lenovo ThinkPad T470-20HD002HGE | |
| Lenovo ThinkPad T470p-20J7S00000 | |
| Dell Latitude 14 E5470 | |
| HP EliteBook 840 G4-Z2V49ET ABD | |
| Lenovo ThinkPad T460p-20FXS05500 | |
| Creative Score Accelerated v2 | |
| Dell Latitude 5480 | |
| Lenovo ThinkPad T470p-20J7S00000 | |
| HP EliteBook 840 G4-Z2V49ET ABD | |
| Lenovo ThinkPad T470-20HD002HGE | |
| Dell Latitude 14 E5470 | |
| Lenovo ThinkPad T460p-20FXS05500 | |
| PCMark 7 Score | 5766 points | |
| PCMark 8 Home Score Accelerated v2 | 3650 points | |
| PCMark 8 Creative Score Accelerated v2 | 4883 points | |
| PCMark 8 Work Score Accelerated v2 | 4654 points | |
Aide | ||
| Lenovo ThinkPad T470p-20J7S00000 Samsung PM961 NVMe MZVLW512HMJP | Lenovo ThinkPad T460p-20FXS05500 Samsung SSD PM871 MZ7LN512HCHP | Dell Latitude 14 E5470 Micron SSD 1100 (MTFDDAV256TBN) | Dell Latitude 5480 Toshiba SG5 256GB THNSNK256GVN8 | HP EliteBook 840 G4-Z2V49ET ABD Samsung PM961 MZVLW256HEHP | Lenovo ThinkPad T470-20HD002HGE Samsung PM961 NVMe MZVLW512HMJP | |
|---|---|---|---|---|---|---|
| CrystalDiskMark 3.0 | -49% | -60% | -55% | 8% | -6% | |
| Read Seq (MB/s) | 1088 | 502 -54% | 465.4 -57% | 469.4 -57% | 1819 67% | 1155 6% |
| Write Seq (MB/s) | 1023 | 442 -57% | 363.1 -65% | 264.8 -74% | 1263 23% | 1076 5% |
| Read 512 (MB/s) | 731 | 411.4 -44% | 338.4 -54% | 408.1 -44% | 922 26% | 811 11% |
| Write 512 (MB/s) | 798 | 414.3 -48% | 246.1 -69% | 265.5 -67% | 804 1% | 862 8% |
| Read 4k (MB/s) | 60.9 | 29.18 -52% | 25.83 -58% | 24.66 -60% | 61.4 1% | 55.5 -9% |
| Write 4k (MB/s) | 166.8 | 86.5 -48% | 80.3 -52% | 114.8 -31% | 157.1 -6% | 134.6 -19% |
| Read 4k QD32 (MB/s) | 652 | 358.1 -45% | 246.1 -62% | 380.3 -42% | 513 -21% | 496.2 -24% |
| Write 4k QD32 (MB/s) | 563 | 319.8 -43% | 197.7 -65% | 207.2 -63% | 410.2 -27% | 425.4 -24% |

| 3DMark | |
| 1280x720 Cloud Gate Standard Graphics | |
| Lenovo ThinkPad T470p-20J7S00000 | |
| Lenovo ThinkPad T460p-20FXS05500 | |
| Dell Latitude 5480 | |
| HP EliteBook 840 G4-Z2V49ET ABD | |
| Lenovo ThinkPad T470-20HD002HGE | |
| Dell Latitude 14 E5470 | |
| 1920x1080 Fire Strike Graphics | |
| Lenovo ThinkPad T470p-20J7S00000 | |
| Lenovo ThinkPad T460p-20FXS05500 | |
| Dell Latitude 5480 | |
| Lenovo ThinkPad T470-20HD002HGE | |
| Dell Latitude 14 E5470 | |
| HP EliteBook 840 G4-Z2V49ET ABD | |
| 3DMark 11 - 1280x720 Performance GPU | |
| Lenovo ThinkPad T470p-20J7S00000 | |
| Lenovo ThinkPad T460p-20FXS05500 | |
| Dell Latitude 5480 | |
| Lenovo ThinkPad T470-20HD002HGE | |
| HP EliteBook 840 G4-Z2V49ET ABD | |
| Dell Latitude 14 E5470 | |
| 3DMark 11 Performance | 3428 points | |
| 3DMark Ice Storm Standard Score | 36216 points | |
| 3DMark Cloud Gate Standard Score | 11802 points | |
| 3DMark Fire Strike Score | 2253 points | |
| 3DMark Fire Strike Extreme Score | 1089 points | |
| 3DMark Time Spy Score | 737 points | |
Aide | ||
| Bas | Moyen | Élevé | Ultra | |
|---|---|---|---|---|
| BioShock Infinite (2013) | 129.4 | 79.3 | 68.3 | 25.5 |
| Battlefield 4 (2013) | 98.8 | 69.1 | 48.8 | 19.8 |
| The Witcher 3 (2015) | 49.2 | 28.4 | 14.6 | |
| Rise of the Tomb Raider (2016) | 51.8 | 30.6 | 17 |
Degré de la nuisance sonore
| Au repos |
| 29 / 29 / 29 dB(A) |
| Fortement sollicité |
| 35.6 / 39.7 dB(A) |
 | ||
30 dB silencieux 40 dB(A) audible 50 dB(A) bruyant |
||
min: | ||
| Lenovo ThinkPad T470p-20J7S00000 i7-7700HQ, GeForce 940MX | Lenovo ThinkPad T460p-20FXS05500 6700HQ, GeForce 940MX | Dell Latitude 14 E5470 6440HQ, HD Graphics 530 | Dell Latitude 5480 i7-7600U, HD Graphics 620 | HP EliteBook 840 G4-Z2V49ET ABD i5-7200U, HD Graphics 620 | Lenovo ThinkPad T470-20HD002HGE i5-7200U, HD Graphics 620 | |
|---|---|---|---|---|---|---|
| Noise | 1% | 1% | -9% | -1% | 6% | |
| arrêt / environnement * (dB) | 29 | 29.2 -1% | 30.3 -4% | 31 -7% | 28 3% | |
| Idle Minimum * (dB) | 29 | 29.2 -1% | 30.3 -4% | 29.6 -2% | 31 -7% | 28 3% |
| Idle Average * (dB) | 29 | 29.2 -1% | 30.3 -4% | 29.6 -2% | 31 -7% | 28 3% |
| Idle Maximum * (dB) | 29 | 29.2 -1% | 30.3 -4% | 29.6 -2% | 31 -7% | 29.4 -1% |
| Load Average * (dB) | 35.6 | 33.5 6% | 31.6 11% | 42 -18% | 33.5 6% | 31.4 12% |
| Load Maximum * (dB) | 39.7 | 38.8 2% | 35 12% | 47.1 -19% | 33.7 15% | 34.6 13% |
* ... Moindre est la valeur, meilleures sont les performances
(-) La température maximale du côté supérieur est de 50.2 °C / 122 F, par rapport à la moyenne de 34.3 °C / 94 F, allant de 21.2 à 62.5 °C pour la classe Office.
(-) Le fond chauffe jusqu'à un maximum de 51.3 °C / 124 F, contre une moyenne de 36.8 °C / 98 F
(+) En utilisation inactive, la température moyenne du côté supérieur est de 25.4 °C / 78 F, par rapport à la moyenne du dispositif de 29.5 °C / 85 F.
(±) Les repose-poignets et le pavé tactile peuvent devenir très chauds au toucher, avec un maximum de 38.5 °C / 101.3# F.
(-) La température moyenne de la zone de l'appui-paume de dispositifs similaires était de 27.5 °C / 81.5 F (-11 °C / #-19.8 F).
| Lenovo ThinkPad T470p-20J7S00000 i7-7700HQ, GeForce 940MX | Lenovo ThinkPad T460p-20FXS05500 6700HQ, GeForce 940MX | Dell Latitude 14 E5470 6440HQ, HD Graphics 530 | Dell Latitude 5480 i7-7600U, HD Graphics 620 | HP EliteBook 840 G4-Z2V49ET ABD i5-7200U, HD Graphics 620 | Lenovo ThinkPad T470-20HD002HGE i5-7200U, HD Graphics 620 | |
|---|---|---|---|---|---|---|
| Heat | -11% | -1% | 11% | 15% | 14% | |
| Maximum Upper Side * (°C) | 50.2 | 51.6 -3% | 43 14% | 36.4 27% | 37 26% | 37.2 26% |
| Maximum Bottom * (°C) | 51.3 | 55.2 -8% | 43 16% | 45 12% | 39.4 23% | 45.1 12% |
| Idle Upper Side * (°C) | 26.3 | 30.7 -17% | 31.2 -19% | 26.4 -0% | 25.9 2% | 24.4 7% |
| Idle Bottom * (°C) | 27.5 | 31.5 -15% | 31.3 -14% | 26.8 3% | 25.6 7% | 25 9% |
* ... Moindre est la valeur, meilleures sont les performances
Lenovo ThinkPad T470p-20J7S00000 analyse audio
(+) | les haut-parleurs peuvent jouer relativement fort (83.1# dB)
Basses 100 - 315 Hz
(-) | presque aucune basse - en moyenne 18.1% plus bas que la médiane
(±) | la linéarité des basses est moyenne (14.6% delta à la fréquence précédente)
Médiums 400 - 2000 Hz
(+) | médiane équilibrée - seulement 4.2% de la médiane
(+) | les médiums sont linéaires (5.9% delta à la fréquence précédente)
Aiguës 2 - 16 kHz
(+) | des sommets équilibrés - à seulement 3.3% de la médiane
(+) | les aigus sont linéaires (6.5% delta à la fréquence précédente)
Globalement 100 - 16 000 Hz
(±) | la linéarité du son global est moyenne (19.6% de différence avec la médiane)
Par rapport à la même classe
» 40% de tous les appareils testés de cette catégorie étaient meilleurs, 8% similaires, 52% pires
» Le meilleur avait un delta de 7%, la moyenne était de 21%, le pire était de 53%.
Par rapport à tous les appareils testés
» 49% de tous les appareils testés étaient meilleurs, 7% similaires, 44% pires
» Le meilleur avait un delta de 4%, la moyenne était de 24%, le pire était de 134%.
Apple MacBook 12 (Early 2016) 1.1 GHz analyse audio
(+) | les haut-parleurs peuvent jouer relativement fort (83.6# dB)
Basses 100 - 315 Hz
(±) | basse réduite - en moyenne 11.3% inférieure à la médiane
(±) | la linéarité des basses est moyenne (14.2% delta à la fréquence précédente)
Médiums 400 - 2000 Hz
(+) | médiane équilibrée - seulement 2.4% de la médiane
(+) | les médiums sont linéaires (5.5% delta à la fréquence précédente)
Aiguës 2 - 16 kHz
(+) | des sommets équilibrés - à seulement 2% de la médiane
(+) | les aigus sont linéaires (4.5% delta à la fréquence précédente)
Globalement 100 - 16 000 Hz
(+) | le son global est linéaire (10.2% différence à la médiane)
Par rapport à la même classe
» 7% de tous les appareils testés de cette catégorie étaient meilleurs, 2% similaires, 91% pires
» Le meilleur avait un delta de 5%, la moyenne était de 18%, le pire était de 53%.
Par rapport à tous les appareils testés
» 5% de tous les appareils testés étaient meilleurs, 1% similaires, 94% pires
» Le meilleur avait un delta de 4%, la moyenne était de 24%, le pire était de 134%.
| Éteint/en veille | |
| Au repos | |
| Fortement sollicité |
|
Légende:
min: | |
| Lenovo ThinkPad T470p-20J7S00000 i7-7700HQ, GeForce 940MX, Samsung PM961 NVMe MZVLW512HMJP, IPS, 2560x1440, 14" | Lenovo ThinkPad T460p-20FXS05500 6700HQ, GeForce 940MX, Samsung SSD PM871 MZ7LN512HCHP, IPS-Panel, 2560x1440, 14" | Dell Latitude 14 E5470 6440HQ, HD Graphics 530, Micron SSD 1100 (MTFDDAV256TBN), AH-IPS, WLED, 1920x1080, 14" | Dell Latitude 5480 i7-7600U, HD Graphics 620, Toshiba SG5 256GB THNSNK256GVN8, IPS, 1920x1080, 14" | HP EliteBook 840 G4-Z2V49ET ABD i5-7200U, HD Graphics 620, Samsung PM961 MZVLW256HEHP, TN, 1920x1080, 14" | Lenovo ThinkPad T470-20HD002HGE i5-7200U, HD Graphics 620, Samsung PM961 NVMe MZVLW512HMJP, IPS, 1920x1080, 14" | |
|---|---|---|---|---|---|---|
| Power Consumption | -22% | 1% | 7% | 29% | 29% | |
| Idle Minimum * (Watt) | 3.8 | 5 -32% | 4.1 -8% | 6.64 -75% | 2.9 24% | 3.21 16% |
| Idle Average * (Watt) | 6.5 | 9.9 -52% | 8.1 -25% | 6.67 -3% | 5.6 14% | 6.15 5% |
| Idle Maximum * (Watt) | 7.2 | 10.8 -50% | 11.4 -58% | 7.78 -8% | 8.15 -13% | 6.82 5% |
| Load Average * (Watt) | 62.5 | 52.4 16% | 33.5 46% | 30.83 51% | 30.6 51% | 28.5 54% |
| Load Maximum * (Watt) | 99.6 | 89.8 10% | 49 51% | 31.7 68% | 31 69% | 34.5 65% |
* ... Moindre est la valeur, meilleures sont les performances
| Lenovo ThinkPad T470p-20J7S00000 i7-7700HQ, GeForce 940MX, 72 Wh | Lenovo ThinkPad T460p-20FXS05500 6700HQ, GeForce 940MX, 48 Wh | Dell Latitude 14 E5470 6440HQ, HD Graphics 530, 62 Wh | Dell Latitude 5480 i7-7600U, HD Graphics 620, 68 Wh | HP EliteBook 840 G4-Z2V49ET ABD i5-7200U, HD Graphics 620, 51 Wh | Lenovo ThinkPad T470-20HD002HGE i5-7200U, HD Graphics 620, 48 Wh | |
|---|---|---|---|---|---|---|
| Autonomie de la batterie | -35% | -13% | 63% | 39% | 13% | |
| Reader / Idle (h) | 17.7 | 11 -38% | 15.2 -14% | 24.1 36% | 19.3 9% | |
| H.264 (h) | 7.6 | 6 -21% | 6.9 -9% | 9.9 30% | 10.4 37% | |
| WiFi v1.3 (h) | 10 | 5 -50% | 7.2 -28% | 16.1 61% | 9.5 -5% | 7.3 -27% |
| Load (h) | 1.4 | 1 -29% | 1.4 0% | 2.7 93% | 3.1 121% | 1.8 29% |
Points positifs
Points négatifs
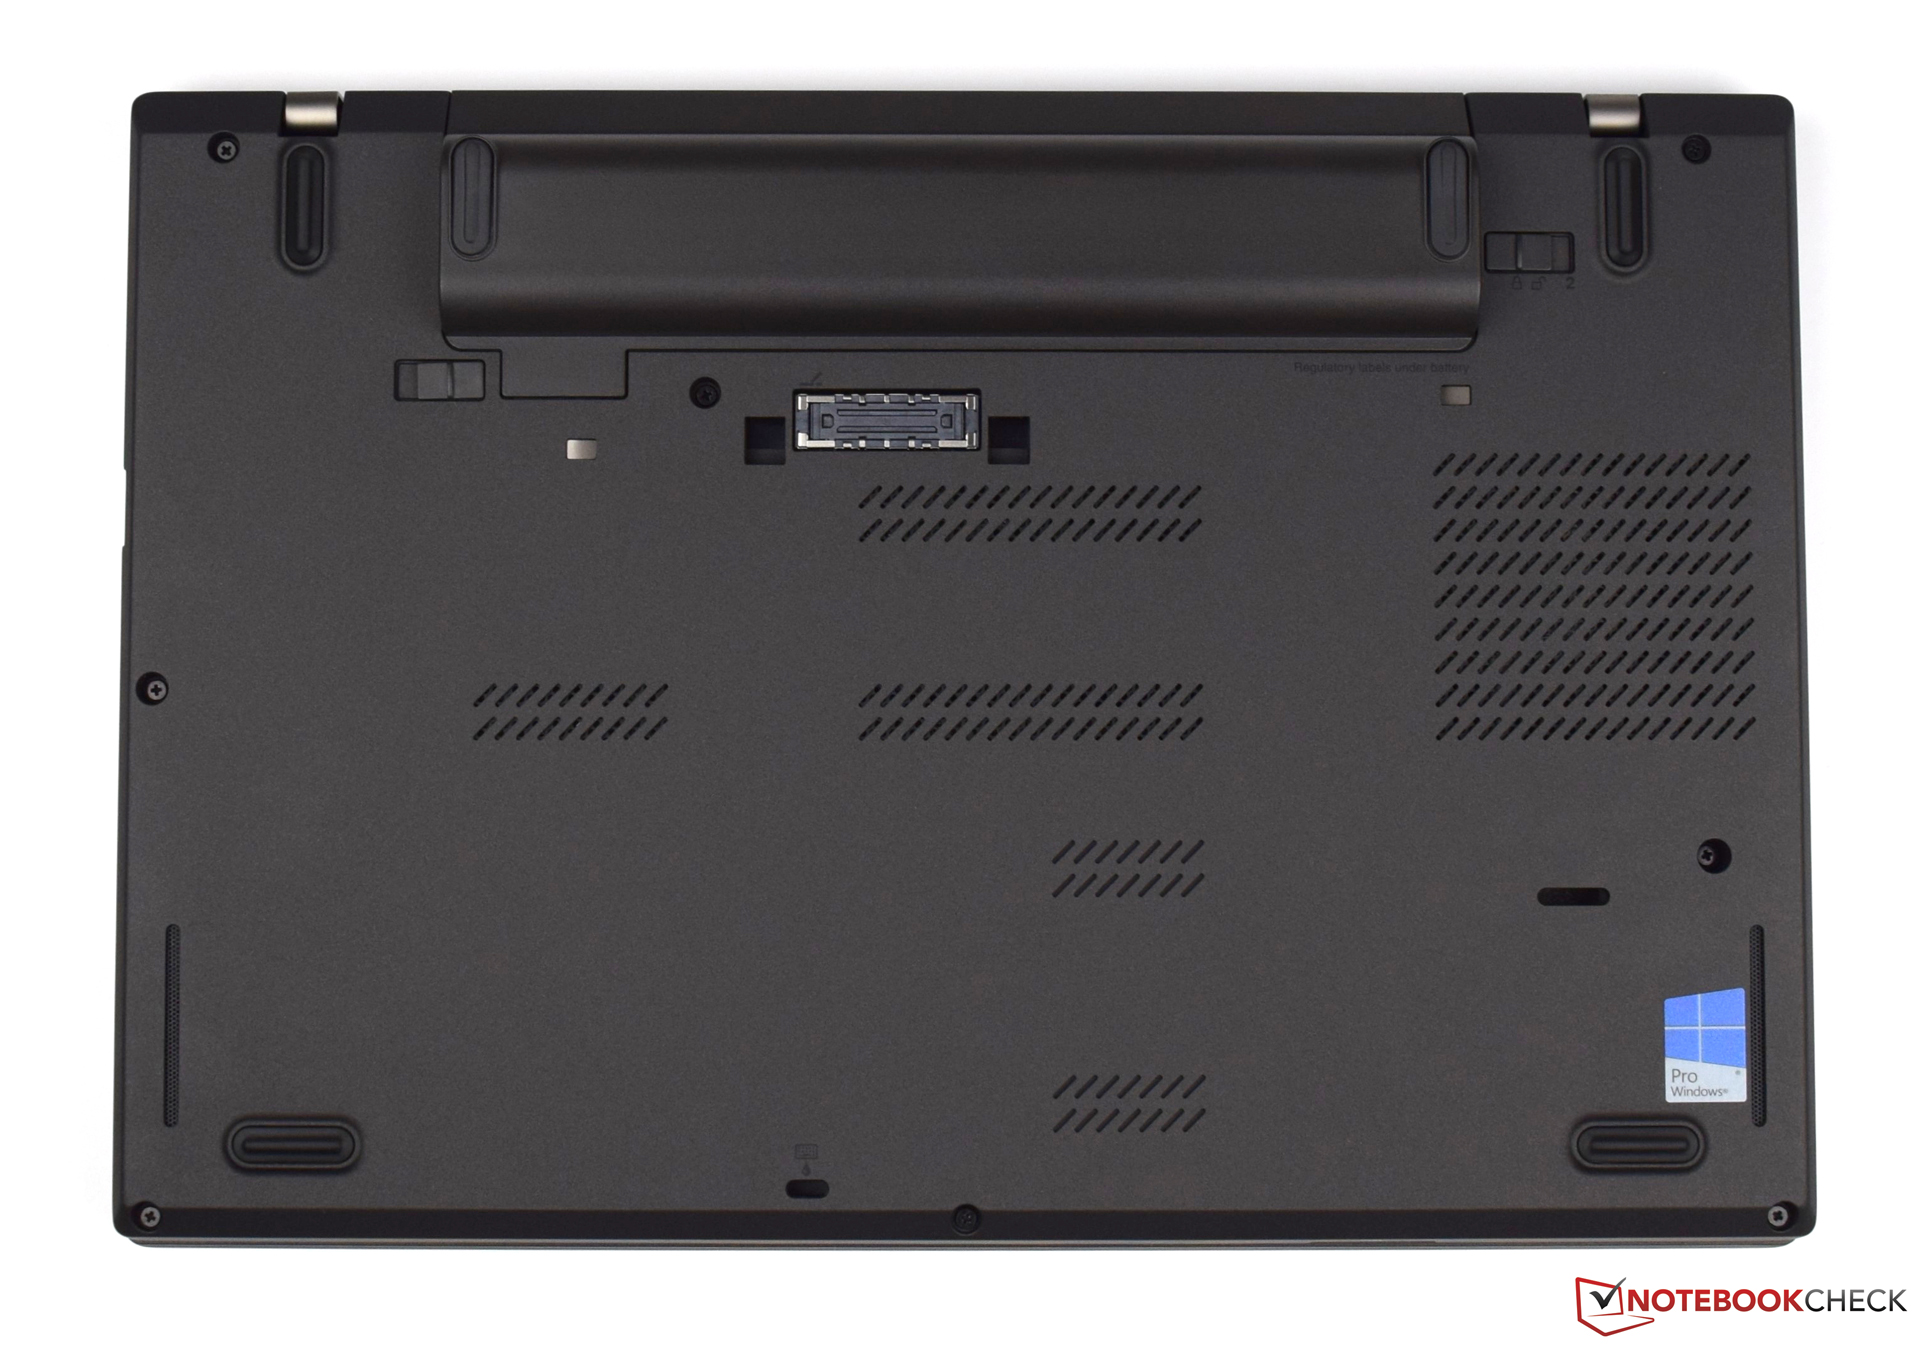
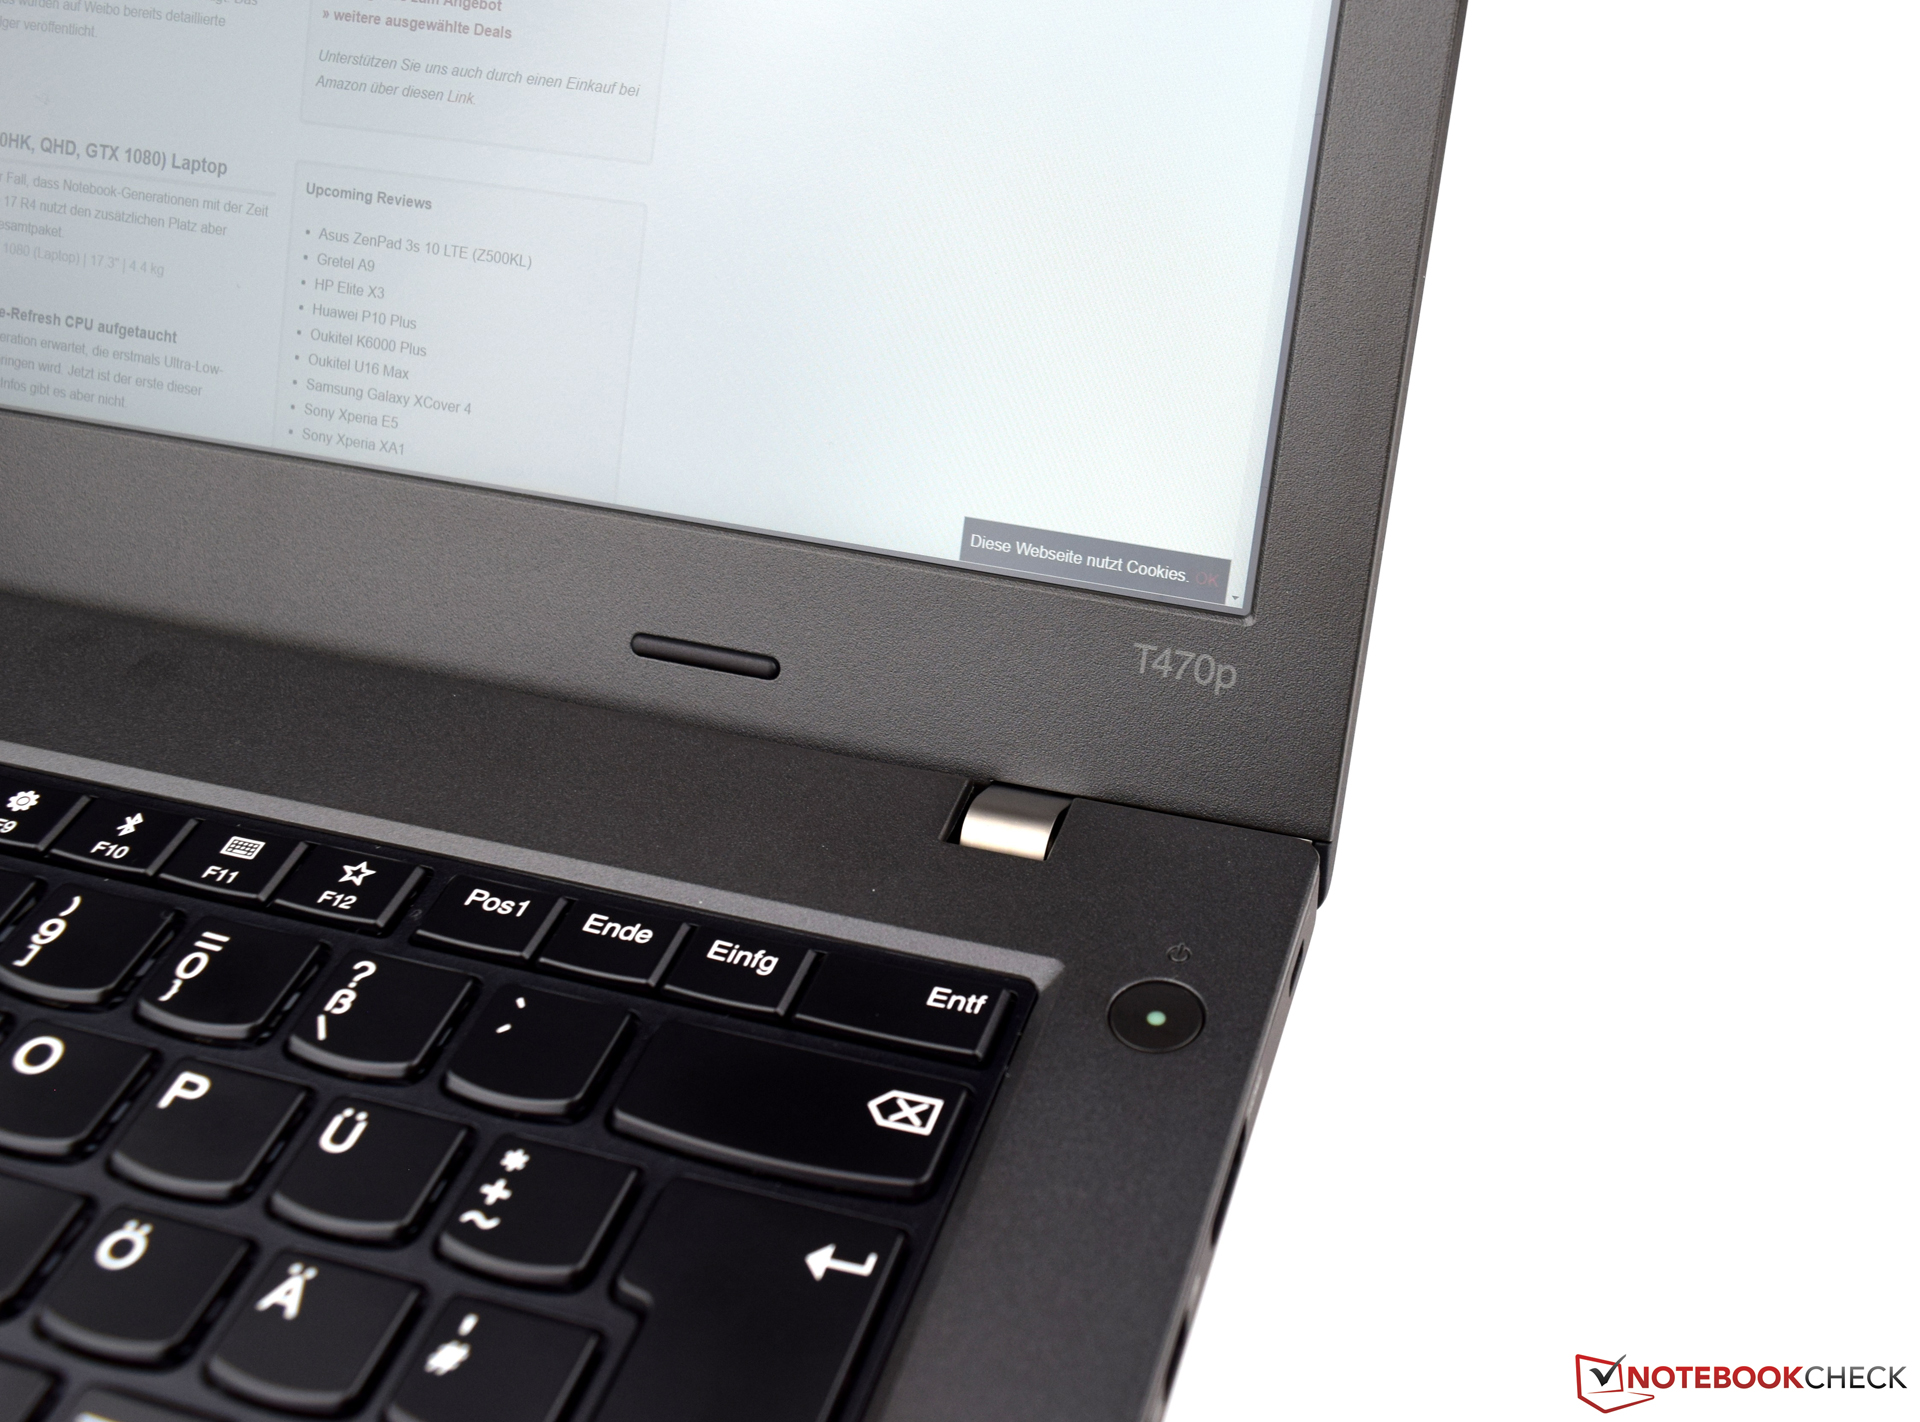
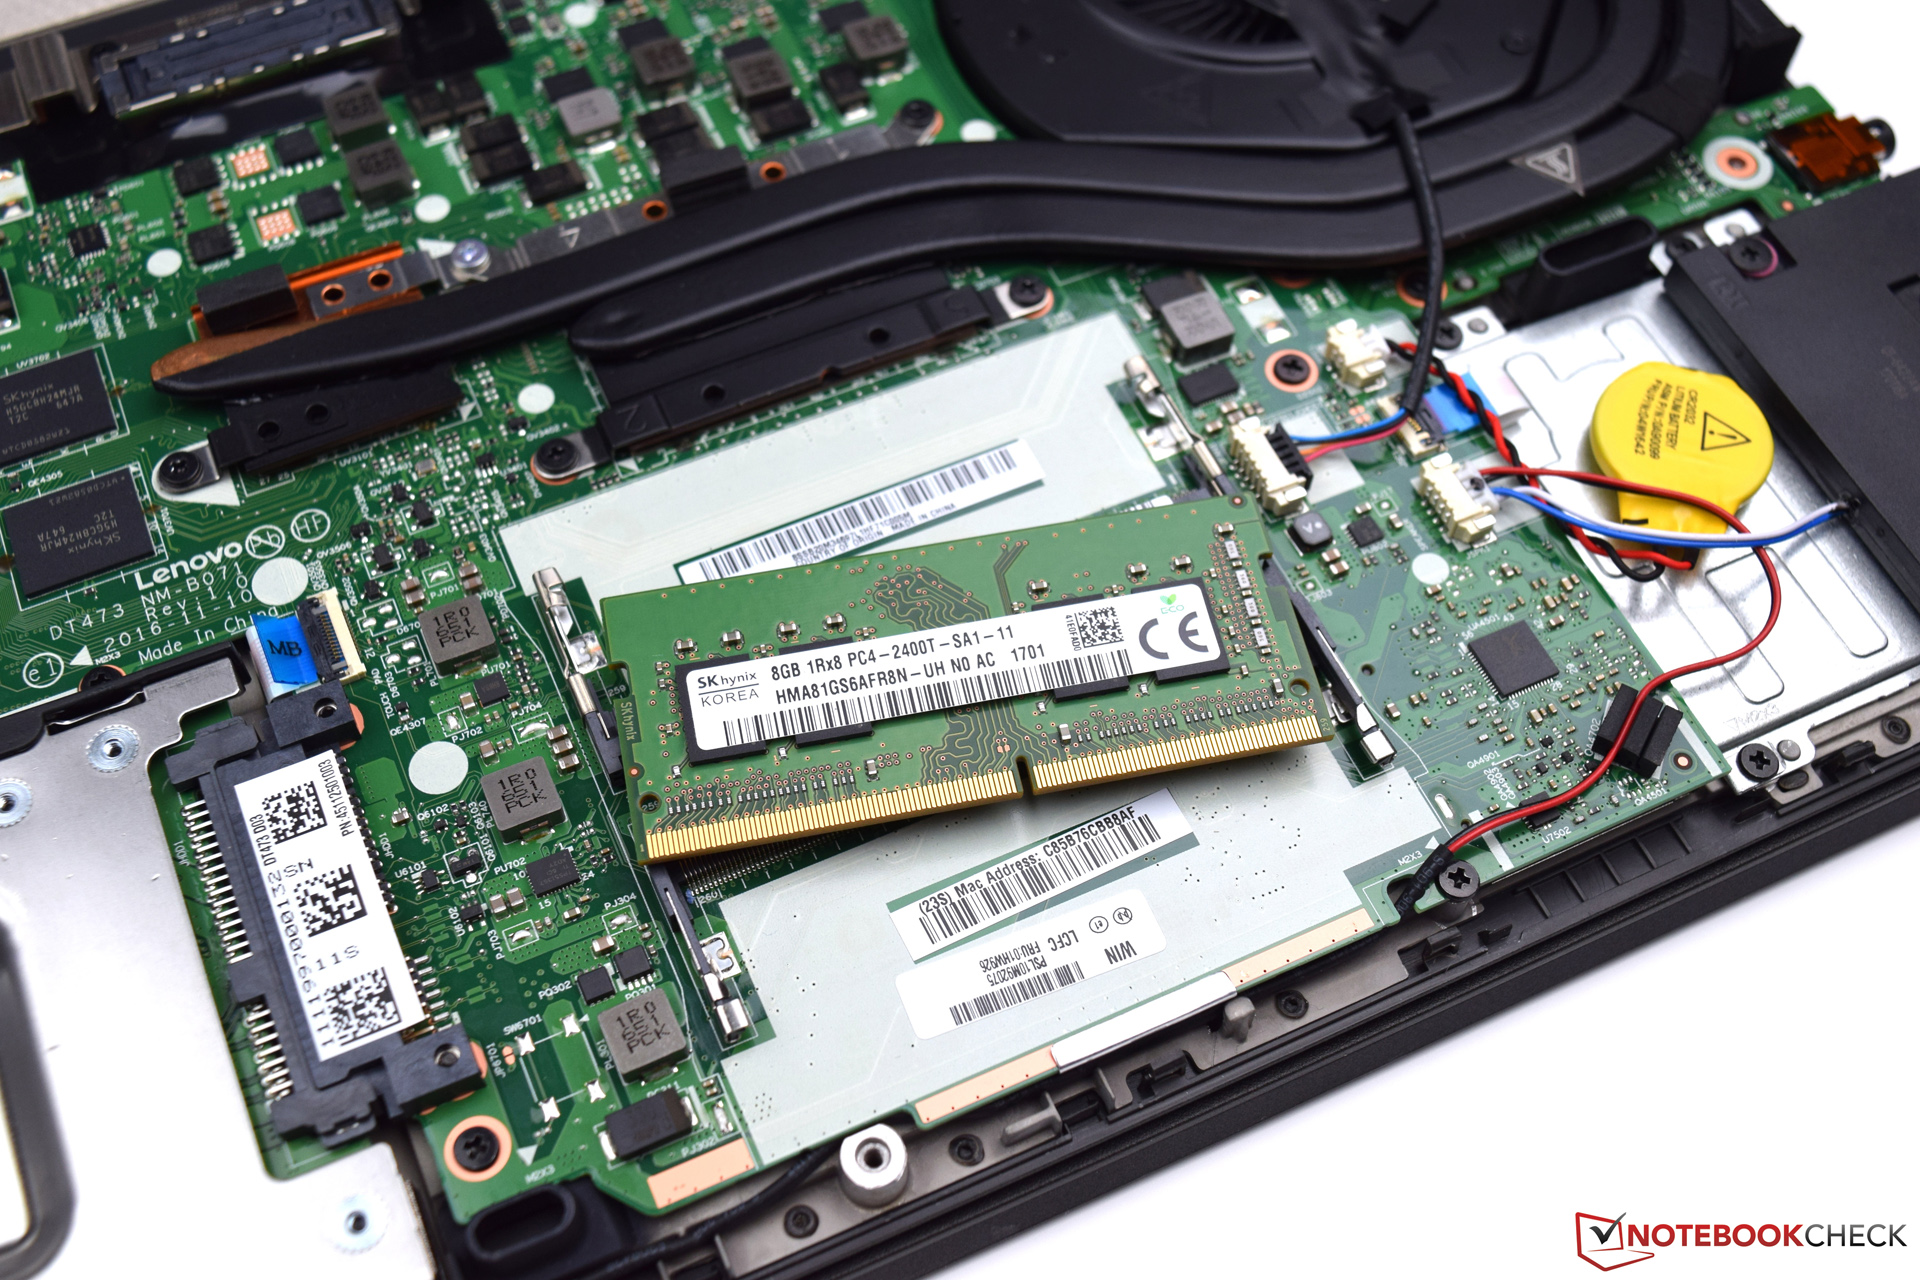
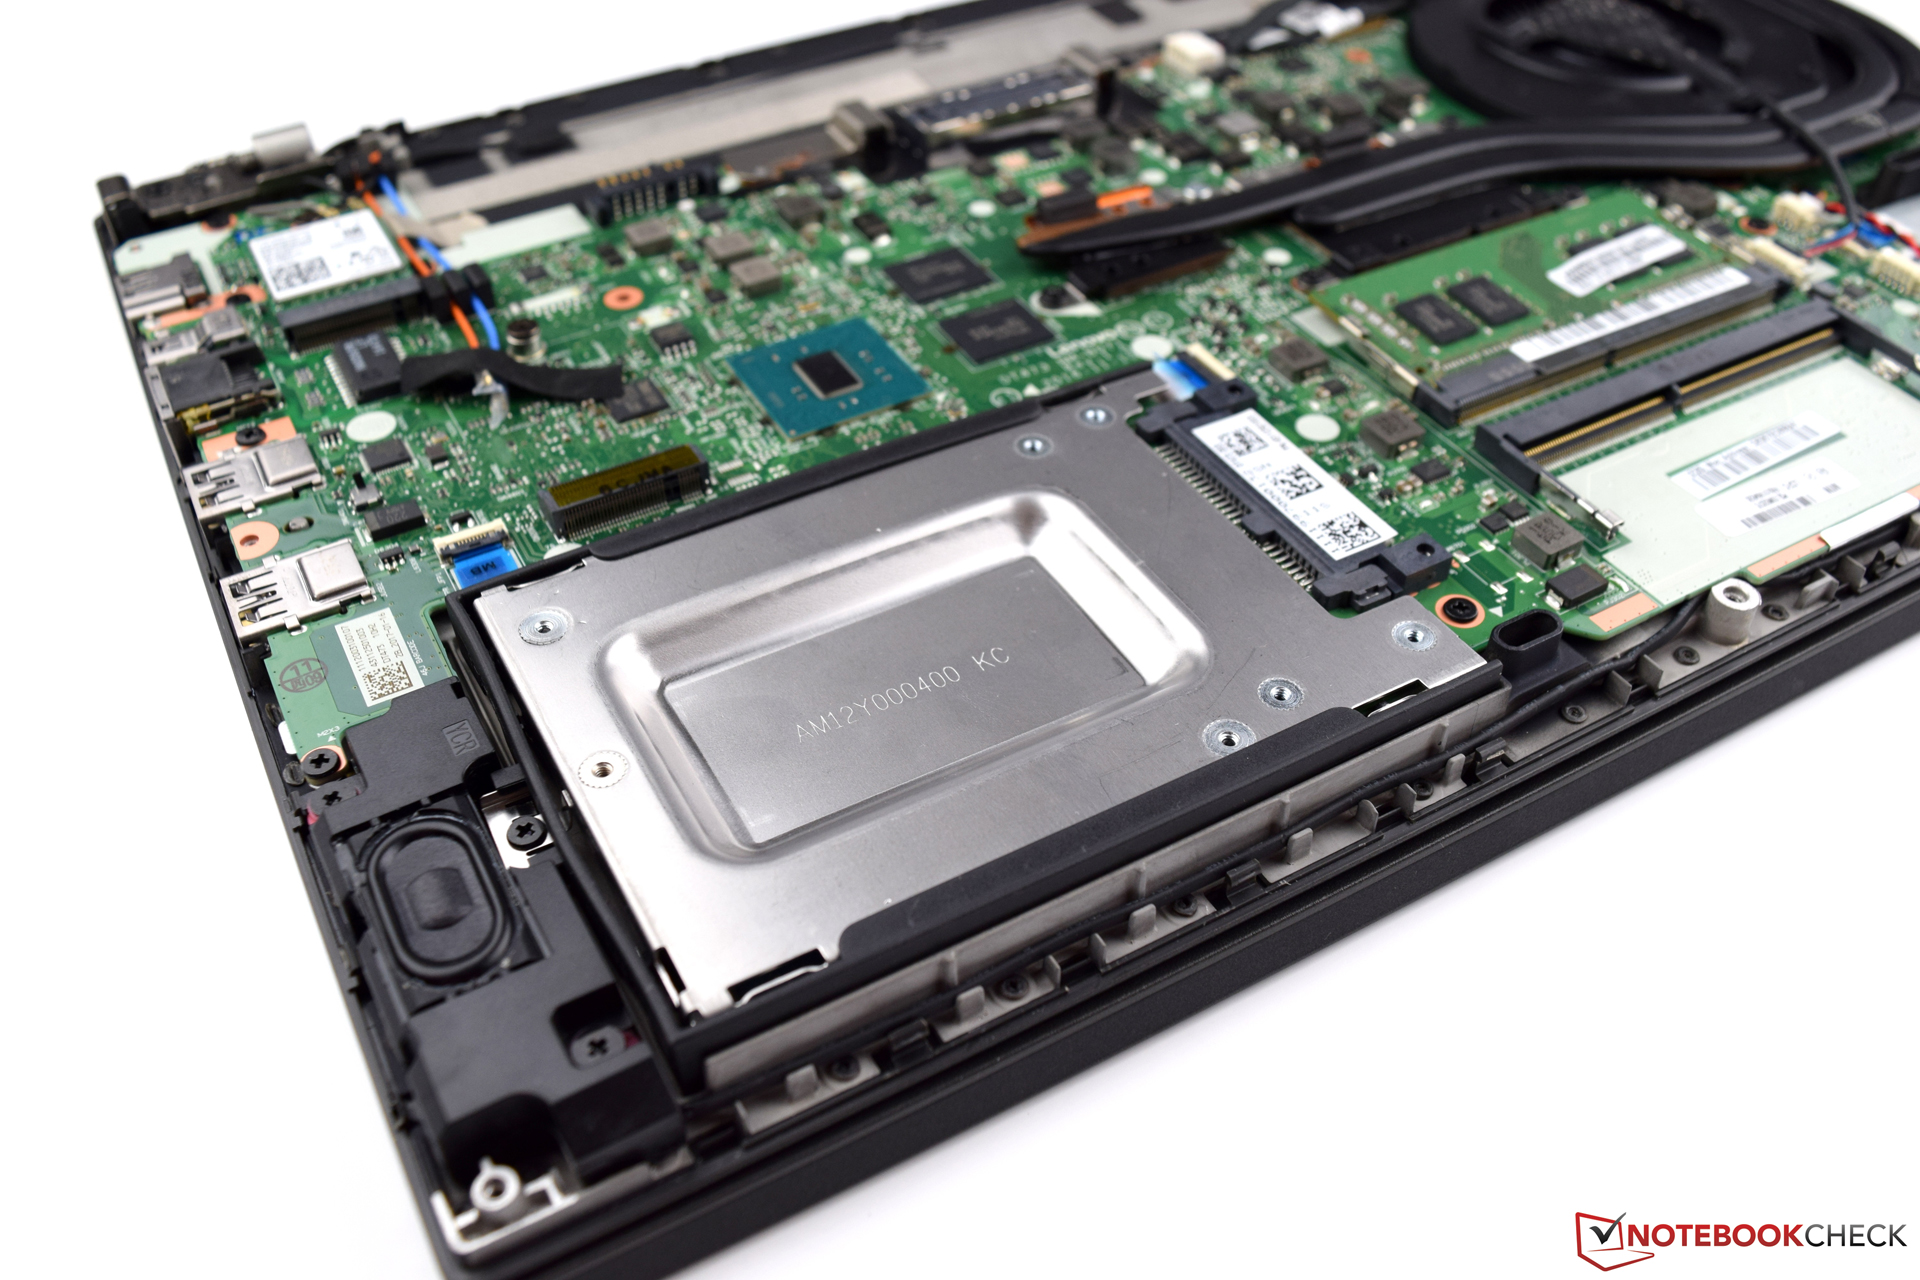
Lenovo a mis à jour ses modèles et équipe le ThinkPad T470p d’un CPU Kaby Lake très performant, plus que nécessaire pour les usages prévus. La mémoire vive (8 Go DDR4), qui n’est pas large mais suffisante, peut être augmentée n’importe quand. Nous apprécions les fonctionnalités de sécurité, qui font du Lenovo ThinkPad T470p un appareil pro. Le fabriquant a également choisi d’intégrer une carte graphique dédiée, rendant possible le jeu, à des taux d’images honnêtes. Le stockage est performant, et contribue largement à la réactivité du système. Cependant le principal problème de l’appareil est les prix, qui à 2 099 € est très élevé. Pour ce montant, il est possible d’avoir un portable pro de 14 pouces très performant, équipé de très bons périphériques d’entrée.
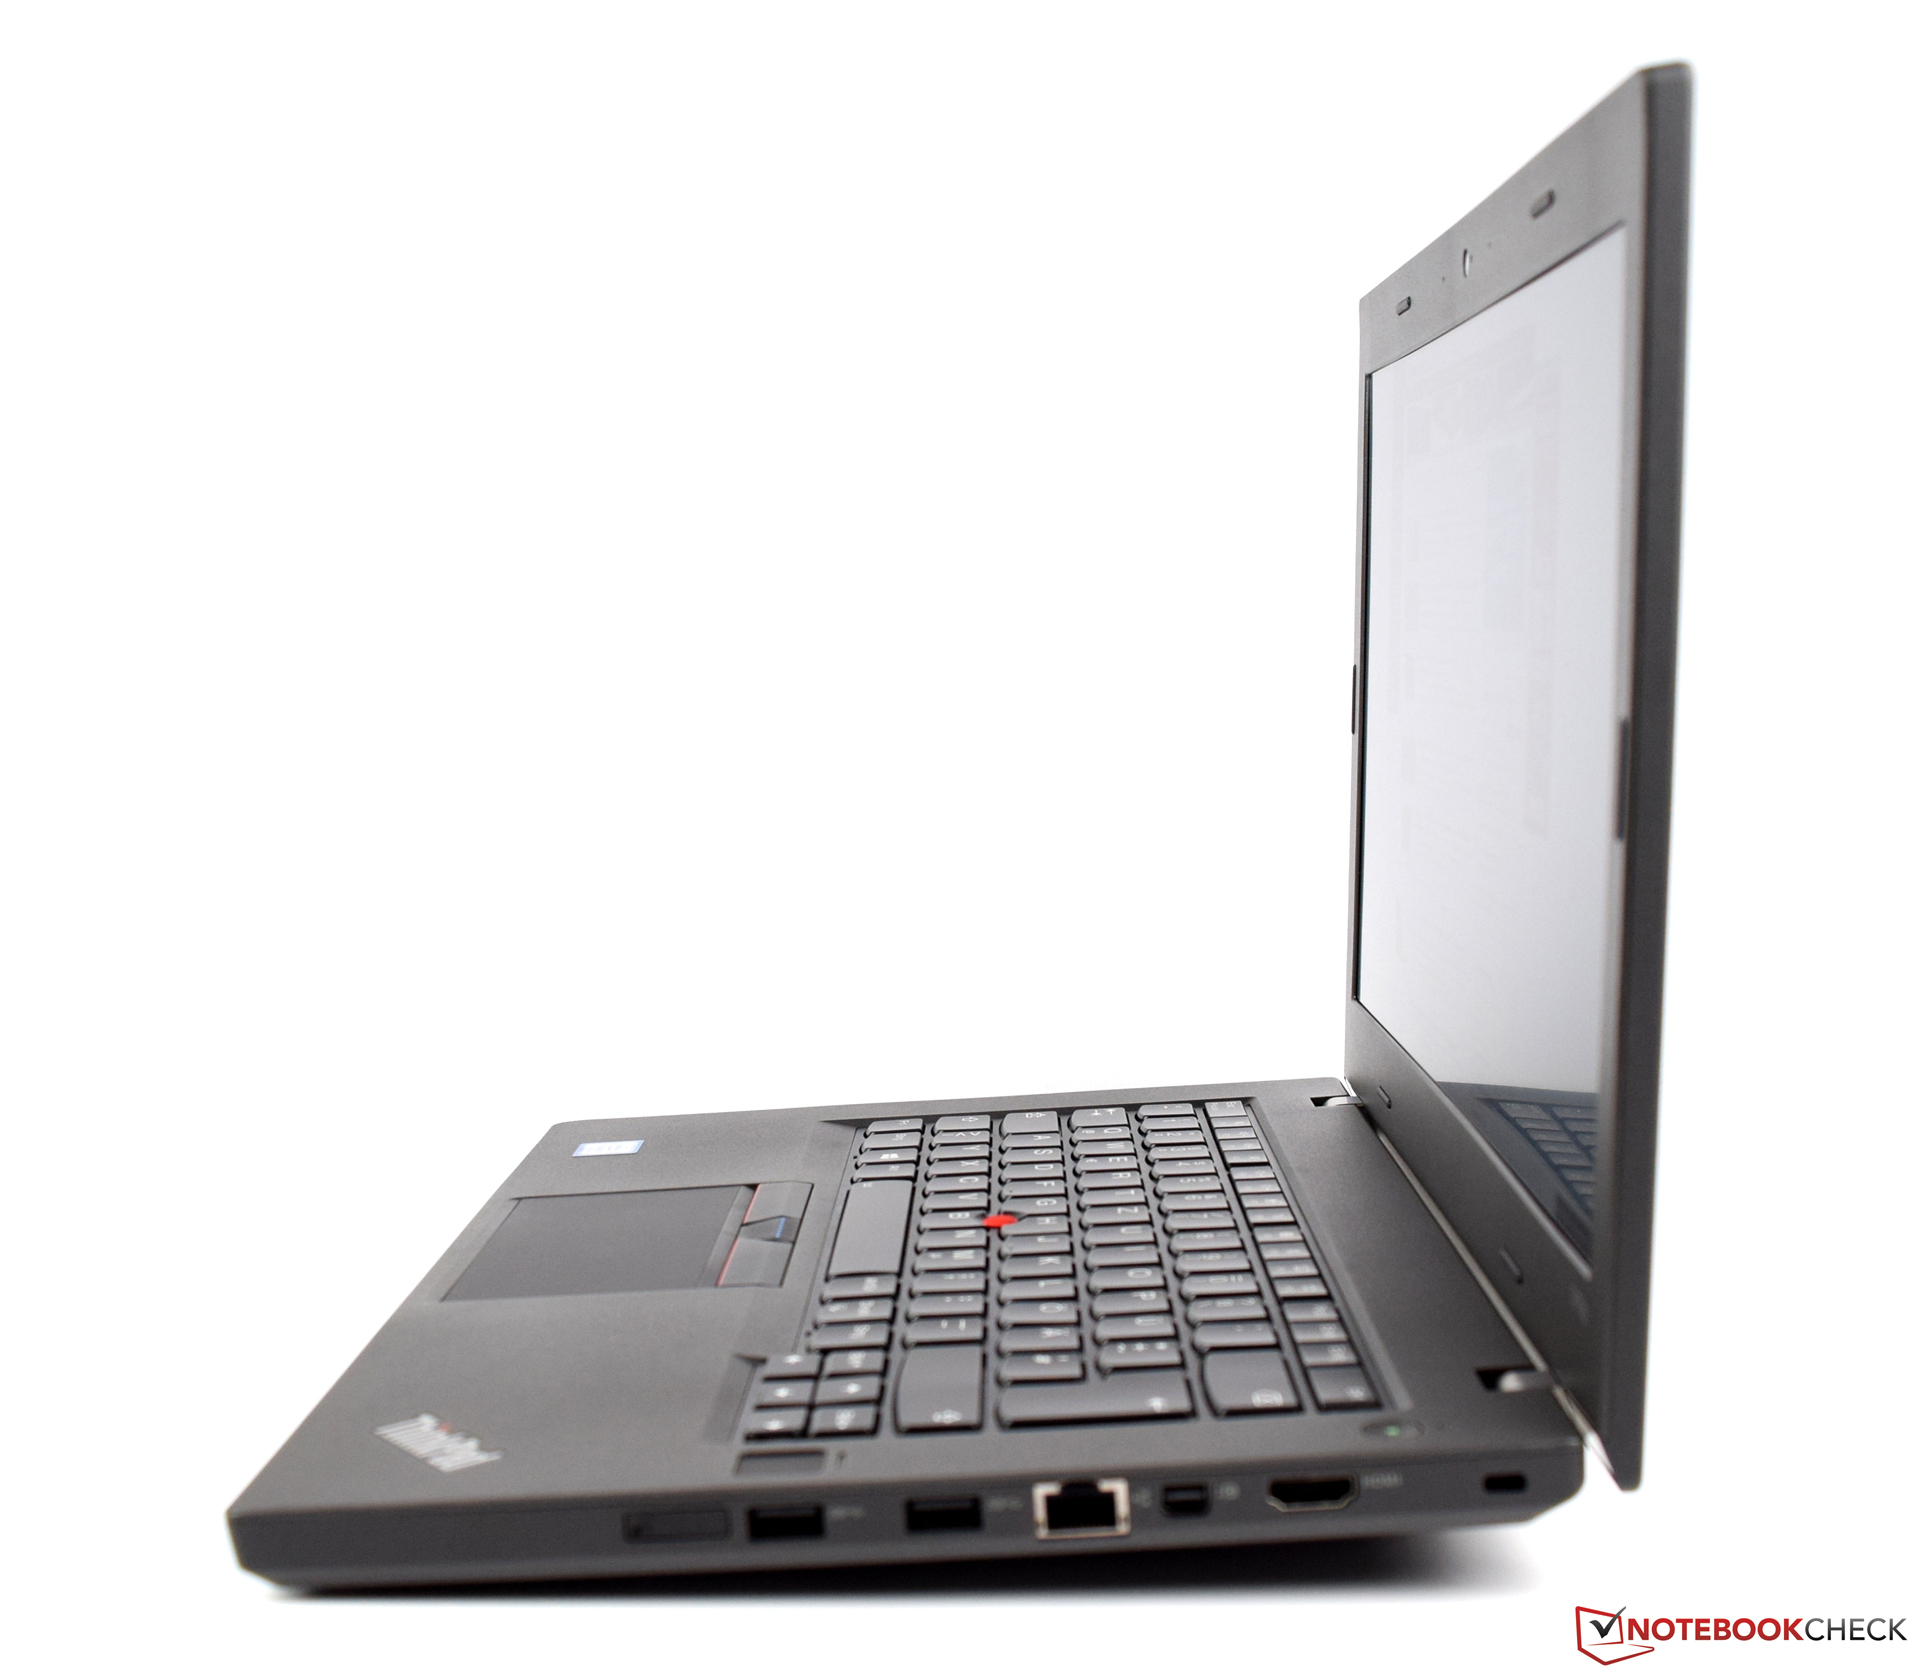
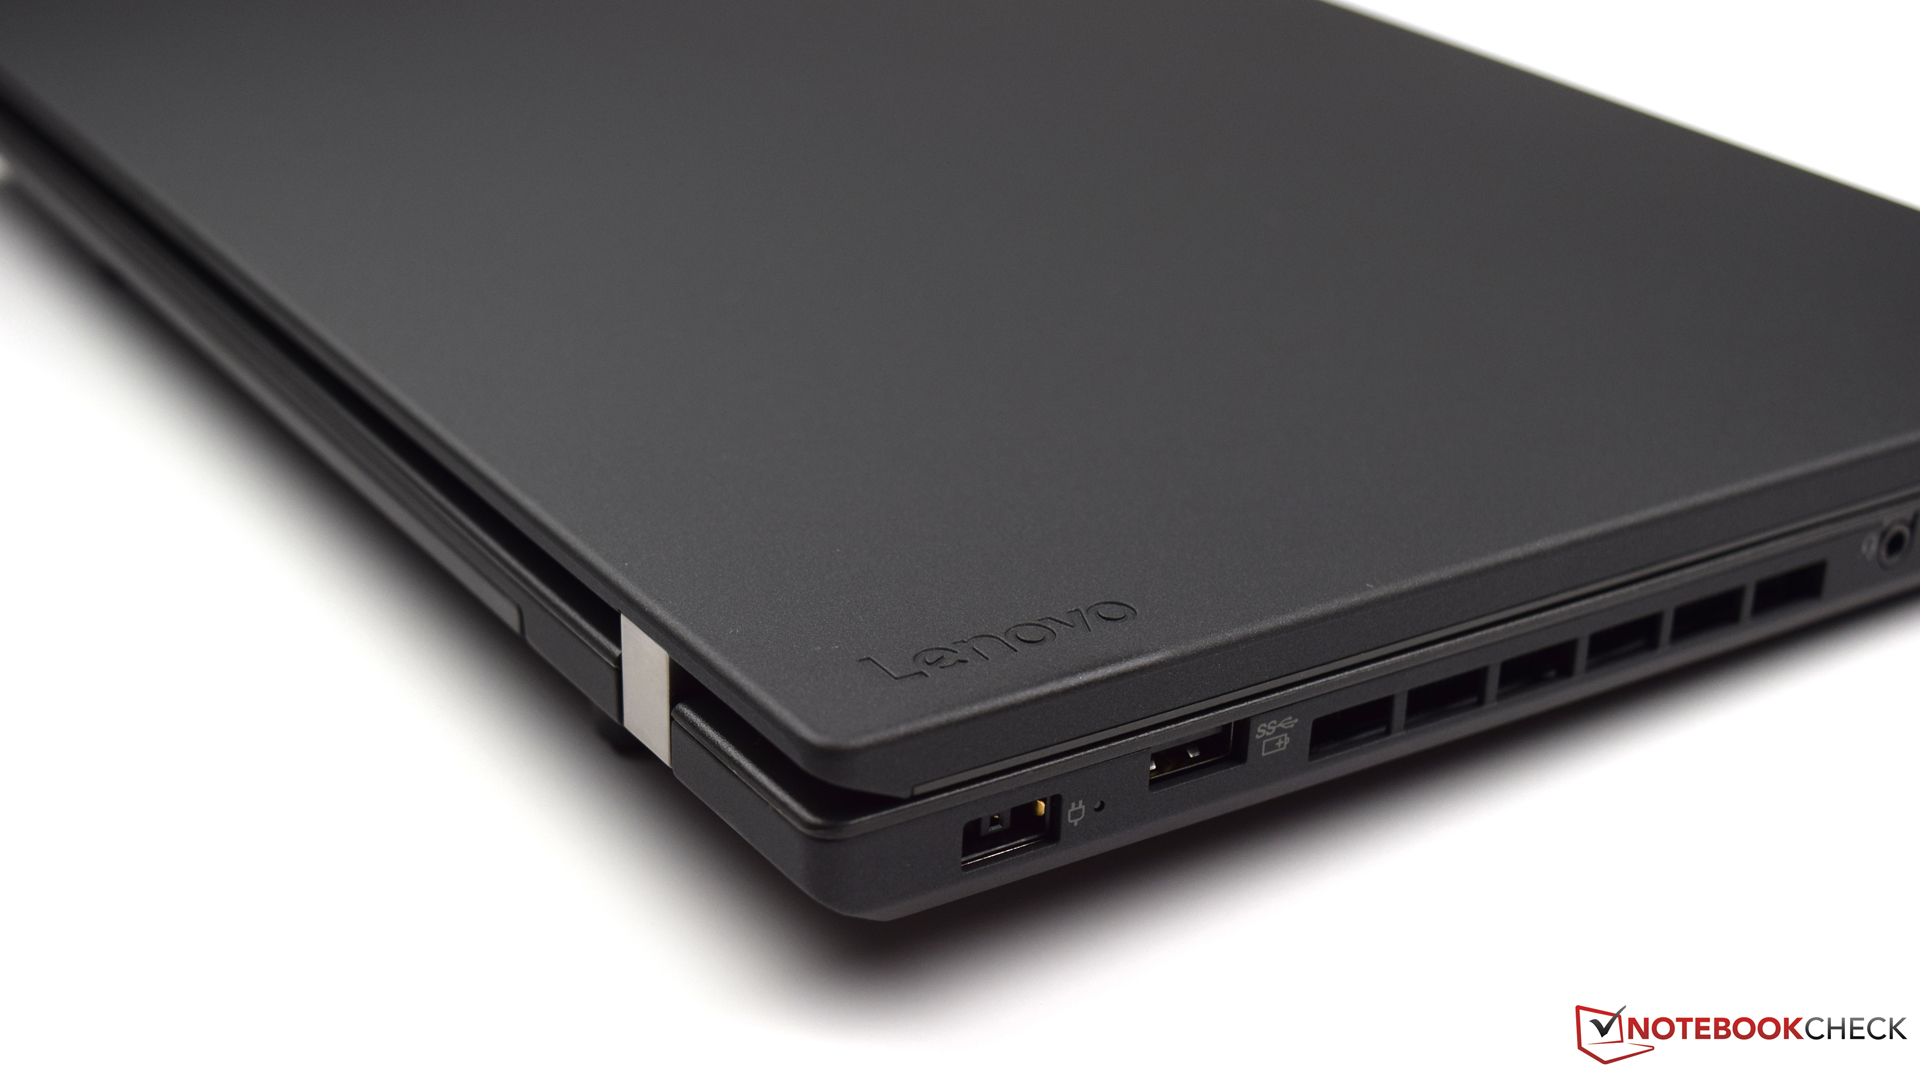
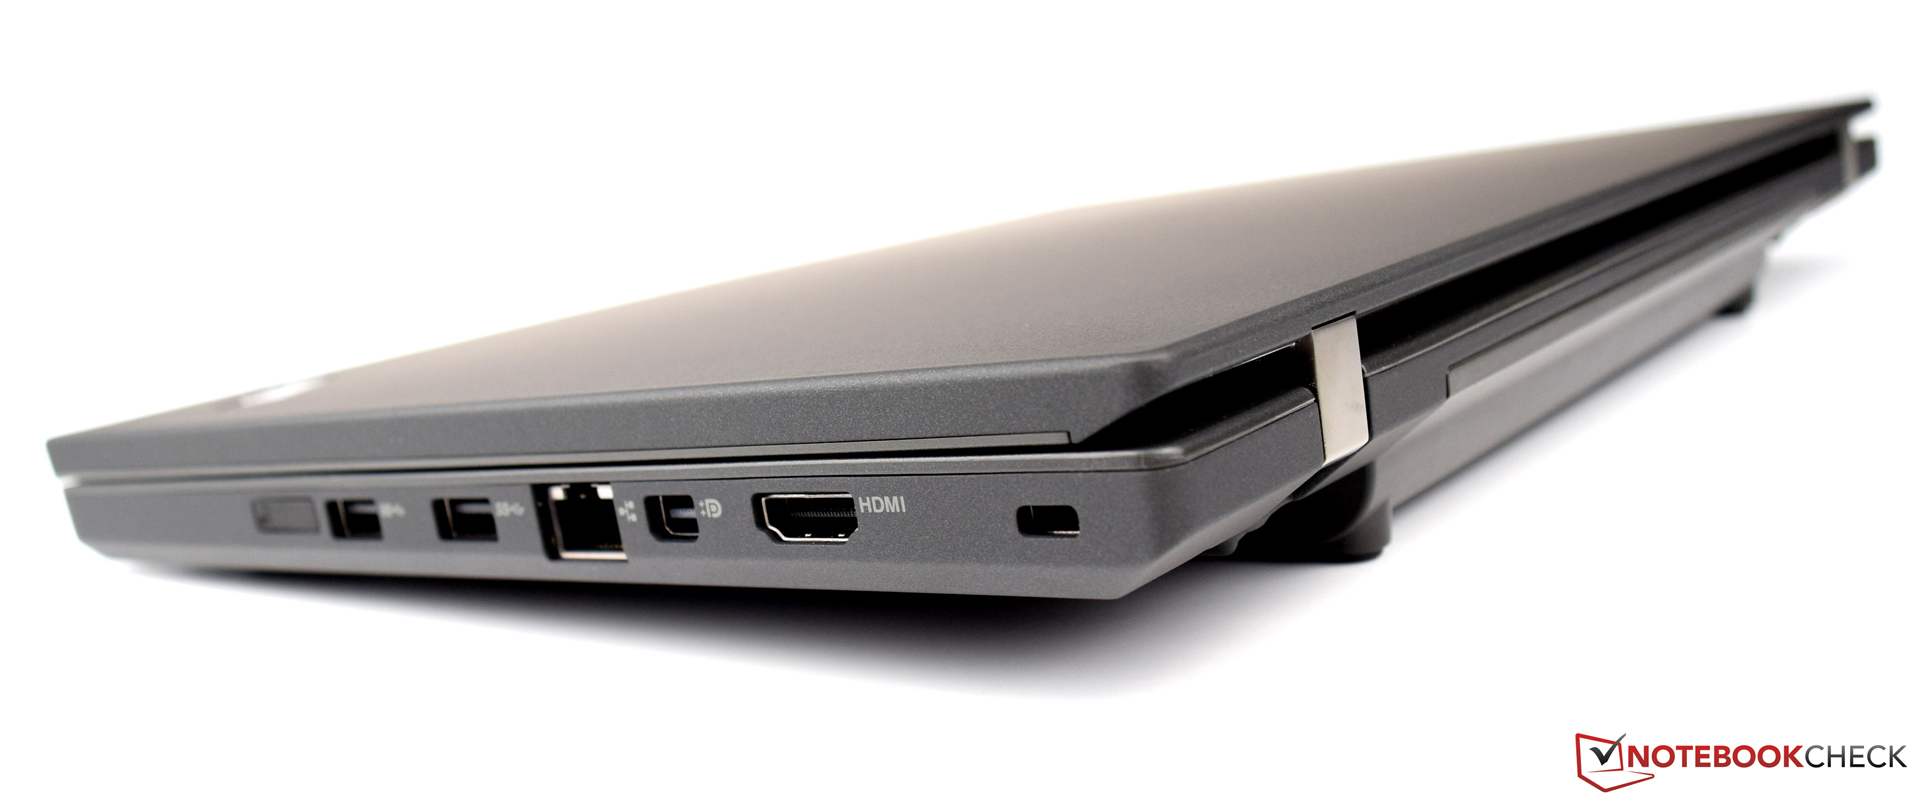
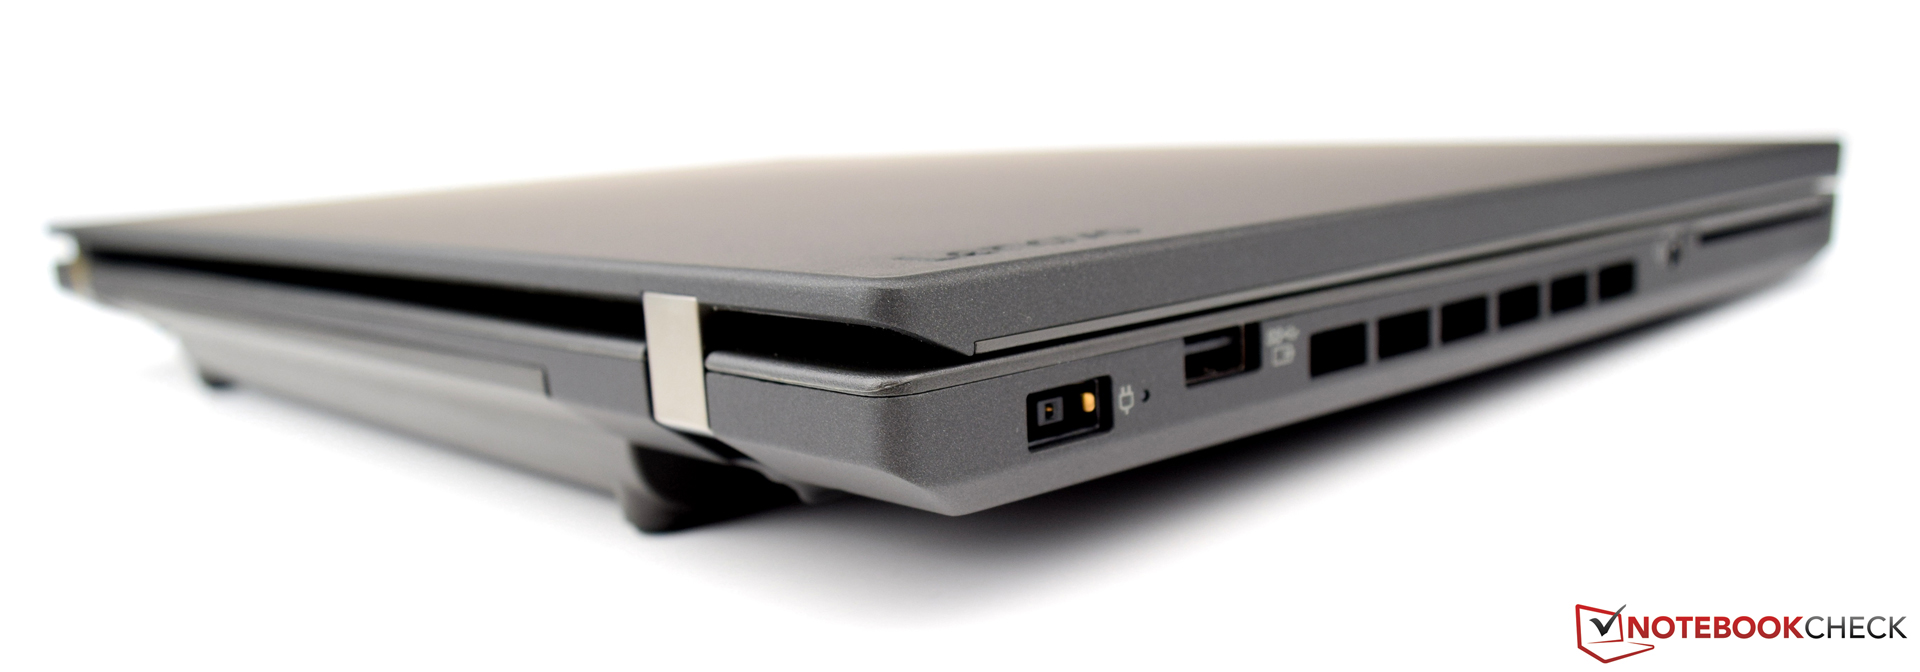
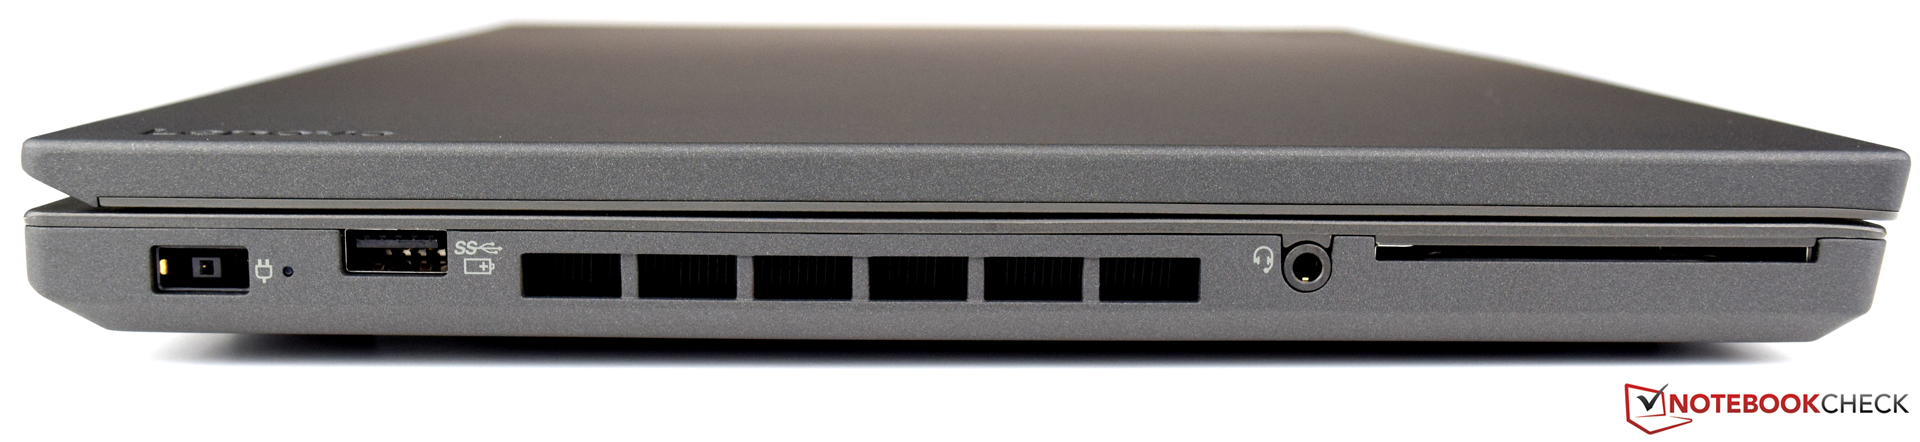
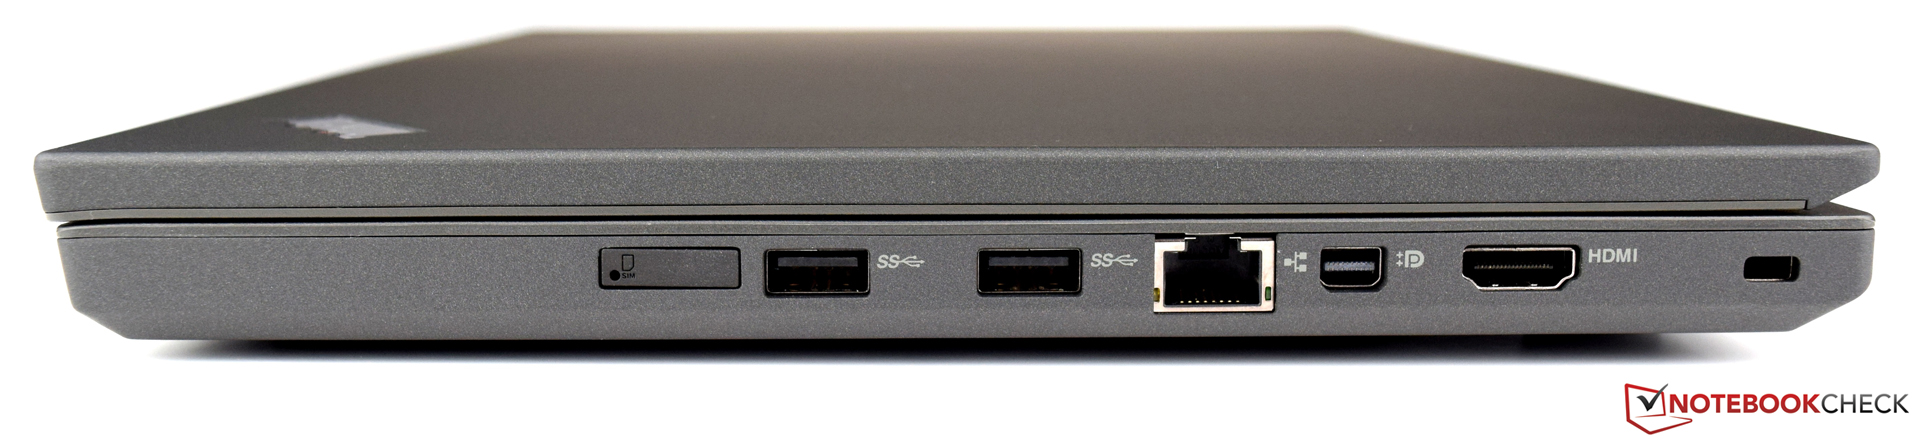
Cependant le Lenovo ThinkPad T470p conserve quelques points faibles : même s’il offre d’excellentes performances, la luminosité de l’écran reste décevante. Nous n’apprécions pas que Lenovo n’intègre pas de ports modernes dans un appareil qui est supposé durer quelques années. Pour ce prix, nous devrions avoir au moins un USB 3.1 de type C, avec Thunderbolt. Enfin, le refroidissement devrait aussi être amélioré sur le successeur.
En tant qu’appareil ultra puissant quatre cœurs au format 14 pouces, le T470p possède des fonctionnalités uniques à l’heure qu’il est.
Dans l’ensemble, le Lenovo ThinkPad T470p laisse une bonne impression. Les performances excellentes et le GPU dédié permettent des scénarios d’utilisation variés. Au-delà du travail au bureau, le Lenovo ThinkPad T470p gère également très bien les tâches multimédia, et il peut même faire tourner certains jeux sans problème.
L’intégralité de cette critique est disponible en anglais en suivant ce lien.
Lenovo ThinkPad T470p-20J7S00000
- 05/14/2017 v6 (old)
Sebastian Bade