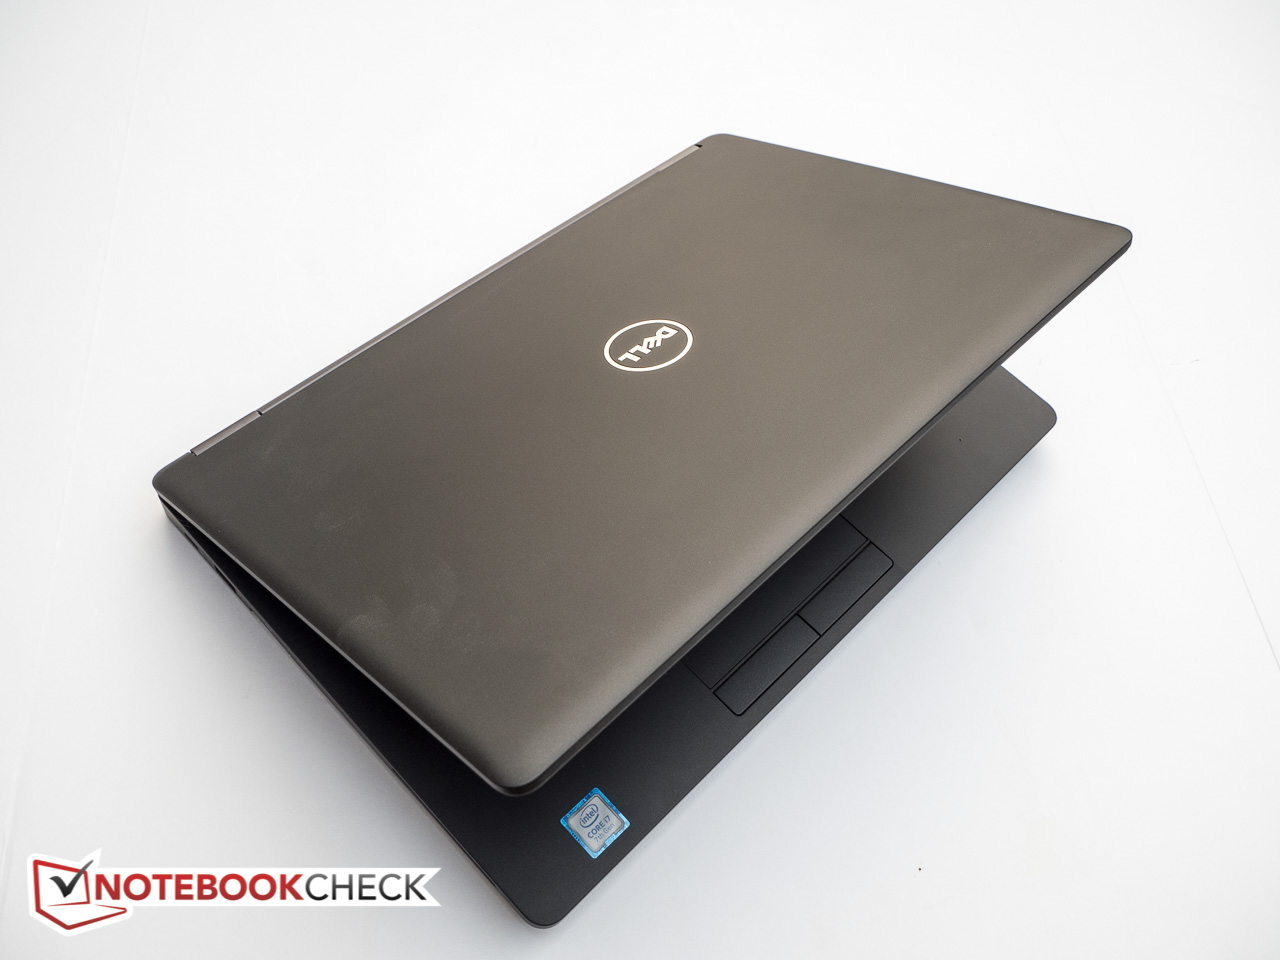
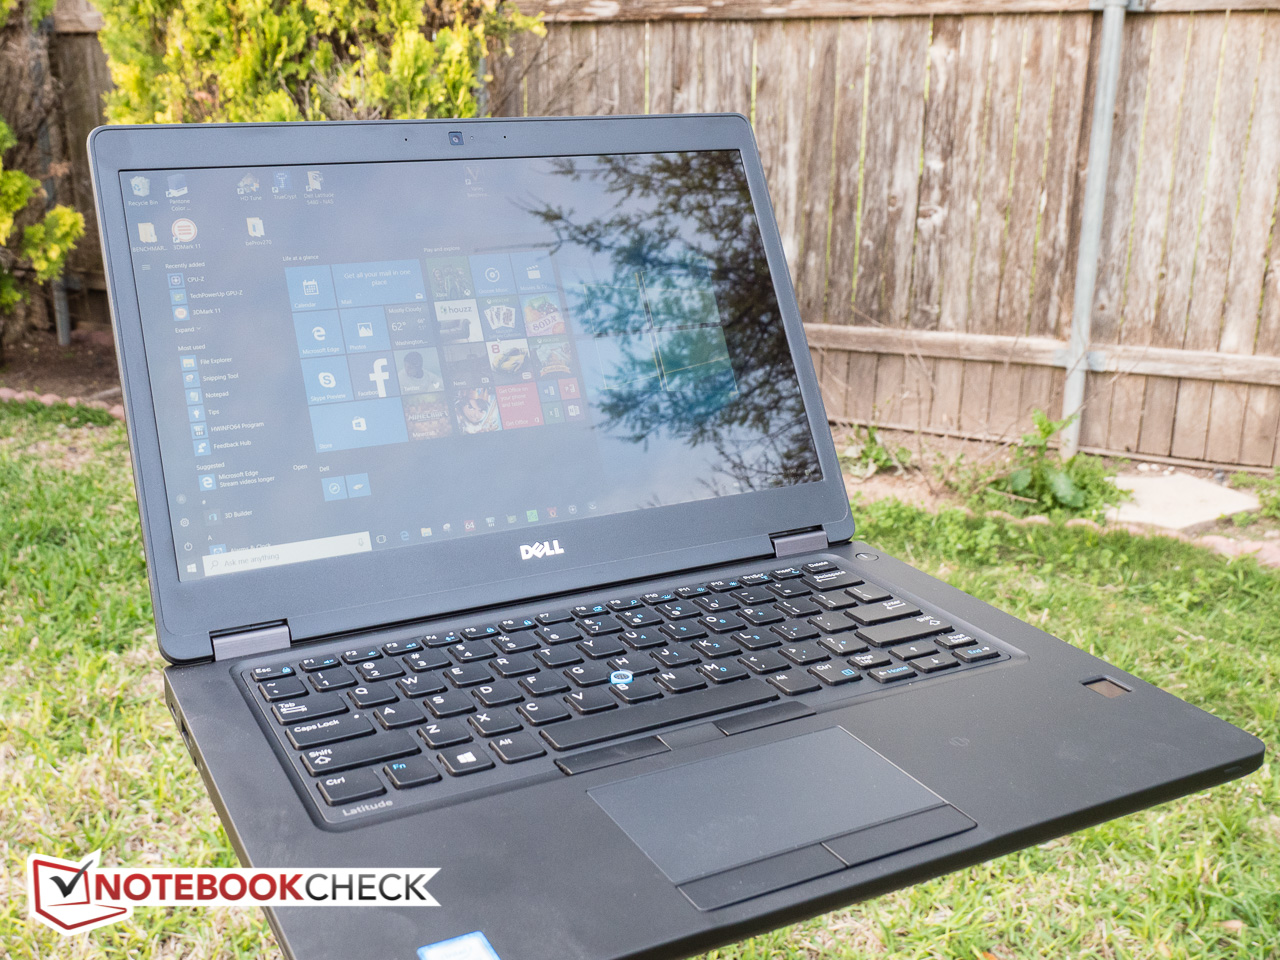
Courte critique du PC portable Dell Latitude 5480 (7600U, FHD)
| SD Card Reader | |
| average JPG Copy Test (av. of 3 runs) | |
| Dell Latitude 5480 | |
| Lenovo ThinkPad T470-20HD002HGE | |
| HP ProBook 440 G4-Y8B51EA | |
| Acer TravelMate P648-M-757N | |
| Toshiba Tecra Z40-C-106 | |
| Lenovo ThinkPad T460s-20F9003SGE | |
| maximum AS SSD Seq Read Test (1GB) | |
| Dell Latitude 5480 | |
| Lenovo ThinkPad T470-20HD002HGE | |
| HP ProBook 440 G4-Y8B51EA | |
| Lenovo ThinkPad T460s-20F9003SGE | |
| Toshiba Tecra Z40-C-106 | |
| Networking | |
| iperf3 transmit AX12 | |
| Lenovo ThinkPad T470-20HD002HGE | |
| HP Spectre x360 15-bl002xx | |
| Dell Latitude 5480 | |
| iperf3 receive AX12 | |
| Lenovo ThinkPad T470-20HD002HGE | |
| Dell Latitude 5480 | |
| HP Spectre x360 15-bl002xx | |
| |||||||||||||||||||||||||
Homogénéité de la luminosité: 90 %
Valeur mesurée au centre, sur batterie: 215.9 cd/m²
Contraste: 981:1 (Valeurs des noirs: 0.22 cd/m²)
ΔE ColorChecker Calman: 5.1 | ∀{0.5-29.43 Ø4.72}
ΔE Greyscale Calman: 4 | ∀{0.09-98 Ø4.97}
61.15% sRGB (Argyll 1.6.3 3D)
41.96% AdobeRGB 1998 (Argyll 1.6.3 3D)
41.96% AdobeRGB 1998 (Argyll 3D)
61.2% sRGB (Argyll 3D)
40.62% Display P3 (Argyll 3D)
Gamma: 2.41
CCT: 6856 K
| Dell Latitude 5480 LG Philips LGD0553, IPS, 14", 1920x1080 | Dell Latitude 14 E5470 LP140WF3, AH-IPS, WLED, 14", 1920x1080 | Lenovo ThinkPad T460s-20F9003SGE N140HCE-EAA, LEN40A9, IPS, 14", 1920x1080 | HP ProBook 440 G4-Y8B51EA AUO1E3D, TN, 14", 1920x1080 | Lenovo ThinkPad X1 Carbon 20FB-005XUS IPS, 14", 1920x1080 | Acer TravelMate P648-M-757N AU Optronics B140HAN02.1, IPS, 14", 1920x1080 | Lenovo ThinkPad T470-20HD002HGE N140HCA-EAB, IPS, 14", 1920x1080 | Toshiba Tecra Z40-C-106 Toshiba TOS508F, IPS, 14", 1920x1080 | |
|---|---|---|---|---|---|---|---|---|
| Display | 49% | 2% | -7% | 42% | -13% | 2% | 48% | |
| Display P3 Coverage (%) | 40.62 | 64.8 60% | 41.65 3% | 37.6 -7% | 58.9 45% | 35.53 -13% | 41.6 2% | 64.8 60% |
| sRGB Coverage (%) | 61.2 | 84.8 39% | 61.6 1% | 56.6 -8% | 83.1 36% | 53.3 -13% | 61.9 1% | 84.4 38% |
| AdobeRGB 1998 Coverage (%) | 41.96 | 62 48% | 43.14 3% | 38.85 -7% | 60.3 44% | 36.72 -12% | 43.06 3% | 61.7 47% |
| Response Times | -9% | -20% | -12% | -25% | -15% | -28% | 3% | |
| Response Time Grey 50% / Grey 80% * (ms) | 32.8 ? | 39 ? -19% | 42 ? -28% | 43.2 ? -32% | 47.2 ? -44% | 44 ? -34% | 41.6 ? -27% | 32.8 ? -0% |
| Response Time Black / White * (ms) | 26.4 ? | 26 ? 2% | 29.2 ? -11% | 24.4 ? 8% | 27.6 ? -5% | 25 ? 5% | 34 ? -29% | 25.2 ? 5% |
| PWM Frequency (Hz) | ||||||||
| Screen | 6% | -8% | -40% | 24% | 13% | -1% | 5% | |
| Brightness middle (cd/m²) | 215.9 | 323 50% | 226 5% | 216 0% | 321.7 49% | 254 18% | 306 42% | 269 25% |
| Brightness (cd/m²) | 205 | 316 54% | 211 3% | 203 -1% | 301 47% | 243 19% | 287 40% | 257 25% |
| Brightness Distribution (%) | 90 | 79 -12% | 89 -1% | 83 -8% | 89 -1% | 90 0% | 88 -2% | 86 -4% |
| Black Level * (cd/m²) | 0.22 | 0.57 -159% | 0.22 -0% | 0.47 -114% | 0.294 -34% | 0.19 14% | 0.3 -36% | 0.52 -136% |
| Contrast (:1) | 981 | 567 -42% | 1027 5% | 460 -53% | 1094 12% | 1337 36% | 1020 4% | 517 -47% |
| Colorchecker dE 2000 * | 5.1 | 3.68 28% | 6.44 -26% | 8.98 -76% | 3.96 22% | 4.93 3% | 6.2 -22% | 3.45 32% |
| Colorchecker dE 2000 max. * | 15.6 | 8.33 47% | 17.18 -10% | 14.07 10% | 6.69 57% | 10.14 35% | 13.6 13% | 9.34 40% |
| Greyscale dE 2000 * | 4 | 2.99 25% | 5.87 -47% | 9.61 -140% | 3.15 21% | 2.71 32% | 5.8 -45% | 2.28 43% |
| Gamma | 2.41 91% | 2.49 88% | 2.37 93% | 2.63 84% | 2.34 94% | 2.36 93% | 2.04 108% | 2.38 92% |
| CCT | 6856 95% | 6572 99% | 6856 95% | 11265 58% | 7082 92% | 6914 94% | 6277 104% | 6230 104% |
| Color Space (Percent of AdobeRGB 1998) (%) | 41.96 | 55 31% | 39.58 -6% | 35.9 -14% | 53.8 28% | 34 -19% | 39.62 -6% | 55.24 32% |
| Color Space (Percent of sRGB) (%) | 61.15 | 85 39% | 61.15 0% | 56.7 -7% | 82.7 35% | 53 -13% | 61.44 0% | 84.32 38% |
| Moyenne finale (programmes/paramètres) | 15% /
13% | -9% /
-7% | -20% /
-30% | 14% /
21% | -5% /
4% | -9% /
-4% | 19% /
13% |
* ... Moindre est la valeur, meilleures sont les performances
Temps de réponse de l'écran
| ↔ Temps de réponse noir à blanc | ||
|---|---|---|
| 26.4 ms ... hausse ↗ et chute ↘ combinées | ↗ 5.2 ms hausse | 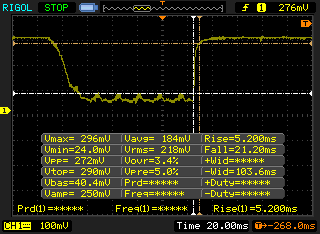 |
| ↘ 21.2 ms chute | ||
| L'écran souffre de latences relativement élevées, insuffisant pour le jeu. En comparaison, tous les appareils testés affichent entre 0.1 (minimum) et 240 (maximum) ms. » 66 % des appareils testés affichent de meilleures performances. Cela signifie que les latences relevées sont moins bonnes que la moyenne (19.8 ms) de tous les appareils testés. | ||
| ↔ Temps de réponse gris 50% à gris 80% | ||
| 32.8 ms ... hausse ↗ et chute ↘ combinées | ↗ 14 ms hausse | 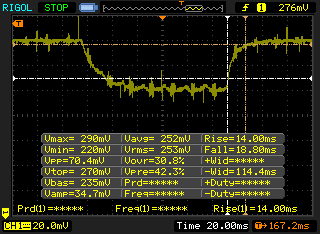 |
| ↘ 18.8 ms chute | ||
| L'écran souffre de latences très élevées, à éviter pour le jeu. En comparaison, tous les appareils testés affichent entre 0.165 (minimum) et 636 (maximum) ms. » 44 % des appareils testés affichent de meilleures performances. Cela signifie que les latences relevées sont similaires à la moyenne (31 ms) de tous les appareils testés. | ||
Scintillement / MLI (Modulation de largeur d'impulsion)
| Scintillement / MLI (Modulation de largeur d'impulsion) non décelé | 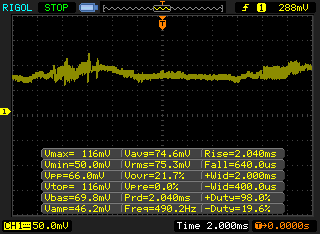 | ||
En comparaison, 52 % des appareils testés n'emploient pas MDI pour assombrir leur écran. Nous avons relevé une moyenne à 7763 (minimum : 5 - maximum : 343500) Hz dans le cas où une MDI était active. | |||

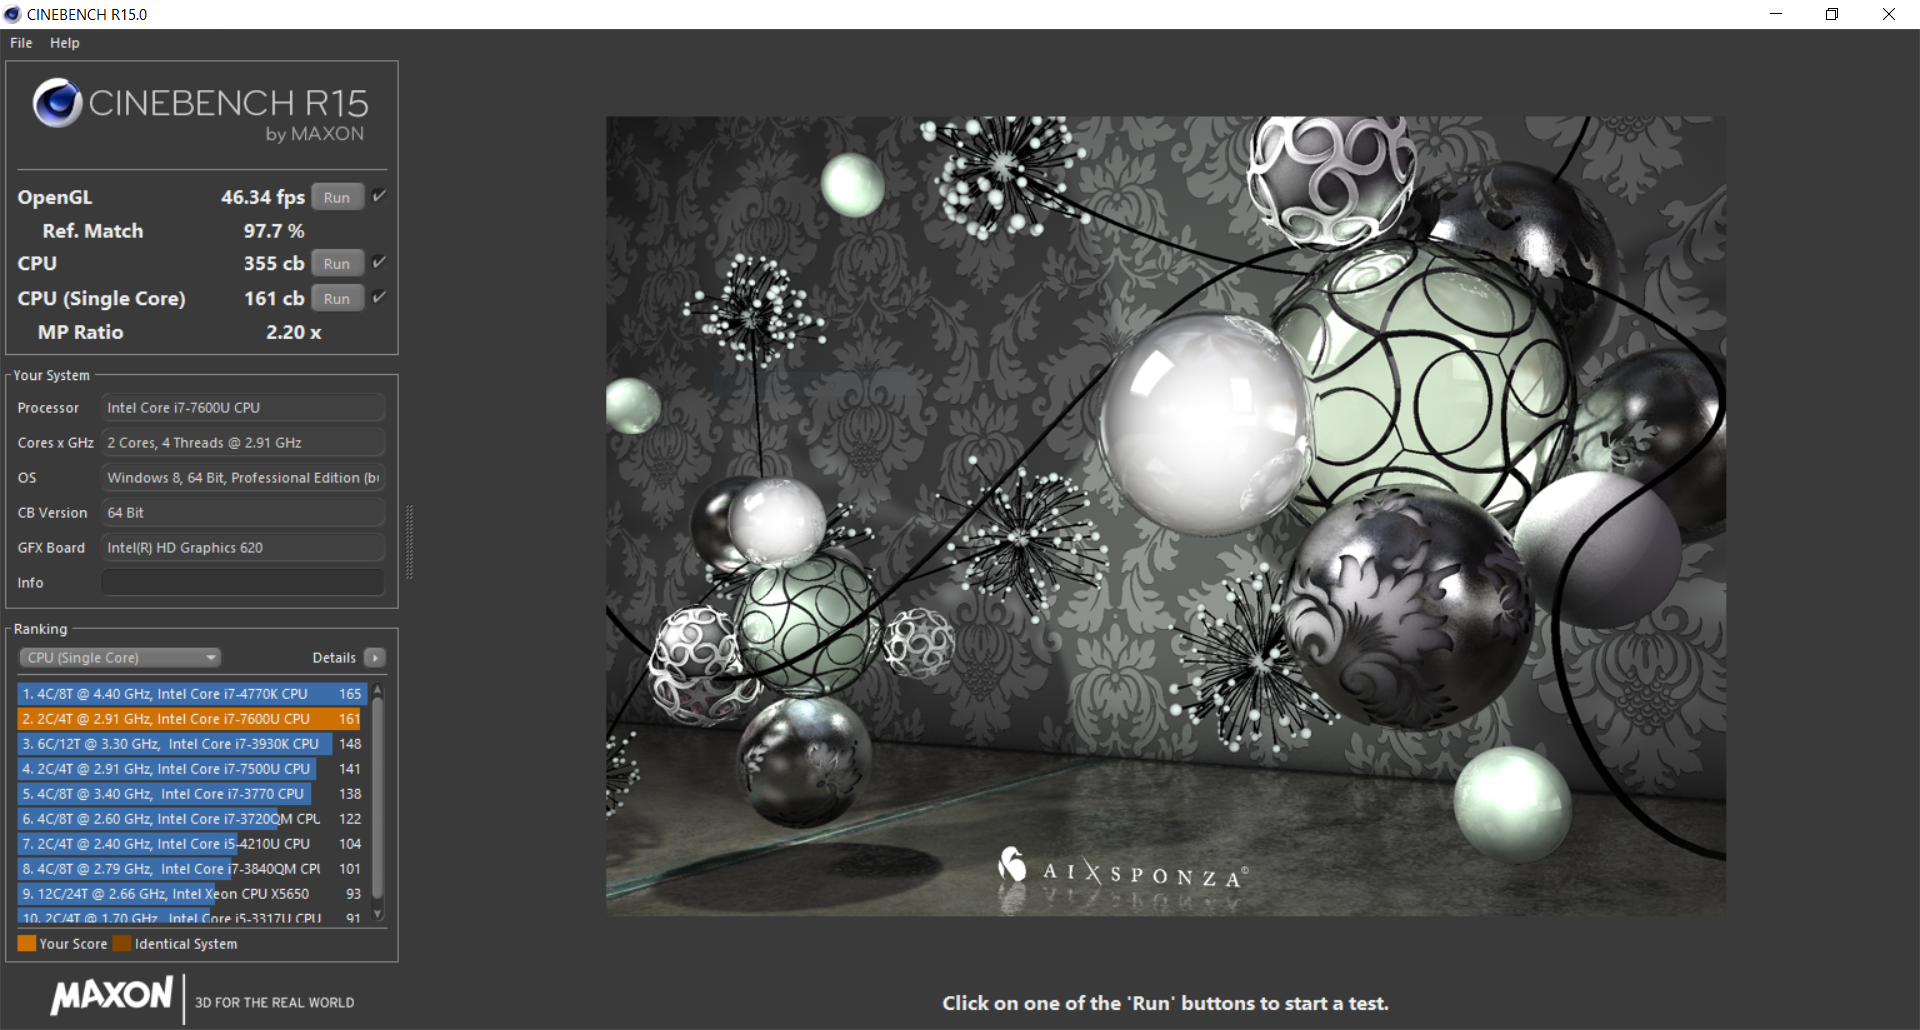
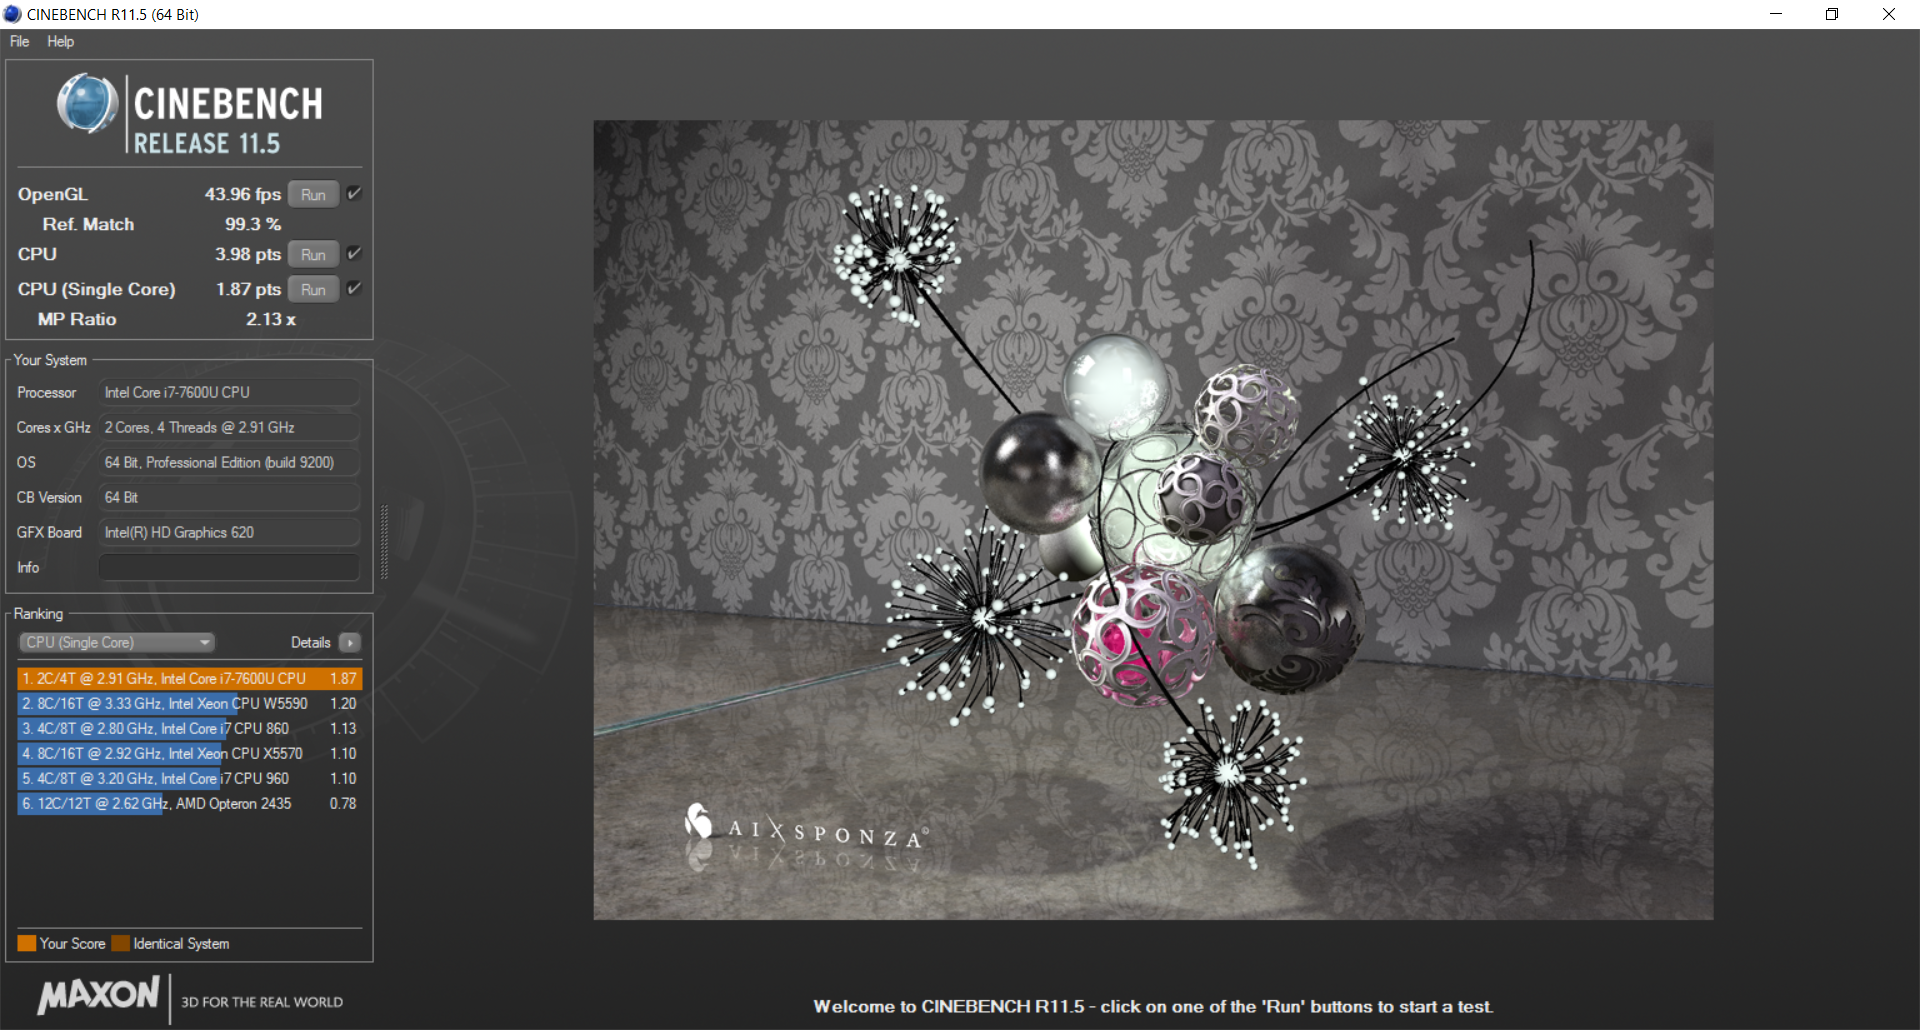
| Cinebench R10 | |
| Rendering Single 32Bit | |
| Dell Latitude 5480 | |
| HP ProBook 440 G4-Y8B51EA | |
| Dell Latitude 14 E5470 | |
| Lenovo ThinkPad X1 Carbon 20FB-005XUS | |
| Acer TravelMate P648-M-757N | |
| Rendering Multiple CPUs 32Bit | |
| Dell Latitude 14 E5470 | |
| Dell Latitude 5480 | |
| HP ProBook 440 G4-Y8B51EA | |
| Acer TravelMate P648-M-757N | |
| Lenovo ThinkPad X1 Carbon 20FB-005XUS | |
| wPrime 2.10 - 1024m | |
| Lenovo ThinkPad X1 Carbon 20FB-005XUS | |
| Dell Latitude 5480 | |
* ... Moindre est la valeur, meilleures sont les performances
| PCMark 8 Home Score Accelerated v2 | 3913 points | |
| PCMark 8 Creative Score Accelerated v2 | 4923 points | |
| PCMark 8 Work Score Accelerated v2 | 4992 points | |
Aide | ||
| Dell Latitude 5480 Toshiba SG5 256GB THNSNK256GVN8 | Dell Latitude 14 E5470 Micron SSD 1100 (MTFDDAV256TBN) | Lenovo ThinkPad T460s-20F9003SGE Samsung CM871 MZ7LF192HCGS | HP ProBook 440 G4-Y8B51EA SanDisk SD8SNAT256G1002 | Lenovo ThinkPad X1 Carbon 20FB-005XUS Samsung SM951 MZVPV256 m.2 | Acer TravelMate P648-M-757N Lite-On CV1-8B256 | Toshiba Tecra Z40-C-106 Toshiba HG6 THNSNJ256G8NY | |
|---|---|---|---|---|---|---|---|
| CrystalDiskMark 3.0 | -7% | -52% | -11% | 177% | 6% | 3% | |
| Read Seq (MB/s) | 469.4 | 465.4 -1% | 446.5 -5% | 491.2 5% | 1720 266% | 531 13% | 521 11% |
| Write Seq (MB/s) | 264.8 | 363.1 37% | 171.1 -35% | 322.2 22% | 1263 377% | 358.8 35% | 444.5 68% |
| Read 512 (MB/s) | 408.1 | 338.4 -17% | 259.2 -36% | 310.1 -24% | 1223 200% | 384.8 -6% | 420.2 3% |
| Write 512 (MB/s) | 265.5 | 246.1 -7% | 167.2 -37% | 276 4% | 1249 370% | 363 37% | 421 59% |
| Read 4k (MB/s) | 24.66 | 25.83 5% | 5.78 -77% | 19.57 -21% | 49.65 101% | 31.3 27% | 20.32 -18% |
| Write 4k (MB/s) | 114.8 | 80.3 -30% | 35.47 -69% | 77.8 -32% | 123 7% | 80.3 -30% | 79.6 -31% |
| Read 4k QD32 (MB/s) | 380.3 | 246.1 -35% | 94.9 -75% | 146.3 -62% | 464.6 22% | 239.4 -37% | 229 -40% |
| Write 4k QD32 (MB/s) | 207.2 | 197.7 -5% | 36.43 -82% | 241.4 17% | 354.7 71% | 225.3 9% | 153.6 -26% |

| 3DMark 11 Performance | 1845 points | |
| 3DMark Ice Storm Standard Score | 67522 points | |
| 3DMark Cloud Gate Standard Score | 6916 points | |
| 3DMark Fire Strike Score | 952 points | |
| 3DMark Fire Strike Extreme Score | 444 points | |
Aide | ||
| Tomb Raider | |
| 1024x768 Low Preset (Classer selon les valeurs) | |
| Dell Latitude 5480 | |
| Lenovo ThinkPad T460s-20F9003SGE | |
| HP ProBook 440 G4-Y8B51EA | |
| Acer TravelMate P648-M-757N | |
| 1366x768 Normal Preset AA:FX AF:4x (Classer selon les valeurs) | |
| Dell Latitude 5480 | |
| Lenovo ThinkPad T460s-20F9003SGE | |
| HP ProBook 440 G4-Y8B51EA | |
| Acer TravelMate P648-M-757N | |
| 1366x768 High Preset AA:FX AF:8x (Classer selon les valeurs) | |
| Dell Latitude 5480 | |
| Lenovo ThinkPad T460s-20F9003SGE | |
| HP ProBook 440 G4-Y8B51EA | |
| Acer TravelMate P648-M-757N | |
| 1920x1080 Ultra Preset AA:FX AF:16x (Classer selon les valeurs) | |
| Dell Latitude 5480 | |
| HP ProBook 440 G4-Y8B51EA | |
| Acer TravelMate P648-M-757N | |
| Bas | Moyen | Élevé | Ultra | |
|---|---|---|---|---|
| Anno 2070 (2011) | 88.9 | 49.7 | 30.3 | 13.8 |
| Tomb Raider (2013) | 86.2 | 45.1 | 28.6 | 13.2 |
Degré de la nuisance sonore
| Au repos |
| 29.6 / 29.6 / 29.6 dB(A) |
| Fortement sollicité |
| 42 / 47.1 dB(A) |
 | ||
30 dB silencieux 40 dB(A) audible 50 dB(A) bruyant |
||
min: | ||
| Dell Latitude 5480 HD Graphics 620, i7-7600U, Toshiba SG5 256GB THNSNK256GVN8 | Acer TravelMate P648-M-757N HD Graphics 520, 6500U, Lite-On CV1-8B256 | Lenovo ThinkPad T460s-20F9003SGE HD Graphics 520, 6200U, Samsung CM871 MZ7LF192HCGS | HP ProBook 440 G4-Y8B51EA GeForce 930MX, i7-7500U, SanDisk SD8SNAT256G1002 | Lenovo ThinkPad X1 Carbon 20FB-005XUS HD Graphics 520, 6300U, Samsung SM951 MZVPV256 m.2 | Toshiba Tecra Z40-C-106 HD Graphics 520, 6200U, Toshiba HG6 THNSNJ256G8NY | Dell Latitude 14 E5470 HD Graphics 530, 6440HQ, Micron SSD 1100 (MTFDDAV256TBN) | |
|---|---|---|---|---|---|---|---|
| Noise | 7% | 10% | 7% | 10% | 8% | 9% | |
| Idle Minimum * (dB) | 29.6 | 31.2 -5% | 29.1 2% | 29 2% | 28.8 3% | 29.8 -1% | 30.3 -2% |
| Idle Average * (dB) | 29.6 | 31.2 -5% | 29.1 2% | 29 2% | 28.9 2% | 29.8 -1% | 30.3 -2% |
| Idle Maximum * (dB) | 29.6 | 31.6 -7% | 29.1 2% | 29 2% | 28.9 2% | 29.8 -1% | 30.3 -2% |
| Load Average * (dB) | 42 | 33.3 21% | 32.3 23% | 37.4 11% | 35 17% | 32.6 22% | 31.6 25% |
| Load Maximum * (dB) | 47.1 | 32.4 31% | 36.6 22% | 39 17% | 35.8 24% | 37.2 21% | 35 26% |
| arrêt / environnement * (dB) | 31.2 | 29.1 | 29 | 28.8 | 29 | 30.3 |
* ... Moindre est la valeur, meilleures sont les performances
(+) La température maximale du côté supérieur est de 36.4 °C / 98 F, par rapport à la moyenne de 34.3 °C / 94 F, allant de 21.2 à 62.5 °C pour la classe Office.
(±) Le fond chauffe jusqu'à un maximum de 45 °C / 113 F, contre une moyenne de 36.8 °C / 98 F
(+) En utilisation inactive, la température moyenne du côté supérieur est de 24 °C / 75 F, par rapport à la moyenne du dispositif de 29.5 °C / 85 F.
(+) Les repose-poignets et le pavé tactile sont plus froids que la température de la peau avec un maximum de 24.8 °C / 76.6 F et sont donc froids au toucher.
(+) La température moyenne de la zone de l'appui-paume de dispositifs similaires était de 27.5 °C / 81.5 F (+2.7 °C / #4.9 F).
Dell Latitude 5480 analyse audio
(±) | le niveau sonore du haut-parleur est moyen mais bon (80.5# dB)
Basses 100 - 315 Hz
(±) | basse réduite - en moyenne 8.7% inférieure à la médiane
(±) | la linéarité des basses est moyenne (10.1% delta à la fréquence précédente)
Médiums 400 - 2000 Hz
(+) | médiane équilibrée - seulement 3.6% de la médiane
(±) | la linéarité des médiums est moyenne (7.8% delta à la fréquence précédente)
Aiguës 2 - 16 kHz
(±) | sommets plus élevés - en moyenne 5.7% plus élevés que la médiane
(±) | la linéarité des aigus est moyenne (9.2% delta à la fréquence précédente)
Globalement 100 - 16 000 Hz
(±) | la linéarité du son global est moyenne (15.6% de différence avec la médiane)
Par rapport à la même classe
» 16% de tous les appareils testés de cette catégorie étaient meilleurs, 4% similaires, 79% pires
» Le meilleur avait un delta de 7%, la moyenne était de 21%, le pire était de 53%.
Par rapport à tous les appareils testés
» 23% de tous les appareils testés étaient meilleurs, 5% similaires, 72% pires
» Le meilleur avait un delta de 4%, la moyenne était de 24%, le pire était de 134%.
Apple MacBook 12 (Early 2016) 1.1 GHz analyse audio
(+) | les haut-parleurs peuvent jouer relativement fort (83.6# dB)
Basses 100 - 315 Hz
(±) | basse réduite - en moyenne 11.3% inférieure à la médiane
(±) | la linéarité des basses est moyenne (14.2% delta à la fréquence précédente)
Médiums 400 - 2000 Hz
(+) | médiane équilibrée - seulement 2.4% de la médiane
(+) | les médiums sont linéaires (5.5% delta à la fréquence précédente)
Aiguës 2 - 16 kHz
(+) | des sommets équilibrés - à seulement 2% de la médiane
(+) | les aigus sont linéaires (4.5% delta à la fréquence précédente)
Globalement 100 - 16 000 Hz
(+) | le son global est linéaire (10.2% différence à la médiane)
Par rapport à la même classe
» 7% de tous les appareils testés de cette catégorie étaient meilleurs, 2% similaires, 91% pires
» Le meilleur avait un delta de 5%, la moyenne était de 18%, le pire était de 53%.
Par rapport à tous les appareils testés
» 5% de tous les appareils testés étaient meilleurs, 1% similaires, 94% pires
» Le meilleur avait un delta de 4%, la moyenne était de 24%, le pire était de 134%.
| Éteint/en veille | |
| Au repos | |
| Fortement sollicité |
|
Légende:
min: | |
| Dell Latitude 5480 i7-7600U, HD Graphics 620, Toshiba SG5 256GB THNSNK256GVN8, IPS, 1920x1080, 14" | Acer TravelMate P648-M-757N 6500U, HD Graphics 520, Lite-On CV1-8B256, IPS, 1920x1080, 14" | Lenovo ThinkPad T460s-20F9003SGE 6200U, HD Graphics 520, Samsung CM871 MZ7LF192HCGS, IPS, 1920x1080, 14" | HP ProBook 440 G4-Y8B51EA i7-7500U, GeForce 930MX, SanDisk SD8SNAT256G1002, TN, 1920x1080, 14" | Lenovo ThinkPad X1 Carbon 20FB-005XUS 6300U, HD Graphics 520, Samsung SM951 MZVPV256 m.2, IPS, 1920x1080, 14" | Toshiba Tecra Z40-C-106 6200U, HD Graphics 520, Toshiba HG6 THNSNJ256G8NY, IPS, 1920x1080, 14" | Dell Latitude 14 E5470 6440HQ, HD Graphics 530, Micron SSD 1100 (MTFDDAV256TBN), AH-IPS, WLED, 1920x1080, 14" | |
|---|---|---|---|---|---|---|---|
| Power Consumption | -14% | 11% | -4% | -9% | 5% | -19% | |
| Idle Minimum * (Watt) | 6.64 | 5.3 20% | 3.7 44% | 3 55% | 7.6 -14% | 4.3 35% | 4.1 38% |
| Idle Average * (Watt) | 6.67 | 9.3 -39% | 6.8 -2% | 5.4 19% | 9 -35% | 7.6 -14% | 8.1 -21% |
| Idle Maximum * (Watt) | 7.78 | 11.5 -48% | 7.3 6% | 6.3 19% | 9.6 -23% | 8.3 -7% | 11.4 -47% |
| Load Average * (Watt) | 30.83 | 30.8 -0% | 26.3 15% | 37.5 -22% | 24.5 21% | 26.8 13% | 33.5 -9% |
| Load Maximum * (Watt) | 31.7 | 32 -1% | 34.6 -9% | 61.1 -93% | 30.3 4% | 32.6 -3% | 49 -55% |
* ... Moindre est la valeur, meilleures sont les performances
| Dell Latitude 5480 i7-7600U, HD Graphics 620, 68 Wh | Acer TravelMate P648-M-757N 6500U, HD Graphics 520, 54 Wh | Lenovo ThinkPad T460s-20F9003SGE 6200U, HD Graphics 520, 49 Wh | HP ProBook 440 G4-Y8B51EA i7-7500U, GeForce 930MX, 48 Wh | Lenovo ThinkPad X1 Carbon 20FB-005XUS 6300U, HD Graphics 520, 52 Wh | Toshiba Tecra Z40-C-106 6200U, HD Graphics 520, 64 Wh | Dell Latitude 14 E5470 6440HQ, HD Graphics 530, 62 Wh | |
|---|---|---|---|---|---|---|---|
| Autonomie de la batterie | -34% | -42% | -30% | -42% | -24% | -47% | |
| Reader / Idle (h) | 24.1 | 18.1 -25% | 15.3 -37% | 18.1 -25% | 12.9 -46% | 17.4 -28% | 15.2 -37% |
| WiFi v1.3 (h) | 16.1 | 9.1 -43% | 6.6 -59% | 6.9 -57% | 6.9 -57% | 9 -44% | 7.2 -55% |
| Load (h) | 2.7 | 1.8 -33% | 1.9 -30% | 2.5 -7% | 2.1 -22% | 2.7 0% | 1.4 -48% |
Points positifs
Points négatifs
Verdict
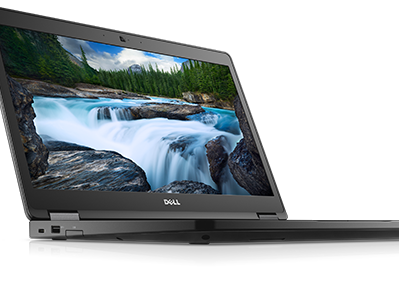
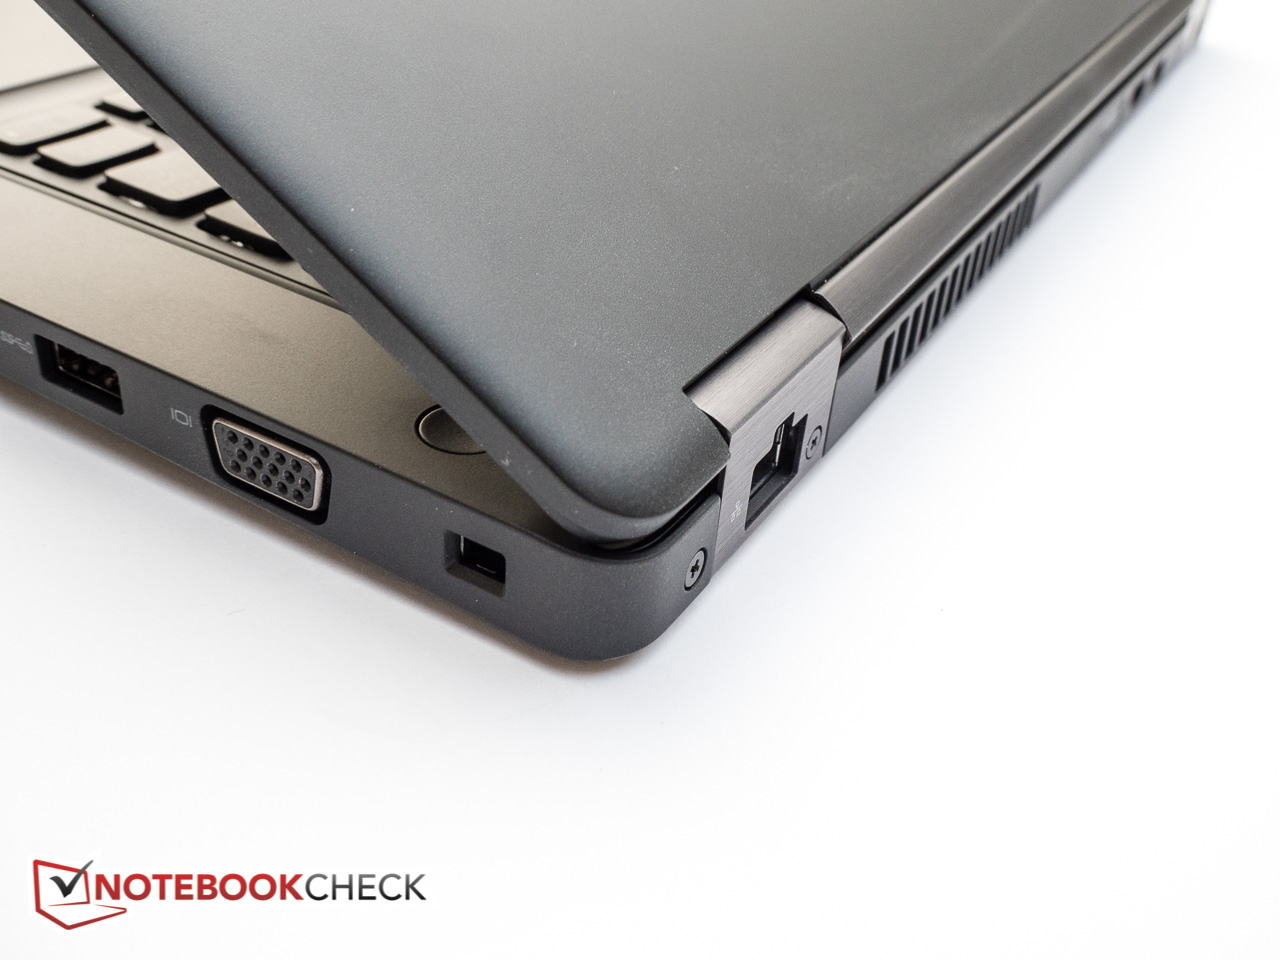
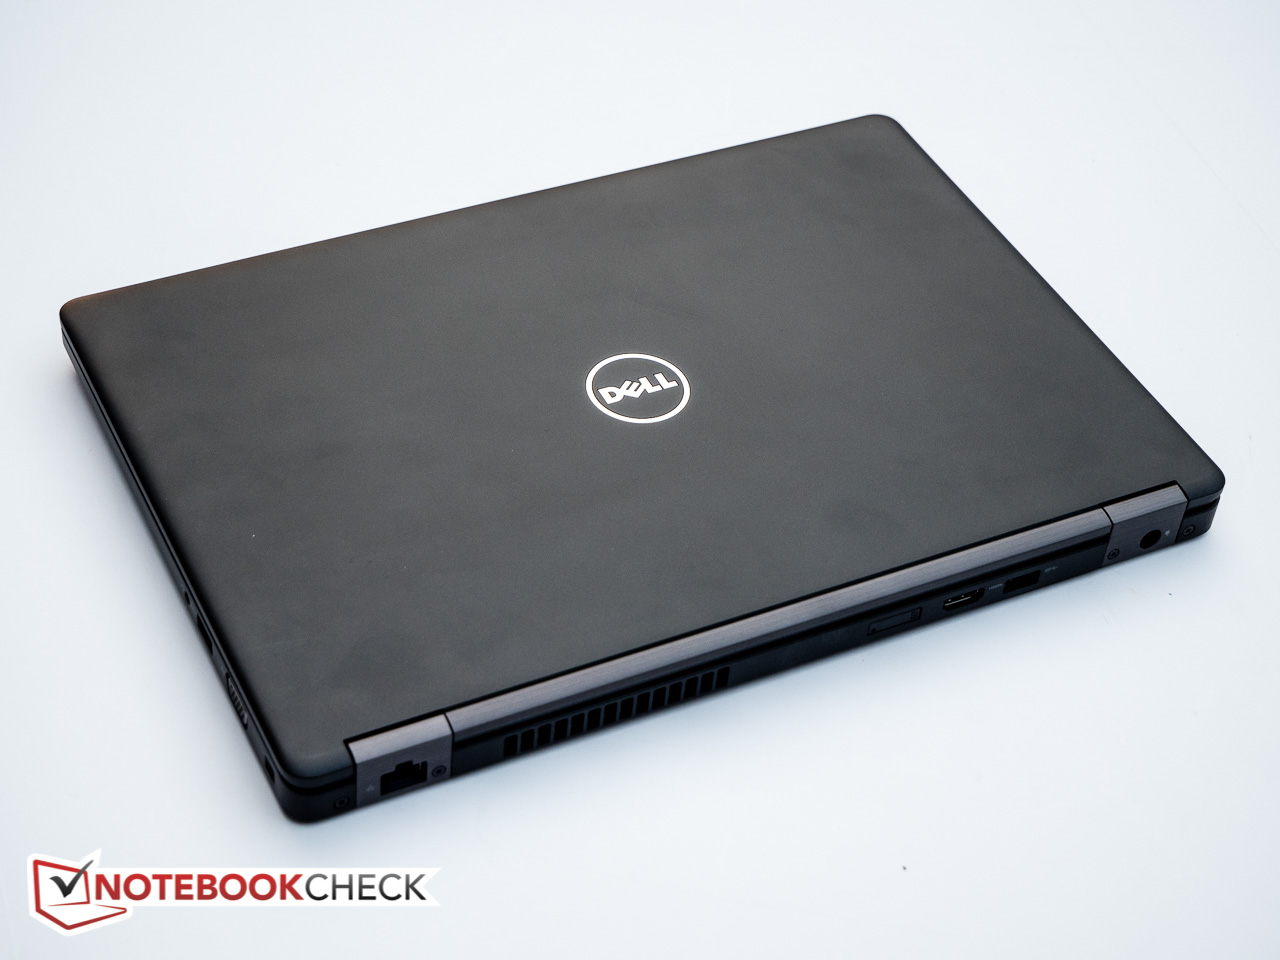
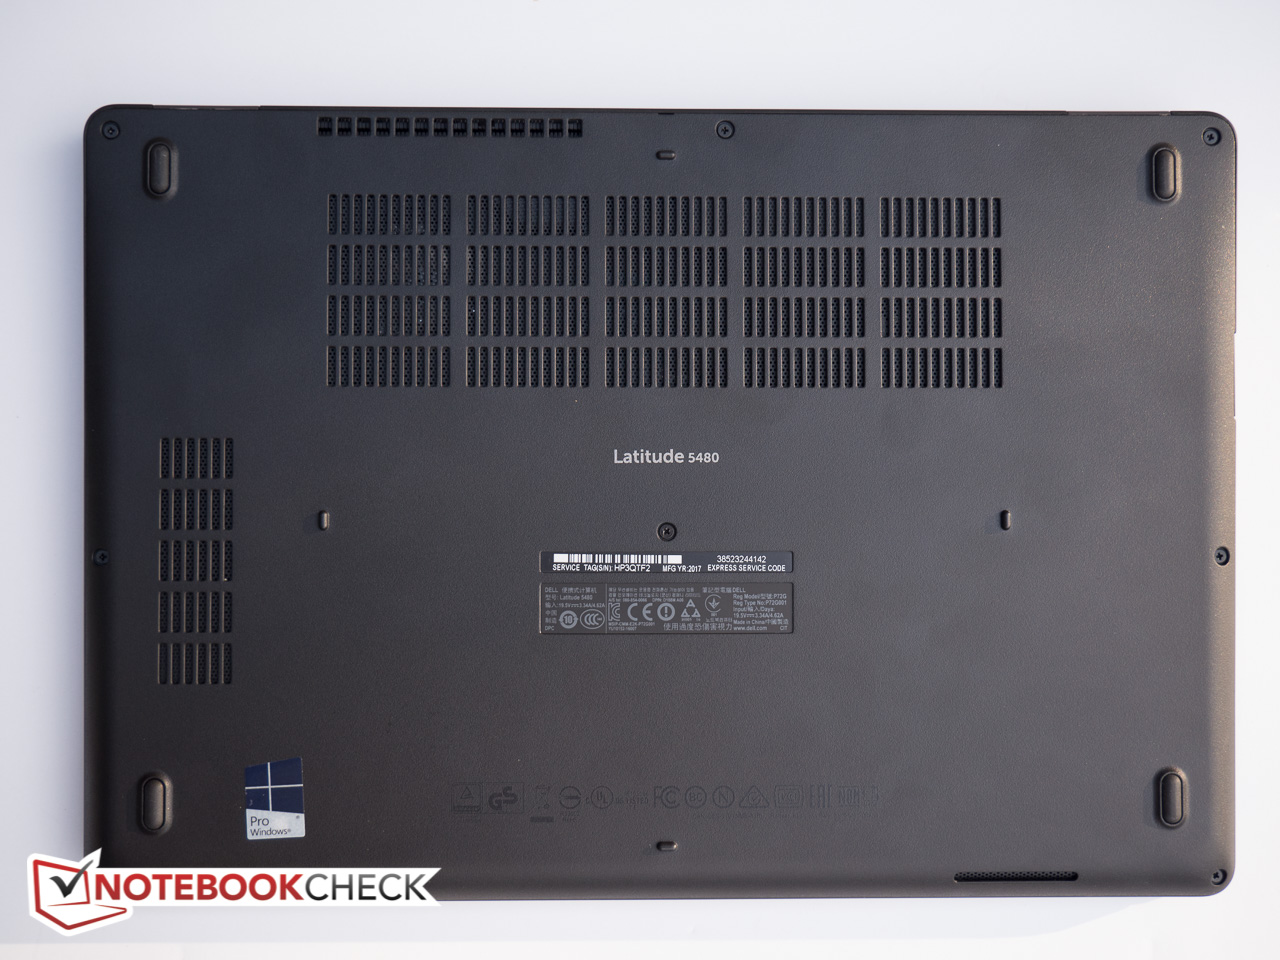
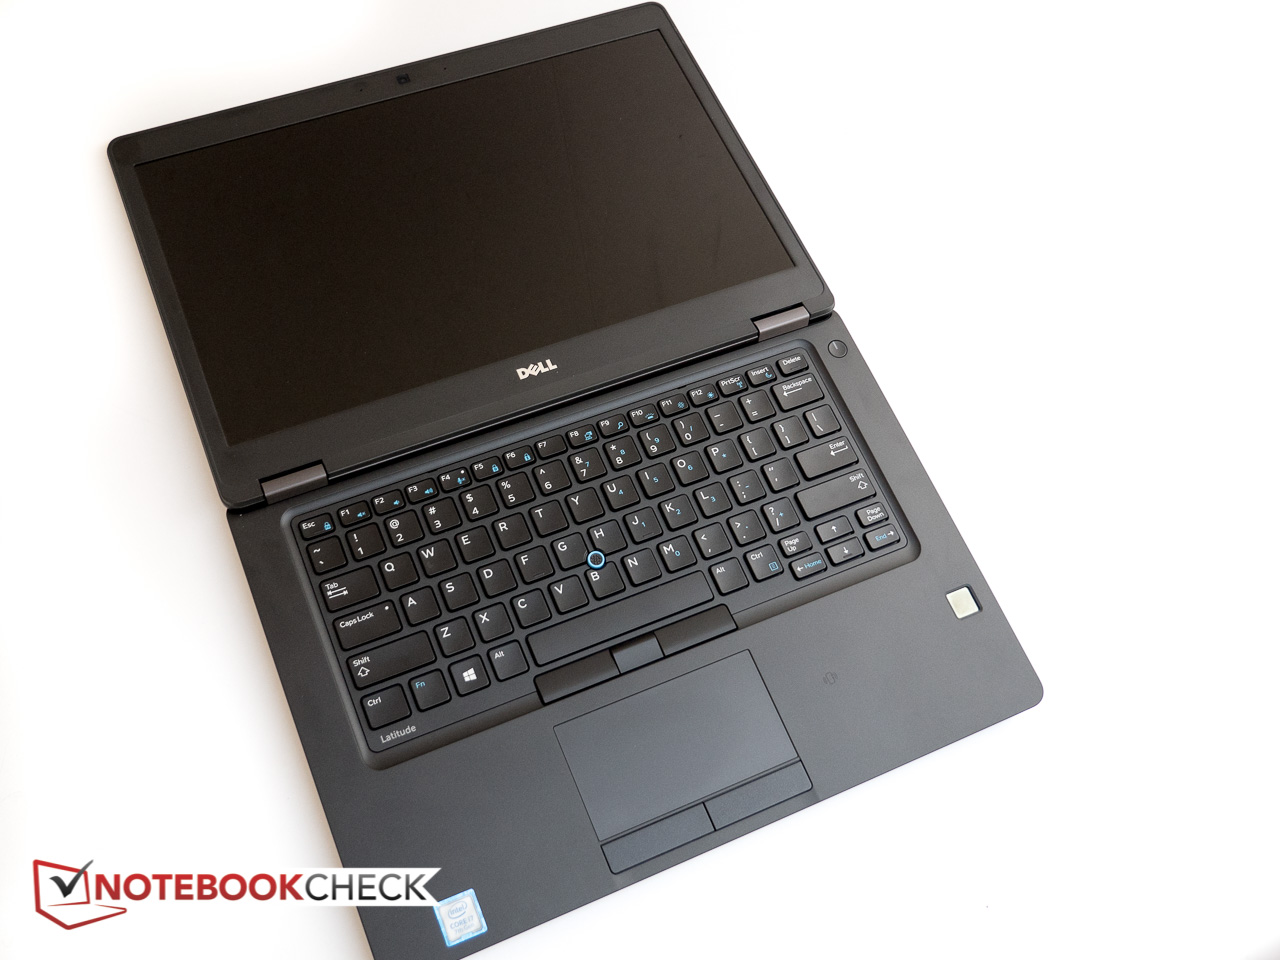
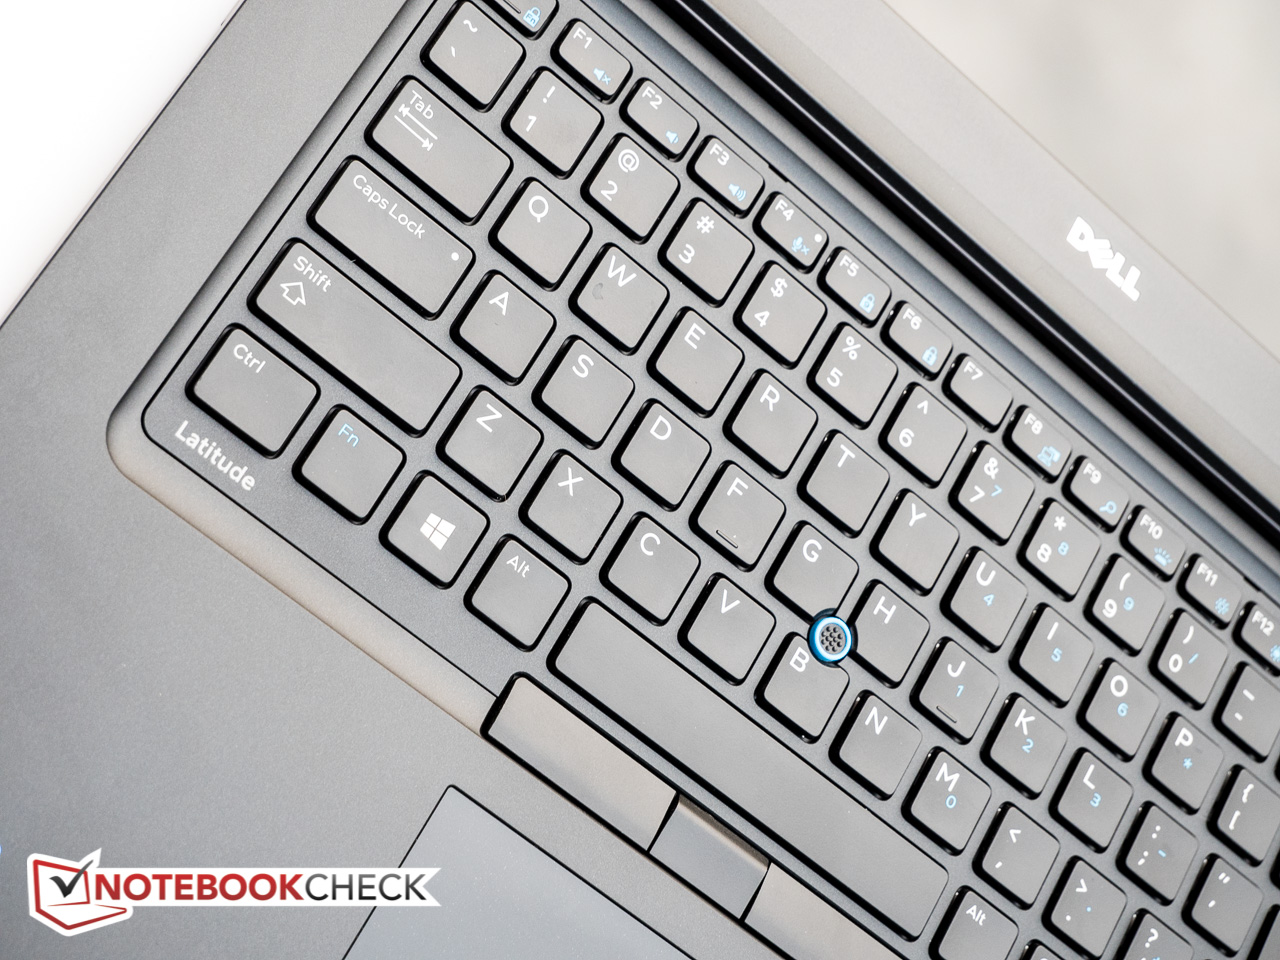
Peu de choses ont changé à première vue : le Latitude 5480 de Dell, entre design sobre et surfaces lisses et noires, ressemble beaucoup à son grand frère le Latitude 14 E5470. Le processeur Kabby Lake Core i7, haut de gamme, assure des performances remarquables et sans aucun doute suffisantes pour les applications qui comptent au travail. Le GPU intégré offre lui une puissance 3D plutôt modeste ; les utilisateurs qui recherchent plus de capacités graphiques pourront choisir un modèle Latitude équipé d’une puce dédiée Nvidia GeForce 930MX. La construction est très bonne entre espacements réguliers et tolérances strictes, même si le clavier a tendance à être trop facilement déformable à notre goût. Les périphériques d’entrée, incluant l’écran tactile, ont un comportement satisfaisant et le clavier se révélera sans aucun doute un plaisir à l’utilisation pour les plus exigeants. Si vous êtes habitué à un Pointstick de ThinkPad, il y a cependant peu de chances que les boutons du touchpad vous fassent grosse impression.
Une des plus grandes différences avec le modèle précédent est malheureusement aussi tout à fait regrettable, et réside dans le changement de dalle. La nouvelle offre bien un meilleur contraste, mais la colorimétrie, et surtout la luminosité avec une chute de 35%, ont souffert. L’autonomie de batterie a en revanche été grandement améliorée et place l’appareil largement en tête de peloton face à la concurrence.
Le Latitude 5480 a une autonomie de batterie très en avance sur ses concurrents, et ses 16h en navigation internet par WiFi devrait ravir les travailleurs en mouvement les plus acharnes. Mais il nous faut bien avouer que nous échangerions volontiers quelques heures d’autonomie pour une plus forte luminosité de l’écran.
Ceci est une version abrégée du compte-rendu original. Vous pouvez lire la version complète en anglais ici.
Dell Latitude 5480
- 04/18/2017 v6 (old)
Bernhard Pechlaner
Price comparison
