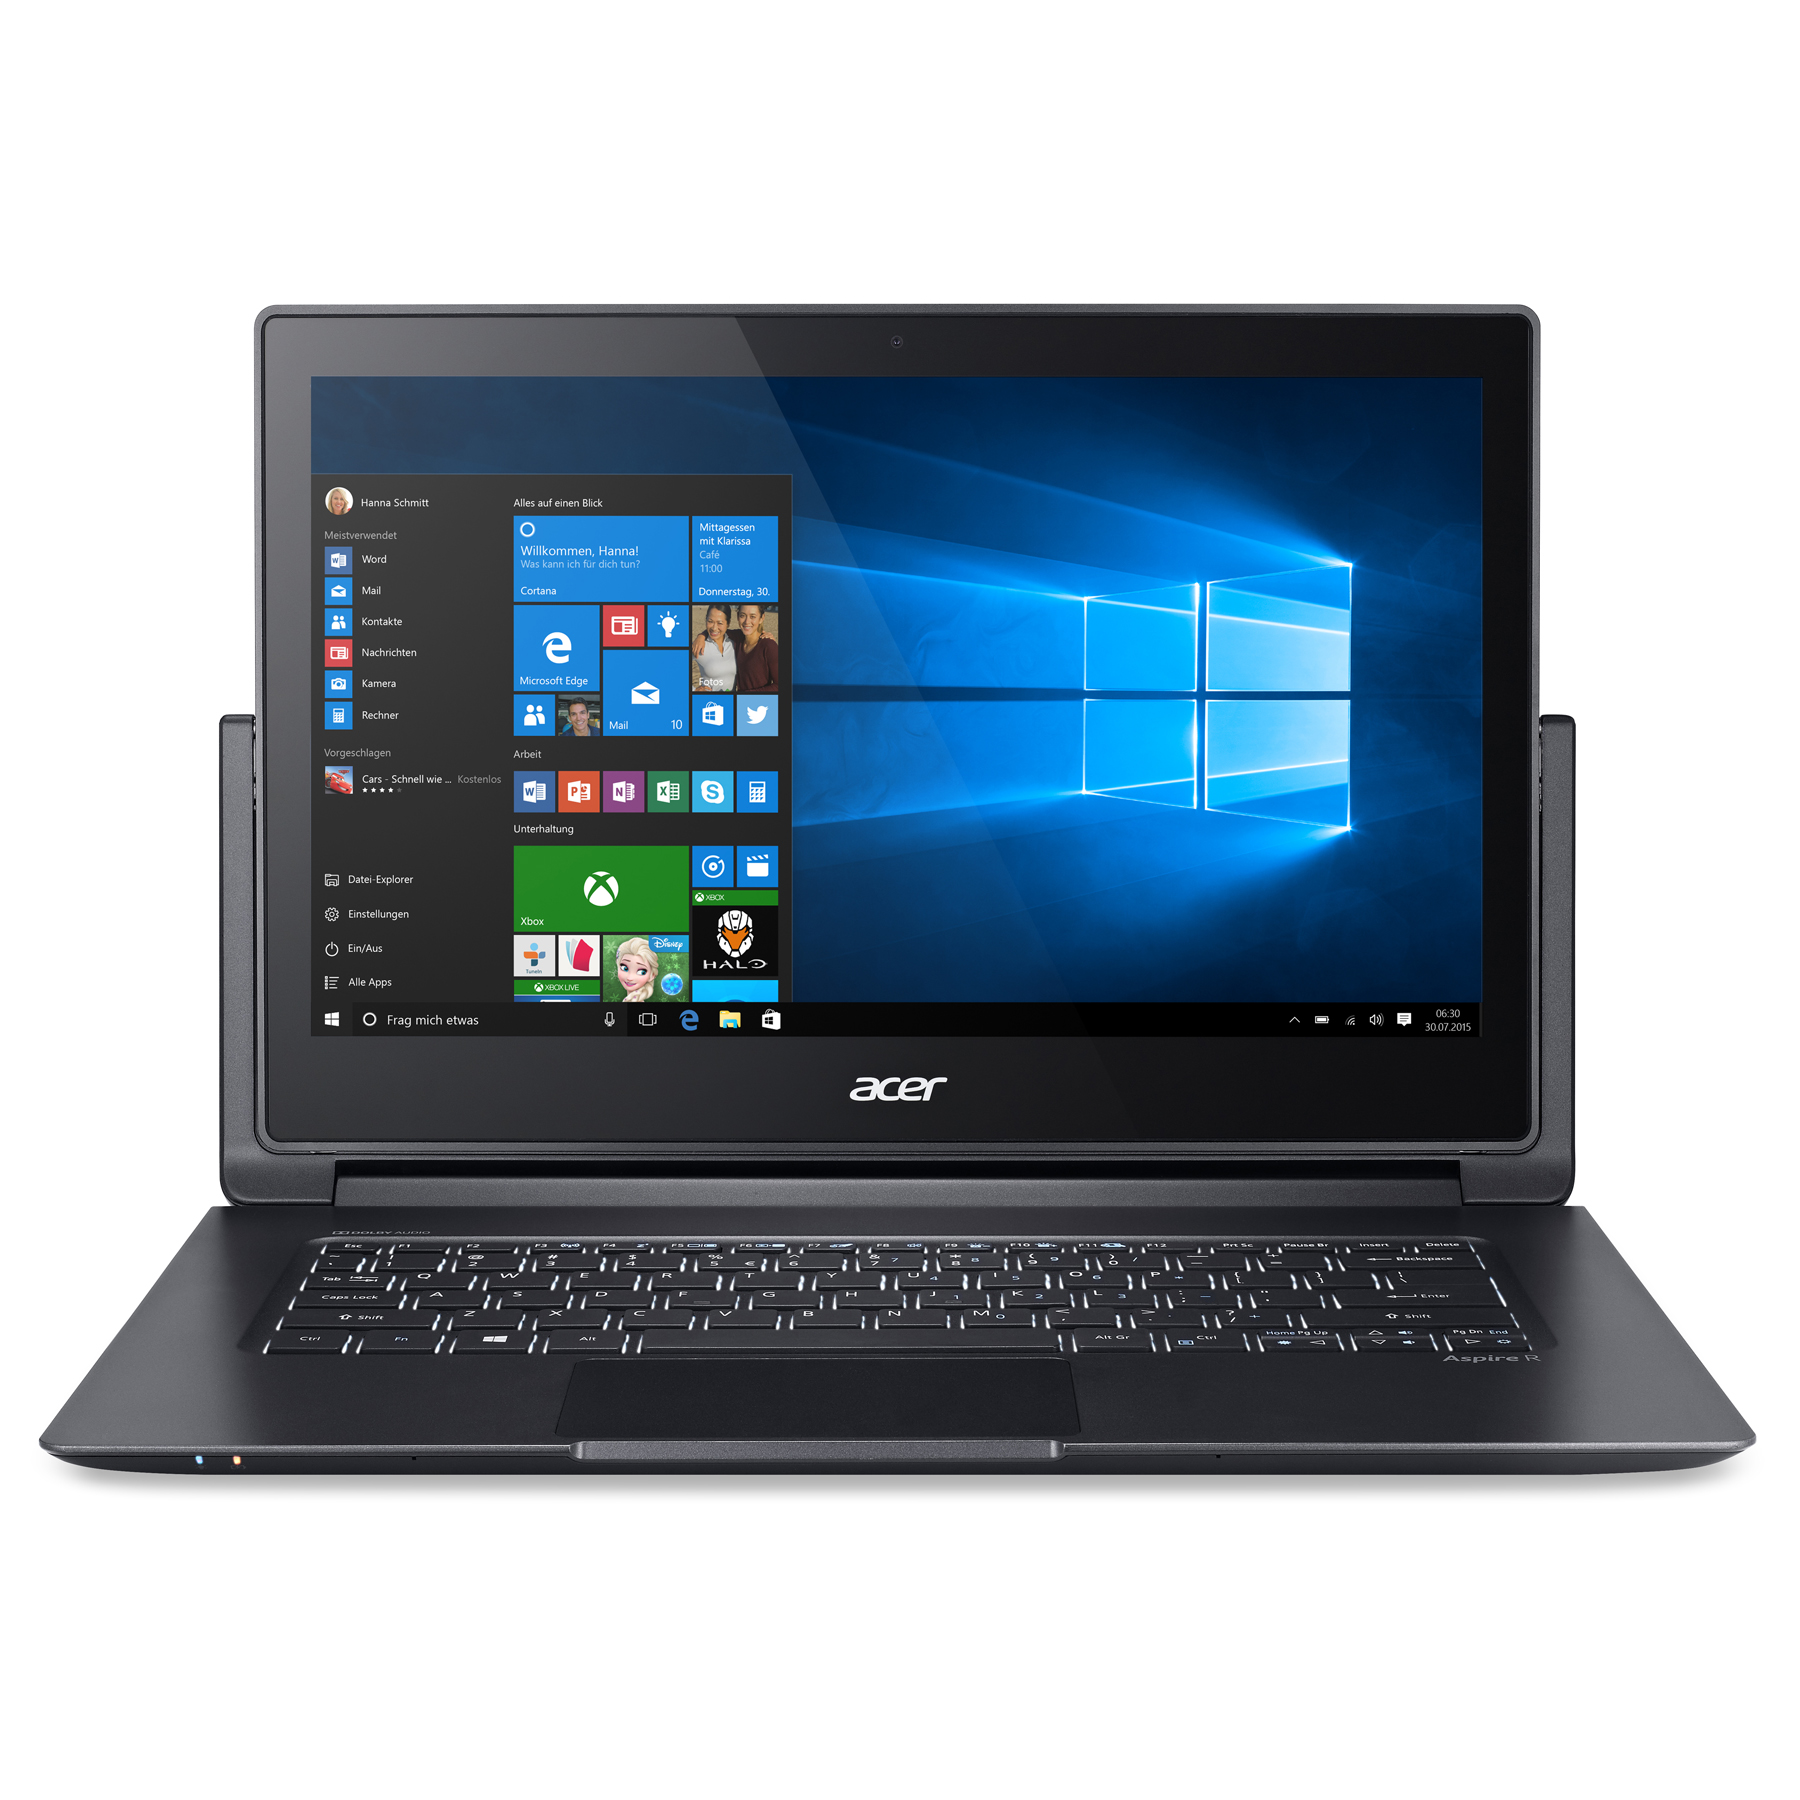
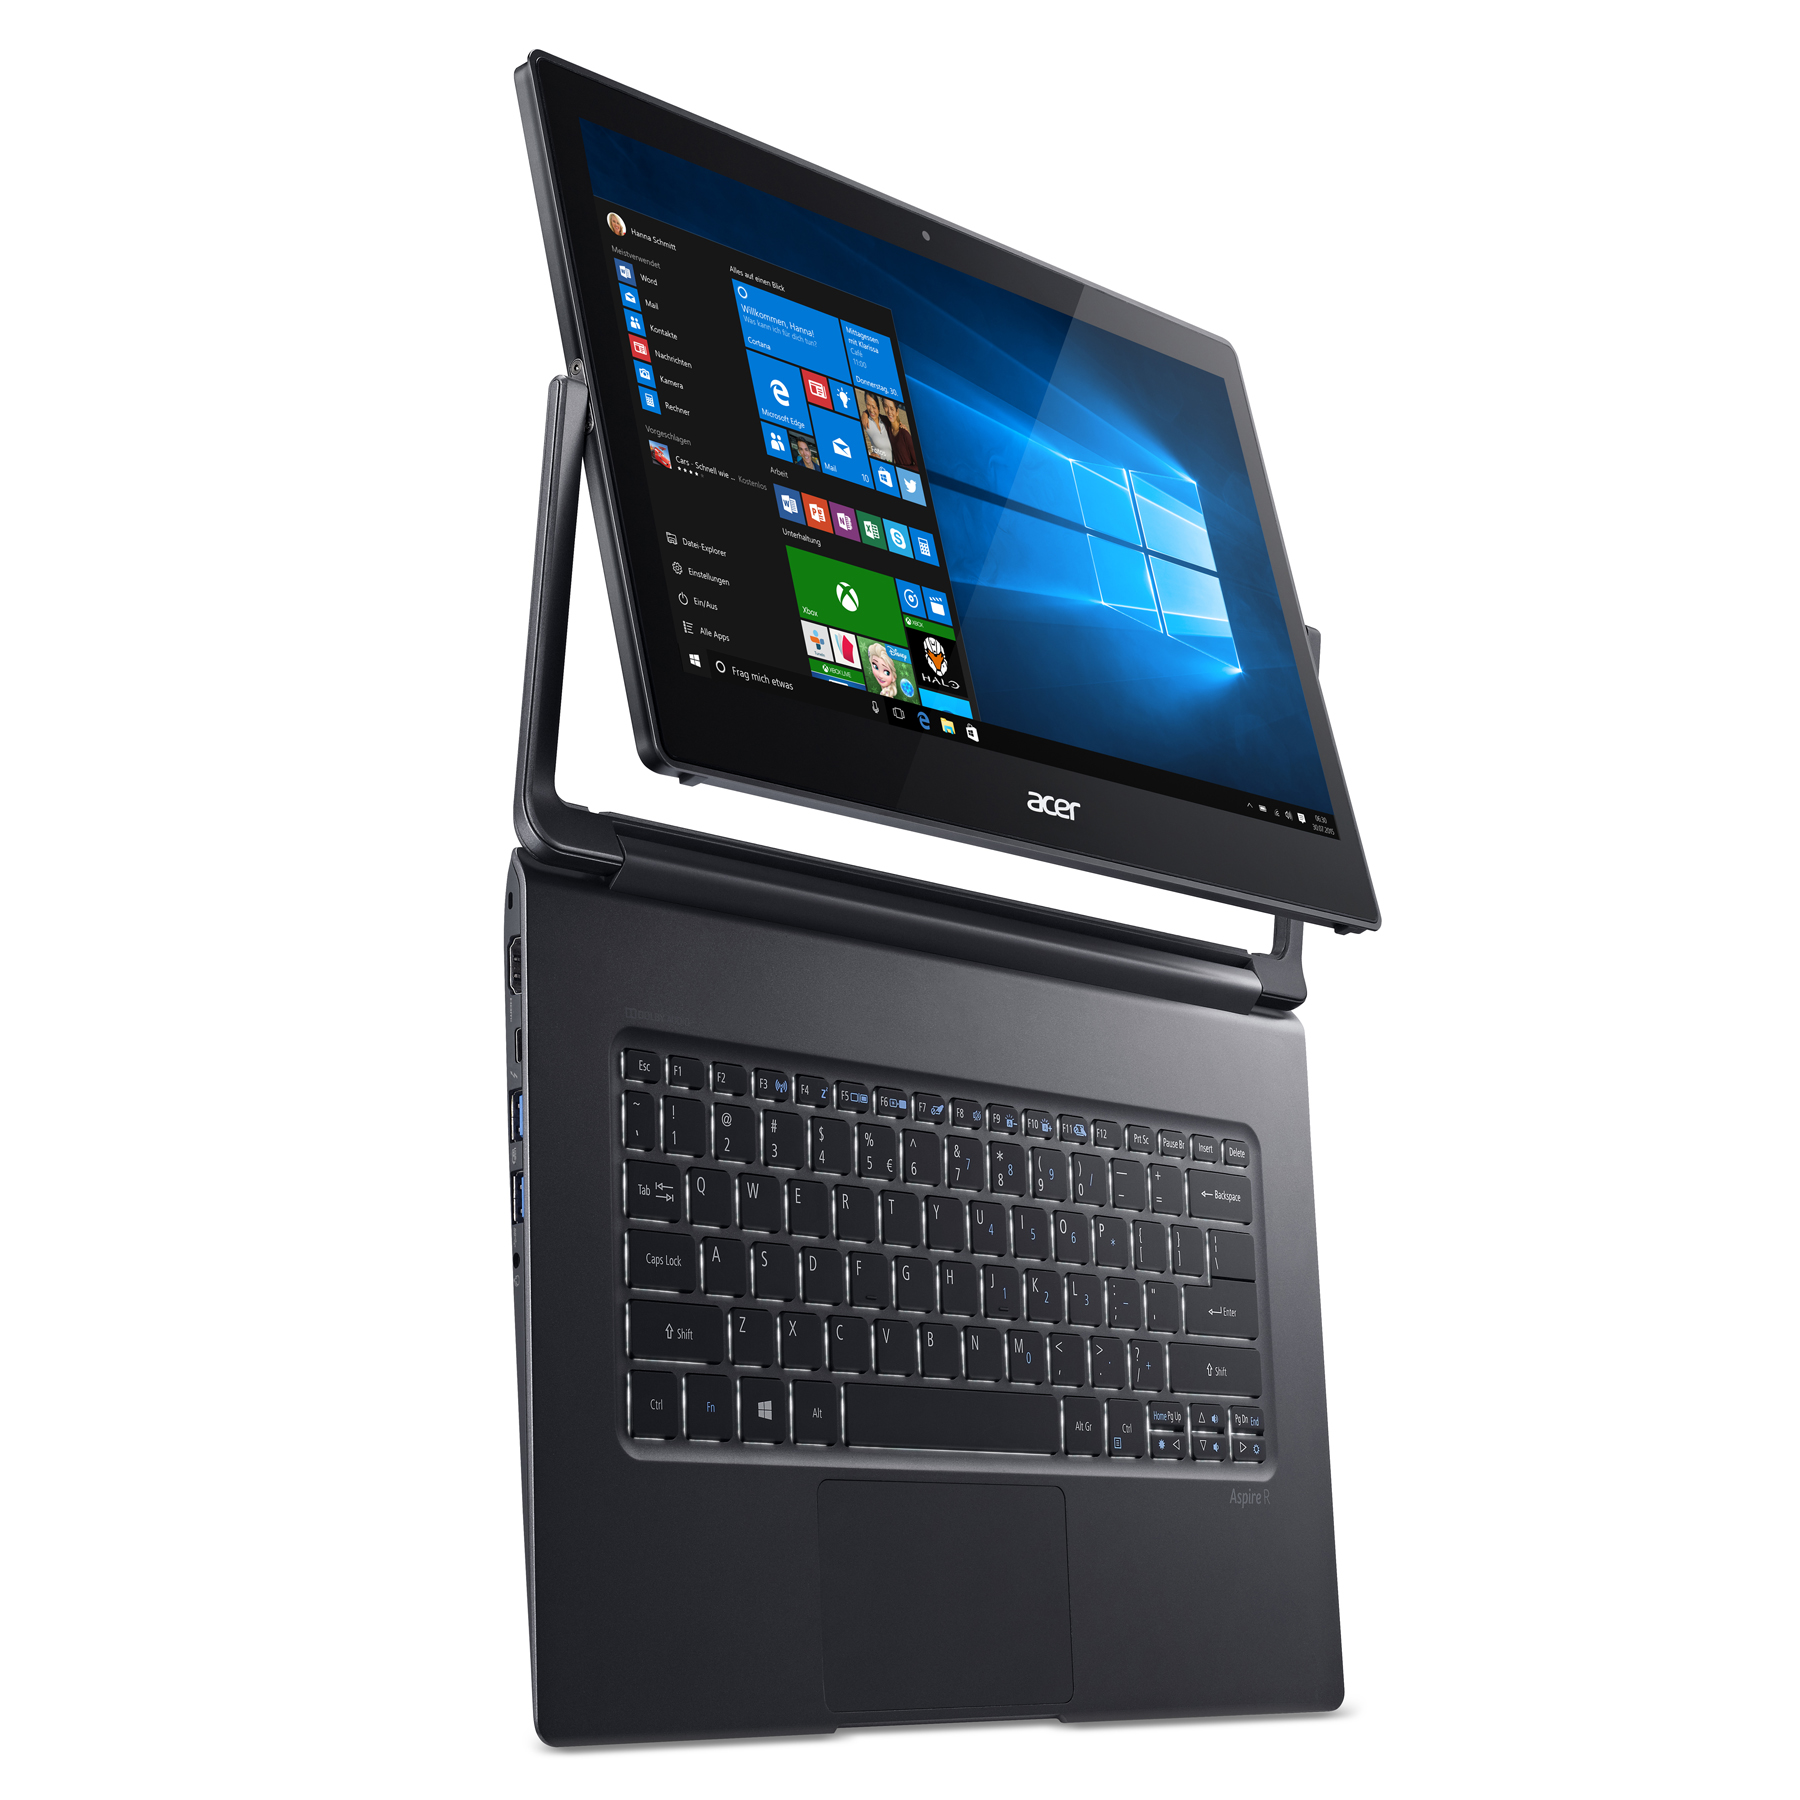
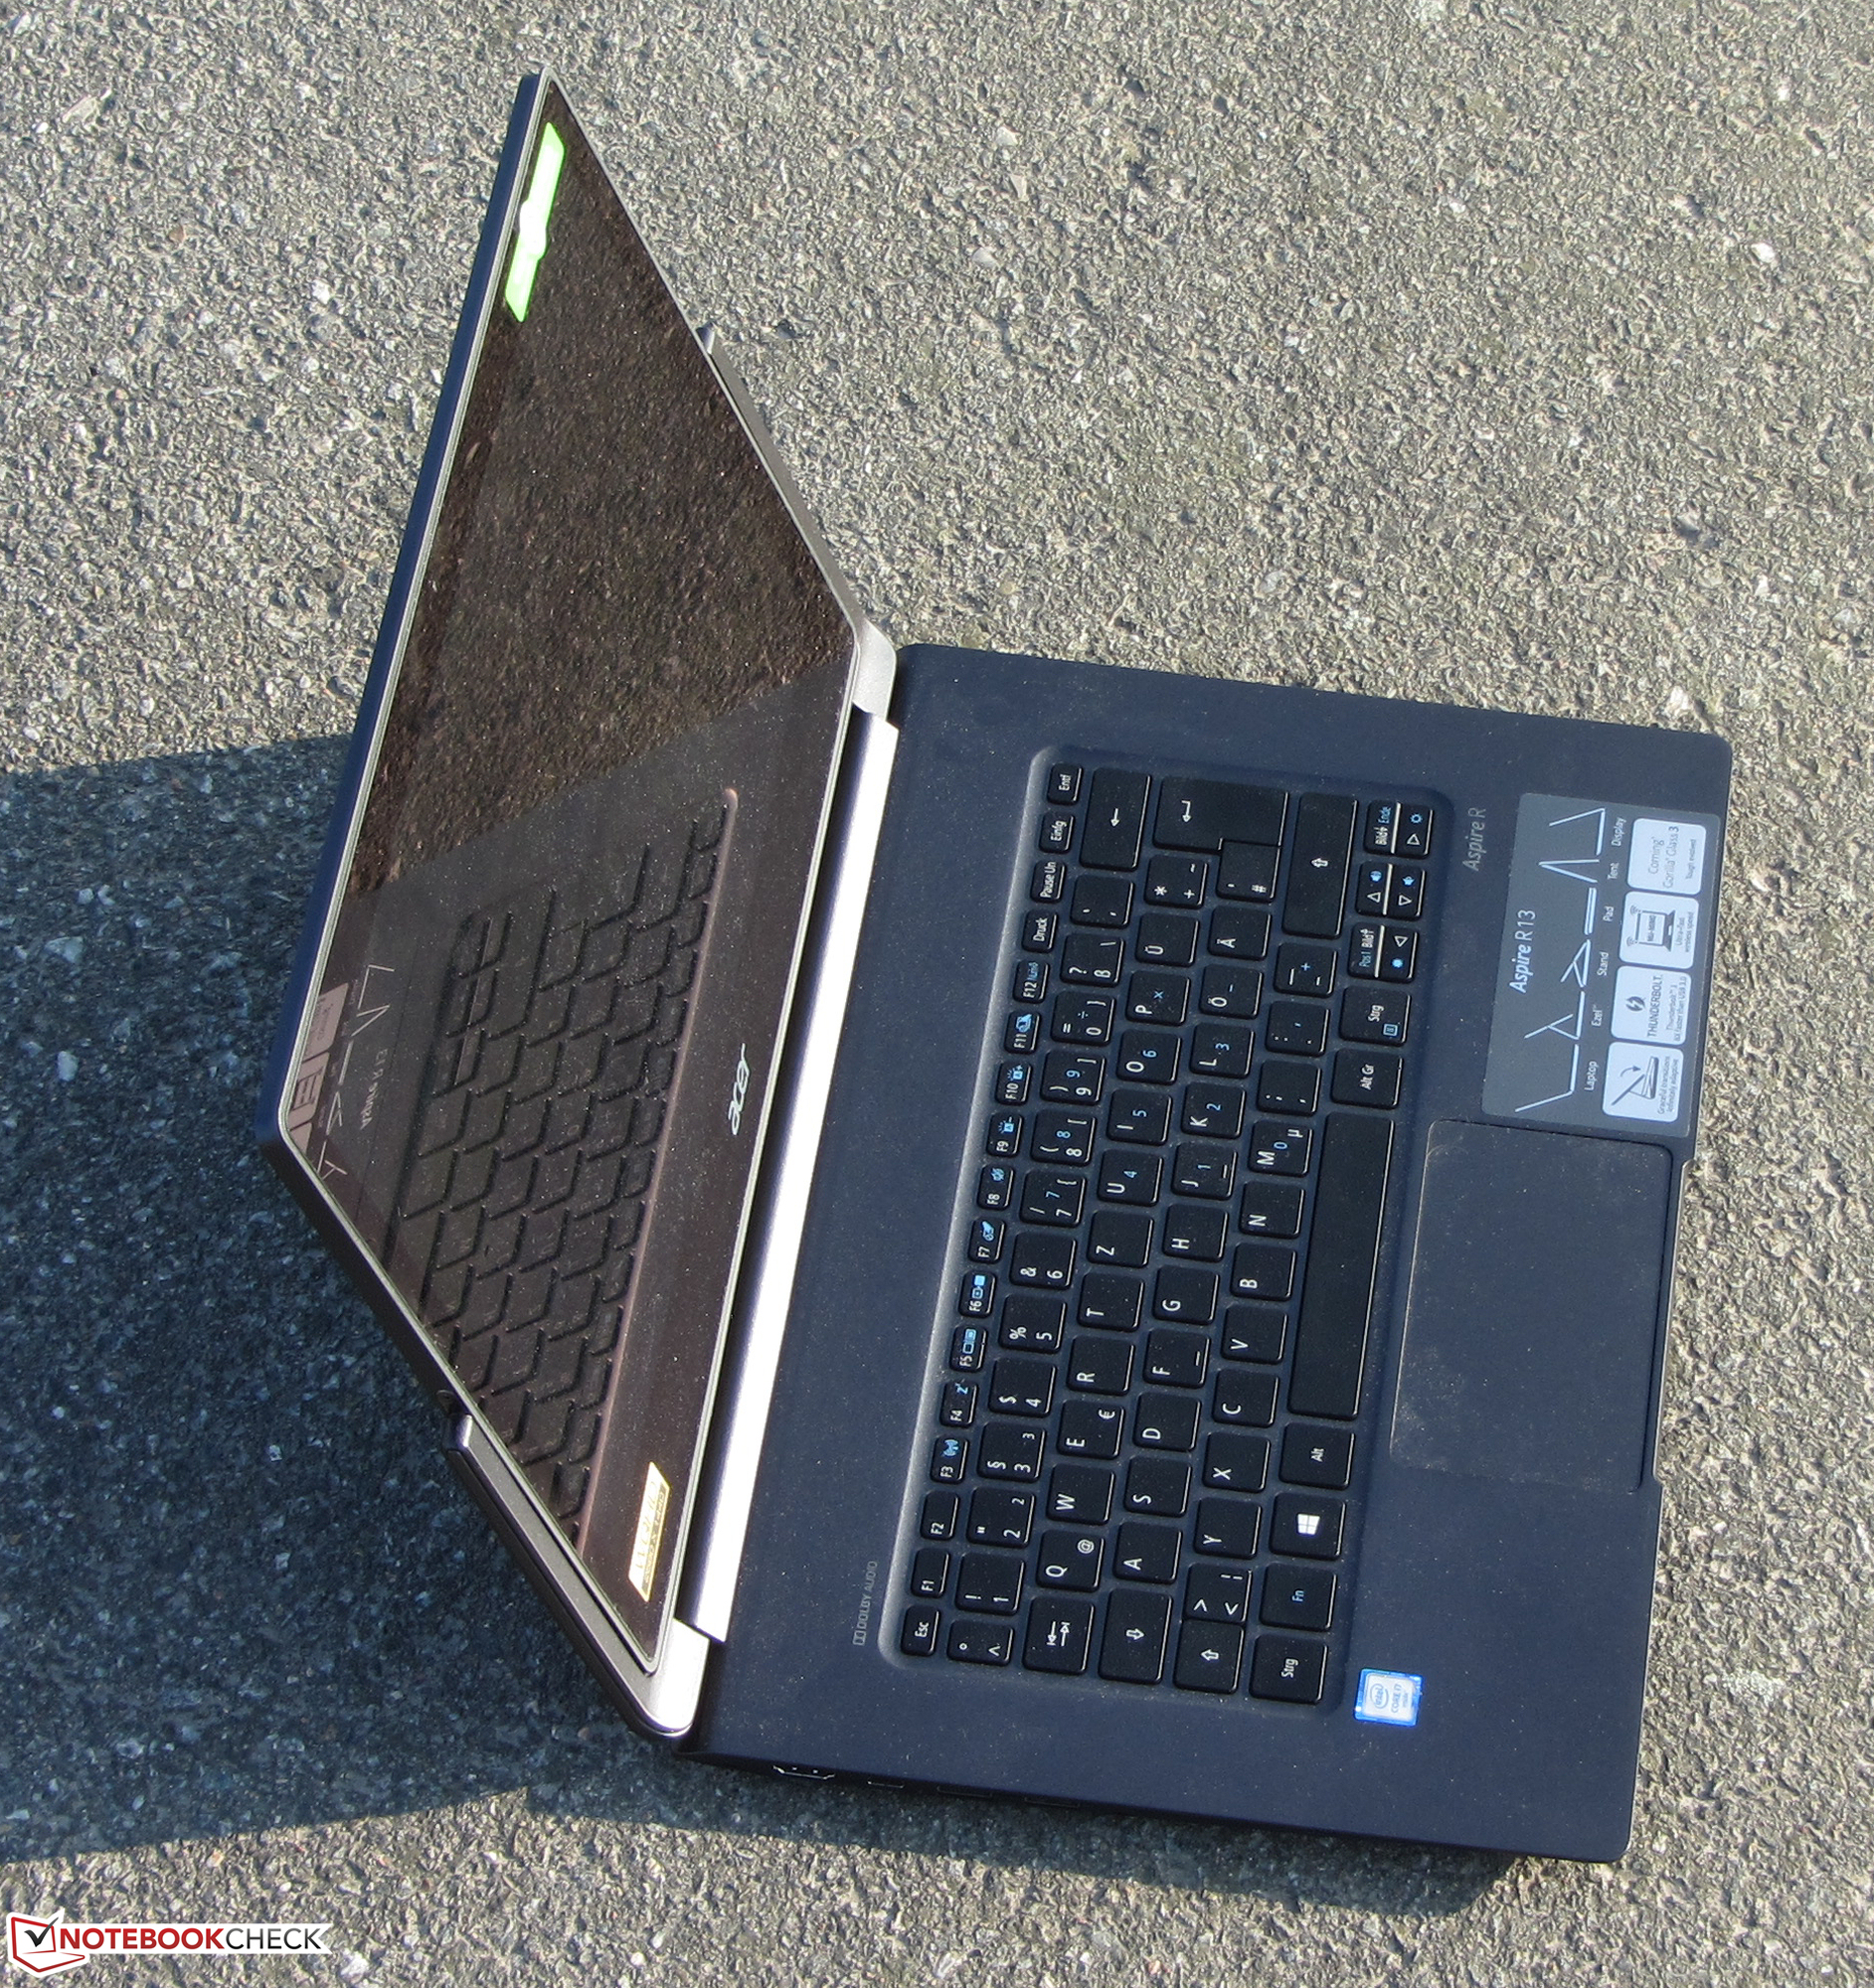
Courte critique du convertible Acer Aspire R13 R7-372T-746N
| |||||||||||||||||||||||||
Homogénéité de la luminosité: 91 %
Valeur mesurée au centre, sur batterie: 323 cd/m²
Contraste: 1882:1 (Valeurs des noirs: 0.17 cd/m²)
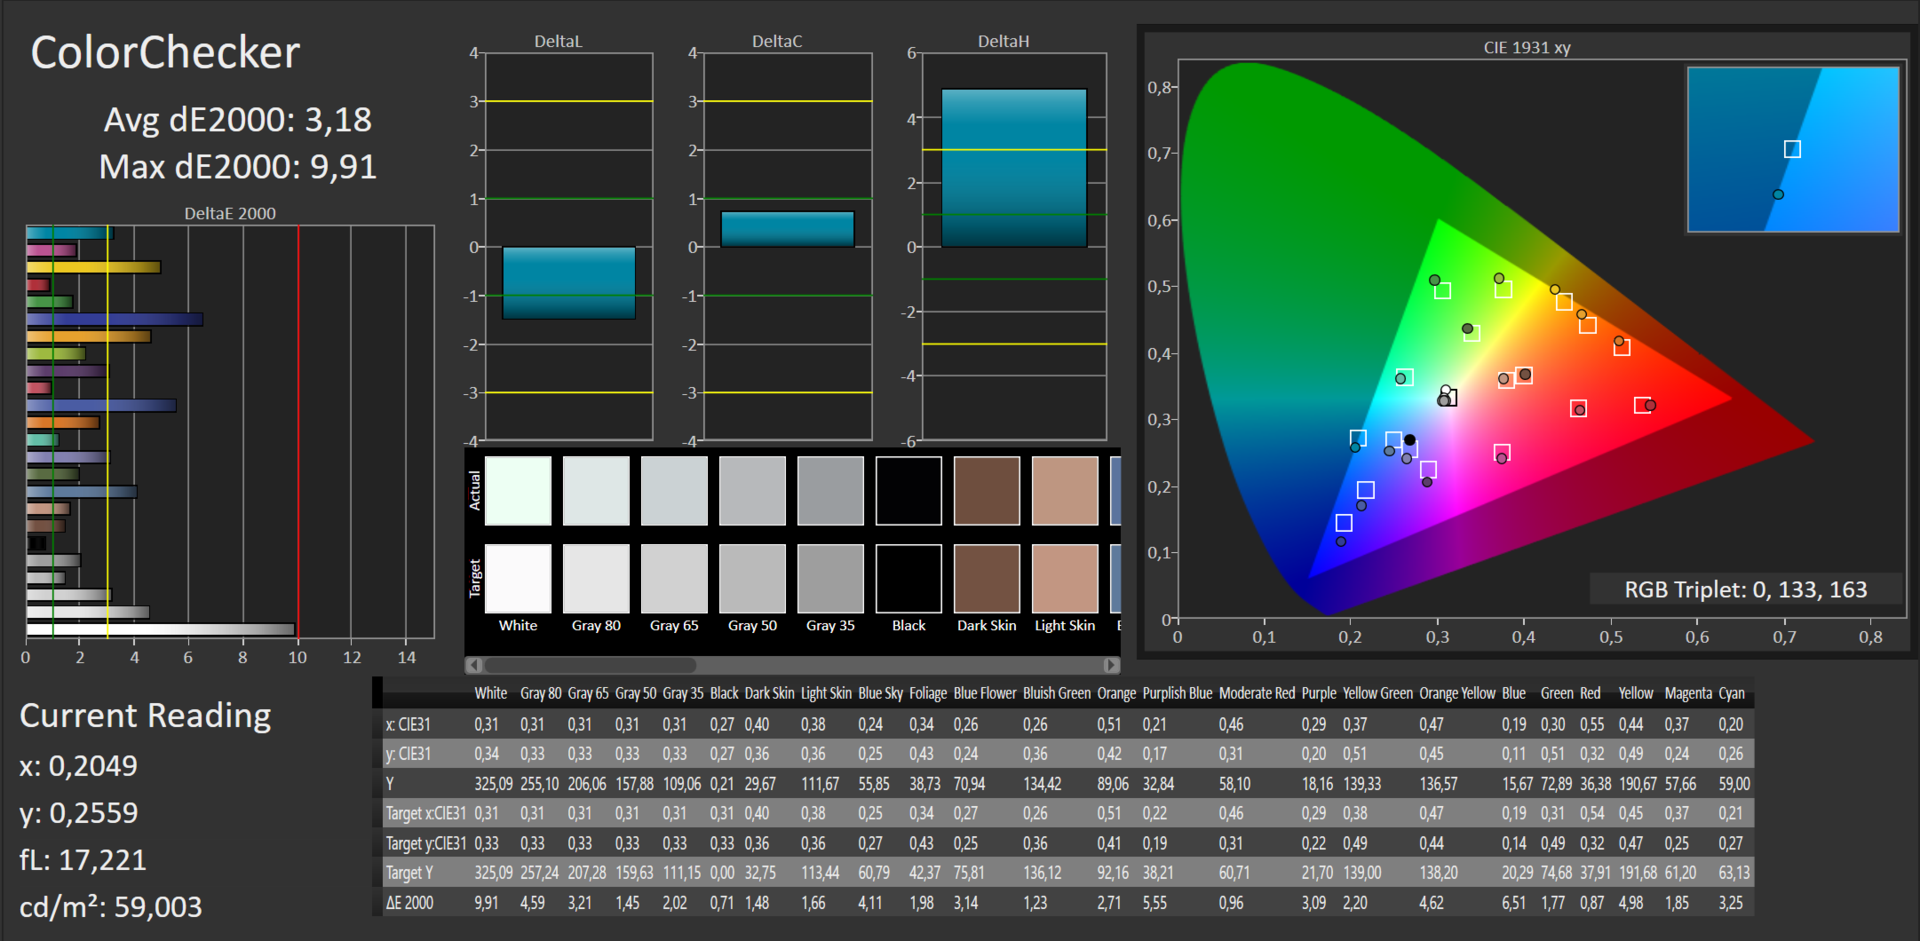
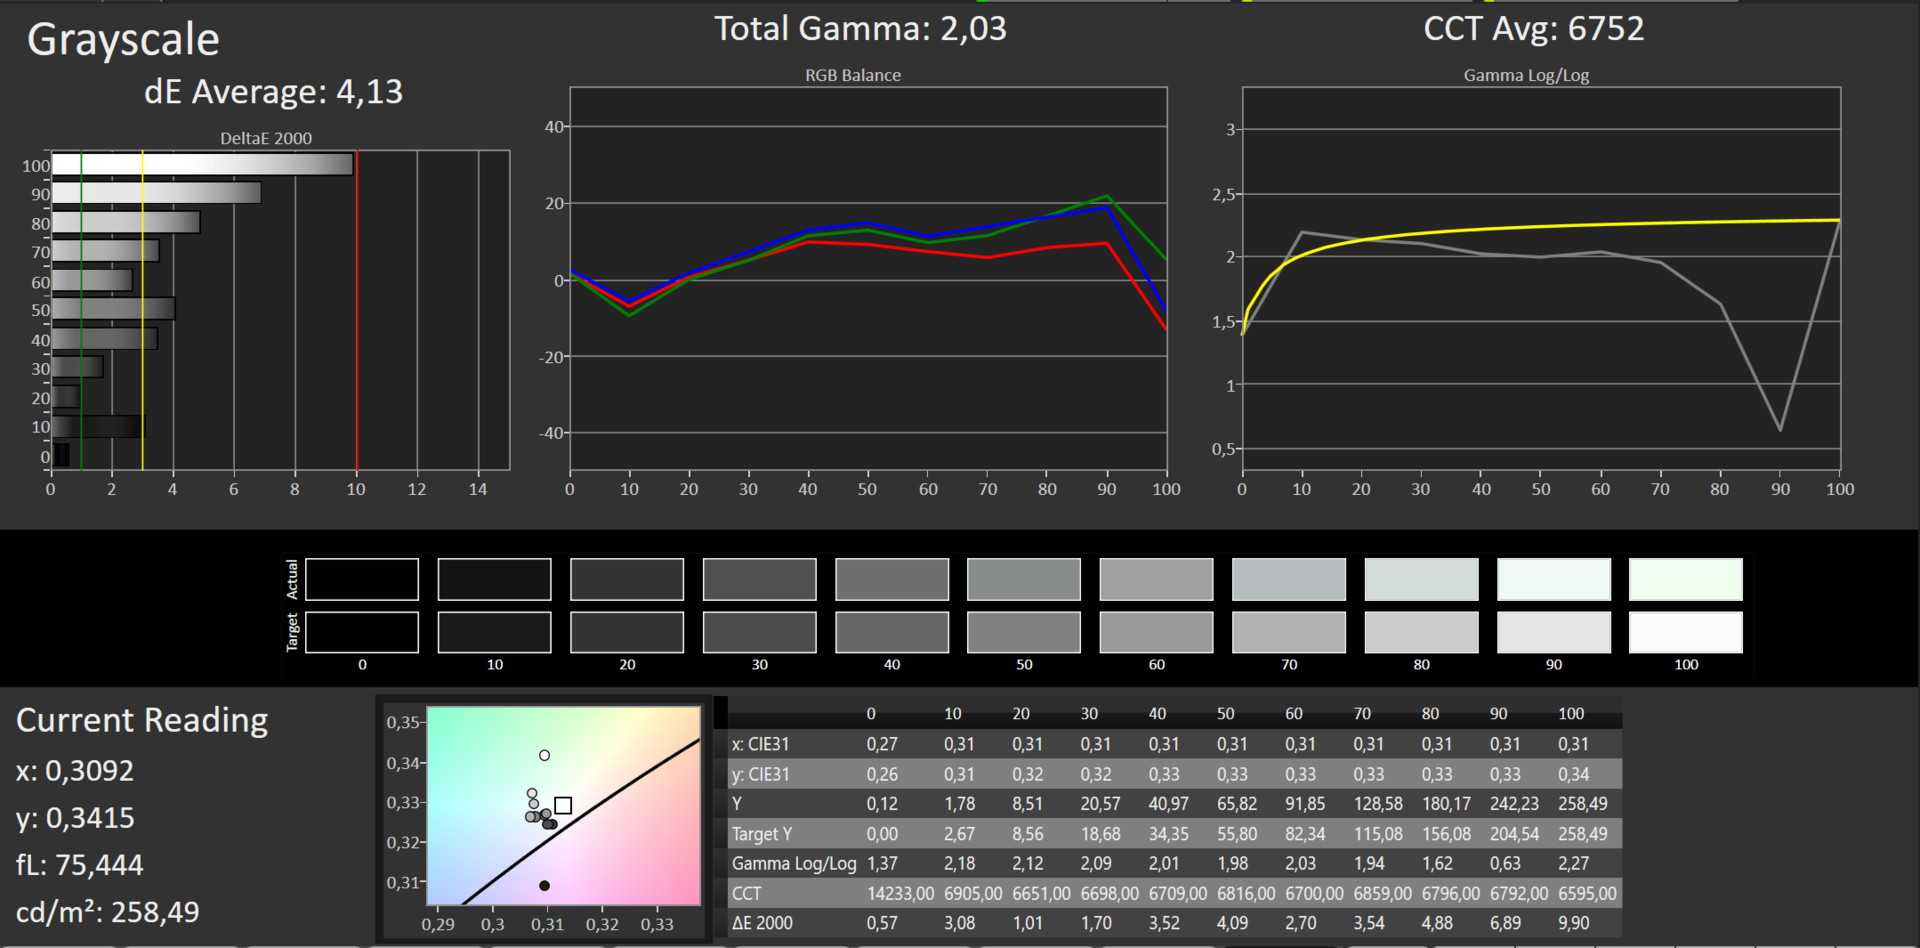
ΔE ColorChecker Calman: 3.18 | ∀{0.5-29.43 Ø4.71}
ΔE Greyscale Calman: 4.13 | ∀{0.09-98 Ø4.96}
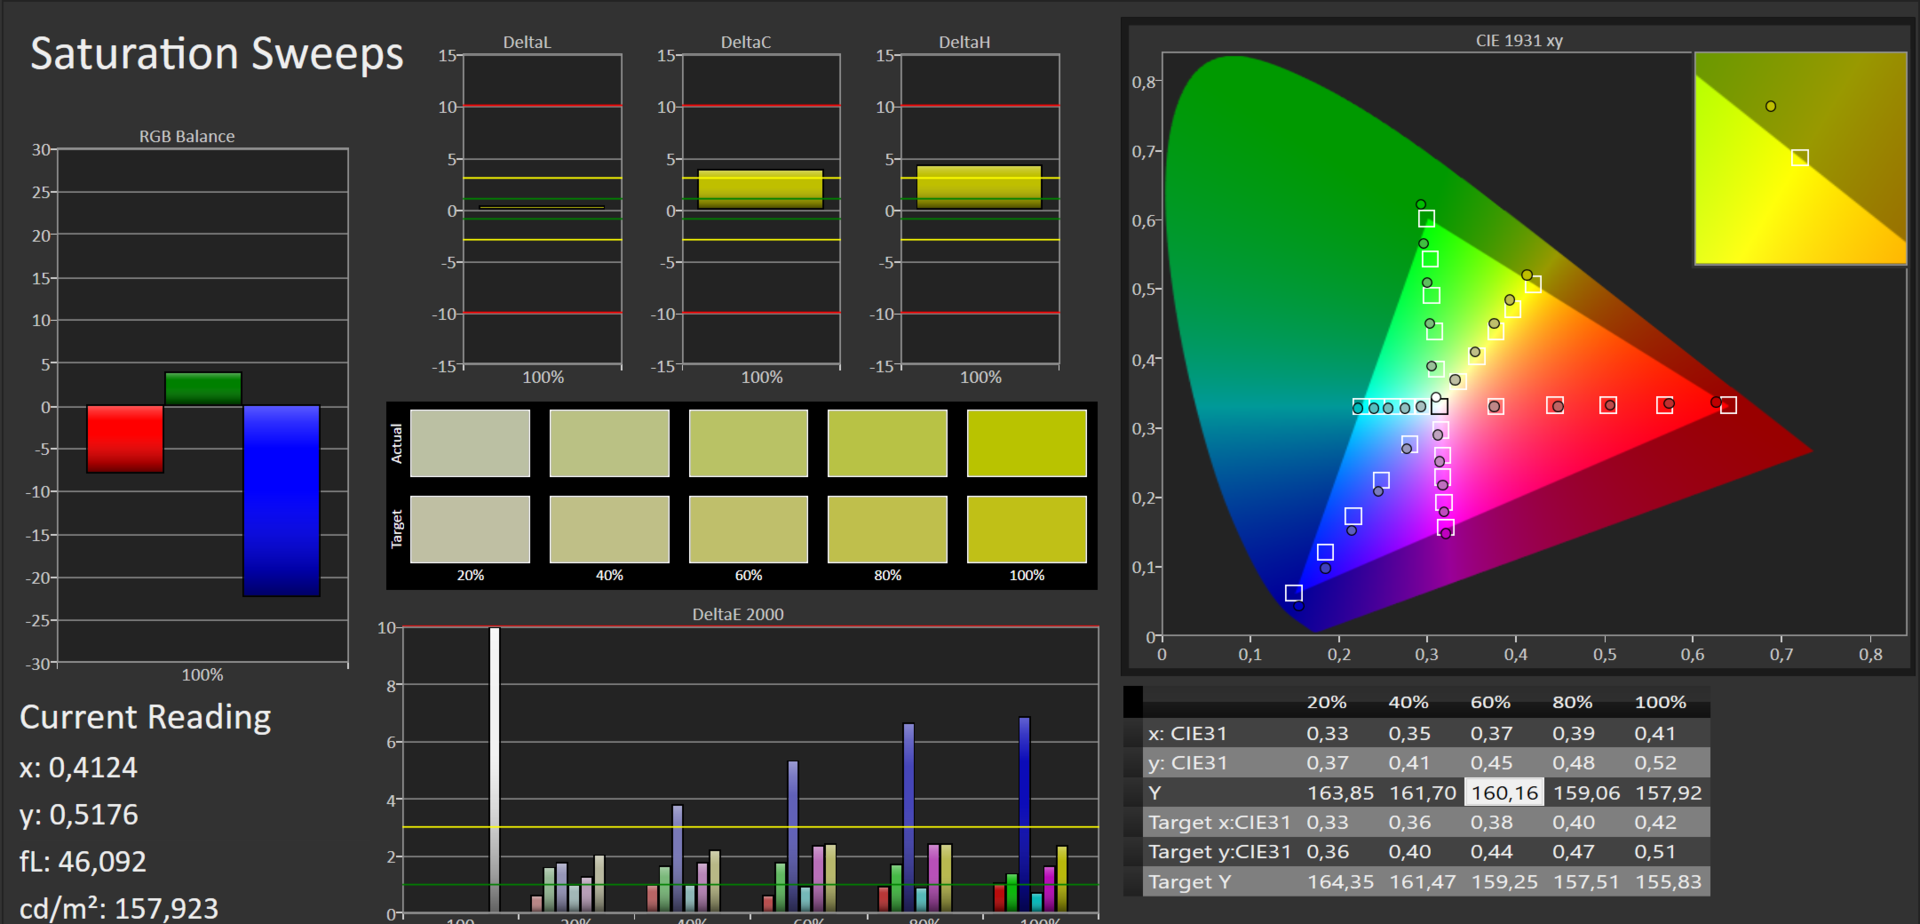
98% sRGB (Argyll 1.6.3 3D)
65% AdobeRGB 1998 (Argyll 1.6.3 3D)
70.7% AdobeRGB 1998 (Argyll 3D)
98% sRGB (Argyll 3D)
69.6% Display P3 (Argyll 3D)
Gamma: 2.03
CCT: 6752 K
Scintillement / MLI (Modulation de largeur d'impulsion)
| Scintillement / MLI (Modulation de largeur d'impulsion) décelé | 1000 Hz | ≤ 10 Niveau de luminosité | 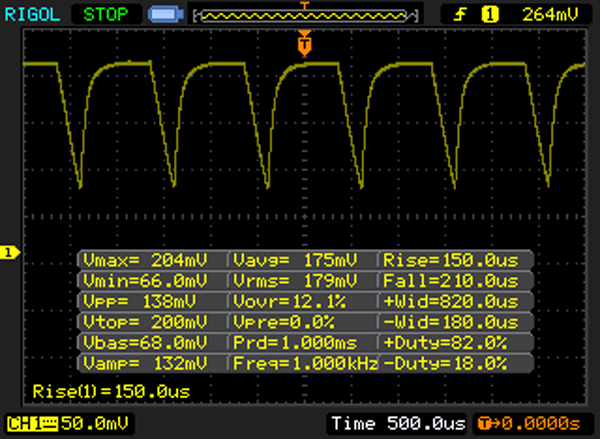 |
Le rétroéclairage de l'écran scintille à la fréquence de 1000 Hz (certainement du fait de l'utilisation d'une MDI - Modulation de largeur d'impulsion) à un niveau de luminosité inférieur ou égal à 10 % . Aucun scintillement ne devrait être perceptible au-dessus de cette valeur. La fréquence de rafraîchissement de 1000 Hz est élevée, la grande majorité des utilisateurs ne devrait pas percevoir de scintillements et être sujette à une fatigue oculaire accrue. En comparaison, 52 % des appareils testés n'emploient pas MDI pour assombrir leur écran. Nous avons relevé une moyenne à 7757 (minimum : 5 - maximum : 343500) Hz dans le cas où une MDI était active. | |||
Temps de réponse de l'écran
| ↔ Temps de réponse noir à blanc | ||
|---|---|---|
| 30 ms ... hausse ↗ et chute ↘ combinées | ↗ 8 ms hausse | 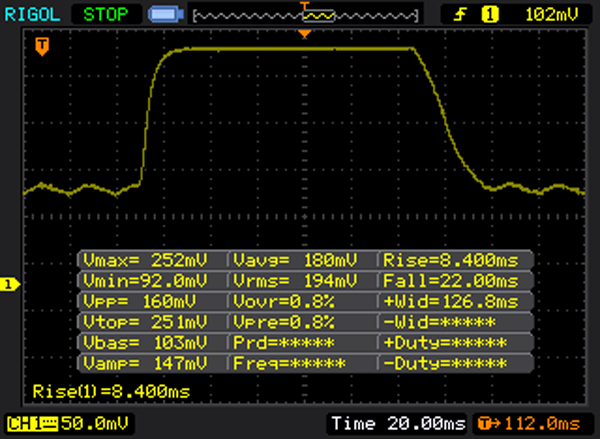 |
| ↘ 22 ms chute | ||
| L'écran souffre de latences très élevées, à éviter pour le jeu. En comparaison, tous les appareils testés affichent entre 0.1 (minimum) et 240 (maximum) ms. » 80 % des appareils testés affichent de meilleures performances. Cela signifie que les latences relevées sont moins bonnes que la moyenne (19.8 ms) de tous les appareils testés. | ||
| ↔ Temps de réponse gris 50% à gris 80% | ||
| 36 ms ... hausse ↗ et chute ↘ combinées | ↗ 12 ms hausse | 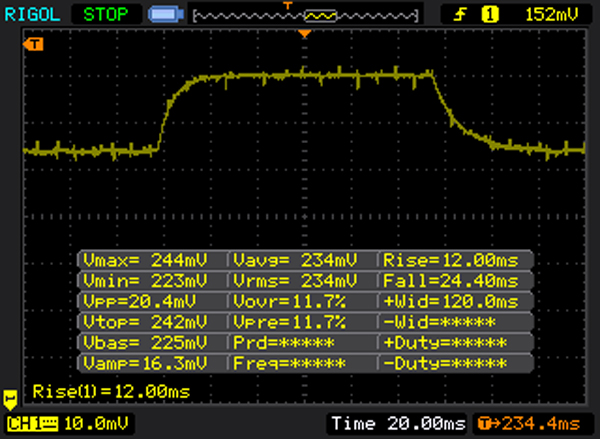 |
| ↘ 24 ms chute | ||
| L'écran souffre de latences très élevées, à éviter pour le jeu. En comparaison, tous les appareils testés affichent entre 0.165 (minimum) et 636 (maximum) ms. » 51 % des appareils testés affichent de meilleures performances. Cela signifie que les latences relevées sont moins bonnes que la moyenne (31 ms) de tous les appareils testés. | ||
| Acer Aspire R13 R7-372T-746N IPS, 2560x1440 | Acer Aspire R13 R7-372T IPS, 1920x1080 | Acer Aspire R13 R7-371T-779K IPS, 2560x1440 | HP Spectre x360 13-4104ng IPS, 2560x1440 | Lenovo Yoga 900-13ISK 80MK IPS, 3200x1800 | Asus Zenbook UX303UB-R4100T IPS, 1920x1080 | Asus Zenbook UX305CA-FB055T IPS, 3200x1800 | Dell XPS 13 2016 i7 256GB QHD IGZO , 3200x1800 | HP Envy 13-d000ng IPS, 3200x1800 | |
|---|---|---|---|---|---|---|---|---|---|
| Display | -8% | -5% | -9% | -5% | -14% | -7% | -8% | ||
| Display P3 Coverage (%) | 69.6 | 63.2 -9% | 66.8 -4% | 63.2 -9% | 66.9 -4% | 59.1 -15% | 63.6 -9% | 64 -8% | |
| sRGB Coverage (%) | 98 | 92.3 -6% | 92.8 -5% | 88.7 -9% | 92.3 -6% | 85.5 -13% | 93.6 -4% | 88.8 -9% | |
| AdobeRGB 1998 Coverage (%) | 70.7 | 64.3 -9% | 67.3 -5% | 64.9 -8% | 67.6 -4% | 61 -14% | 65.5 -7% | 65 -8% | |
| Response Times | -10% | 35% | 9% | -53% | 2% | -6% | 5% | ||
| Response Time Grey 50% / Grey 80% * (ms) | 36 ? | 48 ? -33% | 24 ? 33% | 38.8 ? -8% | 68 ? -89% | 38 ? -6% | 40 ? -11% | 37.6 ? -4% | |
| Response Time Black / White * (ms) | 30 ? | 26 ? 13% | 19 ? 37% | 22.4 ? 25% | 35 ? -17% | 27 ? 10% | 30 ? -0% | 26 ? 13% | |
| PWM Frequency (Hz) | 1000 ? | 1316 | 178 ? | 1429 ? | 4900 ? | 1316 ? | |||
| Screen | -17% | -17% | -23% | -49% | -19% | -32% | -15% | -38% | |
| Brightness middle (cd/m²) | 320 | 339 6% | 316 -1% | 324 1% | 319.8 0% | 385 20% | 390 22% | 285 -11% | 291 -9% |
| Brightness (cd/m²) | 308 | 331 7% | 305 -1% | 324 5% | 302 -2% | 394 28% | 352 14% | 281 -9% | 276 -10% |
| Brightness Distribution (%) | 91 | 90 -1% | 90 -1% | 90 -1% | 88 -3% | 89 -2% | 81 -11% | 90 -1% | 82 -10% |
| Black Level * (cd/m²) | 0.17 | 0.22 -29% | 0.23 -35% | 0.34 -100% | 0.835 -391% | 0.41 -141% | 0.69 -306% | 0.18 -6% | 0.63 -271% |
| Contrast (:1) | 1882 | 1541 -18% | 1374 -27% | 953 -49% | 383 -80% | 939 -50% | 565 -70% | 1583 -16% | 462 -75% |
| Colorchecker dE 2000 * | 3.18 | 5.72 -80% | 4.21 -32% | 4.36 -37% | 2.68 16% | 3.84 -21% | 3.04 4% | 4.89 -54% | 2.76 13% |
| Colorchecker dE 2000 max. * | 9.91 | 10.45 -5% | 7.01 29% | ||||||
| Greyscale dE 2000 * | 4.13 | 5.74 -39% | 5.16 -25% | 4.62 -12% | 2.35 43% | 3.79 8% | 2.88 30% | 5.16 -25% | 2.61 37% |
| Gamma | 2.03 108% | 2.18 101% | 2.58 85% | 2.18 101% | 2.09 105% | 2.23 99% | 2.43 91% | 2.15 102% | 2.31 95% |
| CCT | 6752 96% | 7393 88% | 6934 94% | 6857 95% | 6975 93% | 6499 100% | 6848 95% | 7106 91% | 6731 97% |
| Color Space (Percent of AdobeRGB 1998) (%) | 65 | 59 -9% | 60 -8% | 57 -12% | 60 -8% | 55 -15% | 59 -9% | 57.5 -12% | |
| Color Space (Percent of sRGB) (%) | 98 | 92 -6% | 93 -5% | 88 -10% | 92 -6% | 85 -13% | 93 -5% | 88.7 -9% | |
| Moyenne finale (programmes/paramètres) | -12% /
-15% | -17% /
-17% | 2% /
-11% | -16% /
-32% | -26% /
-21% | -15% /
-24% | -9% /
-12% | -14% /
-26% |
* ... Moindre est la valeur, meilleures sont les performances

| Cinebench R15 | |
| CPU Multi 64Bit (Classer selon les valeurs) | |
| Acer Aspire R13 R7-372T-746N | |
| Acer Aspire R13 R7-372T | |
| Acer Aspire R7-371T-52EL | |
| Acer Aspire R13 R7-371T-779K | |
| HP Spectre x360 13-4104ng | |
| Lenovo Yoga 900-13ISK 80MK | |
| Asus Zenbook UX303UB-R4100T | |
| Asus Zenbook UX305CA-FB055T | |
| Dell XPS 13 2016 i7 256GB QHD | |
| CPU Single 64Bit (Classer selon les valeurs) | |
| Acer Aspire R13 R7-372T-746N | |
| Acer Aspire R13 R7-372T | |
| Acer Aspire R7-371T-52EL | |
| Acer Aspire R13 R7-371T-779K | |
| HP Spectre x360 13-4104ng | |
| Lenovo Yoga 900-13ISK 80MK | |
| Asus Zenbook UX303UB-R4100T | |
| Asus Zenbook UX305CA-FB055T | |
| Dell XPS 13 2016 i7 256GB QHD | |
| Cinebench R11.5 | |
| CPU Multi 64Bit (Classer selon les valeurs) | |
| Acer Aspire R13 R7-372T-746N | |
| Acer Aspire R13 R7-372T | |
| Acer Aspire R7-371T-52EL | |
| Acer Aspire R13 R7-371T-779K | |
| HP Spectre x360 13-4104ng | |
| Lenovo Yoga 900-13ISK 80MK | |
| Asus Zenbook UX303UB-R4100T | |
| Asus Zenbook UX305CA-FB055T | |
| Dell XPS 13 2016 i7 256GB QHD | |
| CPU Single 64Bit (Classer selon les valeurs) | |
| Acer Aspire R13 R7-372T-746N | |
| Acer Aspire R13 R7-372T | |
| Acer Aspire R7-371T-52EL | |
| Acer Aspire R13 R7-371T-779K | |
| HP Spectre x360 13-4104ng | |
| Lenovo Yoga 900-13ISK 80MK | |
| Asus Zenbook UX303UB-R4100T | |
| Asus Zenbook UX305CA-FB055T | |
| Dell XPS 13 2016 i7 256GB QHD | |
| Cinebench R10 | |
| Rendering Multiple CPUs 32Bit (Classer selon les valeurs) | |
| Acer Aspire R13 R7-372T-746N | |
| Acer Aspire R13 R7-372T | |
| Acer Aspire R7-371T-52EL | |
| HP Spectre x360 13-4104ng | |
| Lenovo Yoga 900-13ISK 80MK | |
| Asus Zenbook UX303UB-R4100T | |
| Asus Zenbook UX305CA-FB055T | |
| Dell XPS 13 2016 i7 256GB QHD | |
| Rendering Single 32Bit (Classer selon les valeurs) | |
| Acer Aspire R13 R7-372T-746N | |
| Acer Aspire R13 R7-372T | |
| Acer Aspire R7-371T-52EL | |
| HP Spectre x360 13-4104ng | |
| Lenovo Yoga 900-13ISK 80MK | |
| Asus Zenbook UX303UB-R4100T | |
| Asus Zenbook UX305CA-FB055T | |
| Dell XPS 13 2016 i7 256GB QHD | |
| Geekbench 3 | |
| 32 Bit Single-Core Score (Classer selon les valeurs) | |
| Acer Aspire R13 R7-372T-746N | |
| Acer Aspire R13 R7-372T | |
| Acer Aspire R7-371T-52EL | |
| HP Spectre x360 13-4104ng | |
| Asus Zenbook UX303UB-R4100T | |
| Asus Zenbook UX305CA-FB055T | |
| 32 Bit Multi-Core Score (Classer selon les valeurs) | |
| Acer Aspire R13 R7-372T-746N | |
| Acer Aspire R13 R7-372T | |
| Acer Aspire R7-371T-52EL | |
| HP Spectre x360 13-4104ng | |
| Asus Zenbook UX303UB-R4100T | |
| Asus Zenbook UX305CA-FB055T | |
| Sunspider - 1.0 Total Score (Classer selon les valeurs) | |
| Acer Aspire R13 R7-372T-746N | |
| Acer Aspire R13 R7-372T | |
| Acer Aspire R7-371T-52EL | |
| Acer Aspire R13 R7-371T-779K | |
| HP Spectre x360 13-4104ng | |
| Asus Zenbook UX303UB-R4100T | |
| Asus Zenbook UX305CA-FB055T | |
| Dell XPS 13 2016 i7 256GB QHD | |
| JetStream 1.1 - 1.1 Total (Classer selon les valeurs) | |
| Acer Aspire R13 R7-372T-746N | |
| Acer Aspire R13 R7-372T | |
| Asus Zenbook UX303UB-R4100T | |
| Asus Zenbook UX305CA-FB055T | |
| Mozilla Kraken 1.1 - Total (Classer selon les valeurs) | |
| Acer Aspire R13 R7-372T-746N | |
| Acer Aspire R13 R7-372T | |
| Acer Aspire R7-371T-52EL | |
| Acer Aspire R13 R7-371T-779K | |
| HP Spectre x360 13-4104ng | |
| Asus Zenbook UX303UB-R4100T | |
| Asus Zenbook UX305CA-FB055T | |
| Dell XPS 13 2016 i7 256GB QHD | |
| Octane V2 - Total Score (Classer selon les valeurs) | |
| Acer Aspire R13 R7-372T-746N | |
| Acer Aspire R13 R7-372T | |
| Acer Aspire R7-371T-52EL | |
| Acer Aspire R13 R7-371T-779K | |
| HP Spectre x360 13-4104ng | |
| Asus Zenbook UX303UB-R4100T | |
| Asus Zenbook UX305CA-FB055T | |
| Dell XPS 13 2016 i7 256GB QHD | |
| Peacekeeper - --- (Classer selon les valeurs) | |
| Acer Aspire R13 R7-372T-746N | |
| Acer Aspire R13 R7-372T | |
| Acer Aspire R7-371T-52EL | |
| Asus Zenbook UX303UB-R4100T | |
| Asus Zenbook UX305CA-FB055T | |
* ... Moindre est la valeur, meilleures sont les performances
| PCMark 7 Score | 5415 points | |
| PCMark 8 Home Score Accelerated v2 | 3161 points | |
| PCMark 8 Creative Score Accelerated v2 | 3987 points | |
| PCMark 8 Work Score Accelerated v2 | 3971 points | |
Aide | ||
| PCMark 8 - Home Score Accelerated v2 (Classer selon les valeurs) | |
| Acer Aspire R13 R7-372T-746N | |
| Acer Aspire R13 R7-372T | |
| Acer Aspire R7-371T-52EL | |
| Acer Aspire R13 R7-371T-779K | |
| Lenovo Yoga 900-13ISK 80MK | |
| Asus Zenbook UX303UB-R4100T | |
| Asus Zenbook UX305CA-FB055T | |
| Dell XPS 13 2016 i7 256GB QHD | |
| PCMark 7 - Score (Classer selon les valeurs) | |
| Acer Aspire R13 R7-372T-746N | |
| Acer Aspire R13 R7-372T | |
| Acer Aspire R13 R7-371T-779K | |
| HP Spectre x360 13-4104ng | |
| HP Spectre x360 13-4104ng | |
| Lenovo Yoga 900-13ISK 80MK | |
| Asus Zenbook UX303UB-R4100T | |
| Asus Zenbook UX305CA-FB055T | |
| Dell XPS 13 2016 i7 256GB QHD | |

| 3DMark 06 Standard Score | 9829 points | |
| 3DMark 11 Performance | 1596 points | |
| 3DMark Ice Storm Standard Score | 57060 points | |
| 3DMark Cloud Gate Standard Score | 6139 points | |
| 3DMark Fire Strike Score | 847 points | |
Aide | ||
| 3DMark 11 - 1280x720 Performance (Classer selon les valeurs) | |
| Acer Aspire R13 R7-372T-746N | |
| Acer Aspire R13 R7-372T | |
| Acer Aspire R7-371T-52EL | |
| Acer Aspire R13 R7-371T-779K | |
| HP Spectre x360 13-4104ng | |
| HP Spectre x360 13-4104ng | |
| Lenovo Yoga 900-13ISK 80MK | |
| Asus Zenbook UX303UB-R4100T | |
| Asus Zenbook UX305CA-FB055T | |
| Dell XPS 13 2016 i7 256GB QHD | |
| 3DMark 06 - 1280x1024 Standard Score AA:0x AF:0x (Classer selon les valeurs) | |
| Acer Aspire R13 R7-372T-746N | |
| Acer Aspire R13 R7-372T | |
| HP Spectre x360 13-4104ng | |
| Asus Zenbook UX303UB-R4100T | |
| Asus Zenbook UX305CA-FB055T | |
| Bas | Moyen | Élevé | Ultra | |
|---|---|---|---|---|
| Tomb Raider (2013) | 79.5 | 41 | 25.1 | 11.4 |
| BioShock Infinite (2013) | 57.3 | 29.6 | 24.7 | 7.2 |
| Battlefield 4 (2013) | 45.7 | 32.4 | 21.1 | 6.2 |
| Far Cry Primal (2016) | 15 | 7 | ||
| Hitman 2016 (2016) | 20.4 | 14.5 |
Degré de la nuisance sonore
| Au repos |
| 31.3 / 31.3 / 31.8 dB(A) |
| Fortement sollicité |
| 39.2 / 39.1 dB(A) |
 | ||
30 dB silencieux 40 dB(A) audible 50 dB(A) bruyant |
||
min: | ||
| Acer Aspire R13 R7-372T-746N 6500U, HD Graphics 520 | Acer Aspire R13 R7-372T 6200U, HD Graphics 520 | Acer Aspire R13 R7-371T-779K 4510U, HD Graphics 4400 | HP Spectre x360 13-4104ng 6200U, HD Graphics 520 | Lenovo Yoga 900-13ISK 80MK 6500U, HD Graphics 520 | Asus Zenbook UX303UB-R4100T 6500U, GeForce 940M | Asus Zenbook UX305CA-FB055T 6Y75, HD Graphics 515 | Dell XPS 13 2016 i7 256GB QHD 6500U, HD Graphics 520 | HP Envy 13-d000ng 6200U, HD Graphics 520 | |
|---|---|---|---|---|---|---|---|---|---|
| Noise | -1% | 2% | 3% | 7% | 2% | 7% | 2% | 2% | |
| arrêt / environnement * (dB) | 31.3 | 31.3 -0% | |||||||
| Idle Minimum * (dB) | 31.3 | 31.5 -1% | 30.9 1% | 29.6 5% | 29.7 5% | 31.5 -1% | 31.3 -0% | 31.8 -2% | 31.5 -1% |
| Idle Average * (dB) | 31.3 | 31.5 -1% | 30.9 1% | 29.6 5% | 29.8 5% | 31.5 -1% | 31.3 -0% | 31.8 -2% | 31.5 -1% |
| Idle Maximum * (dB) | 31.8 | 31.7 -0% | 32 -1% | 34.6 -9% | 30 6% | 31.5 1% | 31.3 2% | 34.8 -9% | 31.5 1% |
| Load Average * (dB) | 39.2 | 39.7 -1% | 37.6 4% | 34.7 11% | 32 18% | 35.9 8% | 31.3 20% | 34.8 11% | 35.6 9% |
| Load Maximum * (dB) | 39.1 | 39.4 -1% | 37.6 4% | 37.9 3% | 38.5 2% | 38.2 2% | 31.3 20% | 34.8 11% | 38.8 1% |
* ... Moindre est la valeur, meilleures sont les performances
(±) La température maximale du côté supérieur est de 40 °C / 104 F, par rapport à la moyenne de 35.4 °C / 96 F, allant de 19.6 à 60 °C pour la classe Convertible.
(+) Le fond chauffe jusqu'à un maximum de 37.6 °C / 100 F, contre une moyenne de 36.9 °C / 98 F
(+) En utilisation inactive, la température moyenne du côté supérieur est de 23.7 °C / 75 F, par rapport à la moyenne du dispositif de 30.3 °C / 87 F.
(+) Les repose-poignets et le pavé tactile sont plus froids que la température de la peau avec un maximum de 24.9 °C / 76.8 F et sont donc froids au toucher.
(+) La température moyenne de la zone de l'appui-paume de dispositifs similaires était de 28 °C / 82.4 F (+3.1 °C / #5.6 F).
| Acer Aspire R13 R7-372T-746N 6500U, HD Graphics 520 | Acer Aspire R13 R7-372T 6200U, HD Graphics 520 | Acer Aspire R13 R7-371T-779K 4510U, HD Graphics 4400 | HP Spectre x360 13-4104ng 6200U, HD Graphics 520 | Lenovo Yoga 900-13ISK 80MK 6500U, HD Graphics 520 | Asus Zenbook UX303UB-R4100T 6500U, GeForce 940M | Asus Zenbook UX305CA-FB055T 6Y75, HD Graphics 515 | Dell XPS 13 2016 i7 256GB QHD 6500U, HD Graphics 520 | HP Envy 13-d000ng 6200U, HD Graphics 520 | |
|---|---|---|---|---|---|---|---|---|---|
| Heat | -9% | -22% | -5% | 1% | -19% | -1% | -40% | -30% | |
| Maximum Upper Side * (°C) | 40 | 45.2 -13% | 46 -15% | 39.6 1% | 37.4 6% | 56.6 -42% | 39.1 2% | 57 -43% | 49.8 -24% |
| Maximum Bottom * (°C) | 37.6 | 41 -9% | 51.8 -38% | 39.7 -6% | 36.4 3% | 54.3 -44% | 38.7 -3% | 56 -49% | 50.9 -35% |
| Idle Upper Side * (°C) | 25.1 | 26.9 -7% | 28.5 -14% | 25 -0% | 26.6 -6% | 24 4% | 26 -4% | 34.1 -36% | 33.3 -33% |
| Idle Bottom * (°C) | 26 | 27.6 -6% | 31.1 -20% | 29.8 -15% | 25.6 2% | 24.2 7% | 25.7 1% | 34.3 -32% | 32.7 -26% |
* ... Moindre est la valeur, meilleures sont les performances
| Éteint/en veille | |
| Au repos | |
| Fortement sollicité |
|
Légende:
min: | |
| Acer Aspire R13 R7-372T-746N 6500U, HD Graphics 520 | Acer Aspire R13 R7-372T 6200U, HD Graphics 520 | Acer Aspire R13 R7-371T-779K 4510U, HD Graphics 4400 | HP Spectre x360 13-4104ng 6200U, HD Graphics 520 | Asus Zenbook UX303UB-R4100T 6500U, GeForce 940M | Asus Zenbook UX305CA-FB055T 6Y75, HD Graphics 515 | Dell XPS 13 2016 i7 256GB QHD 6500U, HD Graphics 520 | HP Envy 13-d000ng 6200U, HD Graphics 520 | |
|---|---|---|---|---|---|---|---|---|
| Power Consumption | 13% | 21% | 24% | 3% | 30% | 1% | 0% | |
| Idle Minimum * (Watt) | 6.2 | 5.1 18% | 4.8 23% | 3.9 37% | 3.2 48% | 4.2 32% | 6.8 -10% | 5.4 13% |
| Idle Average * (Watt) | 8 | 7.2 10% | 8.2 -2% | 7.4 7% | 7.6 5% | 8.4 -5% | 10 -25% | 10.1 -26% |
| Idle Maximum * (Watt) | 11.6 | 9 22% | 8.3 28% | 9.2 21% | 8 31% | 8.9 23% | 10.5 9% | 11.1 4% |
| Load Average * (Watt) | 40 | 34.2 14% | 27 32% | 28.1 30% | 47 -18% | 15.9 60% | 30.2 24% | 32.1 20% |
| Load Maximum * (Watt) | 36.6 | 37 -1% | 28.3 23% | 27.6 25% | 55 -50% | 22.5 39% | 33.6 8% | 40.1 -10% |
* ... Moindre est la valeur, meilleures sont les performances
| Acer Aspire R13 R7-372T-746N 49 Wh | Acer Aspire R13 R7-372T 50 Wh | Acer Aspire R13 R7-371T-779K 61 Wh | HP Spectre x360 13-4104ng 56 Wh | Lenovo Yoga 900-13ISK 80MK 66 Wh | Asus Zenbook UX303UB-R4100T 50 Wh | Asus Zenbook UX305CA-FB055T 45 Wh | Dell XPS 13 2016 i7 256GB QHD 56 Wh | HP Envy 13-d000ng 45 Wh | |
|---|---|---|---|---|---|---|---|---|---|
| Autonomie de la batterie | 14% | 17% | 30% | 27% | 26% | 44% | 17% | -6% | |
| Reader / Idle (h) | 11.2 | 12.3 10% | 8.7 -22% | 14.1 26% | 16.6 48% | 16.9 51% | 13.1 17% | 8.6 -23% | |
| H.264 (h) | 6.6 | 6.7 2% | 6.2 -6% | 6.9 5% | 7 6% | 5.7 -14% | |||
| WiFi v1.3 (h) | 6.4 | 7.4 16% | 8.3 30% | 6.7 5% | 6.8 6% | 6.7 5% | 7.2 13% | 5.4 -16% | |
| Load (h) | 1.4 | 1.8 29% | 2.5 79% | 2.1 50% | 2 43% | 3 114% | 1.7 21% | 1.8 29% | |
| WiFi (h) | 6.6 |
Points positifs
Points négatifs
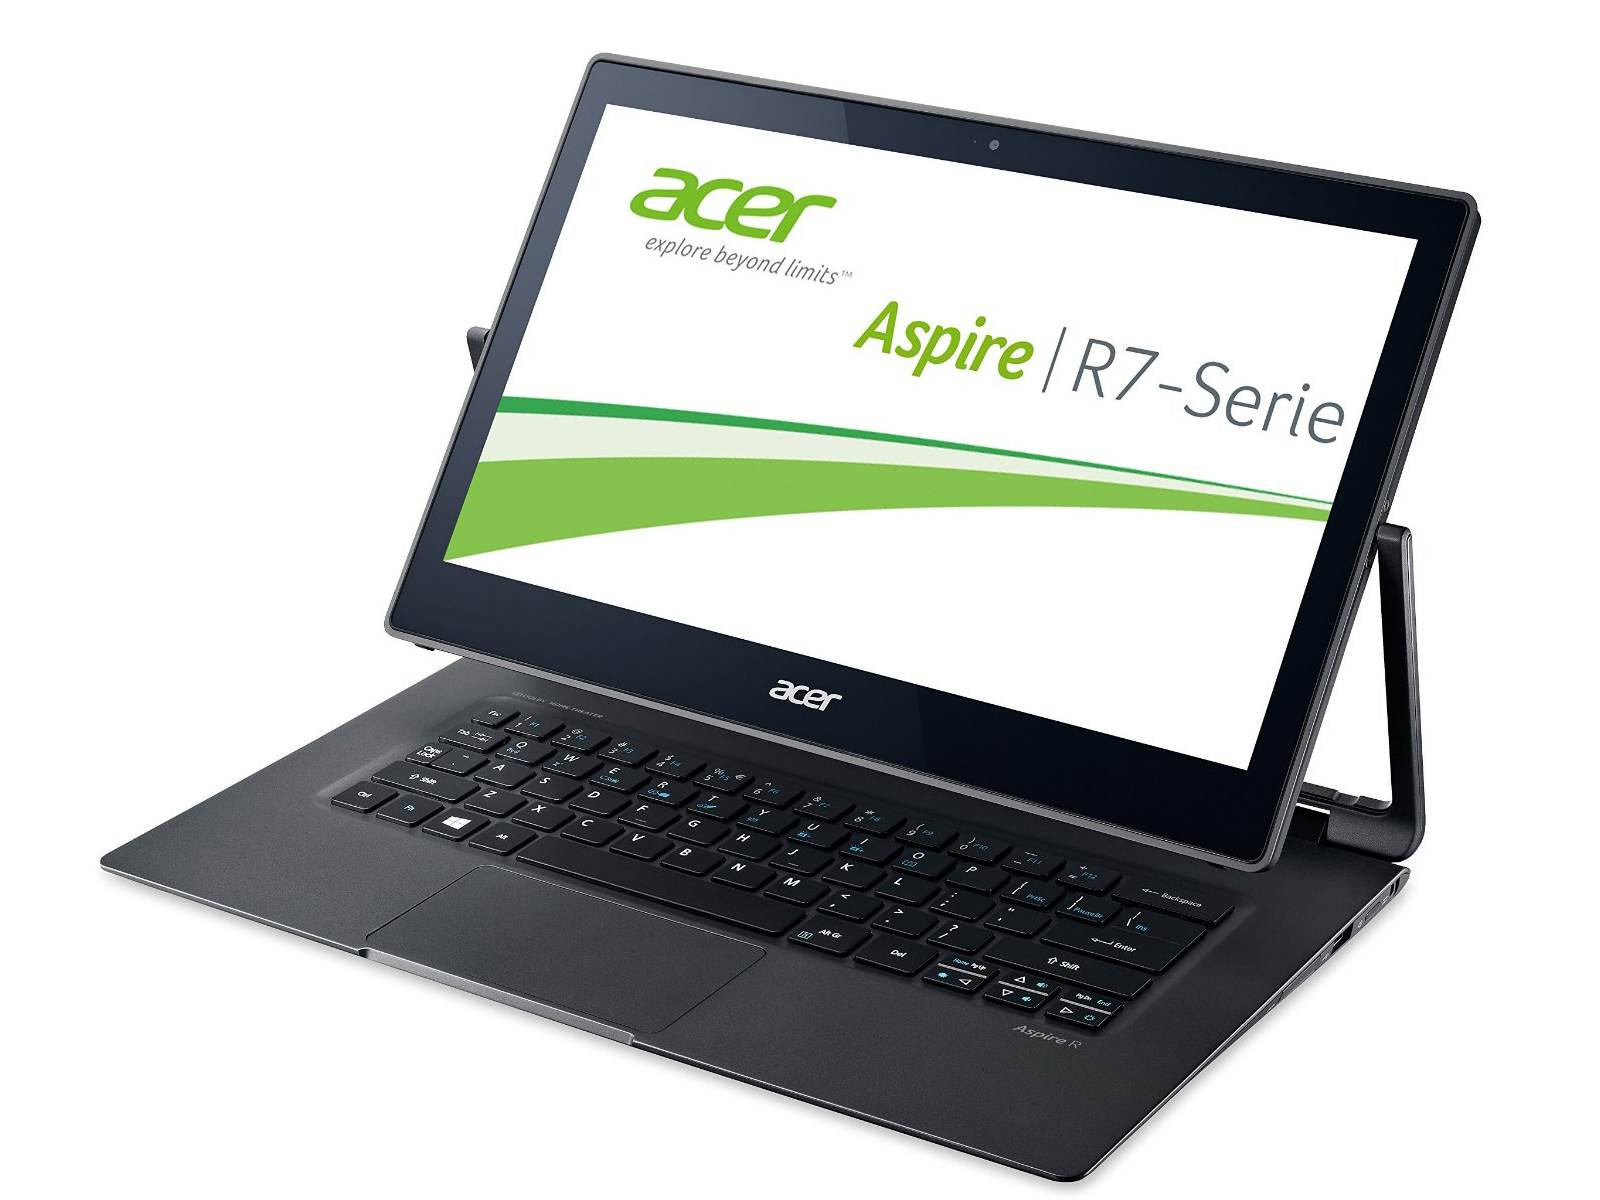
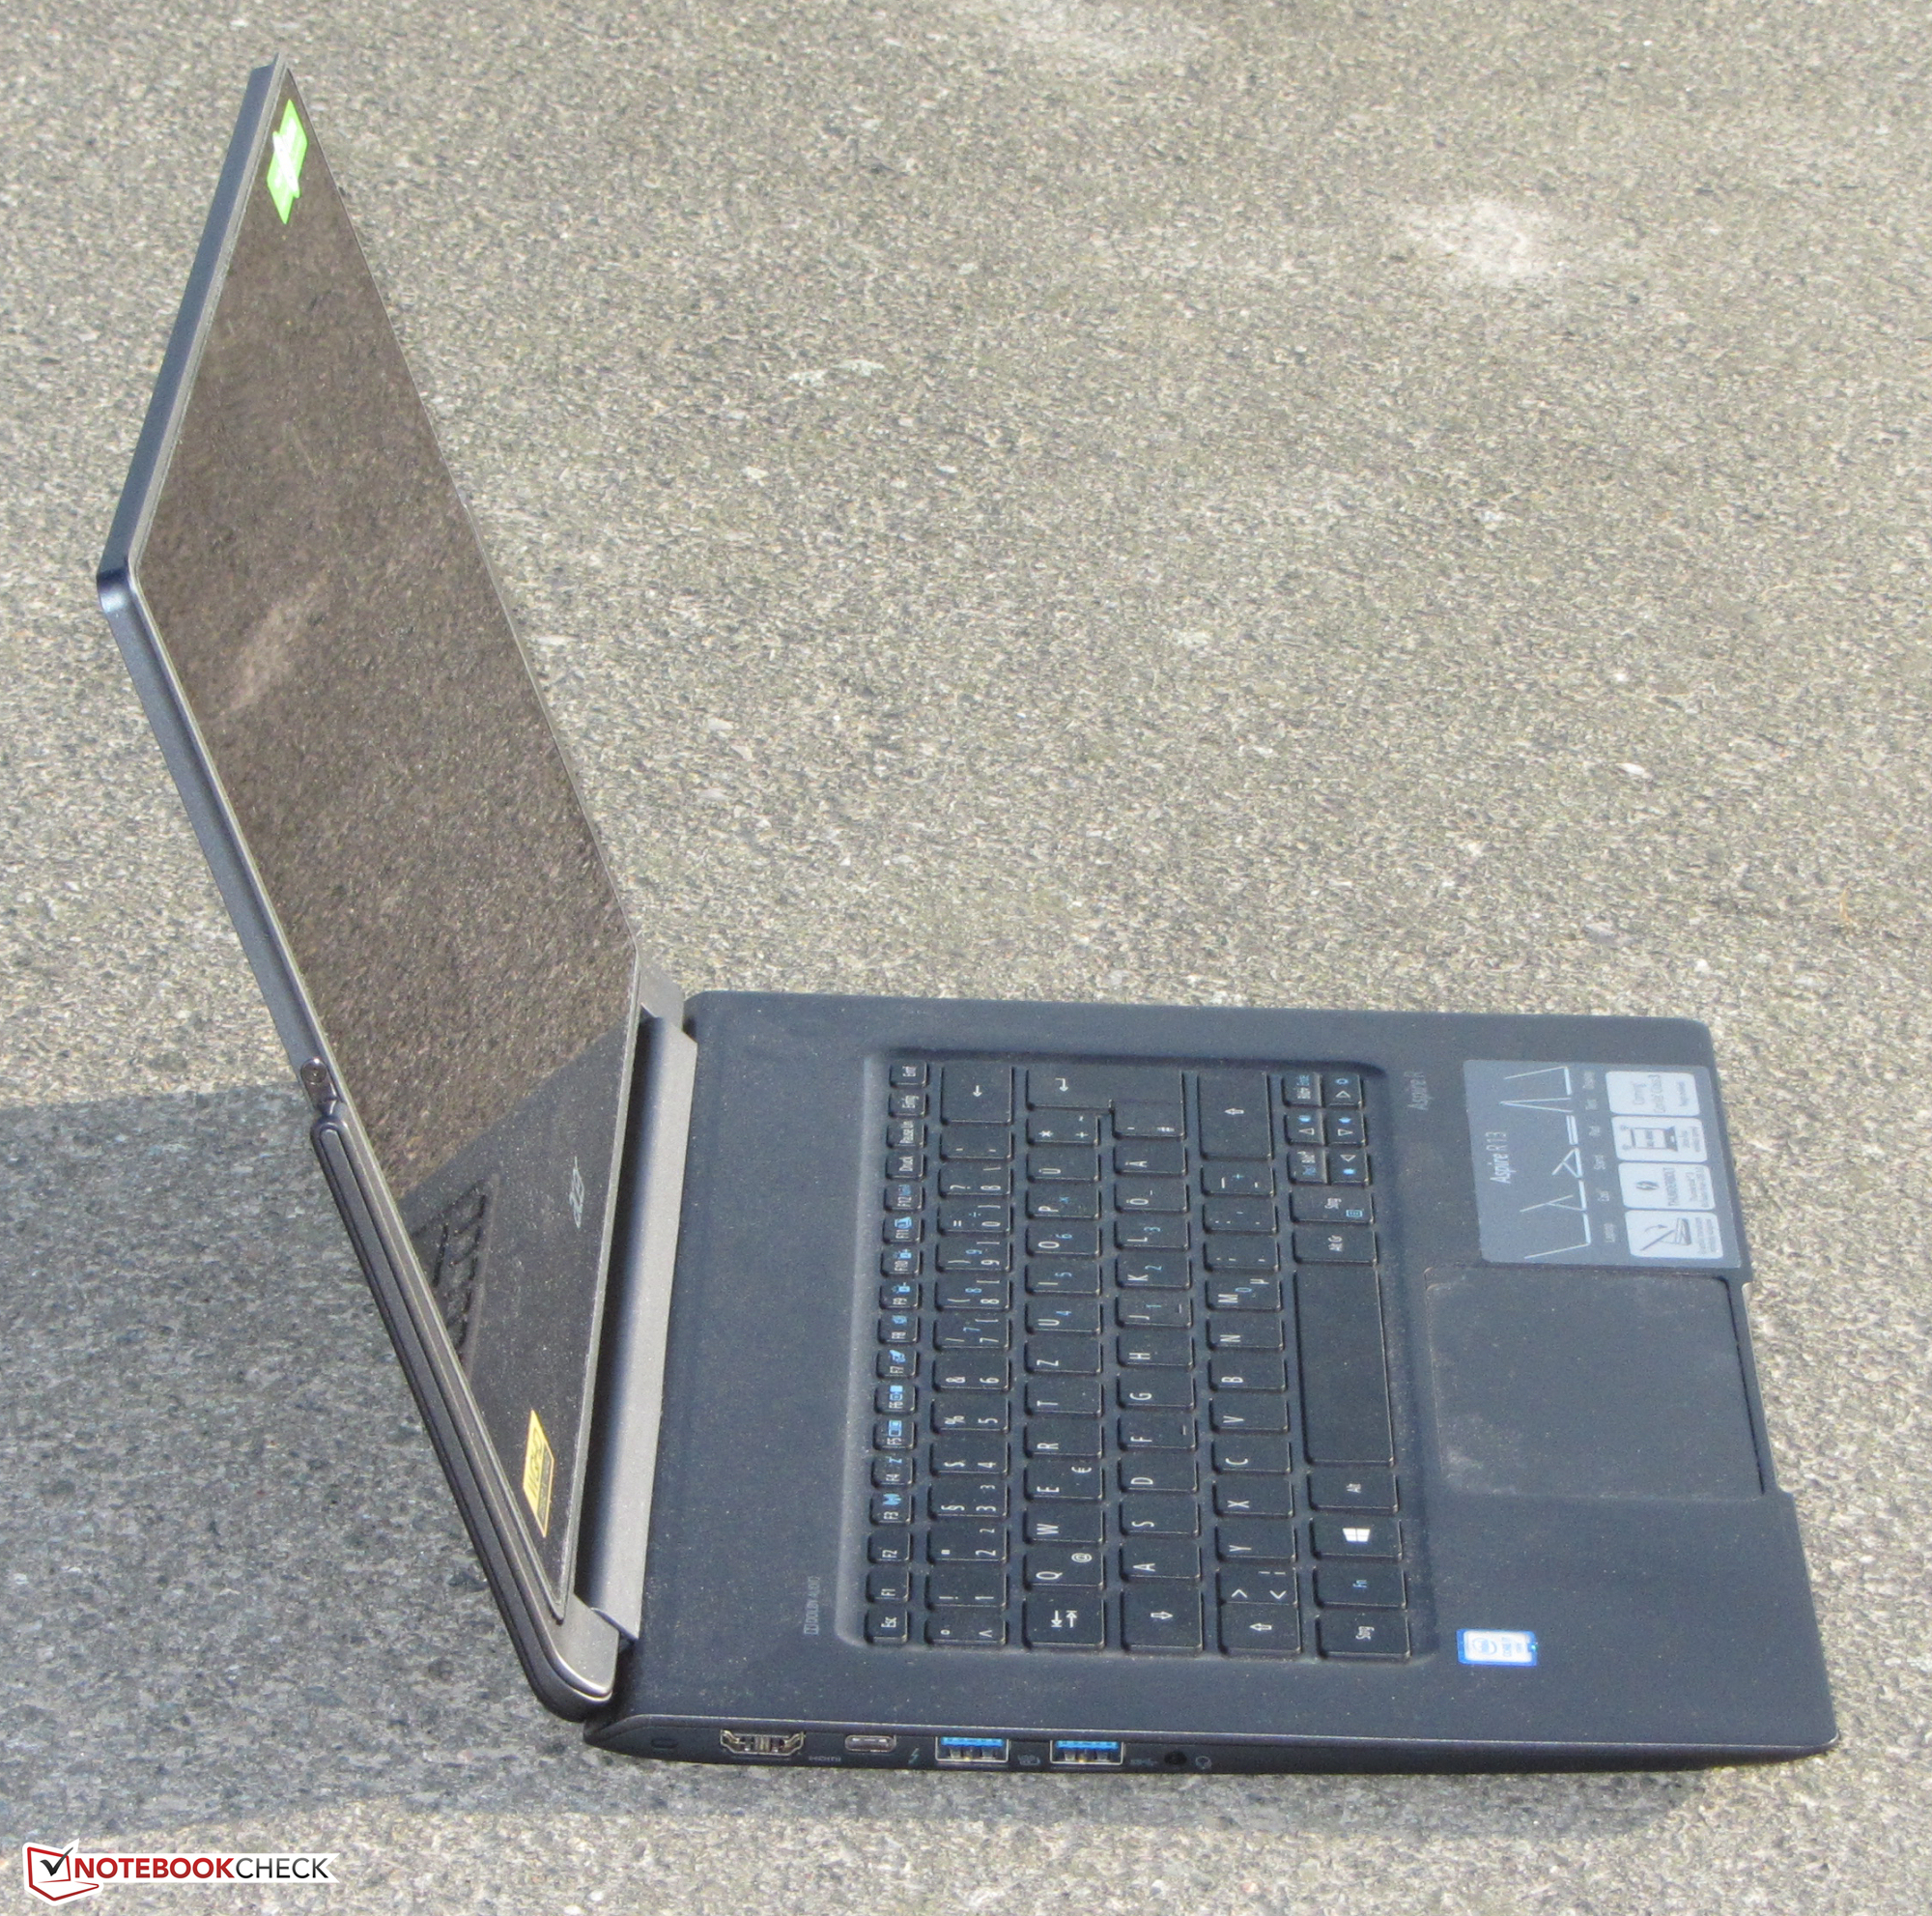
Ce convertible d'Acer est assez puissant pour les diverses tâches quotidiennes habituelles. Le GPU intégré - associé à la mémoire RAM double canal - permet de s'adonner à quelques jeux légers. Le PC reste généralement silencieux et s'échauffe peu. Grâce à la présence d'un SSD, l'appareil est très réactif. En plus, les périphériques d'entrée sont excellents, l'autonomie correcte, et on a également un port supportant la norme Thunderbolt 3. L'atout le plus important est l'écran de résolution WQHD disposant d'un très bon contraste. Grâce à la technologie IPS, les angles de vision sont très bons, bien que les couleurs deviennent un peu pâles pour des angles de vision faibles.
L'Aspire avec écran WQHD est impressionnant, et possède peu de défauts. Les utilisateurs voulant le plus de mobilité possible devraient choisir plutôt la version avec écran Full-HD, du fait de l'autonomie meilleure dans ce cas.
Pour plus de détails, la version complète de ce test (en anglais) est disponible ici.
Acer Aspire R13 R7-372T-746N
- 04/18/2016 v5.1 (old)
Sascha Mölck
Price comparison
