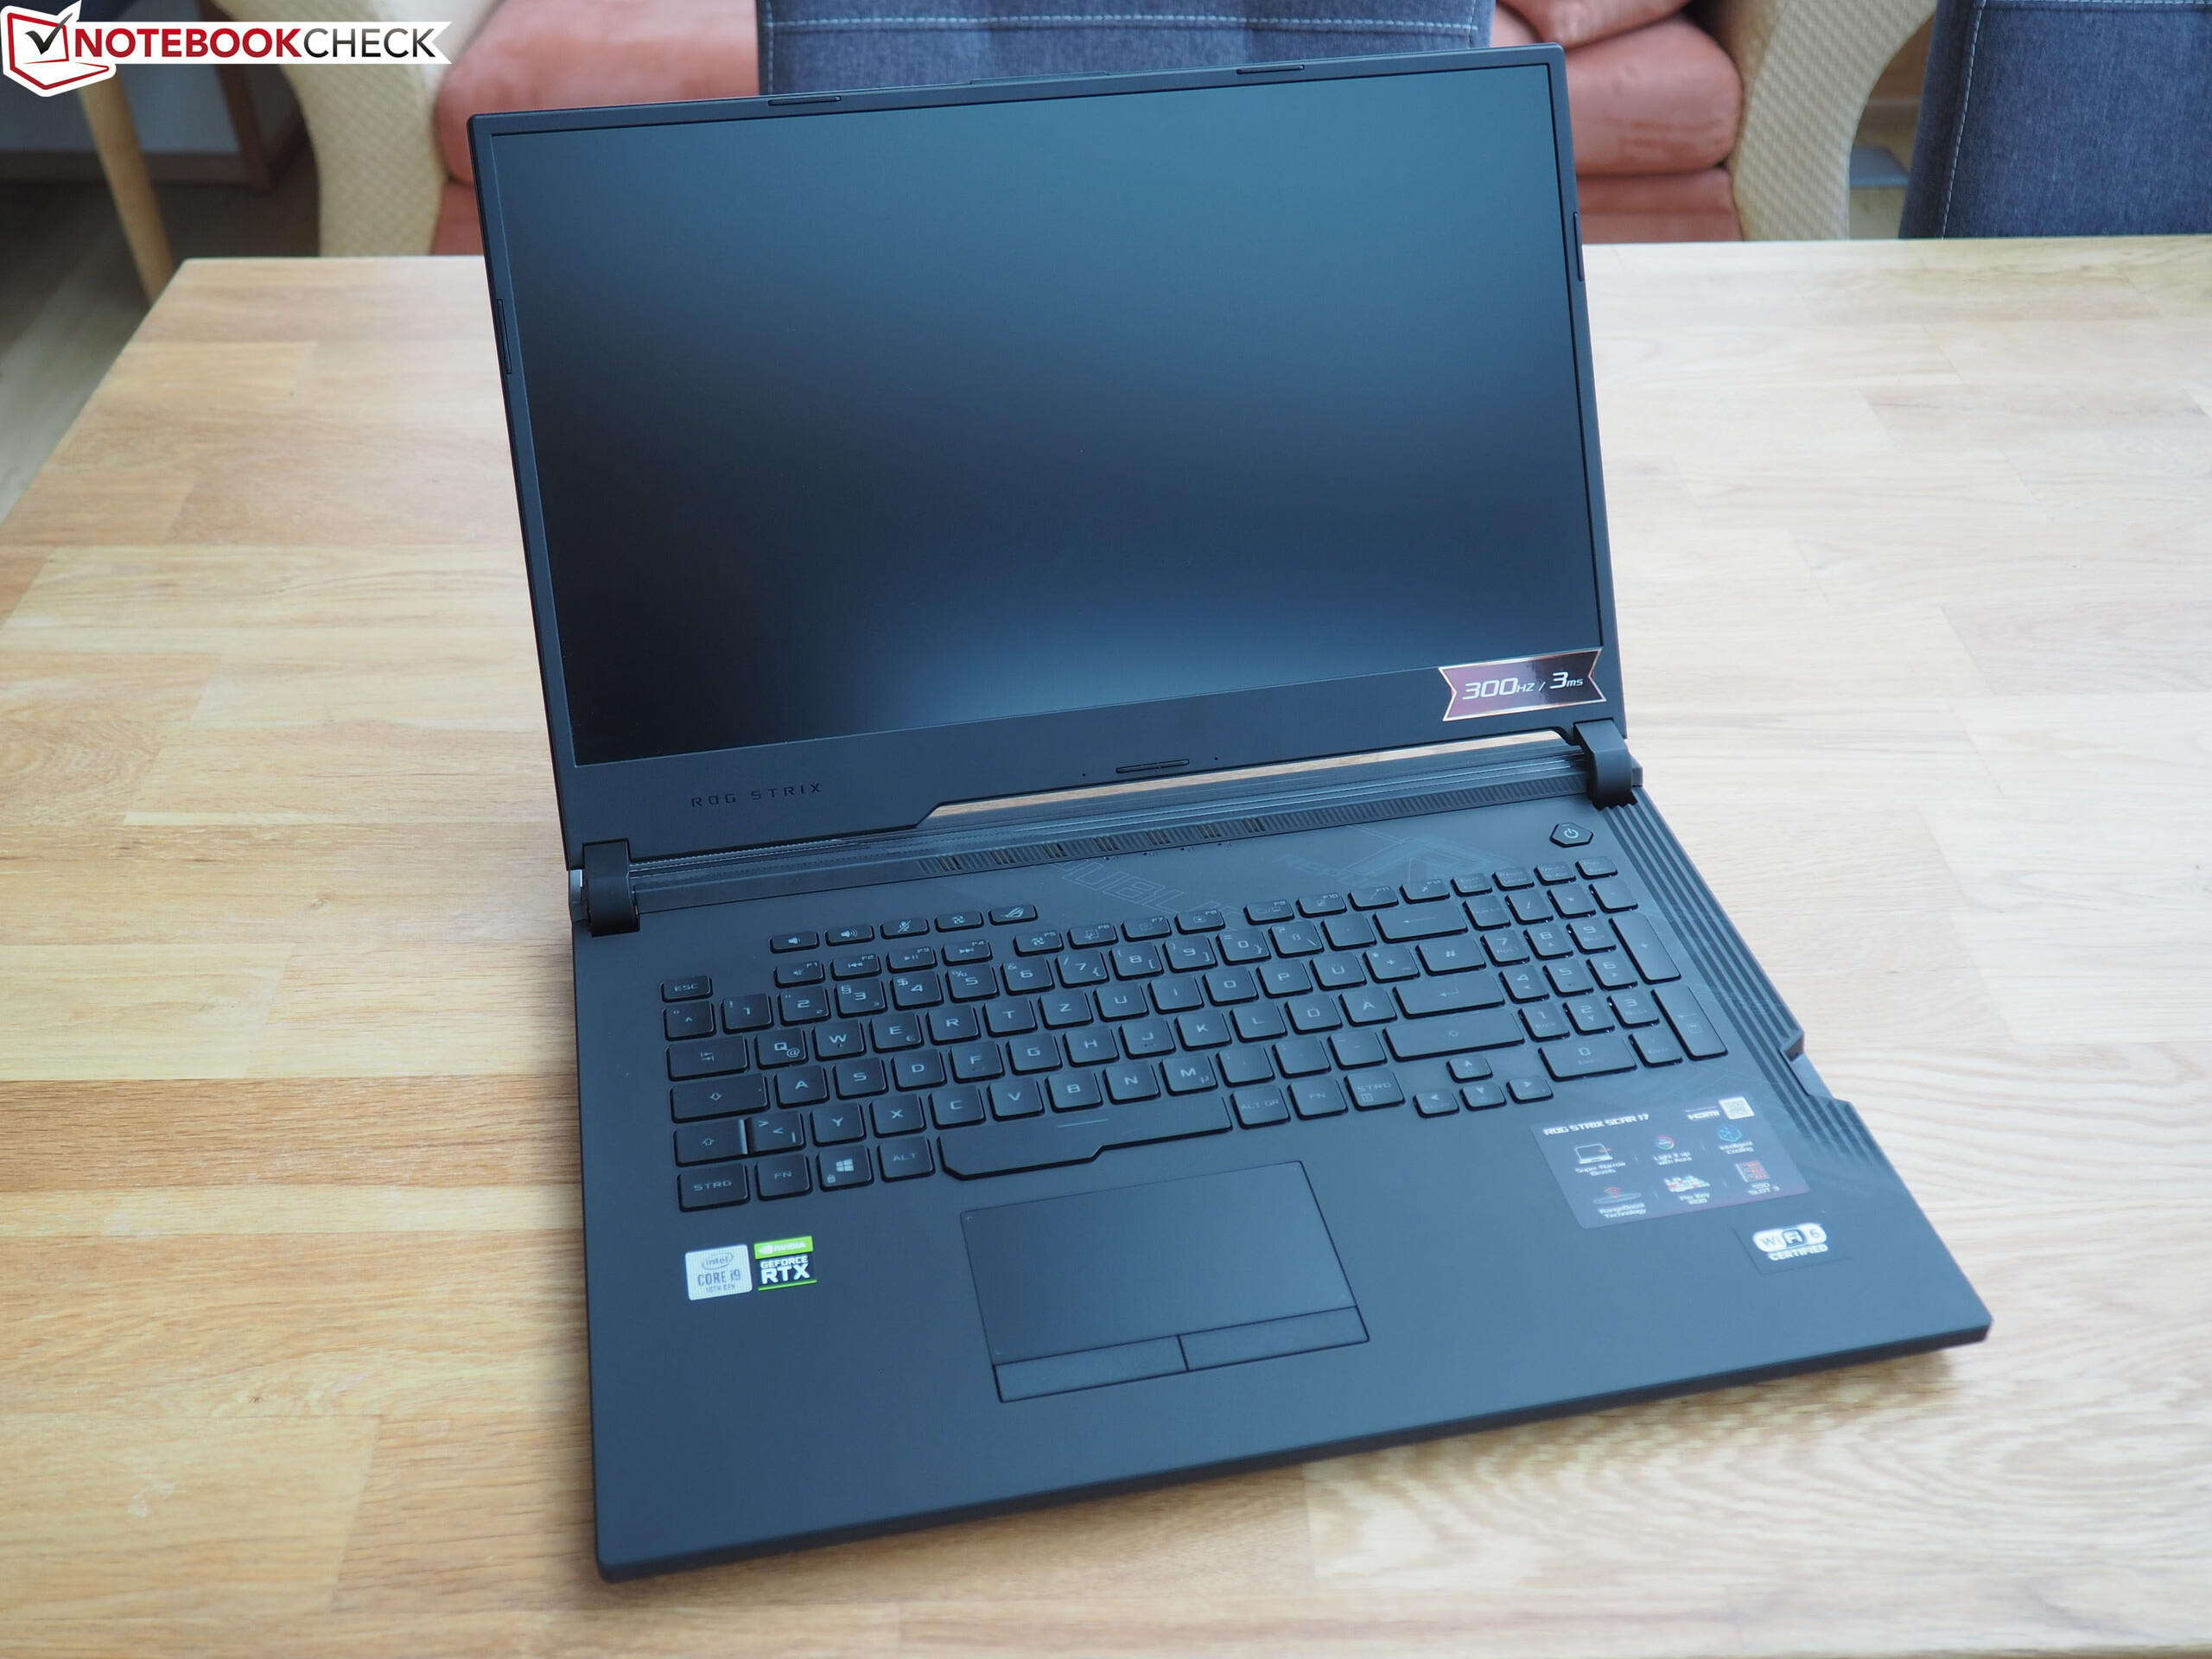
Test de l'Asus ROG Strix Scar 17 G732LXS (i9-10980HK, RTX 2080 Super, FHD, 300 Hz) : tout-terrain
Note | Date | Modèle | Poids | Épaisseur | Taille | Résolution | Prix |
|---|---|---|---|---|---|---|---|
| 82.7 % v7 (old) | 08/20 | Asus Strix Scar 17 G732LXS i9-10980HK, GeForce RTX 2080 Super Mobile | 2.9 kg | 26.5 mm | 17.30" | 1920x1080 | |
| 86.1 % v7 (old) | 05/19 | MSI GE75 9SG i9-9880H, GeForce RTX 2080 Mobile | 2.7 kg | 27.5 mm | 17.30" | 1920x1080 | |
| 85.1 % v7 (old) | 08/19 | HP Omen 17-cb0020ng i9-9880H, GeForce RTX 2080 Mobile | 3.3 kg | 27 mm | 17.30" | 1920x1080 | |
| 85.4 % v7 (old) | 07/19 | Asus ASUS ROG Strix SCAR III G731GW-XB74 i7-9750H, GeForce RTX 2070 Mobile | 2.9 kg | 26.2 mm | 17.30" | 1920x1080 | |
| 87.4 % v6 (old) | 07/19 | Eurocom Nightsky RX17 i7-9750H, GeForce RTX 2070 Mobile | 2.9 kg | 29.9 mm | 17.30" | 1920x1080 |
| |||||||||||||||||||||||||
Homogénéité de la luminosité: 82 %
Valeur mesurée au centre, sur batterie: 310 cd/m²
Contraste: 756:1 (Valeurs des noirs: 0.41 cd/m²)
ΔE ColorChecker Calman: 2.41 | ∀{0.5-29.43 Ø4.72}
calibrated: 1.13
ΔE Greyscale Calman: 4.3 | ∀{0.09-98 Ø4.97}
94% sRGB (Argyll 1.6.3 3D)
72% AdobeRGB 1998 (Argyll 1.6.3 3D)
71.6% AdobeRGB 1998 (Argyll 3D)
99% sRGB (Argyll 3D)
71% Display P3 (Argyll 3D)
Gamma: 2.149
CCT: 7059 K
| Asus Strix Scar 17 G732LXS LQ173M1JW03 (SHP14DC), IPS, 1920x1080 | MSI GE75 9SG Chi Mei N173HCE-G33, AHVA, 1920x1080 | HP Omen 17-cb0020ng CMN175D, IPS, 1920x1080 | Asus ASUS ROG Strix SCAR III G731GW-XB74 AU Optronics AUO409D, IPS, 1920x1080 | Eurocom Nightsky RX17 BOE NV173FHM-N44, IPS, 1920x1080 | |
|---|---|---|---|---|---|
| Display | -10% | -7% | -13% | -6% | |
| Display P3 Coverage (%) | 71 | 61.5 -13% | 63.7 -10% | 61.9 -13% | 66.1 -7% |
| sRGB Coverage (%) | 99 | 92 -7% | 96 -3% | 86.3 -13% | 93.1 -6% |
| AdobeRGB 1998 Coverage (%) | 71.6 | 63.5 -11% | 65.8 -8% | 62.9 -12% | 67.2 -6% |
| Response Times | -2% | -118% | -31% | -104% | |
| Response Time Grey 50% / Grey 80% * (ms) | 5.8 ? | 7.2 ? -24% | 17.6 ? -203% | 7.2 ? -24% | 16.4 ? -183% |
| Response Time Black / White * (ms) | 8.4 ? | 6.6 ? 21% | 11.2 ? -33% | 11.6 ? -38% | 10.4 ? -24% |
| PWM Frequency (Hz) | 26040 ? | 25510 ? | 990 ? | ||
| Screen | 24% | 26% | -26% | -9% | |
| Brightness middle (cd/m²) | 310 | 400.7 29% | 360 16% | 297.4 -4% | 298.4 -4% |
| Brightness (cd/m²) | 311 | 372 20% | 342 10% | 306 -2% | 287 -8% |
| Brightness Distribution (%) | 82 | 89 9% | 91 11% | 80 -2% | 90 10% |
| Black Level * (cd/m²) | 0.41 | 0.34 17% | 0.26 37% | 0.31 24% | 0.3 27% |
| Contrast (:1) | 756 | 1179 56% | 1385 83% | 959 27% | 995 32% |
| Colorchecker dE 2000 * | 2.41 | 1.33 45% | 1.91 21% | 4.08 -69% | 3.58 -49% |
| Colorchecker dE 2000 max. * | 8.59 | 3.51 59% | 4.08 53% | 6.88 20% | 6.29 27% |
| Colorchecker dE 2000 calibrated * | 1.13 | 1.39 -23% | 0.78 31% | 4 -254% | 2.82 -150% |
| Greyscale dE 2000 * | 4.3 | 1.3 70% | 2.72 37% | 4 7% | 3.1 28% |
| Gamma | 2.149 102% | 2.24 98% | 2.37 93% | 2.259 97% | 2.24 98% |
| CCT | 7059 92% | 6735 97% | 6692 97% | 7205 90% | 7064 92% |
| Color Space (Percent of AdobeRGB 1998) (%) | 72 | 58.2 -19% | 60 -17% | 56 -22% | 60.2 -16% |
| Color Space (Percent of sRGB) (%) | 94 | 92.1 -2% | 96 2% | 86 -9% | 92.7 -1% |
| Moyenne finale (programmes/paramètres) | 4% /
14% | -33% /
2% | -23% /
-24% | -40% /
-21% |
* ... Moindre est la valeur, meilleures sont les performances
Temps de réponse de l'écran
| ↔ Temps de réponse noir à blanc | ||
|---|---|---|
| 8.4 ms ... hausse ↗ et chute ↘ combinées | ↗ 4.4 ms hausse | 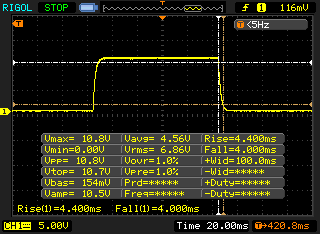 |
| ↘ 4 ms chute | ||
| L'écran montre de faibles temps de réponse, un bon écran pour jouer. En comparaison, tous les appareils testés affichent entre 0.1 (minimum) et 240 (maximum) ms. » 24 % des appareils testés affichent de meilleures performances. Cela signifie que les latences relevées sont meilleures que la moyenne (19.9 ms) de tous les appareils testés. | ||
| ↔ Temps de réponse gris 50% à gris 80% | ||
| 5.8 ms ... hausse ↗ et chute ↘ combinées | ↗ 2.4 ms hausse | 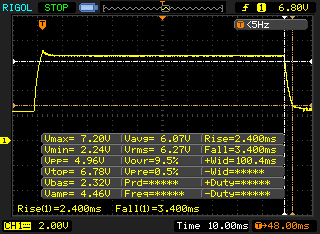 |
| ↘ 3.4 ms chute | ||
| L'écran montre de très faibles temps de réponse, parfait pour le jeu. En comparaison, tous les appareils testés affichent entre 0.165 (minimum) et 636 (maximum) ms. » 18 % des appareils testés affichent de meilleures performances. Cela signifie que les latences relevées sont meilleures que la moyenne (31.1 ms) de tous les appareils testés. | ||
Scintillement / MLI (Modulation de largeur d'impulsion)
| Scintillement / MLI (Modulation de largeur d'impulsion) non décelé | 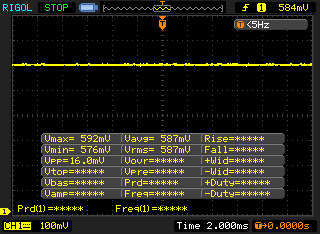 | ||
En comparaison, 52 % des appareils testés n'emploient pas MDI pour assombrir leur écran. Nous avons relevé une moyenne à 7784 (minimum : 5 - maximum : 343500) Hz dans le cas où une MDI était active. | |||
| Blender - v2.79 BMW27 CPU | |
| MSI GE75 9SG | |
| Asus Strix Scar 17 G732LXS | |
| Moyenne de la classe Gaming (80 - 330, n=107, 2 dernières années) | |
| HWBOT x265 Benchmark v2.2 - 4k Preset | |
| Moyenne de la classe Gaming (11.5 - 44.3, n=108, 2 dernières années) | |
| Asus Strix Scar 17 G732LXS | |
| MSI GE75 9SG | |
| LibreOffice - 20 Documents To PDF | |
| Asus Strix Scar 17 G732LXS | |
| Moyenne de la classe Gaming (19 - 88.8, n=108, 2 dernières années) | |
| R Benchmark 2.5 - Overall mean | |
| Asus Strix Scar 17 G732LXS | |
| Moyenne de la classe Gaming (0.3439 - 0.759, n=109, 2 dernières années) | |
* ... Moindre est la valeur, meilleures sont les performances
| DPC Latencies / LatencyMon - interrupt to process latency (max), Web, Youtube, Prime95 | |
| Asus Strix Scar 17 G732LXS | |
* ... Moindre est la valeur, meilleures sont les performances
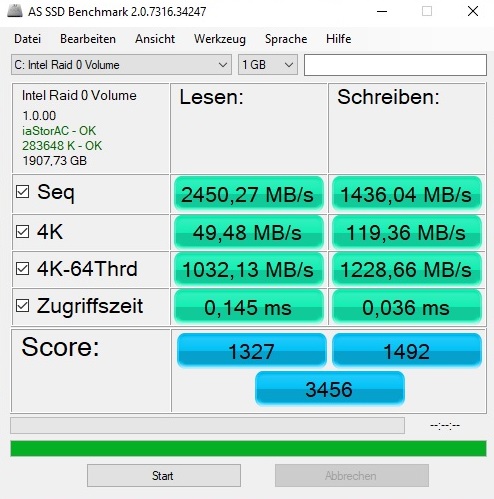
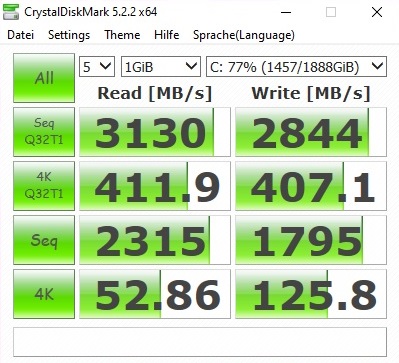
| Asus Strix Scar 17 G732LXS 2x Intel SSD 660p 1TB SSDPEKNW010T8 (RAID 0) | MSI GE75 9SG Samsung SSD PM981 MZVLB1T0HALR | HP Omen 17-cb0020ng 2x Samsung SSD PM981 MZVLB512HAJQ (RAID 0) | Asus ASUS ROG Strix SCAR III G731GW-XB74 Intel SSD 660p 1TB SSDPEKNW010T8 | Eurocom Nightsky RX17 2x Samsung SSD 970 Pro 512GB (RAID 0) | |
|---|---|---|---|---|---|
| CrystalDiskMark 5.2 / 6 | -7% | 11% | -4% | 31% | |
| Write 4K (MB/s) | 125.8 | 116.1 -8% | 103.8 -17% | 130.1 3% | 133 6% |
| Read 4K (MB/s) | 52.9 | 44.98 -15% | 41.67 -21% | 56 6% | 61.6 16% |
| Write Seq (MB/s) | 1795 | 2370 32% | 2639 47% | 2935 64% | |
| Read Seq (MB/s) | 2315 | 1465 -37% | 2702 17% | 3118 35% | |
| Write 4K Q32T1 (MB/s) | 407.1 | 337.5 -17% | 487.3 20% | 465.7 14% | 571 40% |
| Read 4K Q32T1 (MB/s) | 411.9 | 453.6 10% | 555 35% | 547 33% | 654 59% |
| Write Seq Q32T1 (MB/s) | 2844 | 2399 -16% | 2967 4% | 1766 -38% | 3296 16% |
| Read Seq Q32T1 (MB/s) | 3130 | 3087 -1% | 3102 -1% | 1922 -39% | 3560 14% |

Continuous load read: DiskSpd Read Loop, Queue Depth 8
| 3DMark 06 Standard Score | 41873 points | |
| 3DMark Vantage P Result | 69838 points | |
| 3DMark 11 Performance | 27065 points | |
| 3DMark Cloud Gate Standard Score | 49644 points | |
| 3DMark Fire Strike Score | 20902 points | |
| 3DMark Time Spy Score | 9629 points | |
Aide | ||
| The Witcher 3 - 1920x1080 Ultra Graphics & Postprocessing (HBAO+) | |
| Moyenne de la classe Gaming (95 - 240, n=8, 2 dernières années) | |
| MSI GE75 9SG | |
| Asus Strix Scar 17 G732LXS | |
| HP Omen 17-cb0020ng | |
| Eurocom Nightsky RX17 | |
| Asus ASUS ROG Strix SCAR III G731GW-XB74 | |
| Bas | Moyen | Élevé | Ultra | QHD | 4K | |
|---|---|---|---|---|---|---|
| GTA V (2015) | 185 | 178 | 164 | 92.8 | ||
| The Witcher 3 (2015) | 280 | 178 | 93.4 | 66.4 | ||
| Dota 2 Reborn (2015) | 168 | 154 | 148 | 134 | ||
| Fortnite (2018) | 178 | 171 | 136 | 104 | 52 | |
| Final Fantasy XV Benchmark (2018) | 124 | 95.7 | 42 | |||
| Kingdom Come: Deliverance (2018) | 144 | 107 | 75.3 | 56.1 | 33.1 | |
| X-Plane 11.11 (2018) | 123 | 105 | 88.4 | |||
| Monster Hunter World (2018) | 131 | 119 | 102 | 69.1 | 36 | |
| Shadow of the Tomb Raider (2018) | 136 | 127 | 121 | 84 | 45 | |
| Assassin´s Creed Odyssey (2018) | 98 | 85 | 62 | 57 | 38 | |
| Hitman 2 (2018) | 104 | 87.8 | 80 | 77.7 | 48.4 | |
| Battlefield V (2018) | 169 | 153 | 142 | 115 | 68.7 | |
| Darksiders III (2018) | 168 | 143 | 132 | 97.2 | 50.5 | |
| Just Cause 4 (2018) | 157 | 120 | 113 | 81.2 | 46 | |
| Apex Legends (2019) | 144 | 144 | 144 | 131 | 75.4 | |
| Far Cry New Dawn (2019) | 116 | 113 | 100 | 90 | 55 | |
| Metro Exodus (2019) | 116 | 90.2 | 71 | 55.4 | 34.9 | |
| Dirt Rally 2.0 (2019) | 178 | 158 | 91.6 | 74.1 | ||
| The Division 2 (2019) | 147 | 131 | 102 | 69 | 36 | |
| Anno 1800 (2019) | 122 | 91.7 | 50.6 | 45.3 | 27.1 | |
| Rage 2 (2019) | 148 | 127 | 127 | 81.9 | 40.3 | |
| F1 2019 (2019) | 224 | 174 | 167 | 130 | 80 | |
| Control (2019) | 113 | 87.6 | 58.9 | 29.8 | ||
| Borderlands 3 (2019) | 131 | 98 | 88 | 64.6 | 35.2 | |
| FIFA 20 (2019) | 281 | 267 | 262 | 258 | 227 | |
| Ghost Recon Breakpoint (2019) | 109 | 99 | 74 | 57 | 34 | |
| GRID 2019 (2019) | 164 | 120 | 88.7 | 72.5 | 48.8 | |
| Call of Duty Modern Warfare 2019 (2019) | 145 | 136 | 115 | 83.6 | 48.3 | |
| Need for Speed Heat (2019) | 104 | 91 | 79.4 | 75.3 | 51.3 | |
| Star Wars Jedi Fallen Order (2019) | 121 | 117 | 107 | 86.4 | 49 | |
| Red Dead Redemption 2 (2019) | 117 | 79.8 | 52.9 | 42.5 | 27.6 | |
| Escape from Tarkov (2020) | 121 | 121 | 121 | 102 | 49.5 | |
| Hunt Showdown (2020) | 151 | 120 | 83.1 | 38.4 | ||
| Doom Eternal (2020) | 216 | 193 | 191 | 147 | 80.8 | |
| Gears Tactics (2020) | 226 | 144 | 106 | 70.3 | 38.4 | |
| F1 2020 (2020) | 235 | 175 | 146 | 119 | 72 |
Degré de la nuisance sonore
| Au repos |
| 33 / 38 / 45 dB(A) |
| Fortement sollicité |
| 54 / 55 dB(A) |
 | ||
30 dB silencieux 40 dB(A) audible 50 dB(A) bruyant |
||
min: | ||
| Asus Strix Scar 17 G732LXS i9-10980HK, GeForce RTX 2080 Super Mobile | MSI GE75 9SG i9-9880H, GeForce RTX 2080 Mobile | HP Omen 17-cb0020ng i9-9880H, GeForce RTX 2080 Mobile | Asus ASUS ROG Strix SCAR III G731GW-XB74 i7-9750H, GeForce RTX 2070 Mobile | Eurocom Nightsky RX17 i7-9750H, GeForce RTX 2070 Mobile | Moyenne de la classe Gaming | |
|---|---|---|---|---|---|---|
| Noise | 9% | 3% | 8% | 10% | 18% | |
| arrêt / environnement * (dB) | 25 | 28.2 -13% | 30 -20% | 28.2 -13% | 28 -12% | 24.1 ? 4% |
| Idle Minimum * (dB) | 33 | 30.4 8% | 34 -3% | 28.2 15% | 28 15% | 25.8 ? 22% |
| Idle Average * (dB) | 38 | 30.4 20% | 35 8% | 28.5 25% | 28.4 25% | 27.4 ? 28% |
| Idle Maximum * (dB) | 45 | 33.4 26% | 36 20% | 30 33% | 32.9 27% | 29.9 ? 34% |
| Load Average * (dB) | 54 | 37.1 31% | 51 6% | 51.5 5% | 45 17% | 43 ? 20% |
| Witcher 3 ultra * (dB) | 50 | 54.2 -8% | 47 6% | 55.3 -11% | 53.2 -6% | |
| Load Maximum * (dB) | 55 | 56.4 -3% | 51 7% | 55.3 -1% | 53.2 3% | 54 ? 2% |
* ... Moindre est la valeur, meilleures sont les performances
(-) La température maximale du côté supérieur est de 59 °C / 138 F, par rapport à la moyenne de 40.4 °C / 105 F, allant de 21.2 à 68.8 °C pour la classe Gaming.
(-) Le fond chauffe jusqu'à un maximum de 52 °C / 126 F, contre une moyenne de 43.2 °C / 110 F
(+) En utilisation inactive, la température moyenne du côté supérieur est de 28.6 °C / 83 F, par rapport à la moyenne du dispositif de 33.9 °C / 93 F.
(-) En jouant à The Witcher 3, la température moyenne du côté supérieur est de 48.6 °C / 119 F, alors que la moyenne de l'appareil est de 33.9 °C / 93 F.
(-) Les repose-poignets et le pavé tactile peuvent devenir très chauds au toucher, avec un maximum de 40 °C / 104# F.
(-) La température moyenne de la zone de l'appui-paume de dispositifs similaires était de 28.8 °C / 83.8 F (-11.2 °C / #-20.2 F).
| Asus Strix Scar 17 G732LXS i9-10980HK, GeForce RTX 2080 Super Mobile | MSI GE75 9SG i9-9880H, GeForce RTX 2080 Mobile | HP Omen 17-cb0020ng i9-9880H, GeForce RTX 2080 Mobile | Asus ASUS ROG Strix SCAR III G731GW-XB74 i7-9750H, GeForce RTX 2070 Mobile | Eurocom Nightsky RX17 i7-9750H, GeForce RTX 2070 Mobile | Moyenne de la classe Gaming | |
|---|---|---|---|---|---|---|
| Heat | -14% | 2% | -5% | -5% | 2% | |
| Maximum Upper Side * (°C) | 59 | 48.8 17% | 47 20% | 45.2 23% | 48.6 18% | 45.2 ? 23% |
| Maximum Bottom * (°C) | 52 | 52 -0% | 54 -4% | 52 -0% | 46.8 10% | 47.9 ? 8% |
| Idle Upper Side * (°C) | 30 | 36.2 -21% | 32 -7% | 33 -10% | 35.4 -18% | 31.1 ? -4% |
| Idle Bottom * (°C) | 29 | 44.4 -53% | 30 -3% | 38 -31% | 38 -31% | 34.2 ? -18% |
* ... Moindre est la valeur, meilleures sont les performances
Asus Strix Scar 17 G732LXS analyse audio
(±) | le niveau sonore du haut-parleur est moyen mais bon (81# dB)
Basses 100 - 315 Hz
(±) | basse réduite - en moyenne 7.1% inférieure à la médiane
(±) | la linéarité des basses est moyenne (12.6% delta à la fréquence précédente)
Médiums 400 - 2000 Hz
(±) | médiane supérieure - en moyenne 5.5% supérieure à la médiane
(+) | les médiums sont linéaires (5.1% delta à la fréquence précédente)
Aiguës 2 - 16 kHz
(+) | des sommets équilibrés - à seulement 2.8% de la médiane
(+) | les aigus sont linéaires (5.6% delta à la fréquence précédente)
Globalement 100 - 16 000 Hz
(+) | le son global est linéaire (12.1% différence à la médiane)
Par rapport à la même classe
» 12% de tous les appareils testés de cette catégorie étaient meilleurs, 4% similaires, 84% pires
» Le meilleur avait un delta de 6%, la moyenne était de 18%, le pire était de 132%.
Par rapport à tous les appareils testés
» 9% de tous les appareils testés étaient meilleurs, 2% similaires, 88% pires
» Le meilleur avait un delta de 4%, la moyenne était de 24%, le pire était de 134%.
MSI GE75 9SG analyse audio
(+) | les haut-parleurs peuvent jouer relativement fort (92.8# dB)
Basses 100 - 315 Hz
(±) | basse réduite - en moyenne 12.2% inférieure à la médiane
(±) | la linéarité des basses est moyenne (8.7% delta à la fréquence précédente)
Médiums 400 - 2000 Hz
(±) | médiane supérieure - en moyenne 6.7% supérieure à la médiane
(±) | la linéarité des médiums est moyenne (11.5% delta à la fréquence précédente)
Aiguës 2 - 16 kHz
(+) | des sommets équilibrés - à seulement 2.9% de la médiane
(±) | la linéarité des aigus est moyenne (7.6% delta à la fréquence précédente)
Globalement 100 - 16 000 Hz
(±) | la linéarité du son global est moyenne (16.5% de différence avec la médiane)
Par rapport à la même classe
» 42% de tous les appareils testés de cette catégorie étaient meilleurs, 7% similaires, 51% pires
» Le meilleur avait un delta de 6%, la moyenne était de 18%, le pire était de 132%.
Par rapport à tous les appareils testés
» 28% de tous les appareils testés étaient meilleurs, 6% similaires, 66% pires
» Le meilleur avait un delta de 4%, la moyenne était de 24%, le pire était de 134%.
| Éteint/en veille | |
| Au repos | |
| Fortement sollicité |
|
Légende:
min: | |
| Asus Strix Scar 17 G732LXS i9-10980HK, GeForce RTX 2080 Super Mobile | MSI GE75 9SG i9-9880H, GeForce RTX 2080 Mobile | HP Omen 17-cb0020ng i9-9880H, GeForce RTX 2080 Mobile | Asus ASUS ROG Strix SCAR III G731GW-XB74 i7-9750H, GeForce RTX 2070 Mobile | Eurocom Nightsky RX17 i7-9750H, GeForce RTX 2070 Mobile | Moyenne de la classe Gaming | |
|---|---|---|---|---|---|---|
| Power Consumption | 17% | -8% | 9% | 18% | 24% | |
| Idle Minimum * (Watt) | 16 | 13.9 13% | 26 -63% | 18.2 -14% | 18.6 -16% | 13.2 ? 17% |
| Idle Average * (Watt) | 25 | 18.8 25% | 29 -16% | 23 8% | 22.6 10% | 18.9 ? 24% |
| Idle Maximum * (Watt) | 35 | 23.1 34% | 38 -9% | 33.1 5% | 23 34% | 24.3 ? 31% |
| Load Average * (Watt) | 177 | 112.3 37% | 106 40% | 124.8 29% | 93.4 47% | 108.3 ? 39% |
| Witcher 3 ultra * (Watt) | 227 | 231 -2% | 228 -0% | 180.8 20% | 186.4 18% | |
| Load Maximum * (Watt) | 280 | 291.5 -4% | 287 -2% | 263 6% | 233.6 17% | 254 ? 9% |
* ... Moindre est la valeur, meilleures sont les performances
| Asus Strix Scar 17 G732LXS i9-10980HK, GeForce RTX 2080 Super Mobile, 66 Wh | MSI GE75 9SG i9-9880H, GeForce RTX 2080 Mobile, 65 Wh | HP Omen 17-cb0020ng i9-9880H, GeForce RTX 2080 Mobile, 70 Wh | Asus ASUS ROG Strix SCAR III G731GW-XB74 i7-9750H, GeForce RTX 2070 Mobile, 66 Wh | Eurocom Nightsky RX17 i7-9750H, GeForce RTX 2070 Mobile, 62 Wh | Moyenne de la classe Gaming | |
|---|---|---|---|---|---|---|
| Autonomie de la batterie | -17% | -43% | -33% | -48% | 1% | |
| Reader / Idle (h) | 10 | 4.2 -58% | 4.2 -58% | 4.2 -58% | 8.71 ? -13% | |
| WiFi v1.3 (h) | 5.9 | 4.9 -17% | 3.3 -44% | 3.9 -34% | 2 -66% | 7.04 ? 19% |
| Load (h) | 1.5 | 1.1 -27% | 1.4 -7% | 1.2 -20% | 1.47 ? -2% |
Points positifs
Points négatifs
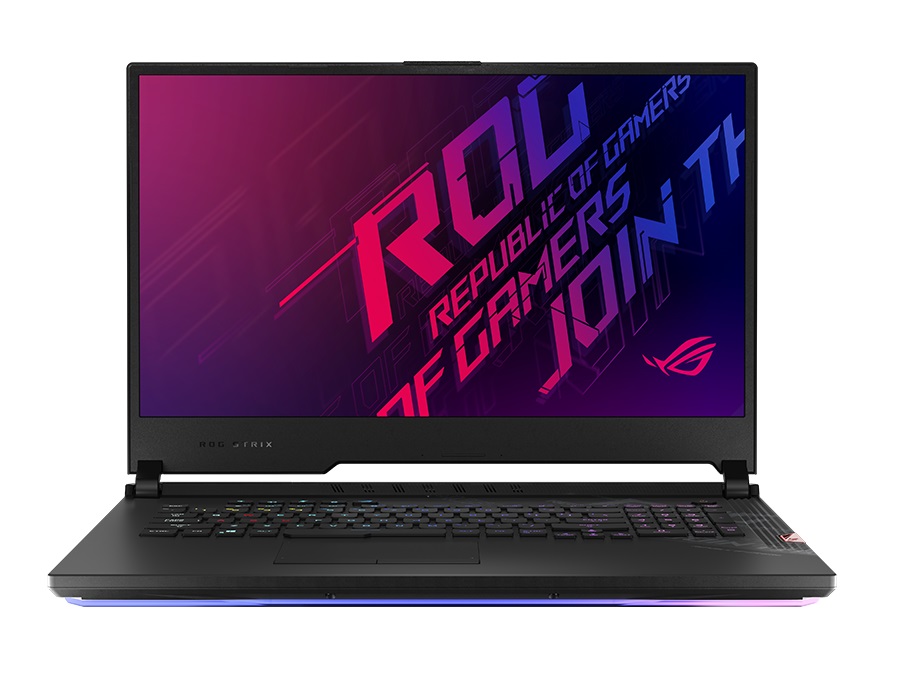
Avec le Strix Scar 17 G732LXS, Asus propose un PC poratble haut de gamme ultra-puissant, qui souffre malheureusement des défauts typiques de cette catégorie de machines.
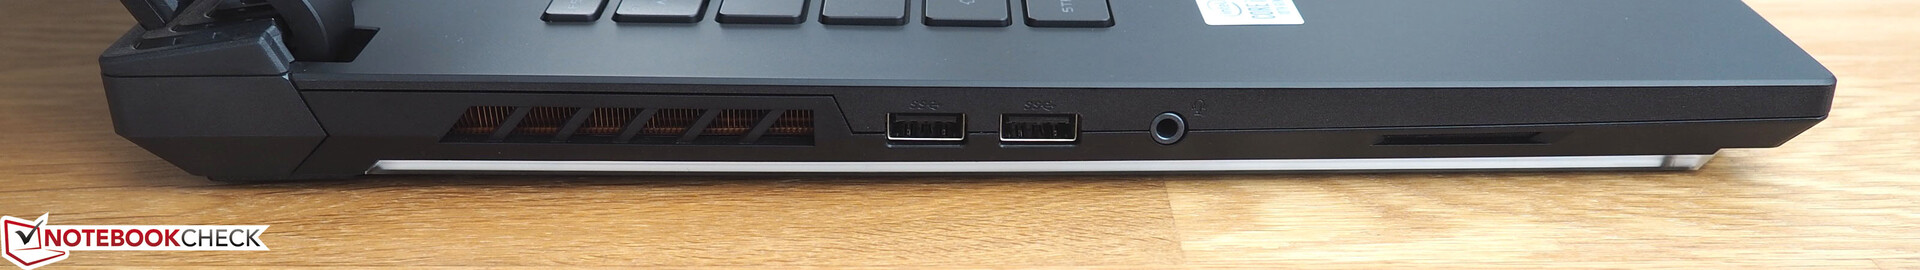
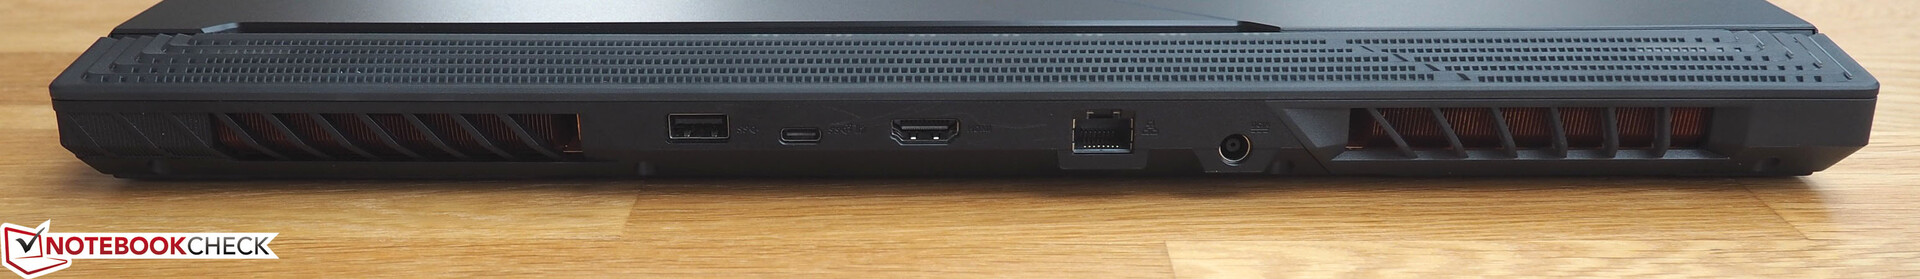
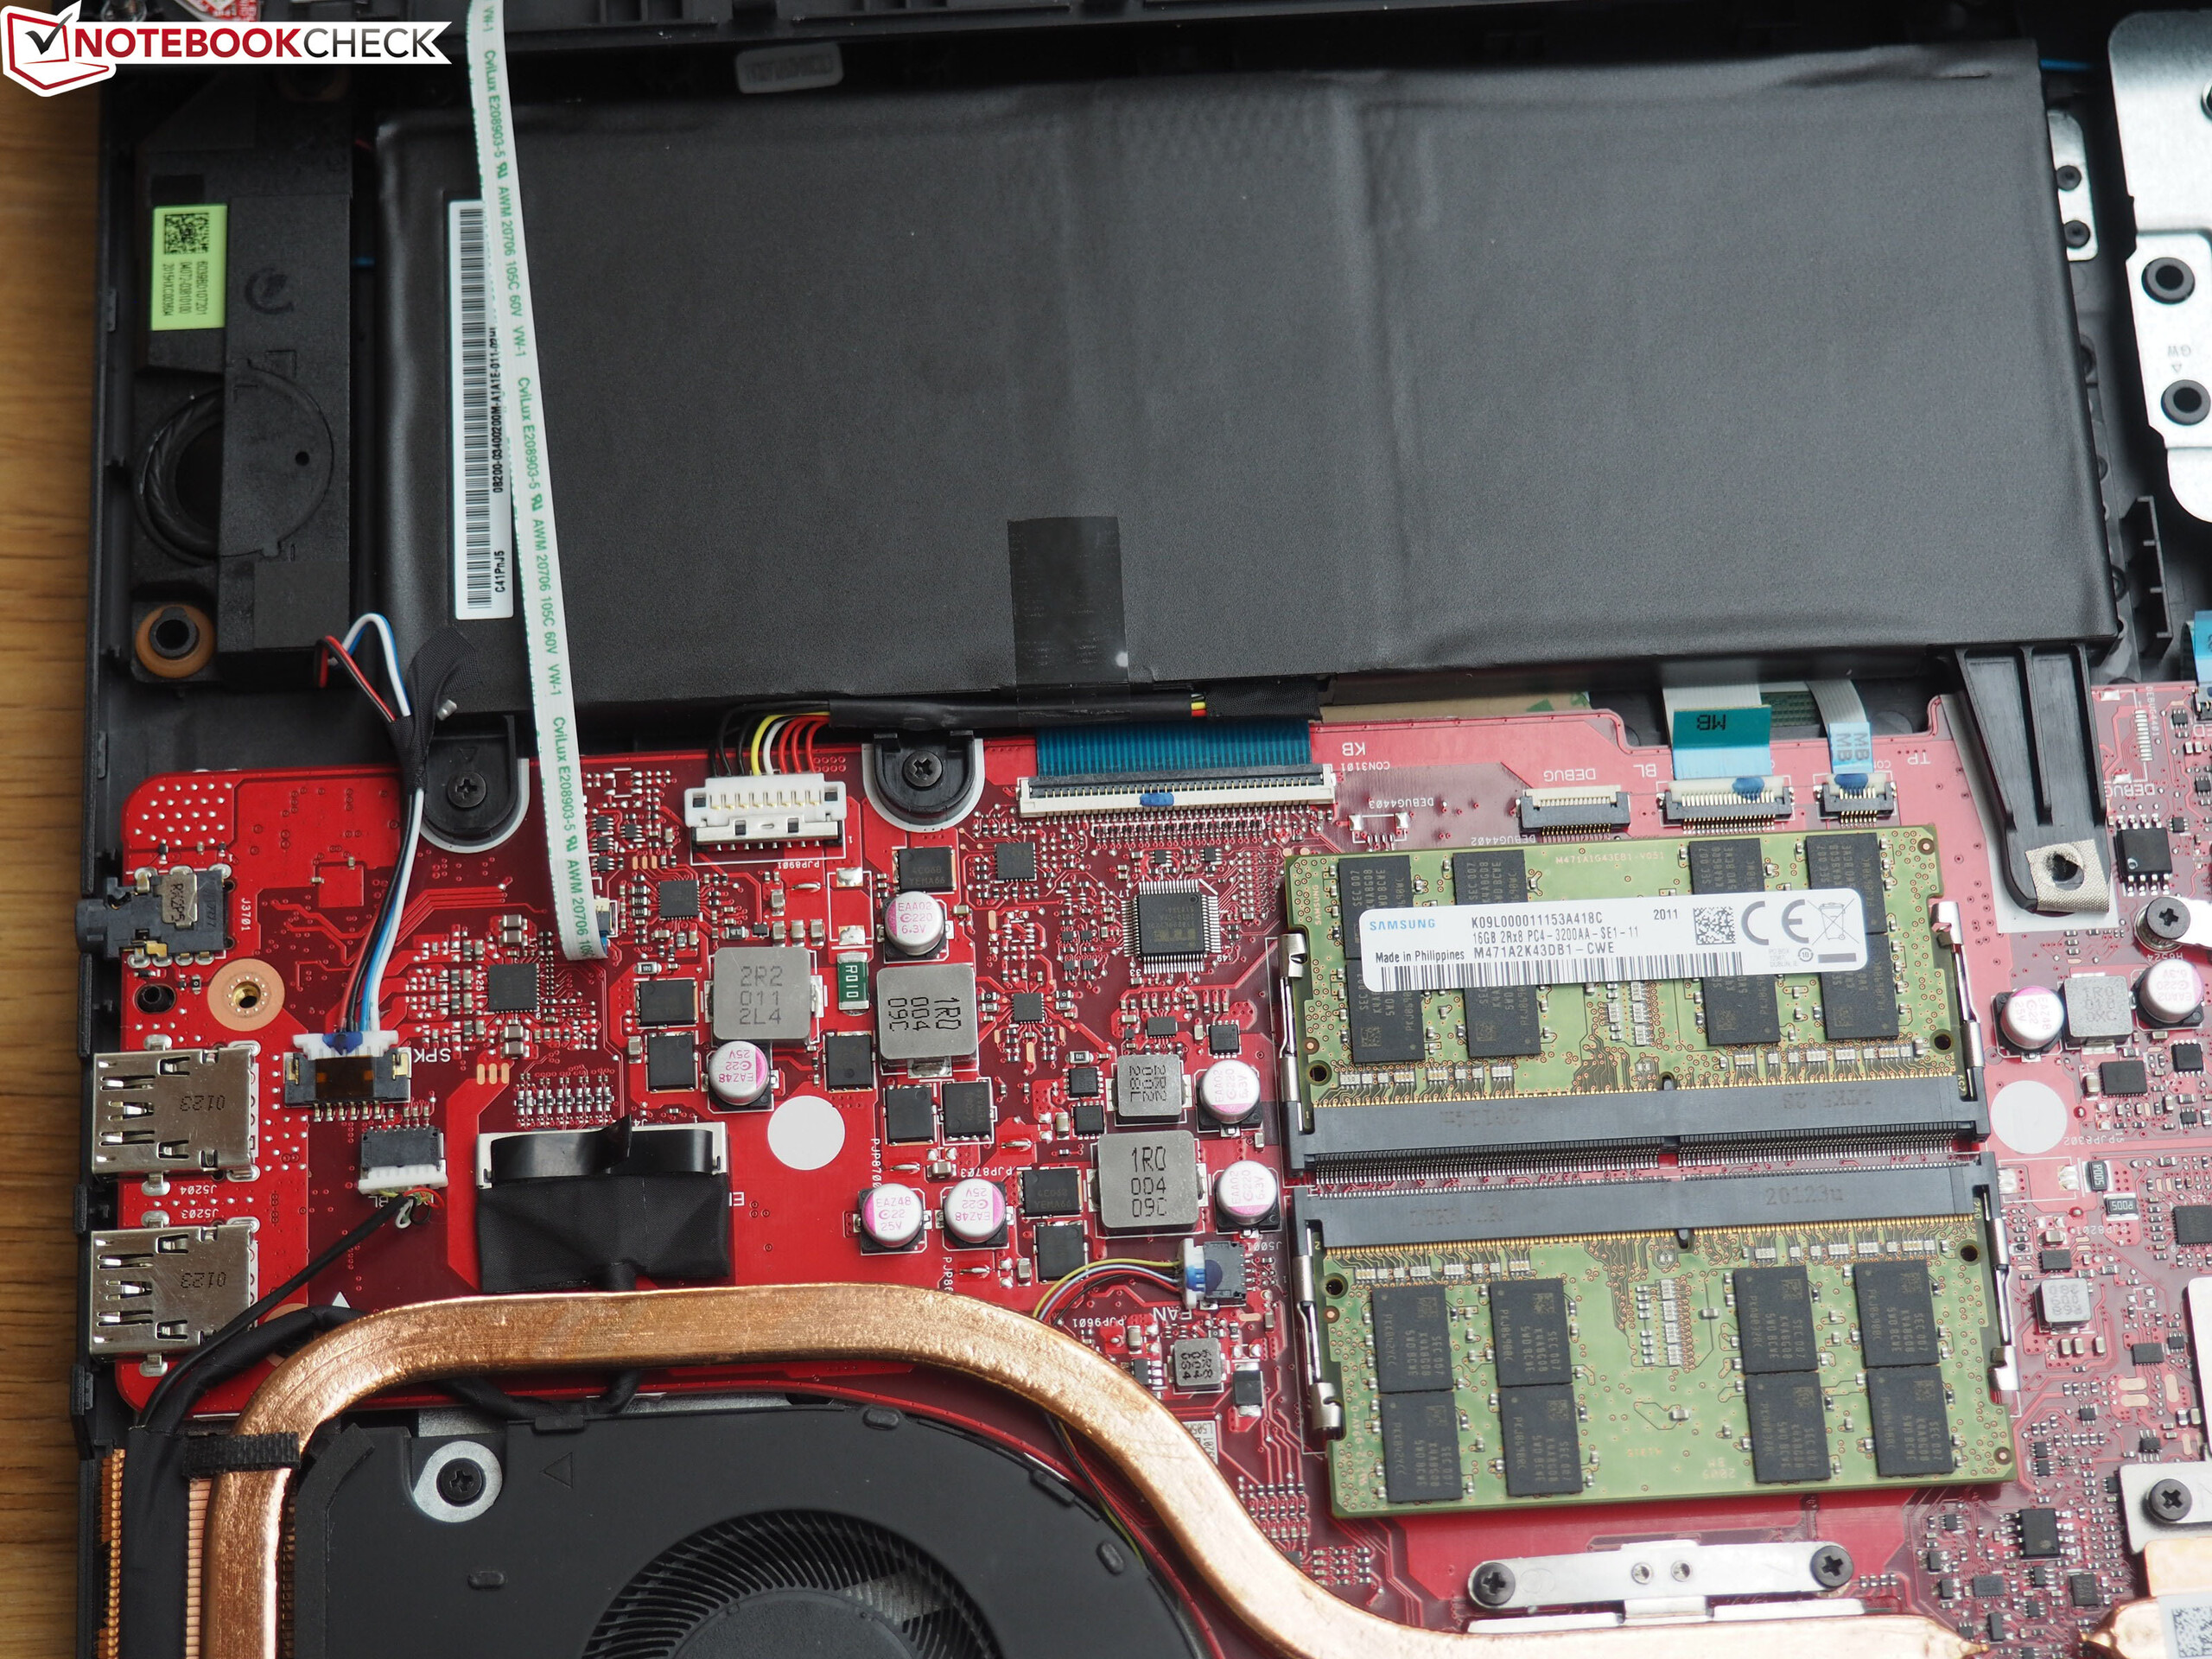
In addition to the heat generation, the noise level in 3D operation is also very high. On top of that, the graphics card has only earned its "Super" designation to a limited extent when comparing the performance with other RTX 2080 laptops (keyword TGP). Asus could also improve on the connectivity (no card reader, no Thunderbolt 3).
En plus de la chauffe, le niveau sonore en 3D est également très élevé. De plus, la carte graphique ne mérite pas tout à fait son qualificatif "Super", par rapport à d'autres PC portables avec RTX 2080 (TGP). Asus pourrait également améliorer la connectivité (pas de lecteur de carte ni de Thunderbolt 3).
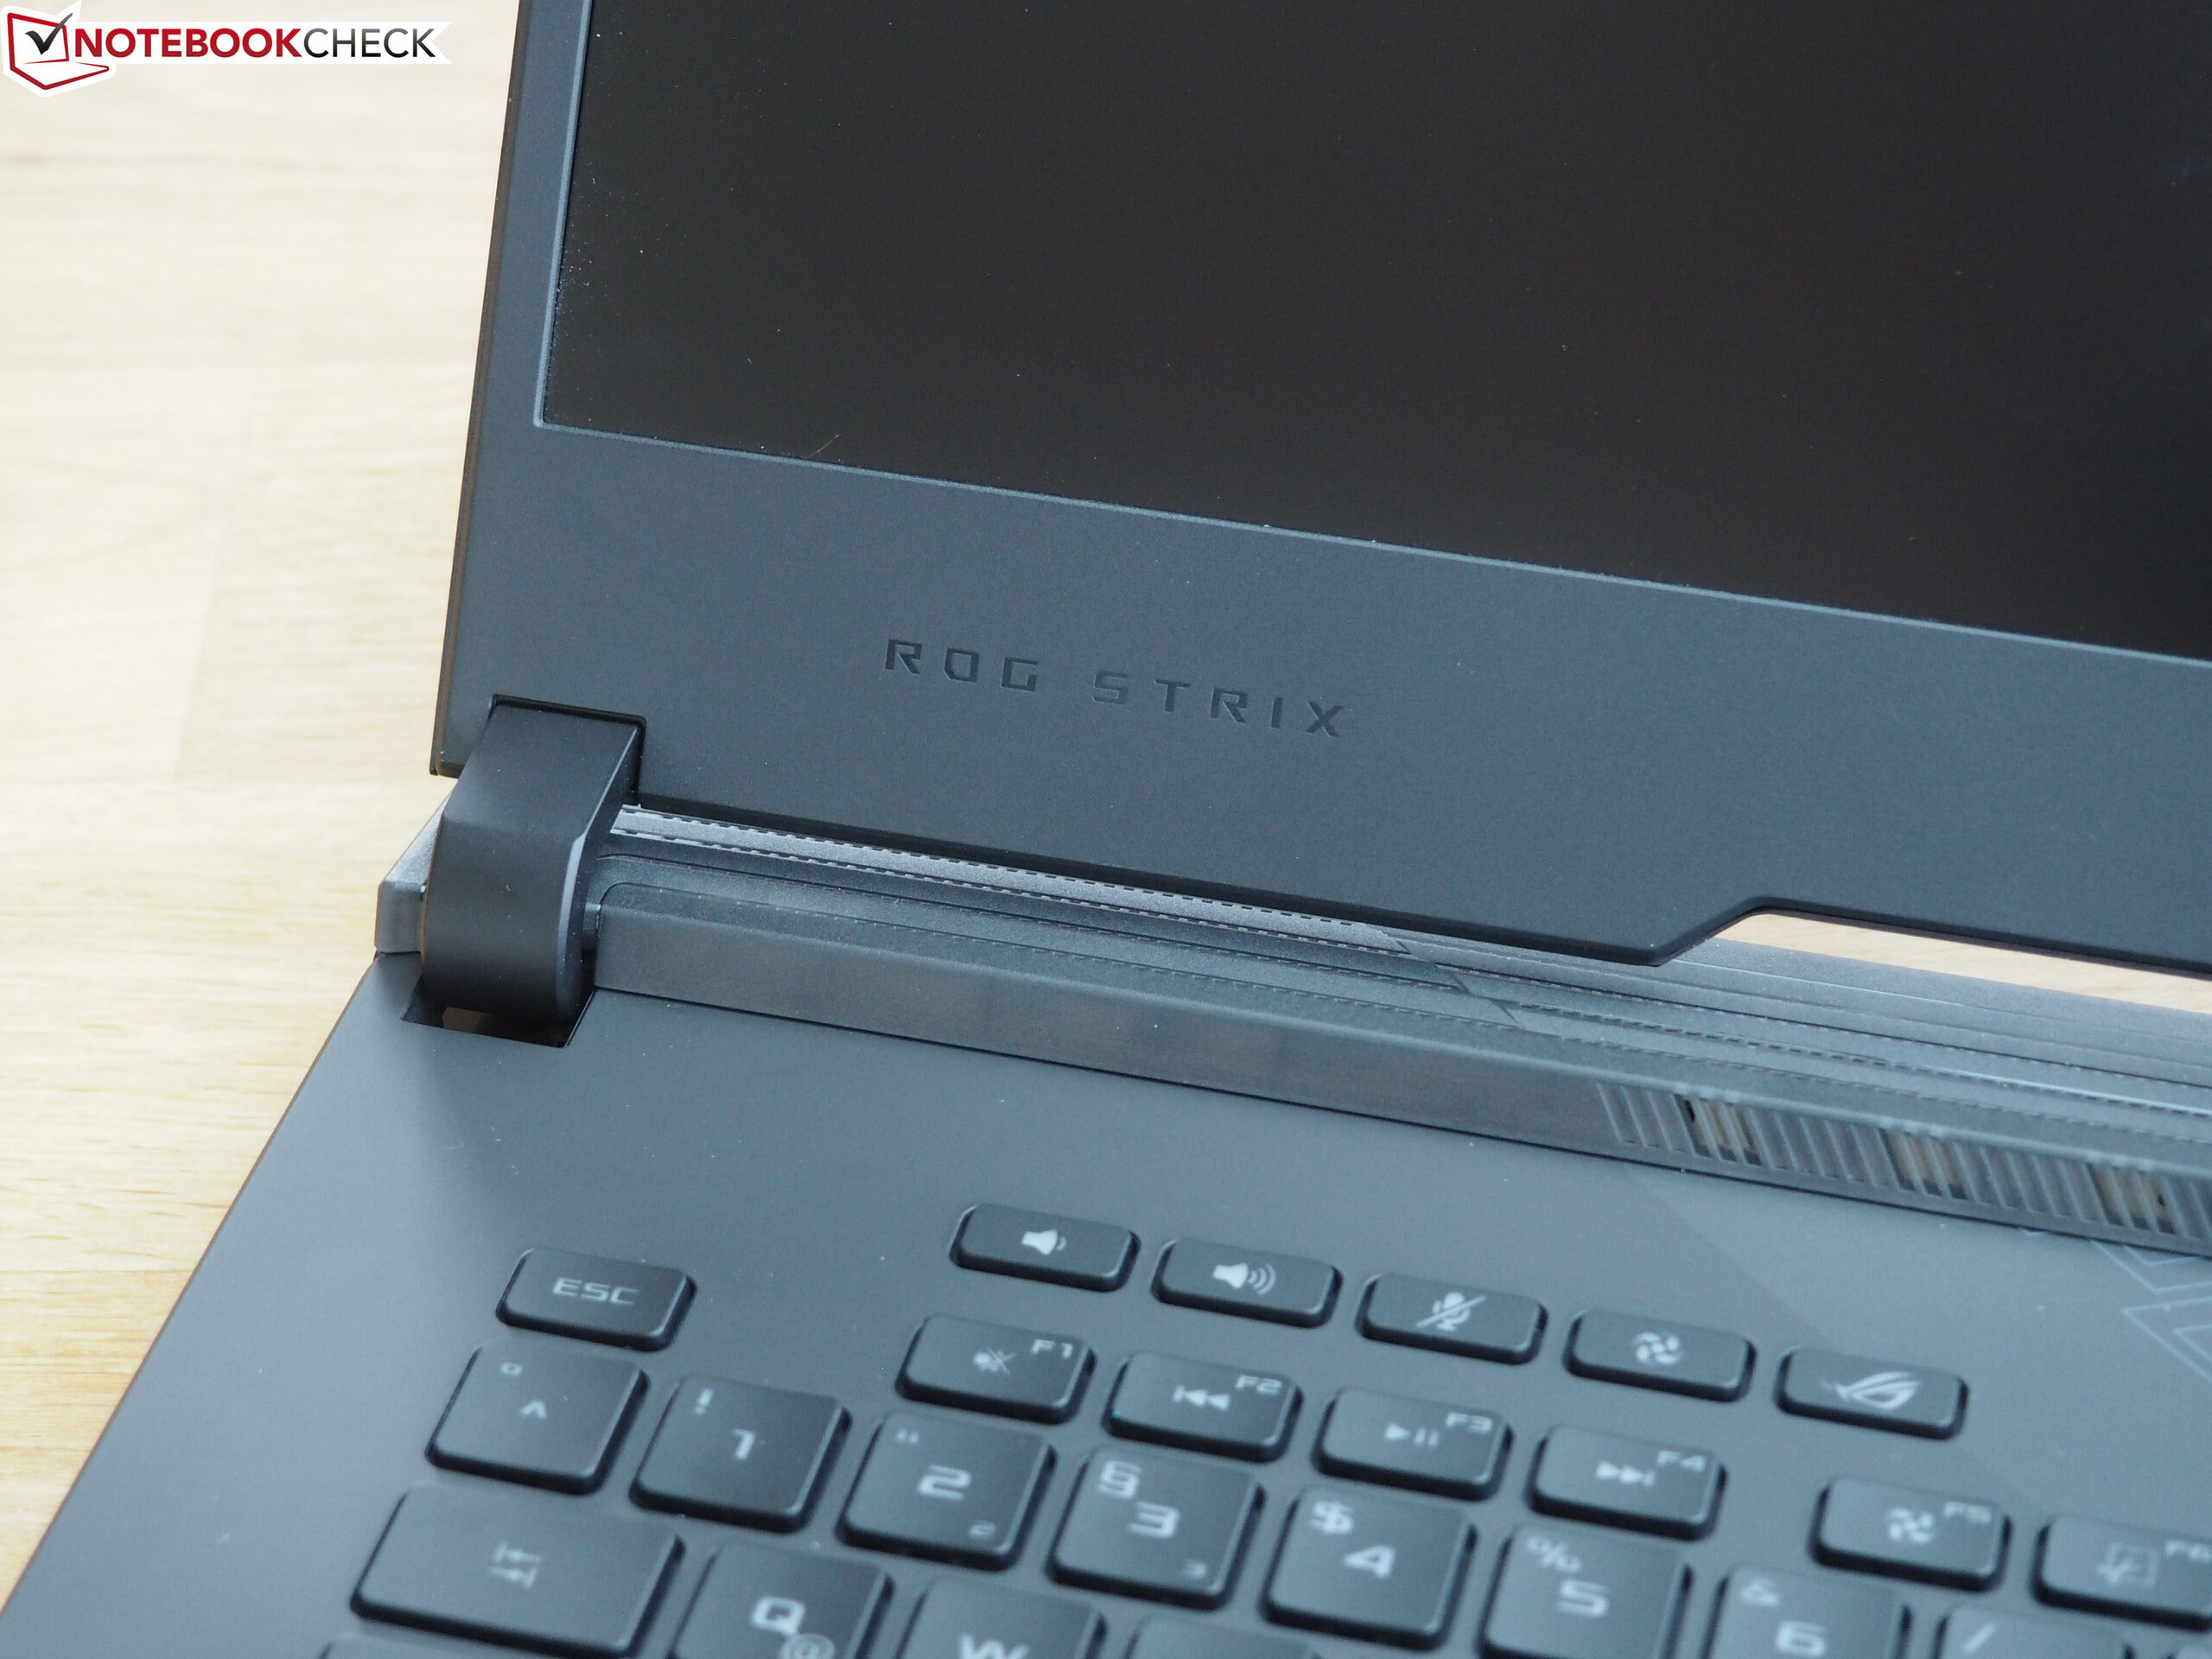
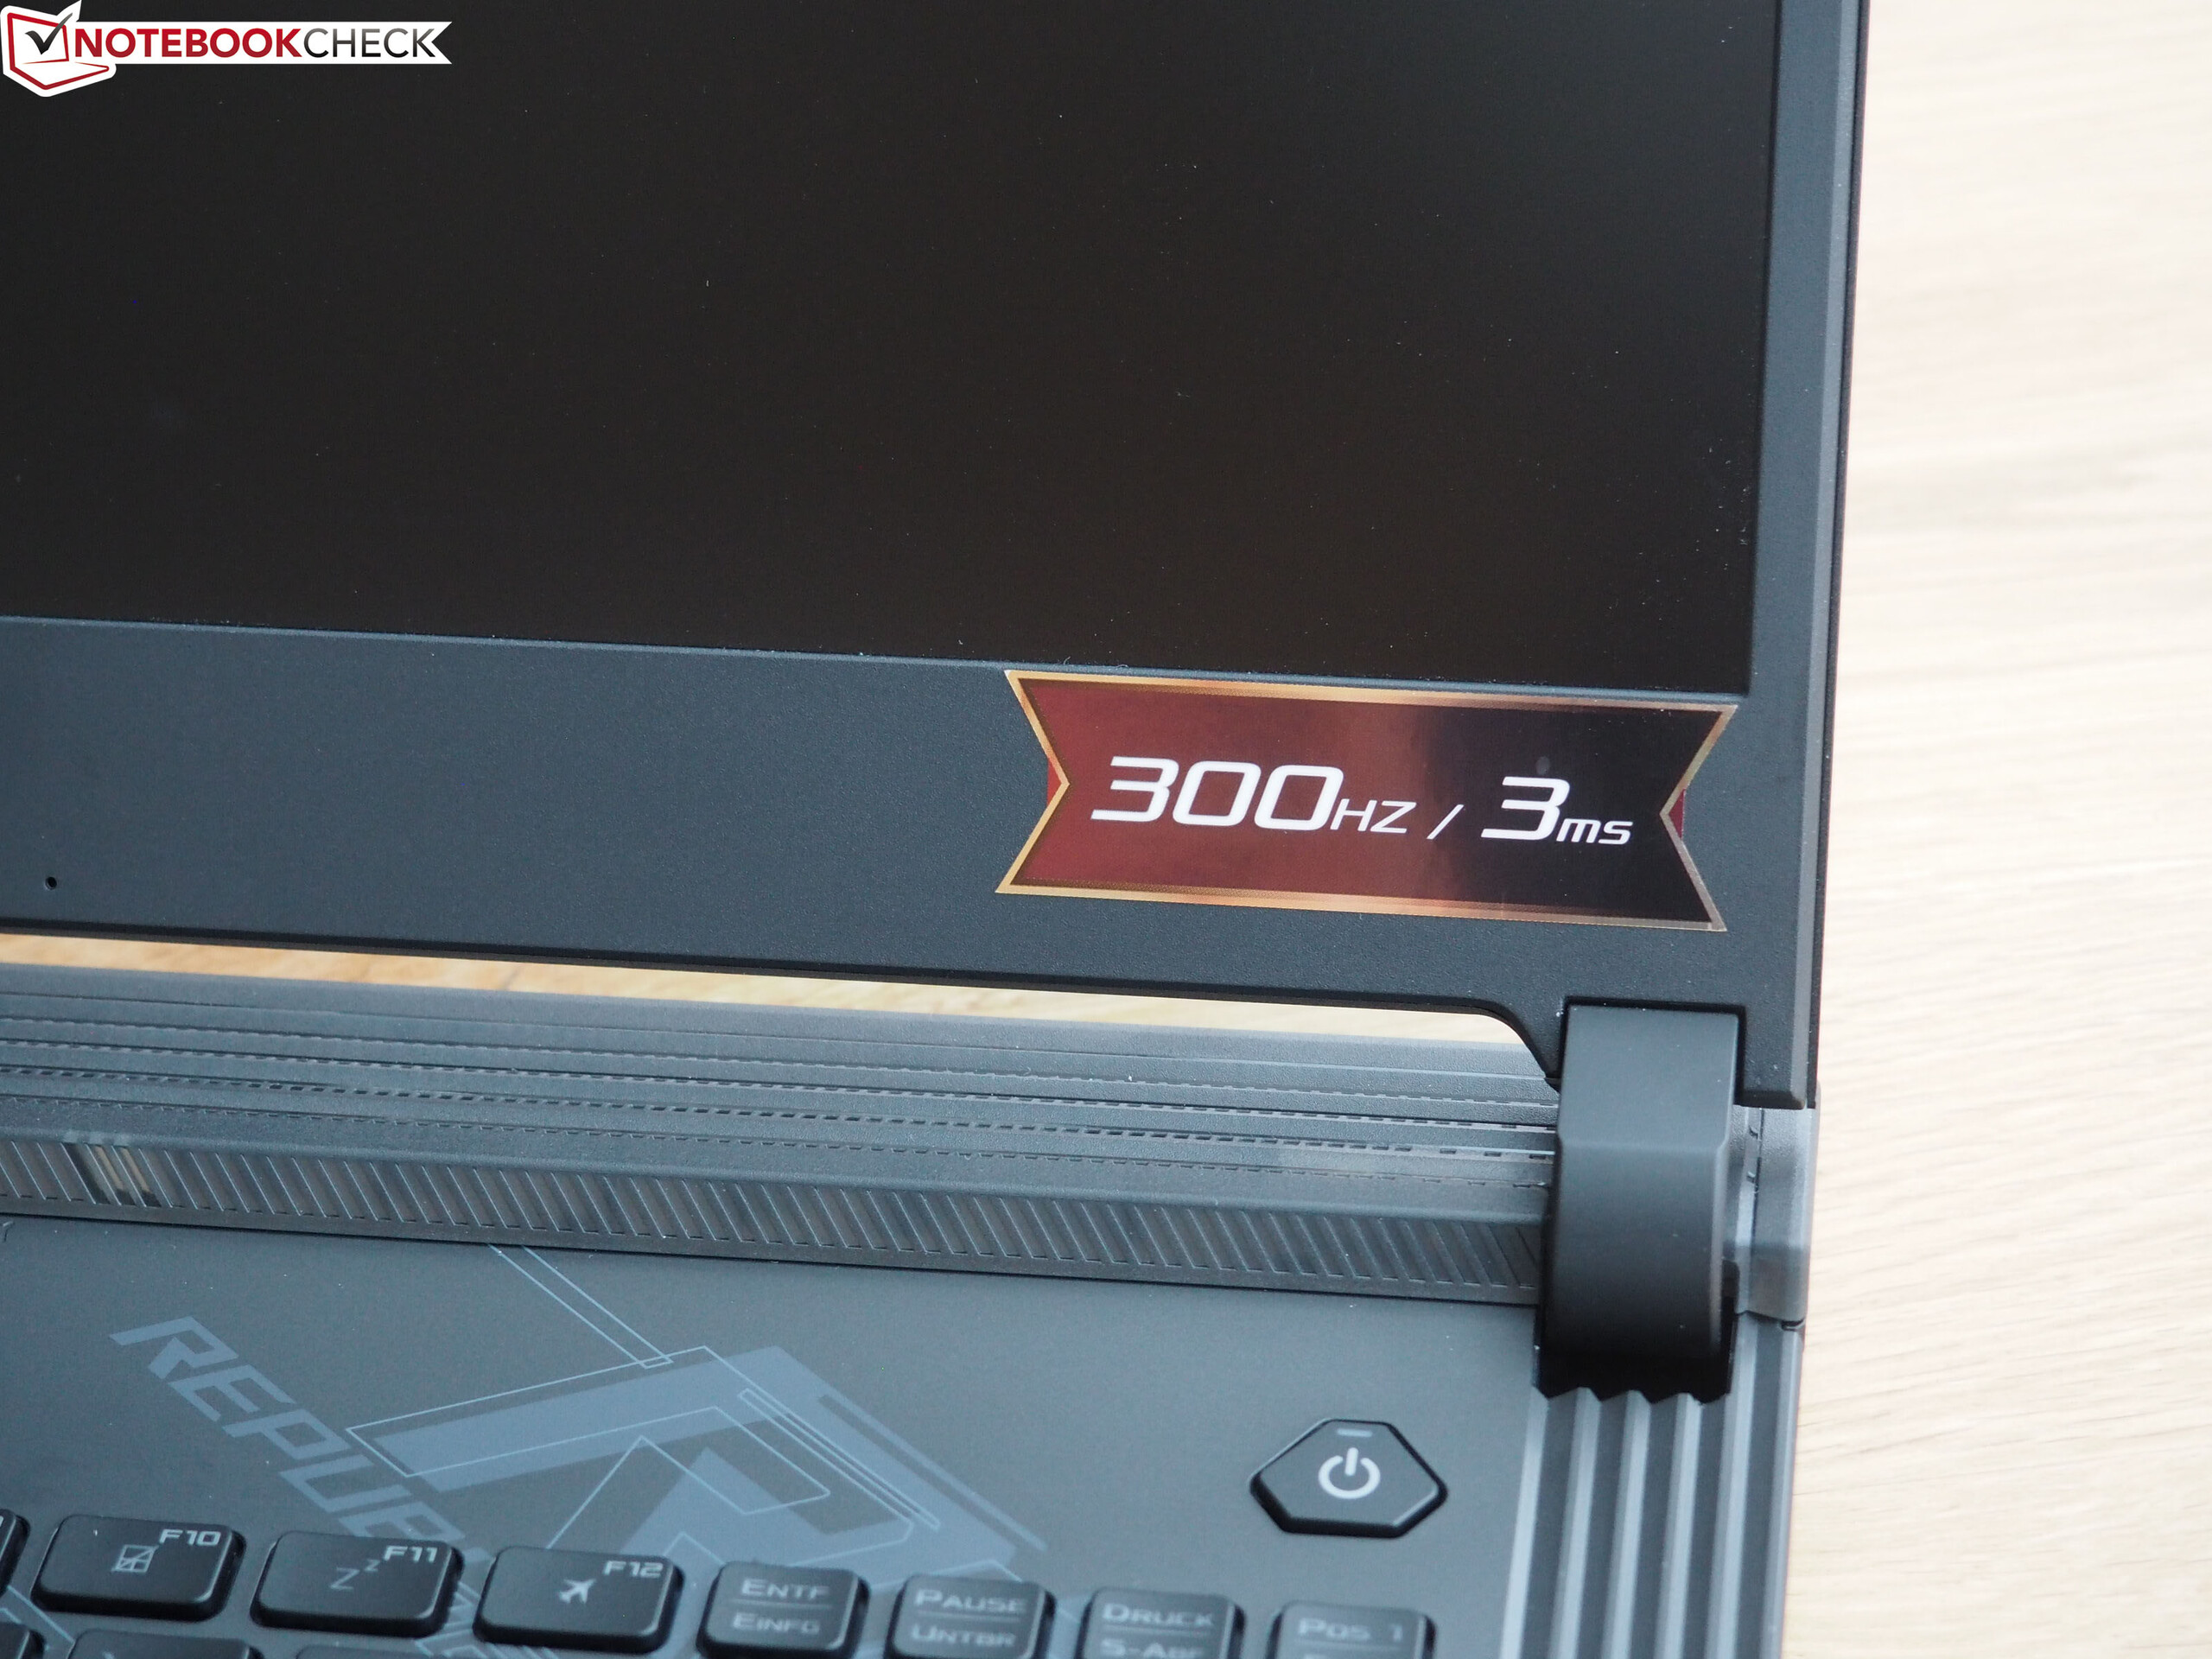
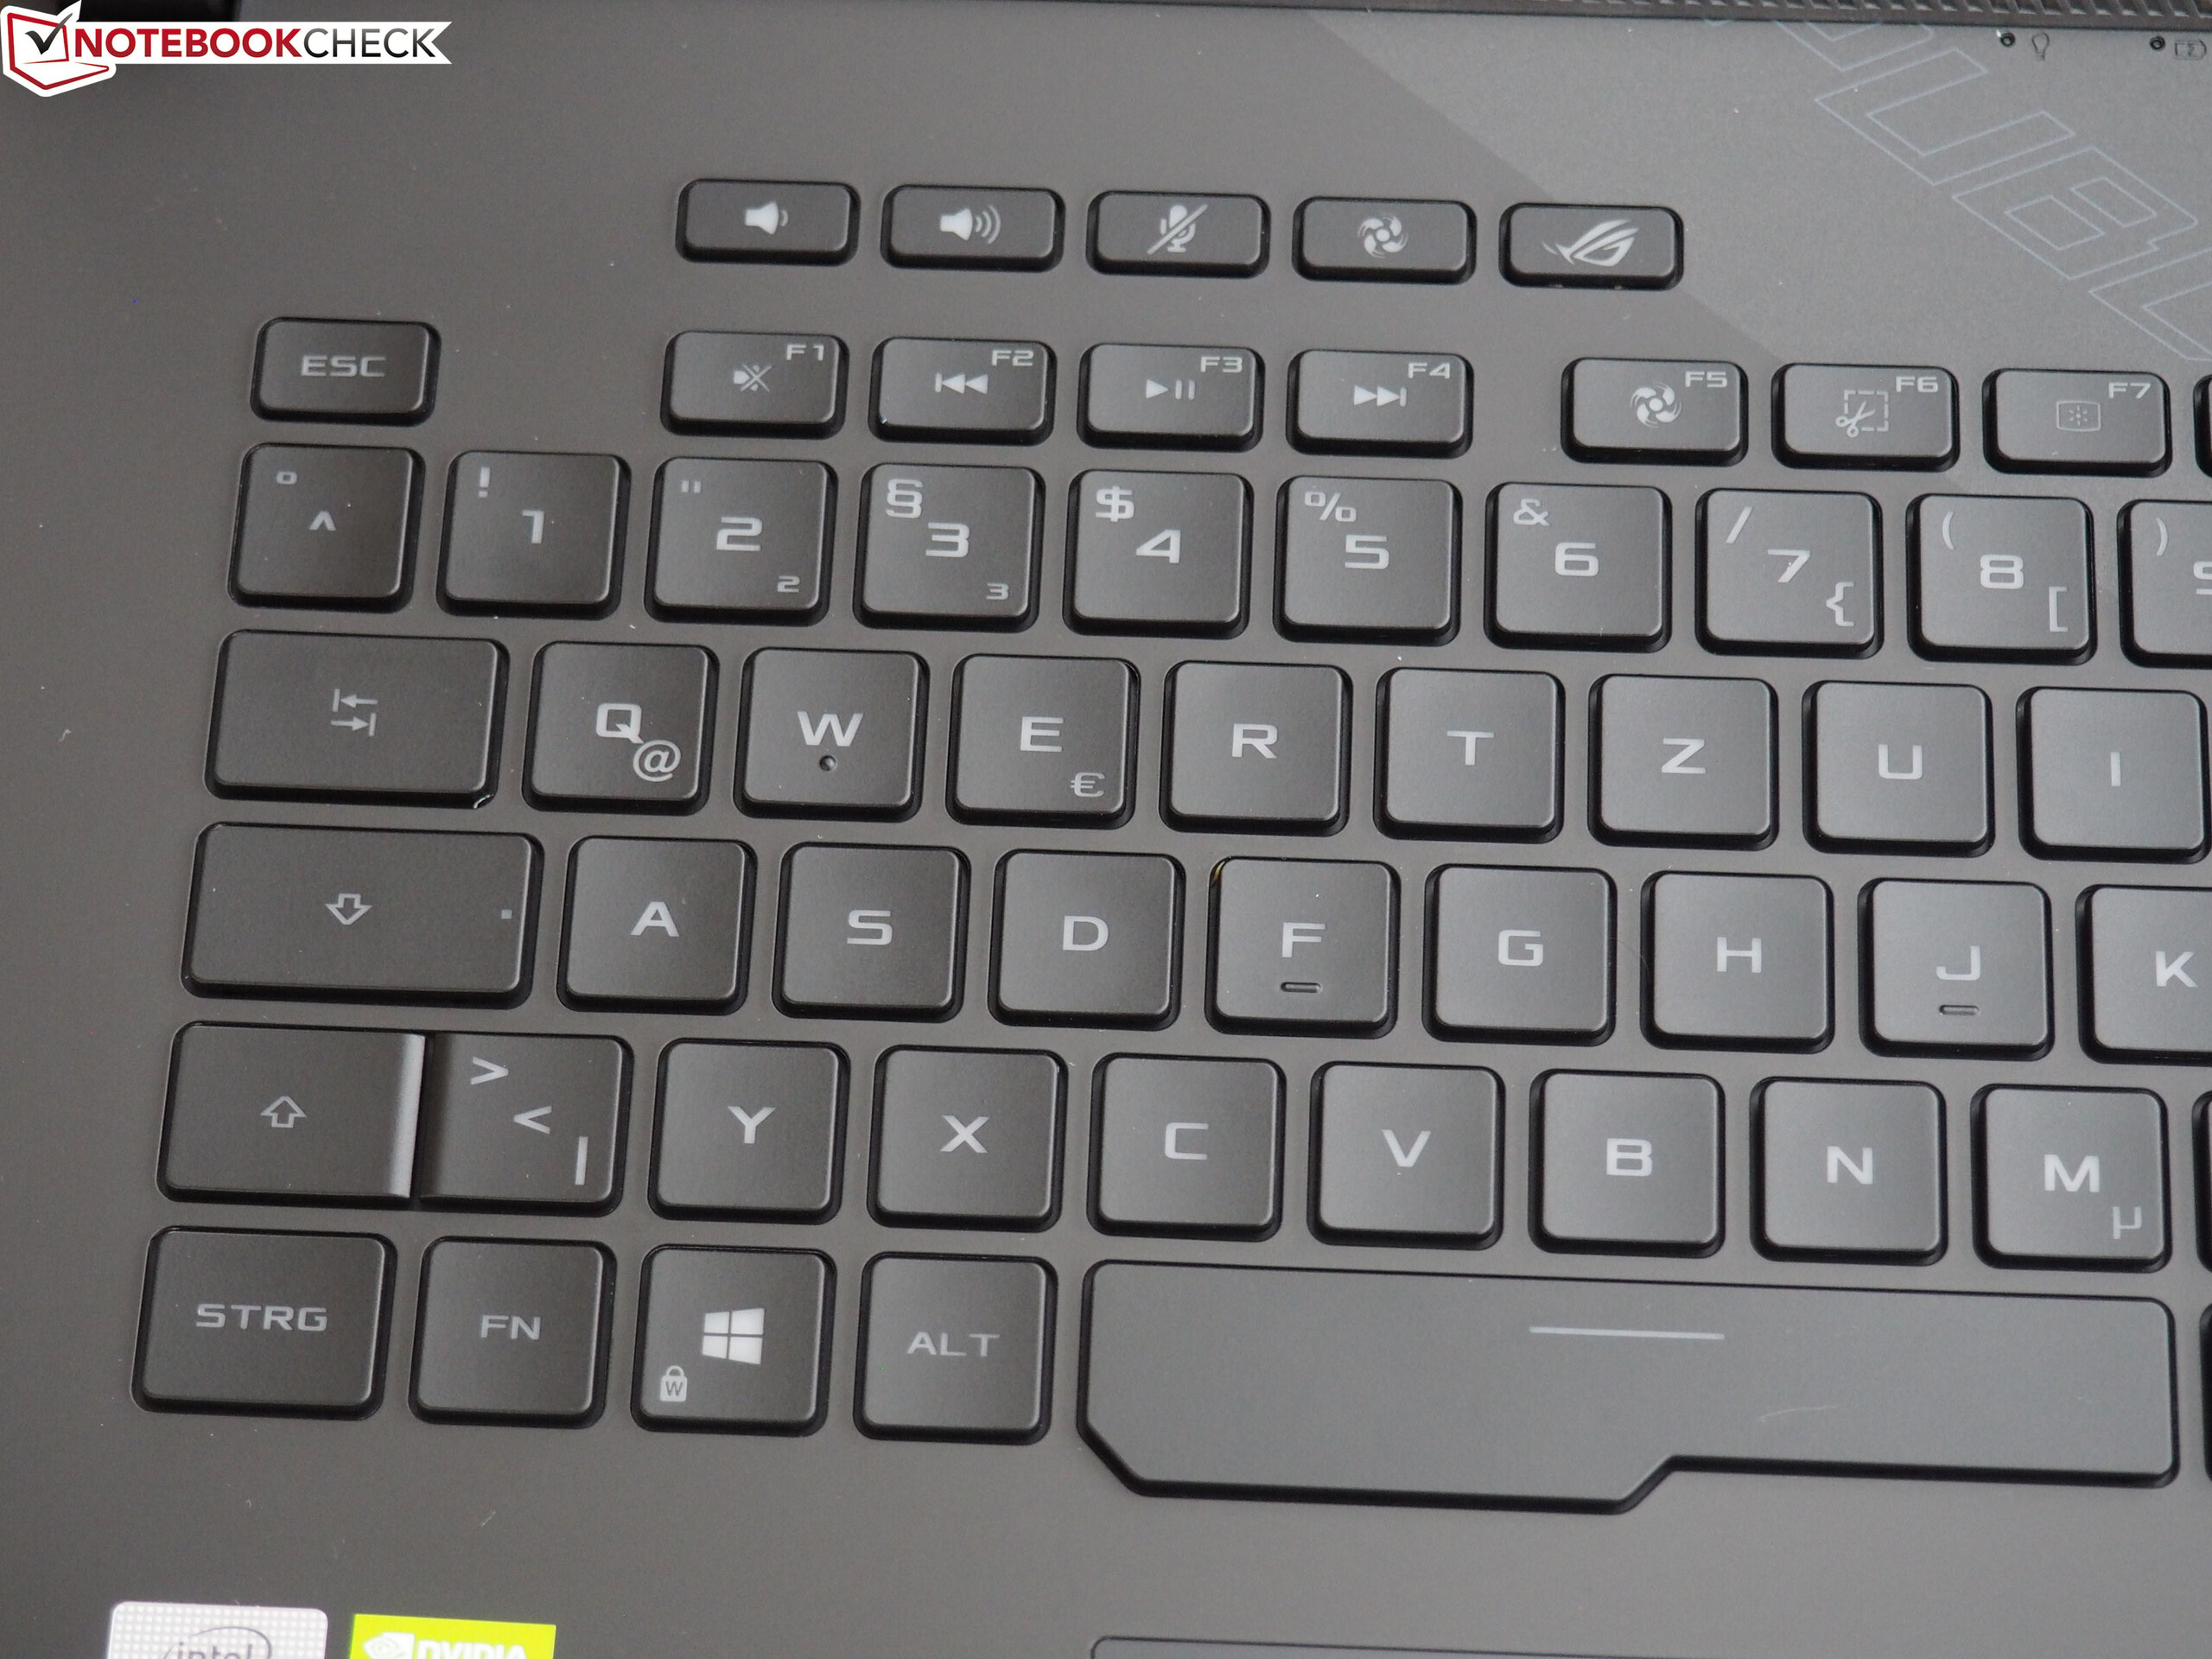
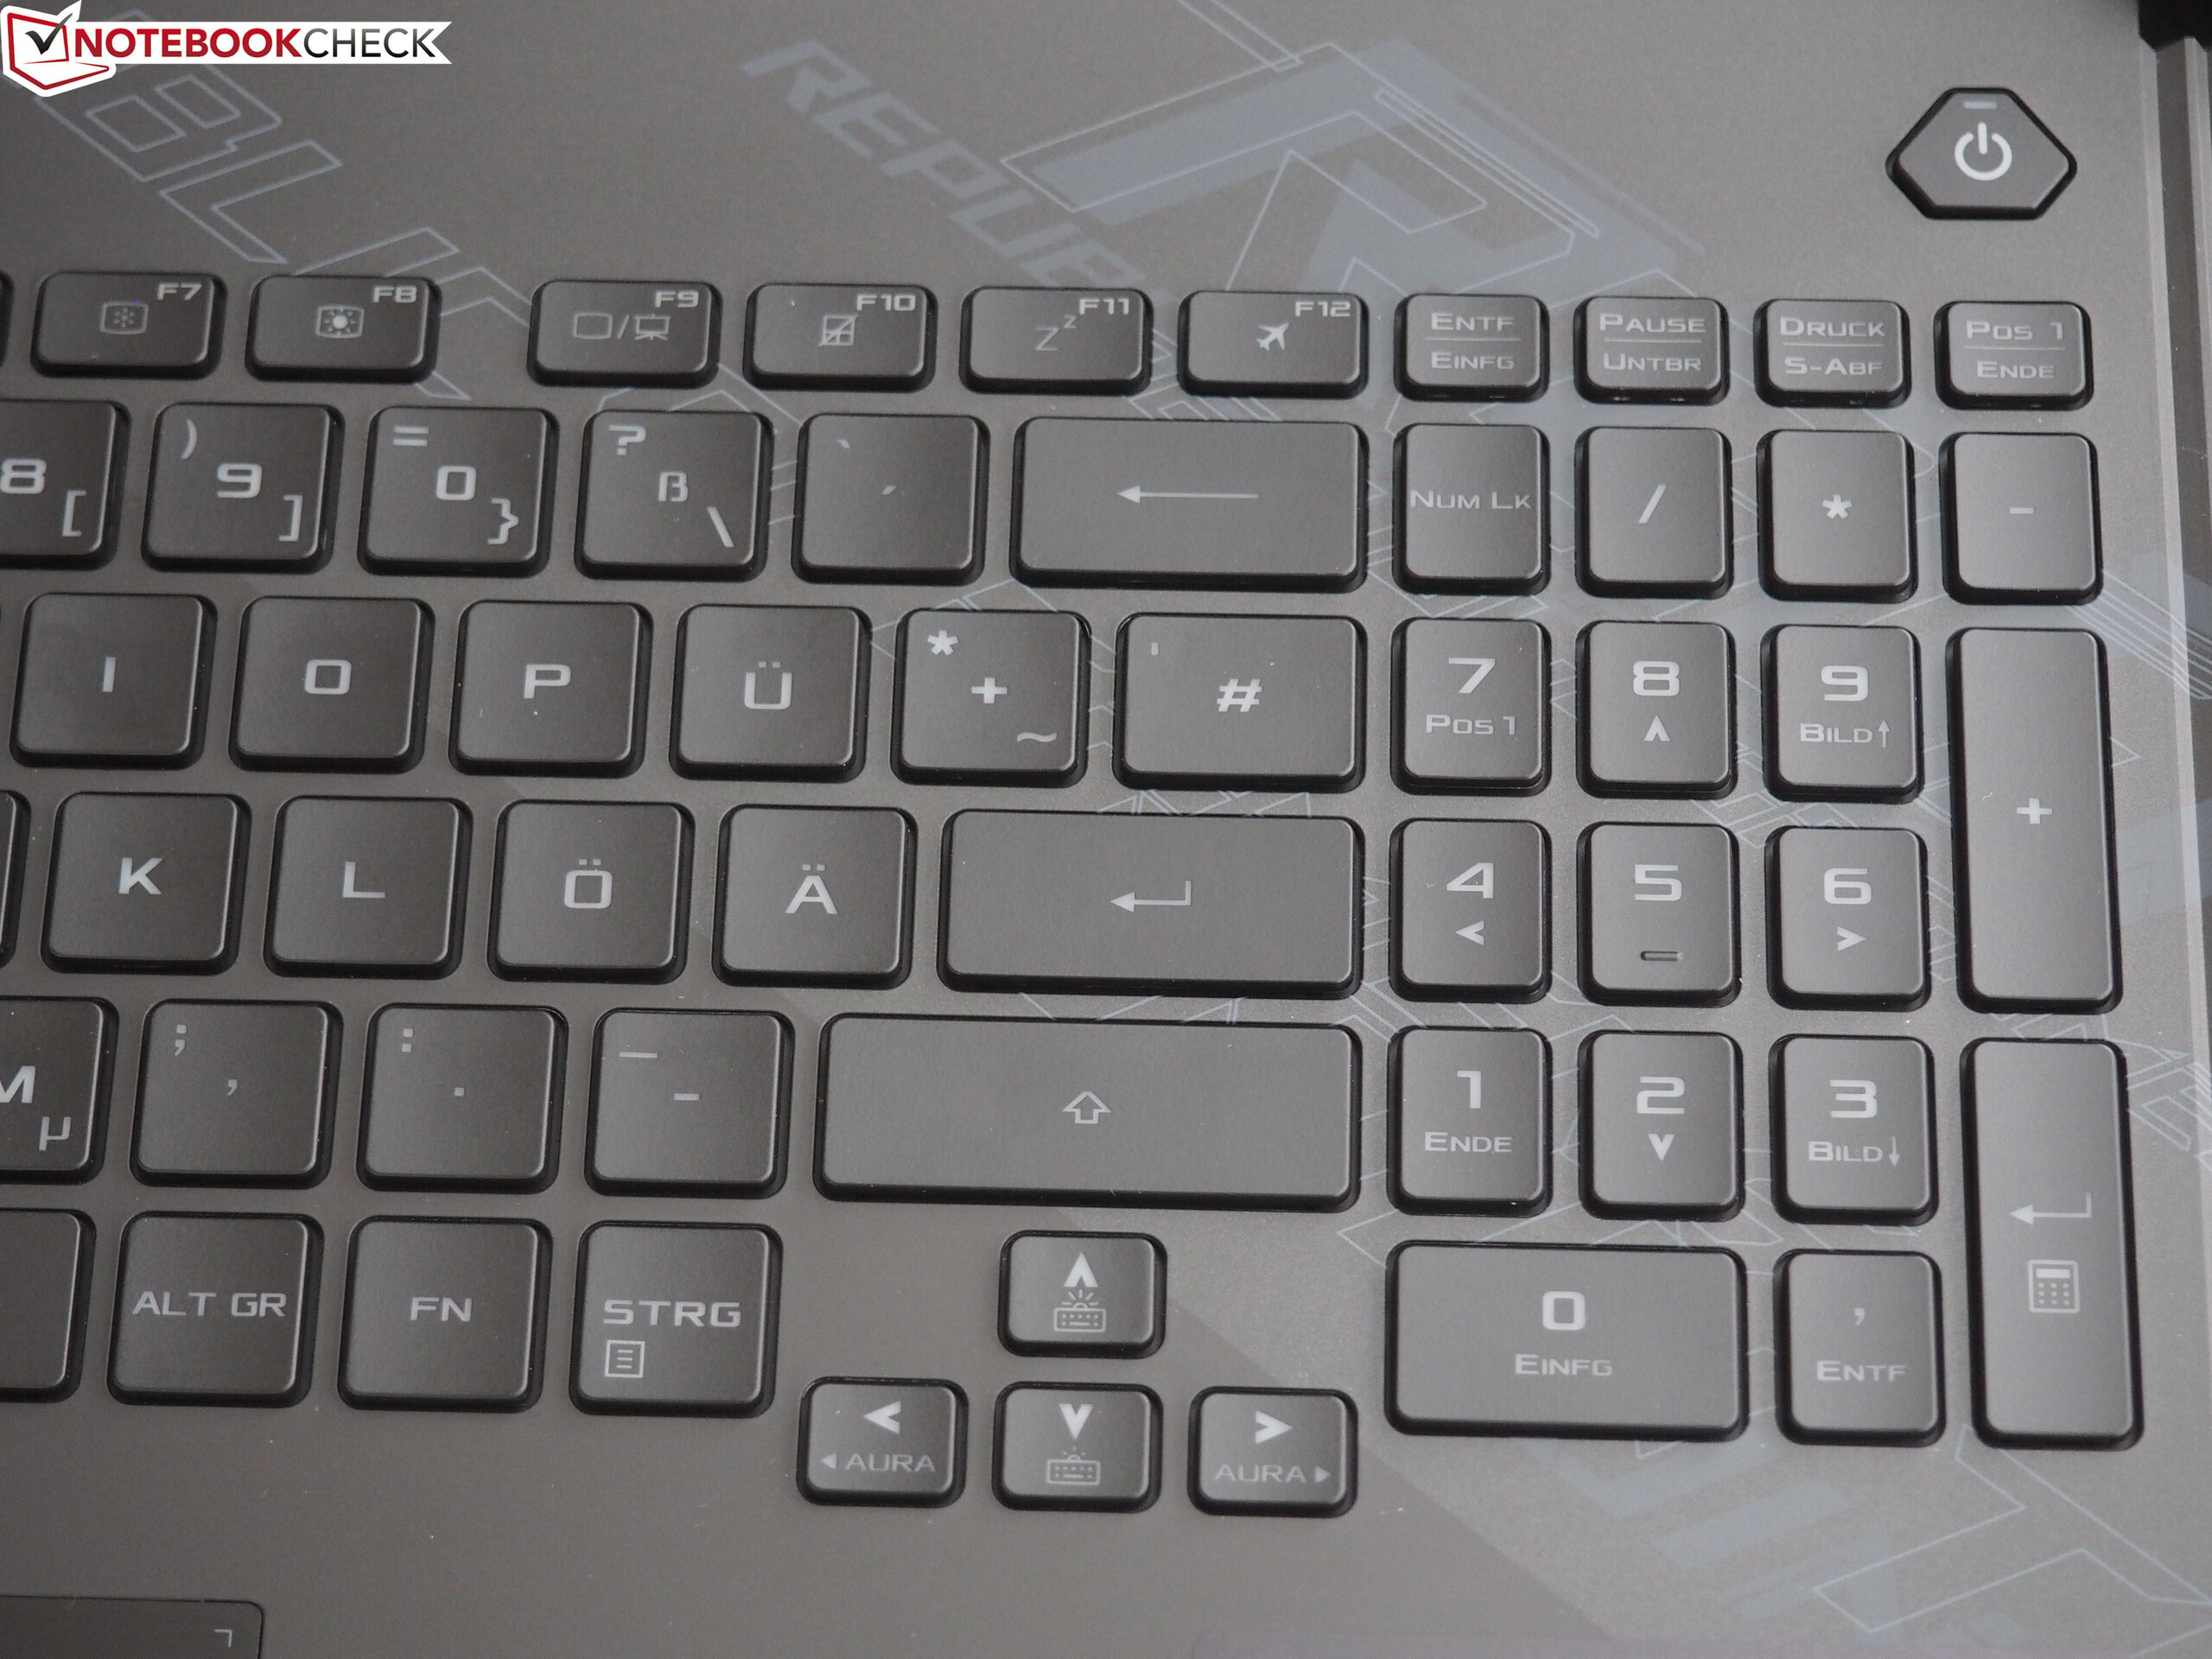
Cela mis à part, nous avons vraiment apprécié ce 17 pouces. Le Scar 17 devance la plupart de ses concurrents grâce à son écran (300 Hz !), ses périphériques d'entrée, le son et l'autonomie. Cependant, le ratio performances / prix pourrait être meilleur avec un modèle moins cher équipé d'un Core i7-10875H et d'une GeForce RTX 2070 (Super), qui restera également sans doute moins chaud et moins bruyant.
L’intégralité de cette critique est disponible en anglais en suivant ce lien.
Asus Strix Scar 17 G732LXS
- 07/12/2020 v7 (old)
Florian Glaser
Price comparison