Notebookcheck Logo

Test du Huawei MateBook 13 2020 (Ryzen 5 3500U, Vega 8, FHD+) : un portable Ryzen n'est pas toujours le meilleur choix

Attractif mais peu autonome. Comparativement compact et encore moins cher que la version Intel, le MateBook 13 est équipé d'une puce AMD. Notre rapport de test va dévoiler s'il est plus intéressant ou non de dépenser un peu plus.
Huawei MateBook 13 2020 AMD (MateBook Gamme)
Processeur
AMD Ryzen 5 3500U 4 x 2.1 - 3.7 GHz, Picasso-U (Zen+)
Carte graphique
AMD Radeon RX Vega 8 (Ryzen 2000/3000)
Mémoire
8 Go 
, Samsung, LPDDR4, 2400 MHz
Écran
13.00 pouces 3:2, 2160 x 1440 pixel 200 PPP, Chi Mei CMN8201 P130ZFA-BA1, IPS, brillant: oui, 60 Hz
Carte mère
AMD Promontory/Bixby FCH
Disque dur
WDC PC SN730 SDBPNTY-512G, 512 Go 
, 422.2 Go libres
Carte son
AMD Rave/Renoir - Audio Processor - HD Audio Controller
Connexions
2 USB 3.0 / 3.1 Gen1, 1 DisplayPort, Connectique audio: jack 3,5 mm, 1 Lecteur d'empreintes digitales, NFC, Capteur de luminosité, Capteurs: capteur thermique et capteur à effet Hall
Réseau
Realtek 8822CE Wireless LAN 802.11ac PCI-E NIC (a/b/g/n = Wi-Fi 4/ac = Wi-Fi 5/), Bluetooth 5.0
Taille
Hauteur x Largeur x Profondeur (en mm): 14.9 x 286 x 211
Batterie
41.7 Wh, 3660 mAh Lithium-Polymère, 11,4 V, Autonomie de la batterie (selon les données du fabricant): 7.5 h
Système d'exploitation
Microsoft Windows 10 Home 64 Bit
Appareil photo
Appareil photo primaire: 1 MPix
Fonctionnalités additionnelles
Haut-parleurs: stéréo, Clavier: chiclet, Rétroéclairage du clavier: oui, adaptateur secteur 65 watts (USB C), câble USB, adaptateur USB C vers USB A, guide de démarrage rapide, 24 Mois Garantie, Huawei Share, PC Manager
Poids
1.317 kg, Alimentation: 198 g
Prix
799 euros
Remarque : le fabricant peut utiliser des composants provenant de différents fournisseurs, notamment des panneaux d'affichage, des lecteurs ou des clés USB ayant des spécifications similaires.


Note
Date
Modèle
Poids
Épaisseur
Taille
Résolution
Meilleur prix
84 %
08/20
Huawei MateBook 13 2020 AMD
R5 3500U, Vega 8
1.3 kg14.9 mm13.00"2160x1440
84.4 %
07/20
Huawei MateBook 13 2020 i5
i5-10210U, UHD Graphics 620
1.3 kg14.9 mm13.00"2160x1440
88 %
05/20
Apple MacBook Air 2020 i5
i5-1030NG7, Iris Plus Graphics G7 (Ice Lake 64 EU)
1.3 kg16.1 mm13.30"2560x1600
88.8 %
04/20
Dell XPS 13 9300 i5 FHD
i5-1035G1, UHD Graphics G1 (Ice Lake 32 EU)
1.2 kg14.8 mm13.40"1920x1200
85.9 %
07/20
Acer Swift 3 SF313-52-52AS
i5-1035G4, Iris Plus Graphics G4 (Ice Lake 48 EU)
1.2 kg16.6 mm13.50"2256x1504
Networking
iperf3 transmit AX12
Moyenne de la classe Subnotebook
  (606 - 1339, n=3, 2 dernières années)
1056 MBit/s +59%
Dell XPS 13 9300 i5 FHD
Intel Killer Wi-Fi 6 AX1650s
906 MBit/s +36%
Huawei MateBook 13 2020 i5
Intel Wireless-AC 9560
708 (684min - 720max) MBit/s +6%
Acer Swift 3 SF313-52-52AS
Intel Wi-Fi 6 AX201
696 (679min - 711max) MBit/s +5%
Huawei MateBook 13 2020 AMD
Realtek 8822CE Wireless LAN 802.11ac PCI-E NIC
666 (328min - 692max) MBit/s
Moyenne Realtek 8822CE Wireless LAN 802.11ac PCI-E NIC
  (87 - 690, n=29)
618 MBit/s -7%
Apple MacBook Air 2020 i5
802.11 a/b/g/n/ac
550 (546min - 561max) MBit/s -17%
iperf3 receive AX12
Dell XPS 13 9300 i5 FHD
Intel Killer Wi-Fi 6 AX1650s
1460 MBit/s +124%
Moyenne de la classe Subnotebook
  (623 - 1690, n=3, 2 dernières années)
1258 MBit/s +93%
Acer Swift 3 SF313-52-52AS
Intel Wi-Fi 6 AX201
870 (832min - 928max) MBit/s +33%
Huawei MateBook 13 2020 AMD
Realtek 8822CE Wireless LAN 802.11ac PCI-E NIC
652 (639min - 661max) MBit/s
Huawei MateBook 13 2020 i5
Intel Wireless-AC 9560
627 (579min - 673max) MBit/s -4%
Moyenne Realtek 8822CE Wireless LAN 802.11ac PCI-E NIC
  (486 - 685, n=29)
622 MBit/s -5%
Apple MacBook Air 2020 i5
802.11 a/b/g/n/ac
612 (576min - 636max) MBit/s -6%
04080120160200240280320360400440480520560600640680Tooltip
Huawei MateBook 13 2020 AMD; iperf3 receive AX12; iperf 3.1.3: Ø652 (639-661)
Huawei MateBook 13 2020 AMD; iperf3 transmit AX12; iperf 3.1.3: Ø656 (328-692)
03570105140175210245280315350385420455490525560595630665Tooltip
Huawei MateBook 13 2020 AMD AMD Ryzen 5 3500U, AMD Ryzen 5 3500U: Ø571 (564.95-646.42)
Huawei MateBook 13 2020 i5 Intel Core i5-10210U, Intel Core i5-10210U: Ø530 (520.93-665.09)
Apple MacBook Air 2020 i5 Intel Core i5-1030NG7, Intel Core i5-1030NG7; macOS 10.15: Ø401 (363.09-448.1)
HP EliteBook 735 G6 7KN29EA AMD Ryzen 5 PRO 3500U, AMD Ryzen 5 PRO 3500U: Ø561 (547.56-636.74)
Cinebench R20: CPU (Single Core) | CPU (Multi Core)
Cinebench R15: CPU Single 64Bit | CPU Multi 64Bit
Blender: v2.79 BMW27 CPU
7-Zip 18.03: 7z b 4 -mmt1 | 7z b 4
Geekbench 5.5: Single-Core | Multi-Core
HWBOT x265 Benchmark v2.2: 4k Preset
LibreOffice : 20 Documents To PDF
R Benchmark 2.5: Overall mean
Cinebench R20 / CPU (Single Core)
Moyenne de la classe Subnotebook
  (216 - 738, n=64, 2 dernières années)
602 Points +63%
Dell XPS 13 9300 i5 FHD
Intel Core i5-1035G1
425 Points +15%
Huawei MateBook 13 2020 i5
Intel Core i5-10210U
421 Points +14%
Apple MacBook Air 2020 i5
Intel Core i5-1030NG7
375 Points +1%
Apple MacBook Air 2020 i5
Intel Core i5-1030NG7
330 Points -11%
Huawei MateBook 13 2020 AMD
AMD Ryzen 5 3500U
370 Points
Acer Swift 3 SF313-52-52AS
Intel Core i5-1035G4
357 Points -4%
Acer Swift 3 SF313-52-52AS
Intel Core i5-1035G4
357 Points -4%
HP EliteBook 735 G6 7KN29EA
AMD Ryzen 5 PRO 3500U
354 Points -4%
Moyenne AMD Ryzen 5 3500U
  (317 - 372, n=15)
354 Points -4%
Cinebench R20 / CPU (Multi Core)
Moyenne de la classe Subnotebook
  (810 - 6314, n=64, 2 dernières années)
3825 Points +182%
Dell XPS 13 9300 i5 FHD
Intel Core i5-1035G1
1533 Points +13%
Moyenne AMD Ryzen 5 3500U
  (1063 - 1540, n=15)
1436 Points +6%
Huawei MateBook 13 2020 AMD
AMD Ryzen 5 3500U
1355 Points
HP EliteBook 735 G6 7KN29EA
AMD Ryzen 5 PRO 3500U
1328 Points -2%
Huawei MateBook 13 2020 i5
Intel Core i5-10210U
1325 Points -2%
Apple MacBook Air 2020 i5
Intel Core i5-1030NG7
987 Points -27%
Apple MacBook Air 2020 i5
Intel Core i5-1030NG7
764 Points -44%
Acer Swift 3 SF313-52-52AS
Intel Core i5-1035G4
892 Points -34%
Acer Swift 3 SF313-52-52AS
Intel Core i5-1035G4
892 Points -34%
Cinebench R15 / CPU Single 64Bit
Moyenne de la classe Subnotebook
  (91.8 - 280, n=62, 2 dernières années)
234 Points +62%
Huawei MateBook 13 2020 i5
Intel Core i5-10210U
168 Points +16%
Dell XPS 13 9300 i5 FHD
Intel Core i5-1035G1
166 Points +15%
Acer Swift 3 SF313-52-52AS
Intel Core i5-1035G4
146.4 Points +1%
Huawei MateBook 13 2020 AMD
AMD Ryzen 5 3500U
144.5 Points
Moyenne AMD Ryzen 5 3500U
  (131 - 147, n=18)
142.4 Points -1%
Apple MacBook Air 2020 i5
Intel Core i5-1030NG7
140 Points -3%
HP EliteBook 735 G6 7KN29EA
AMD Ryzen 5 PRO 3500U
140 Points -3%
Cinebench R15 / CPU Multi 64Bit
Moyenne de la classe Subnotebook
  (514 - 2581, n=70, 2 dernières années)
1705 Points +164%
Dell XPS 13 9300 i5 FHD
Intel Core i5-1035G1
667 Points +3%
Dell XPS 13 9300 i5 FHD
Intel Core i5-1035G1
659 Points +2%
Huawei MateBook 13 2020 i5
Intel Core i5-10210U
665 (520.93min - 665.09max) Points +3%
Huawei MateBook 13 2020 AMD
AMD Ryzen 5 3500U
646 (564.95min - 646.42max) Points
Moyenne AMD Ryzen 5 3500U
  (482 - 682, n=19)
642 Points -1%
HP EliteBook 735 G6 7KN29EA
AMD Ryzen 5 PRO 3500U
637 (547.56min - 636.74max) Points -1%
Acer Swift 3 SF313-52-52AS
Intel Core i5-1035G4
490.1 (289.98min - 451.62max) Points -24%
Apple MacBook Air 2020 i5
Intel Core i5-1030NG7
448 (363min - 448max) Points -31%
Blender / v2.79 BMW27 CPU
Apple MacBook Air 2020 i5
Intel Core i5-1030NG7
1310 Seconds * -65%
Acer Swift 3 SF313-52-52AS
Intel Core i5-1035G4
1016 Seconds * -28%
Acer Swift 3 SF313-52-52AS
Intel Core i5-1035G4
1016 Seconds * -28%
Huawei MateBook 13 2020 i5
Intel Core i5-10210U
826 Seconds * -4%
HP EliteBook 735 G6 7KN29EA
AMD Ryzen 5 PRO 3500U
805 Seconds * -1%
Huawei MateBook 13 2020 AMD
AMD Ryzen 5 3500U
796 Seconds *
Dell XPS 13 9300 i5 FHD
Intel Core i5-1035G1
766 Seconds * +4%
Moyenne AMD Ryzen 5 3500U
  (680 - 796, n=10)
704 Seconds * +12%
Moyenne de la classe Subnotebook
  (201 - 1600, n=66, 2 dernières années)
397 Seconds * +50%
7-Zip 18.03 / 7z b 4 -mmt1
Moyenne de la classe Subnotebook
  (2197 - 6403, n=58, 2 dernières années)
5278 MIPS +51%
Huawei MateBook 13 2020 i5
Intel Core i5-10210U
4324 MIPS +23%
Dell XPS 13 9300 i5 FHD
Intel Core i5-1035G1
4087 MIPS +17%
Acer Swift 3 SF313-52-52AS
Intel Core i5-1035G4
4048 MIPS +16%
Acer Swift 3 SF313-52-52AS
Intel Core i5-1035G4
4048 MIPS +16%
Moyenne AMD Ryzen 5 3500U
  (3502 - 3580, n=10)
3541 MIPS +1%
Huawei MateBook 13 2020 AMD
AMD Ryzen 5 3500U
3502 MIPS
Apple MacBook Air 2020 i5
Intel Core i5-1030NG7
3472 MIPS -1%
HP EliteBook 735 G6 7KN29EA
AMD Ryzen 5 PRO 3500U
3432 MIPS -2%
7-Zip 18.03 / 7z b 4
Moyenne de la classe Subnotebook
  (16223 - 67444, n=57, 2 dernières années)
43017 MIPS +172%
Dell XPS 13 9300 i5 FHD
Intel Core i5-1035G1
18535 MIPS +17%
Moyenne AMD Ryzen 5 3500U
  (15825 - 17508, n=10)
16929 MIPS +7%
Huawei MateBook 13 2020 i5
Intel Core i5-10210U
16685 MIPS +5%
HP EliteBook 735 G6 7KN29EA
AMD Ryzen 5 PRO 3500U
15910 MIPS +1%
Huawei MateBook 13 2020 AMD
AMD Ryzen 5 3500U
15825 MIPS
Acer Swift 3 SF313-52-52AS
Intel Core i5-1035G4
13057 MIPS -17%
Acer Swift 3 SF313-52-52AS
Intel Core i5-1035G4
13057 MIPS -17%
Apple MacBook Air 2020 i5
Intel Core i5-1030NG7
10924 MIPS -31%
Geekbench 5.5 / Single-Core
Moyenne de la classe Subnotebook
  (672 - 2350, n=66, 2 dernières années)
1677 Points +88%
Dell XPS 13 9300 i5 FHD
Intel Core i5-1035G1
1229 Points +37%
Apple MacBook Air 2020 i5
Intel Core i5-1030NG7
1167 Points +31%
Apple MacBook Air 2020 i5
Intel Core i5-1030NG7
1010 Points +13%
Huawei MateBook 13 2020 i5
Intel Core i5-10210U
1094 Points +22%
Acer Swift 3 SF313-52-52AS
Intel Core i5-1035G4
1081 Points +21%
Acer Swift 3 SF313-52-52AS
Intel Core i5-1035G4
1081 Points +21%
Huawei MateBook 13 2020 AMD
AMD Ryzen 5 3500U
894 Points
Moyenne AMD Ryzen 5 3500U
  (777 - 905, n=8)
884 Points -1%
HP EliteBook 735 G6 7KN29EA
AMD Ryzen 5 PRO 3500U
863 Points -3%
Geekbench 5.5 / Multi-Core
Moyenne de la classe Subnotebook
  (4213 - 12580, n=66, 2 dernières années)
8762 Points +185%
Dell XPS 13 9300 i5 FHD
Intel Core i5-1035G1
4372 Points +42%
Huawei MateBook 13 2020 i5
Intel Core i5-10210U
4119 Points +34%
Acer Swift 3 SF313-52-52AS
Intel Core i5-1035G4
3261 Points +6%
Acer Swift 3 SF313-52-52AS
Intel Core i5-1035G4
3261 Points +6%
Huawei MateBook 13 2020 AMD
AMD Ryzen 5 3500U
3076 Points
Moyenne AMD Ryzen 5 3500U
  (2543 - 3234, n=8)
3076 Points 0%
Apple MacBook Air 2020 i5
Intel Core i5-1030NG7
2881 Points -6%
Apple MacBook Air 2020 i5
Intel Core i5-1030NG7
2539 Points -17%
HP EliteBook 735 G6 7KN29EA
AMD Ryzen 5 PRO 3500U
2824 Points -8%
HWBOT x265 Benchmark v2.2 / 4k Preset
Moyenne de la classe Subnotebook
  (1.5 - 19.4, n=56, 2 dernières années)
11.5 fps +243%
Huawei MateBook 13 2020 i5
Intel Core i5-10210U
4.37 fps +30%
Dell XPS 13 9300 i5 FHD
Intel Core i5-1035G1
4.27 fps +27%
Moyenne AMD Ryzen 5 3500U
  (3.35 - 4.15, n=10)
3.94 fps +18%
Acer Swift 3 SF313-52-52AS
Intel Core i5-1035G4
3.37 fps +1%
Acer Swift 3 SF313-52-52AS
Intel Core i5-1035G4
3.37 fps +1%
HP EliteBook 735 G6 7KN29EA
AMD Ryzen 5 PRO 3500U
3.36 fps 0%
Huawei MateBook 13 2020 AMD
AMD Ryzen 5 3500U
3.35 fps
Apple MacBook Air 2020 i5
Intel Core i5-1030NG7
2.95 fps -12%
LibreOffice / 20 Documents To PDF
HP EliteBook 735 G6 7KN29EA
AMD Ryzen 5 PRO 3500U
117 s * -28%
Apple MacBook Air 2020 i5
Intel Core i5-1030NG7
110 s * -20%
Huawei MateBook 13 2020 AMD
AMD Ryzen 5 3500U
91.4 s *
Moyenne AMD Ryzen 5 3500U
  (81.9 - 91.4, n=3)
86.5 s * +5%
Acer Swift 3 SF313-52-52AS
Intel Core i5-1035G4
78.3 s * +14%
Acer Swift 3 SF313-52-52AS
Intel Core i5-1035G4
78.3 s * +14%
Huawei MateBook 13 2020 i5
Intel Core i5-10210U
58.7 s * +36%
Moyenne de la classe Subnotebook
  (40.1 - 120.5, n=57, 2 dernières années)
53.6 s * +41%
R Benchmark 2.5 / Overall mean
Apple MacBook Air 2020 i5
Intel Core i5-1030NG7
0.922 sec * -15%
Apple MacBook Air 2020 i5
Intel Core i5-1030NG7
0.909 sec * -13%
Acer Swift 3 SF313-52-52AS
Intel Core i5-1035G4
0.825 sec * -3%
Acer Swift 3 SF313-52-52AS
Intel Core i5-1035G4
0.825 sec * -3%
Huawei MateBook 13 2020 AMD
AMD Ryzen 5 3500U
0.804 sec *
HP EliteBook 735 G6 7KN29EA
AMD Ryzen 5 PRO 3500U
0.77 sec * +4%
Moyenne AMD Ryzen 5 3500U
  (0.734 - 0.804, n=8)
0.749 sec * +7%
Dell XPS 13 9300 i5 FHD
Intel Core i5-1035G1
0.722 sec * +10%
Huawei MateBook 13 2020 i5
Intel Core i5-10210U
0.713 sec * +11%
Moyenne de la classe Subnotebook
  (0.4397 - 1.236, n=57, 2 dernières années)
0.528 sec * +34%

* ... Moindre est la valeur, meilleures sont les performances

Cinebench R15 CPU Single 64Bit
144.5 Points
Cinebench R15 CPU Multi 64Bit
646 Points
Cinebench R15 OpenGL 64Bit
49.16 fps
Cinebench R15 Ref. Match 64Bit
98 %
Aide
PCMark 10
Score
Moyenne de la classe Subnotebook
  (4384 - 7428, n=56, 2 dernières années)
5810 Points +50%
Dell XPS 13 9300 i5 FHD
UHD Graphics G1 (Ice Lake 32 EU), i5-1035G1, Toshiba XG6 KXG60ZNV512G
4122 Points +7%
Huawei MateBook 13 2020 i5
UHD Graphics 620, i5-10210U, WDC PC SN730 SDBPNTY-512G
4067 Points +5%
Huawei MateBook 13 2020 AMD
Vega 8, R5 3500U, WDC PC SN730 SDBPNTY-512G
3861 Points
Acer Swift 3 SF313-52-52AS
Iris Plus Graphics G4 (Ice Lake 48 EU), i5-1035G4, SK Hynix BC501 HFM512GDJTNG
3790 Points -2%
Moyenne AMD Ryzen 5 3500U, AMD Radeon RX Vega 8 (Ryzen 2000/3000)
  (3485 - 3972, n=16)
3766 Points -2%
HP EliteBook 735 G6 7KN29EA
Vega 8, R5 PRO 3500U, WDC PC SN520 SDAPNUW-256G
3389 Points -12%
Apple MacBook Air 2020 i5
Iris Plus Graphics G7 (Ice Lake 64 EU), i5-1030NG7, Apple SSD AP0512
2540 Points -34%
Essentials
Moyenne de la classe Subnotebook
  (8890 - 11168, n=56, 2 dernières années)
10202 Points +35%
Huawei MateBook 13 2020 i5
UHD Graphics 620, i5-10210U, WDC PC SN730 SDBPNTY-512G
8715 Points +15%
Dell XPS 13 9300 i5 FHD
UHD Graphics G1 (Ice Lake 32 EU), i5-1035G1, Toshiba XG6 KXG60ZNV512G
8568 Points +14%
Acer Swift 3 SF313-52-52AS
Iris Plus Graphics G4 (Ice Lake 48 EU), i5-1035G4, SK Hynix BC501 HFM512GDJTNG
7558 Points 0%
Huawei MateBook 13 2020 AMD
Vega 8, R5 3500U, WDC PC SN730 SDBPNTY-512G
7548 Points
Moyenne AMD Ryzen 5 3500U, AMD Radeon RX Vega 8 (Ryzen 2000/3000)
  (6690 - 8300, n=16)
7533 Points 0%
Apple MacBook Air 2020 i5
Iris Plus Graphics G7 (Ice Lake 64 EU), i5-1030NG7, Apple SSD AP0512
6746 Points -11%
HP EliteBook 735 G6 7KN29EA
Vega 8, R5 PRO 3500U, WDC PC SN520 SDAPNUW-256G
6563 Points -13%
Productivity
Moyenne de la classe Subnotebook
  (6213 - 10279, n=56, 2 dernières années)
7803 Points +32%
Dell XPS 13 9300 i5 FHD
UHD Graphics G1 (Ice Lake 32 EU), i5-1035G1, Toshiba XG6 KXG60ZNV512G
6766 Points +15%
Huawei MateBook 13 2020 i5
UHD Graphics 620, i5-10210U, WDC PC SN730 SDBPNTY-512G
6720 Points +14%
Acer Swift 3 SF313-52-52AS
Iris Plus Graphics G4 (Ice Lake 48 EU), i5-1035G4, SK Hynix BC501 HFM512GDJTNG
6414 Points +9%
Huawei MateBook 13 2020 AMD
Vega 8, R5 3500U, WDC PC SN730 SDBPNTY-512G
5900 Points
Moyenne AMD Ryzen 5 3500U, AMD Radeon RX Vega 8 (Ryzen 2000/3000)
  (5456 - 6074, n=16)
5774 Points -2%
HP EliteBook 735 G6 7KN29EA
Vega 8, R5 PRO 3500U, WDC PC SN520 SDAPNUW-256G
5264 Points -11%
Apple MacBook Air 2020 i5
Iris Plus Graphics G7 (Ice Lake 64 EU), i5-1030NG7, Apple SSD AP0512
3033 Points -49%
Digital Content Creation
Moyenne de la classe Subnotebook
  (4093 - 9749, n=56, 2 dernières années)
6758 Points +93%
Huawei MateBook 13 2020 AMD
Vega 8, R5 3500U, WDC PC SN730 SDBPNTY-512G
3509 Points
Moyenne AMD Ryzen 5 3500U, AMD Radeon RX Vega 8 (Ryzen 2000/3000)
  (2989 - 3526, n=16)
3337 Points -5%
Dell XPS 13 9300 i5 FHD
UHD Graphics G1 (Ice Lake 32 EU), i5-1035G1, Toshiba XG6 KXG60ZNV512G
3281 Points -6%
Huawei MateBook 13 2020 i5
UHD Graphics 620, i5-10210U, WDC PC SN730 SDBPNTY-512G
3118 Points -11%
HP EliteBook 735 G6 7KN29EA
Vega 8, R5 PRO 3500U, WDC PC SN520 SDAPNUW-256G
3061 Points -13%
Acer Swift 3 SF313-52-52AS
Iris Plus Graphics G4 (Ice Lake 48 EU), i5-1035G4, SK Hynix BC501 HFM512GDJTNG
3048 Points -13%
Apple MacBook Air 2020 i5
Iris Plus Graphics G7 (Ice Lake 64 EU), i5-1030NG7, Apple SSD AP0512
2174 Points -38%
PCMark 8
Home Score Accelerated v2
Moyenne de la classe Subnotebook
  (4730 - 5285, n=3, 2 dernières années)
5030 Points +31%
Dell XPS 13 9300 i5 FHD
UHD Graphics G1 (Ice Lake 32 EU), i5-1035G1, Toshiba XG6 KXG60ZNV512G
3988 Points +4%
Huawei MateBook 13 2020 i5
UHD Graphics 620, i5-10210U, WDC PC SN730 SDBPNTY-512G
3946 Points +3%
Huawei MateBook 13 2020 AMD
Vega 8, R5 3500U, WDC PC SN730 SDBPNTY-512G
3846 Points
Moyenne AMD Ryzen 5 3500U, AMD Radeon RX Vega 8 (Ryzen 2000/3000)
  (3316 - 4235, n=13)
3600 Points -6%
HP EliteBook 735 G6 7KN29EA
Vega 8, R5 PRO 3500U, WDC PC SN520 SDAPNUW-256G
3311 Points -14%
Work Score Accelerated v2
Dell XPS 13 9300 i5 FHD
UHD Graphics G1 (Ice Lake 32 EU), i5-1035G1, Toshiba XG6 KXG60ZNV512G
4832 Points +9%
Huawei MateBook 13 2020 i5
UHD Graphics 620, i5-10210U, WDC PC SN730 SDBPNTY-512G
4773 Points +8%
Moyenne AMD Ryzen 5 3500U, AMD Radeon RX Vega 8 (Ryzen 2000/3000)
  (4436 - 5039, n=12)
4707 Points +6%
HP EliteBook 735 G6 7KN29EA
Vega 8, R5 PRO 3500U, WDC PC SN520 SDAPNUW-256G
4558 Points +3%
Huawei MateBook 13 2020 AMD
Vega 8, R5 3500U, WDC PC SN730 SDBPNTY-512G
4436 Points
Moyenne de la classe Subnotebook
  (2972 - 5271, n=3, 2 dernières années)
3805 Points -14%
PCMark 8 Home Score Accelerated v2
3846 points
PCMark 8 Creative Score Accelerated v2
4845 points
PCMark 8 Work Score Accelerated v2
4436 points
PCMark 10 Score
3861 points
Aide
DPC Latencies / LatencyMon - interrupt to process latency (max), Web, Youtube, Prime95
Apple MacBook Air 2020 i5
Iris Plus Graphics G7 (Ice Lake 64 EU), i5-1030NG7, Apple SSD AP0512
2635 μs * -165%
Acer Swift 3 SF313-52-52AS
Iris Plus Graphics G4 (Ice Lake 48 EU), i5-1035G4, SK Hynix BC501 HFM512GDJTNG
1997 μs * -101%
HP EliteBook 735 G6 7KN29EA
Vega 8, R5 PRO 3500U, WDC PC SN520 SDAPNUW-256G
1497 μs * -51%
Dell XPS 13 9300 i5 FHD
UHD Graphics G1 (Ice Lake 32 EU), i5-1035G1, Toshiba XG6 KXG60ZNV512G
1368 μs * -38%
Huawei MateBook 13 2020 i5
UHD Graphics 620, i5-10210U, WDC PC SN730 SDBPNTY-512G
1135 μs * -14%
Huawei MateBook 13 2020 AMD
Vega 8, R5 3500U, WDC PC SN730 SDBPNTY-512G
993 μs *

* ... Moindre est la valeur, meilleures sont les performances

Huawei MateBook 13 2020 AMD
WDC PC SN730 SDBPNTY-512G
Huawei MateBook 13 2020 i5
WDC PC SN730 SDBPNTY-512G
Apple MacBook Air 2020 i5
Apple SSD AP0512
Dell XPS 13 9300 i5 FHD
Toshiba XG6 KXG60ZNV512G
Acer Swift 3 SF313-52-52AS
SK Hynix BC501 HFM512GDJTNG
Moyenne WDC PC SN730 SDBPNTY-512G
 
CrystalDiskMark 5.2 / 6
18%
15%
-10%
33%
Write 4K
143.9
190.5
32%
121.9
-15%
120.6
-16%
164.3 ?(106.9 - 242, n=21)
14%
Read 4K
45.91
53.7
17%
50
9%
46.88
2%
48.2 ?(36.8 - 57.9, n=21)
5%
Write Seq
1307
1436
10%
1497
15%
1044
-20%
2096 ?(1025 - 2707, n=21)
60%
Read Seq
1435
1356
-6%
2111
47%
1147
-20%
2123 ?(1356 - 2553, n=21)
48%
Write 4K Q32T1
237.1
382.5
61%
365.9
54%
332.4
40%
451 ?(237 - 671, n=21)
90%
Read 4K Q32T1
332.7
502
51%
384.6
16%
443.3
33%
509 ?(333 - 838, n=21)
53%
Write Seq Q32T1
2698
2114
-22%
2748
2%
1052
-61%
2551 ?(1087 - 2721, n=21)
-5%
Read Seq Q32T1
3394
3410
0%
3119
-8%
2171
-36%
3330 ?(2869 - 3426, n=21)
-2%
AS SSD
65%
-64%
-9%
-25%
39%
Seq Read
2844
2912
2%
1153
-59%
2328
-18%
1370
-52%
2605 ?(1786 - 3021, n=21)
-8%
Seq Write
2316
2190
-5%
1367
-41%
1137
-51%
1019
-56%
1905 ?(993 - 2486, n=21)
-18%
4K Read
40.76
49.52
21%
12.95
-68%
48.07
18%
50.8
25%
45.8 ?(34.7 - 53.4, n=21)
12%
4K Write
96.9
167.1
72%
24.52
-75%
120.6
24%
111.2
15%
155.6 ?(96.9 - 217, n=21)
61%
4K-64 Read
1275
1447
13%
665
-48%
899
-29%
770
-40%
1181 ?(615 - 1483, n=21)
-7%
4K-64 Write
1156
1513
31%
159.5
-86%
1220
6%
713
-38%
1372 ?(677 - 2346, n=21)
19%
Access Time Read *
0.074
0.05
32%
0.295
-299%
0.085
-15%
0.0801 ?(0.05 - 0.138, n=21)
-8%
Access Time Write *
0.039
0.023
41%
0.163
-318%
0.033
15%
0.034
13%
0.04195 ?(0.018 - 0.091, n=21)
-8%
Score Read
1600
1787
12%
793
-50%
1180
-26%
958
-40%
1488 ?(895 - 1838, n=21)
-7%
Score Write
1485
1899
28%
321
-78%
1455
-2%
926
-38%
1718 ?(948 - 2721, n=21)
16%
Score Total
3879
4569
18%
1528
-61%
3189
-18%
2370
-39%
3938 ?(2834 - 5376, n=21)
2%
Copy ISO MB/s
433.2
2290
429%
1433
231%
1718 ?(433 - 3092, n=13)
297%
Copy Program MB/s
266.4
555
108%
363
36%
536 ?(257 - 790, n=13)
101%
Copy Game MB/s
620
1300
110%
725
17%
1193 ?(620 - 1879, n=13)
92%
Moyenne finale (programmes/paramètres)
42% / 48%
-64% / -64%
3% / 1%
-18% / -18%
36% / 37%

* ... Moindre est la valeur, meilleures sont les performances

WDC PC SN730 SDBPNTY-512G
CDM 5/6 Read Seq Q32T1: 3394 MB/s
CDM 5/6 Write Seq Q32T1: 2698 MB/s
CDM 5/6 Read 4K Q32T1: 332.7 MB/s
CDM 5/6 Write 4K Q32T1: 237.1 MB/s
CDM 5 Read Seq: 1435 MB/s
CDM 5 Write Seq: 1307 MB/s
CDM 5/6 Read 4K: 45.91 MB/s
CDM 5/6 Write 4K: 143.9 MB/s

Continuous load read: DiskSpd Read Loop, Queue Depth 8

No graph data
3DMark 11 - 1280x720 Performance GPU
Moyenne de la classe Subnotebook
  (2979 - 16904, n=55, 2 dernières années)
8016 Points +130%
Huawei MateBook 13 2020 AMD
AMD Radeon RX Vega 8 (Ryzen 2000/3000), AMD Ryzen 5 3500U
3486 Points
Moyenne AMD Radeon RX Vega 8 (Ryzen 2000/3000)
  (1668 - 4317, n=44)
3447 Points -1%
HP EliteBook 735 G6 7KN29EA
AMD Radeon RX Vega 8 (Ryzen 2000/3000), AMD Ryzen 5 PRO 3500U
2997 Points -14%
Apple MacBook Air 2020 i5
Intel Iris Plus Graphics G7 (Ice Lake 64 EU), Intel Core i5-1030NG7
2924 Points -16%
Acer Swift 3 SF313-52-52AS
Intel Iris Plus Graphics G4 (Ice Lake 48 EU), Intel Core i5-1035G4
2809 Points -19%
Dell XPS 13 9300 i5 FHD
Intel UHD Graphics G1 (Ice Lake 32 EU), Intel Core i5-1035G1
2578 Points -26%
Huawei MateBook 13 2020 i5
Intel UHD Graphics 620, Intel Core i5-10210U
1852 Points -47%
3DMark
1280x720 Cloud Gate Standard Graphics
Moyenne de la classe Subnotebook
  (13768 - 65911, n=40, 2 dernières années)
29002 Points +58%
Huawei MateBook 13 2020 AMD
AMD Radeon RX Vega 8 (Ryzen 2000/3000), AMD Ryzen 5 3500U
18329 Points
Moyenne AMD Radeon RX Vega 8 (Ryzen 2000/3000)
  (7309 - 19399, n=37)
15327 Points -16%
Dell XPS 13 9300 i5 FHD
Intel UHD Graphics G1 (Ice Lake 32 EU), Intel Core i5-1035G1
12698 Points -31%
HP EliteBook 735 G6 7KN29EA
AMD Radeon RX Vega 8 (Ryzen 2000/3000), AMD Ryzen 5 PRO 3500U
12233 Points -33%
Huawei MateBook 13 2020 i5
Intel UHD Graphics 620, Intel Core i5-10210U
10111 Points -45%
1920x1080 Fire Strike Graphics
Moyenne de la classe Subnotebook
  (2837 - 12349, n=59, 2 dernières années)
5881 Points +152%
Huawei MateBook 13 2020 AMD
AMD Radeon RX Vega 8 (Ryzen 2000/3000), AMD Ryzen 5 3500U
2335 Points
Moyenne AMD Radeon RX Vega 8 (Ryzen 2000/3000)
  (1095 - 2901, n=41)
2224 Points -5%
Acer Swift 3 SF313-52-52AS
Intel Iris Plus Graphics G4 (Ice Lake 48 EU), Intel Core i5-1035G4
1995 Points -15%
HP EliteBook 735 G6 7KN29EA
AMD Radeon RX Vega 8 (Ryzen 2000/3000), AMD Ryzen 5 PRO 3500U
1872 Points -20%
Apple MacBook Air 2020 i5
Intel Iris Plus Graphics G7 (Ice Lake 64 EU), Intel Core i5-1030NG7
1846 Points -21%
Dell XPS 13 9300 i5 FHD
Intel UHD Graphics G1 (Ice Lake 32 EU), Intel Core i5-1035G1
1755 Points -25%
Huawei MateBook 13 2020 i5
Intel UHD Graphics 620, Intel Core i5-10210U
1280 Points -45%
2560x1440 Time Spy Graphics
Moyenne de la classe Subnotebook
  (811 - 4773, n=58, 2 dernières années)
1981 Points +151%
Huawei MateBook 13 2020 AMD
AMD Radeon RX Vega 8 (Ryzen 2000/3000), AMD Ryzen 5 3500U
790 Points
Moyenne AMD Radeon RX Vega 8 (Ryzen 2000/3000)
  (523 - 790, n=23)
673 Points -15%
HP EliteBook 735 G6 7KN29EA
AMD Radeon RX Vega 8 (Ryzen 2000/3000), AMD Ryzen 5 PRO 3500U
568 Points -28%
Apple MacBook Air 2020 i5
Intel Iris Plus Graphics G7 (Ice Lake 64 EU), Intel Core i5-1030NG7
526 Points -33%
Dell XPS 13 9300 i5 FHD
Intel UHD Graphics G1 (Ice Lake 32 EU), Intel Core i5-1035G1
472 Points -40%
3DMark 11 Performance
3619 points
3DMark Cloud Gate Standard Score
13533 points
3DMark Fire Strike Score
2142 points
3DMark Fire Strike Extreme Score
979 points
3DMark Time Spy Score
881 points
Aide
Bas Moyen Élevé Ultra
The Witcher 3 (2015) 24.5 15.35
Dota 2 Reborn (2015) 70 63.2 38.9 34.6
Warhammer 40.000: Dawn of War III (2017) 42.69 17.95
X-Plane 11.11 (2018) 26.9 21 18.4
Far Cry 5 (2018) 19 12
F1 2019 (2019) 46.2 27.6 24.2 22.5

Degré de la nuisance sonore

Au repos
27.2 / 27.2 / 27.2 dB(A)
Fortement sollicité
31.8 / 38.3 dB(A)
  red to green bar
 
 
30 dB
silencieux
40 dB(A)
audible
50 dB(A)
bruyant
 
min: dark, med: mid, max: light   Audix TM1, Arta (à 15 cm de distance)   bruit ambiant: 27.2 dB(A)
dB(A) 0102030405060708090Deep BassMiddle BassHigh BassLower RangeMidsHigher MidsLower HighsMid HighsUpper HighsSuper Highs2038.732.937.231.738.7253433.334.128.7343130.627.52830.630.64025.727.424.523.725.75029353130.7296326.730.728.523.826.78023.523.927.224.223.510025.520.925.724.625.512522.11821.120.522.116020.220.321.218.320.220023.320.119.818.723.325021.420.717.816.621.431521.520.618.71721.540022.117.717.314.722.150023.818.815.31423.863025.518.51515.225.580024.217.714.314.224.2100023.921.415.214.623.9125026.719.81513.826.7160026.319.81514.126.3200027.521.214.114.827.5250026.920.114.414.526.9315027.619.915.11527.6400027.321.114.914.827.3500027.420.314.814.827.4630028.317.914.814.928.3800024.416.315.115.124.41000022.615.81515.222.61250018.615.915.215.418.61600016.616.115.315.316.6SPL38.331.827.326.938.3N2.91.50.90.92.9median 24.2median 19.8median 15.1median 15median 24.2Delta2.61.31.31.32.631.831.230.131.326.727.228.228.132.933.529.731.130.931.628.829.429.626.527.731.726.326.824.824.924.625.222.924.123.523.825.827.523.423.923.524.123.32422.823.423.823.423.123.723.122.123.322.521.921.721.922.722.121.421.22220.920.520.821.320.320.219.821.320.519.918.720.62120.117.821.122.621.117.621.322.520.516.920.922.521.116.420.921.720.416.420.421.119.316.320.419.618.51618.418.917.516.116.816.916.516.216.716.616.616.116.416.516.316.216.316.116.115.916.215.915.915.815.932.831.729.732.11.81.61.31.7median 21.1median 20.4median 17.6median 20.92.62.12.92.7hearing rangehide median Fan NoiseHuawei MateBook 13 2020 AMDHuawei MateBook 13 2020 i5
 35.3 °C39.3 °C38.8 °C 
 32.7 °C37.3 °C37.5 °C 
 30.3 °C30 °C32.6 °C 
Maximum: 39.3 °C
Moyenne: 34.9 °C
40.2 °C36.9 °C32.1 °C
38.5 °C34.3 °C32.7 °C
34.5 °C32.9 °C30.8 °C
Maximum: 40.2 °C
Moyenne: 34.8 °C
Alimentation (valeur maximale)  41 °C | Température ambiante de la pièce 22 °C | Fluke t3000FC (calibrated) & Voltcraft IR-260
(±) La température moyenne de la face supérieure sous charge maximale est de 34.9 °C / 95 F, par rapport à la moyenne de 30.7 °C / 87 F pour les appareils de la classe Subnotebook.
(+) La température maximale du côté supérieur est de 39.3 °C / 103 F, par rapport à la moyenne de 35.9 °C / 97 F, allant de 21.4 à 59 °C pour la classe Subnotebook.
(±) Le fond chauffe jusqu'à un maximum de 40.2 °C / 104 F, contre une moyenne de 39.4 °C / 103 F
(+) En utilisation inactive, la température moyenne du côté supérieur est de 28.5 °C / 83 F, par rapport à la moyenne du dispositif de 30.7 °C / 87 F.
(+) Les repose-poignets et le pavé tactile atteignent la température maximale de la peau (32.6 °C / 90.7 F) et ne sont donc pas chauds.
(-) La température moyenne de la zone de l'appui-paume de dispositifs similaires était de 28.3 °C / 82.9 F (-4.3 °C / #-7.8 F).
Consommation énergétique
Éteint/en veilledarklight 0.21 / 0.32 Watts
Au reposdarkmidlight 4.71 / 8.65 / 9.42 Watts
Fortement sollicité midlight 34.23 / 47.1 Watts
 color bar
Légende: min: dark, med: mid, max: light        Metrahit Energy
Currently we use the Metrahit Energy, a professional single phase power quality and energy measurement digital multimeter, for our measurements. Find out more about it here. All of our test methods can be found here.
Huawei MateBook 13 2020 AMD
R5 3500U, Vega 8, WDC PC SN730 SDBPNTY-512G, IPS, 2160x1440, 13.00
Huawei MateBook 13 2020 i5
i5-10210U, UHD Graphics 620, WDC PC SN730 SDBPNTY-512G, IPS, 2160x1440, 13.00
Apple MacBook Air 2020 i5
i5-1030NG7, Iris Plus Graphics G7 (Ice Lake 64 EU), Apple SSD AP0512, IPS, 2560x1600, 13.30
Dell XPS 13 9300 i5 FHD
i5-1035G1, UHD Graphics G1 (Ice Lake 32 EU), Toshiba XG6 KXG60ZNV512G, IPS, 1920x1200, 13.40
Acer Swift 3 SF313-52-52AS
i5-1035G4, Iris Plus Graphics G4 (Ice Lake 48 EU), SK Hynix BC501 HFM512GDJTNG, IPS, 2256x1504, 13.50
HP EliteBook 735 G6 7KN29EA
R5 PRO 3500U, Vega 8, WDC PC SN520 SDAPNUW-256G, IPS LED, 1920x1080, 13.30
Moyenne AMD Radeon RX Vega 8 (Ryzen 2000/3000)
 
Moyenne de la classe Subnotebook
 
Power Consumption
-2%
24%
8%
28%
-4%
-7%
-17%
Idle Minimum *
4.71
2.97
37%
2.4
49%
3.4
28%
3
36%
5.6
-19%
5.68 ?(3.7 - 11.5, n=42)
-21%
4.9 ?(1.77 - 11.8, n=63, 2 dernières années)
-4%
Idle Average *
8.65
7.5
13%
6.8
21%
6
31%
6.1
29%
8.1
6%
8.75 ?(5.86 - 21.8, n=42)
-1%
8.4 ?(4.6 - 17.4, n=63, 2 dernières années)
3%
Idle Maximum *
9.42
9.6
-2%
10.5
-11%
10.2
-8%
8.4
11%
9.6
-2%
10.1 ?(6.36 - 22.2, n=42)
-7%
10.4 ?(5.1 - 22.4, n=63, 2 dernières années)
-10%
Load Average *
34.23
38.9
-14%
25.7
25%
36.6
-7%
25.7
25%
34.3
-0%
37.8 ?(24.1 - 55.3, n=42)
-10%
46.1 ?(19.1 - 83.3, n=62, 2 dernières années)
-35%
Load Maximum *
47.1
66.7
-42%
30.4
35%
49.3
-5%
27.6
41%
48.6
-3%
46.2 ?(26.5 - 65.6, n=42)
2%
66.2 ?(24.2 - 121.2, n=63, 2 dernières années)
-41%
Witcher 3 ultra *
24.5

* ... Moindre est la valeur, meilleures sont les performances

Autonomie
WiFi Websurfing (Microsoft Edge 83)
5h 19min
WiFi Websurfing max. Brightness (Microsoft Edge 83)
4h 21min
En lecture de Big Buck Bunny encodé en H.264 1080p
8h 47min
Fortement sollicité (luminosité au maximum)
1h 36min
Huawei MateBook 13 2020 AMD
R5 3500U, Vega 8, 41.7 Wh
Huawei MateBook 13 2020 i5
i5-10210U, UHD Graphics 620, 41.7 Wh
Apple MacBook Air 2020 i5
i5-1030NG7, Iris Plus Graphics G7 (Ice Lake 64 EU), 49.9 Wh
Dell XPS 13 9300 i5 FHD
i5-1035G1, UHD Graphics G1 (Ice Lake 32 EU), 52 Wh
Acer Swift 3 SF313-52-52AS
i5-1035G4, Iris Plus Graphics G4 (Ice Lake 48 EU), 54.5 Wh
HP EliteBook 735 G6 7KN29EA
R5 PRO 3500U, Vega 8, 50 Wh
Moyenne de la classe Subnotebook
 
Autonomie de la batterie
13%
65%
99%
103%
54%
54%
H.264
527
580
10%
640
21%
866
64%
778 ?(426 - 1153, n=30, 2 dernières années)
48%
WiFi v1.3
319
441
38%
618
94%
703
120%
648
103%
492
54%
623 ?(303 - 1144, n=64, 2 dernières années)
95%
Load
96
86
-10%
173
80%
205
114%
115.4 ?(61 - 197, n=47, 2 dernières années)
20%

Points positifs

+ châssis, en métal
+ performances globales
+ périphériques d'entrée
+ luminosité de l'écran 3:2

Points négatifs

- accès aux composants
- écran brillant
- calibrage de l'écran
- USB C avec limitations

Verdict

En test : le Huawei MateBook 13 (2020) AMD version.

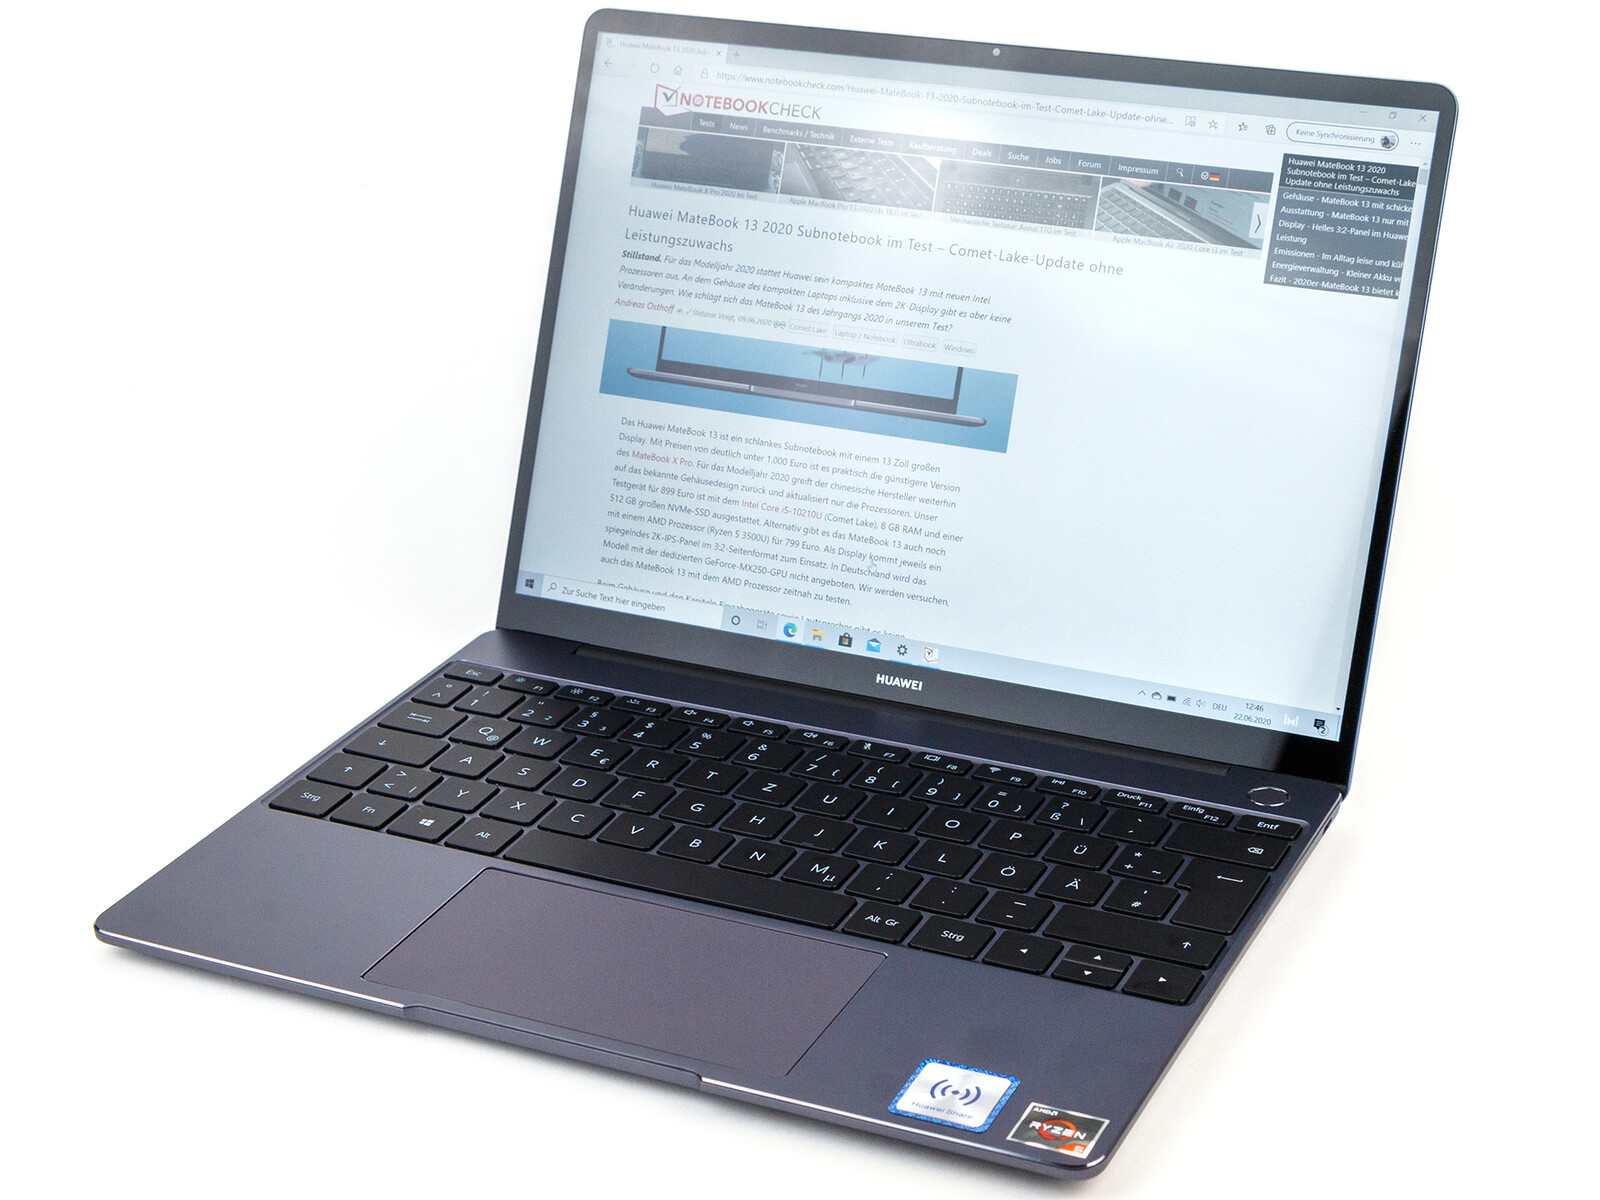
Avec le Huawei MateBook 13, l'on aura un très bon ultraportable, même avec une puce AMD, avant tout avec un prix réduit puisque l'appareil est déjà disponible à 749 €. L'adaptateur USB inclus dans la boîte est cependant une maigre consolation face à l'absence du MateDock 2.

La carte graphique intégrée plus puissante de la puce Picasso n'influence pas beaucoup le score, mais permet de faire la différence entre un jeu encore jouable et un jeu pixelisé, surtout pour les joueurs occasionnels. Nous voyons aussi un léger avantage à la version AMD dans les logiciels créatifs comme Photoshop.

Le MateBook 13 avec puce Ryzen est moins cher, mais il faudra composer avec des défauts, en particulier en ce qui concerne l'autonomie.

Les nomades devraient ainsi y réfléchir à deux fois, le modèle Intel ayant une autonomie bien meilleure. Mais dans les deux cas, les appareils ont un châssis en métal de grande qualité, avec des périphériques d'entrée corrects. Ceux qui possède déjà un smartphone Huawei à peu près à jour auront une fonctionnalité intéressante avec Huawei Share.

L’intégralité de cette critique est disponible en anglais en suivant ce lien.

Huawei MateBook 13 2020 AMD - 06/29/2020 v7
Daniel Schmidt

Châssis
84 / 98 → 86%
Clavier
84%
Dispositif de pointage
86%
Connectivité
45 / 75 → 60%
Poids
71 / 20-75 → 93%
Autonomie
72%
Écran
83%
Performances en jeu
51 / 78 → 66%
Performances dans les applications
83 / 85 → 97%
Chauffe
91%
Nuisance sonore
97%
Audio
65 / 91 → 71%
Appareil photo
35 / 85 → 41%
Moyenne
73%
84%
Subnotebook - Moyenne compensée

Pricecompare

Please share our article, every link counts!
> Revues et rapports de ordinateurs portatifs et smartphones, ordiphones > Critiques > Test du Huawei MateBook 13 2020 (Ryzen 5 3500U, Vega 8, FHD+) : un portable Ryzen n'est pas toujours le meilleur choix
Daniel Schmidt, 2020-08-15 (Update: 2020-08-15)