Critiques du AMD Ryzen 5 3500U processeur
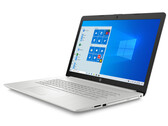
Test du HP 17 (Ryzen 5 3500U, Vega 8, FHD) : PC portable Ryzen pour le bureau
Le 17,3 pouces de HP est un PC portable de bureau basique, équipé d'un APU Ryzen 5-3500U, de 16 Go de mémoire vive (en mode double canal), d'un SSD NVMe et d'un écran mat IPS. Il intègre également un disque optique. Avec un prix de seulement 800 €, l'ordinateur n'a pas un prix réduit.
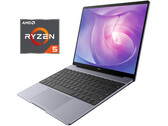
AMD Ryzen 5 3500U, Vega 8, 17.3", 2.5 kgTest du Huawei MateBook 13 2020 (Ryzen 5 3500U, Vega 8, FHD+) : un portable Ryzen n'est pas toujours le meilleur choix
Comparativement compact et encore moins cher que la version Intel, le MateBook 13 est équipé d'une puce AMD. Notre rapport de test va dévoiler s'il est plus intéressant ou non de dépenser un peu plus.
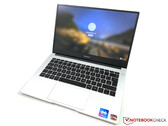
AMD Ryzen 5 3500U, Vega 8, 13", 1.3 kgTest du Honor Magicbook 14 (Ryzen 5 3500U, RX Vega 8, FHD) : un MateBook D 14 amélioré ?
Nous avions vraiment aimé le Huawei MateBook D 14 avec un processeur AMD, et Honor propose maintenant le même appareil sous le nom de MagicBook 14 pour 50 à 100 € de moins. Y a-t-il une arnaque, ou le MagicBook 14 peut-il être recommandé ?
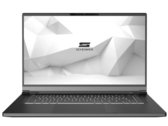
AMD Ryzen 5 3500U, Vega 8, 14", 1.4 kgTest du Schenker VIA 15 (Ryzen 5, Vega 8, FHD) : PC portable AMD léger
Le Schenker VIA 15 est un PC portable de 15 pouces à la belle allure et aux spécifications prometteuses. Mais il possède quelques particularités que le client potentiel doit connaître. Découvrez-en plus dans notre rapport.
AMD Ryzen 5 3500U, Vega 8, 15.6", 1.4 kgTest du Huawei MateBook D 14 (Ryzen 5 3500U, RX Vega 8, FHD) : AMD Ryzen 5 3500U lâché
Suivant les traces du MateBook D 15, le MateBook D 14 plus compact prouve une fois de plus qu’il n’y a absolument aucune raison de brider les performances du processeur en cas de sollicitations. Découvrez dans nos tests quelles autres qualités peut proposer le portable de Huawei.
AMD Ryzen 5 3500U, Vega 8, 14", 1.4 kgHuawei MateBook D 15-53010TUY: AMD Radeon RX Vega 8 (Ryzen 2000/3000), 15.60", 1.5 kg
Critique » Test du Huawei MateBook D 15 (Ryzen 5 3500U, RX Vega 8, FHD) : toujours un bon portable, avec AMD
Asus VivoBook 17 M712DA-AU017T: AMD Radeon RX Vega 8 (Ryzen 2000/3000), 17.30", 2.3 kg
Critique » Test de l'Asus VivoBook 17 M712DA (Ryzen 5 3500U, Vega 8, FHD) : un 17 pouces bon marché
Walmart Motile M142: AMD Radeon RX Vega 8 (Ryzen 2000/3000), 14.00", 1.1 kg
Critique » Test du Walmart Motile M142 (Ryzen 5 3500U, RX Vega 8, FHD) : bon pour son prix
Acer Aspire 5 A515-43-R6WW: AMD Radeon RX Vega 8 (Ryzen 2000/3000), 15.60", 1.8 kg
Critique » Test de l'Acer Aspire 5 A515-43-R057 (Ryzen 5 3500U, RX Vega 8, FHD) : portable AMD abordable, avec un gros défaut
Acer Swift 3 SF314-41-R8HZ: AMD Radeon RX Vega 8 (Ryzen 2000/3000), 14.00", 1.5 kg
Critique » Test de l'Acer Swift 3 SF314-41 (Ryzen 5 3500U, RX Vega 8, FHD) : ultraportable élégant et fin, puissant et autonome
Lenovo Ideapad C340-14API 81N6004UGE: AMD Radeon RX Vega 8 (Ryzen 2000/3000), 14.00", 1.7 kg
Critique » Test du Lenovo Ideapad Flex 14API (Ryzen 5 3500U, Vega 8, FHD) : Ryzen 5 monte la barre
HP ProBook 455R G6: AMD Radeon RX Vega 8 (Ryzen 2000/3000), 15.60", 2 kg
Critique » Test du HP ProBook 455R G6 (Ryzen 5 3500U, Vega 8, FHD) : bonne autonomei grâce à Zen+
Lenovo V155-15API: AMD Radeon RX Vega 8 (Ryzen 2000/3000), 15.60", 2.2 kg
Critique » Test du Lenovo V155-15API (Ryzen 5 3500U, RX Vega 8, FHD) : portable à petit prix au stockage énorme
Lenovo ThinkPad E495-20NE000JGE: AMD Radeon RX Vega 8 (Ryzen 2000/3000), 14.00", 1.8 kg
Critique » Test du Lenovo ThinkPad E495 (Ryzen 5 3500U, Vega 8, FHD) : PC portable de bureau puissant, mais non rétroéclairé
Lenovo Ideapad L340-17API-81LY0004GE: AMD Radeon RX Vega 8 (Ryzen 2000/3000), 17.30", 2.8 kg
Critique » Test du Lenovo IdeaPad L340-17API (Ryzen 5, Vega 8, HD) : PC portable de 17,3 pouces avec une bonne autonomie
Medion Akoya E14301: AMD Radeon RX Vega 8 (Ryzen 2000/3000), 14.00", 1.5 kg
Autres tests » Medion Akoya E14301
HP Pavilion 15-cw1501nd: AMD Radeon RX Vega 8 (Ryzen 2000/3000), 15.60", 1.9 kg
Autres tests » HP Pavilion 15-cw1501nd
Dell Vostro 14 3405, R5 3500U: AMD Radeon RX Vega 8 (Ryzen 2000/3000), 14.00", 1.7 kg
Autres tests » Dell Vostro 14 3405, R5 3500U
HP Pavilion 15-cw1947nd: AMD Radeon RX Vega 8 (Ryzen 2000/3000), 15.60", 1.9 kg
Autres tests » HP Pavilion 15-cw1947nd
Acer Spin 3 SP314-21-R572: AMD Radeon RX Vega 8 (Ryzen 2000/3000), 14.00", 1.5 kg
Autres tests » Acer Spin 3 SP314-21-R572
Asus VivoBook 14 D415DA-EB238: AMD Radeon RX Vega 8 (Ryzen 2000/3000), 14.00", 1.6 kg
Autres tests » Asus VivoBook 14 D415DA-EB238
Asus VivoBook 14 M415DA-EK274: AMD Radeon RX Vega 8 (Ryzen 2000/3000), 14.00", 1.6 kg
Autres tests » Asus VivoBook 14 M415DA-EK274
Medion Akoya E15301: AMD Radeon RX Vega 8 (Ryzen 2000/3000), 15.60", 1.9 kg
Autres tests » Medion Akoya E15301
HP 15s-eq0022ns: AMD Radeon RX Vega 8 (Ryzen 2000/3000), 15.60", 1.8 kg
Autres tests » HP 15s-eq0022ns
Asus VivoBook 14 M409DA-BV646: AMD Radeon RX Vega 8 (Ryzen 2000/3000), 14.00", 1.5 kg
Autres tests » Asus VivoBook 14 M409DA-BV646
Asus VivoBook D509DA-EJ028T: AMD Radeon RX Vega 8 (Ryzen 2000/3000), 15.60", 1.8 kg
Autres tests » Asus VivoBook D509DA-EJ028T
Asus VivoBook 14 M409DA-EK146T: AMD Radeon RX Vega 8 (Ryzen 2000/3000), 14.00", 1.6 kg
Autres tests » Asus VivoBook 14 M409DA-EK146T
HP Pavilion 15-cw1948nd: AMD Radeon RX Vega 8 (Ryzen 2000/3000), 15.60", 1.9 kg
Autres tests » HP Pavilion 15-cw1948nd
HP 14-dk0033ns: AMD Radeon RX Vega 8 (Ryzen 2000/3000), 14.00", 1.5 kg
Autres tests » HP 14-dk0033ns
Acer Aspire 3 A315-23-R6U9: AMD Radeon RX Vega 8 (Ryzen 2000/3000), 15.60", 1.9 kg
Autres tests » Acer Aspire 3 A315-23-R6U9
Acer Aspire 3 A315-23-R875: AMD Radeon RX Vega 8 (Ryzen 2000/3000), 15.60", 1.9 kg
Autres tests » Acer Aspire 3 A315-23-R875
Lenovo ThinkPad E495-20NE000JGE: AMD Radeon RX Vega 8 (Ryzen 2000/3000), 14.00", 1.8 kg
Autres tests » Lenovo ThinkPad E495-20NE000JGE
Lenovo IdeaPad S145-81V70008BR: AMD Radeon RX Vega 8 (Ryzen 2000/3000), 15.60", 2.5 kg
Autres tests » Lenovo IdeaPad S145-81V70008BR
Acer Aspire 3 A315-23-R33X: AMD Radeon RX Vega 8 (Ryzen 2000/3000), 15.60", 1.9 kg
Autres tests » Acer Aspire 3 A315-23-R33X
HP 14-dk0030ns: AMD Radeon RX Vega 8 (Ryzen 2000/3000), 14.00", 1.5 kg
Autres tests » HP 14-dk0030ns
Acer Aspire 3 A315-23-R8W6: AMD Radeon RX Vega 8 (Ryzen 2000/3000), 15.60", 1.9 kg
Autres tests » Acer Aspire 3 A315-23-R8W6
HP 17-ca1008ng: AMD Radeon RX Vega 8 (Ryzen 2000/3000), 17.30", 2.5 kg
Autres tests » HP 17-ca1008ng
Lenovo IdeaPad 3 15ADA05: AMD Radeon RX Vega 8 (Ryzen 2000/3000), 15.60", 1.9 kg
Autres tests » Lenovo IdeaPad 3 15ADA05
Asus VivoBook 17 D712DA-AU021T: AMD Radeon RX Vega 8 (Ryzen 2000/3000), 17.30", 2.3 kg
Autres tests » Asus VivoBook 17 D712DA-AU021T
Asus ZenBook 14 UM431DA-AM011T: AMD Radeon RX Vega 8 (Ryzen 2000/3000), 14.00", 1.4 kg
Autres tests » Asus ZenBook 14 UM431DA-AM011T
Asus D509DA-BR294: AMD Radeon RX Vega 8 (Ryzen 2000/3000), 15.60", 1.8 kg
Autres tests » Asus D509DA-BR294
Acer Swift 3 SF314-41-R69Y: AMD Radeon RX Vega 8 (Ryzen 2000/3000), 14.00", 1.5 kg
Autres tests » Acer Swift 3 SF314-41-R69Y
Asus M509DA-EJ068T: AMD Radeon RX Vega 8 (Ryzen 2000/3000), 15.60", 1.8 kg
Autres tests » Asus M509DA-EJ068T
Asus ZenBook Flip 14 UM462DA-AI038: AMD Radeon RX Vega 8 (Ryzen 2000/3000), 14.00", 1.6 kg
Autres tests » Asus ZenBook Flip 14 UM462DA-AI038
Honor MagicBook 15: AMD Radeon RX Vega 8 (Ryzen 2000/3000), 15.60", 1.5 kg
Autres tests » Honor MagicBook 15
Asus VivoBook 14 D409DA-EK366: AMD Radeon RX Vega 8 (Ryzen 2000/3000), 14.00", 1.6 kg
Autres tests » Asus VivoBook 14 D409DA-EK366
Lenovo Ideapad S340-14API-81NB006AGE: AMD Radeon RX Vega 8 (Ryzen 2000/3000), 14.00", 1.7 kg
Autres tests » Lenovo Ideapad S340-14API-81NB006AGE
Huawei MateBook 13 2020 AMD: AMD Radeon RX Vega 8 (Ryzen 2000/3000), 13.00", 1.3 kg
Autres tests » Huawei MateBook 13 2020 AMD
HP 15s-eq0025ns: AMD Radeon RX Vega 8 (Ryzen 2000/3000), 15.60", 1.7 kg
Autres tests » HP 15s-eq0025ns
Lenovo Ideapad S145-15API-81UT00DBGE: AMD Radeon RX Vega 8 (Ryzen 2000/3000), 15.60", 1.9 kg
Autres tests » Lenovo Ideapad S145-15API-81UT00DBGE
Asus VivoBook 17 M712DA-AU017T: AMD Radeon RX Vega 8 (Ryzen 2000/3000), 17.30", 2.3 kg
Autres tests » Asus VivoBook 17 M712DA-AU017T
Acer Aspire 5 A515-43-R4HV: AMD Radeon RX Vega 8 (Ryzen 2000/3000), 15.60", 1.9 kg
Autres tests » Acer Aspire 5 A515-43-R4HV
HP 14-dk0009ns: AMD Radeon RX Vega 8 (Ryzen 2000/3000), 14.00", 1.5 kg
Autres tests » HP 14-dk0009ns
Asus M570DD-E4082T: NVIDIA GeForce GTX 1050 Mobile, 15.60", 2 kg
Autres tests » Asus M570DD-E4082T
HP 15s-eq0017ns: AMD Radeon RX Vega 8 (Ryzen 2000/3000), 15.60", 1.8 kg
Autres tests » HP 15s-eq0017ns
Asus M509DA-EJ025T: AMD Radeon RX Vega 8 (Ryzen 2000/3000), 15.60", 1.9 kg
Autres tests » Asus M509DA-EJ025T
HP Envy x360 13-ar0002ur: AMD Radeon RX Vega 8 (Ryzen 2000/3000), 13.30", 1.3 kg
Autres tests » HP Envy x360 13-ar0002ur
Lenovo ThinkPad E595-20NF001HMH: AMD Radeon RX Vega 8 (Ryzen 2000/3000), 15.60", 2.1 kg
Autres tests » Lenovo ThinkPad E595-20NF001HMH
Acer Swift 3 SF314-41-R9JT: AMD Radeon RX Vega 8 (Ryzen 2000/3000), 14.00", 1.5 kg
Autres tests » Acer Swift 3 SF314-41-R9JT
Honor Magicbook 14: AMD Radeon RX Vega 8 (Ryzen 2000/3000), 14.00", 1.4 kg
Autres tests » Honor Magicbook 14
Huawei MateBook D 15-53010TUY: AMD Radeon RX Vega 8 (Ryzen 2000/3000), 15.60", 1.5 kg
Autres tests » Huawei MateBook D 15-53010TUY
HP 14-dk0933nd: AMD Radeon RX Vega 8 (Ryzen 2000/3000), 14.00", 1.5 kg
Autres tests » HP 14-dk0933nd
Huawei Matebook D 15 Space Grey (2020): AMD Radeon RX Vega 8 (Ryzen 2000/3000), 15.60", 1.5 kg
Autres tests » Huawei Matebook D 15 Space Grey (2020)
Huawei MateBook D 14-53010TVS: AMD Radeon RX Vega 8 (Ryzen 2000/3000), 14.00", 1.4 kg
Autres tests » Huawei MateBook D 14-53010TVS
HP Envy x360 13-ar0006nw: AMD Radeon RX Vega 8 (Ryzen 2000/3000), 13.30", 1.3 kg
Autres tests » HP Envy x360 13-ar0006nw
Asus D570DD-E4028T: NVIDIA GeForce GTX 1050 Mobile, 15.60", 2 kg
Autres tests » Asus D570DD-E4028T
HP Envy x360 13-ar0150nd: AMD Radeon RX Vega 8 (Ryzen 2000/3000), 13.30", 1.3 kg
Autres tests » HP Envy x360 13-ar0150nd
HP Envy x360 13-ar0800no: AMD Radeon RX Vega 8 (Ryzen 2000/3000), 13.30", 1.3 kg
Autres tests » HP Envy x360 13-ar0800no
Acer Swift 3 SF314-41-R8HZ: AMD Radeon RX Vega 8 (Ryzen 2000/3000), 14.00", 1.5 kg
Autres tests » Acer Swift 3 SF314-41-R8HZ
Asus ZenBook Flip 14 UM462DA-AI012T: AMD Radeon RX Vega 8 (Ryzen 2000/3000), 14.00", 1.6 kg
Autres tests » Asus ZenBook Flip 14 UM462DA-AI012T
Acer Swift 3 SF314-41-R1X6: AMD Radeon RX Vega 8 (Ryzen 2000/3000), 14.00", 1.5 kg
Autres tests » Acer Swift 3 SF314-41-R1X6
Asus ZenBook 14 UM431DA-AM003: AMD Radeon RX Vega 8 (Ryzen 2000/3000), 14.00", 1.4 kg
Autres tests » Asus ZenBook 14 UM431DA-AM003
HP 17-ca1105ng: AMD Radeon RX Vega 8 (Ryzen 2000/3000), 17.30", 2.5 kg
Autres tests » HP 17-ca1105ng
Lenovo V155-15API-81V50008SP: AMD Radeon RX Vega 8 (Ryzen 2000/3000), 15.60", 2.2 kg
Autres tests » Lenovo V155-15API-81V50008SP
Acer Aspire 3 A315-42-R5P7: AMD Radeon RX Vega 8 (Ryzen 2000/3000), 15.60", 1.9 kg
Autres tests » Acer Aspire 3 A315-42-R5P7
Asus ZenBook 14 UM431DA-AM053: AMD Radeon RX Vega 8 (Ryzen 2000/3000), 14.00", 1.4 kg
Autres tests » Asus ZenBook 14 UM431DA-AM053
Acer Aspire 5 A515-43-R7MS: AMD Radeon RX Vega 8 (Ryzen 2000/3000), 15.60", 1.8 kg
Autres tests » Acer Aspire 5 A515-43-R7MS
Lenovo Ideapad C340-14API 81N6004UGE: AMD Radeon RX Vega 8 (Ryzen 2000/3000), 14.00", 1.7 kg
Autres tests » Lenovo Ideapad C340-14API 81N6004UGE
Asus VivoBook 15 S512DA-BR097: AMD Radeon RX Vega 8 (Ryzen 2000/3000), 15.60", 1.6 kg
Autres tests » Asus VivoBook 15 S512DA-BR097
Acer Swift 3 SF314-41-R8VS: AMD Radeon RX Vega 8 (Ryzen 2000/3000), 14.00", 1.5 kg
Autres tests » Acer Swift 3 SF314-41-R8VS
Asus ZenBook 14 UM433DA-AM062T: AMD Radeon RX Vega 8 (Ryzen 2000/3000), 14.00", 1.4 kg
Autres tests » Asus ZenBook 14 UM433DA-AM062T
Lenovo Ideapad C340-14API-81N6005LSP: AMD Radeon RX Vega 8 (Ryzen 2000/3000), 14.00", 1.7 kg
Autres tests » Lenovo Ideapad C340-14API-81N6005LSP
HP 14-dk0002ns: AMD Radeon RX Vega 8 (Ryzen 2000/3000), 14.00", 1.5 kg
Autres tests » HP 14-dk0002ns
HP Envy x360 13-ar0004ng: AMD Radeon RX Vega 8 (Ryzen 2000/3000), 13.30", 1.3 kg
Autres tests » HP Envy x360 13-ar0004ng
Lenovo Ideapad S540-14API-81NH002YGE: AMD Radeon RX Vega 8 (Ryzen 2000/3000), 14.00", 1.5 kg
Autres tests » Lenovo Ideapad S540-14API-81NH002YGE
HP 15-db1011ns: AMD Radeon RX Vega 8 (Ryzen 2000/3000), 15.60", 1.8 kg
Autres tests » HP 15-db1011ns
HP Envy x360 13-ar0000ns: AMD Radeon RX Vega 8 (Ryzen 2000/3000), 13.30", 1.3 kg
Autres tests » HP Envy x360 13-ar0000ns
HP 15-db1014ns: AMD Radeon RX Vega 8 (Ryzen 2000/3000), 15.60", 1.8 kg
Autres tests » HP 15-db1014ns