Test du Lenovo ThinkPad L15 (Ryzen 7 PRO 4750U, Vega 7, FHD) : PC portable de bureau correct et performant
Note | Date | Modèle | Poids | Épaisseur | Taille | Résolution | Prix |
|---|---|---|---|---|---|---|---|
| 84.9 % v7 (old) | 11/20 | Lenovo ThinkPad L15-20U8S0AH00 R7 PRO 4750U, Vega 7 | 1.9 kg | 21 mm | 15.60" | 1920x1080 | |
| 82.1 % v7 (old) | 04/20 | Lenovo ThinkPad E15 20RD0011GE i7-10510U, Radeon RX 640 | 1.8 kg | 18.9 mm | 15.60" | 1920x1080 | |
| 81.4 % v7 (old) | 09/20 | HP ProBook 450 G7 8WC04UT i7-10510U, GeForce MX250 | 1.9 kg | 19 mm | 15.60" | 1920x1080 | |
| 82.6 % v7 (old) | 09/20 | HP ProBook 455 G7-175W8EA R7 4700U, Vega 7 | 1.8 kg | 19 mm | 15.60" | 1920x1080 | |
| 84 % v7 (old) | 11/20 | Dell Latitude 15 5510-D90XK i5-10310U, UHD Graphics 620 | 1.8 kg | 23 mm | 15.60" | 1920x1080 | |
| 82 % v7 (old) | 08/20 | Acer TravelMate P215-52 i7-10510U, UHD Graphics 620 | 1.8 kg | 19.9 mm | 15.60" | 1920x1080 | |
| 83.2 % v7 (old) | 10/19 | Lenovo ThinkPad L590-20Q70019GE i5-8265U, UHD Graphics 620 | 2 kg | 23 mm | 15.60" | 1920x1080 |

| SD Card Reader | |
| average JPG Copy Test (av. of 3 runs) | |
| Dell Latitude 15 5510-D90XK (Toshiba Exceria Pro M501 microSDXC 64GB) | |
| Lenovo ThinkPad L15-20U8S0AH00 (Toshiba Exceria Pro M501 64 GB UHS-II) | |
| HP ProBook 455 G7-175W8EA (Toshiba Exceria Pro SDXC 64 GB UHS-II) | |
| HP ProBook 450 G7 8WC04UT (Toshiba Exceria Pro SDXC 64 GB UHS-II) | |
| Lenovo ThinkPad L590-20Q70019GE (Toshiba Exceria Pro M501 64 GB UHS-II) | |
| Moyenne de la classe Office (19.8 - 198.5, n=22, 2 dernières années) | |
| Acer TravelMate P215-52 (Toshiba Exceria Pro SDXC 64 GB UHS-II) | |
| maximum AS SSD Seq Read Test (1GB) | |
| Dell Latitude 15 5510-D90XK (Toshiba Exceria Pro M501 microSDXC 64GB) | |
| HP ProBook 455 G7-175W8EA (Toshiba Exceria Pro SDXC 64 GB UHS-II) | |
| Lenovo ThinkPad L15-20U8S0AH00 (Toshiba Exceria Pro M501 64 GB UHS-II) | |
| Lenovo ThinkPad L590-20Q70019GE (Toshiba Exceria Pro M501 64 GB UHS-II) | |
| HP ProBook 450 G7 8WC04UT (Toshiba Exceria Pro SDXC 64 GB UHS-II) | |
| Moyenne de la classe Office (27.4 - 249, n=21, 2 dernières années) | |
| Acer TravelMate P215-52 (Toshiba Exceria Pro SDXC 64 GB UHS-II) | |


| |||||||||||||||||||||||||
Homogénéité de la luminosité: 89 %
Valeur mesurée au centre, sur batterie: 247 cd/m²
Contraste: 1660:1 (Valeurs des noirs: 0.15 cd/m²)
ΔE ColorChecker Calman: 5.9 | ∀{0.5-29.43 Ø4.72}
calibrated: 4.8
ΔE Greyscale Calman: 3 | ∀{0.09-98 Ø4.97}
56.8% sRGB (Argyll 1.6.3 3D)
36.1% AdobeRGB 1998 (Argyll 1.6.3 3D)
39.19% AdobeRGB 1998 (Argyll 3D)
57% sRGB (Argyll 3D)
37.93% Display P3 (Argyll 3D)
Gamma: 2.32
CCT: 6838 K
| Lenovo ThinkPad L15-20U8S0AH00 B156HAN02.1, IPS, 1920x1080, 15.6" | Lenovo ThinkPad E15 20RD0011GE NV156FHM-N48, IPS LED, 1920x1080, 15.6" | HP ProBook 450 G7 8WC04UT LG Philips LGD062E, IPS, 1920x1080, 15.6" | HP ProBook 455 G7-175W8EA AUO, B156HW02, IPS, 1920x1080, 15.6" | Dell Latitude 15 5510-D90XK BOE0869, IPS, 1920x1080, 15.6" | Acer TravelMate P215-52 BOE CQ NV156FHM-N48, IPS, 1920x1080, 15.6" | Lenovo ThinkPad L590-20Q70019GE N156HCE-EAA, IPS, 1920x1080, 15.6" | |
|---|---|---|---|---|---|---|---|
| Display | 4% | -0% | 0% | 1% | 7% | 14% | |
| Display P3 Coverage (%) | 37.93 | 40.25 6% | 37.9 0% | 37.92 0% | 38.74 2% | 40.66 7% | 43.3 14% |
| sRGB Coverage (%) | 57 | 57.7 1% | 56.5 -1% | 57.1 0% | 56.6 -1% | 60.6 6% | 64.4 13% |
| AdobeRGB 1998 Coverage (%) | 39.19 | 41.59 6% | 39.08 0% | 39.18 0% | 40.02 2% | 42.01 7% | 44.81 14% |
| Response Times | -9% | 15% | 16% | -1% | 28% | 6% | |
| Response Time Grey 50% / Grey 80% * (ms) | 48 ? | 49.6 ? -3% | 35.2 ? 27% | 41 ? 15% | 44 ? 8% | 24.4 ? 49% | 42.8 ? 11% |
| Response Time Black / White * (ms) | 31.2 ? | 36 ? -15% | 30.4 ? 3% | 26 ? 17% | 34 ? -9% | 29.2 ? 6% | 30.8 ? 1% |
| PWM Frequency (Hz) | 1250 ? | 1000 ? | 1000 ? | 24510 ? | |||
| Screen | -22% | -22% | -1% | -0% | -24% | -9% | |
| Brightness middle (cd/m²) | 249 | 283 14% | 259.8 4% | 282 13% | 258 4% | 255.9 3% | 247 -1% |
| Brightness (cd/m²) | 240 | 258 8% | 251 5% | 264 10% | 229 -5% | 234 -2% | 228 -5% |
| Brightness Distribution (%) | 89 | 81 -9% | 91 2% | 88 -1% | 74 -17% | 78 -12% | 81 -9% |
| Black Level * (cd/m²) | 0.15 | 0.22 -47% | 0.42 -180% | 0.19 -27% | 0.16 -7% | 0.46 -207% | 0.18 -20% |
| Contrast (:1) | 1660 | 1286 -23% | 619 -63% | 1484 -11% | 1613 -3% | 556 -67% | 1372 -17% |
| Colorchecker dE 2000 * | 5.9 | 7.9 -34% | 6.09 -3% | 5.56 6% | 5.61 5% | 5.02 15% | 5.9 -0% |
| Colorchecker dE 2000 max. * | 21.7 | 23.6 -9% | 16.33 25% | 19.07 12% | 19 12% | 18.26 16% | 22.9 -6% |
| Colorchecker dE 2000 calibrated * | 4.8 | 5.8 -21% | 5.2 -8% | 4.5 6% | 4.17 13% | 4.7 2% | |
| Greyscale dE 2000 * | 3 | 6.6 -120% | 3.7 -23% | 3.57 -19% | 2.77 8% | 4.2 -40% | 5.1 -70% |
| Gamma | 2.32 95% | 2.18 101% | 2.56 86% | 2.61 84% | 2.27 97% | 2.07 106% | 2.21 100% |
| CCT | 6838 95% | 5735 113% | 6759 96% | 6895 94% | 6198 105% | 6975 93% | 6398 102% |
| Color Space (Percent of AdobeRGB 1998) (%) | 36.1 | 37 2% | 35.7 -1% | 36 0% | 36 0% | 38.6 7% | 41.2 14% |
| Color Space (Percent of sRGB) (%) | 56.8 | 57.1 1% | 56.2 -1% | 57 0% | 56 -1% | 60.4 6% | 64.1 13% |
| Moyenne finale (programmes/paramètres) | -9% /
-15% | -2% /
-13% | 5% /
1% | 0% /
-0% | 4% /
-12% | 4% /
-3% |
* ... Moindre est la valeur, meilleures sont les performances
Temps de réponse de l'écran
| ↔ Temps de réponse noir à blanc | ||
|---|---|---|
| 31.2 ms ... hausse ↗ et chute ↘ combinées | ↗ 17.2 ms hausse | 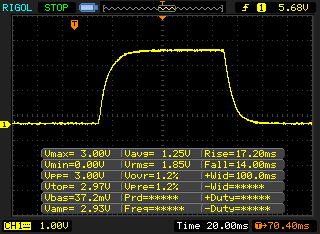 |
| ↘ 14 ms chute | ||
| L'écran souffre de latences très élevées, à éviter pour le jeu. En comparaison, tous les appareils testés affichent entre 0.1 (minimum) et 240 (maximum) ms. » 84 % des appareils testés affichent de meilleures performances. Cela signifie que les latences relevées sont moins bonnes que la moyenne (19.9 ms) de tous les appareils testés. | ||
| ↔ Temps de réponse gris 50% à gris 80% | ||
| 48 ms ... hausse ↗ et chute ↘ combinées | ↗ 24.4 ms hausse | 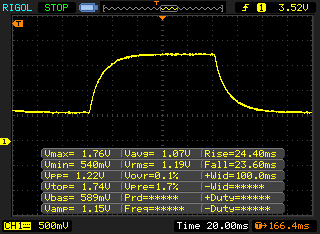 |
| ↘ 23.6 ms chute | ||
| L'écran souffre de latences très élevées, à éviter pour le jeu. En comparaison, tous les appareils testés affichent entre 0.165 (minimum) et 636 (maximum) ms. » 82 % des appareils testés affichent de meilleures performances. Cela signifie que les latences relevées sont moins bonnes que la moyenne (31.1 ms) de tous les appareils testés. | ||
Scintillement / MLI (Modulation de largeur d'impulsion)
| Scintillement / MLI (Modulation de largeur d'impulsion) non décelé | 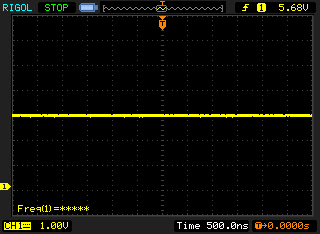 | ||
En comparaison, 52 % des appareils testés n'emploient pas MDI pour assombrir leur écran. Nous avons relevé une moyenne à 7784 (minimum : 5 - maximum : 343500) Hz dans le cas où une MDI était active. | |||
Cinebench R15: CPU Single 64Bit | CPU Multi 64Bit
Blender: v2.79 BMW27 CPU
7-Zip 18.03: 7z b 4 -mmt1 | 7z b 4
Geekbench 5.5: Single-Core | Multi-Core
HWBOT x265 Benchmark v2.2: 4k Preset
LibreOffice : 20 Documents To PDF
R Benchmark 2.5: Overall mean
| Cinebench R20 / CPU (Single Core) | |
| Moyenne de la classe Office (345 - 816, n=73, 2 dernières années) | |
| Moyenne AMD Ryzen 7 PRO 4750U (461 - 479, n=5) | |
| HP ProBook 455 G7-175W8EA | |
| Lenovo ThinkPad L15-20U8S0AH00 | |
| Lenovo ThinkPad E15 20RD0011GE | |
| Dell Latitude 15 5510-D90XK | |
| Lenovo ThinkPad L590-20Q70019GE | |
| HP ProBook 450 G7 8WC04UT | |
| Acer TravelMate P215-52 | |
| Cinebench R20 / CPU (Multi Core) | |
| Moyenne de la classe Office (648 - 8840, n=73, 2 dernières années) | |
| Lenovo ThinkPad L15-20U8S0AH00 | |
| Moyenne AMD Ryzen 7 PRO 4750U (2935 - 3302, n=5) | |
| HP ProBook 455 G7-175W8EA | |
| Dell Latitude 15 5510-D90XK | |
| Lenovo ThinkPad E15 20RD0011GE | |
| Acer TravelMate P215-52 | |
| Lenovo ThinkPad L590-20Q70019GE | |
| HP ProBook 450 G7 8WC04UT | |
| Cinebench R15 / CPU Single 64Bit | |
| Moyenne de la classe Office (99.5 - 312, n=75, 2 dernières années) | |
| Moyenne AMD Ryzen 7 PRO 4750U (180 - 184, n=5) | |
| HP ProBook 455 G7-175W8EA | |
| Lenovo ThinkPad L15-20U8S0AH00 | |
| Lenovo ThinkPad E15 20RD0011GE | |
| Dell Latitude 15 5510-D90XK | |
| Acer TravelMate P215-52 | |
| Lenovo ThinkPad L590-20Q70019GE | |
| HP ProBook 450 G7 8WC04UT | |
| Cinebench R15 / CPU Multi 64Bit | |
| Moyenne de la classe Office (250 - 3380, n=75, 2 dernières années) | |
| Lenovo ThinkPad L15-20U8S0AH00 | |
| Moyenne AMD Ryzen 7 PRO 4750U (1287 - 1417, n=5) | |
| HP ProBook 455 G7-175W8EA | |
| Lenovo ThinkPad E15 20RD0011GE | |
| Dell Latitude 15 5510-D90XK | |
| Lenovo ThinkPad L590-20Q70019GE | |
| Acer TravelMate P215-52 | |
| HP ProBook 450 G7 8WC04UT | |
| Blender / v2.79 BMW27 CPU | |
| HP ProBook 450 G7 8WC04UT | |
| Lenovo ThinkPad L590-20Q70019GE | |
| Dell Latitude 15 5510-D90XK | |
| Acer TravelMate P215-52 | |
| Lenovo ThinkPad E15 20RD0011GE | |
| HP ProBook 455 G7-175W8EA | |
| Moyenne de la classe Office (158 - 1940, n=74, 2 dernières années) | |
| Moyenne AMD Ryzen 7 PRO 4750U (340 - 403, n=5) | |
| Lenovo ThinkPad L15-20U8S0AH00 | |
| 7-Zip 18.03 / 7z b 4 -mmt1 | |
| Moyenne de la classe Office (3387 - 6469, n=75, 2 dernières années) | |
| Lenovo ThinkPad E15 20RD0011GE | |
| Lenovo ThinkPad L15-20U8S0AH00 | |
| Moyenne AMD Ryzen 7 PRO 4750U (4413 - 4467, n=5) | |
| Acer TravelMate P215-52 | |
| Dell Latitude 15 5510-D90XK | |
| HP ProBook 455 G7-175W8EA | |
| HP ProBook 450 G7 8WC04UT | |
| Lenovo ThinkPad L590-20Q70019GE | |
| 7-Zip 18.03 / 7z b 4 | |
| Moyenne de la classe Office (7098 - 76886, n=75, 2 dernières années) | |
| Moyenne AMD Ryzen 7 PRO 4750U (37081 - 42173, n=5) | |
| Lenovo ThinkPad L15-20U8S0AH00 | |
| HP ProBook 455 G7-175W8EA | |
| Lenovo ThinkPad E15 20RD0011GE | |
| Acer TravelMate P215-52 | |
| Dell Latitude 15 5510-D90XK | |
| Lenovo ThinkPad L590-20Q70019GE | |
| HP ProBook 450 G7 8WC04UT | |
| Geekbench 5.5 / Single-Core | |
| Moyenne de la classe Office (811 - 2128, n=71, 2 dernières années) | |
| HP ProBook 450 G7 8WC04UT | |
| Lenovo ThinkPad E15 20RD0011GE | |
| Moyenne AMD Ryzen 7 PRO 4750U (1117 - 1157, n=5) | |
| Dell Latitude 15 5510-D90XK | |
| Lenovo ThinkPad L15-20U8S0AH00 | |
| HP ProBook 455 G7-175W8EA | |
| Acer TravelMate P215-52 | |
| Geekbench 5.5 / Multi-Core | |
| Moyenne de la classe Office (1483 - 16999, n=71, 2 dernières années) | |
| Moyenne AMD Ryzen 7 PRO 4750U (5456 - 6609, n=5) | |
| Lenovo ThinkPad L15-20U8S0AH00 | |
| HP ProBook 455 G7-175W8EA | |
| Dell Latitude 15 5510-D90XK | |
| HP ProBook 450 G7 8WC04UT | |
| Lenovo ThinkPad E15 20RD0011GE | |
| Acer TravelMate P215-52 | |
| HWBOT x265 Benchmark v2.2 / 4k Preset | |
| Moyenne de la classe Office (2.21 - 26, n=74, 2 dernières années) | |
| Moyenne AMD Ryzen 7 PRO 4750U (8.33 - 10.3, n=5) | |
| Lenovo ThinkPad L15-20U8S0AH00 | |
| HP ProBook 455 G7-175W8EA | |
| Lenovo ThinkPad E15 20RD0011GE | |
| Acer TravelMate P215-52 | |
| Dell Latitude 15 5510-D90XK | |
| Lenovo ThinkPad L590-20Q70019GE | |
| HP ProBook 450 G7 8WC04UT | |
| LibreOffice / 20 Documents To PDF | |
| HP ProBook 455 G7-175W8EA | |
| HP ProBook 450 G7 8WC04UT | |
| Lenovo ThinkPad L15-20U8S0AH00 | |
| Moyenne AMD Ryzen 7 PRO 4750U (58.4 - 73.4, n=5) | |
| Dell Latitude 15 5510-D90XK | |
| Moyenne de la classe Office (39.9 - 102.3, n=74, 2 dernières années) | |
| Acer TravelMate P215-52 | |
| R Benchmark 2.5 / Overall mean | |
| HP ProBook 450 G7 8WC04UT | |
| Acer TravelMate P215-52 | |
| Dell Latitude 15 5510-D90XK | |
| Lenovo ThinkPad E15 20RD0011GE | |
| HP ProBook 455 G7-175W8EA | |
| Lenovo ThinkPad L15-20U8S0AH00 | |
| Moyenne AMD Ryzen 7 PRO 4750U (0.61 - 0.621, n=5) | |
| Moyenne de la classe Office (0.4098 - 0.888, n=74, 2 dernières années) | |
* ... Moindre est la valeur, meilleures sont les performances
| PCMark 8 Home Score Accelerated v2 | 4158 points | |
| PCMark 8 Creative Score Accelerated v2 | 5381 points | |
| PCMark 8 Work Score Accelerated v2 | 5435 points | |
| PCMark 10 Score | 4639 points | |
Aide | ||
| DPC Latencies / LatencyMon - interrupt to process latency (max), Web, Youtube, Prime95 | |
| Lenovo ThinkPad L15-20U8S0AH00 | |
| Dell Latitude 15 5510-D90XK | |
| HP ProBook 450 G7 8WC04UT | |
| Acer TravelMate P215-52 | |
| HP ProBook 455 G7-175W8EA | |
* ... Moindre est la valeur, meilleures sont les performances
| Lenovo ThinkPad L15-20U8S0AH00 WDC PC SN730 SDBQNTY-1T00 | Lenovo ThinkPad E15 20RD0011GE Samsung PM991 MZALQ512HALU | HP ProBook 450 G7 8WC04UT Crucial P1 SSD CT1000P1SSD8 | HP ProBook 455 G7-175W8EA Samsung PM991 MZVLQ512HALU | Dell Latitude 15 5510-D90XK SK Hynix BC511 HFM512GDJTNI | Acer TravelMate P215-52 SK hynix BC511 HFM256GDJTNI-82A0 | Lenovo ThinkPad L590-20Q70019GE Toshiba XG6 KXG6AZNV512G | Moyenne WDC PC SN730 SDBQNTY-1T00 | |
|---|---|---|---|---|---|---|---|---|
| CrystalDiskMark 5.2 / 6 | -16% | -35% | -29% | -34% | -30% | -26% | 7% | |
| Write 4K (MB/s) | 156.5 | 144.4 -8% | 111.1 -29% | 141.9 -9% | 121 -23% | 153.7 -2% | 115.3 -26% | 169.8 ? 8% |
| Read 4K (MB/s) | 48.72 | 52.3 7% | 56.3 16% | 37.25 -24% | 42.39 -13% | 60.4 24% | 43.34 -11% | 50.4 ? 3% |
| Write Seq (MB/s) | 2147 | 946 -56% | 559 -74% | 998 -54% | 1034 -52% | 431 -80% | 1014 -53% | 2351 ? 10% |
| Read Seq (MB/s) | 1809 | 1608 -11% | 1348 -25% | 1233 -32% | 1063 -41% | 1199 -34% | 1481 -18% | 2078 ? 15% |
| Write 4K Q32T1 (MB/s) | 393.8 | 592 50% | 277.1 -30% | 338.4 -14% | 351.4 -11% | 374.5 -5% | 495.4 26% | 457 ? 16% |
| Read 4K Q32T1 (MB/s) | 496.1 | 397.7 -20% | 312.1 -37% | 431.1 -13% | 334.3 -33% | 445.5 -10% | 332.6 -33% | 513 ? 3% |
| Write Seq Q32T1 (MB/s) | 3093 | 1364 -56% | 1652 -47% | 1367 -56% | 1059 -66% | 408.4 -87% | 1654 -47% | 3048 ? -1% |
| Read Seq Q32T1 (MB/s) | 3394 | 2301 -32% | 1588 -53% | 2355 -31% | 2290 -33% | 1966 -42% | 1746 -49% | 3334 ? -2% |
| Write 4K Q8T8 (MB/s) | 877 | 1033 | 1933 ? | |||||
| Read 4K Q8T8 (MB/s) | 518 | 892 | 1653 ? | |||||
| AS SSD | -24% | -80% | -35% | -38% | -78% | -25% | 7% | |
| Seq Read (MB/s) | 2203 | 1918 -13% | 1155 -48% | 1929 -12% | 1172 -47% | 1770 -20% | 1383 -37% | 2679 ? 22% |
| Seq Write (MB/s) | 2253 | 802 -64% | 984 -56% | 1199 -47% | 678 -70% | 354.5 -84% | 852 -62% | 2311 ? 3% |
| 4K Read (MB/s) | 45.51 | 49.89 10% | 48.85 7% | 43.9 -4% | 47.35 4% | 38.18 -16% | 45.72 0% | 45.7 ? 0% |
| 4K Write (MB/s) | 140.4 | 151.7 8% | 96.6 -31% | 116.2 -17% | 115.7 -18% | 95.9 -32% | 120.2 -14% | 148.8 ? 6% |
| 4K-64 Read (MB/s) | 1672 | 830 -50% | 581 -65% | 897 -46% | 786 -53% | 423.4 -75% | 1344 -20% | 1549 ? -7% |
| 4K-64 Write (MB/s) | 2040 | 736 -64% | 658 -68% | 801 -61% | 718 -65% | 141.1 -93% | 926 -55% | 1747 ? -14% |
| Access Time Read * (ms) | 0.067 | 0.095 -42% | 0.066 1% | 0.069 -3% | 0.049 27% | 0.071 -6% | 0.063 6% | 0.0615 ? 8% |
| Access Time Write * (ms) | 0.027 | 0.025 7% | 0.207 -667% | 0.033 -22% | 0.034 -26% | 0.117 -333% | 0.036 -33% | 0.02817 ? -4% |
| Score Read (Points) | 1938 | 1072 -45% | 745 -62% | 1134 -41% | 951 -51% | 639 -67% | 1528 -21% | 1863 ? -4% |
| Score Write (Points) | 2406 | 968 -60% | 853 -65% | 1037 -57% | 902 -63% | 272 -89% | 1132 -53% | 2129 ? -12% |
| Score Total (Points) | 5338 | 2545 -52% | 1986 -63% | 2723 -49% | 2326 -56% | 1178 -78% | 3420 -36% | 4927 ? -8% |
| Copy ISO MB/s (MB/s) | 1055 | 1287 22% | 2635 150% | 1409 34% | 634 -40% | 1147 9% | 1868 ? 77% | |
| Copy Program MB/s (MB/s) | 520 | 529 2% | 95.1 -82% | 70.2 -86% | 96.2 -81% | 419.8 -19% | 512 ? -2% | |
| Copy Game MB/s (MB/s) | 1055 | 1113 5% | 361.9 -66% | 254.9 -76% | 228.9 -78% | 928 -12% | 1365 ? 29% | |
| Moyenne finale (programmes/paramètres) | -20% /
-21% | -58% /
-63% | -32% /
-33% | -36% /
-36% | -54% /
-60% | -26% /
-25% | 7% /
7% |
* ... Moindre est la valeur, meilleures sont les performances

Continuous load read: DiskSpd Read Loop, Queue Depth 8
| 3DMark 11 Performance | 4125 points | |
| 3DMark Fire Strike Score | 2135 points | |
| 3DMark Time Spy Score | 838 points | |
Aide | ||
| Bas | Moyen | Élevé | Ultra | |
|---|---|---|---|---|
| The Witcher 3 (2015) | 25.5 | 9.74 | 10.9 | |
| Dota 2 Reborn (2015) | 88.3 | 67.9 | 35.5 | 34 |
| X-Plane 11.11 (2018) | 34.9 | 26.7 | 24.1 | |
| Far Cry 5 (2018) | 29 | 14 | ||
| F1 2020 (2020) | 56.1 | 27 | 21.1 |
Degré de la nuisance sonore
| Au repos |
| 29.7 / 29.7 / 30.3 dB(A) |
| Fortement sollicité |
| 31 / 34.3 dB(A) |
 | ||
30 dB silencieux 40 dB(A) audible 50 dB(A) bruyant |
||
min: | ||
(±) La température maximale du côté supérieur est de 40.5 °C / 105 F, par rapport à la moyenne de 34.3 °C / 94 F, allant de 21.2 à 62.5 °C pour la classe Office.
(-) Le fond chauffe jusqu'à un maximum de 48 °C / 118 F, contre une moyenne de 36.8 °C / 98 F
(+) En utilisation inactive, la température moyenne du côté supérieur est de 24.6 °C / 76 F, par rapport à la moyenne du dispositif de 29.5 °C / 85 F.
(+) Les repose-poignets et le pavé tactile sont plus froids que la température de la peau avec un maximum de 29.9 °C / 85.8 F et sont donc froids au toucher.
(-) La température moyenne de la zone de l'appui-paume de dispositifs similaires était de 27.5 °C / 81.5 F (-2.4 °C / #-4.3 F).
Lenovo ThinkPad L15-20U8S0AH00 analyse audio
(-) | haut-parleurs pas très forts (70.8 dB)
Basses 100 - 315 Hz
(-) | presque aucune basse - en moyenne 17.3% plus bas que la médiane
(±) | la linéarité des basses est moyenne (11.6% delta à la fréquence précédente)
Médiums 400 - 2000 Hz
(+) | médiane équilibrée - seulement 3.3% de la médiane
(+) | les médiums sont linéaires (5.5% delta à la fréquence précédente)
Aiguës 2 - 16 kHz
(+) | des sommets équilibrés - à seulement 2.3% de la médiane
(±) | la linéarité des aigus est moyenne (7.3% delta à la fréquence précédente)
Globalement 100 - 16 000 Hz
(±) | la linéarité du son global est moyenne (22.3% de différence avec la médiane)
Par rapport à la même classe
» 59% de tous les appareils testés de cette catégorie étaient meilleurs, 9% similaires, 32% pires
» Le meilleur avait un delta de 7%, la moyenne était de 21%, le pire était de 53%.
Par rapport à tous les appareils testés
» 65% de tous les appareils testés étaient meilleurs, 6% similaires, 29% pires
» Le meilleur avait un delta de 4%, la moyenne était de 24%, le pire était de 134%.
Apple MacBook 12 (Early 2016) 1.1 GHz analyse audio
(+) | les haut-parleurs peuvent jouer relativement fort (83.6# dB)
Basses 100 - 315 Hz
(±) | basse réduite - en moyenne 11.3% inférieure à la médiane
(±) | la linéarité des basses est moyenne (14.2% delta à la fréquence précédente)
Médiums 400 - 2000 Hz
(+) | médiane équilibrée - seulement 2.4% de la médiane
(+) | les médiums sont linéaires (5.5% delta à la fréquence précédente)
Aiguës 2 - 16 kHz
(+) | des sommets équilibrés - à seulement 2% de la médiane
(+) | les aigus sont linéaires (4.5% delta à la fréquence précédente)
Globalement 100 - 16 000 Hz
(+) | le son global est linéaire (10.2% différence à la médiane)
Par rapport à la même classe
» 7% de tous les appareils testés de cette catégorie étaient meilleurs, 2% similaires, 91% pires
» Le meilleur avait un delta de 5%, la moyenne était de 18%, le pire était de 53%.
Par rapport à tous les appareils testés
» 5% de tous les appareils testés étaient meilleurs, 1% similaires, 94% pires
» Le meilleur avait un delta de 4%, la moyenne était de 24%, le pire était de 134%.
| Éteint/en veille | |
| Au repos | |
| Fortement sollicité |
|
Légende:
min: | |
| Lenovo ThinkPad L15-20U8S0AH00 R7 PRO 4750U, Vega 7, WDC PC SN730 SDBQNTY-1T00, IPS, 1920x1080, 15.6" | Lenovo ThinkPad E15 20RD0011GE i7-10510U, Radeon RX 640, Samsung PM991 MZALQ512HALU, IPS LED, 1920x1080, 15.6" | HP ProBook 450 G7 8WC04UT i7-10510U, GeForce MX250, Crucial P1 SSD CT1000P1SSD8, IPS, 1920x1080, 15.6" | HP ProBook 455 G7-175W8EA R7 4700U, Vega 7, Samsung PM991 MZVLQ512HALU, IPS, 1920x1080, 15.6" | Dell Latitude 15 5510-D90XK i5-10310U, UHD Graphics 620, SK Hynix BC511 HFM512GDJTNI, IPS, 1920x1080, 15.6" | Acer TravelMate P215-52 i7-10510U, UHD Graphics 620, SK hynix BC511 HFM256GDJTNI-82A0, IPS, 1920x1080, 15.6" | Lenovo ThinkPad L590-20Q70019GE i5-8265U, UHD Graphics 620, Toshiba XG6 KXG6AZNV512G, IPS, 1920x1080, 15.6" | Moyenne AMD Radeon RX Vega 7 | Moyenne de la classe Office | |
|---|---|---|---|---|---|---|---|---|---|
| Power Consumption | -3% | -30% | 7% | 12% | 20% | 10% | -1% | -6% | |
| Idle Minimum * (Watt) | 4.8 | 3.2 33% | 4.8 -0% | 3.8 21% | 3.6 25% | 3.5 27% | 3.96 17% | 4.79 ? -0% | 4.41 ? 8% |
| Idle Average * (Watt) | 8.9 | 6.8 24% | 9.5 -7% | 7.7 13% | 6.9 22% | 6.2 30% | 6.9 22% | 7.72 ? 13% | 7.37 ? 17% |
| Idle Maximum * (Watt) | 10.5 | 9.5 10% | 10.7 -2% | 10.5 -0% | 9.4 10% | 6.9 34% | 9.8 7% | 9.12 ? 13% | 8.58 ? 18% |
| Load Average * (Watt) | 32.9 | 44 -34% | 61.8 -88% | 32 3% | 34.7 -5% | 31 6% | 31.4 5% | 38.4 ? -17% | 43 ? -31% |
| Load Maximum * (Watt) | 45 | 66.4 -48% | 69 -53% | 45.4 -1% | 41 9% | 43.3 4% | 45.4 -1% | 51.7 ? -15% | 64.6 ? -44% |
| Witcher 3 ultra * (Watt) | 50 |
* ... Moindre est la valeur, meilleures sont les performances
| Lenovo ThinkPad L15-20U8S0AH00 R7 PRO 4750U, Vega 7, 45 Wh | Lenovo ThinkPad E15 20RD0011GE i7-10510U, Radeon RX 640, 45 Wh | HP ProBook 450 G7 8WC04UT i7-10510U, GeForce MX250, 45 Wh | HP ProBook 455 G7-175W8EA R7 4700U, Vega 7, 45 Wh | Dell Latitude 15 5510-D90XK i5-10310U, UHD Graphics 620, 51 Wh | Acer TravelMate P215-52 i7-10510U, UHD Graphics 620, 48 Wh | Lenovo ThinkPad L590-20Q70019GE i5-8265U, UHD Graphics 620, 45 Wh | Moyenne de la classe Office | |
|---|---|---|---|---|---|---|---|---|
| Autonomie de la batterie | 26% | 30% | 10% | 94% | 31% | 42% | 68% | |
| H.264 (h) | 8.5 | 10.4 22% | 6.7 -21% | 9 6% | 15 ? 76% | |||
| WiFi v1.3 (h) | 6.8 | 7.5 10% | 7.2 6% | 7.6 12% | 10.6 56% | 7.9 16% | 7.2 6% | 12.9 ? 90% |
| Load (h) | 1.3 | 1.9 46% | 2 54% | 1.8 38% | 3 131% | 1.9 46% | 2.8 115% | 1.794 ? 38% |
| Reader / Idle (h) | 14.8 | 12.6 | 23.5 | 25.1 | 17.4 | 23.7 ? |
Points positifs
Points négatifs
Verdict - Convaincant pour la bureautique
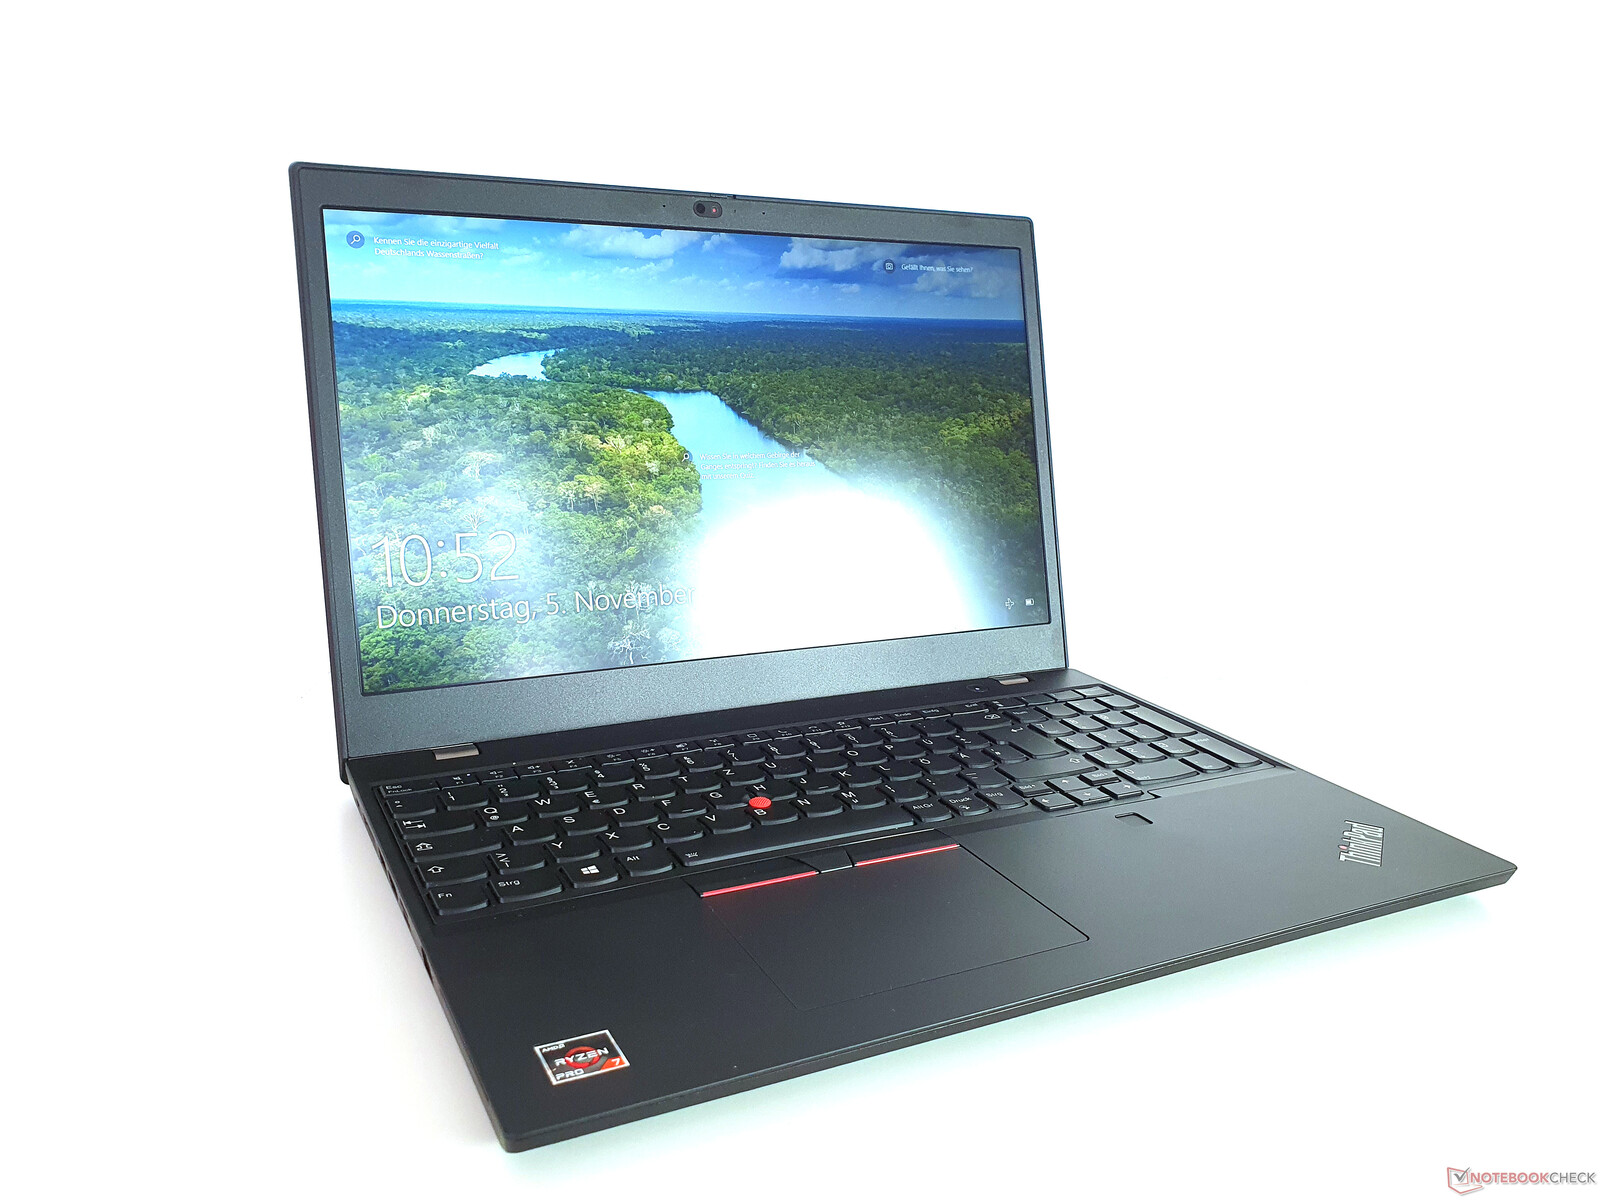

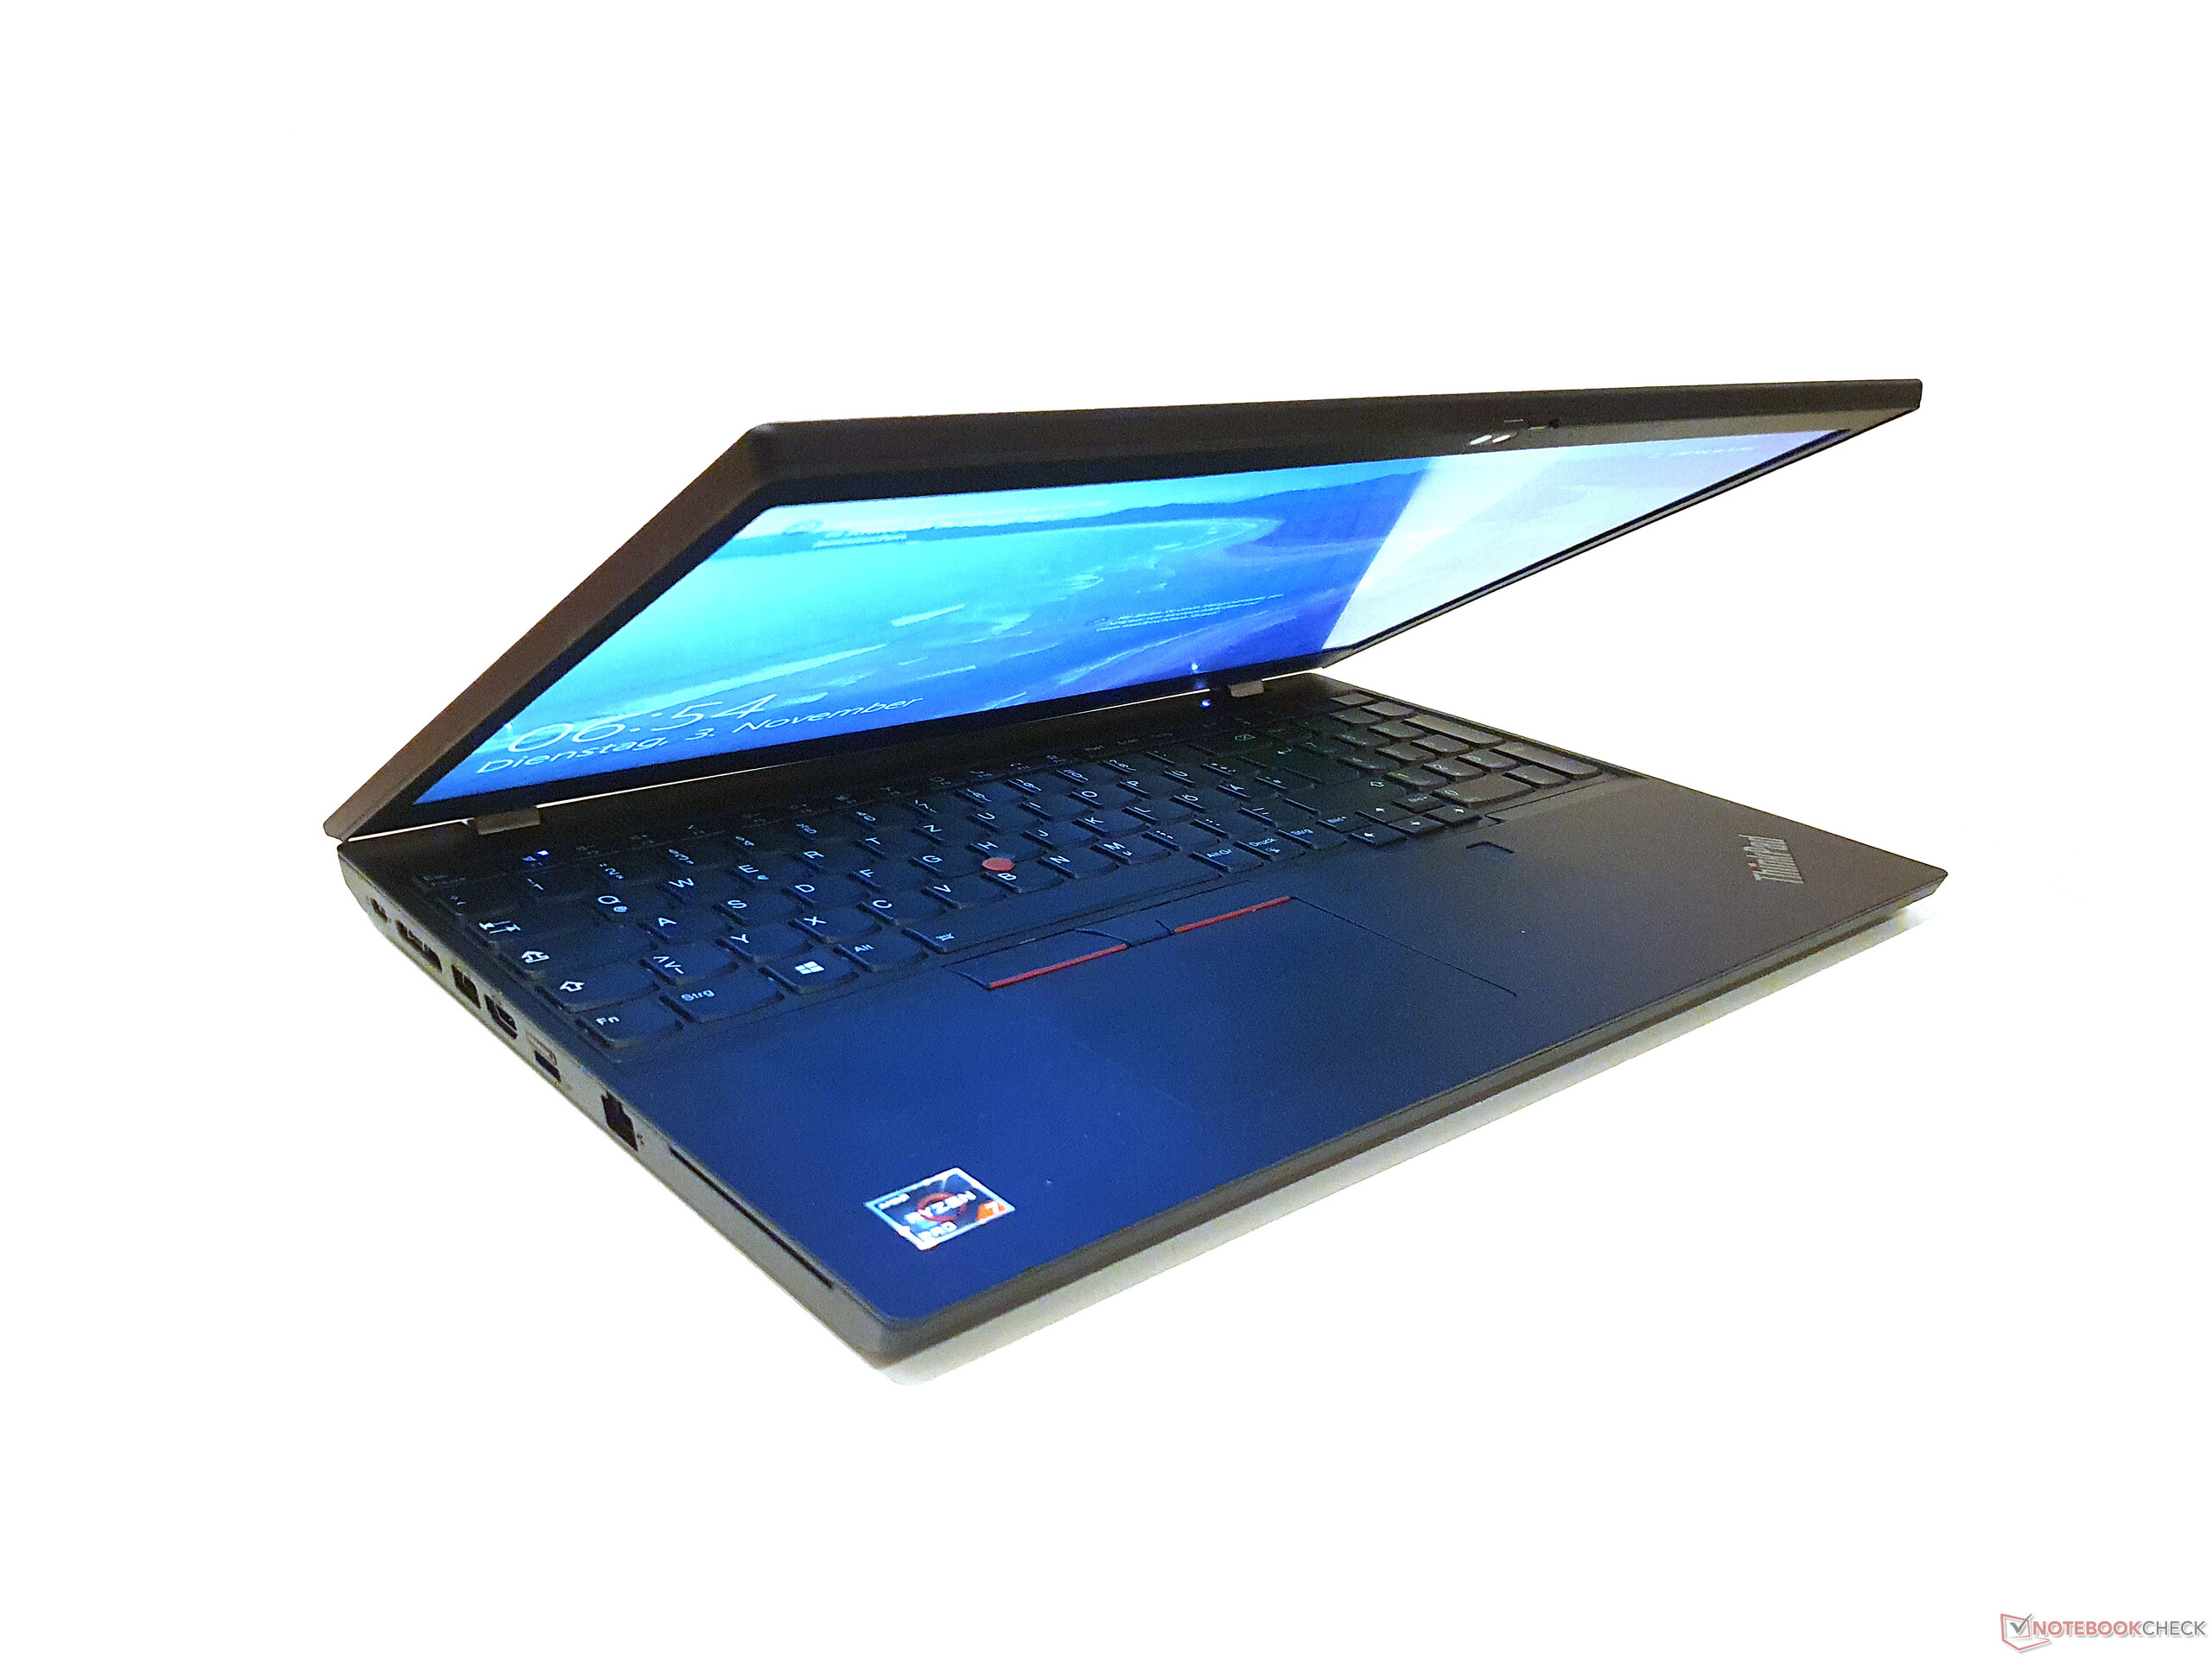
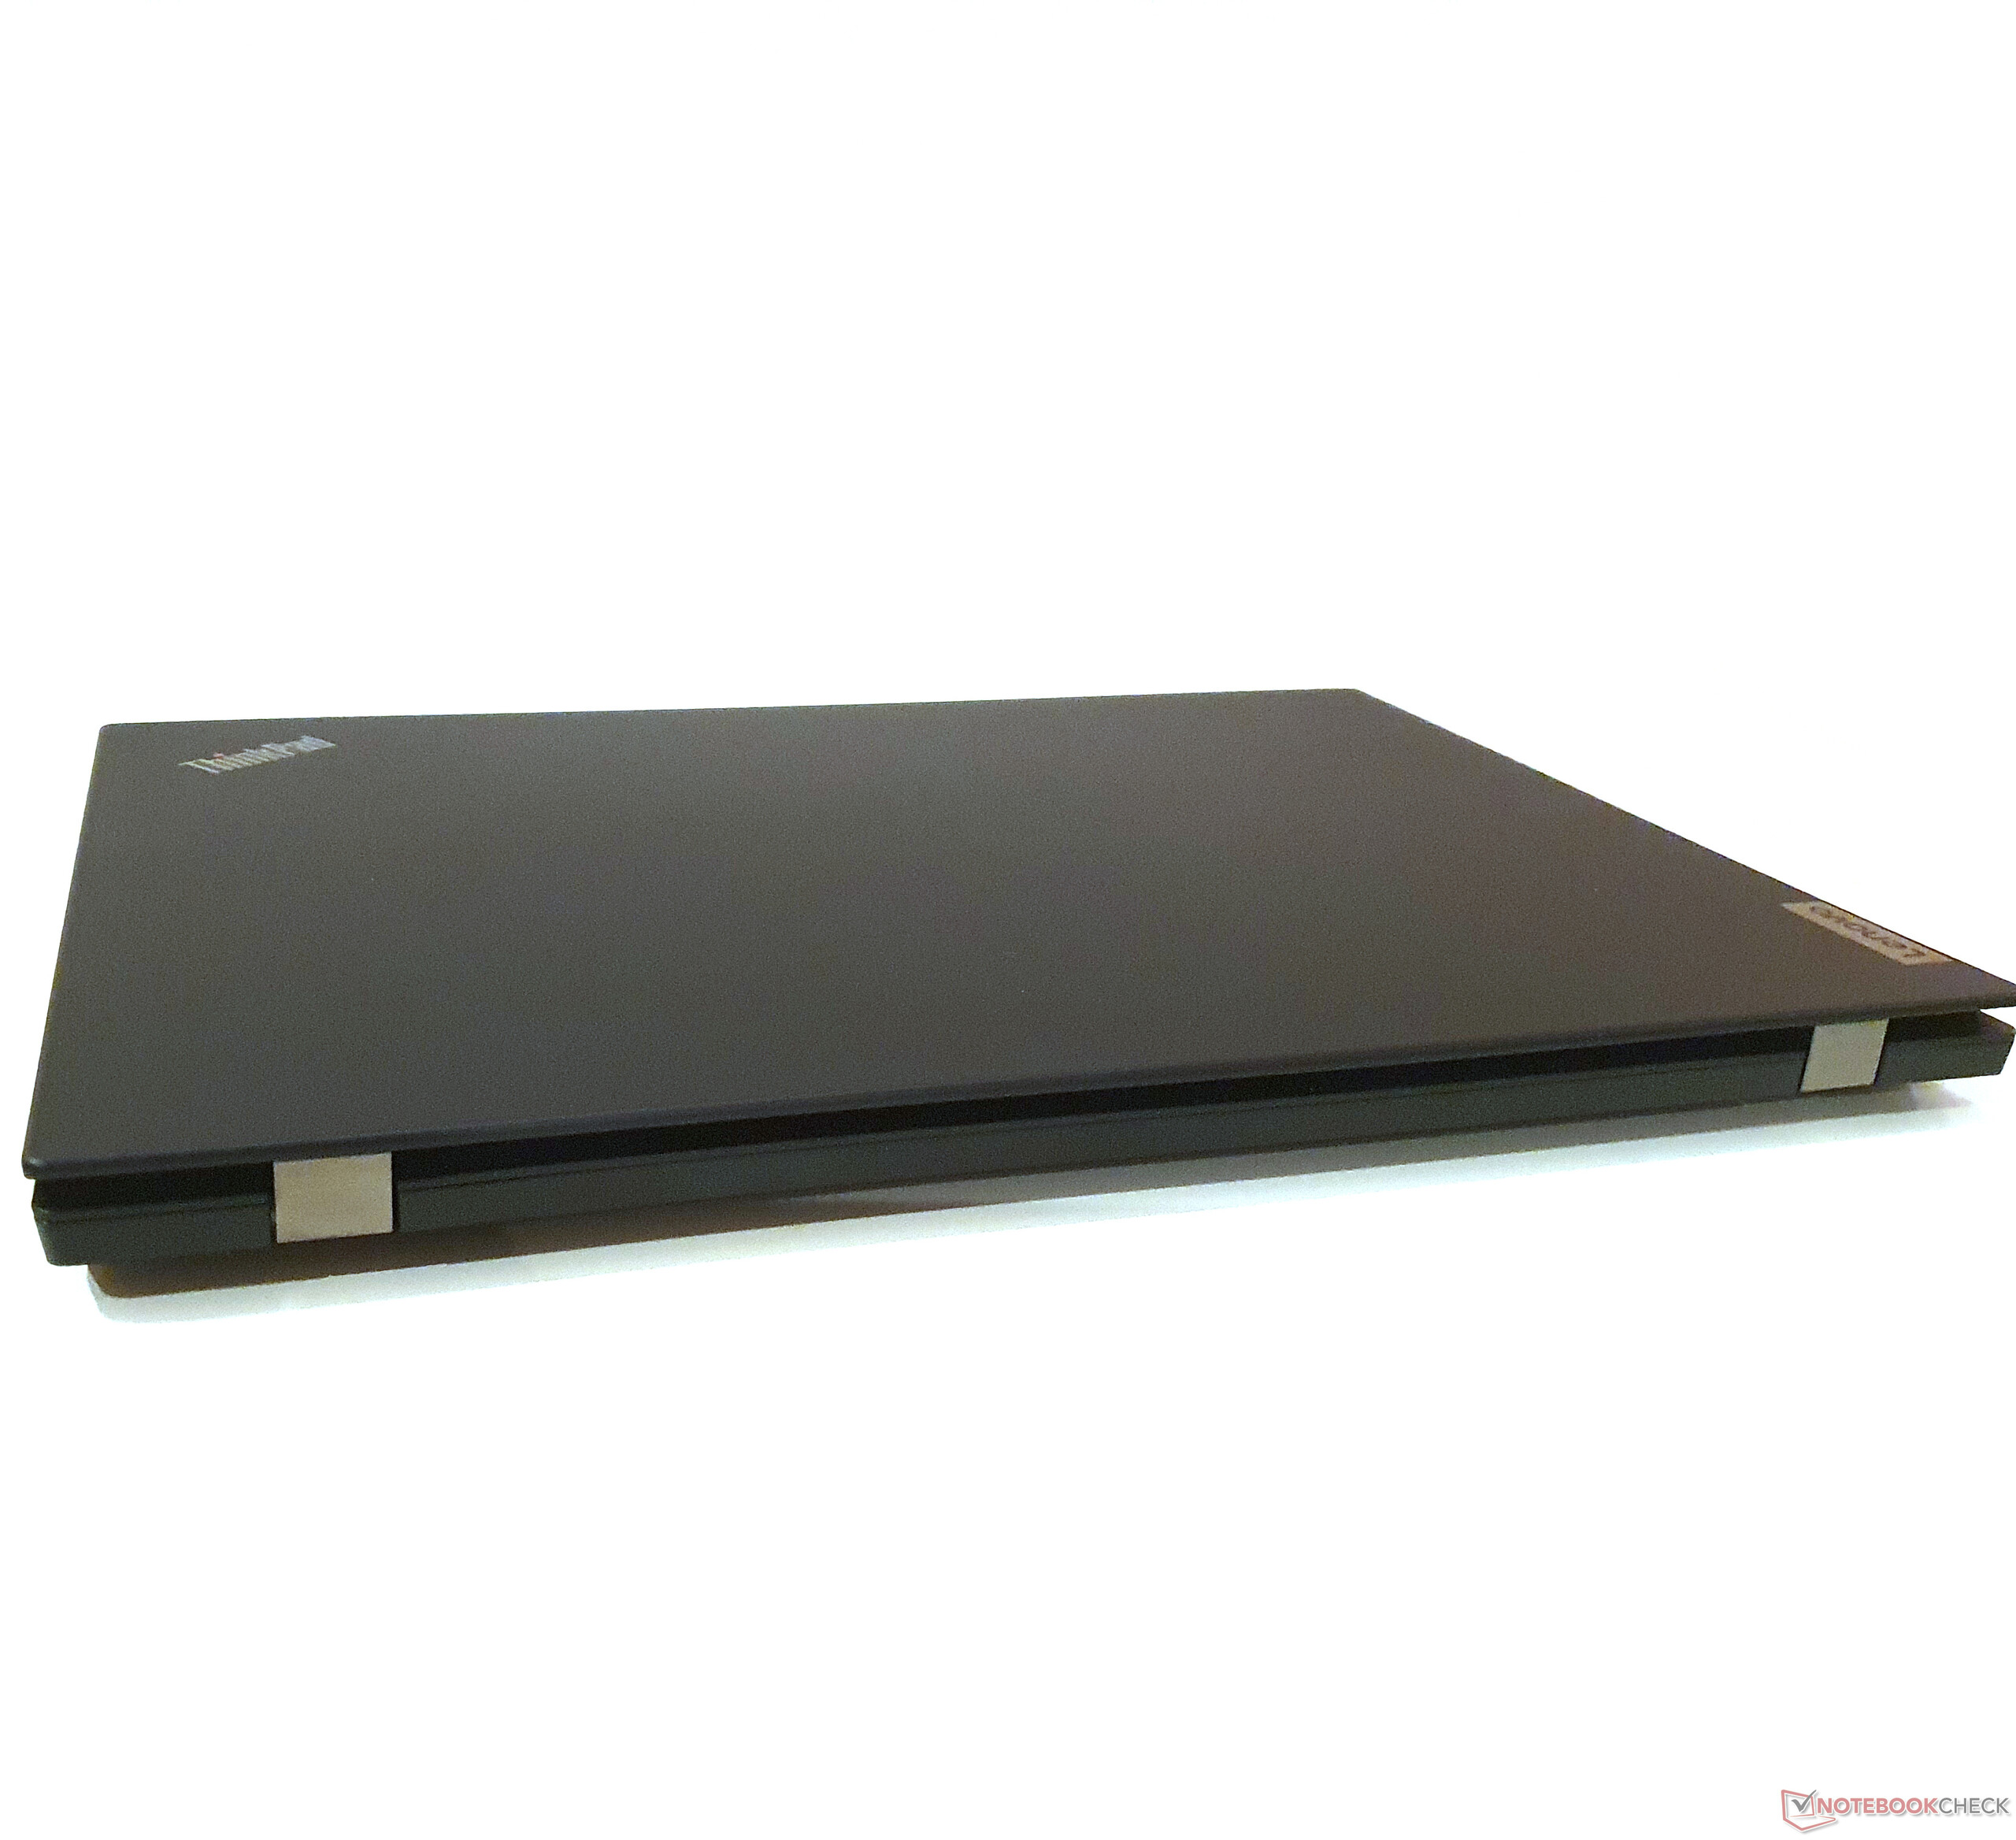
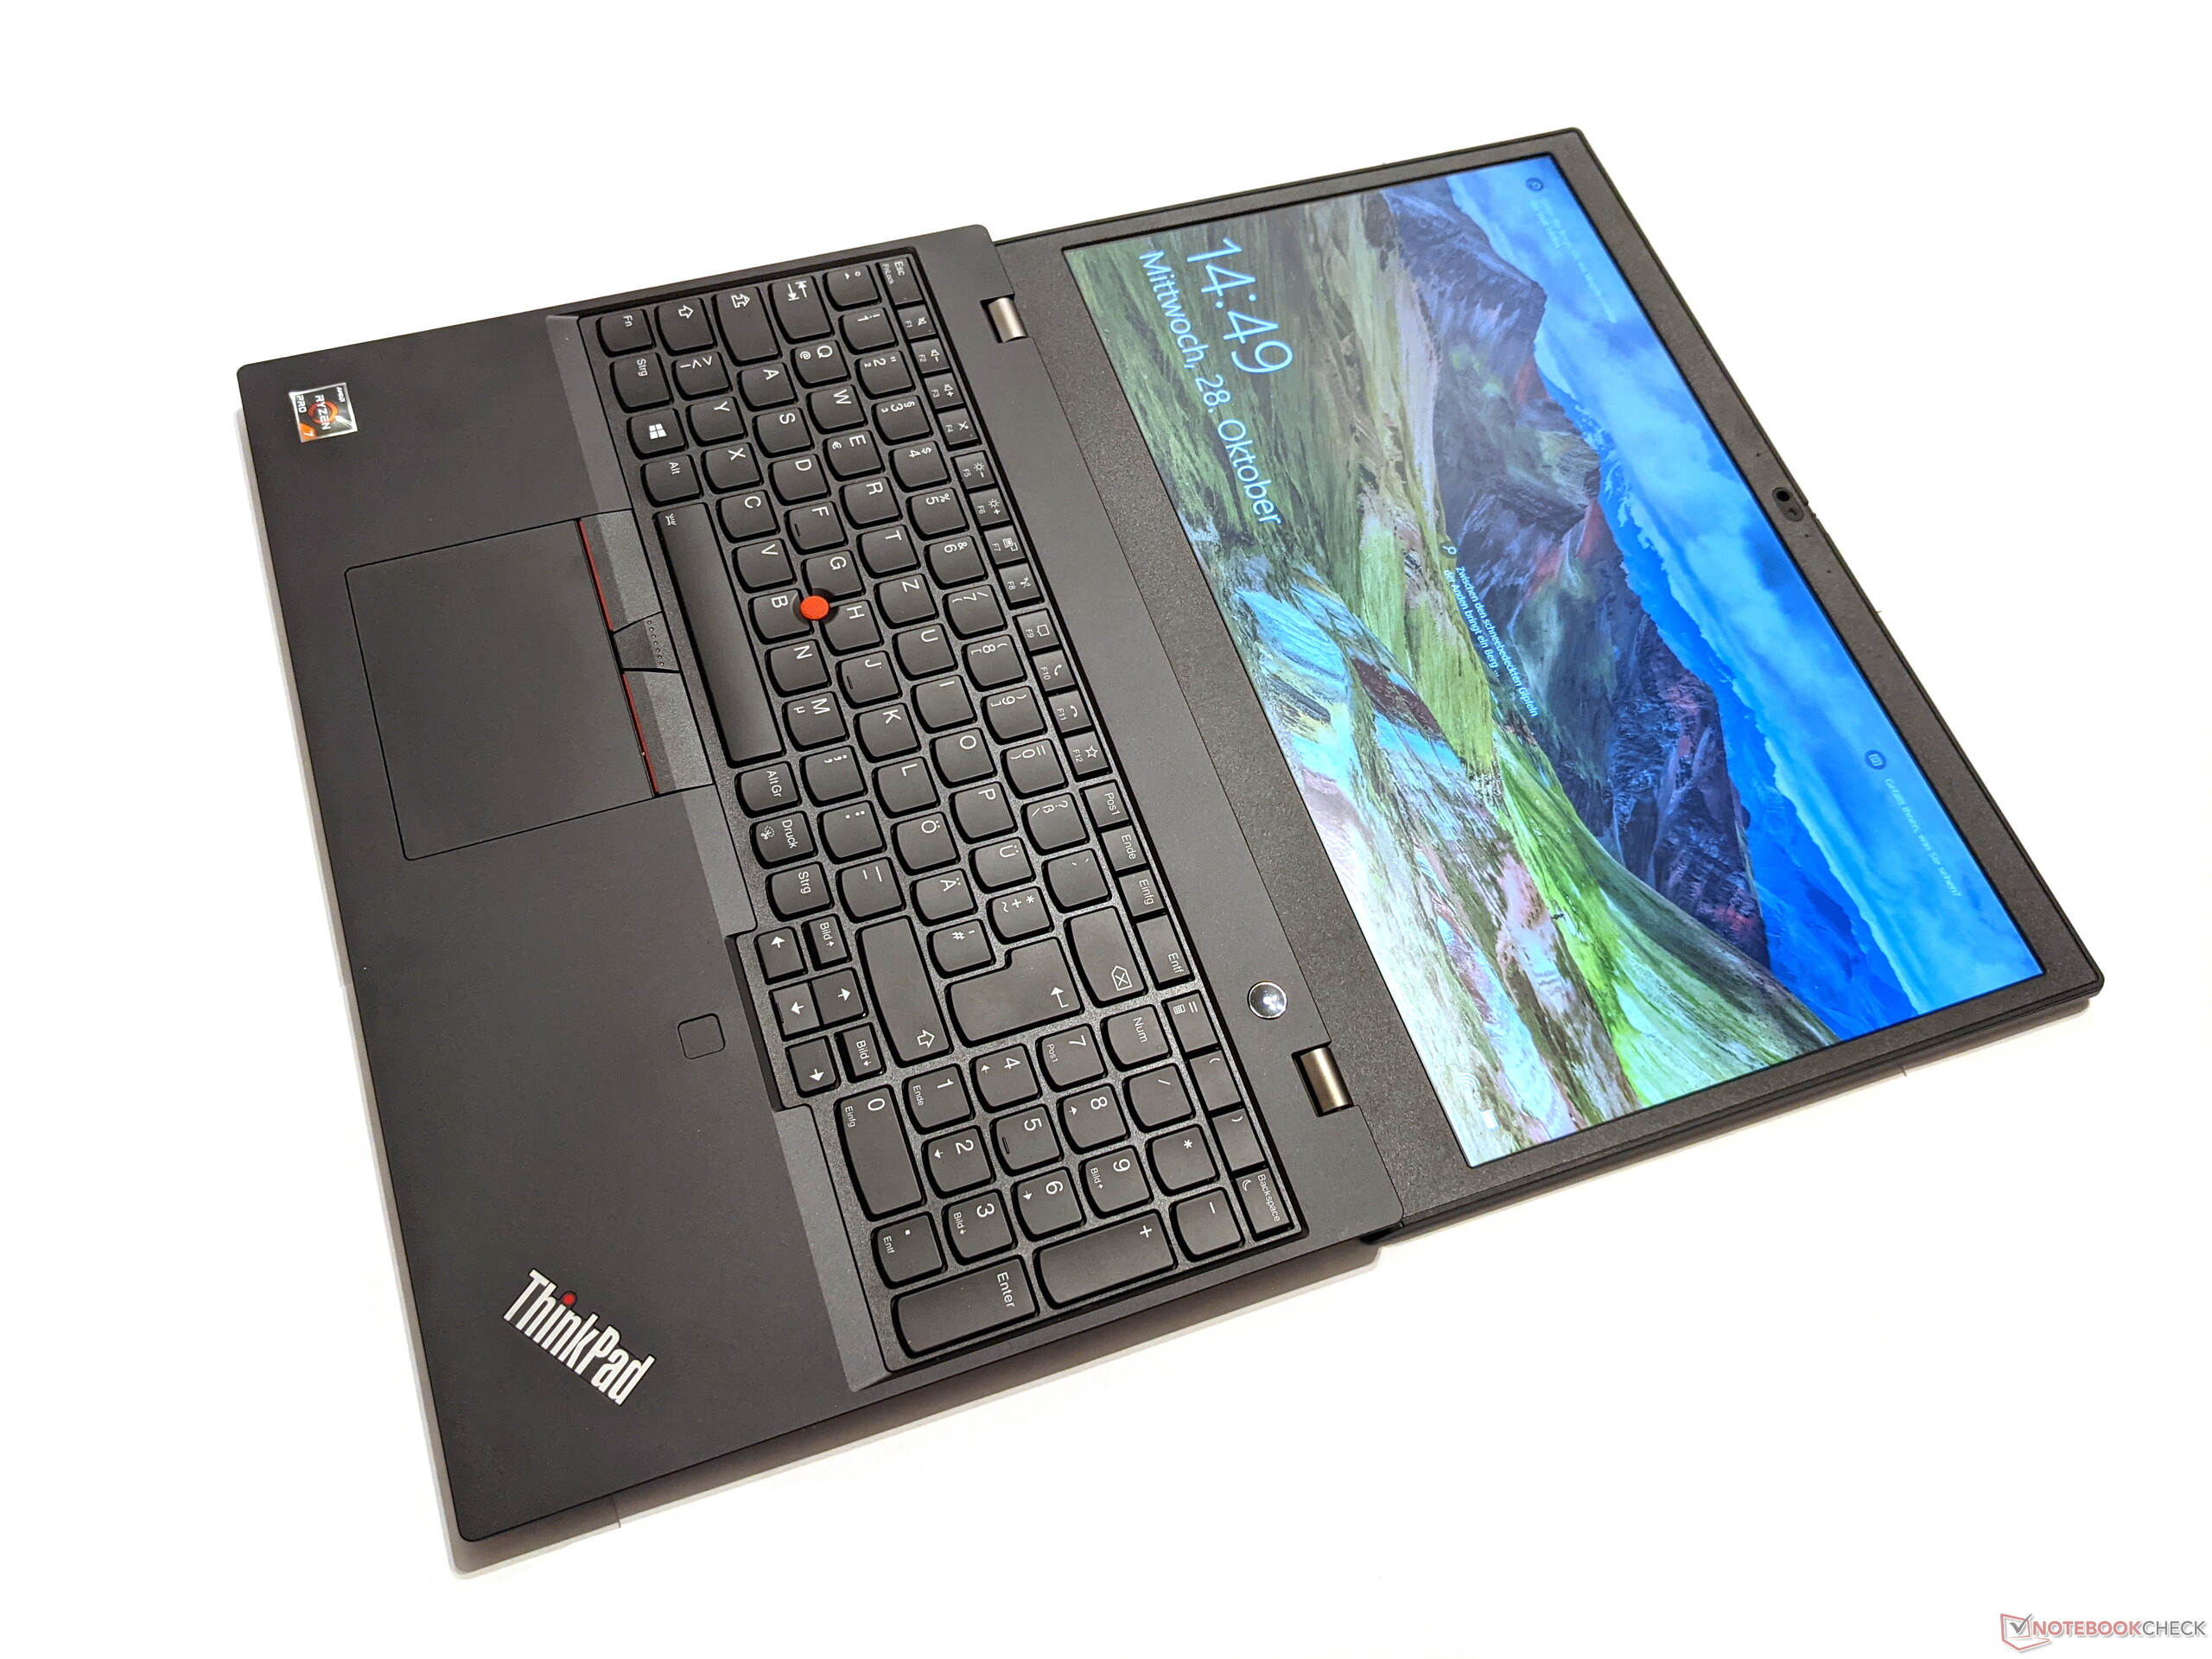
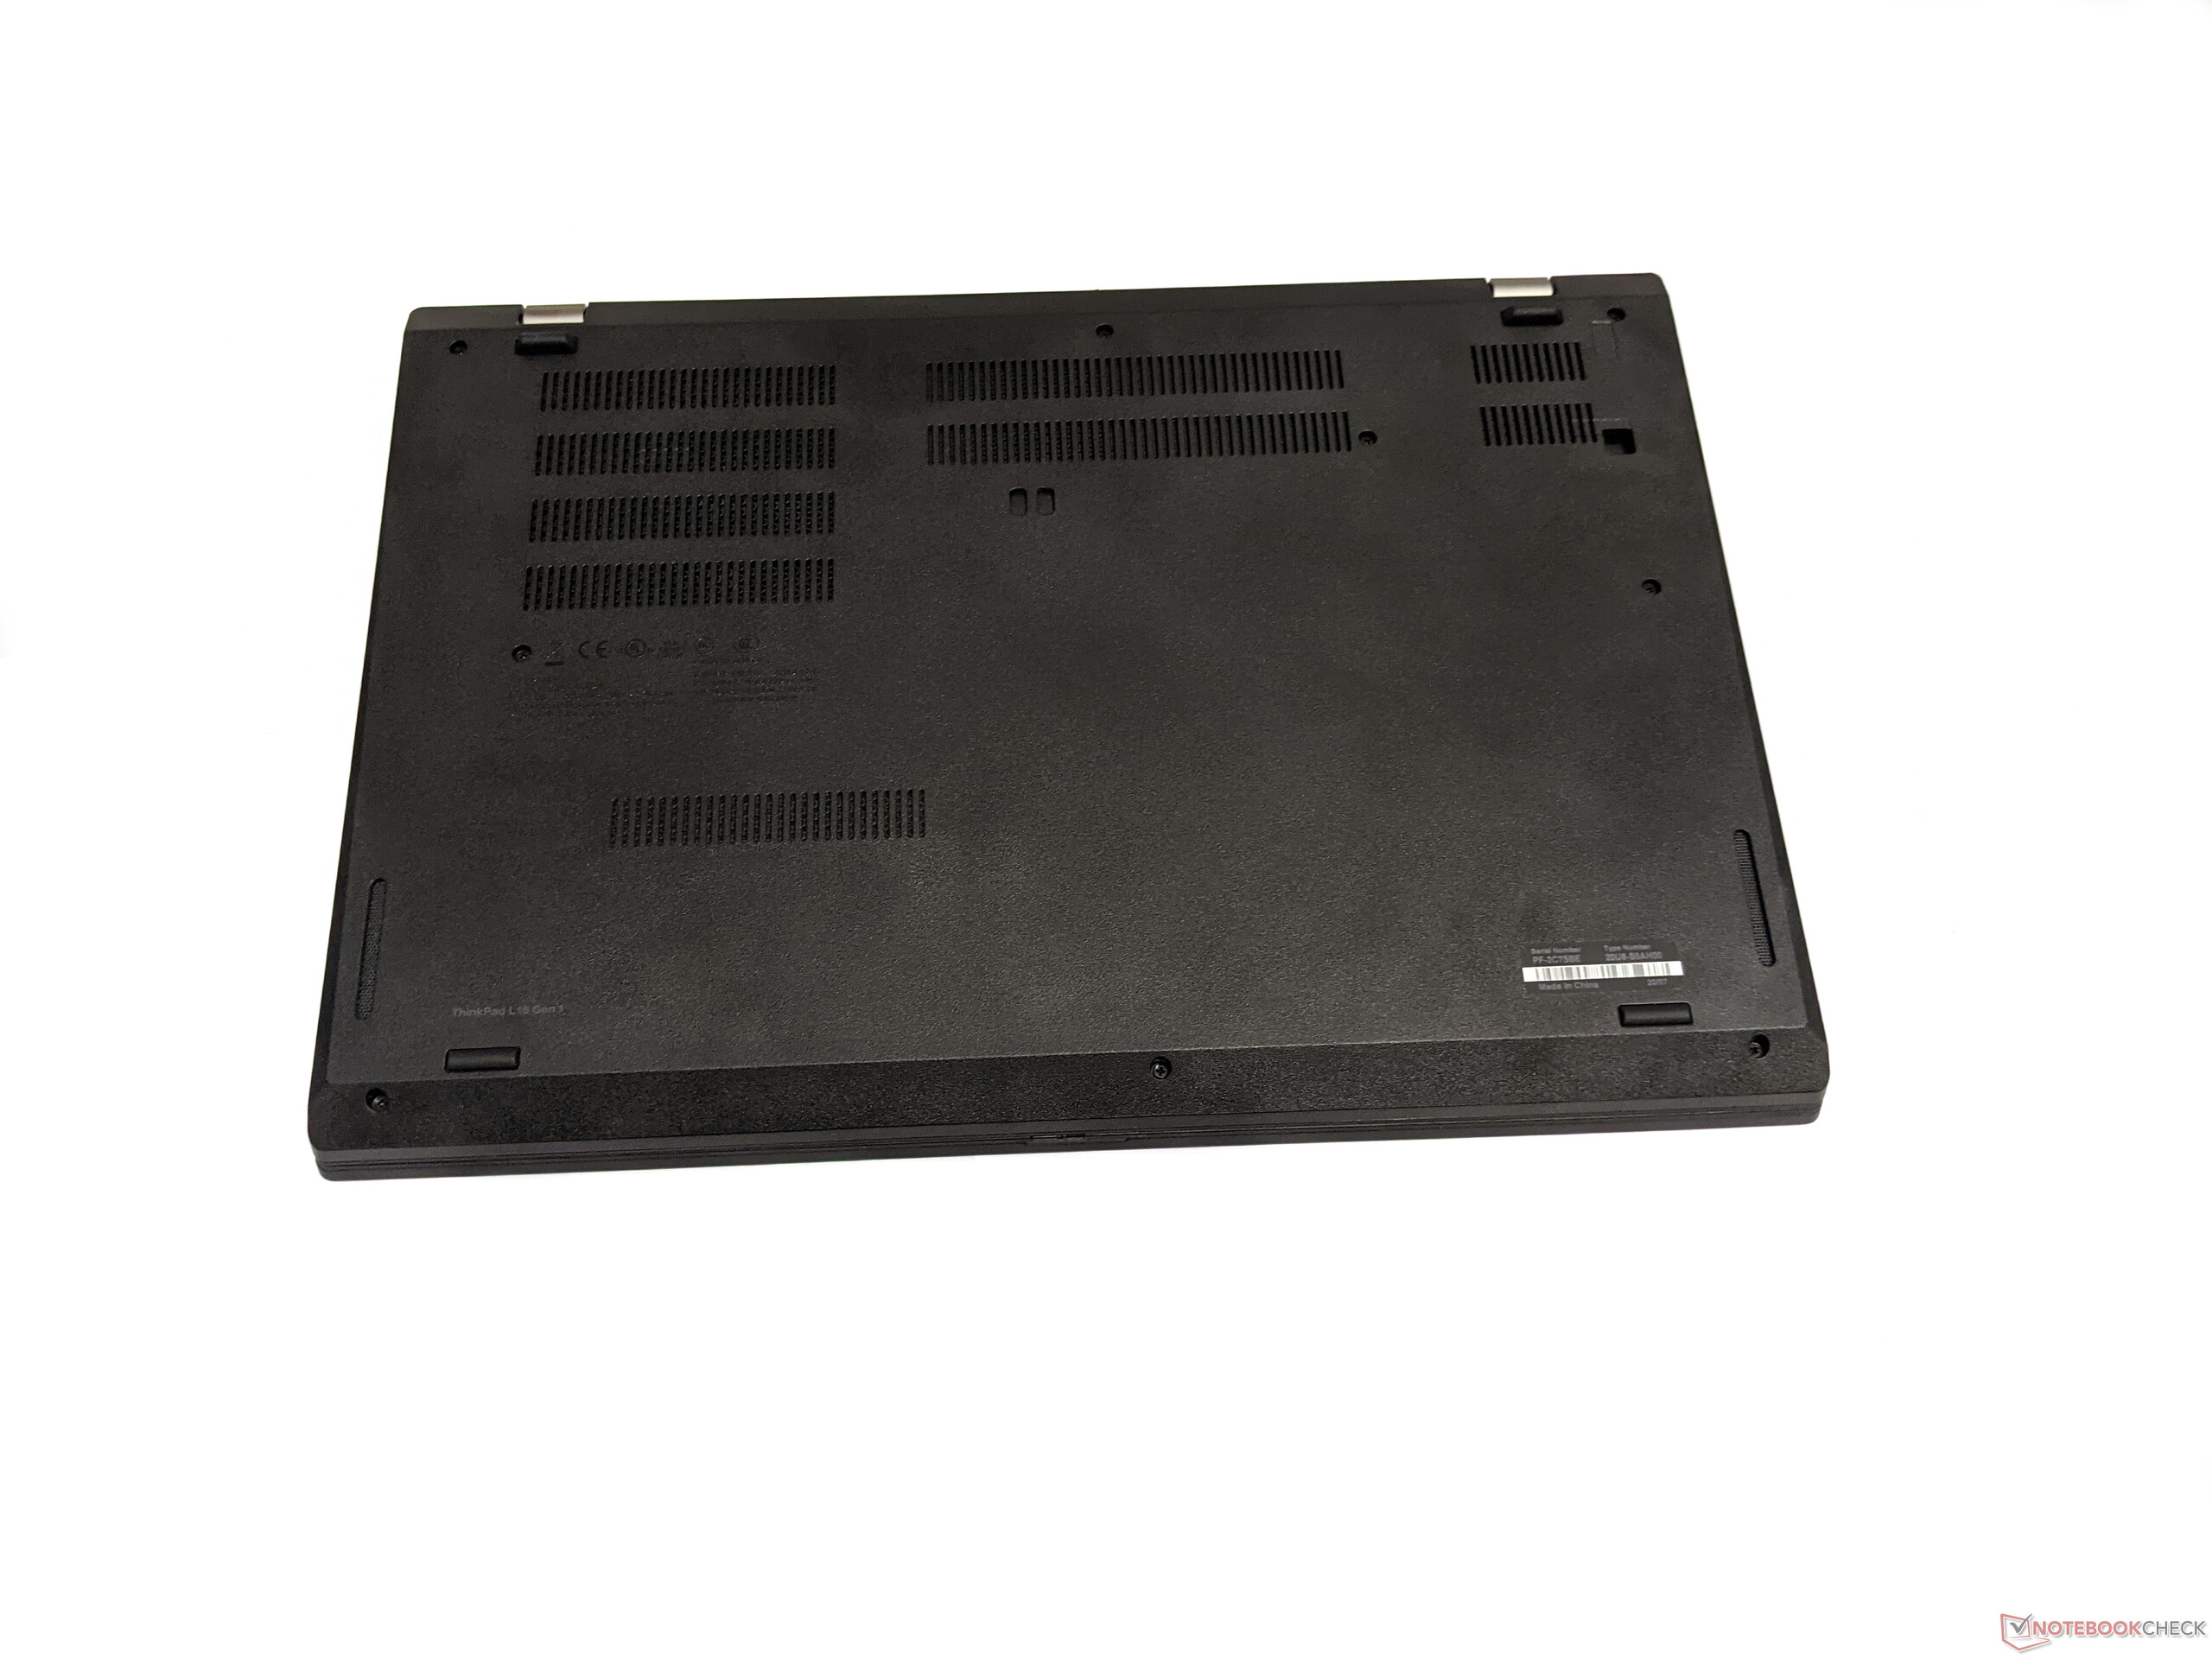
Le ThinkPad L15 s'avère être un appareil tout à fait efficace au quotidien. La qualité de construction sans faille, la solidité et le design sobre mais élégant donnent au PC portable de bureau une apparence discrète mais de haute qualité. De plus, grâce à l'AMD Ryzen 7 Pro 4750U, le portable fournit plus de puissance que nécessaire pour sa cible, qui profite également des excellents périphériques d'entrée. En particulier, l'efficience et les performances de l'actuelle génération Ryzen dans le multitâche avec des scénarios exigeants pour le CPU sont impressionnantes. Nous apprécions le contraste de l'écran, mais la luminosité est vraiment au minimum.
Le ThinkPad L15 impressionne avec son apparence à la fois élégante et discrète, son clavier confortable, et ses bonne performances.
Les principaux défauts de la machine sont son autonomie trop juste, et sa RAM qui fonctionne en mode mono-canal. Les nomades devraient aller voir chez la concurrence. Au final, avec le ThinkPad L15, on aura un PC portable puissant et bien construit, avec des défauts mineurs qui ne font pas le poids face aux qualités de la machine - en fonction du scénario d'usage de la machine.
L’intégralité de cette critique est disponible en anglais en suivant ce lien.
Lenovo ThinkPad L15-20U8S0AH00
- 11/07/2020 v7 (old)
Marius Schell
Price comparison
