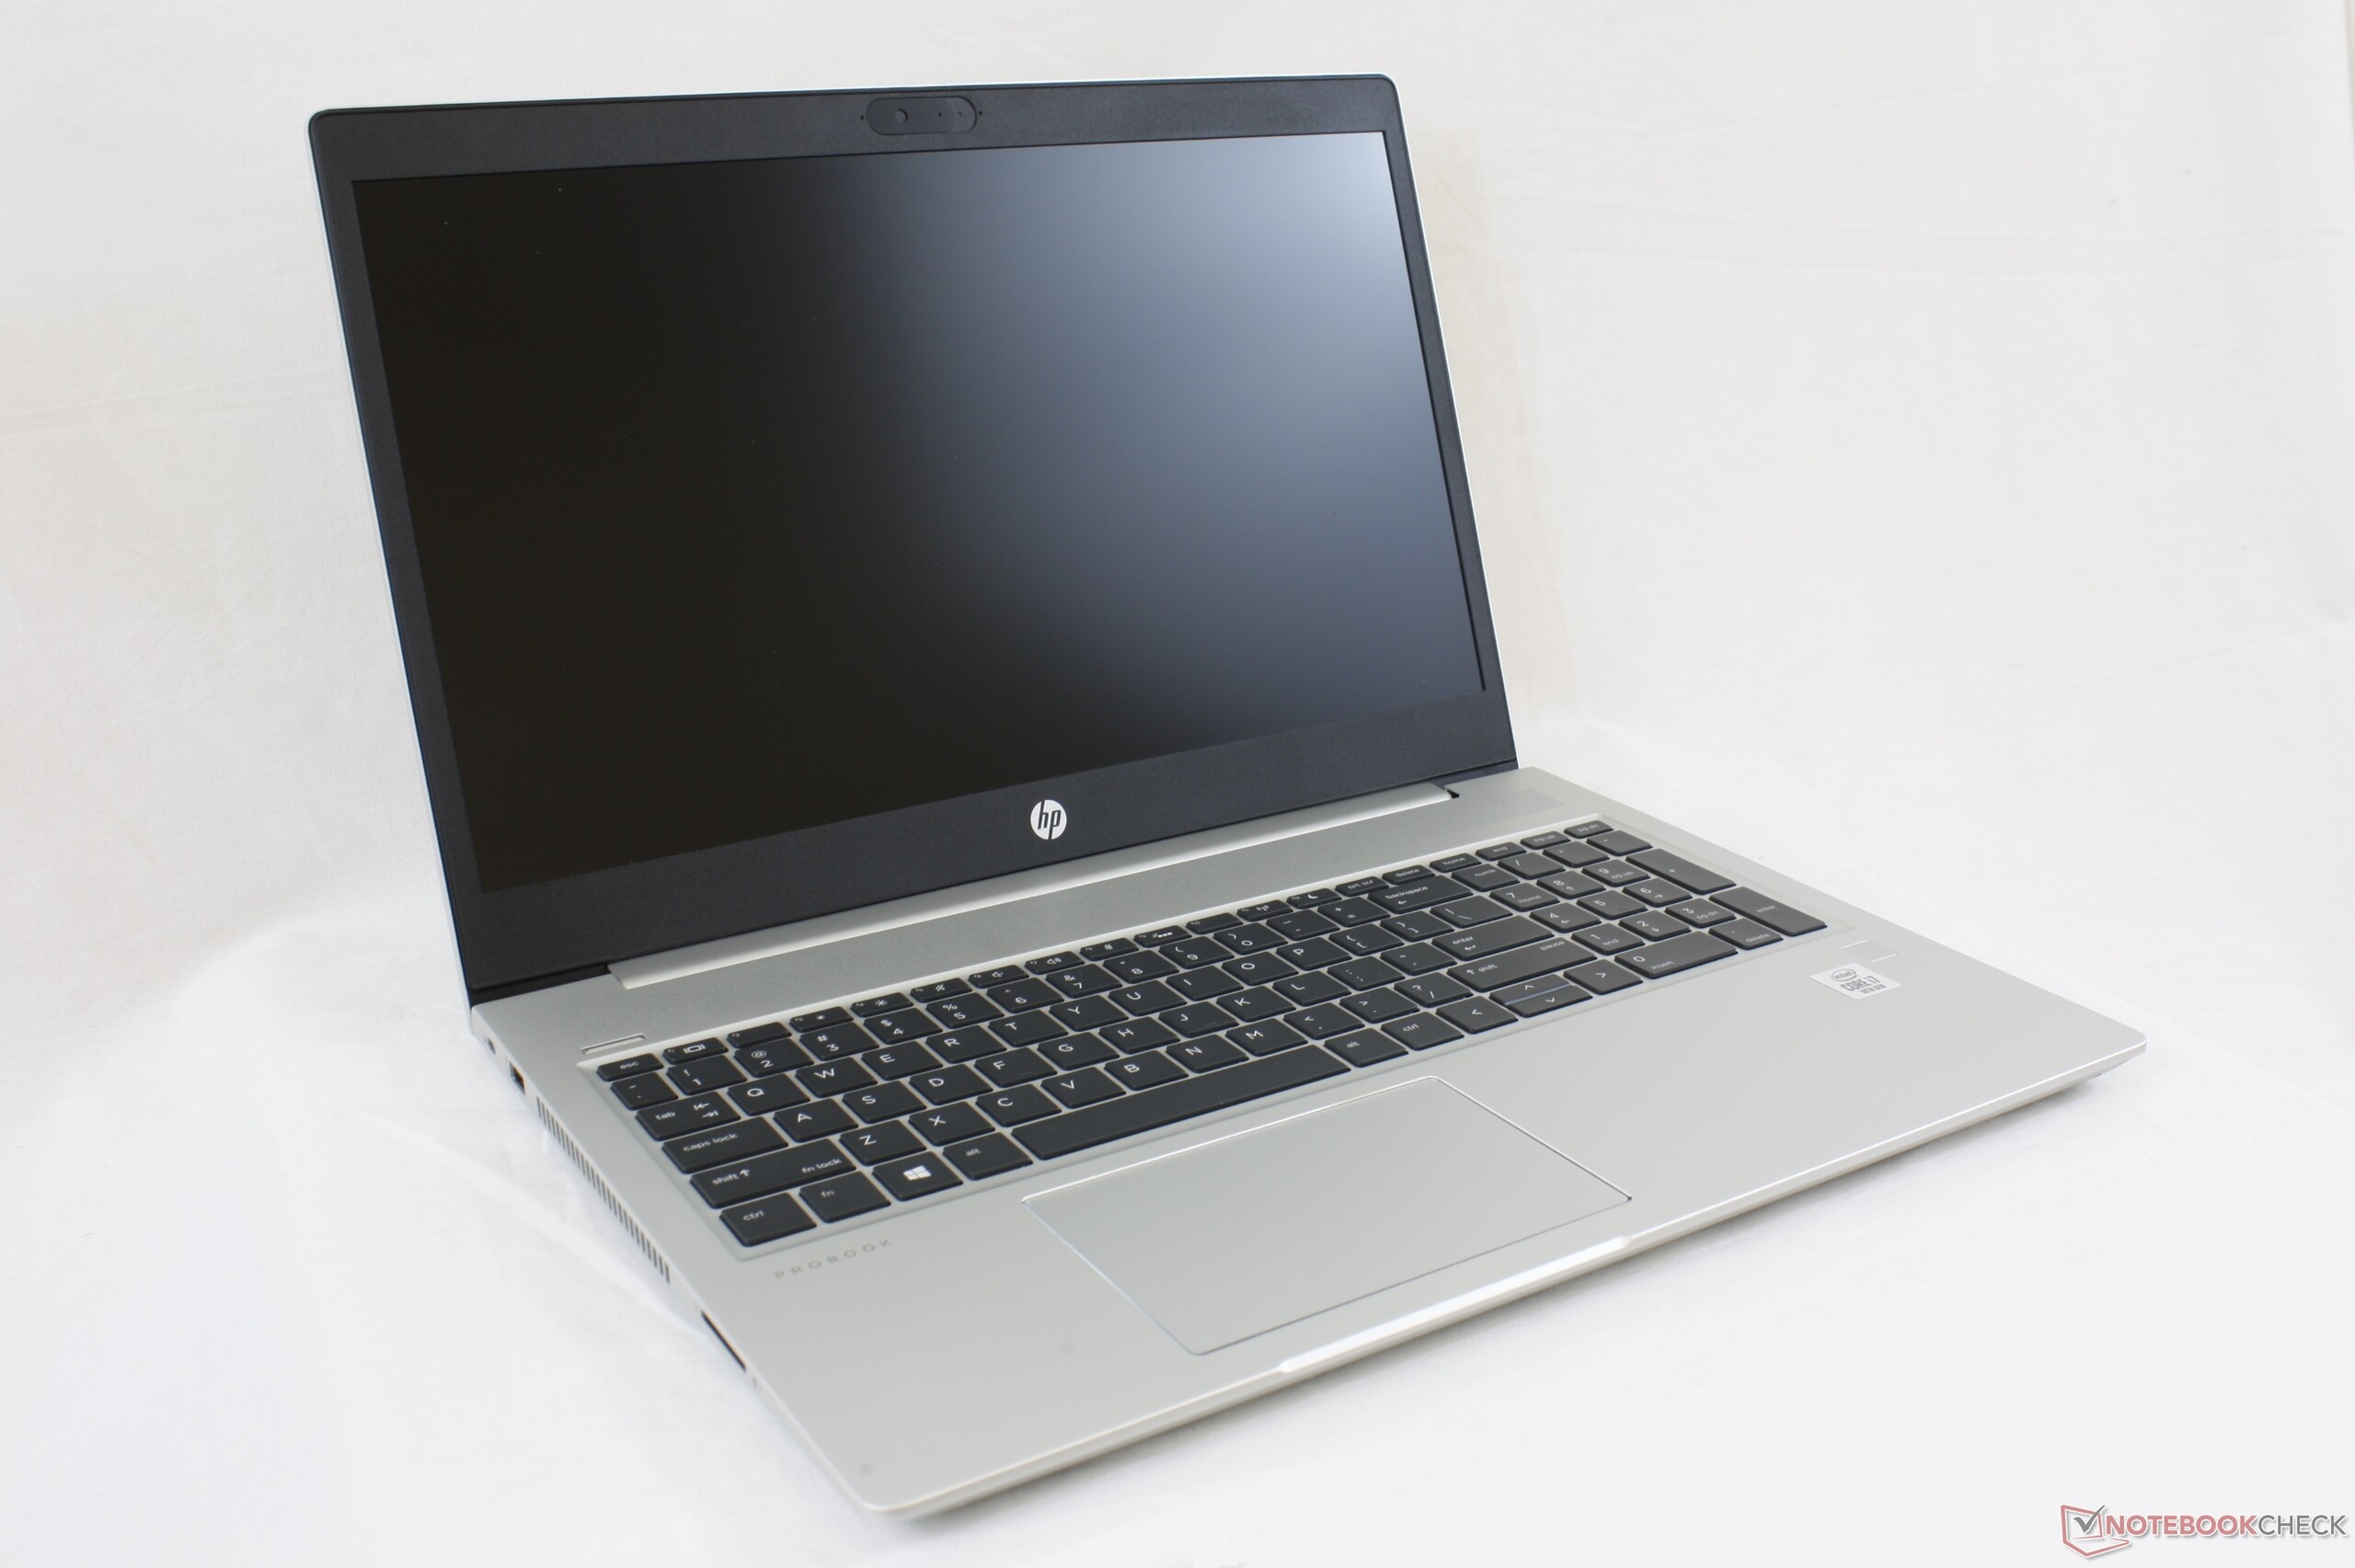
Test du HP ProBook 450 G7 (i7-10510U, MX250, FHD) : est-il meilleur que le ProBook 455 G7 avec Ryzen 7 ?
Note | Date | Modèle | Poids | Épaisseur | Taille | Résolution | Prix |
|---|---|---|---|---|---|---|---|
| 81.4 % v7 (old) | 09/20 | HP ProBook 450 G7 8WC04UT i7-10510U, GeForce MX250 | 1.9 kg | 19 mm | 15.60" | 1920x1080 | |
| 82.6 % v7 (old) | 09/20 | HP ProBook 455 G7-175W8EA R7 4700U, Vega 7 | 1.8 kg | 19 mm | 15.60" | 1920x1080 | |
| 80.1 % v7 (old) | 02/20 | MSI Modern 15 A10RB i7-10510U, GeForce MX250 | 1.6 kg | 15.9 mm | 15.60" | 1920x1080 | |
| 79.6 % v6 (old) | 07/19 | Dell Latitude 15 3590 i5-8250U, UHD Graphics 620 | 2.1 kg | 22 mm | 15.60" | 1920x1080 | |
| 83.2 % v7 (old) | 10/19 | Lenovo ThinkPad L590-20Q70019GE i5-8265U, UHD Graphics 620 | 2 kg | 23 mm | 15.60" | 1920x1080 | |
| 82.9 % v7 (old) | 11/19 | Dynabook Tecra X50-F i7-8665U, UHD Graphics 620 | 1.4 kg | 17.6 mm | 15.60" | 1920x1080 |
| SD Card Reader | |
| average JPG Copy Test (av. of 3 runs) | |
| HP EliteBook 1050 G1-4QY20EA (Toshiba Exceria Pro SDXC 64 GB UHS-II) | |
| HP ProBook 455 G7-175W8EA (Toshiba Exceria Pro SDXC 64 GB UHS-II) | |
| HP ProBook 450 G7 8WC04UT (Toshiba Exceria Pro SDXC 64 GB UHS-II) | |
| Lenovo ThinkPad L590-20Q70019GE (Toshiba Exceria Pro M501 64 GB UHS-II) | |
| MSI Modern 15 A10RB (Toshiba Exceria Pro M501 UHS-II) | |
| Dell Latitude 15 3590 (Toshiba Exceria Pro SDXC 64 GB UHS-II) | |
| maximum AS SSD Seq Read Test (1GB) | |
| HP EliteBook 1050 G1-4QY20EA (Toshiba Exceria Pro SDXC 64 GB UHS-II) | |
| HP ProBook 455 G7-175W8EA (Toshiba Exceria Pro SDXC 64 GB UHS-II) | |
| Lenovo ThinkPad L590-20Q70019GE (Toshiba Exceria Pro M501 64 GB UHS-II) | |
| HP ProBook 450 G7 8WC04UT (Toshiba Exceria Pro SDXC 64 GB UHS-II) | |
| MSI Modern 15 A10RB (Toshiba Exceria Pro M501 UHS-II) | |
| Dell Latitude 15 3590 (Toshiba Exceria Pro SDXC 64 GB UHS-II) | |


| |||||||||||||||||||||||||
Homogénéité de la luminosité: 91 %
Valeur mesurée au centre, sur batterie: 224.3 cd/m²
Contraste: 619:1 (Valeurs des noirs: 0.42 cd/m²)
ΔE ColorChecker Calman: 6.09 | ∀{0.5-29.43 Ø4.73}
calibrated: 5.2
ΔE Greyscale Calman: 3.7 | ∀{0.09-98 Ø4.97}
56.2% sRGB (Argyll 1.6.3 3D)
35.7% AdobeRGB 1998 (Argyll 1.6.3 3D)
39.08% AdobeRGB 1998 (Argyll 3D)
56.5% sRGB (Argyll 3D)
37.9% Display P3 (Argyll 3D)
Gamma: 2.56
CCT: 6759 K
| HP ProBook 450 G7 8WC04UT LG Philips LGD062E, IPS, 15.6", 1920x1080 | HP ProBook 455 G7-175W8EA AUO, B156HW02, IPS, 15.6", 1920x1080 | MSI Modern 15 A10RB Chi Mei N156HCE-EN1, IPS, 15.6", 1920x1080 | Dell Latitude 15 3590 BOE0802 / NT15N41 / Dell: M9P74, TN LED, 15.6", 1920x1080 | Lenovo ThinkPad L590-20Q70019GE N156HCE-EAA, IPS, 15.6", 1920x1080 | Dynabook Tecra X50-F Toshiba TOS508F, IPS, 15.6", 1920x1080 | |
|---|---|---|---|---|---|---|
| Display | 0% | 69% | 5% | 14% | -3% | |
| Display P3 Coverage (%) | 37.9 | 37.92 0% | 66 74% | 39.67 5% | 43.3 14% | 36.68 -3% |
| sRGB Coverage (%) | 56.5 | 57.1 1% | 92.1 63% | 59.7 6% | 64.4 14% | 55 -3% |
| AdobeRGB 1998 Coverage (%) | 39.08 | 39.18 0% | 66.5 70% | 40.99 5% | 44.81 15% | 37.92 -3% |
| Response Times | -1% | -18% | 23% | -12% | 4% | |
| Response Time Grey 50% / Grey 80% * (ms) | 35.2 ? | 41 ? -16% | 43.2 ? -23% | 41 ? -16% | 42.8 ? -22% | 38 ? -8% |
| Response Time Black / White * (ms) | 30.4 ? | 26 ? 14% | 34.4 ? -13% | 12 ? 61% | 30.8 ? -1% | 25.6 ? 16% |
| PWM Frequency (Hz) | 26040 ? | 250 ? | 24510 ? | |||
| Screen | 20% | 41% | -28% | 11% | 3% | |
| Brightness middle (cd/m²) | 259.8 | 282 9% | 289.4 11% | 215 -17% | 247 -5% | 295.9 14% |
| Brightness (cd/m²) | 251 | 264 5% | 273 9% | 214 -15% | 228 -9% | 270 8% |
| Brightness Distribution (%) | 91 | 88 -3% | 82 -10% | 91 0% | 81 -11% | 86 -5% |
| Black Level * (cd/m²) | 0.42 | 0.19 55% | 0.27 36% | 0.385 8% | 0.18 57% | 0.3 29% |
| Contrast (:1) | 619 | 1484 140% | 1072 73% | 558 -10% | 1372 122% | 986 59% |
| Colorchecker dE 2000 * | 6.09 | 5.56 9% | 2.32 62% | 10.31 -69% | 5.9 3% | 6.55 -8% |
| Colorchecker dE 2000 max. * | 16.33 | 19.07 -17% | 5.76 65% | 20.44 -25% | 22.9 -40% | 21.52 -32% |
| Colorchecker dE 2000 calibrated * | 5.2 | 4.5 13% | 2.49 52% | 3.88 25% | 4.7 10% | 5.73 -10% |
| Greyscale dE 2000 * | 3.7 | 3.57 4% | 3 19% | 11.84 -220% | 5.1 -38% | 4.3 -16% |
| Gamma | 2.56 86% | 2.61 84% | 2.22 99% | 2.67 82% | 2.21 100% | 2.475 89% |
| CCT | 6759 96% | 6895 94% | 6867 95% | 13398 49% | 6398 102% | 7002 93% |
| Color Space (Percent of AdobeRGB 1998) (%) | 35.7 | 36 1% | 59.8 68% | 39 9% | 41.2 15% | 35 -2% |
| Color Space (Percent of sRGB) (%) | 56.2 | 57 1% | 92 64% | 61 9% | 64.1 14% | 54 -4% |
| Moyenne finale (programmes/paramètres) | 6% /
14% | 31% /
39% | 0% /
-15% | 4% /
9% | 1% /
2% |
* ... Moindre est la valeur, meilleures sont les performances
Temps de réponse de l'écran
| ↔ Temps de réponse noir à blanc | ||
|---|---|---|
| 30.4 ms ... hausse ↗ et chute ↘ combinées | ↗ 19.6 ms hausse | 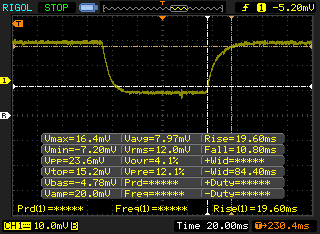 |
| ↘ 10.8 ms chute | ||
| L'écran souffre de latences très élevées, à éviter pour le jeu. En comparaison, tous les appareils testés affichent entre 0.1 (minimum) et 240 (maximum) ms. » 82 % des appareils testés affichent de meilleures performances. Cela signifie que les latences relevées sont moins bonnes que la moyenne (19.9 ms) de tous les appareils testés. | ||
| ↔ Temps de réponse gris 50% à gris 80% | ||
| 35.2 ms ... hausse ↗ et chute ↘ combinées | ↗ 19.6 ms hausse | 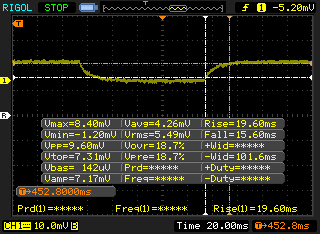 |
| ↘ 15.6 ms chute | ||
| L'écran souffre de latences très élevées, à éviter pour le jeu. En comparaison, tous les appareils testés affichent entre 0.165 (minimum) et 636 (maximum) ms. » 49 % des appareils testés affichent de meilleures performances. Cela signifie que les latences relevées sont moins bonnes que la moyenne (31.1 ms) de tous les appareils testés. | ||
Scintillement / MLI (Modulation de largeur d'impulsion)
| Scintillement / MLI (Modulation de largeur d'impulsion) non décelé | 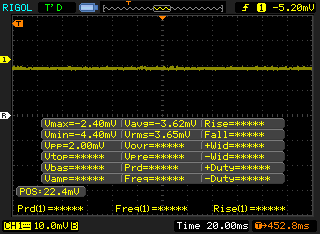 | ||
En comparaison, 52 % des appareils testés n'emploient pas MDI pour assombrir leur écran. Nous avons relevé une moyenne à 7798 (minimum : 5 - maximum : 343500) Hz dans le cas où une MDI était active. | |||
Cinebench R15: CPU Multi 64Bit | CPU Single 64Bit
Blender: v2.79 BMW27 CPU
7-Zip 18.03: 7z b 4 -mmt1 | 7z b 4
Geekbench 5.5: Single-Core | Multi-Core
HWBOT x265 Benchmark v2.2: 4k Preset
LibreOffice : 20 Documents To PDF
R Benchmark 2.5: Overall mean
| Cinebench R20 / CPU (Multi Core) | |
| HP ProBook 455 G7-175W8EA | |
| MSI Prestige 15 A10SC | |
| Microsoft Surface Laptop 3 15 i7-1065G7 | |
| Lenovo ThinkBook 15 | |
| Moyenne Intel Core i7-10510U (1015 - 1897, n=38) | |
| Lenovo ThinkPad L590-20Q70019GE | |
| Lenovo ThinkPad E590-20NB0012GE | |
| HP ProBook 450 G7 8WC04UT | |
| LG Gram 15Z90N | |
| Lenovo IdeaPad 3 14IIL05 | |
| HP 17-by2437ng | |
| Cinebench R20 / CPU (Single Core) | |
| HP ProBook 455 G7-175W8EA | |
| MSI Prestige 15 A10SC | |
| Microsoft Surface Laptop 3 15 i7-1065G7 | |
| Moyenne Intel Core i7-10510U (362 - 497, n=37) | |
| Lenovo ThinkPad E590-20NB0012GE | |
| Lenovo ThinkBook 15 | |
| Lenovo ThinkPad L590-20Q70019GE | |
| HP 17-by2437ng | |
| HP ProBook 450 G7 8WC04UT | |
| LG Gram 15Z90N | |
| Lenovo IdeaPad 3 14IIL05 | |
| Cinebench R15 / CPU Multi 64Bit | |
| MSI Prestige 15 A10SC | |
| HP ProBook 455 G7-175W8EA | |
| Microsoft Surface Laptop 3 15 i7-1065G7 | |
| Lenovo ThinkBook 15 | |
| Moyenne Intel Core i7-10510U (482 - 856, n=45) | |
| LG Gram 15Z90N | |
| Lenovo ThinkPad E590-20NB0012GE | |
| Lenovo ThinkPad L590-20Q70019GE | |
| HP ProBook 450 G7 8WC04UT | |
| Lenovo IdeaPad 3 14IIL05 | |
| HP 17-by2437ng | |
| Cinebench R15 / CPU Single 64Bit | |
| MSI Prestige 15 A10SC | |
| Microsoft Surface Laptop 3 15 i7-1065G7 | |
| Lenovo ThinkPad E590-20NB0012GE | |
| HP ProBook 455 G7-175W8EA | |
| Moyenne Intel Core i7-10510U (113 - 202, n=42) | |
| Lenovo ThinkBook 15 | |
| Lenovo ThinkPad L590-20Q70019GE | |
| HP 17-by2437ng | |
| Lenovo IdeaPad 3 14IIL05 | |
| LG Gram 15Z90N | |
| HP ProBook 450 G7 8WC04UT | |
| Blender / v2.79 BMW27 CPU | |
| HP 17-by2437ng | |
| Lenovo IdeaPad 3 14IIL05 | |
| LG Gram 15Z90N | |
| HP ProBook 450 G7 8WC04UT | |
| Lenovo ThinkPad L590-20Q70019GE | |
| Lenovo ThinkPad E590-20NB0012GE | |
| Moyenne Intel Core i7-10510U (628 - 1051, n=31) | |
| Lenovo ThinkBook 15 | |
| HP ProBook 455 G7-175W8EA | |
| 7-Zip 18.03 / 7z b 4 -mmt1 | |
| Lenovo ThinkPad E590-20NB0012GE | |
| Moyenne Intel Core i7-10510U (3747 - 4981, n=31) | |
| HP 17-by2437ng | |
| HP ProBook 455 G7-175W8EA | |
| Lenovo ThinkBook 15 | |
| LG Gram 15Z90N | |
| Lenovo IdeaPad 3 14IIL05 | |
| HP ProBook 450 G7 8WC04UT | |
| Lenovo ThinkPad L590-20Q70019GE | |
| 7-Zip 18.03 / 7z b 4 | |
| HP ProBook 455 G7-175W8EA | |
| Lenovo ThinkBook 15 | |
| Moyenne Intel Core i7-10510U (12196 - 21298, n=31) | |
| Lenovo ThinkPad E590-20NB0012GE | |
| Lenovo ThinkPad L590-20Q70019GE | |
| LG Gram 15Z90N | |
| HP ProBook 450 G7 8WC04UT | |
| Lenovo IdeaPad 3 14IIL05 | |
| HP 17-by2437ng | |
| Geekbench 5.5 / Single-Core | |
| HP ProBook 450 G7 8WC04UT | |
| Moyenne Intel Core i7-10510U (977 - 1287, n=31) | |
| LG Gram 15Z90N | |
| Lenovo IdeaPad 3 14IIL05 | |
| HP ProBook 455 G7-175W8EA | |
| HP 17-by2437ng | |
| Geekbench 5.5 / Multi-Core | |
| HP ProBook 455 G7-175W8EA | |
| Moyenne Intel Core i7-10510U (2474 - 4484, n=31) | |
| HP ProBook 450 G7 8WC04UT | |
| LG Gram 15Z90N | |
| Lenovo IdeaPad 3 14IIL05 | |
| HP 17-by2437ng | |
| HWBOT x265 Benchmark v2.2 / 4k Preset | |
| HP ProBook 455 G7-175W8EA | |
| Lenovo ThinkBook 15 | |
| Moyenne Intel Core i7-10510U (3.41 - 6.04, n=31) | |
| Lenovo ThinkPad E590-20NB0012GE | |
| Lenovo ThinkPad L590-20Q70019GE | |
| Lenovo IdeaPad 3 14IIL05 | |
| HP ProBook 450 G7 8WC04UT | |
| HP 17-by2437ng | |
| LibreOffice / 20 Documents To PDF | |
| HP ProBook 455 G7-175W8EA | |
| HP ProBook 450 G7 8WC04UT | |
| HP 17-by2437ng | |
| Moyenne Intel Core i7-10510U (50.7 - 77.8, n=27) | |
| Lenovo IdeaPad 3 14IIL05 | |
| LG Gram 15Z90N | |
| R Benchmark 2.5 / Overall mean | |
| LG Gram 15Z90N | |
| Lenovo IdeaPad 3 14IIL05 | |
| HP ProBook 450 G7 8WC04UT | |
| HP 17-by2437ng | |
| Moyenne Intel Core i7-10510U (0.637 - 0.81, n=28) | |
| HP ProBook 455 G7-175W8EA | |
* ... Moindre est la valeur, meilleures sont les performances
| PCMark 8 Home Score Accelerated v2 | 3585 points | |
| PCMark 8 Work Score Accelerated v2 | 4992 points | |
| PCMark 10 Score | 4231 points | |
Aide | ||
| DPC Latencies / LatencyMon - interrupt to process latency (max), Web, Youtube, Prime95 | |
| LG Gram 15Z90N | |
| HP Envy x360 15-dr1679cl | |
| HP ProBook 450 G7 8WC04UT | |
| HP 17-by2437ng | |
| Asus VivoBook 17 S712FA-DS76 | |
| HP ProBook 455 G7-175W8EA | |
| Lenovo IdeaPad 3 14IIL05 | |
* ... Moindre est la valeur, meilleures sont les performances
| HP ProBook 450 G7 8WC04UT Crucial P1 SSD CT1000P1SSD8 | HP ProBook 455 G7-175W8EA Samsung PM991 MZVLQ512HALU | MSI Modern 15 A10RB WDC PC SN730 SDBPNTY-512G | Dell Latitude 15 3590 Samsung SSD PM871b MZ7LN256HAJQ | Lenovo ThinkPad L590-20Q70019GE Toshiba XG6 KXG6AZNV512G | Dynabook Tecra X50-F Samsung SSD PM981 MZVLB512HAJQ | |
|---|---|---|---|---|---|---|
| AS SSD | 19% | 113% | -29% | 67% | 31% | |
| Seq Read (MB/s) | 1155 | 1929 67% | 2084 80% | 498.7 -57% | 1383 20% | 1461 26% |
| Seq Write (MB/s) | 984 | 1199 22% | 2442 148% | 361.7 -63% | 852 -13% | 1039 6% |
| 4K Read (MB/s) | 48.85 | 43.9 -10% | 47.52 -3% | 34.65 -29% | 45.72 -6% | 45.98 -6% |
| 4K Write (MB/s) | 96.6 | 116.2 20% | 135.8 41% | 79.8 -17% | 120.2 24% | 125.5 30% |
| 4K-64 Read (MB/s) | 581 | 897 54% | 1043 80% | 372.5 -36% | 1344 131% | 560 -4% |
| 4K-64 Write (MB/s) | 658 | 801 22% | 955 45% | 247.7 -62% | 926 41% | 1162 77% |
| Access Time Read * (ms) | 0.066 | 0.069 -5% | 0.062 6% | 0.06 9% | 0.063 5% | 0.045 32% |
| Access Time Write * (ms) | 0.207 | 0.033 84% | 0.076 63% | 0.042 80% | 0.036 83% | 0.032 85% |
| Score Read (Points) | 745 | 1134 52% | 1299 74% | 457 -39% | 1528 105% | 752 1% |
| Score Write (Points) | 853 | 1037 22% | 1335 57% | 364 -57% | 1132 33% | 1391 63% |
| Score Total (Points) | 1986 | 2723 37% | 3326 67% | 1060 -47% | 3420 72% | 2521 27% |
| Copy ISO MB/s (MB/s) | 2635 | 1409 -47% | 1926 -27% | 1147 -56% | ||
| Copy Program MB/s (MB/s) | 95.1 | 70.2 -26% | 714 651% | 419.8 341% | ||
| Copy Game MB/s (MB/s) | 361.9 | 254.9 -30% | 1425 294% | 928 156% | ||
| CrystalDiskMark 5.2 / 6 | 19% | 108% | -36% | 21% | 10% | |
| Write 4K (MB/s) | 111.1 | 141.9 28% | 208.4 88% | 79.5 -28% | 115.3 4% | 100.1 -10% |
| Read 4K (MB/s) | 56.3 | 37.25 -34% | 51 -9% | 32.72 -42% | 43.34 -23% | 42.4 -25% |
| Write Seq (MB/s) | 559 | 998 79% | 2687 381% | 472.5 -15% | 1014 81% | |
| Read Seq (MB/s) | 1348 | 1233 -9% | 2168 61% | 504 -63% | 1481 10% | |
| Write 4K Q32T1 (MB/s) | 277.1 | 338.4 22% | 489.2 77% | 322.6 16% | 495.4 79% | 245.9 -11% |
| Read 4K Q32T1 (MB/s) | 312.1 | 431.1 38% | 600 92% | 249.9 -20% | 332.6 7% | 230.3 -26% |
| Write Seq Q32T1 (MB/s) | 1652 | 1367 -17% | 2699 63% | 531 -68% | 1654 0% | 1910 16% |
| Read Seq Q32T1 (MB/s) | 1588 | 2355 48% | 3374 112% | 544 -66% | 1746 10% | 3454 118% |
| Write 4K Q8T8 (MB/s) | 877 | 1033 | ||||
| Read 4K Q8T8 (MB/s) | 518 | 892 | ||||
| Moyenne finale (programmes/paramètres) | 19% /
19% | 111% /
111% | -33% /
-32% | 44% /
50% | 21% /
23% |
* ... Moindre est la valeur, meilleures sont les performances

Disk Throttling: DiskSpd Read Loop, Queue Depth 8
| 3DMark 11 Performance | 4452 points | |
| 3DMark Cloud Gate Standard Score | 13121 points | |
| 3DMark Fire Strike Score | 3072 points | |
| 3DMark Time Spy Score | 1119 points | |
Aide | ||
| Bas | Moyen | Élevé | Ultra | |
|---|---|---|---|---|
| The Witcher 3 (2015) | 66.7 | 34.7 | 21 | 11.2 |
| Dota 2 Reborn (2015) | 110 | 96.2 | 68 | 60.7 |
| X-Plane 11.11 (2018) | 44.3 | 38.7 | 35.5 |
| HP ProBook 450 G7 8WC04UT GeForce MX250, i7-10510U, Crucial P1 SSD CT1000P1SSD8 | HP ProBook 455 G7-175W8EA Vega 7, R7 4700U, Samsung PM991 MZVLQ512HALU | MSI Modern 15 A10RB GeForce MX250, i7-10510U, WDC PC SN730 SDBPNTY-512G | Dell Latitude 15 3590 UHD Graphics 620, i5-8250U, Samsung SSD PM871b MZ7LN256HAJQ | Lenovo ThinkPad L590-20Q70019GE UHD Graphics 620, i5-8265U, Toshiba XG6 KXG6AZNV512G | Dynabook Tecra X50-F UHD Graphics 620, i7-8665U, Samsung SSD PM981 MZVLB512HAJQ | |
|---|---|---|---|---|---|---|
| Noise | -6% | -11% | -11% | 1% | -5% | |
| arrêt / environnement * (dB) | 26.2 | 30.7 -17% | 28.3 -8% | 30.6 -17% | 29 -11% | 30.2 -15% |
| Idle Minimum * (dB) | 26.2 | 30.7 -17% | 32 -22% | 30.6 -17% | 29 -11% | 30.2 -15% |
| Idle Average * (dB) | 26.2 | 30.7 -17% | 32 -22% | 31.9 -22% | 29 -11% | 30.2 -15% |
| Idle Maximum * (dB) | 26.2 | 30.7 -17% | 32 -22% | 31.9 -22% | 29 -11% | 30.2 -15% |
| Load Average * (dB) | 38.1 | 33.9 11% | 34.5 9% | 39 -2% | 29 24% | 33.4 12% |
| Witcher 3 ultra * (dB) | 37.5 | 39.5 -5% | ||||
| Load Maximum * (dB) | 47 | 36.8 22% | 50.9 -8% | 39.1 17% | 33.8 28% | 39 17% |
* ... Moindre est la valeur, meilleures sont les performances
Degré de la nuisance sonore
| Au repos |
| 26.2 / 26.2 / 26.2 dB(A) |
| Fortement sollicité |
| 38.1 / 47 dB(A) |
 | ||
30 dB silencieux 40 dB(A) audible 50 dB(A) bruyant |
||
min: | ||
(±) La température maximale du côté supérieur est de 40 °C / 104 F, par rapport à la moyenne de 34.3 °C / 94 F, allant de 21.2 à 62.5 °C pour la classe Office.
(-) Le fond chauffe jusqu'à un maximum de 56.6 °C / 134 F, contre une moyenne de 36.8 °C / 98 F
(+) En utilisation inactive, la température moyenne du côté supérieur est de 26 °C / 79 F, par rapport à la moyenne du dispositif de 29.5 °C / 85 F.
(±) En jouant à The Witcher 3, la température moyenne du côté supérieur est de 35.2 °C / 95 F, alors que la moyenne de l'appareil est de 29.5 °C / 85 F.
(+) Les repose-poignets et le pavé tactile sont plus froids que la température de la peau avec un maximum de 29.8 °C / 85.6 F et sont donc froids au toucher.
(-) La température moyenne de la zone de l'appui-paume de dispositifs similaires était de 27.5 °C / 81.5 F (-2.3 °C / #-4.1 F).
HP ProBook 450 G7 8WC04UT analyse audio
(±) | le niveau sonore du haut-parleur est moyen mais bon (81.8# dB)
Basses 100 - 315 Hz
(-) | presque aucune basse - en moyenne 18.4% plus bas que la médiane
(±) | la linéarité des basses est moyenne (12.2% delta à la fréquence précédente)
Médiums 400 - 2000 Hz
(+) | médiane équilibrée - seulement 2.9% de la médiane
(+) | les médiums sont linéaires (5.4% delta à la fréquence précédente)
Aiguës 2 - 16 kHz
(+) | des sommets équilibrés - à seulement 2.8% de la médiane
(+) | les aigus sont linéaires (5.4% delta à la fréquence précédente)
Globalement 100 - 16 000 Hz
(+) | le son global est linéaire (14.5% différence à la médiane)
Par rapport à la même classe
» 12% de tous les appareils testés de cette catégorie étaient meilleurs, 3% similaires, 85% pires
» Le meilleur avait un delta de 7%, la moyenne était de 21%, le pire était de 53%.
Par rapport à tous les appareils testés
» 18% de tous les appareils testés étaient meilleurs, 4% similaires, 78% pires
» Le meilleur avait un delta de 4%, la moyenne était de 24%, le pire était de 134%.
Apple MacBook 12 (Early 2016) 1.1 GHz analyse audio
(+) | les haut-parleurs peuvent jouer relativement fort (83.6# dB)
Basses 100 - 315 Hz
(±) | basse réduite - en moyenne 11.3% inférieure à la médiane
(±) | la linéarité des basses est moyenne (14.2% delta à la fréquence précédente)
Médiums 400 - 2000 Hz
(+) | médiane équilibrée - seulement 2.4% de la médiane
(+) | les médiums sont linéaires (5.5% delta à la fréquence précédente)
Aiguës 2 - 16 kHz
(+) | des sommets équilibrés - à seulement 2% de la médiane
(+) | les aigus sont linéaires (4.5% delta à la fréquence précédente)
Globalement 100 - 16 000 Hz
(+) | le son global est linéaire (10.2% différence à la médiane)
Par rapport à la même classe
» 7% de tous les appareils testés de cette catégorie étaient meilleurs, 2% similaires, 91% pires
» Le meilleur avait un delta de 5%, la moyenne était de 18%, le pire était de 53%.
Par rapport à tous les appareils testés
» 5% de tous les appareils testés étaient meilleurs, 1% similaires, 94% pires
» Le meilleur avait un delta de 4%, la moyenne était de 24%, le pire était de 134%.
| Éteint/en veille | |
| Au repos | |
| Fortement sollicité |
|
Légende:
min: | |
| HP ProBook 450 G7 8WC04UT i7-10510U, GeForce MX250, Crucial P1 SSD CT1000P1SSD8, IPS, 1920x1080, 15.6" | HP ProBook 455 G7-175W8EA R7 4700U, Vega 7, Samsung PM991 MZVLQ512HALU, IPS, 1920x1080, 15.6" | MSI Modern 15 A10RB i7-10510U, GeForce MX250, WDC PC SN730 SDBPNTY-512G, IPS, 1920x1080, 15.6" | Dell Latitude 15 3590 i5-8250U, UHD Graphics 620, Samsung SSD PM871b MZ7LN256HAJQ, TN LED, 1920x1080, 15.6" | Lenovo ThinkPad L590-20Q70019GE i5-8265U, UHD Graphics 620, Toshiba XG6 KXG6AZNV512G, IPS, 1920x1080, 15.6" | Dynabook Tecra X50-F i7-8665U, UHD Graphics 620, Samsung SSD PM981 MZVLB512HAJQ, IPS, 1920x1080, 15.6" | |
|---|---|---|---|---|---|---|
| Power Consumption | 25% | -32% | 29% | 27% | 28% | |
| Idle Minimum * (Watt) | 4.8 | 3.8 21% | 6.6 -38% | 4.3 10% | 3.96 17% | 3.9 19% |
| Idle Average * (Watt) | 9.5 | 7.7 19% | 9.9 -4% | 7.2 24% | 6.9 27% | 7 26% |
| Idle Maximum * (Watt) | 10.7 | 10.5 2% | 14.7 -37% | 9.8 8% | 9.8 8% | 7.3 32% |
| Load Average * (Watt) | 61.8 | 32 48% | 82.9 -34% | 38 39% | 31.4 49% | 32.7 47% |
| Witcher 3 ultra * (Watt) | 50 | 59.4 -19% | ||||
| Load Maximum * (Watt) | 69 | 45.4 34% | 109.3 -58% | 24 65% | 45.4 34% | 57.8 16% |
* ... Moindre est la valeur, meilleures sont les performances
| HP ProBook 450 G7 8WC04UT i7-10510U, GeForce MX250, 45 Wh | HP ProBook 455 G7-175W8EA R7 4700U, Vega 7, 45 Wh | MSI Modern 15 A10RB i7-10510U, GeForce MX250, 52 Wh | Dell Latitude 15 3590 i5-8250U, UHD Graphics 620, 56 Wh | Lenovo ThinkPad L590-20Q70019GE i5-8265U, UHD Graphics 620, 45 Wh | Dynabook Tecra X50-F i7-8665U, UHD Graphics 620, 48 Wh | |
|---|---|---|---|---|---|---|
| Autonomie de la batterie | -6% | -7% | 24% | 19% | -37% | |
| Reader / Idle (h) | 14.8 | 12.6 -15% | 15.4 4% | 20.2 36% | 17.4 18% | 5.8 -61% |
| WiFi v1.3 (h) | 7.2 | 7.6 6% | 6.5 -10% | 9.1 26% | 7.2 0% | 4.6 -36% |
| Load (h) | 2 | 1.8 -10% | 1.7 -15% | 2.2 10% | 2.8 40% | 1.7 -15% |
Points positifs
Points négatifs

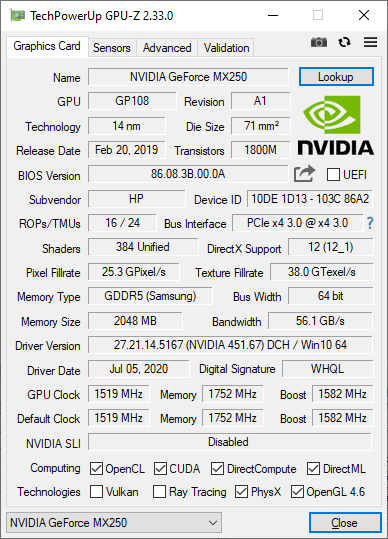
Équipé d'un processeur Core i7, sans carte graphique GeForce, d'un écran 1080p, de 8 Go de RAM et d'un disque dur de 500 Go, le ProBook 450 G7 est vendu environ 1200 € sur HP.com. Le ProBook 455 G7, équipé de la même façon mais avec un processeur Ryzen 7, est vendu environ 800 €. Ces prix vont certainement évoluer, mais le message est clair : le ProBook 455 G7 Ryzen est à la fois plus puissant et moins cher que le ProBook Intel, avec un excellent rapport performances / prix.
Le ProBook 450 G7 Intel vaut-il encore le coup ? Les versions avec Nvidia GeForce ne sont disponibles qu'avec Intel, permettant des performances graphiques supérieures à celles de la solution AMD intégrée. Des réductions potentielles, comme celles sur CUKUSA, peuvent également rendre plus intéressante la version Intel. Cela mis à part, Intel a du travail à faire pour pourvoir faire face aux concurrents Ryzen...
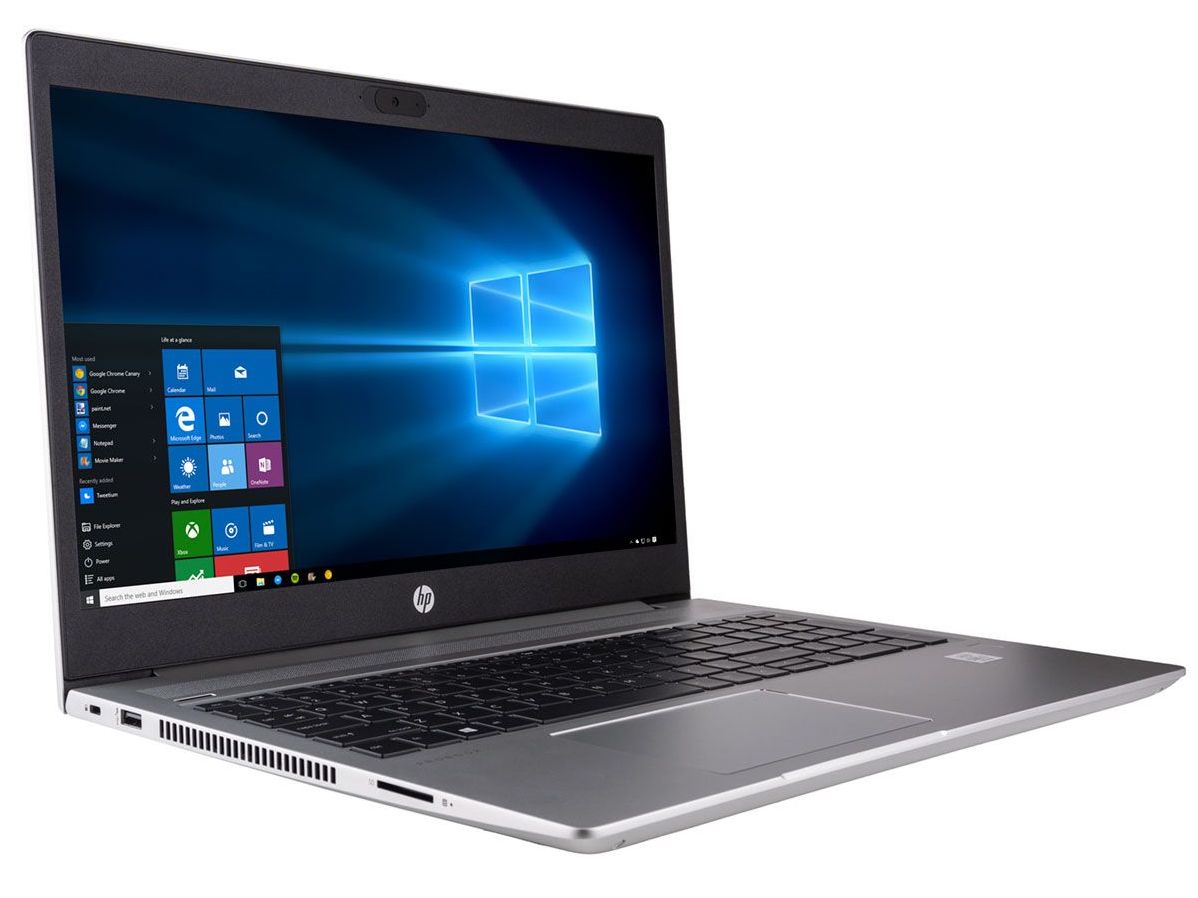
Le HP ProBook 450 G7 est complet pour un PC portable professionnel à prix réduit, avec carte graphique GeForce MX. Mais si cette dernière n'est pas importante pour vous, alors le ProBook 455 G7 sera meilleur à presque tous les niveaux.
L’intégralité de cette critique est disponible en anglais en suivant ce lien.
HP ProBook 450 G7 8WC04UT
- 08/02/2020 v7 (old)
Allen Ngo
Price comparison
