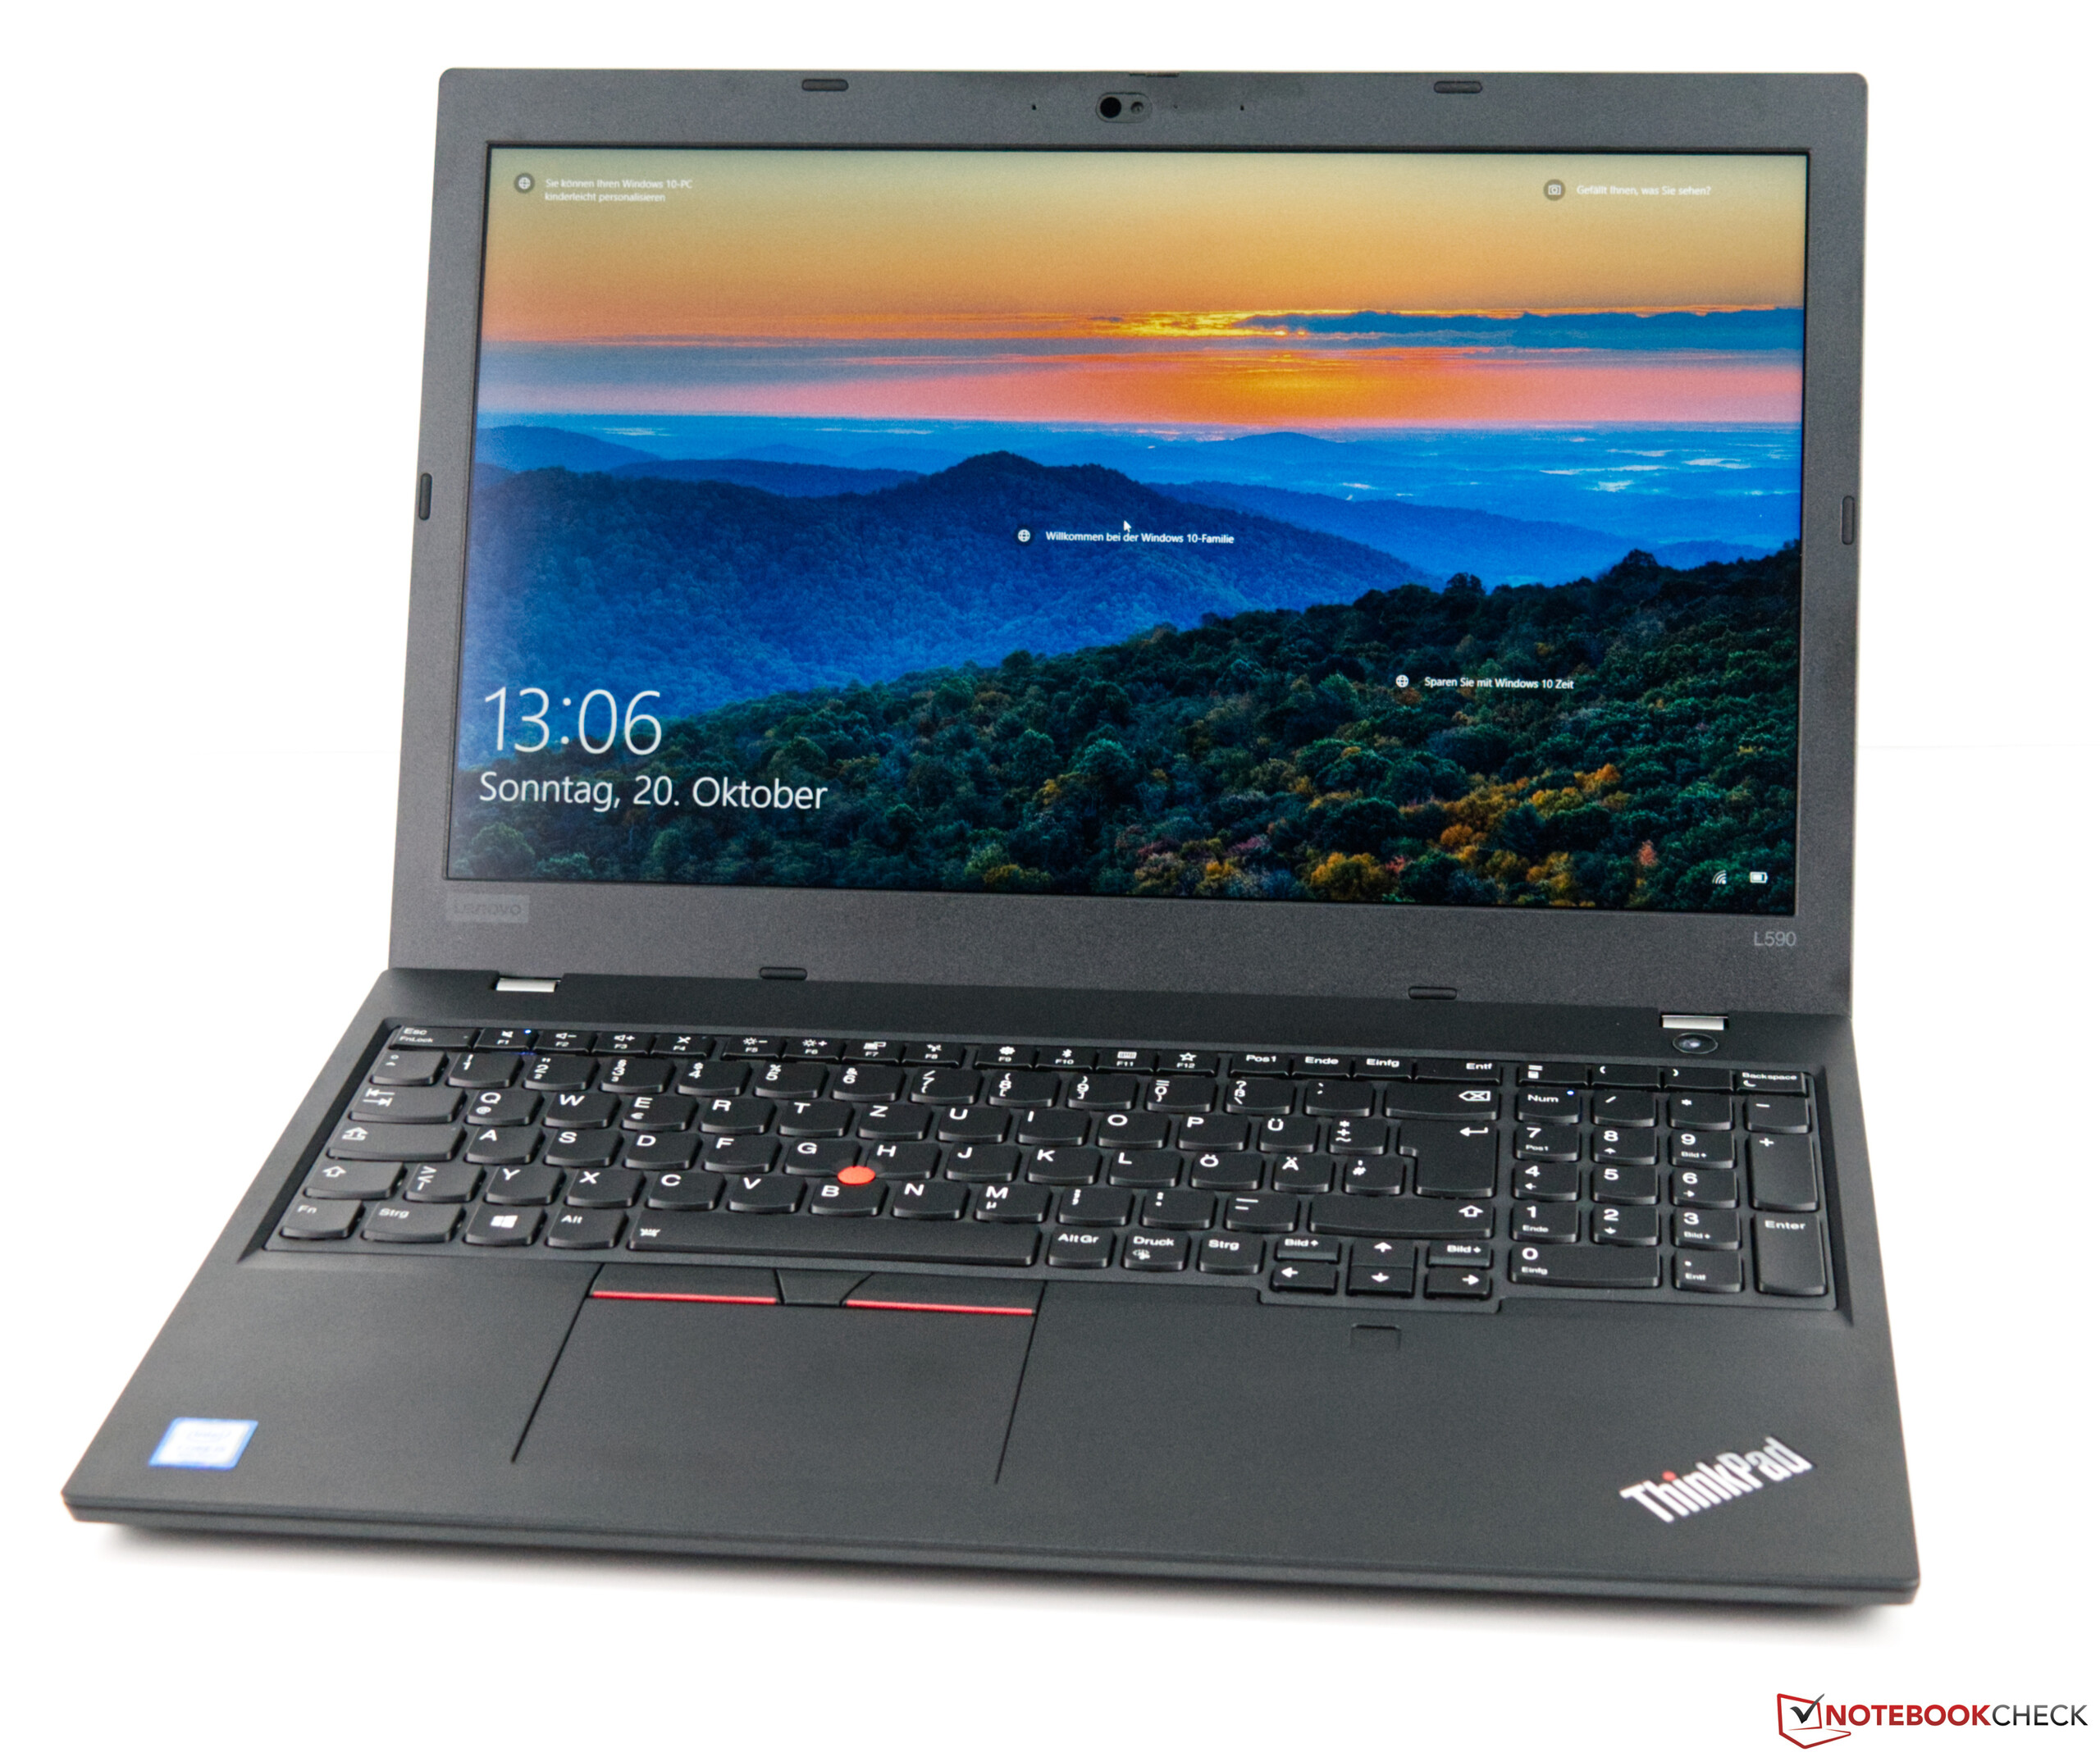
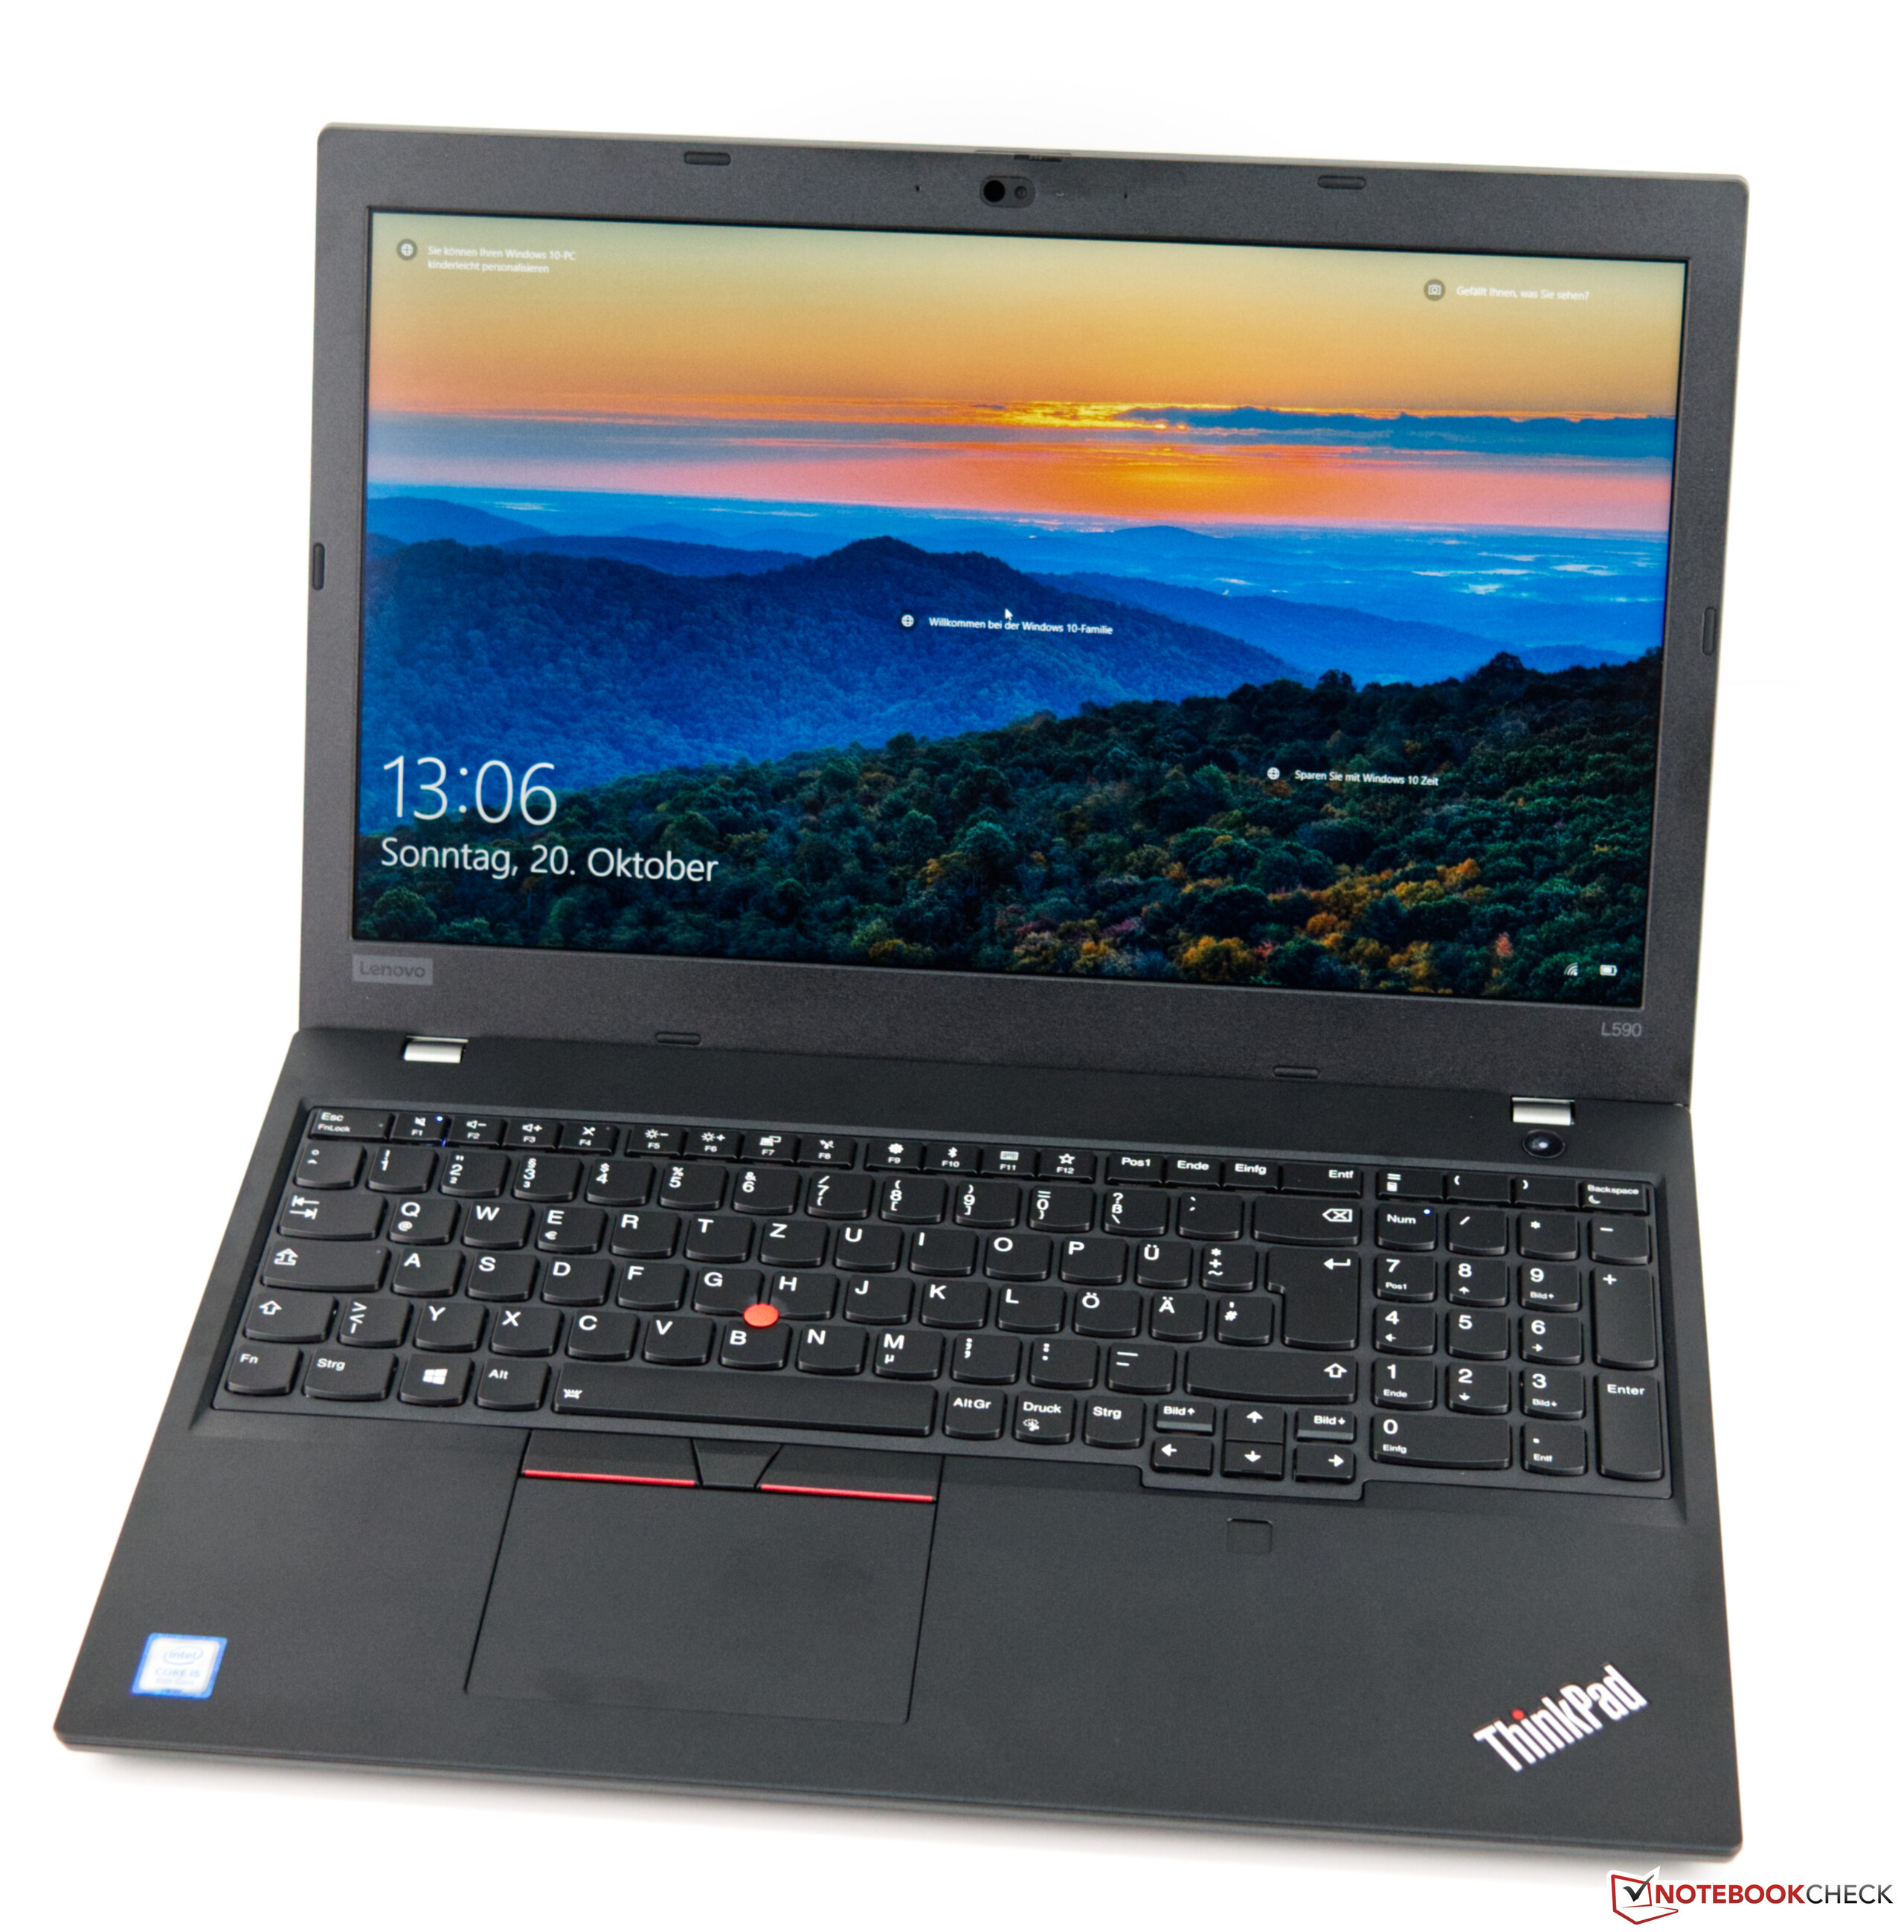
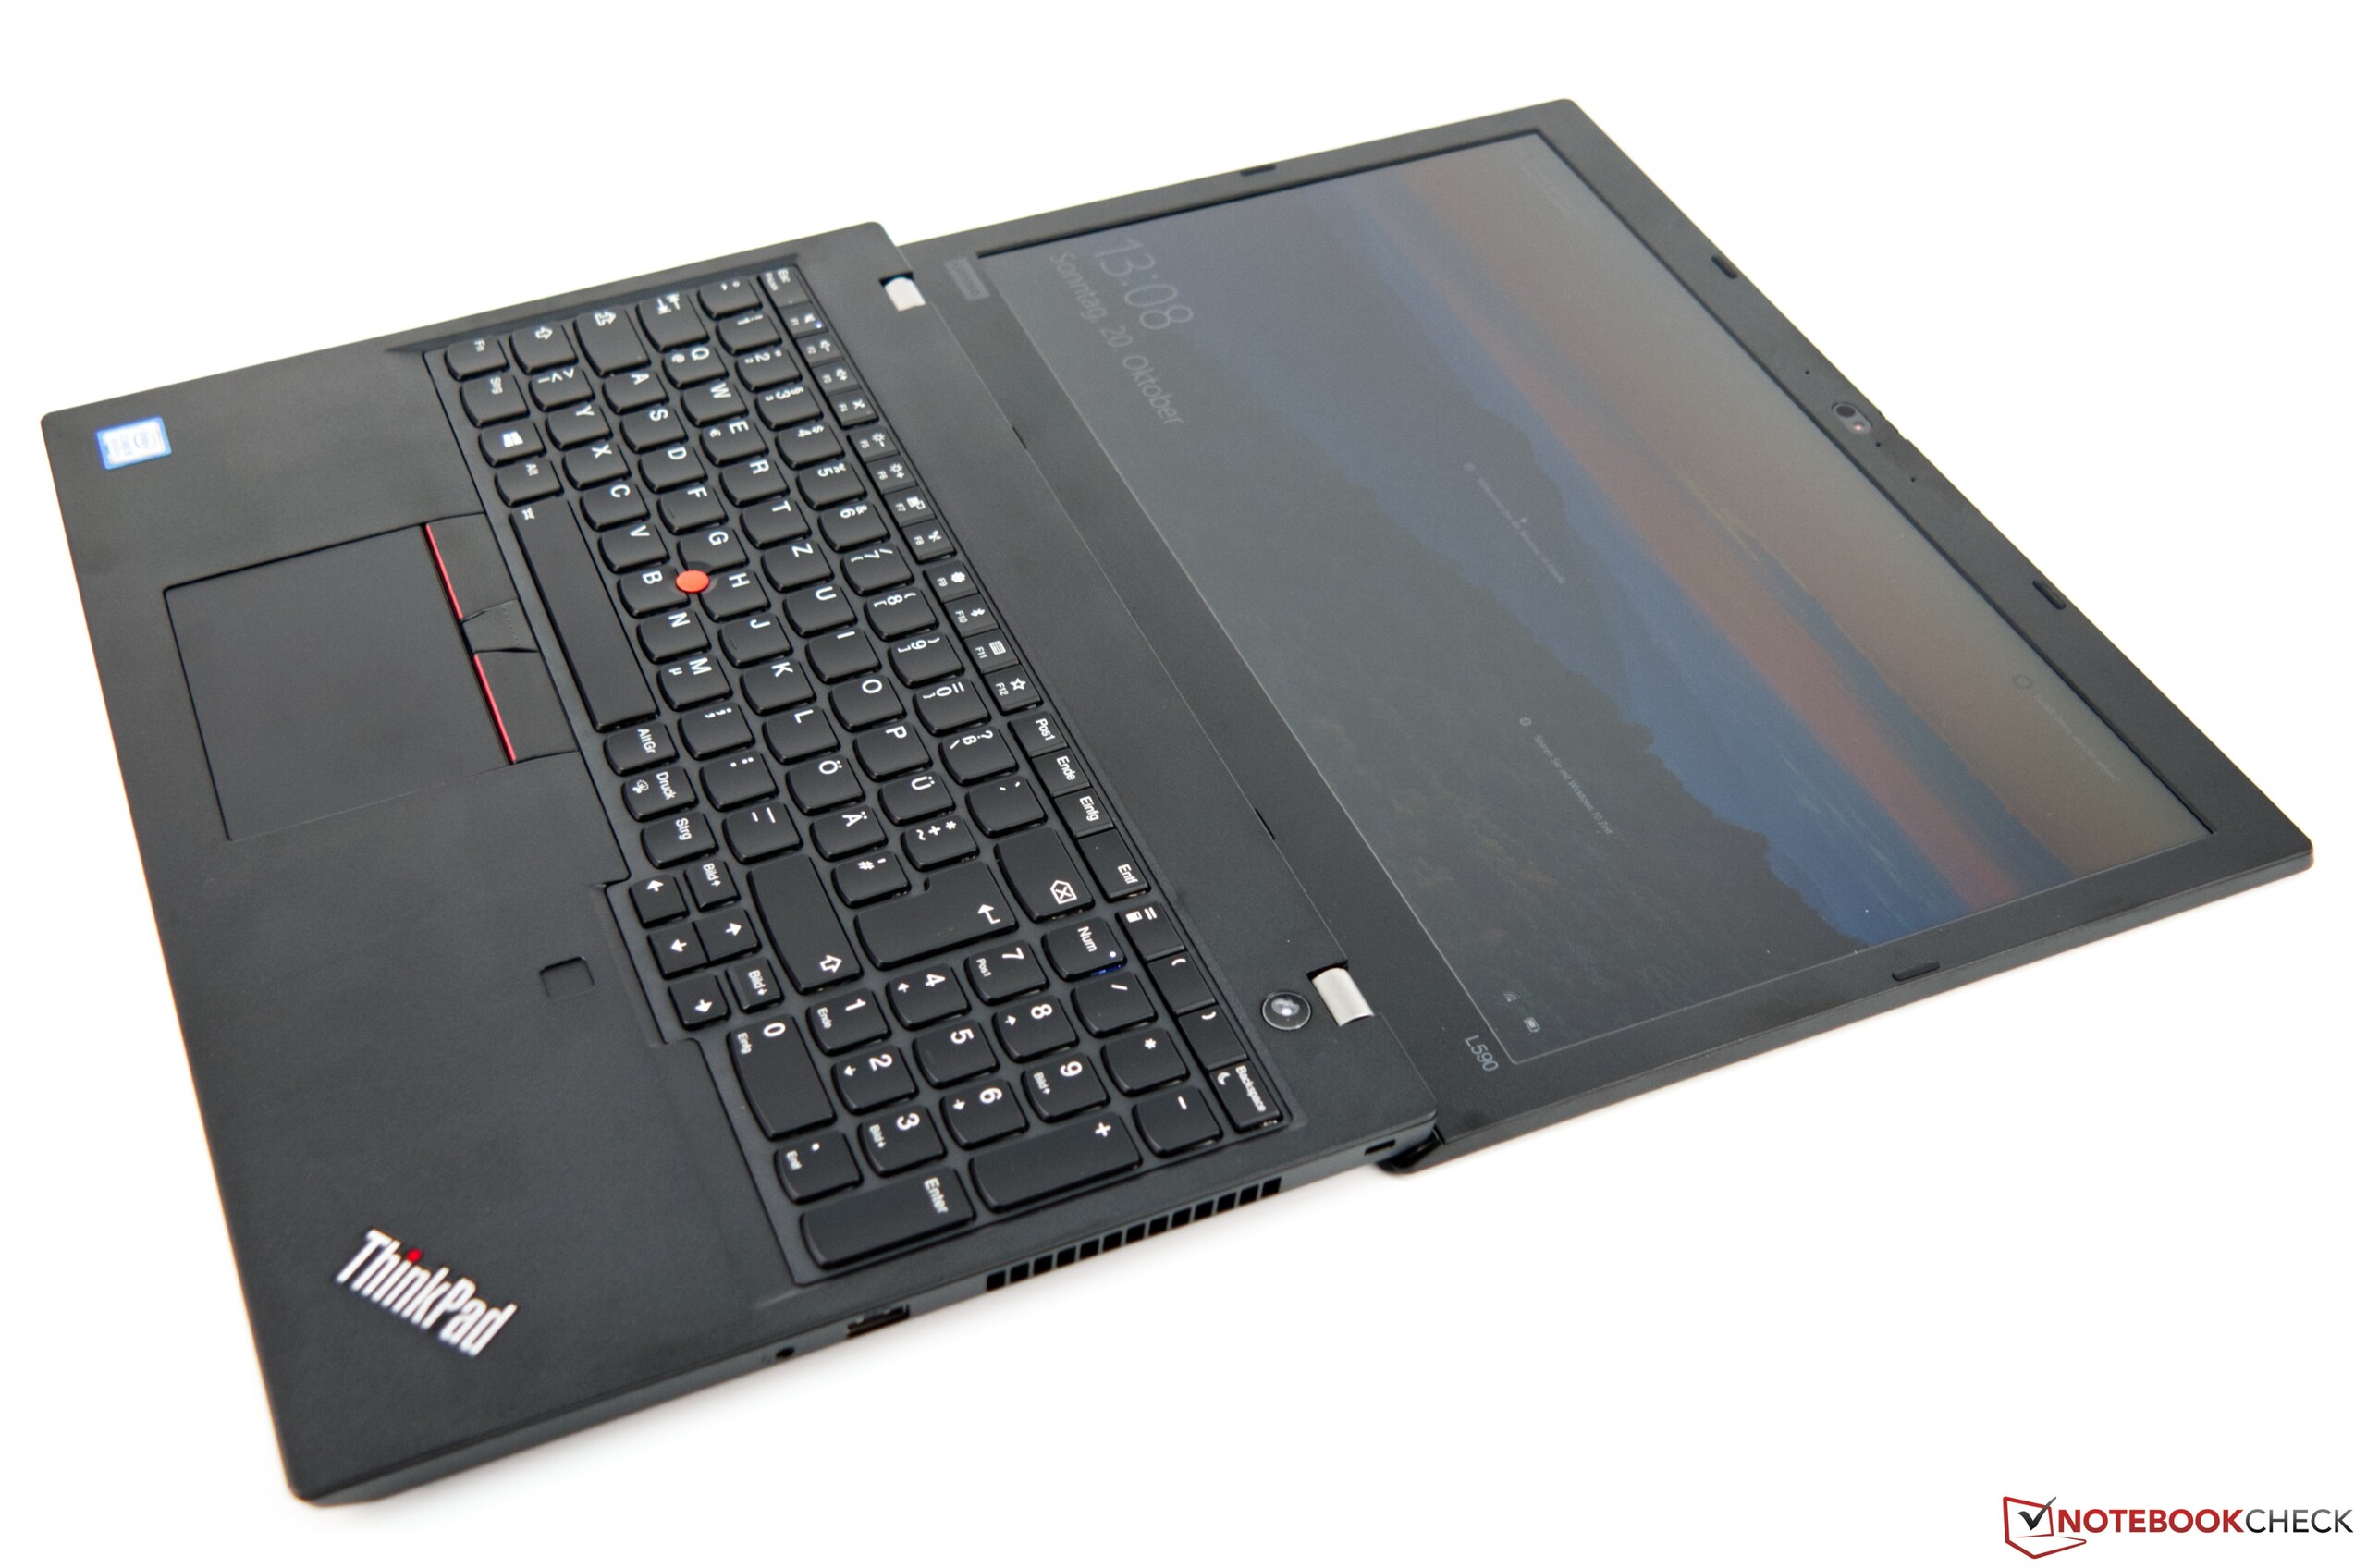
Test du Lenovo ThinkPad L590 (i5-8265U, UHD 620, FHD) : portable pro avec de bons périphériques d'entrée
Note | Date | Modèle | Poids | Épaisseur | Taille | Résolution | Prix |
|---|---|---|---|---|---|---|---|
| 83.2 % v7 (old) | 10/19 | Lenovo ThinkPad L590-20Q70019GE i5-8265U, UHD Graphics 620 | 2 kg | 23 mm | 15.60" | 1920x1080 | |
| 84.3 % v7 (old) | 10/19 | Lenovo ThinkPad L580-20LW000VGE i5-8250U, UHD Graphics 620 | 2 kg | 23 mm | 15.60" | 1920x1080 | |
| 82.6 % v6 (old) | 03/19 | Schenker Slim 15-RE-E19 i5-8265U, UHD Graphics 620 | 1.5 kg | 19.9 mm | 15.60" | 2x1 | |
| 83.4 % v7 (old) | 03/19 | Lenovo ThinkPad E590-20NC0003GE i7-8565U, UHD Graphics 620 | 1.9 kg | 19.9 mm | 15.60" | 1920x1080 | |
| 83.9 % v6 (old) | 02/19 | Tuxedo Book BU1307 i5-8550U, UHD Graphics 620 | 1.4 kg | 21 mm | 13.30" | 1920x1080 | |
| 84 % v7 (old) | 01/19 | Acer TravelMate X3410-M-50DD i5-8550U, GeForce MX130 | 1.7 kg | 19.9 mm | 14.00" | 1920x1080 |

| SD Card Reader | |
| average JPG Copy Test (av. of 3 runs) | |
| Lenovo ThinkPad E590-20NC0003GE (Toshiba Exceria Pro M501 64 GB UHS-II) | |
| Lenovo ThinkPad L580-20LW000VGE (Toshiba Exceria Pro M501) | |
| Lenovo ThinkPad L590-20Q70019GE (Toshiba Exceria Pro M501 64 GB UHS-II) | |
| Schenker Slim 15-RE-E19 (Toshiba Exceria Pro SDXC 64 GB UHS-II) | |
| Moyenne de la classe Office (19.8 - 198.5, n=21, 2 dernières années) | |
| Tuxedo Book BU1307 (Toshiba Exceria Pro SDXC 64 GB UHS-II) | |
| Acer TravelMate X3410-M-50DD (Toshiba Exceria Pro SDXC 64 GB UHS-II) | |
| maximum AS SSD Seq Read Test (1GB) | |
| Lenovo ThinkPad L580-20LW000VGE (Toshiba Exceria Pro M501) | |
| Lenovo ThinkPad E590-20NC0003GE (Toshiba Exceria Pro M501 64 GB UHS-II) | |
| Lenovo ThinkPad L590-20Q70019GE (Toshiba Exceria Pro M501 64 GB UHS-II) | |
| Schenker Slim 15-RE-E19 (Toshiba Exceria Pro SDXC 64 GB UHS-II) | |
| Moyenne de la classe Office (27.4 - 249, n=20, 2 dernières années) | |
| Acer TravelMate X3410-M-50DD (Toshiba Exceria Pro SDXC 64 GB UHS-II) | |
| |||||||||||||||||||||||||
Homogénéité de la luminosité: 81 %
Valeur mesurée au centre, sur batterie: 245 cd/m²
Contraste: 1372:1 (Valeurs des noirs: 0.18 cd/m²)
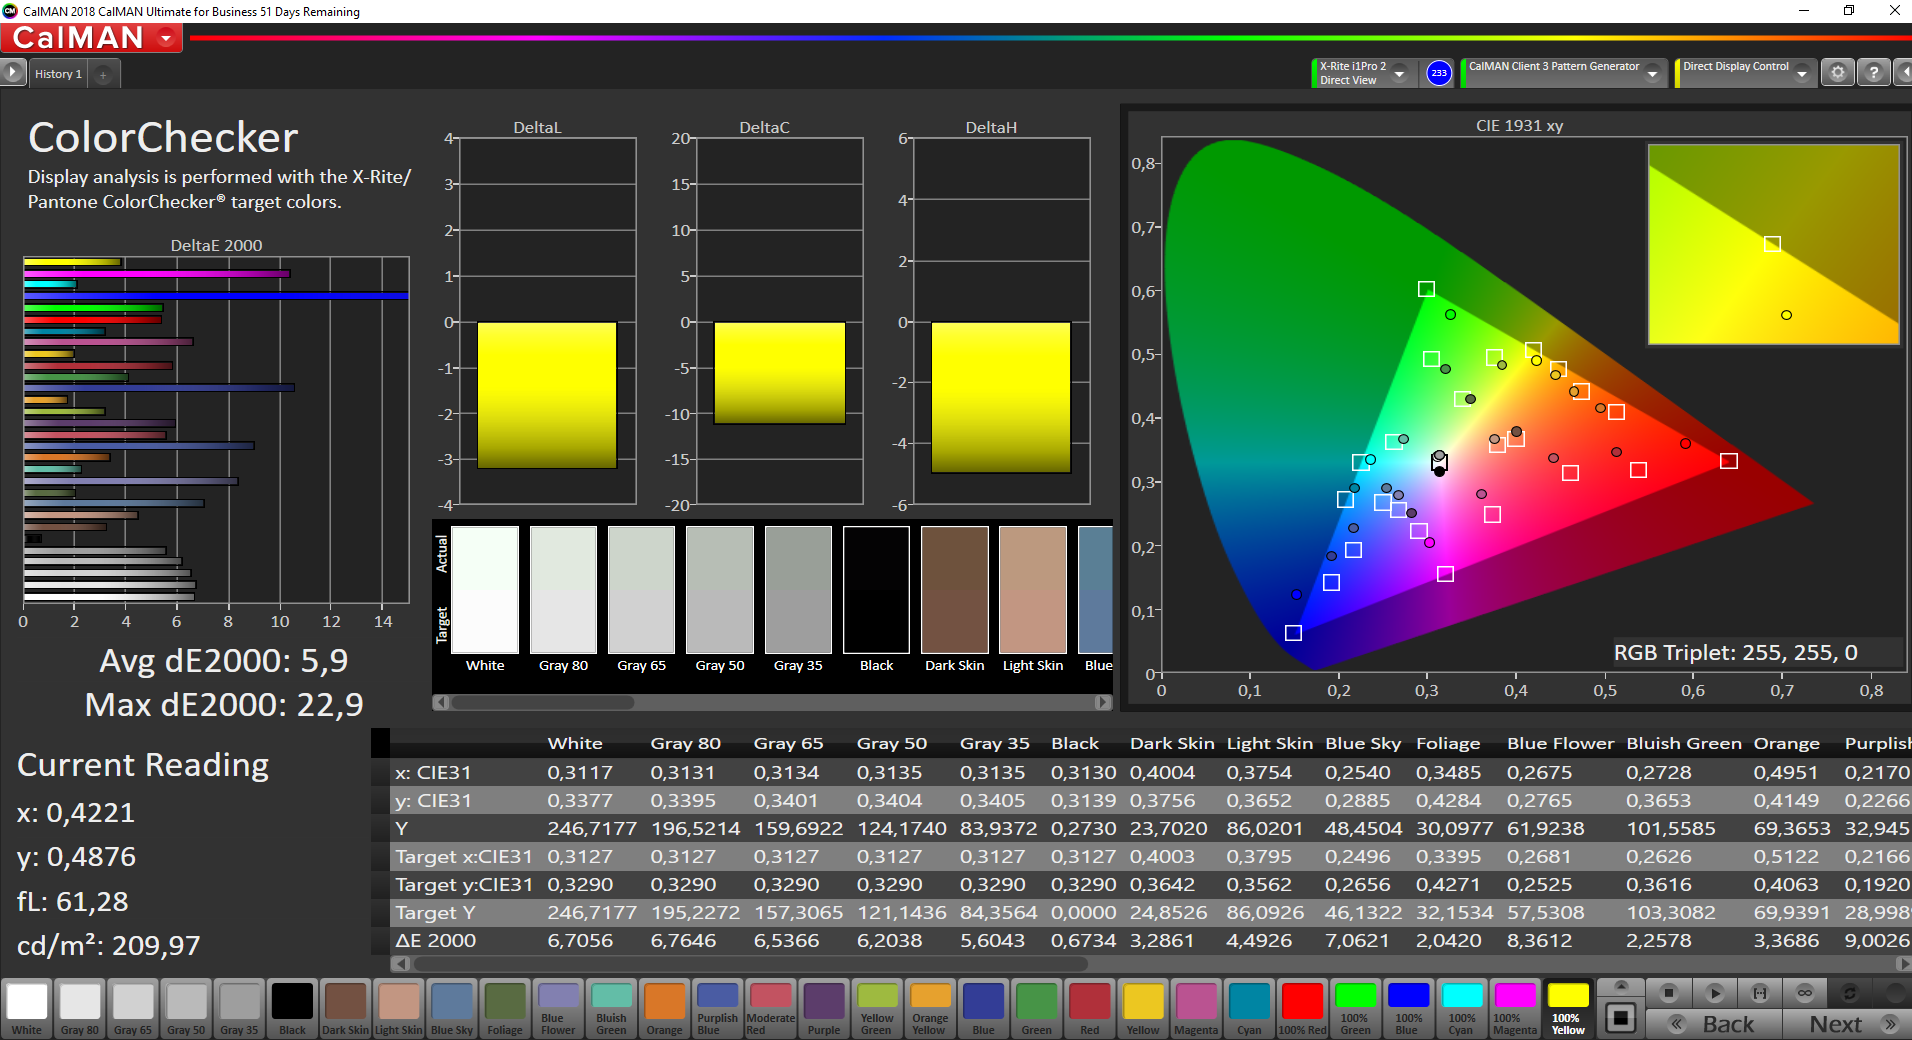
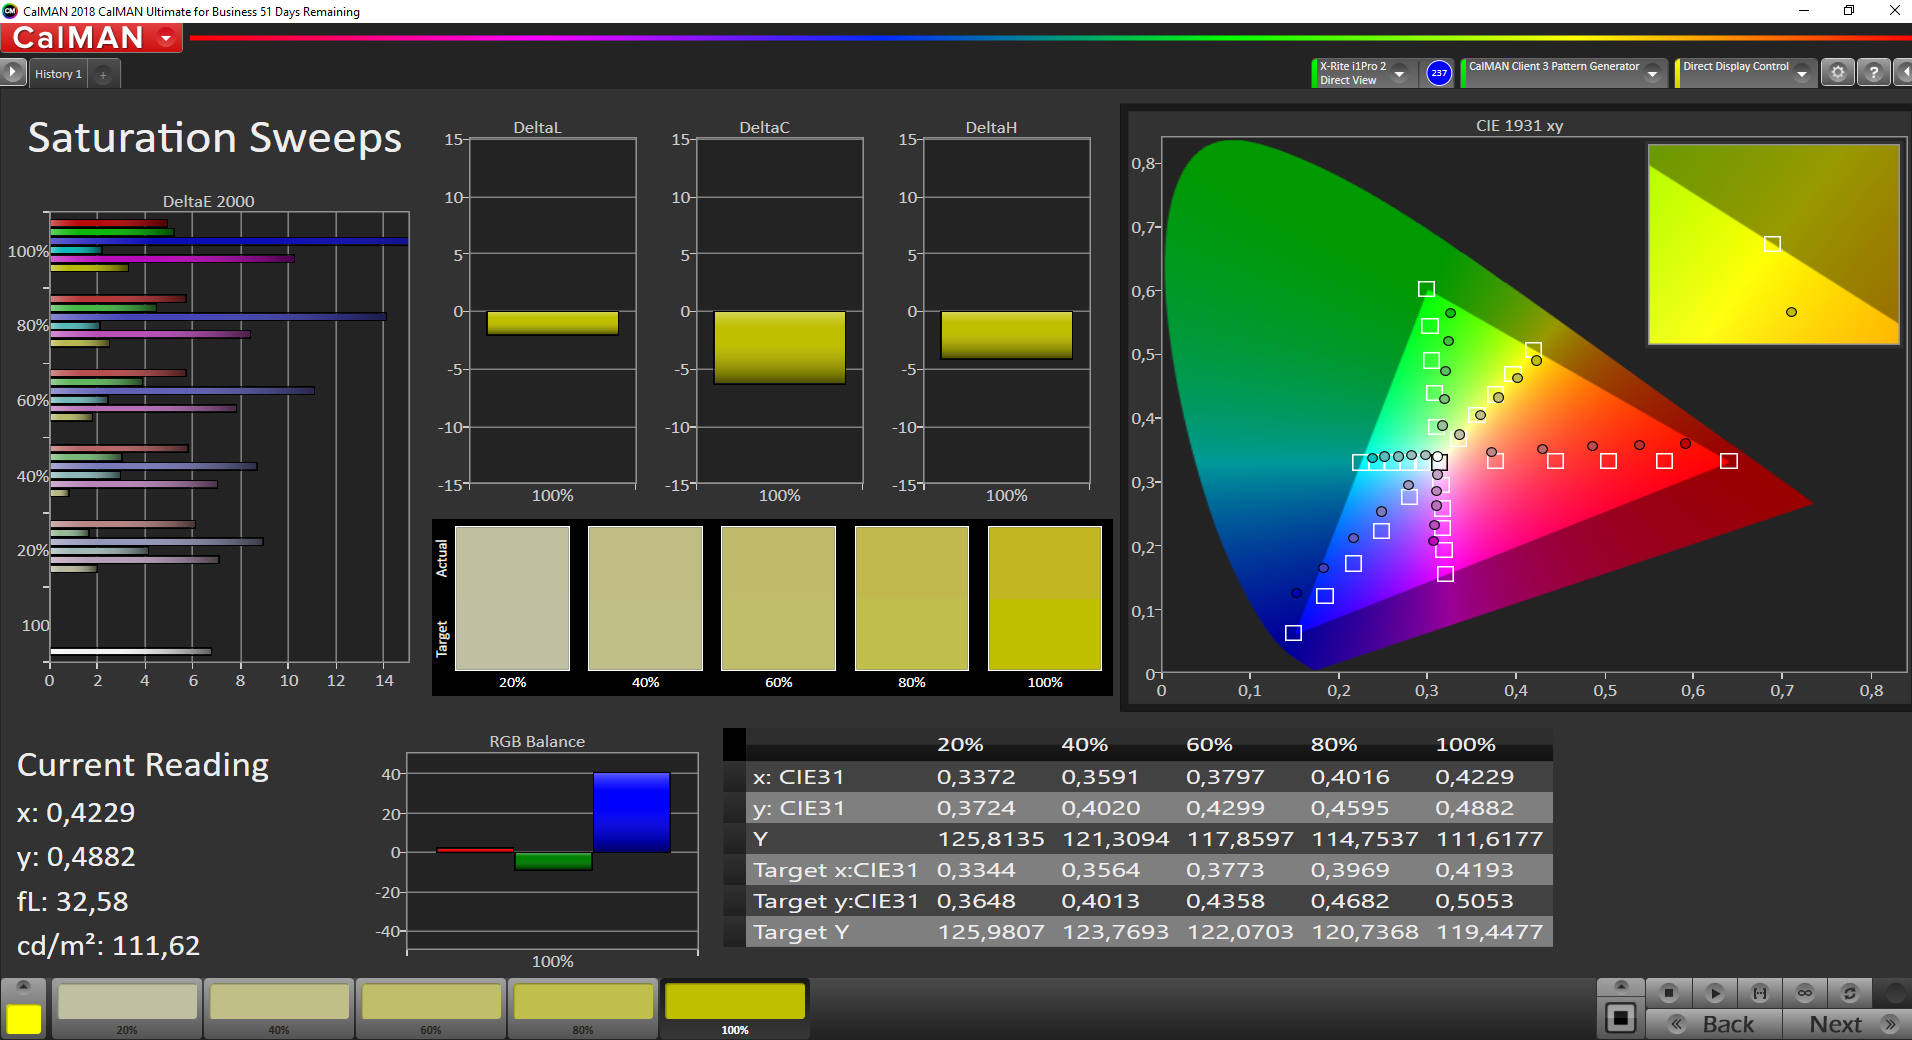
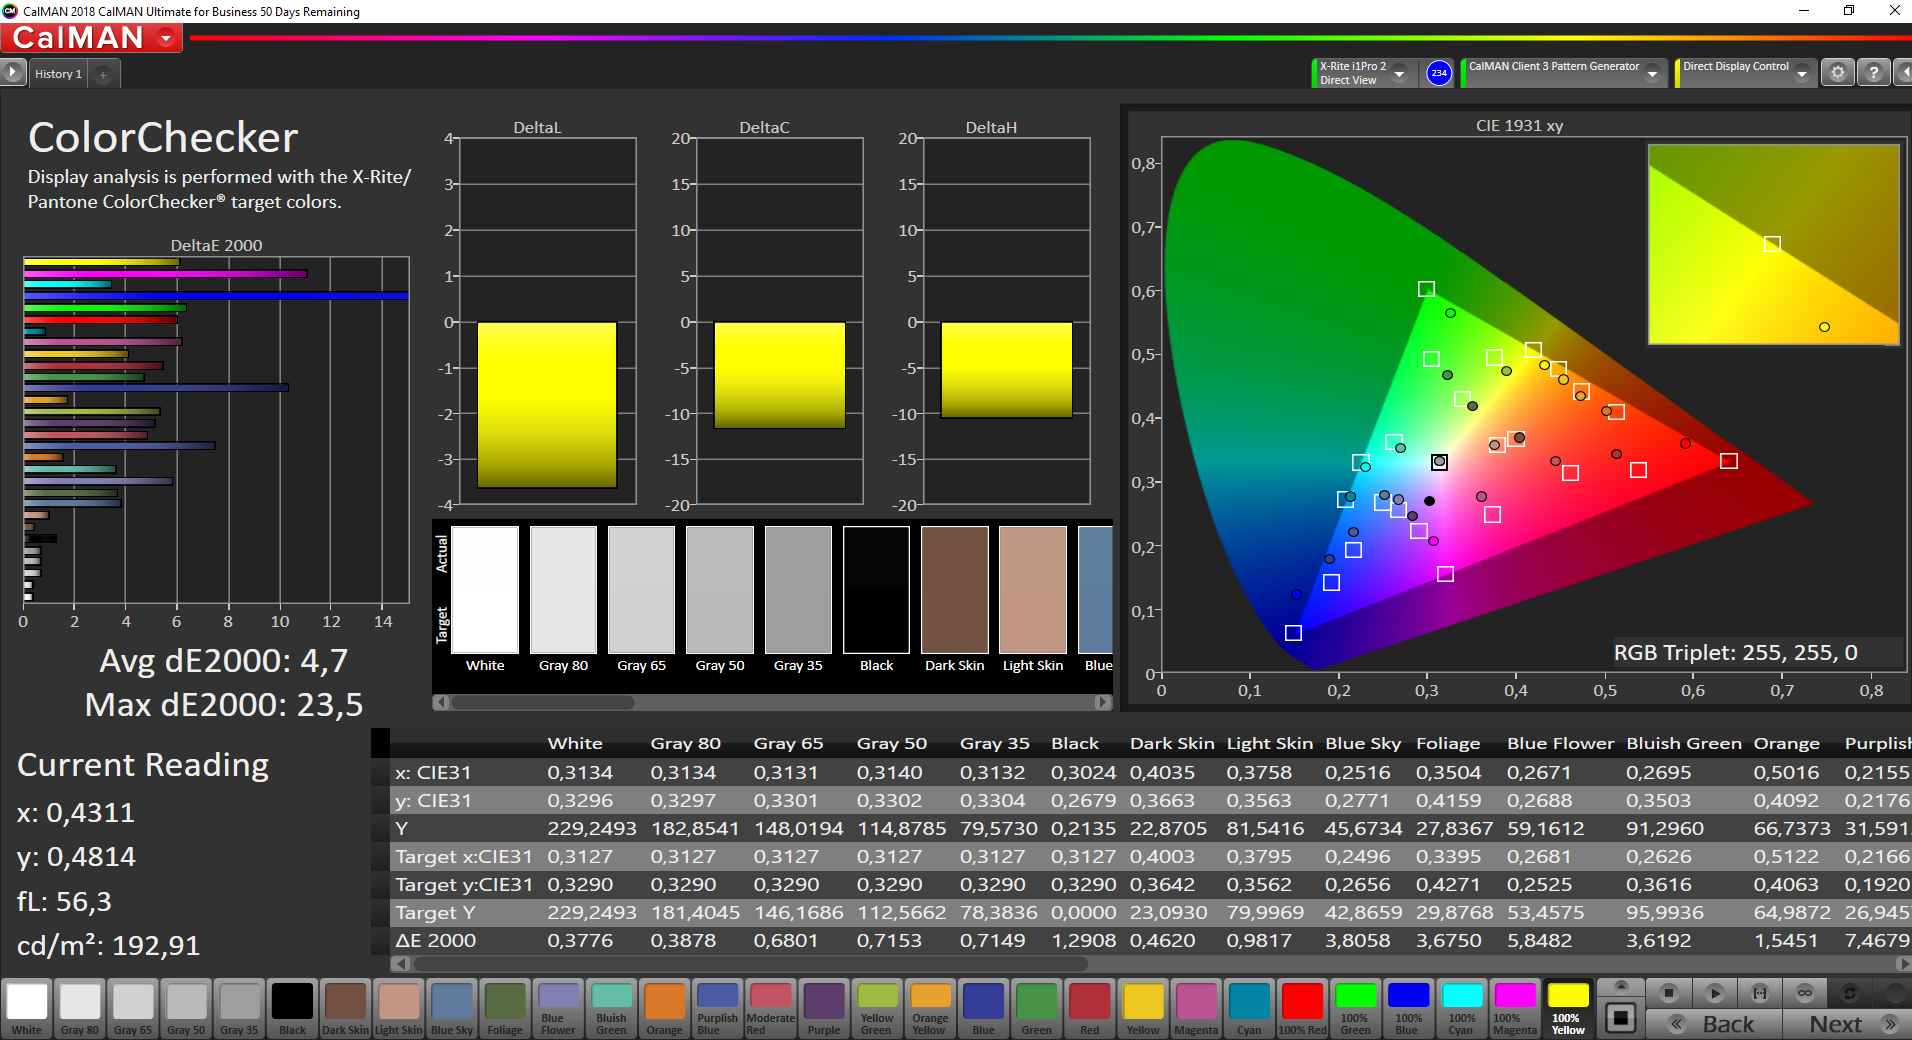
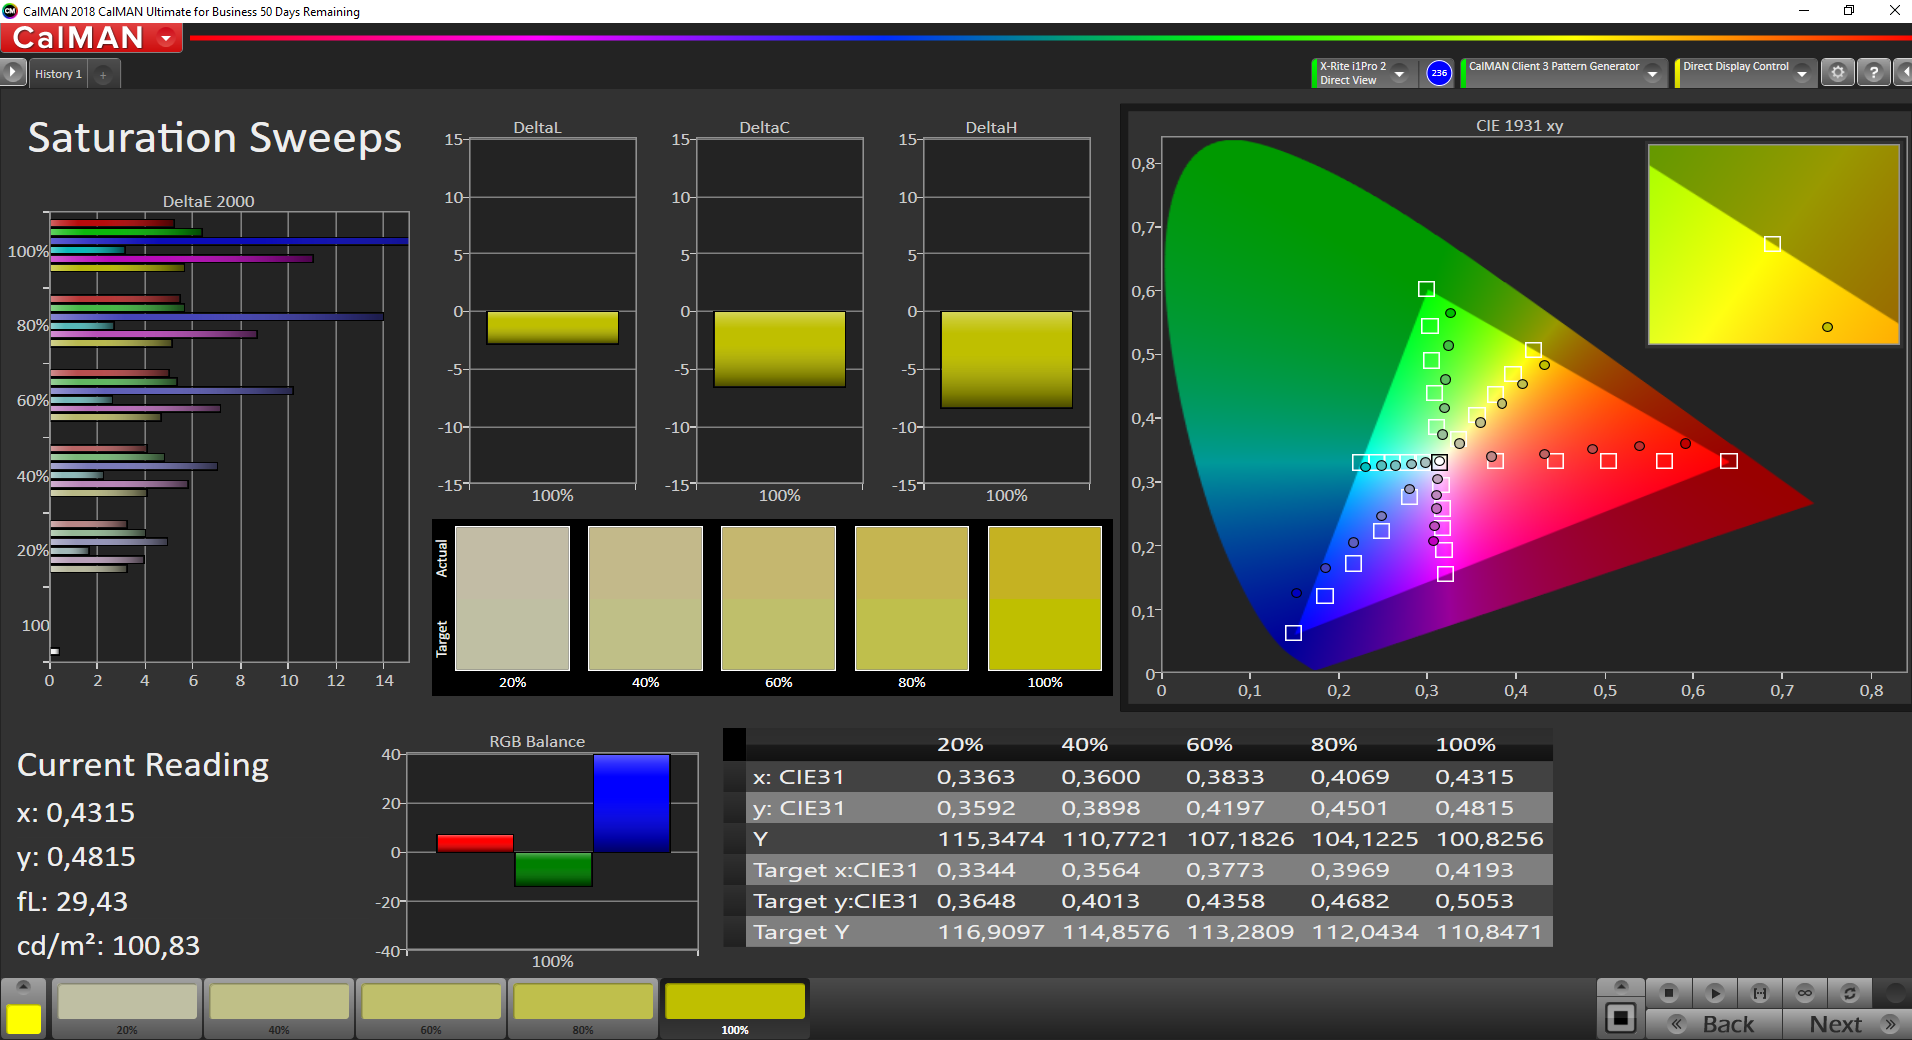
ΔE ColorChecker Calman: 5.9 | ∀{0.5-29.43 Ø4.72}
calibrated: 4.7
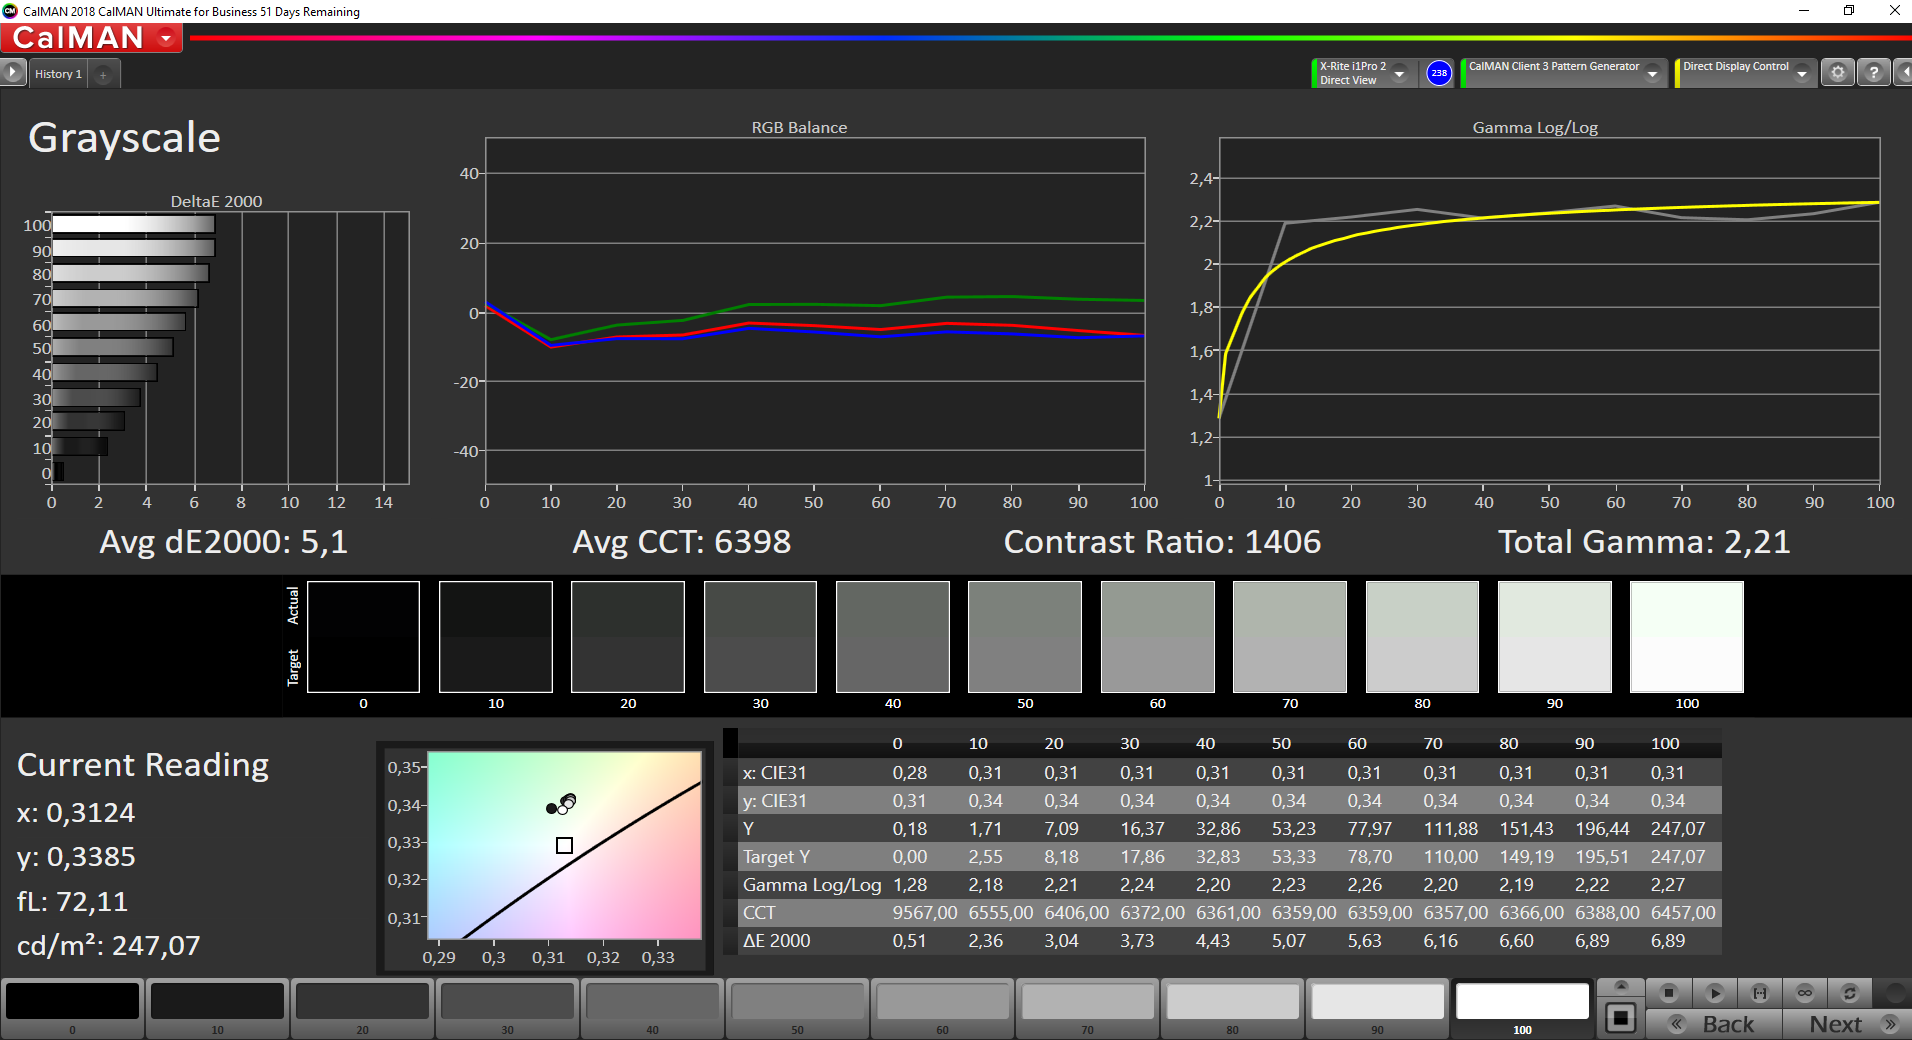
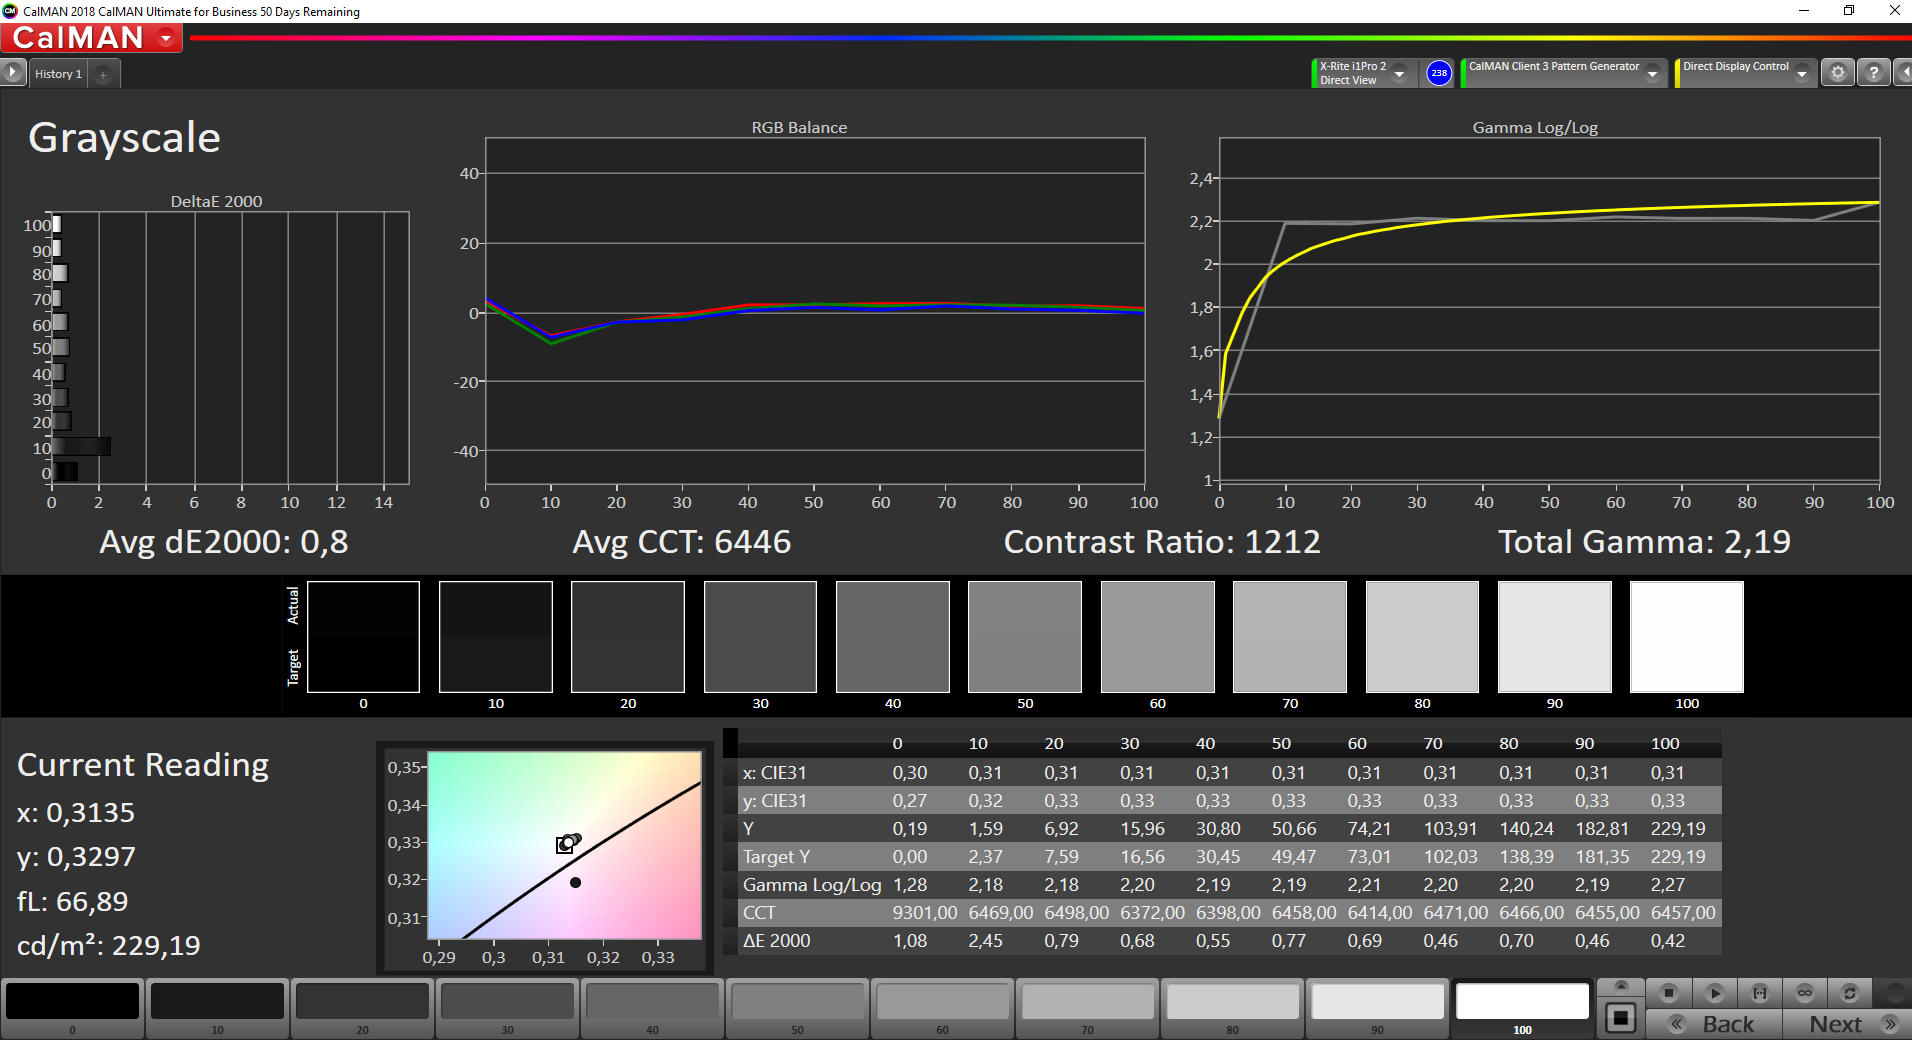
ΔE Greyscale Calman: 5.1 | ∀{0.09-98 Ø4.97}
64.1% sRGB (Argyll 1.6.3 3D)
41.2% AdobeRGB 1998 (Argyll 1.6.3 3D)
44.81% AdobeRGB 1998 (Argyll 3D)
64.4% sRGB (Argyll 3D)
43.3% Display P3 (Argyll 3D)
Gamma: 2.21
CCT: 6398 K
| Lenovo ThinkPad L590-20Q70019GE N156HCE-EAA, IPS, 1920x1080, 15.6" | Lenovo ThinkPad L580-20LW000VGE N156HCE-EAA, IPS, 1920x1080, 15.6" | Schenker Slim 15-RE-E19 Chi Mei CMN15E8, IPS, 2x1, 15.6" | Lenovo ThinkPad E590-20NC0003GE LP156WFC-SPDB, IPS LED, 1920x1080, 15.6" | Tuxedo Book BU1307 AUO272D, IPS, 1920x1080, 13.3" | Acer TravelMate X3410-M-50DD N140HCA-EAC, IPS LED, 1920x1080, 14" | |
|---|---|---|---|---|---|---|
| Display | -1% | 42% | -12% | -3% | ||
| Display P3 Coverage (%) | 43.3 | 42.86 -1% | 63.7 47% | 38.21 -12% | 41.96 -3% | |
| sRGB Coverage (%) | 64.4 | 64.4 0% | 87.7 36% | 57.5 -11% | 63 -2% | |
| AdobeRGB 1998 Coverage (%) | 44.81 | 44.29 -1% | 63.9 43% | 39.47 -12% | 43.37 -3% | |
| Response Times | 16% | 18% | 9% | 27% | 3% | |
| Response Time Grey 50% / Grey 80% * (ms) | 42.8 ? | 33.6 ? 21% | 37 ? 14% | 40 ? 7% | 34 ? 21% | 42 ? 2% |
| Response Time Black / White * (ms) | 30.8 ? | 27.6 ? 10% | 24 ? 22% | 27.6 ? 10% | 21 ? 32% | 30 ? 3% |
| PWM Frequency (Hz) | 24510 ? | 24750 ? | 25000 ? | 400 ? | 24500 ? | |
| Screen | 13% | 11% | 5% | -9% | 24% | |
| Brightness middle (cd/m²) | 247 | 269 9% | 289 17% | 254 3% | 333 35% | 255 3% |
| Brightness (cd/m²) | 228 | 237 4% | 280 23% | 251 10% | 319 40% | 218 -4% |
| Brightness Distribution (%) | 81 | 80 -1% | 87 7% | 90 11% | 83 2% | 72 -11% |
| Black Level * (cd/m²) | 0.18 | 0.21 -17% | 0.36 -100% | 0.2 -11% | 0.3 -67% | 0.08 56% |
| Contrast (:1) | 1372 | 1281 -7% | 803 -41% | 1270 -7% | 1110 -19% | 3188 132% |
| Colorchecker dE 2000 * | 5.9 | 3.9 34% | 3.93 33% | 5.6 5% | 5.01 15% | |
| Colorchecker dE 2000 max. * | 22.9 | 16.3 29% | 6.98 70% | 15.4 33% | 17.44 24% | |
| Colorchecker dE 2000 calibrated * | 4.7 | 3.7 21% | 4.9 -4% | 4.06 14% | ||
| Greyscale dE 2000 * | 5.1 | 1.5 71% | 3.73 27% | 3.1 39% | 7.35 -44% | 3 41% |
| Gamma | 2.21 100% | 2.21 100% | 2.42 91% | 2.22 99% | 2.35 94% | 2.26 97% |
| CCT | 6398 102% | 6332 103% | 6802 96% | 6450 101% | 7156 91% | 6185 105% |
| Color Space (Percent of AdobeRGB 1998) (%) | 41.2 | 40.8 -1% | 57 38% | 36.3 -12% | 40 -3% | |
| Color Space (Percent of sRGB) (%) | 64.1 | 64.3 0% | 87 36% | 57.1 -11% | 63 -2% | |
| Moyenne finale (programmes/paramètres) | 9% /
11% | 24% /
18% | 1% /
2% | 9% /
0% | 8% /
16% |
* ... Moindre est la valeur, meilleures sont les performances
Temps de réponse de l'écran
| ↔ Temps de réponse noir à blanc | ||
|---|---|---|
| 30.8 ms ... hausse ↗ et chute ↘ combinées | ↗ 18 ms hausse | 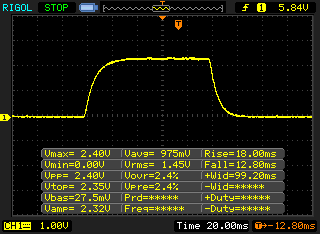 |
| ↘ 12.8 ms chute | ||
| L'écran souffre de latences très élevées, à éviter pour le jeu. En comparaison, tous les appareils testés affichent entre 0.1 (minimum) et 240 (maximum) ms. » 83 % des appareils testés affichent de meilleures performances. Cela signifie que les latences relevées sont moins bonnes que la moyenne (19.8 ms) de tous les appareils testés. | ||
| ↔ Temps de réponse gris 50% à gris 80% | ||
| 42.8 ms ... hausse ↗ et chute ↘ combinées | ↗ 22.8 ms hausse | 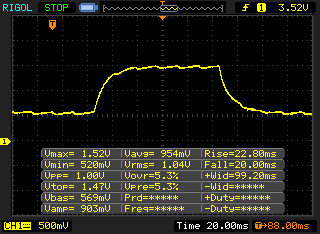 |
| ↘ 20 ms chute | ||
| L'écran souffre de latences très élevées, à éviter pour le jeu. En comparaison, tous les appareils testés affichent entre 0.165 (minimum) et 636 (maximum) ms. » 70 % des appareils testés affichent de meilleures performances. Cela signifie que les latences relevées sont moins bonnes que la moyenne (31 ms) de tous les appareils testés. | ||
Scintillement / MLI (Modulation de largeur d'impulsion)
| Scintillement / MLI (Modulation de largeur d'impulsion) décelé | 24510 Hz | ≤ 40 Niveau de luminosité | 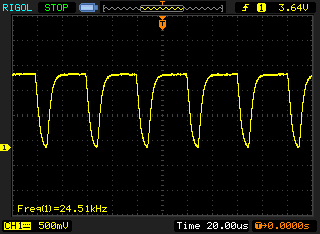 |
Le rétroéclairage de l'écran scintille à la fréquence de 24510 Hz (certainement du fait de l'utilisation d'une MDI - Modulation de largeur d'impulsion) à un niveau de luminosité inférieur ou égal à 40 % . Aucun scintillement ne devrait être perceptible au-dessus de cette valeur. La fréquence de rafraîchissement de 24510 Hz est élevée, la grande majorité des utilisateurs ne devrait pas percevoir de scintillements et être sujette à une fatigue oculaire accrue. En comparaison, 52 % des appareils testés n'emploient pas MDI pour assombrir leur écran. Nous avons relevé une moyenne à 7763 (minimum : 5 - maximum : 343500) Hz dans le cas où une MDI était active. | |||
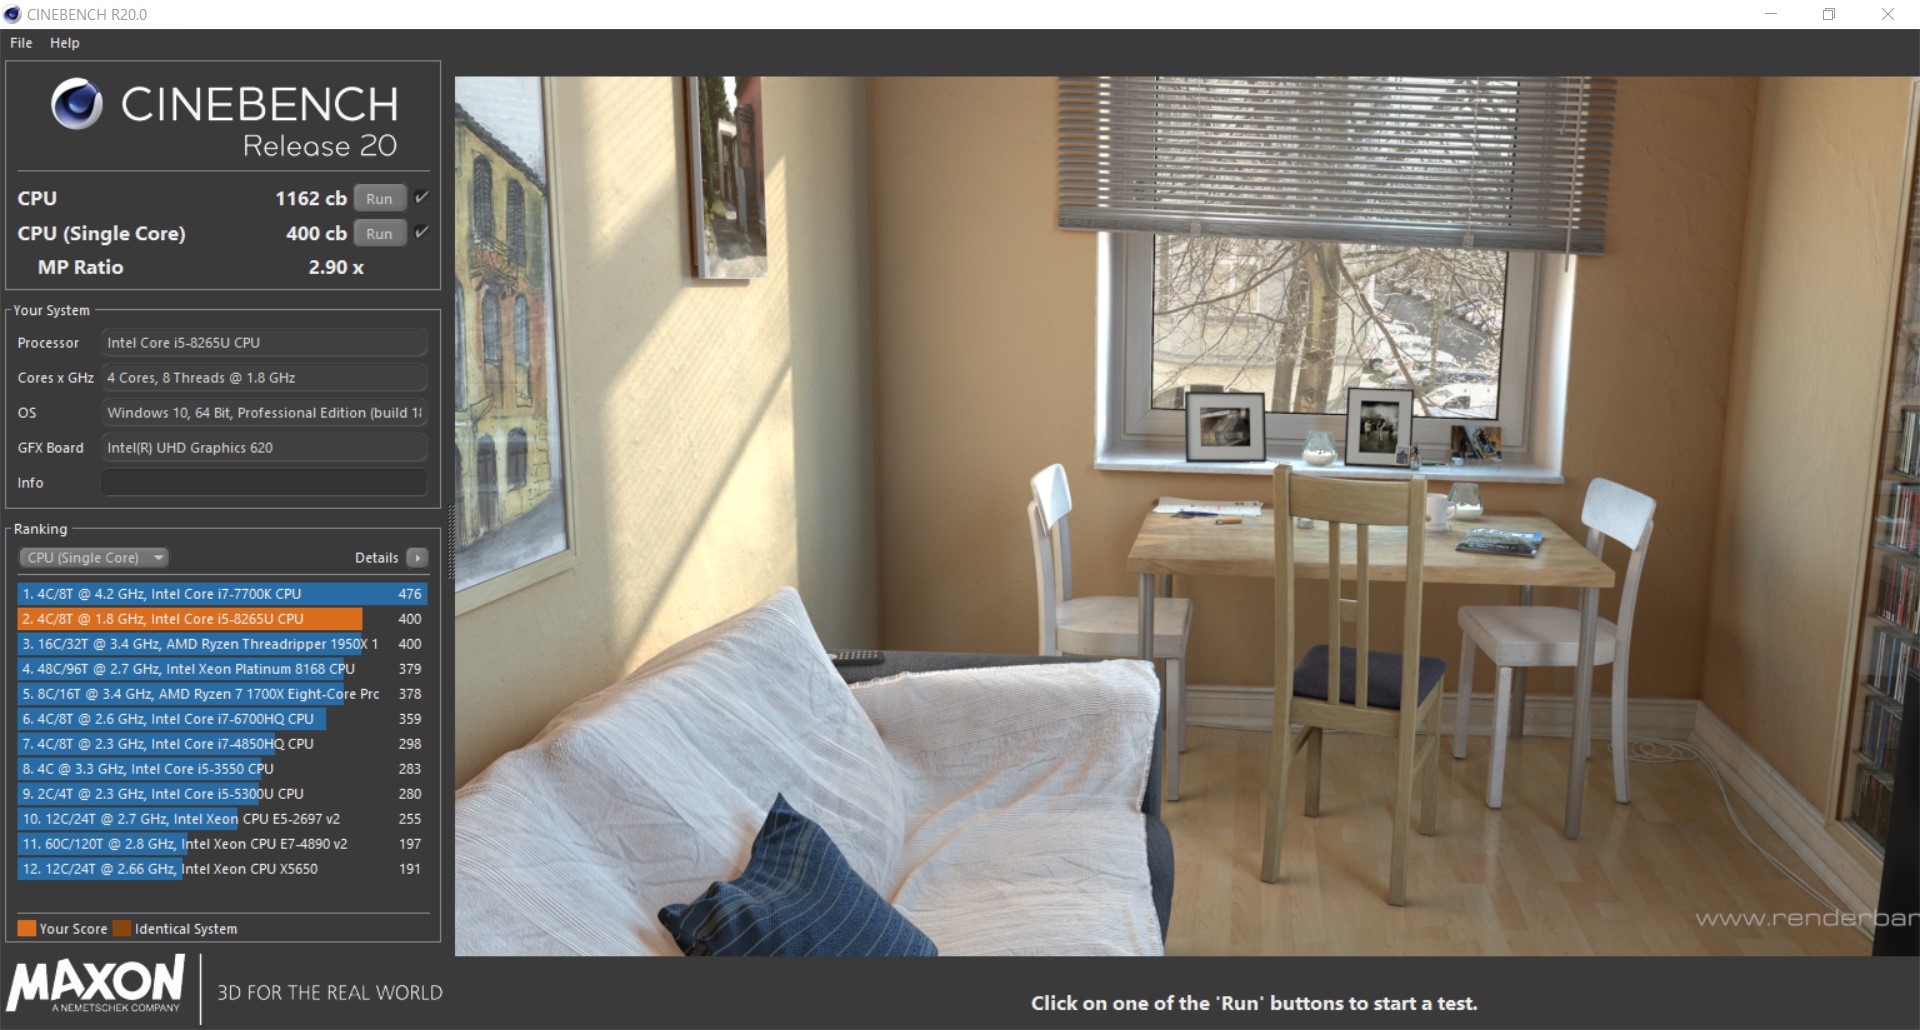
| Cinebench R20 | |
| CPU (Single Core) | |
| Lenovo ThinkPad L590-20Q70019GE | |
| Moyenne Intel Core i5-8265U (325 - 403, n=16) | |
| CPU (Multi Core) | |
| Moyenne Intel Core i5-8265U (972 - 1564, n=16) | |
| Lenovo ThinkPad L590-20Q70019GE | |
| Blender - v2.79 BMW27 CPU | |
| Lenovo ThinkPad L590-20Q70019GE | |
| Moyenne Intel Core i5-8265U (769 - 1098, n=15) | |
| Geekbench 4.4 | |
| 64 Bit Single-Core Score | |
| Moyenne Intel Core i5-8265U (2106 - 4830, n=19) | |
| Lenovo ThinkPad L590-20Q70019GE | |
| Lenovo ThinkPad L590-20Q70019GE | |
| 64 Bit Multi-Core Score | |
| Moyenne Intel Core i5-8265U (7144 - 16249, n=19) | |
| Lenovo ThinkPad L590-20Q70019GE | |
| Lenovo ThinkPad L590-20Q70019GE | |
| 7-Zip 18.03 | |
| 7z b 4 | |
| Moyenne Intel Core i5-8265U (13731 - 18802, n=15) | |
| Lenovo ThinkPad L590-20Q70019GE | |
| 7z b 4 -mmt1 | |
| Moyenne Intel Core i5-8265U (3780 - 4195, n=15) | |
| Lenovo ThinkPad L590-20Q70019GE | |
* ... Moindre est la valeur, meilleures sont les performances
| PCMark 8 Home Score Accelerated v2 | 2747 points | |
| PCMark 8 Creative Score Accelerated v2 | 3504 points | |
| PCMark 8 Work Score Accelerated v2 | 3132 points | |
| PCMark 10 Score | 2247 points | |
Aide | ||
| Lenovo ThinkPad L590-20Q70019GE Toshiba XG6 KXG6AZNV512G | Lenovo ThinkPad L580-20LW000VGE Samsung PM961 MZVLW256HEHP | Schenker Slim 15-RE-E19 Samsung SSD 970 EVO Plus 500GB | Lenovo ThinkPad E590-20NC0003GE Toshiba KBG30ZMT512G | Tuxedo Book BU1307 Samsung SSD 970 EVO 250GB | Acer TravelMate X3410-M-50DD Micron 1100 MTFDDAV256TBN | Moyenne Toshiba XG6 KXG6AZNV512G | |
|---|---|---|---|---|---|---|---|
| CrystalDiskMark 5.2 / 6 | -0% | 45% | -45% | 16% | -58% | 31% | |
| Write 4K (MB/s) | 115.3 | 117 1% | 187.2 62% | 53.4 -54% | 158.2 37% | 85.4 -26% | 139 ? 21% |
| Read 4K (MB/s) | 43.34 | 41.47 -4% | 51.8 20% | 33.03 -24% | 38.78 -11% | 26.4 -39% | 45.8 ? 6% |
| Write Seq (MB/s) | 1014 | 791 -22% | 1438 42% | 624 -38% | 1487 47% | 402.5 -60% | 1628 ? 61% |
| Read Seq (MB/s) | 1481 | 1390 -6% | 1347 -9% | 835 -44% | 913 -38% | 461.2 -69% | 1647 ? 11% |
| Write 4K Q32T1 (MB/s) | 495.4 | 651 31% | 396.7 -20% | 87.4 -82% | 330.5 -33% | 175.8 -65% | 547 ? 10% |
| Read 4K Q32T1 (MB/s) | 332.6 | 408.9 23% | 534 61% | 135.9 -59% | 423.8 27% | 228.8 -31% | 436 ? 31% |
| Write Seq Q32T1 (MB/s) | 1654 | 1227 -26% | 3280 98% | 784 -53% | 1540 -7% | 442.9 -73% | 2522 ? 52% |
| Read Seq Q32T1 (MB/s) | 1746 | 1779 2% | 3556 104% | 1623 -7% | 3556 104% | 522 -70% | 2739 ? 57% |
| Write 4K Q8T8 (MB/s) | 1033 | 309 -70% | 1266 ? 23% | ||||
| Read 4K Q8T8 (MB/s) | 892 | 247.1 -72% | 1212 ? 36% | ||||
| AS SSD | -10% | 52% | -58% | -723% | -50% | 18% | |
| Seq Read (MB/s) | 1383 | 1315 -5% | 2661 92% | 1348 -3% | 2406 74% | 492.9 -64% | 2383 ? 72% |
| Seq Write (MB/s) | 852 | 741 -13% | 2426 185% | 789 -7% | 435.1 -49% | 462.2 -46% | 1459 ? 71% |
| 4K Read (MB/s) | 45.72 | 45.28 -1% | 59 29% | 38.82 -15% | 50.2 10% | 26.89 -41% | 46.8 ? 2% |
| 4K Write (MB/s) | 120.2 | 119.9 0% | 166 38% | 81.8 -32% | 1.45 -99% | 85.1 -29% | 125.1 ? 4% |
| 4K-64 Read (MB/s) | 1344 | 1186 -12% | 1314 -2% | 825 -39% | 818 -39% | 234.2 -83% | 1294 ? -4% |
| 4K-64 Write (MB/s) | 926 | 456.3 -51% | 1494 61% | 488 -47% | 145.6 -84% | 312.8 -66% | 1276 ? 38% |
| Access Time Read * (ms) | 0.063 | 0.043 32% | 0.046 27% | 0.081 -29% | 0.047 25% | 0.0825 ? -31% | |
| Access Time Write * (ms) | 0.036 | 0.029 19% | 0.023 36% | 0.188 -422% | 2.784 -7633% | 0.056 -56% | 0.0335 ? 7% |
| Score Read (Points) | 1528 | 1363 -11% | 1639 7% | 999 -35% | 1108 -27% | 310 -80% | 1580 ? 3% |
| Score Write (Points) | 1132 | 650 -43% | 1902 68% | 649 -43% | 191 -83% | 444 -61% | 1547 ? 37% |
| Score Total (Points) | 3420 | 2689 -21% | 4379 28% | 2139 -37% | 1780 -48% | 922 -73% | 3893 ? 14% |
| Copy ISO MB/s (MB/s) | 1147 | 876 -24% | 923 -20% | 1645 ? 43% | |||
| Copy Program MB/s (MB/s) | 419.8 | 209.7 -50% | 453.6 8% | 425 ? 1% | |||
| Copy Game MB/s (MB/s) | 928 | 599 -35% | 523 -44% | 933 ? 1% | |||
| Moyenne finale (programmes/paramètres) | -5% /
-6% | 49% /
49% | -52% /
-54% | -354% /
-412% | -54% /
-53% | 25% /
24% |
* ... Moindre est la valeur, meilleures sont les performances

| 3DMark 11 Performance | 1846 points | |
| 3DMark Ice Storm Standard Score | 41848 points | |
| 3DMark Cloud Gate Standard Score | 6555 points | |
| 3DMark Fire Strike Score | 1043 points | |
| 3DMark Fire Strike Extreme Score | 501 points | |
| 3DMark Time Spy Score | 412 points | |
Aide | ||
| Bas | Moyen | Élevé | Ultra | |
|---|---|---|---|---|
| BioShock Infinite (2013) | 56 | 31 | 24 | 8 |
| Dota 2 Reborn (2015) | 60.4 | 36.7 | 18 | 16.2 |
| Rise of the Tomb Raider (2016) | 16.6 | 12.3 | 6.5 | |
| X-Plane 11.11 (2018) | 17.6 | 12.8 | 11.1 |
Degré de la nuisance sonore
| Au repos |
| 29 / 29 / 29 dB(A) |
| Fortement sollicité |
| 29 / 33.8 dB(A) |
 | ||
30 dB silencieux 40 dB(A) audible 50 dB(A) bruyant |
||
min: | ||
| Lenovo ThinkPad L590-20Q70019GE UHD Graphics 620, i5-8265U, Toshiba XG6 KXG6AZNV512G | Lenovo ThinkPad L580-20LW000VGE UHD Graphics 620, i5-8250U, Samsung PM961 MZVLW256HEHP | Schenker Slim 15-RE-E19 UHD Graphics 620, i5-8265U, Samsung SSD 970 EVO Plus 500GB | Lenovo ThinkPad E590-20NC0003GE UHD Graphics 620, i7-8565U, Toshiba KBG30ZMT512G | Tuxedo Book BU1307 UHD Graphics 620, i5-8550U, Samsung SSD 970 EVO 250GB | Acer TravelMate X3410-M-50DD GeForce MX130, i5-8550U, Micron 1100 MTFDDAV256TBN | |
|---|---|---|---|---|---|---|
| Noise | -7% | -19% | -0% | -7% | -9% | |
| arrêt / environnement * (dB) | 29 | 29.9 -3% | 30.4 -5% | 29.3 -1% | 30.5 -5% | 30.2 -4% |
| Idle Minimum * (dB) | 29 | 29.9 -3% | 30.4 -5% | 29.3 -1% | 30.5 -5% | 30.2 -4% |
| Idle Average * (dB) | 29 | 29.9 -3% | 30.4 -5% | 29.3 -1% | 30.8 -6% | 30.2 -4% |
| Idle Maximum * (dB) | 29 | 31.6 -9% | 31.6 -9% | 29.3 -1% | 30.8 -6% | 30.2 -4% |
| Load Average * (dB) | 29 | 33.1 -14% | 44.8 -54% | 30.6 -6% | 34.3 -18% | 36.8 -27% |
| Load Maximum * (dB) | 33.8 | 36 -7% | 44.8 -33% | 30.6 9% | 34.3 -1% | 36.8 -9% |
* ... Moindre est la valeur, meilleures sont les performances
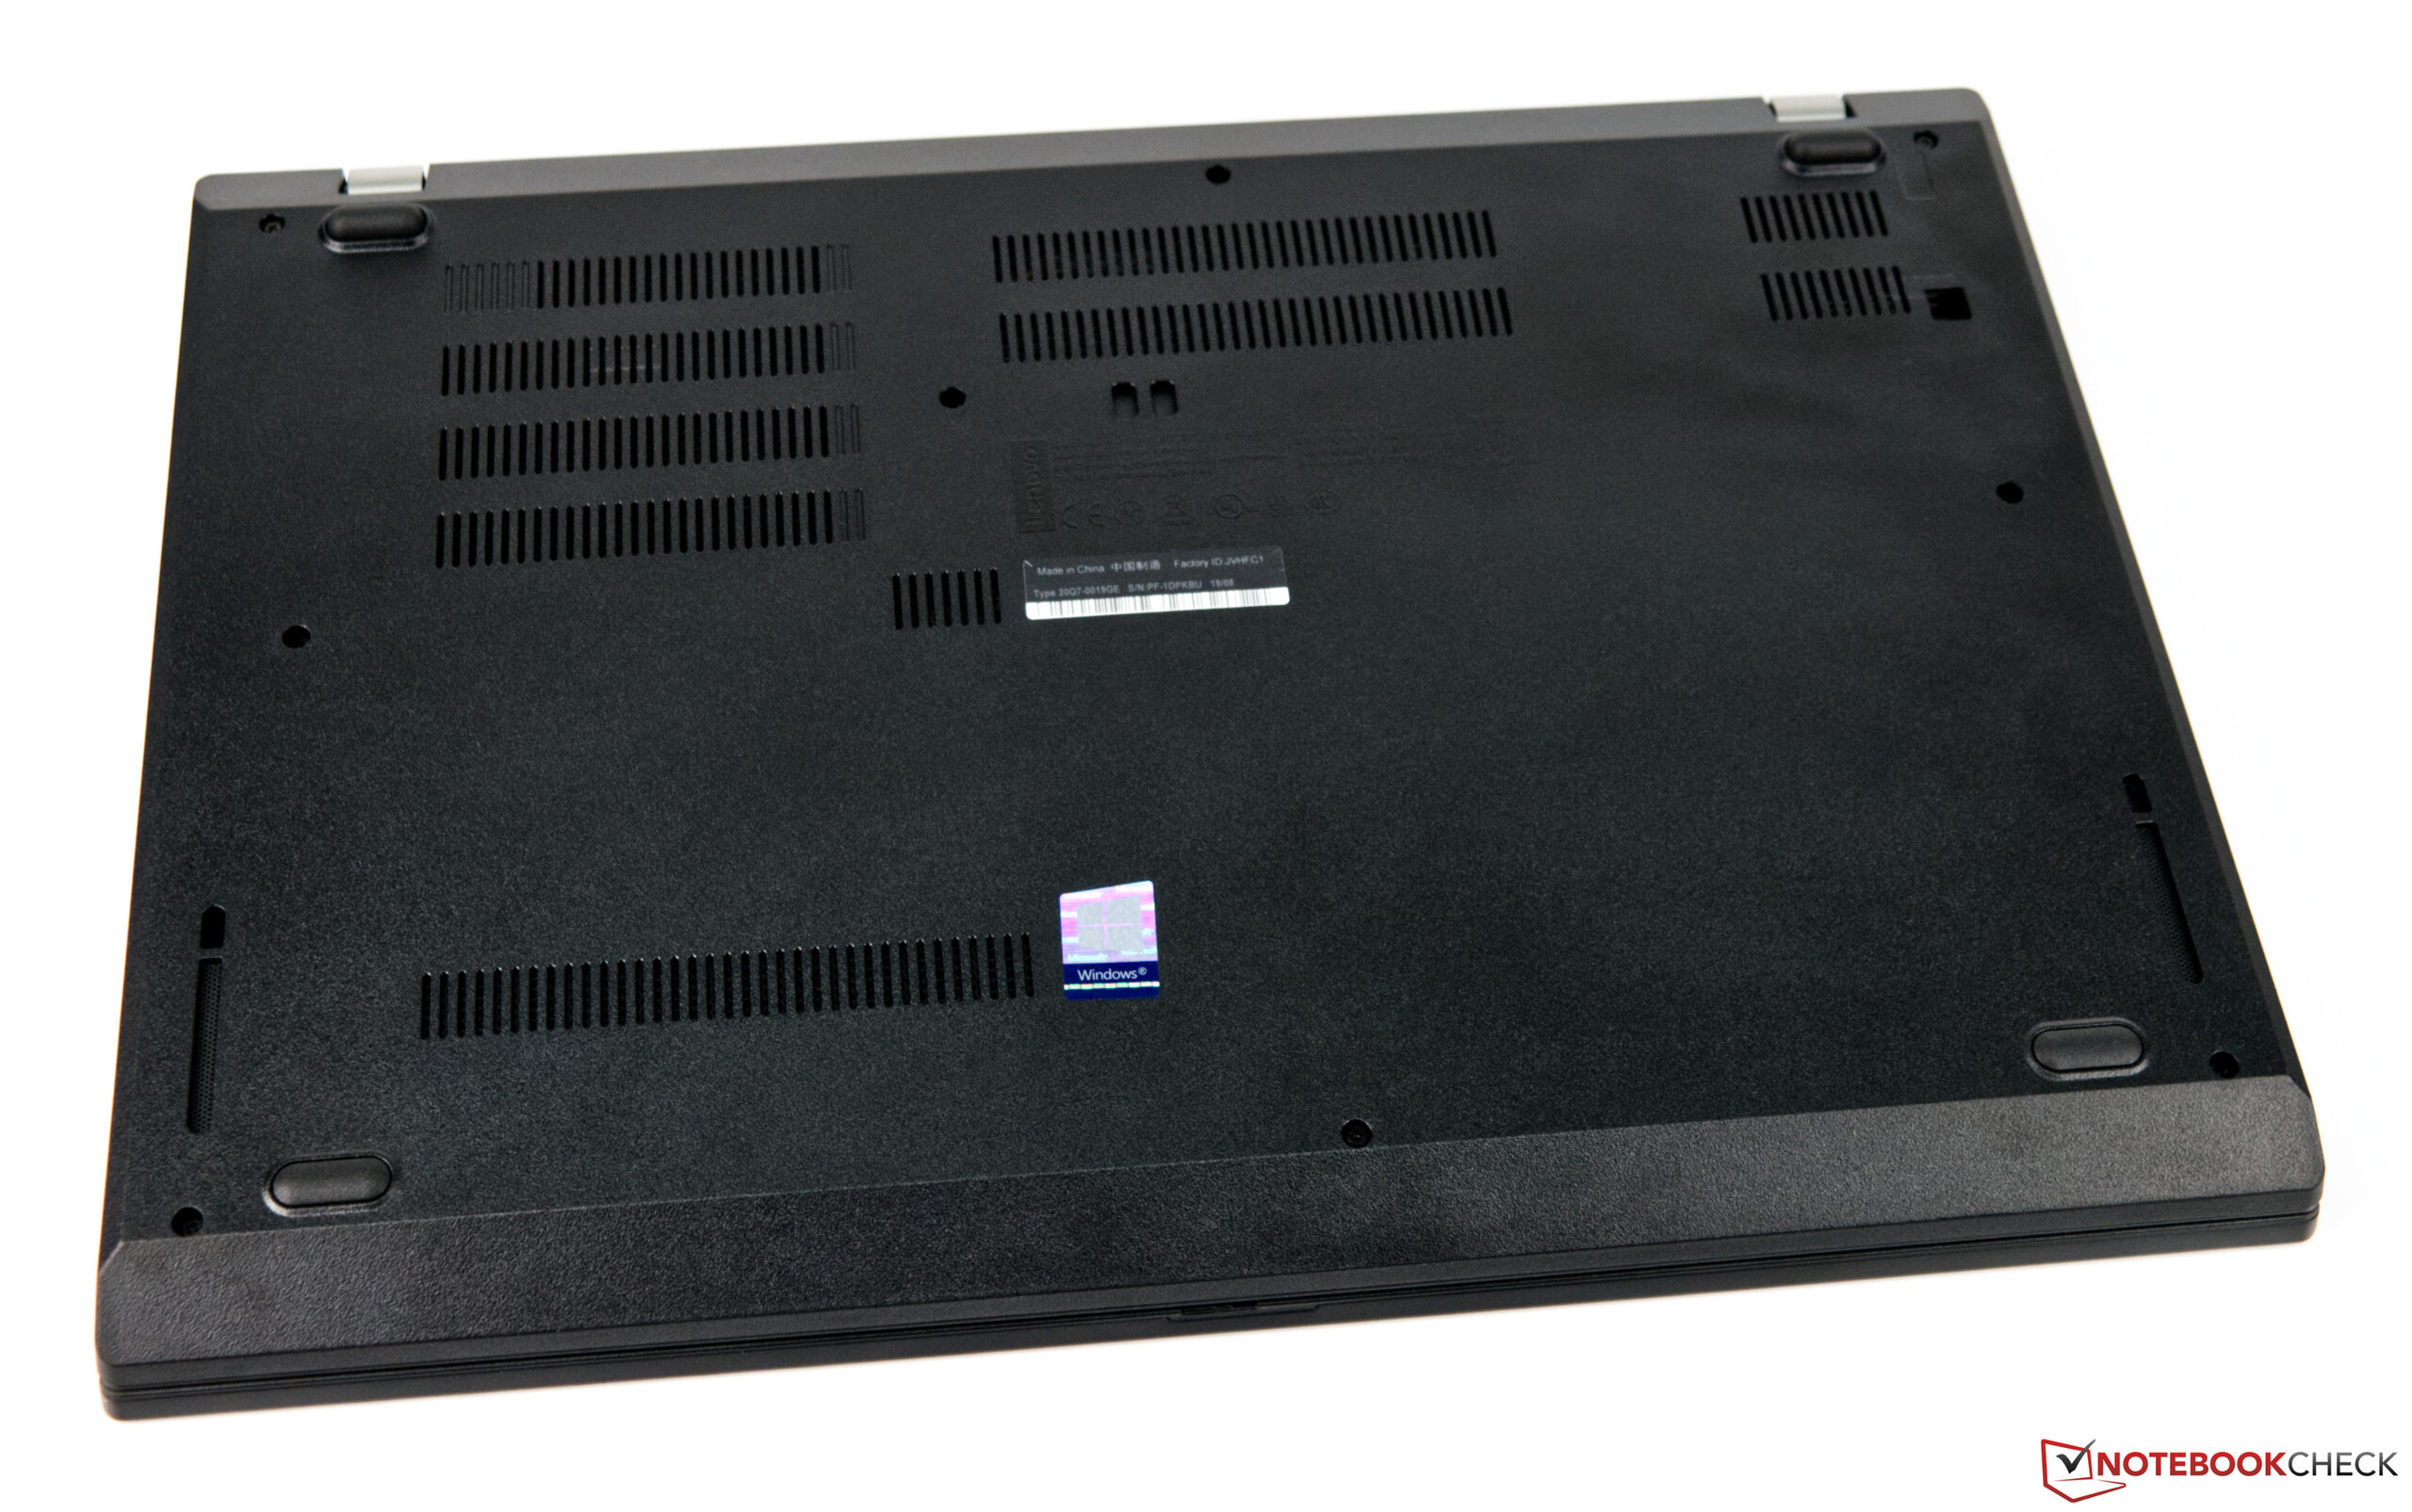
(±) La température maximale du côté supérieur est de 42.7 °C / 109 F, par rapport à la moyenne de 34.3 °C / 94 F, allant de 21.2 à 62.5 °C pour la classe Office.
(-) Le fond chauffe jusqu'à un maximum de 51 °C / 124 F, contre une moyenne de 36.8 °C / 98 F
(+) En utilisation inactive, la température moyenne du côté supérieur est de 24.8 °C / 77 F, par rapport à la moyenne du dispositif de 29.5 °C / 85 F.
(+) Les repose-poignets et le pavé tactile sont plus froids que la température de la peau avec un maximum de 25.2 °C / 77.4 F et sont donc froids au toucher.
(+) La température moyenne de la zone de l'appui-paume de dispositifs similaires était de 27.5 °C / 81.5 F (+2.3 °C / #4.1 F).
| Lenovo ThinkPad L590-20Q70019GE UHD Graphics 620, i5-8265U, Toshiba XG6 KXG6AZNV512G | Lenovo ThinkPad L580-20LW000VGE UHD Graphics 620, i5-8250U, Samsung PM961 MZVLW256HEHP | Schenker Slim 15-RE-E19 UHD Graphics 620, i5-8265U, Samsung SSD 970 EVO Plus 500GB | Lenovo ThinkPad E590-20NC0003GE UHD Graphics 620, i7-8565U, Toshiba KBG30ZMT512G | Tuxedo Book BU1307 UHD Graphics 620, i5-8550U, Samsung SSD 970 EVO 250GB | Acer TravelMate X3410-M-50DD GeForce MX130, i5-8550U, Micron 1100 MTFDDAV256TBN | |
|---|---|---|---|---|---|---|
| Heat | 7% | 6% | 5% | 10% | -1% | |
| Maximum Upper Side * (°C) | 42.7 | 43 -1% | 40.3 6% | 43.8 -3% | 35.9 16% | 48.4 -13% |
| Maximum Bottom * (°C) | 51 | 46.2 9% | 47.1 8% | 43.9 14% | 39.2 23% | 45 12% |
| Idle Upper Side * (°C) | 25.9 | 24.1 7% | 25 3% | 25.5 2% | 25.6 1% | 27.2 -5% |
| Idle Bottom * (°C) | 28.3 | 25.3 11% | 26.4 7% | 27 5% | 28.7 -1% | 27.2 4% |
* ... Moindre est la valeur, meilleures sont les performances
Lenovo ThinkPad L590-20Q70019GE analyse audio
(-) | haut-parleurs pas très forts (68 dB)
Basses 100 - 315 Hz
(±) | basse réduite - en moyenne 14.1% inférieure à la médiane
(±) | la linéarité des basses est moyenne (13% delta à la fréquence précédente)
Médiums 400 - 2000 Hz
(±) | médiane supérieure - en moyenne 7.4% supérieure à la médiane
(±) | la linéarité des médiums est moyenne (10% delta à la fréquence précédente)
Aiguës 2 - 16 kHz
(+) | des sommets équilibrés - à seulement 1.9% de la médiane
(±) | la linéarité des aigus est moyenne (10.9% delta à la fréquence précédente)
Globalement 100 - 16 000 Hz
(±) | la linéarité du son global est moyenne (27.5% de différence avec la médiane)
Par rapport à la même classe
» 86% de tous les appareils testés de cette catégorie étaient meilleurs, 4% similaires, 10% pires
» Le meilleur avait un delta de 7%, la moyenne était de 21%, le pire était de 53%.
Par rapport à tous les appareils testés
» 84% de tous les appareils testés étaient meilleurs, 3% similaires, 13% pires
» Le meilleur avait un delta de 4%, la moyenne était de 24%, le pire était de 134%.
Acer TravelMate X3410-M-50DD analyse audio
(-) | haut-parleurs pas très forts (65 dB)
Basses 100 - 315 Hz
(±) | basse réduite - en moyenne 10% inférieure à la médiane
(±) | la linéarité des basses est moyenne (8% delta à la fréquence précédente)
Médiums 400 - 2000 Hz
(±) | médiane supérieure - en moyenne 5.3% supérieure à la médiane
(±) | la linéarité des médiums est moyenne (9.3% delta à la fréquence précédente)
Aiguës 2 - 16 kHz
(+) | des sommets équilibrés - à seulement 1.2% de la médiane
(+) | les aigus sont linéaires (6.5% delta à la fréquence précédente)
Globalement 100 - 16 000 Hz
(±) | la linéarité du son global est moyenne (19.5% de différence avec la médiane)
Par rapport à la même classe
» 40% de tous les appareils testés de cette catégorie étaient meilleurs, 7% similaires, 52% pires
» Le meilleur avait un delta de 7%, la moyenne était de 21%, le pire était de 53%.
Par rapport à tous les appareils testés
» 48% de tous les appareils testés étaient meilleurs, 7% similaires, 44% pires
» Le meilleur avait un delta de 4%, la moyenne était de 24%, le pire était de 134%.
| Éteint/en veille | |
| Au repos | |
| Fortement sollicité |
|
Légende:
min: | |
| Lenovo ThinkPad L590-20Q70019GE i5-8265U, UHD Graphics 620, Toshiba XG6 KXG6AZNV512G, IPS, 1920x1080, 15.6" | Lenovo ThinkPad L580-20LW000VGE i5-8250U, UHD Graphics 620, Samsung PM961 MZVLW256HEHP, IPS, 1920x1080, 15.6" | Schenker Slim 15-RE-E19 i5-8265U, UHD Graphics 620, Samsung SSD 970 EVO Plus 500GB, IPS, 2x1, 15.6" | Lenovo ThinkPad E590-20NC0003GE i7-8565U, UHD Graphics 620, Toshiba KBG30ZMT512G, IPS LED, 1920x1080, 15.6" | Tuxedo Book BU1307 i5-8550U, UHD Graphics 620, Samsung SSD 970 EVO 250GB, IPS, 1920x1080, 13.3" | Acer TravelMate X3410-M-50DD i5-8550U, GeForce MX130, Micron 1100 MTFDDAV256TBN, IPS LED, 1920x1080, 14" | Moyenne Intel UHD Graphics 620 | Moyenne de la classe Office | |
|---|---|---|---|---|---|---|---|---|
| Power Consumption | -2% | 3% | -1% | -15% | -25% | -0% | -17% | |
| Idle Minimum * (Watt) | 3.96 | 4.4 -11% | 3.2 19% | 3.72 6% | 5.5 -39% | 4.6 -16% | 3.81 ? 4% | 4.4 ? -11% |
| Idle Average * (Watt) | 6.9 | 7.2 -4% | 6.5 6% | 7.8 -13% | 8.9 -29% | 6.5 6% | 6.94 ? -1% | 7.35 ? -7% |
| Idle Maximum * (Watt) | 9.8 | 8.3 15% | 11.3 -15% | 10.32 -5% | 11.5 -17% | 8.5 13% | 8.75 ? 11% | 8.57 ? 13% |
| Load Average * (Watt) | 31.4 | 36.4 -16% | 32 -2% | 30.24 4% | 34.6 -10% | 56 -78% | 35 ? -11% | 43.5 ? -39% |
| Load Maximum * (Watt) | 45.4 | 42.5 6% | 42.2 7% | 44 3% | 36.6 19% | 67 -48% | 47.5 ? -5% | 64.5 ? -42% |
* ... Moindre est la valeur, meilleures sont les performances


| Lenovo ThinkPad L590-20Q70019GE i5-8265U, UHD Graphics 620, 45 Wh | Lenovo ThinkPad L580-20LW000VGE i5-8250U, UHD Graphics 620, 45 Wh | Schenker Slim 15-RE-E19 i5-8265U, UHD Graphics 620, 36 Wh | Lenovo ThinkPad E590-20NC0003GE i7-8565U, UHD Graphics 620, 45 Wh | Tuxedo Book BU1307 i5-8550U, UHD Graphics 620, 66 Wh | Acer TravelMate X3410-M-50DD i5-8550U, GeForce MX130, 57 Wh | Moyenne de la classe Office | |
|---|---|---|---|---|---|---|---|
| Autonomie de la batterie | 6% | -37% | -12% | 28% | 15% | 37% | |
| Reader / Idle (h) | 17.4 | 18.3 5% | 17.4 0% | 23.7 ? 36% | |||
| H.264 (h) | 9 | 8.4 -7% | 11.6 29% | 15.1 ? 68% | |||
| WiFi v1.3 (h) | 7.2 | 7.6 6% | 4.5 -37% | 6.4 -11% | 9.2 28% | 10.9 51% | 12.9 ? 79% |
| Load (h) | 2.8 | 1.8 -36% | 2.2 -21% | 1.795 ? -36% |
Points positifs
Points négatifs
Verdict

Le ThinkPad L590 est un portable professionnel sans fioritures, qui nous a impressionnés avec ses excellents périphériques d’entrée. L’appareil ne possède cependant pas beaucoup d’autres points forts, les autres constructeurs ayant rattrapé Lenovo dans les autres domaines. Le L590 possède également des défauts, dont un écran peu lumineux à la couverture colorimétrique bien trop réduite. La concurrence ne fait cependant pas beaucoup mieux à cet égard.
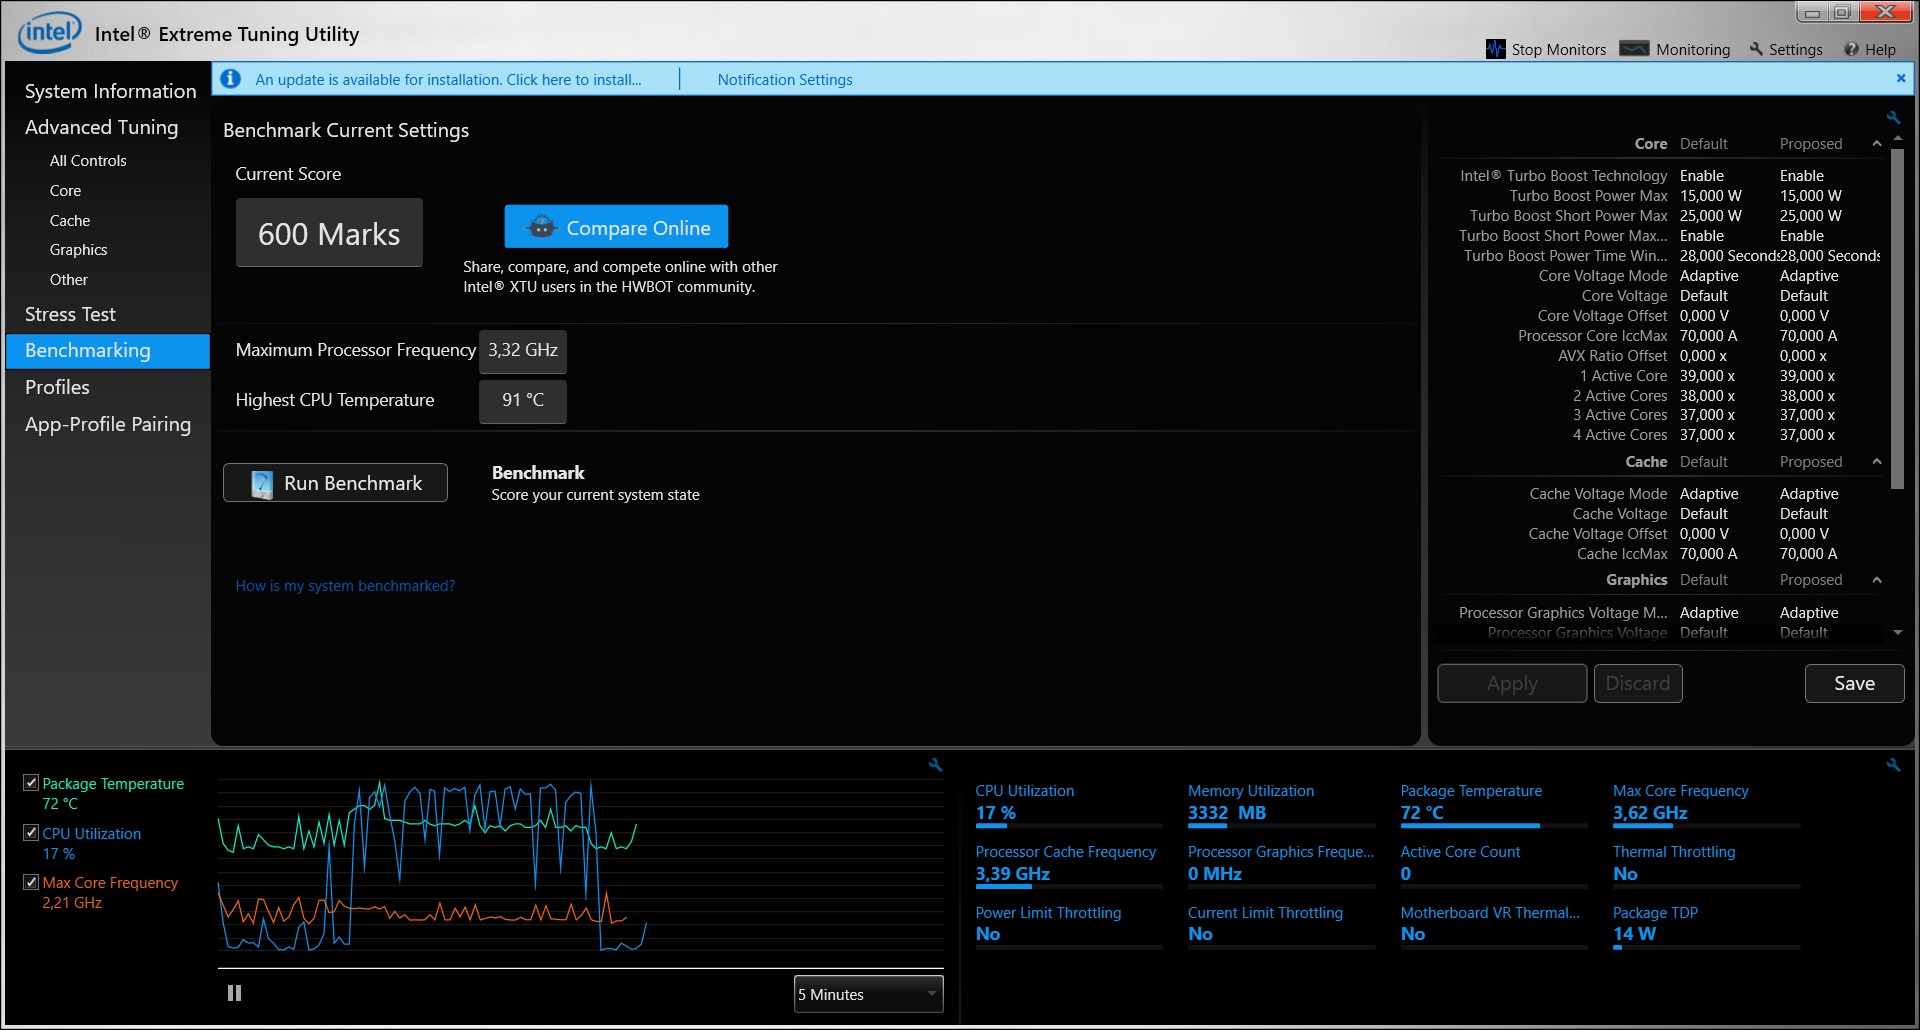
Comme son prédécesseur, le L590 ne peut tirer pleinement profit de son processeur quadricœur. La cause en est certainement le refroidissement, que Lenovo devrait améliorer dans la série L. Nous n’avons pas à critiquer le choix des ports du L590. Tout ce dont on a besoin est présent, et les haut-parleurs ne nous ont pas non plus déçus.
Ceux qui sont à la recherche d’un portable pro au prix raisonnable devraient regarder du côté du Lenovo ThinkPad L590. L’appareil vaut le coup pour sa connectivité et ses périphériques d’entrée, à moins de 1 000 €, mais il faudra être prêt à composer avec quelques défauts.
L’intégralité de cette critique est disponible en anglais en suivant ce lien.
Lenovo ThinkPad L590-20Q70019GE
- 10/25/2019 v7 (old)
Sebastian Bade
Price comparison
