Notebookcheck Logo

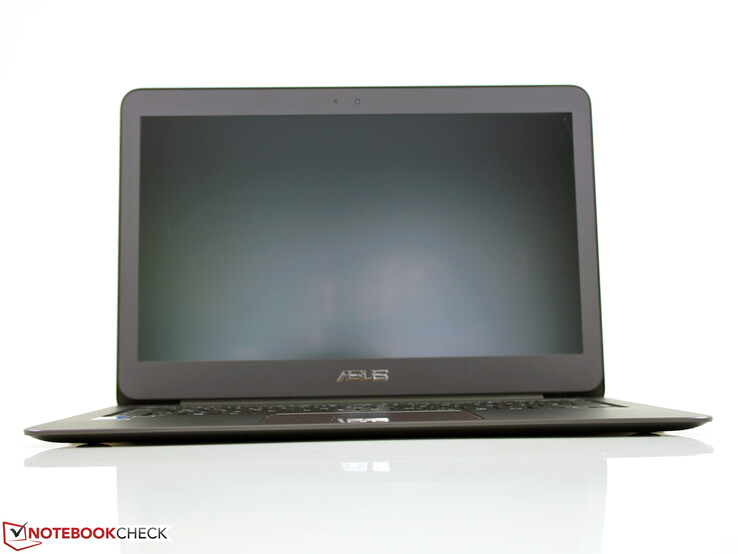
Courte critique de l'Asus Zenbook UX305UA-FC040T

Endurant. Le processeur Skylake intégré dans le Zenbook UX305 permet des performances en hausse sans impact négatif sur l'autonomie. Le disque SSD rapide, l'écran Full HD et le clavier excellent restent inchangés.
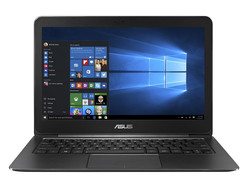
Asus Zenbook UX305UA-FC040T (Zenbook UX303UA Gamme)
Processeur
Intel Core i7-6500U 2 x 2.5 - 3.1 GHz, Skylake
Carte graphique
Intel HD Graphics 520, Processeur: 950 MHz, double canal, 20.19.15.4352
Mémoire
8 Go 
, DDR3-1600, doublel canal, aucun emplacement mémoire disponible, RAM soudée à la carte mère
Écran
13.30 pouces 16:9, 1920 x 1080 pixel, AU Optronics B133HAN02.7, IPS, brillant: non
Carte mère
Intel Skylake-U Premium PCH
Disque dur
SK Hynix Canvas SC300 512GB M.2 (HFS512G39MND), 512 Go 
, 440 Go libres
Carte son
Conexant CX20751/2 @ Intel Skylake High Definition Audio Controller
Connexions
1 USB 2.0, 2 USB 3.0 / 3.1 Gen1, 1 HDMI, Connectique audio: combo audio, Lecteur de cartes mémoires: SD, Capteur de luminosité, TPM 2.0
Réseau
Intel Dual Band Wireless-AC 7265 (a/b/g/h/n = Wi-Fi 4/ac = Wi-Fi 5/), Bluetooth 4.0
Taille
Hauteur x Largeur x Profondeur (en mm): 12 x 324 x 226
Batterie
56 Wh, 56 mAh Lithium-Ion
Système d'exploitation
Microsoft Windows 10 Home 64 Bit
Appareil photo
Webcam: webcam HD
Fonctionnalités additionnelles
Haut-parleurs: Stereo, Clavier: Chiclet, Rétroéclairage du clavier: non, sac de transport, adaptateur USB 3.0 vers prise Ethernet, Evernote, Foxit PhantomPDF, McAfee LiveSafe - Internet Security (Demo), MS Office (Demo), WPS Office, 24 Mois Garantie
Poids
1.45 kg, Alimentation: 175 g
Prix
1249 Euro
Remarque : le fabricant peut utiliser des composants provenant de différents fournisseurs, notamment des panneaux d'affichage, des lecteurs ou des clés USB ayant des spécifications similaires.


372
cd/m²
371
cd/m²
380
cd/m²
325
cd/m²
358
cd/m²
339
cd/m²
328
cd/m²
336
cd/m²
352
cd/m²
Homogénéité de la luminosité
AU Optronics B133HAN02.7 tested with X-Rite i1Pro 2
Maximum: 380 cd/m² (Nits) Moyenne: 351.2 cd/m² Minimum: 21 cd/m²
Homogénéité de la luminosité: 86 %
Valeur mesurée au centre, sur batterie: 358 cd/m²
Contraste: 895:1 (Valeurs des noirs: 0.4 cd/m²)
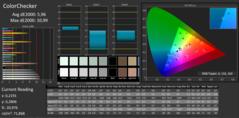
ΔE Color 5.96 | 0.5-29.43 Ø4.92
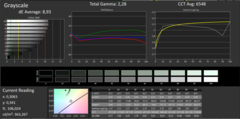
ΔE Greyscale 8.93 | 0.5-98 Ø5.2
93% sRGB (Argyll 1.6.3 3D)
60% AdobeRGB 1998 (Argyll 1.6.3 3D)
66.3% AdobeRGB 1998 (Argyll 2.2.0 3D)
92.8% sRGB (Argyll 2.2.0 3D)
65.1% Display P3 (Argyll 2.2.0 3D)
Gamma: 2.28

Scintillement / MLI (Modulation de largeur d'impulsion)

Afin d'abaisser la luminosité de l'écran, certains ordinateurs portables font varier très rapidement le rétroéclairage entre éteint et allumé. La fréquence à laquelle le rétroéclairage s'éteint et se rallume est normalement fixée à une valeur qui permet de rendre la variation indétectable à l'œil nu? Si la fréquence est trop basse, certaines personnes peuvent être sujettes à une fatigue oculaire, des maux de tête ou même percevoir les variations.
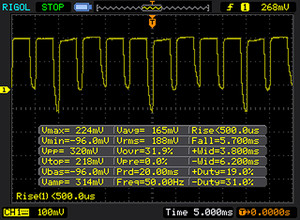
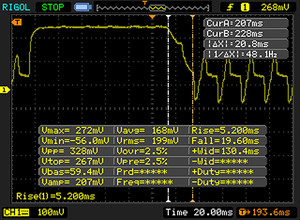
Scintillement / MLI (Modulation de largeur d'impulsion) décelé 50 Hz ≤ 20 Niveau de luminosité

Le rétroéclairage de l'écran scintille à la fréquence de 50 Hz (certainement du fait de l'utilisation d'une MDI - Modulation de largeur d'impulsion) à un niveau de luminosité inférieur ou égal à 20 % . Aucun scintillement ne devrait être perceptible au-dessus de cette valeur.

La fréquence de rafraîchissement de 50 Hz est extrêmement faible, de grands risques de fatigue oculaire accrue et de maux de tête en cas d'utilisation prolongée.

En comparaison, 53 % des appareils testés n'emploient pas MDI pour assombrir leur écran. Nous avons relevé une moyenne à 8774 (minimum : 5 - maximum : 343500) Hz dans le cas où une MDI était active.

CalMAN - Color Checker
CalMAN - Graustufen
CalMAN - Graustufen
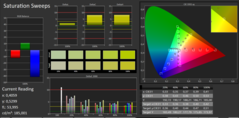
CalMAN - Farbsättigung

Temps de réponse de l'écran

Le temps de réponse d'un écran mesure la rapidité à laquelle l'écran est capable de changer une couleur pour une autre. Un temps de réponse élevé se traduit par une image floutée pour les objets en mouvement. Les joueurs bénéficieront de faibles latences d'affichage en jeu.
       Temps de réponse noir à blanc
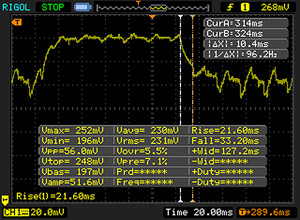
28 ms ... hausse ↗ et chute ↘ combinées↗ 8 ms hausse
↘ 20 ms chute
L'écran souffre de latences relativement élevées, insuffisant pour le jeu.
En comparaison, tous les appareils testés affichent entre 0.1 (minimum) et 240 (maximum) ms. » 68 % des appareils testés affichent de meilleures performances.
Cela signifie que les latences relevées sont moins bonnes que la moyenne (21 ms) de tous les appareils testés.
       Temps de réponse gris 50% à gris 80%
25 ms ... hausse ↗ et chute ↘ combinées↗ 15 ms hausse
↘ 10 ms chute
L'écran souffre de latences relativement élevées, insuffisant pour le jeu.
En comparaison, tous les appareils testés affichent entre 0.165 (minimum) et 636 (maximum) ms. » 31 % des appareils testés affichent de meilleures performances.
Cela signifie que les latences relevées sont meilleures que la moyenne (32.9 ms) de tous les appareils testés.
Asus Zenbook UX305UA-FC040T
IPS, 1920x1080
Asus Zenbook UX305LA-FC012H
IPS, 1920x1080
Asus Zenbook UX305CA-EHM1
IPS, 1920x1080
Dell XPS 13 2016 i7 256GB QHD
IGZO , 3200x1800
Lenovo Yoga 900-13ISK 80MK
IPS, 3200x1800
Apple MacBook Air 13 inch 2015-03
TN LED, 1440x900
Lenovo U31-70 80M5003EGE
IPS, 1920x1080
Acer Aspire V3-372-50LK
IPS, 1920x1080
Display
-2%
-2%
-1%
-3%
-37%
-39%
-39%
Display P3 Coverage
65.1
63.9
-2%
64.5
-1%
63.6
-2%
63.2
-3%
40.1
-38%
38.85
-40%
39.05
-40%
sRGB Coverage
92.8
91.6
-1%
90.4
-3%
93.6
1%
88.7
-4%
59.8
-36%
58.3
-37%
58.7
-37%
AdobeRGB 1998 Coverage
66.3
65
-2%
65.5
-1%
65.5
-1%
64.9
-2%
41.51
-37%
40.17
-39%
40.35
-39%
Response Times
88%
3211%
832%
-62%
-35%
Response Time Grey 50% / Grey 80% *
25 ?(15, 10)
37.6 ?(17.2, 20.4)
-50%
40 ?(10, 30, Schwankungen auf kleinstem Niveau (Akku/Netz ident))
-60%
38.8 ?(18.4, 20.4)
-55%
54 ?(19, 35)
-116%
46 ?(19, 27)
-84%
Response Time Black / White *
28 ?(8, 20)
24.8 ?(6.8, 18)
11%
30 ?(7, 23)
-7%
22.4 ?(9.2, 13.2)
20%
30 ?(7, 23)
-7%
24 ?(5, 19)
14%
PWM Frequency
50 ?(20)
201.6 ?(25, 78)
303%
4900 ?(100)
9700%
1316
2532%
Screen
15%
6%
17%
-8%
2%
-2%
-10%
Brightness middle
358
349
-3%
324.3
-9%
285
-20%
319.8
-11%
329
-8%
293
-18%
250
-30%
Brightness
351
338
-4%
314
-11%
281
-20%
302
-14%
310
-12%
289
-18%
247
-30%
Brightness Distribution
86
87
1%
93
8%
90
5%
88
2%
82
-5%
93
8%
87
1%
Black Level *
0.4
0.25
37%
0.289
28%
0.18
55%
0.835
-109%
0.405
-1%
0.36
10%
0.43
-8%
Contrast
895
1396
56%
1122
25%
1583
77%
383
-57%
812
-9%
814
-9%
581
-35%
Colorchecker dE 2000 *
5.96
5.49
8%
6.03
-1%
4.89
18%
2.68
55%
3.96
34%
4.94
17%
4.51
24%
Colorchecker dE 2000 max. *
10.99
7.51
32%
9.98
9%
Greyscale dE 2000 *
8.93
5.43
39%
7.89
12%
5.16
42%
2.35
74%
3.51
61%
4.11
54%
3.18
64%
Gamma
2.28 96%
2.17 101%
2.08 106%
2.15 102%
2.09 105%
3.83 57%
2.48 89%
2.43 91%
CCT
6548 99%
7055 92%
6490 100%
7106 91%
6975 93%
6711 97%
7508 87%
6743 96%
Color Space (Percent of AdobeRGB 1998)
60
60
0%
65.46
9%
59
-2%
57
-5%
38.4
-36%
37
-38%
37
-38%
Color Space (Percent of sRGB)
93
92
-1%
90.36
-3%
93
0%
88
-5%
59.8
-36%
58
-38%
58
-38%
Moyenne finale (programmes/paramètres)
7% / 11%
31% / 21%
1076% / 652%
274% / 161%
-18% / -7%
-34% / -17%
-28% / -20%

* ... Moindre est la valeur, meilleures sont les performances

CPU-Z
CPU-Z
CPU-Z
CPU-Z
GPU-Z
HWINfo
HWInfo
Cinebench R10 Shading 32Bit
8260
Cinebench R10 Rendering Multiple CPUs 32Bit
9681
Cinebench R10 Rendering Single 32Bit
4838
Cinebench R11.5 OpenGL 64Bit
37.48 fps
Cinebench R11.5 CPU Multi 64Bit
3.53 Points
Cinebench R11.5 CPU Single 64Bit
1.45 Points
Cinebench R15 Ref. Match 64Bit
97.8 %
Cinebench R15 OpenGL 64Bit
41.39 fps
Cinebench R15 CPU Multi 64Bit
312 Points
Cinebench R15 CPU Single 64Bit
123 Points
Aide
Cinebench R15
CPU Multi 64Bit
Asus Zenbook UX305UA-FC040T
HD Graphics 520, 6500U, SK Hynix Canvas SC300 512GB M.2 (HFS512G39MND)
312 Points
Dell XPS 13 2016 i7 256GB QHD
HD Graphics 520, 6500U, Samsung PM951 NVMe MZ-VLV256D
303 Points -3%
Apple MacBook Air 13 inch 2015-03
HD Graphics 6000, 5650U, Apple SSD SD0256F
296 Points -5%
Asus Zenbook UX305LA-FC012H
HD Graphics 5500, 5500U, Micron M600 MTFDDAV256MBF M.2
296 Points -5%
Acer Aspire V3-372-50LK
HD Graphics 520, 6200U, Toshiba HG6 THNSNJ256G8NU
291 Points -7%
Lenovo Yoga 900-13ISK 80MK
HD Graphics 520, 6500U, Samsung SSD PM871 MZNLN512HCJH
287 Points -8%
Lenovo U31-70 80M5003EGE
GeForce 920M, 5500U, Western Digital WD10S21X SSHD 1TB + 8GB SSD-Cache
276 Points -12%
Asus Zenbook UX305CA-EHM1
HD Graphics 515, 6Y30, Micron M600 MTFDDAV256MBF M.2
200 Points -36%
CPU Single 64Bit
Dell XPS 13 2016 i7 256GB QHD
HD Graphics 520, 6500U, Samsung PM951 NVMe MZ-VLV256D
125 Points +2%
Lenovo U31-70 80M5003EGE
GeForce 920M, 5500U, Western Digital WD10S21X SSHD 1TB + 8GB SSD-Cache
123 Points 0%
Asus Zenbook UX305UA-FC040T
HD Graphics 520, 6500U, SK Hynix Canvas SC300 512GB M.2 (HFS512G39MND)
123 Points
Asus Zenbook UX305LA-FC012H
HD Graphics 5500, 5500U, Micron M600 MTFDDAV256MBF M.2
121 Points -2%
Apple MacBook Air 13 inch 2015-03
HD Graphics 6000, 5650U, Apple SSD SD0256F
112 Points -9%
Acer Aspire V3-372-50LK
HD Graphics 520, 6200U, Toshiba HG6 THNSNJ256G8NU
97 Points -21%
Lenovo Yoga 900-13ISK 80MK
HD Graphics 520, 6500U, Samsung SSD PM871 MZNLN512HCJH
87 Points -29%
Asus Zenbook UX305CA-EHM1
HD Graphics 515, 6Y30, Micron M600 MTFDDAV256MBF M.2
72 Points -41%
Cinebench R11.5
CPU Multi 64Bit
Asus Zenbook UX305UA-FC040T
HD Graphics 520, 6500U, SK Hynix Canvas SC300 512GB M.2 (HFS512G39MND)
3.53 Points
Dell XPS 13 2016 i7 256GB QHD
HD Graphics 520, 6500U, Samsung PM951 NVMe MZ-VLV256D
3.52 Points 0%
Asus Zenbook UX305LA-FC012H
HD Graphics 5500, 5500U, Micron M600 MTFDDAV256MBF M.2
3.26 Points -8%
Lenovo Yoga 900-13ISK 80MK
HD Graphics 520, 6500U, Samsung SSD PM871 MZNLN512HCJH
3.23 Points -8%
Acer Aspire V3-372-50LK
HD Graphics 520, 6200U, Toshiba HG6 THNSNJ256G8NU
3.2 Points -9%
Apple MacBook Air 13 inch 2015-03
HD Graphics 6000, 5650U, Apple SSD SD0256F
3.14 Points -11%
Lenovo U31-70 80M5003EGE
GeForce 920M, 5500U, Western Digital WD10S21X SSHD 1TB + 8GB SSD-Cache
3.07 Points -13%
Asus Zenbook UX305CA-EHM1
HD Graphics 515, 6Y30, Micron M600 MTFDDAV256MBF M.2
1.79 Points -49%
CPU Single 64Bit
Apple MacBook Air 13 inch 2015-03
HD Graphics 6000, 5650U, Apple SSD SD0256F
1.47 Points +1%
Dell XPS 13 2016 i7 256GB QHD
HD Graphics 520, 6500U, Samsung PM951 NVMe MZ-VLV256D
1.46 Points +1%
Lenovo Yoga 900-13ISK 80MK
HD Graphics 520, 6500U, Samsung SSD PM871 MZNLN512HCJH
1.45 Points 0%
Asus Zenbook UX305UA-FC040T
HD Graphics 520, 6500U, SK Hynix Canvas SC300 512GB M.2 (HFS512G39MND)
1.45 Points
Lenovo U31-70 80M5003EGE
GeForce 920M, 5500U, Western Digital WD10S21X SSHD 1TB + 8GB SSD-Cache
1.43 Points -1%
Asus Zenbook UX305LA-FC012H
HD Graphics 5500, 5500U, Micron M600 MTFDDAV256MBF M.2
1.41 Points -3%
Acer Aspire V3-372-50LK
HD Graphics 520, 6200U, Toshiba HG6 THNSNJ256G8NU
1.13 Points -22%
Asus Zenbook UX305CA-EHM1
HD Graphics 515, 6Y30, Micron M600 MTFDDAV256MBF M.2
0.81 Points -44%
Cinebench R10
Rendering Multiple CPUs 32Bit
Dell XPS 13 2016 i7 256GB QHD
HD Graphics 520, 6500U, Samsung PM951 NVMe MZ-VLV256D
10973 Points +13%
Apple MacBook Air 13 inch 2015-03
HD Graphics 6000, 5650U, Apple SSD SD0256F
10008 Points +3%
Acer Aspire V3-372-50LK
HD Graphics 520, 6200U, Toshiba HG6 THNSNJ256G8NU
9942 Points +3%
Asus Zenbook UX305LA-FC012H
HD Graphics 5500, 5500U, Micron M600 MTFDDAV256MBF M.2
9767 Points +1%
Asus Zenbook UX305UA-FC040T
HD Graphics 520, 6500U, SK Hynix Canvas SC300 512GB M.2 (HFS512G39MND)
9681 Points
Lenovo U31-70 80M5003EGE
GeForce 920M, 5500U, Western Digital WD10S21X SSHD 1TB + 8GB SSD-Cache
9543 Points -1%
Lenovo Yoga 900-13ISK 80MK
HD Graphics 520, 6500U, Samsung SSD PM871 MZNLN512HCJH
9348 Points -3%
Rendering Single 32Bit
Apple MacBook Air 13 inch 2015-03
HD Graphics 6000, 5650U, Apple SSD SD0256F
4980 Points +3%
Lenovo Yoga 900-13ISK 80MK
HD Graphics 520, 6500U, Samsung SSD PM871 MZNLN512HCJH
4920 Points +2%
Dell XPS 13 2016 i7 256GB QHD
HD Graphics 520, 6500U, Samsung PM951 NVMe MZ-VLV256D
4881 Points +1%
Asus Zenbook UX305UA-FC040T
HD Graphics 520, 6500U, SK Hynix Canvas SC300 512GB M.2 (HFS512G39MND)
4838 Points
Lenovo U31-70 80M5003EGE
GeForce 920M, 5500U, Western Digital WD10S21X SSHD 1TB + 8GB SSD-Cache
4695 Points -3%
Asus Zenbook UX305LA-FC012H
HD Graphics 5500, 5500U, Micron M600 MTFDDAV256MBF M.2
4600 Points -5%
Acer Aspire V3-372-50LK
HD Graphics 520, 6200U, Toshiba HG6 THNSNJ256G8NU
4397 Points -9%
Geekbench 3
32 Bit Single-Core Score
Asus Zenbook UX305UA-FC040T
HD Graphics 520, 6500U, SK Hynix Canvas SC300 512GB M.2 (HFS512G39MND)
3133 Points
Apple MacBook Air 13 inch 2015-03
HD Graphics 6000, 5650U, Apple SSD SD0256F
3053 Points -3%
Asus Zenbook UX305LA-FC012H
HD Graphics 5500, 5500U, Micron M600 MTFDDAV256MBF M.2
2846 Points -9%
Lenovo U31-70 80M5003EGE
GeForce 920M, 5500U, Western Digital WD10S21X SSHD 1TB + 8GB SSD-Cache
2747 Points -12%
32 Bit Multi-Core Score
Asus Zenbook UX305UA-FC040T
HD Graphics 520, 6500U, SK Hynix Canvas SC300 512GB M.2 (HFS512G39MND)
6655 Points
Apple MacBook Air 13 inch 2015-03
HD Graphics 6000, 5650U, Apple SSD SD0256F
6406 Points -4%
Asus Zenbook UX305LA-FC012H
HD Graphics 5500, 5500U, Micron M600 MTFDDAV256MBF M.2
6039 Points -9%
Lenovo U31-70 80M5003EGE
GeForce 920M, 5500U, Western Digital WD10S21X SSHD 1TB + 8GB SSD-Cache
5769 Points -13%
Sunspider - 1.0 Total Score
Asus Zenbook UX305CA-EHM1
HD Graphics 515, 6Y30, Micron M600 MTFDDAV256MBF M.2
124.5 ms * -52%
Lenovo U31-70 80M5003EGE
GeForce 920M, 5500U, Western Digital WD10S21X SSHD 1TB + 8GB SSD-Cache
96.2 ms * -18%
Asus Zenbook UX305LA-FC012H
HD Graphics 5500, 5500U, Micron M600 MTFDDAV256MBF M.2
95.3 ms * -17%
Acer Aspire V3-372-50LK
HD Graphics 520, 6200U, Toshiba HG6 THNSNJ256G8NU
89 ms * -9%
Dell XPS 13 2016 i7 256GB QHD
HD Graphics 520, 6500U, Samsung PM951 NVMe MZ-VLV256D
85 ms * -4%
Asus Zenbook UX305UA-FC040T
HD Graphics 520, 6500U, SK Hynix Canvas SC300 512GB M.2 (HFS512G39MND)
81.8 ms *
JetStream 1.1 - Total Score
Asus Zenbook UX305UA-FC040T
HD Graphics 520, 6500U, SK Hynix Canvas SC300 512GB M.2 (HFS512G39MND)
212.9 Points
Lenovo U31-70 80M5003EGE
GeForce 920M, 5500U, Western Digital WD10S21X SSHD 1TB + 8GB SSD-Cache
116.6 Points -45%
Mozilla Kraken 1.1 - Total
Asus Zenbook UX305LA-FC012H
HD Graphics 5500, 5500U, Micron M600 MTFDDAV256MBF M.2
2292 ms * -102%
Lenovo U31-70 80M5003EGE
GeForce 920M, 5500U, Western Digital WD10S21X SSHD 1TB + 8GB SSD-Cache
2251 ms * -99%
Acer Aspire V3-372-50LK
HD Graphics 520, 6200U, Toshiba HG6 THNSNJ256G8NU
1251 ms * -10%
Dell XPS 13 2016 i7 256GB QHD
HD Graphics 520, 6500U, Samsung PM951 NVMe MZ-VLV256D
1149 ms * -1%
Asus Zenbook UX305UA-FC040T
HD Graphics 520, 6500U, SK Hynix Canvas SC300 512GB M.2 (HFS512G39MND)
1134 ms *
Octane V2 - Total Score
Asus Zenbook UX305UA-FC040T
HD Graphics 520, 6500U, SK Hynix Canvas SC300 512GB M.2 (HFS512G39MND)
31796 Points
Dell XPS 13 2016 i7 256GB QHD
HD Graphics 520, 6500U, Samsung PM951 NVMe MZ-VLV256D
29724 Points -7%
Acer Aspire V3-372-50LK
HD Graphics 520, 6200U, Toshiba HG6 THNSNJ256G8NU
28525 Points -10%
Asus Zenbook UX305LA-FC012H
HD Graphics 5500, 5500U, Micron M600 MTFDDAV256MBF M.2
14493 Points -54%
Lenovo U31-70 80M5003EGE
GeForce 920M, 5500U, Western Digital WD10S21X SSHD 1TB + 8GB SSD-Cache
14491 Points -54%
Peacekeeper - ---
Asus Zenbook UX305UA-FC040T
HD Graphics 520, 6500U, SK Hynix Canvas SC300 512GB M.2 (HFS512G39MND)
2962 Points
Lenovo U31-70 80M5003EGE
GeForce 920M, 5500U, Western Digital WD10S21X SSHD 1TB + 8GB SSD-Cache
2714 Points -8%
Asus Zenbook UX305LA-FC012H
HD Graphics 5500, 5500U, Micron M600 MTFDDAV256MBF M.2
2659 Points -10%

* ... Moindre est la valeur, meilleures sont les performances

PCMark 7 Score
5389 points
PCMark 8 Home Score Accelerated v2
3341 points
PCMark 8 Creative Score Accelerated v2
3937 points
PCMark 8 Work Score Accelerated v2
4225 points
Aide
PCMark 8 - Home Score Accelerated v2
Apple MacBook Air 13 inch 2015-03
HD Graphics 6000, 5650U, Apple SSD SD0256F
3579 Points +7%
Asus Zenbook UX305UA-FC040T
HD Graphics 520, 6500U, SK Hynix Canvas SC300 512GB M.2 (HFS512G39MND)
3341 Points
Acer Aspire V3-372-50LK
HD Graphics 520, 6200U, Toshiba HG6 THNSNJ256G8NU
3209 Points -4%
Asus Zenbook UX305LA-FC012H
HD Graphics 5500, 5500U, Micron M600 MTFDDAV256MBF M.2
3167 Points -5%
Lenovo U31-70 80M5003EGE
GeForce 920M, 5500U, Western Digital WD10S21X SSHD 1TB + 8GB SSD-Cache
2841 Points -15%
Lenovo Yoga 900-13ISK 80MK
HD Graphics 520, 6500U, Samsung SSD PM871 MZNLN512HCJH
2837 Points -15%
Asus Zenbook UX305CA-EHM1
HD Graphics 515, 6Y30, Micron M600 MTFDDAV256MBF M.2
2833 Points -15%
Dell XPS 13 2016 i7 256GB QHD
HD Graphics 520, 6500U, Samsung PM951 NVMe MZ-VLV256D
2822 Points -16%
PCMark 7 - Score
Lenovo Yoga 900-13ISK 80MK
HD Graphics 520, 6500U, Samsung SSD PM871 MZNLN512HCJH
5478 Points +2%
Asus Zenbook UX305UA-FC040T
HD Graphics 520, 6500U, SK Hynix Canvas SC300 512GB M.2 (HFS512G39MND)
5389 Points
Apple MacBook Air 13 inch 2015-03
HD Graphics 6000, 5650U, Apple SSD SD0256F
5205 Points -3%
Acer Aspire V3-372-50LK
HD Graphics 520, 6200U, Toshiba HG6 THNSNJ256G8NU
5197 Points -4%
Asus Zenbook UX305LA-FC012H
HD Graphics 5500, 5500U, Micron M600 MTFDDAV256MBF M.2
5180 Points -4%
Dell XPS 13 2016 i7 256GB QHD
HD Graphics 520, 6500U, Samsung PM951 NVMe MZ-VLV256D
4977 Points -8%
Asus Zenbook UX305CA-EHM1
HD Graphics 515, 6Y30, Micron M600 MTFDDAV256MBF M.2
4635 Points -14%
Lenovo U31-70 80M5003EGE
GeForce 920M, 5500U, Western Digital WD10S21X SSHD 1TB + 8GB SSD-Cache
3819 Points -29%
SK Hynix Canvas SC300 512GB M.2 (HFS512G39MND)
Sequential Read: 469.1 MB/s
Sequential Write: 412.1 MB/s
512K Read: 301.6 MB/s
512K Write: 327.1 MB/s
4K Read: 28.08 MB/s
4K Write: 71.9 MB/s
4K QD32 Read: 262 MB/s
4K QD32 Write: 274.7 MB/s
3DMark 11 Performance
1525 points
3DMark Ice Storm Standard Score
56569 points
3DMark Cloud Gate Standard Score
5734 points
3DMark Fire Strike Score
826 points
Aide
3DMark 11 - 1280x720 Performance
Lenovo U31-70 80M5003EGE
GeForce 920M, 5500U, Western Digital WD10S21X SSHD 1TB + 8GB SSD-Cache
1849 Points +21%
Dell XPS 13 2016 i7 256GB QHD
HD Graphics 520, 6500U, Samsung PM951 NVMe MZ-VLV256D
1556 Points +2%
Lenovo Yoga 900-13ISK 80MK
HD Graphics 520, 6500U, Samsung SSD PM871 MZNLN512HCJH
1535 Points +1%
Asus Zenbook UX305UA-FC040T
HD Graphics 520, 6500U, SK Hynix Canvas SC300 512GB M.2 (HFS512G39MND)
1525 Points
Acer Aspire V3-372-50LK
HD Graphics 520, 6200U, Toshiba HG6 THNSNJ256G8NU
1487 Points -2%
Apple MacBook Air 13 inch 2015-03
HD Graphics 6000, 5650U, Apple SSD SD0256F
1459 Points -4%
Asus Zenbook UX305LA-FC012H
HD Graphics 5500, 5500U, Micron M600 MTFDDAV256MBF M.2
1198 Points -21%
Asus Zenbook UX305CA-EHM1
HD Graphics 515, 6Y30, Micron M600 MTFDDAV256MBF M.2
1151 Points -25%
3DMark
1280x720 Ice Storm Standard Score
Acer Aspire V3-372-50LK
HD Graphics 520, 6200U, Toshiba HG6 THNSNJ256G8NU
56687 Points 0%
Asus Zenbook UX305UA-FC040T
HD Graphics 520, 6500U, SK Hynix Canvas SC300 512GB M.2 (HFS512G39MND)
56569 Points
Apple MacBook Air 13 inch 2015-03
HD Graphics 6000, 5650U, Apple SSD SD0256F
56022 Points -1%
Dell XPS 13 2016 i7 256GB QHD
HD Graphics 520, 6500U, Samsung PM951 NVMe MZ-VLV256D
52990 Points -6%
Asus Zenbook UX305LA-FC012H
HD Graphics 5500, 5500U, Micron M600 MTFDDAV256MBF M.2
51649 Points -9%
Lenovo U31-70 80M5003EGE
GeForce 920M, 5500U, Western Digital WD10S21X SSHD 1TB + 8GB SSD-Cache
45983 Points -19%
Lenovo Yoga 900-13ISK 80MK
HD Graphics 520, 6500U, Samsung SSD PM871 MZNLN512HCJH
44755 Points -21%
Asus Zenbook UX305CA-EHM1
HD Graphics 515, 6Y30, Micron M600 MTFDDAV256MBF M.2
37002 Points -35%
1280x720 Cloud Gate Standard Score
Apple MacBook Air 13 inch 2015-03
HD Graphics 6000, 5650U, Apple SSD SD0256F
6061 Points +6%
Dell XPS 13 2016 i7 256GB QHD
HD Graphics 520, 6500U, Samsung PM951 NVMe MZ-VLV256D
5896 Points +3%
Acer Aspire V3-372-50LK
HD Graphics 520, 6200U, Toshiba HG6 THNSNJ256G8NU
5833 Points +2%
Lenovo U31-70 80M5003EGE
GeForce 920M, 5500U, Western Digital WD10S21X SSHD 1TB + 8GB SSD-Cache
5778 Points +1%
Asus Zenbook UX305UA-FC040T
HD Graphics 520, 6500U, SK Hynix Canvas SC300 512GB M.2 (HFS512G39MND)
5734 Points
Asus Zenbook UX305LA-FC012H
HD Graphics 5500, 5500U, Micron M600 MTFDDAV256MBF M.2
5461 Points -5%
Lenovo Yoga 900-13ISK 80MK
HD Graphics 520, 6500U, Samsung SSD PM871 MZNLN512HCJH
5333 Points -7%
Asus Zenbook UX305CA-EHM1
HD Graphics 515, 6Y30, Micron M600 MTFDDAV256MBF M.2
3778 Points -34%
1280x720 Sky Diver Score
Lenovo U31-70 80M5003EGE
GeForce 920M, 5500U, Western Digital WD10S21X SSHD 1TB + 8GB SSD-Cache
4053 Points +16%
Asus Zenbook UX305UA-FC040T
HD Graphics 520, 6500U, SK Hynix Canvas SC300 512GB M.2 (HFS512G39MND)
3480 Points
Asus Zenbook UX305LA-FC012H
HD Graphics 5500, 5500U, Micron M600 MTFDDAV256MBF M.2
2788 Points -20%
1920x1080 Fire Strike Score
Lenovo U31-70 80M5003EGE
GeForce 920M, 5500U, Western Digital WD10S21X SSHD 1TB + 8GB SSD-Cache
1073 Points +30%
Apple MacBook Air 13 inch 2015-03
HD Graphics 6000, 5650U, Apple SSD SD0256F
903 Points +9%
Dell XPS 13 2016 i7 256GB QHD
HD Graphics 520, 6500U, Samsung PM951 NVMe MZ-VLV256D
847 Points +3%
Asus Zenbook UX305UA-FC040T
HD Graphics 520, 6500U, SK Hynix Canvas SC300 512GB M.2 (HFS512G39MND)
826 Points
Lenovo Yoga 900-13ISK 80MK
HD Graphics 520, 6500U, Samsung SSD PM871 MZNLN512HCJH
814 Points -1%
Asus Zenbook UX305LA-FC012H
HD Graphics 5500, 5500U, Micron M600 MTFDDAV256MBF M.2
757 Points -8%
Asus Zenbook UX305CA-EHM1
HD Graphics 515, 6Y30, Micron M600 MTFDDAV256MBF M.2
596 Points -28%
3DMark 06 - 1280x1024 Standard Score AA:0x AF:0x
Apple MacBook Air 13 inch 2015-03
HD Graphics 6000, 5650U, Apple SSD SD0256F
9408 Points
Lenovo U31-70 80M5003EGE
GeForce 920M, 5500U, Western Digital WD10S21X SSHD 1TB + 8GB SSD-Cache
9199 Points
Asus Zenbook UX305LA-FC012H
HD Graphics 5500, 5500U, Micron M600 MTFDDAV256MBF M.2
7769 Points
BasMoyenÉlevéUltra
Tomb Raider (2013) 67.9 33.3 21.7 10.1
BioShock Infinite (2013) 46.8 25.7 21.5 6.4
Dirt Rally (2015) 116.6 26.6 12.5 12.5
XCOM 2 (2016) 16.3 5.2 2.9
Tomb Raider - 1366x768 Normal Preset AA:FX AF:4x
Lenovo U31-70 80M5003EGE
GeForce 920M, 5500U, Western Digital WD10S21X SSHD 1TB + 8GB SSD-Cache
43.9 fps +32%
Dell XPS 13 2016 i7 256GB QHD
HD Graphics 520, 6500U, Samsung PM951 NVMe MZ-VLV256D
36.6 fps +10%
Apple MacBook Air 13 inch 2015-03
HD Graphics 6000, 5650U, Apple SSD SD0256F
34.5 fps +4%
Asus Zenbook UX305UA-FC040T
HD Graphics 520, 6500U, SK Hynix Canvas SC300 512GB M.2 (HFS512G39MND)
33.3 fps
Asus Zenbook UX305LA-FC012H
HD Graphics 5500, 5500U, Micron M600 MTFDDAV256MBF M.2
31.1 fps -7%

Degré de la nuisance sonore

Au repos
31.3 / 31.3 / 32.2 dB(A)
Fortement sollicité
37.6 / 38 dB(A)
  red to green bar
 
 
30 dB
silencieux
40 dB(A)
audible
50 dB(A)
bruyant
 
min: dark, med: mid, max: light   Audix TM1 Arta (à 15 cm de distance)   bruit ambiant: 31.3 dB(A)
Asus Zenbook UX305UA-FC040T
6500U, HD Graphics 520
Asus Zenbook UX305LA-FC012H
5500U, HD Graphics 5500
Dell XPS 13 2016 i7 256GB QHD
6500U, HD Graphics 520
Lenovo Yoga 900-13ISK 80MK
6500U, HD Graphics 520
Apple MacBook Air 13 inch 2015-03
5650U, HD Graphics 6000
Lenovo U31-70 80M5003EGE
5500U, GeForce 920M
Acer Aspire V3-372-50LK
6200U, HD Graphics 520
Noise
4%
1%
6%
-1%
-7%
6%
off / environment *
31.3
Idle Minimum *
31.3
29.6
5%
31.8
-2%
29.7
5%
29.2
7%
31.9
-2%
31.5
-1%
Idle Average *
31.3
29.6
5%
31.8
-2%
29.8
5%
29.2
7%
32.3
-3%
31.5
-1%
Idle Maximum *
32.2
29.6
8%
34.8
-8%
30
7%
29.2
9%
32.3
-0%
31.5
2%
Load Average *
37.6
39.3
-5%
34.8
7%
32
15%
40.2
-7%
40.8
-9%
32.4
14%
Load Maximum *
38
36
5%
34.8
8%
38.5
-1%
46.3
-22%
46.6
-23%
32.3
15%

* ... Moindre est la valeur, meilleures sont les performances

 35.8 °C40.8 °C32.2 °C 
 27.2 °C38 °C29.4 °C 
 26.6 °C26.8 °C27.6 °C 
Maximum: 40.8 °C
Moyenne: 31.6 °C
30.5 °C37 °C36.4 °C
29 °C32.8 °C29.5 °C
28.2 °C28.8 °C28.2 °C
Maximum: 37 °C
Moyenne: 31.2 °C
Alimentation (valeur maximale)  39.6 °C | Température ambiante de la pièce 23.4 °C | FIRT 550-Pocket
(+) La température moyenne de la face supérieure sous charge maximale est de 31.6 °C / 89 F, par rapport à la moyenne de 30.8 °C / 87 F pour les appareils de la classe Subnotebook.
(±) La température maximale du côté supérieur est de 40.8 °C / 105 F, par rapport à la moyenne de 36.1 °C / 97 F, allant de 21.4 à 281 °C pour la classe Subnotebook.
(+) Le fond chauffe jusqu'à un maximum de 37 °C / 99 F, contre une moyenne de 39.4 °C / 103 F
(+) En utilisation inactive, la température moyenne du côté supérieur est de 24.1 °C / 75 F, par rapport à la moyenne du dispositif de 30.8 °C / 87 F.
(+) Les repose-poignets et le pavé tactile sont plus froids que la température de la peau avec un maximum de 27.6 °C / 81.7 F et sont donc froids au toucher.
(±) La température moyenne de la zone de l'appui-paume de dispositifs similaires était de 28.3 °C / 82.9 F (+0.7 °C / #1.2 F).
Asus Zenbook UX305UA-FC040T
6500U, HD Graphics 520
Asus Zenbook UX305LA-FC012H
5500U, HD Graphics 5500
Asus Zenbook UX305CA-EHM1
6Y30, HD Graphics 515
Dell XPS 13 2016 i7 256GB QHD
6500U, HD Graphics 520
Lenovo Yoga 900-13ISK 80MK
6500U, HD Graphics 520
Apple MacBook Air 13 inch 2015-03
5650U, HD Graphics 6000
Lenovo U31-70 80M5003EGE
5500U, GeForce 920M
Acer Aspire V3-372-50LK
6200U, HD Graphics 520
Heat
-9%
9%
-41%
0%
-13%
-16%
-27%
Maximum Upper Side *
40.8
45.9
-13%
34.6
15%
57
-40%
37.4
8%
43.8
-7%
40.8
-0%
49.3
-21%
Maximum Bottom *
37
45
-22%
35.2
5%
56
-51%
36.4
2%
42.1
-14%
43.8
-18%
53.3
-44%
Idle Upper Side *
25.2
25.6
-2%
22.6
10%
34.1
-35%
26.6
-6%
28.5
-13%
29.8
-18%
28.2
-12%
Idle Bottom *
24.9
25
-0%
23.4
6%
34.3
-38%
25.6
-3%
28.9
-16%
31.5
-27%
32.6
-31%

* ... Moindre est la valeur, meilleures sont les performances

Consommation énergétique
Éteint/en veilledarklight 0.32 / 0.38 Watts
Au reposdarkmidlight 3.2 / 6.5 / 6.7 Watts
Fortement sollicité midlight 30.6 / 31 Watts
 color bar
Légende: min: dark, med: mid, max: light        Metrahit Energy
Asus Zenbook UX305UA-FC040T
6500U, HD Graphics 520
Asus Zenbook UX305LA-FC012H
5500U, HD Graphics 5500
Dell XPS 13 2016 i7 256GB QHD
6500U, HD Graphics 520
Apple MacBook Air 13 inch 2015-03
5650U, HD Graphics 6000
Lenovo U31-70 80M5003EGE
5500U, GeForce 920M
Acer Aspire V3-372-50LK
6200U, HD Graphics 520
Power Consumption
8%
-46%
3%
-25%
-7%
Idle Minimum *
3.2
2.6
19%
6.8
-113%
2.7
16%
3.9
-22%
3.8
-19%
Idle Average *
6.5
6.2
5%
10
-54%
5.7
12%
6.8
-5%
5.8
11%
Idle Maximum *
6.7
6.5
3%
10.5
-57%
6
10%
7
-4%
8.1
-21%
Load Average *
30.6
30.8
-1%
30.2
1%
32.1
-5%
40
-31%
30.2
1%
Load Maximum *
31
27
13%
33.6
-8%
36.2
-17%
51
-65%
32.4
-5%

* ... Moindre est la valeur, meilleures sont les performances

Autonomie
Au repos (module WiFi éteint, luminosité au minimum)
23h 47min
WiFi Websurfing (Edge 25.10586.0.0)
9h 21min
En lecture de Big Buck Bunny encodé en H.264 1080p
9h 05min
Fortement sollicité (luminosité au maximum)
1h 58min
Asus Zenbook UX305UA-FC040T
56 Wh
Asus Zenbook UX305LA-FC012H
56 Wh
Asus Zenbook UX305CA-EHM1
45 Wh
Dell XPS 13 2016 i7 256GB QHD
56 Wh
Lenovo Yoga 900-13ISK 80MK
66 Wh
Apple MacBook Air 13 inch 2015-03
54 Wh
Lenovo U31-70 80M5003EGE
35 Wh
Acer Aspire V3-372-50LK
51 Wh
Autonomie de la batterie
1%
8%
-27%
-20%
1%
-52%
-20%
Reader / Idle
1427
1469
3%
1052
-26%
784
-45%
844
-41%
1572
10%
525
-63%
906
-37%
H.264
545
582
7%
273
-50%
WiFi v1.3
561
569
1%
382
-32%
432
-23%
403
-28%
620
11%
253
-55%
349
-38%
Load
118
108
-8%
215
82%
103
-13%
128
8%
97
-18%
70
-41%
135
14%

Points positifs

+ Dalle IPS matte, bon contraste, luminosité excellente
+ Résolution Full HD
+ Construction solide et de qualité
+ Périphériques d'entrée excellents
+ Autonomie excellente
+ Généralement silencieux
+ S'échauffe peu
+ SSD rapide
+ Maintenance facile

Points négatifs

- pas de rétroéclairage du clavier
- Scintillement de l'écran
Test: Asus Zenbook UX305UA-FC040T. Exemplaire de test fourni par Cyberport.de

L’Asus Zenbook UX305UA délivre de solides performances processeur avec des possibilités de gaming limitées. Malgré cela, il reste généralement silencieux et s’échauffe peu. L’appareil dispose d’un bon espace de stockage avec un SSD de 512 Go. Le SSD peut être remplacé si nécessaire. Nous avons apprécié la dalle IPS avec de bons angles de vision. La luminosité est excellente avec un bon contraste. Le clavier demeure excellent et convient pour ceux qui rédigent beaucoup. Cependant on a du mal à comprendre pourquoi Asus ne l’a pas équipé de rétroéclairage. Cela aurait rendu l’ensemble plus équilibré.

En résumé: la version Skylake du Zenbook délivre d’excellentes performances sans impact négatif sur l’autonomie.

Asus présente 2 approches avec sa gamme de Zenbook UX305. Les versions équipées de processeurs Core i fournissent de bonnes performances et des autonomies très correctes. Les versions équipées de Core M par contre ne disposent pas de ces atouts. Ils sont plus silencieux et moins chers. Le choix des aspects les plus importants revient à l’utilisateur. Le test du nouveau Zenbook UX305 équipé d’un processeur Skylake Core M7 sera disponible prochainement sur Notebookcheck.com.

Pour plus de détails, vous trouverez la version complète de ce test (en anglais) ici.

Asus Zenbook UX305UA-FC040T - 02/26/2016 v5 (old)
Sascha Mölck

Châssis
96 /  98 → 98%
Clavier
89%
Dispositif de pointage
93%
Connectivité
49 / 80 → 61%
Poids
70 / 35-78 → 81%
Autonomie
91%
Écran
86%
Performances en jeu
56 / 68 → 83%
Performances dans les applications
86 / 87 → 99%
Chauffe
94 / 91 → 100%
Nuisance sonore
90%
Audio
56 / 91 → 62%
Moyenne
80%
88%
Subnotebook - Moyenne compensée

Price comparison

Please share our article, every link counts!
> Revues et rapports de ordinateurs portatifs et smartphones, ordiphones > Critiques > Courte critique de l'Asus Zenbook UX305UA-FC040T
Sascha Mölck, 2016-03-10 (Update: 2016-03-10)