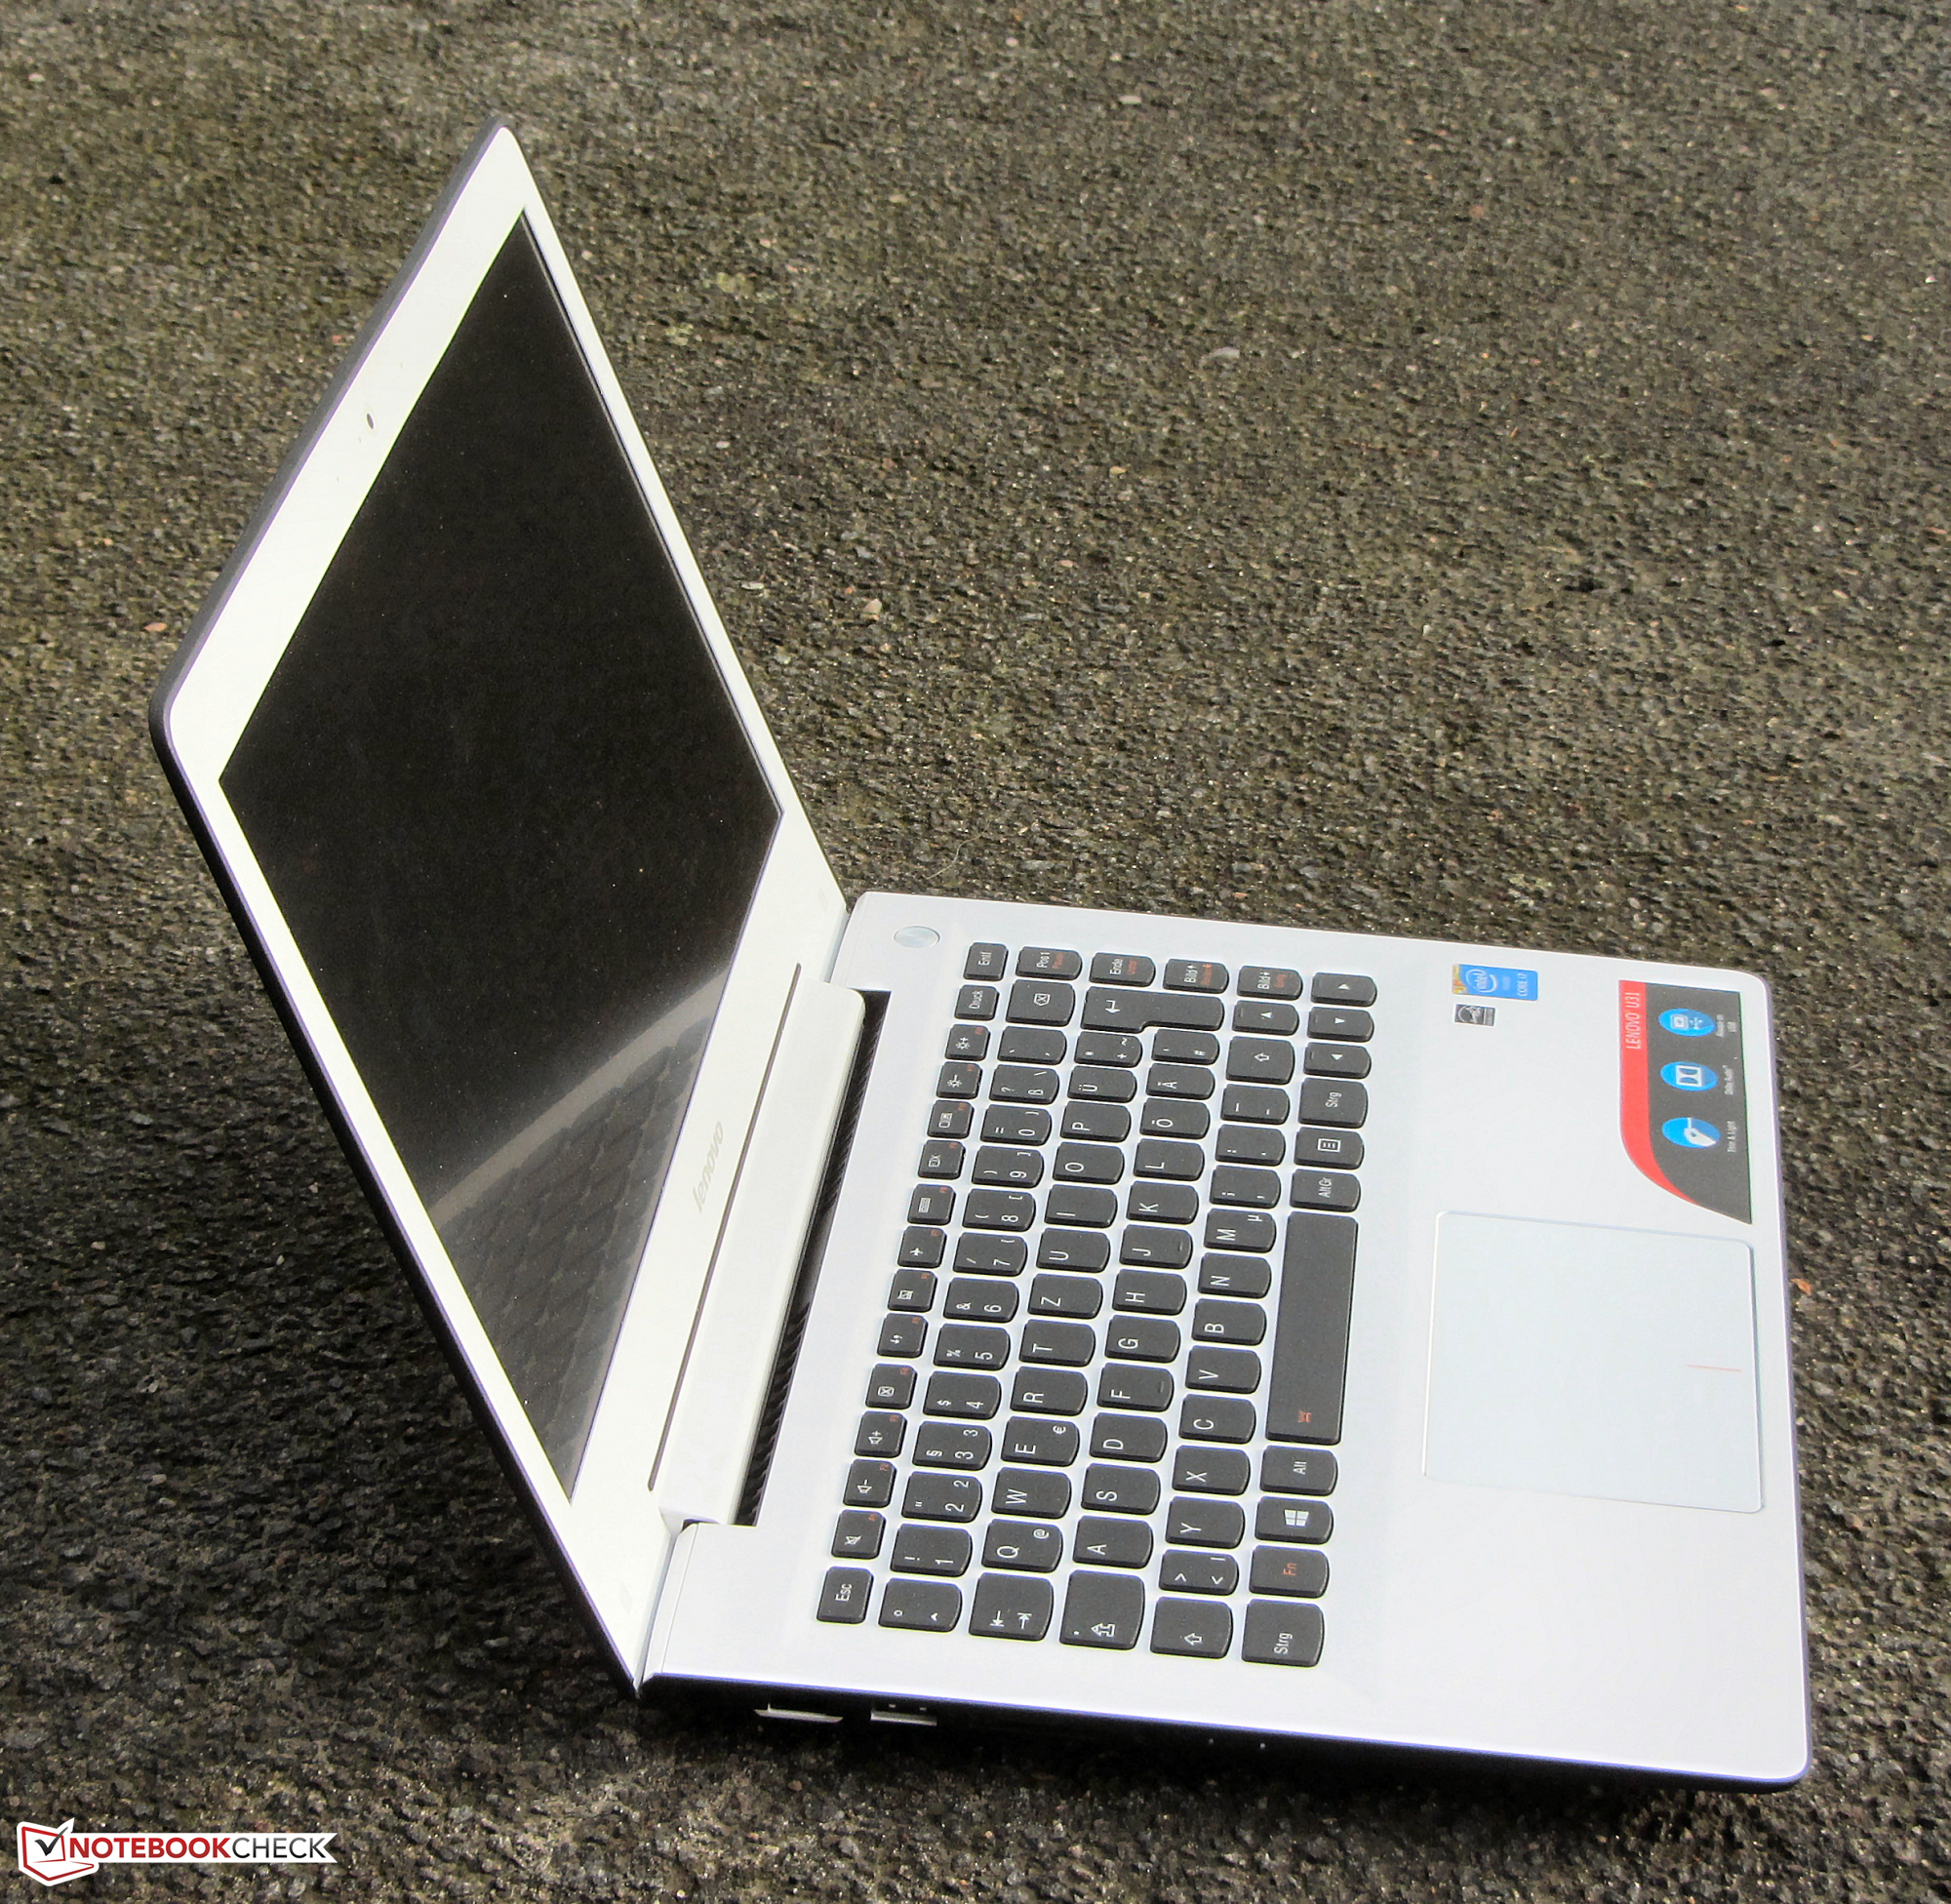
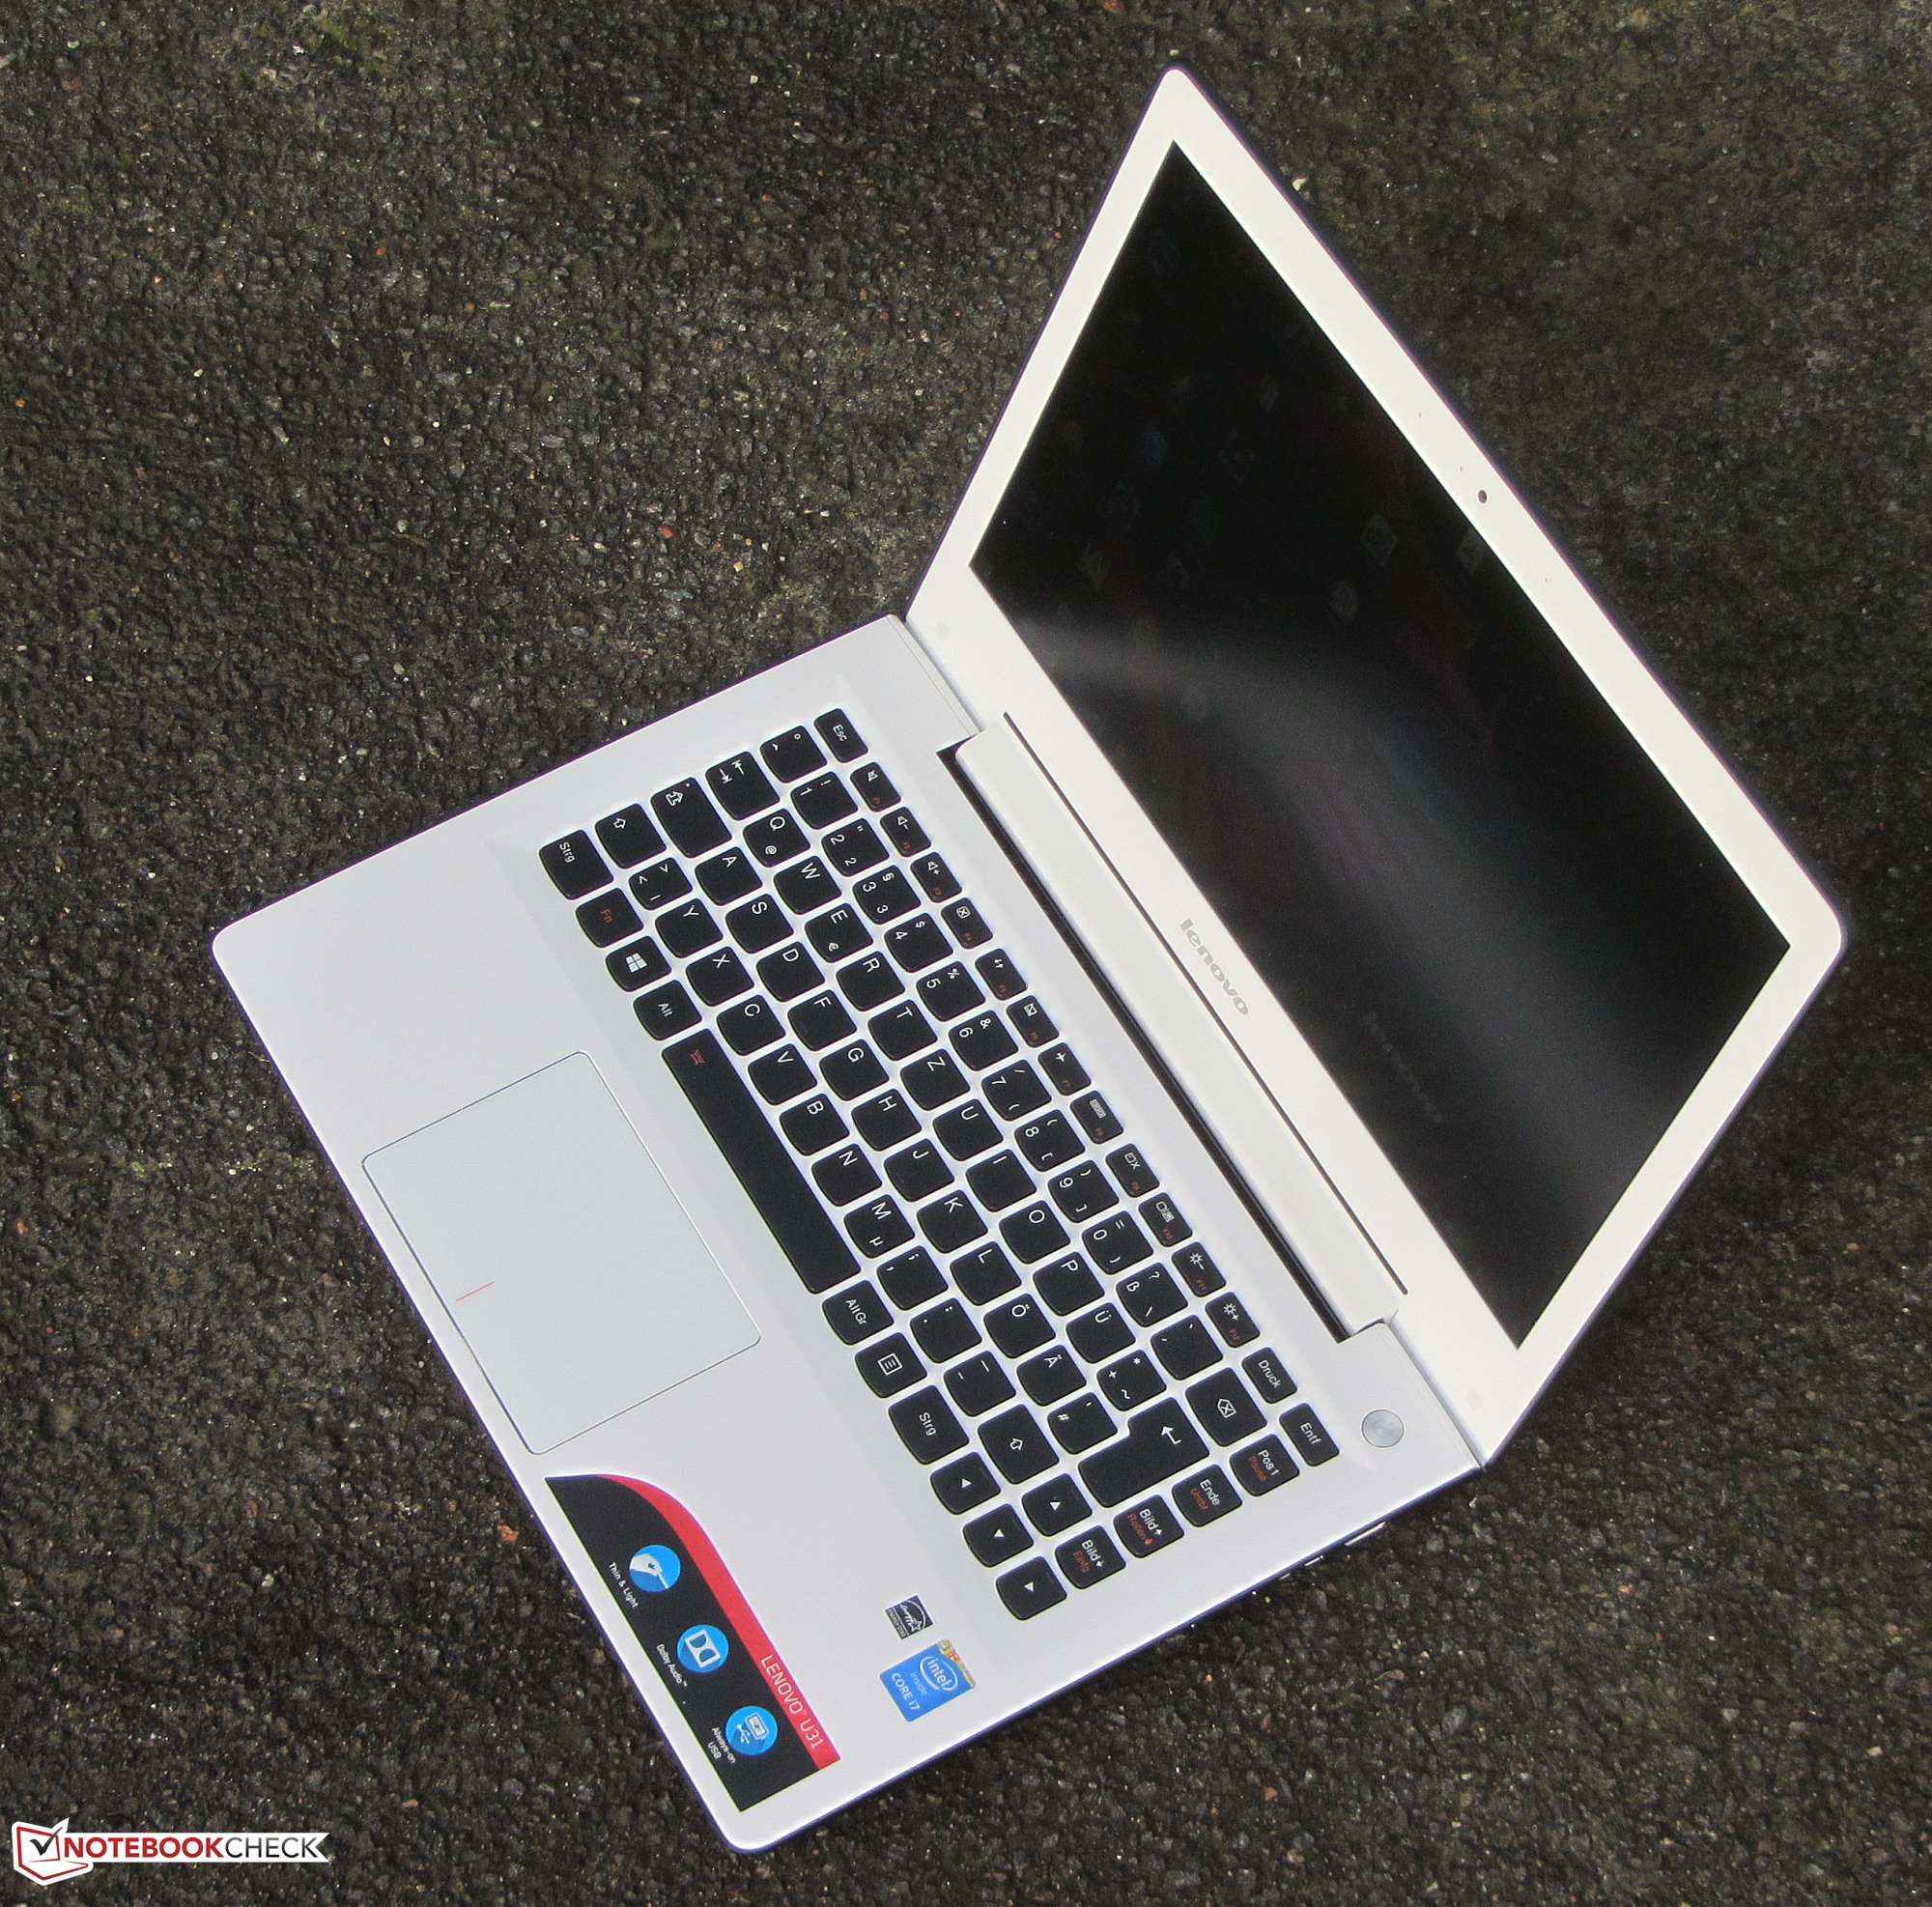
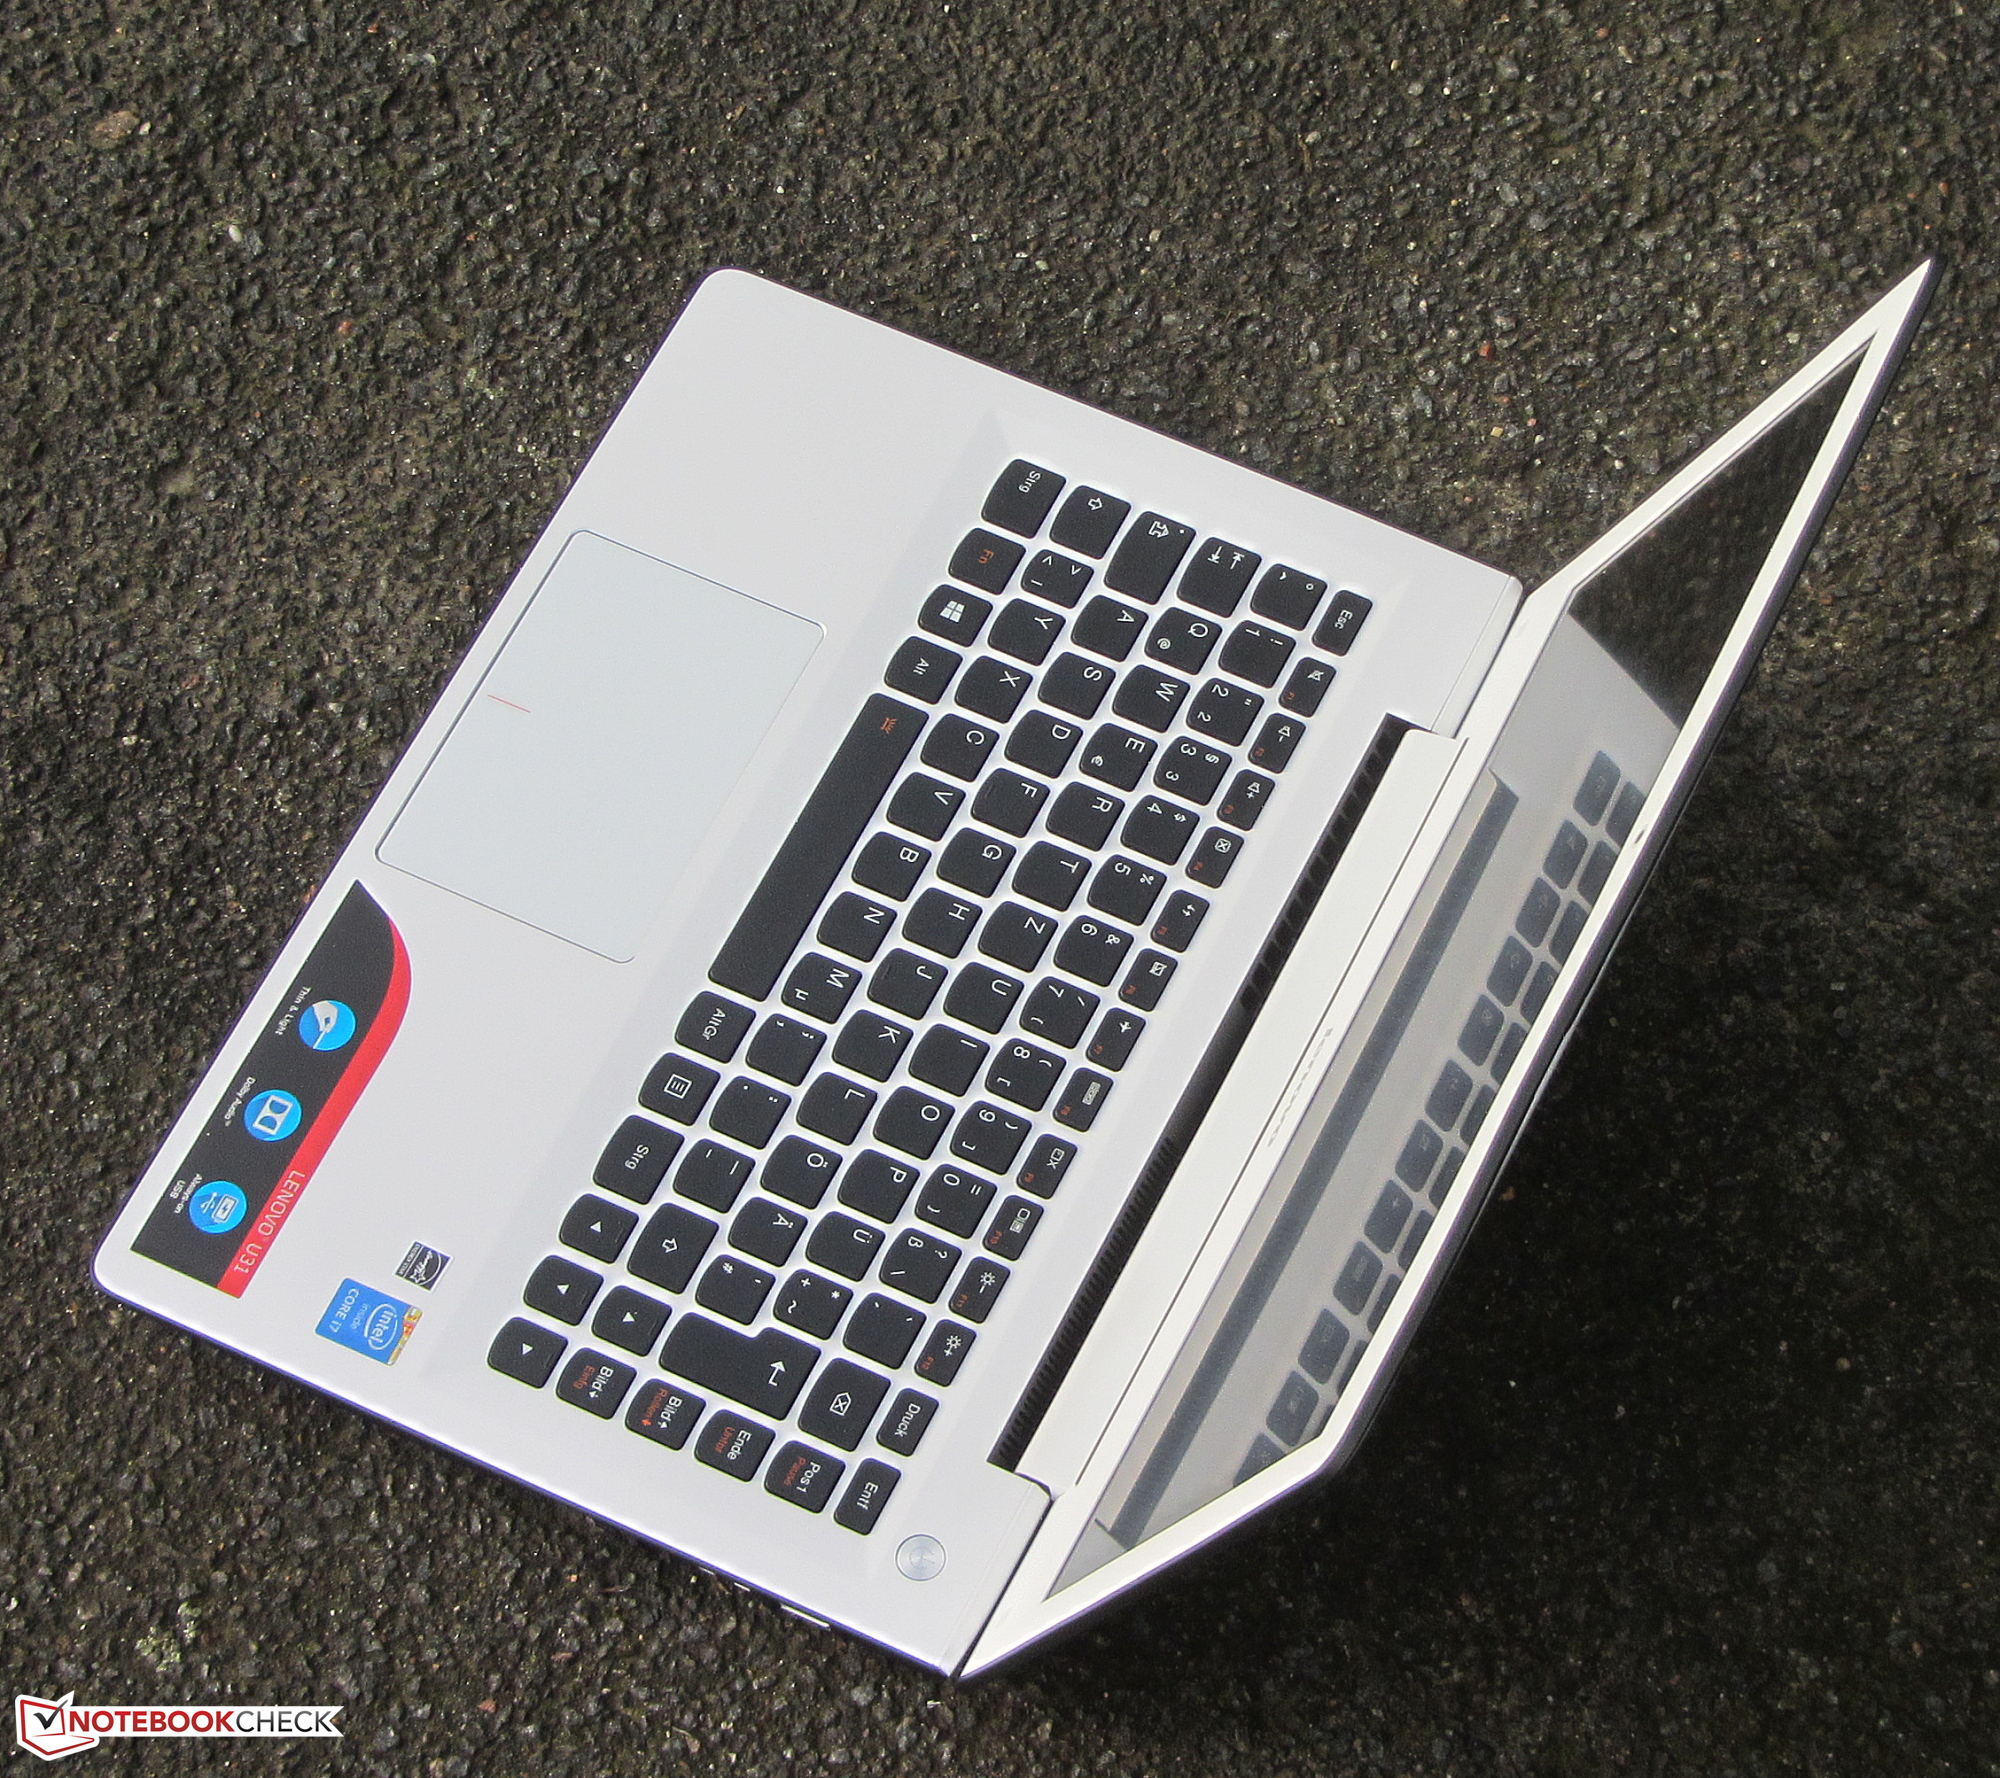
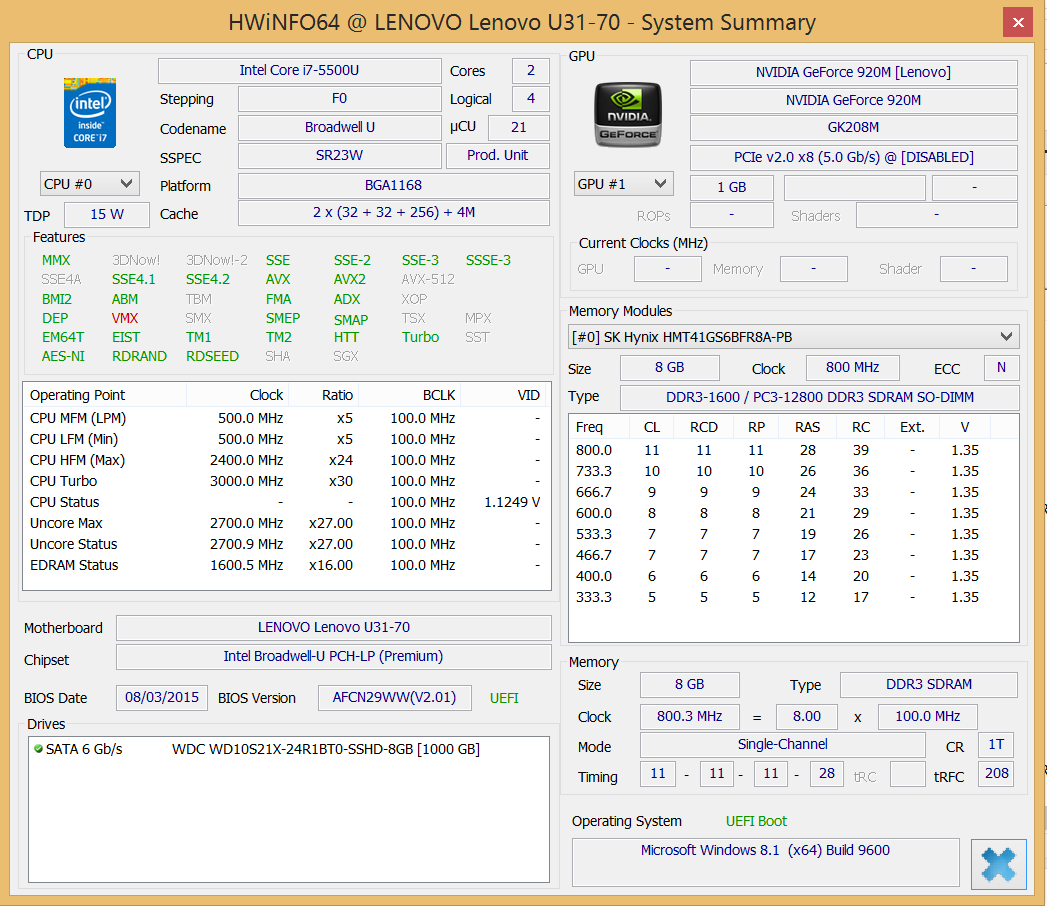
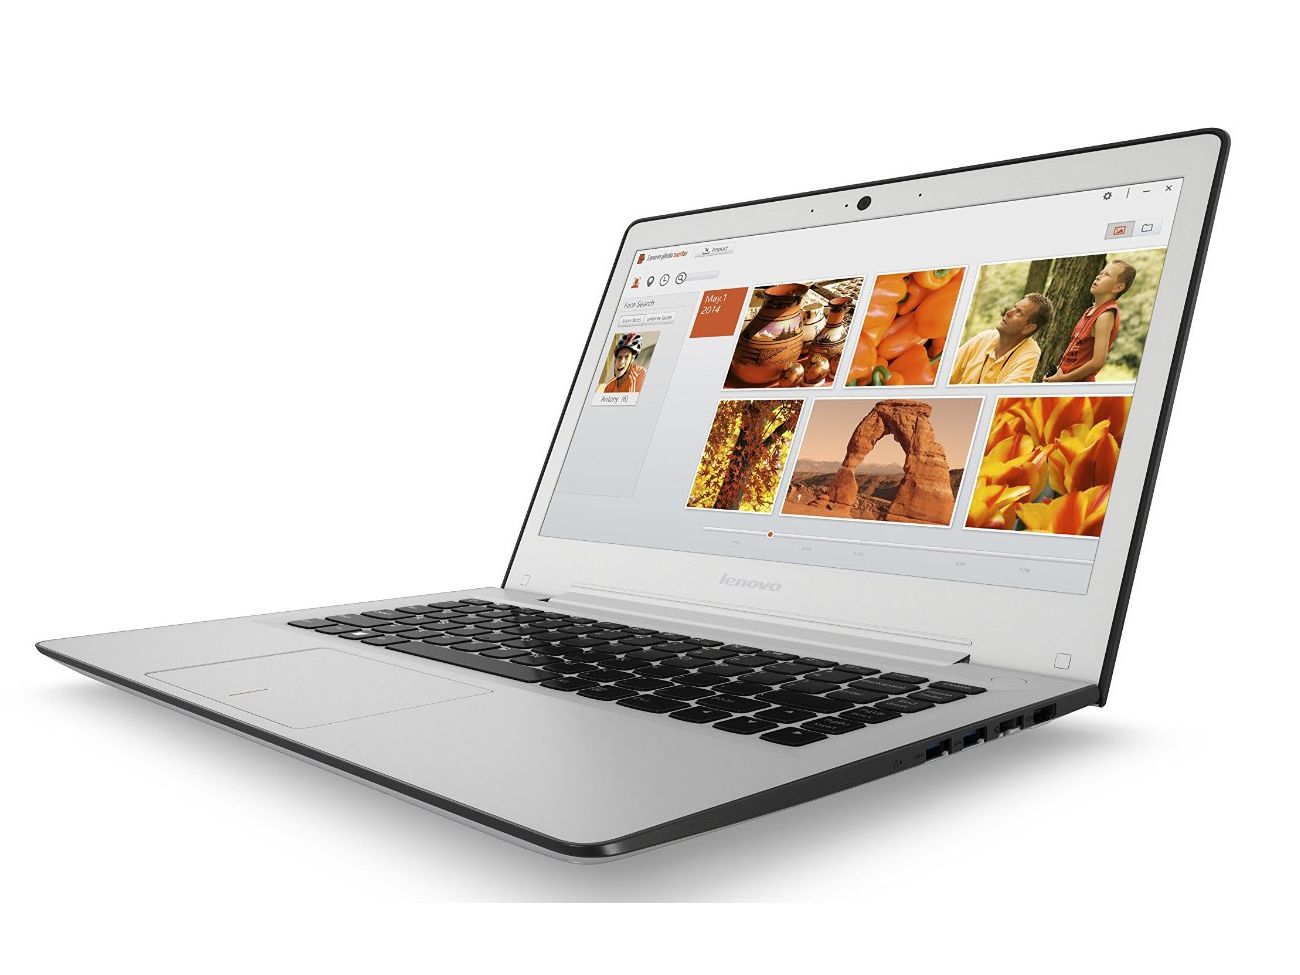
Courte critique du PC portable Lenovo U31-70 80M5003EGE
| |||||||||||||||||||||||||
Homogénéité de la luminosité: 93 %
Valeur mesurée au centre, sur batterie: 233 cd/m²
Contraste: 814:1 (Valeurs des noirs: 0.36 cd/m²)
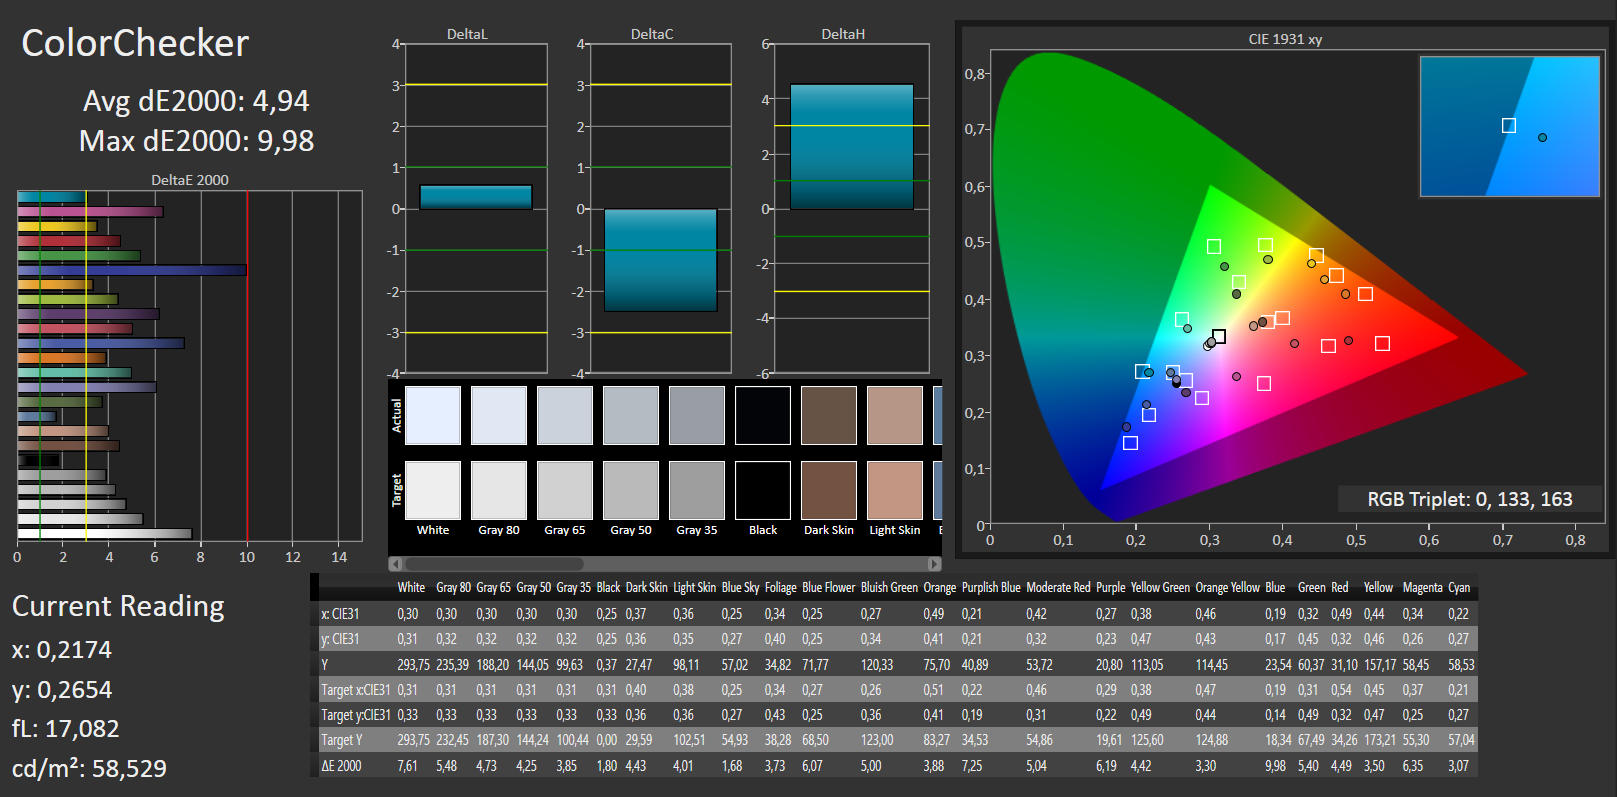
ΔE ColorChecker Calman: 4.94 | ∀{0.5-29.43 Ø4.71}
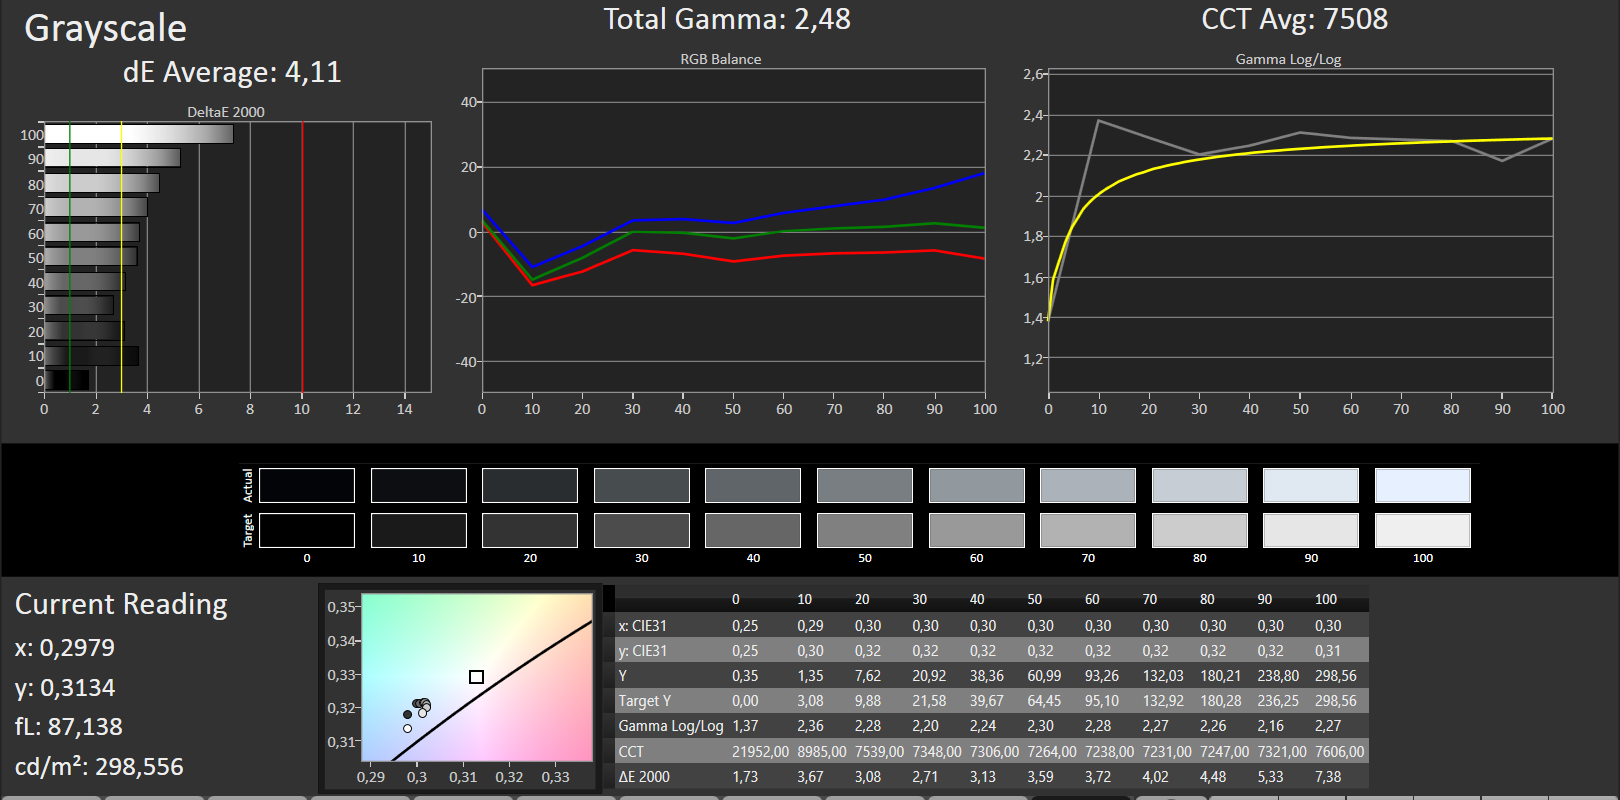
ΔE Greyscale Calman: 4.11 | ∀{0.09-98 Ø4.96}
58% sRGB (Argyll 1.6.3 3D)
37% AdobeRGB 1998 (Argyll 1.6.3 3D)
40.17% AdobeRGB 1998 (Argyll 3D)
58.3% sRGB (Argyll 3D)
38.85% Display P3 (Argyll 3D)
Gamma: 2.48
CCT: 7508 K
Scintillement / MLI (Modulation de largeur d'impulsion)
| Scintillement / MLI (Modulation de largeur d'impulsion) non décelé | ||
En comparaison, 52 % des appareils testés n'emploient pas MDI pour assombrir leur écran. Nous avons relevé une moyenne à 7741 (minimum : 5 - maximum : 343500) Hz dans le cas où une MDI était active. | ||

Temps de réponse de l'écran
| ↔ Temps de réponse noir à blanc | ||
|---|---|---|
| 30 ms ... hausse ↗ et chute ↘ combinées | ↗ 7 ms hausse | 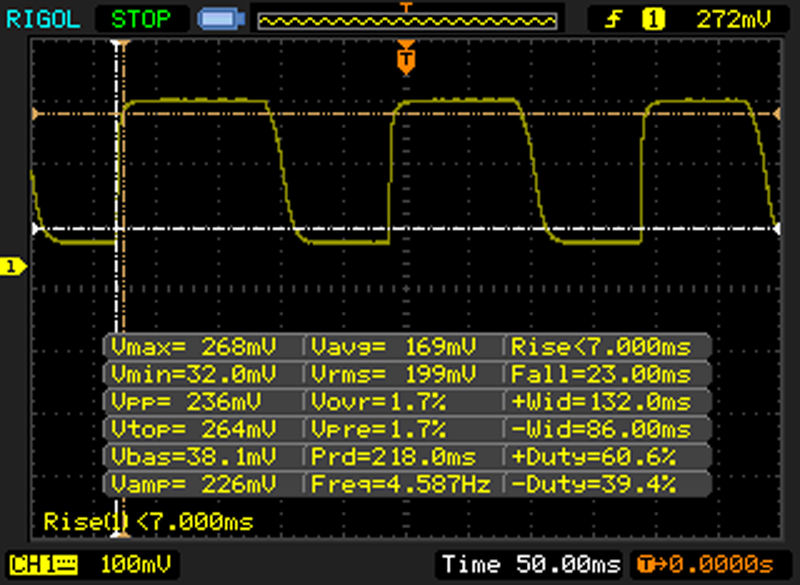 |
| ↘ 23 ms chute | ||
| L'écran souffre de latences très élevées, à éviter pour le jeu. En comparaison, tous les appareils testés affichent entre 0.1 (minimum) et 240 (maximum) ms. » 80 % des appareils testés affichent de meilleures performances. Cela signifie que les latences relevées sont moins bonnes que la moyenne (19.8 ms) de tous les appareils testés. | ||
| ↔ Temps de réponse gris 50% à gris 80% | ||
| 54 ms ... hausse ↗ et chute ↘ combinées | ↗ 19 ms hausse | 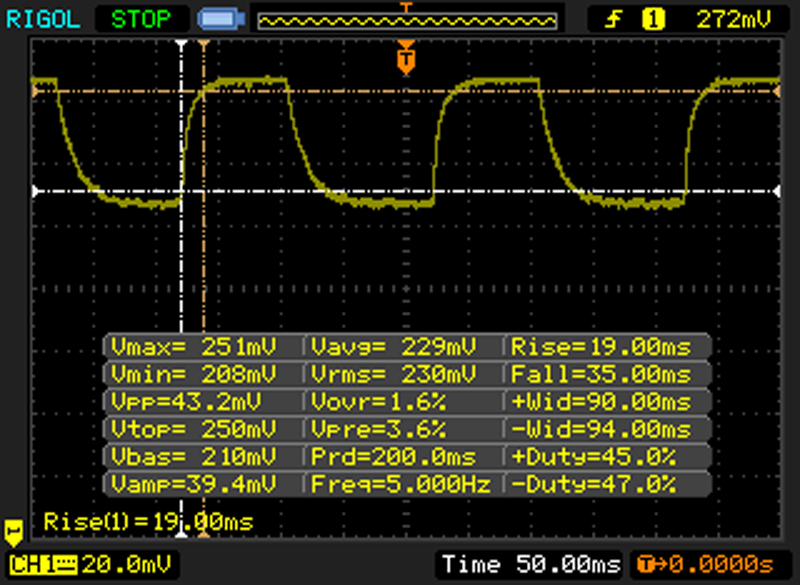 |
| ↘ 35 ms chute | ||
| L'écran souffre de latences très élevées, à éviter pour le jeu. En comparaison, tous les appareils testés affichent entre 0.165 (minimum) et 636 (maximum) ms. » 91 % des appareils testés affichent de meilleures performances. Cela signifie que les latences relevées sont moins bonnes que la moyenne (30.9 ms) de tous les appareils testés. | ||
| Lenovo U31-70 80M5003EGE IPS, 1920x1080 | Acer Aspire V3-372-50LK IPS, 1920x1080 | Asus Zenbook UX303UB-R4100T IPS, 1920x1080 | Asus Zenbook UX305LA-FC012H IPS, 1920x1080 | Apple MacBook Air 13 inch 2015-03 TN LED, 1440x900 | Acer Aspire E5-473G-59QT TN, 1920x1080 | Lenovo U41-70 TN LED, 1920x1080 | |
|---|---|---|---|---|---|---|---|
| Display | 1% | 66% | 61% | 3% | -3% | 3% | |
| Display P3 Coverage (%) | 38.85 | 39.05 1% | 66.9 72% | 63.9 64% | 40.1 3% | 37.82 -3% | 40.07 3% |
| sRGB Coverage (%) | 58.3 | 58.7 1% | 92.3 58% | 91.6 57% | 59.8 3% | 56.9 -2% | 59.8 3% |
| AdobeRGB 1998 Coverage (%) | 40.17 | 40.35 0% | 67.6 68% | 65 62% | 41.51 3% | 39.07 -3% | 41.45 3% |
| Response Times | 18% | -22% | |||||
| Response Time Grey 50% / Grey 80% * (ms) | 54 ? | 46 ? 15% | 68 ? -26% | ||||
| Response Time Black / White * (ms) | 30 ? | 24 ? 20% | 35 ? -17% | ||||
| PWM Frequency (Hz) | 178 ? | ||||||
| Screen | -6% | 24% | 23% | 6% | -49% | -38% | |
| Brightness middle (cd/m²) | 293 | 250 -15% | 385 31% | 349 19% | 329 12% | 238 -19% | 245 -16% |
| Brightness (cd/m²) | 289 | 247 -15% | 394 36% | 338 17% | 310 7% | 228 -21% | 222 -23% |
| Brightness Distribution (%) | 93 | 87 -6% | 89 -4% | 87 -6% | 82 -12% | 90 -3% | 84 -10% |
| Black Level * (cd/m²) | 0.36 | 0.43 -19% | 0.41 -14% | 0.25 31% | 0.405 -13% | 0.54 -50% | 0.42 -17% |
| Contrast (:1) | 814 | 581 -29% | 939 15% | 1396 71% | 812 0% | 441 -46% | 583 -28% |
| Colorchecker dE 2000 * | 4.94 | 4.51 9% | 3.84 22% | 5.49 -11% | 3.96 20% | 10.64 -115% | 9.55 -93% |
| Colorchecker dE 2000 max. * | 9.98 | 7.51 25% | |||||
| Greyscale dE 2000 * | 4.11 | 3.18 23% | 3.79 8% | 5.43 -32% | 3.51 15% | 11.74 -186% | 10.73 -161% |
| Gamma | 2.48 89% | 2.43 91% | 2.23 99% | 2.17 101% | 3.83 57% | 2.42 91% | 2.34 94% |
| CCT | 7508 87% | 6743 96% | 6499 100% | 7055 92% | 6711 97% | 13043 50% | 12167 53% |
| Color Space (Percent of AdobeRGB 1998) (%) | 37 | 37 0% | 60 62% | 60 62% | 38.4 4% | 36 -3% | 38 3% |
| Color Space (Percent of sRGB) (%) | 58 | 58 0% | 92 59% | 92 59% | 59.8 3% | 57 -2% | 60 3% |
| Moyenne finale (programmes/paramètres) | 4% /
-1% | 23% /
26% | 42% /
33% | 5% /
5% | -26% /
-38% | -18% /
-28% |
* ... Moindre est la valeur, meilleures sont les performances
| Cinebench R15 | |
| CPU Multi 64Bit (Classer selon les valeurs) | |
| Lenovo U31-70 80M5003EGE | |
| Acer Aspire V3-372-50LK | |
| Asus Zenbook UX303UB-R4100T | |
| Asus Zenbook UX305CA-EHM1 | |
| Asus Zenbook UX303LB-R4079H | |
| Asus Zenbook UX305LA-FC012H | |
| Apple MacBook Air 13 inch 2015-03 | |
| HP Envy 13-d000ng | |
| Acer Aspire E5-473G-59QT | |
| Toshiba Portege Z30t-A-10X | |
| Acer TravelMate P645-MG-74508G75tkk | |
| CPU Single 64Bit (Classer selon les valeurs) | |
| Lenovo U31-70 80M5003EGE | |
| Acer Aspire V3-372-50LK | |
| Asus Zenbook UX303UB-R4100T | |
| Asus Zenbook UX305CA-EHM1 | |
| Asus Zenbook UX303LB-R4079H | |
| Asus Zenbook UX305LA-FC012H | |
| Apple MacBook Air 13 inch 2015-03 | |
| HP Envy 13-d000ng | |
| Acer Aspire E5-473G-59QT | |
| Toshiba Portege Z30t-A-10X | |
| Acer TravelMate P645-MG-74508G75tkk | |
| Cinebench R11.5 | |
| CPU Multi 64Bit (Classer selon les valeurs) | |
| Lenovo U31-70 80M5003EGE | |
| Acer Aspire V3-372-50LK | |
| Asus Zenbook UX303UB-R4100T | |
| Asus Zenbook UX305CA-EHM1 | |
| Asus Zenbook UX303LB-R4079H | |
| Asus Zenbook UX305LA-FC012H | |
| Apple MacBook Air 13 inch 2015-03 | |
| HP Envy 13-d000ng | |
| Acer Aspire E5-473G-59QT | |
| Toshiba Portege Z30t-A-10X | |
| Acer TravelMate P645-MG-74508G75tkk | |
| CPU Single 64Bit (Classer selon les valeurs) | |
| Lenovo U31-70 80M5003EGE | |
| Acer Aspire V3-372-50LK | |
| Asus Zenbook UX303UB-R4100T | |
| Asus Zenbook UX305CA-EHM1 | |
| Asus Zenbook UX303LB-R4079H | |
| Asus Zenbook UX305LA-FC012H | |
| Apple MacBook Air 13 inch 2015-03 | |
| HP Envy 13-d000ng | |
| Acer Aspire E5-473G-59QT | |
| Toshiba Portege Z30t-A-10X | |
| Acer TravelMate P645-MG-74508G75tkk | |
| Cinebench R10 | |
| Rendering Multiple CPUs 32Bit (Classer selon les valeurs) | |
| Lenovo U31-70 80M5003EGE | |
| Acer Aspire V3-372-50LK | |
| Asus Zenbook UX303UB-R4100T | |
| Asus Zenbook UX305LA-FC012H | |
| Apple MacBook Air 13 inch 2015-03 | |
| HP Envy 13-d000ng | |
| Acer Aspire E5-473G-59QT | |
| Toshiba Portege Z30t-A-10X | |
| Acer TravelMate P645-MG-74508G75tkk | |
| Rendering Single 32Bit (Classer selon les valeurs) | |
| Lenovo U31-70 80M5003EGE | |
| Acer Aspire V3-372-50LK | |
| Asus Zenbook UX303UB-R4100T | |
| Asus Zenbook UX305LA-FC012H | |
| Apple MacBook Air 13 inch 2015-03 | |
| HP Envy 13-d000ng | |
| Acer Aspire E5-473G-59QT | |
| Toshiba Portege Z30t-A-10X | |
| Acer TravelMate P645-MG-74508G75tkk | |
| Geekbench 3 | |
| 32 Bit Single-Core Score (Classer selon les valeurs) | |
| Lenovo U31-70 80M5003EGE | |
| Asus Zenbook UX303UB-R4100T | |
| Asus Zenbook UX305LA-FC012H | |
| Apple MacBook Air 13 inch 2015-03 | |
| 32 Bit Multi-Core Score (Classer selon les valeurs) | |
| Lenovo U31-70 80M5003EGE | |
| Asus Zenbook UX303UB-R4100T | |
| Asus Zenbook UX305LA-FC012H | |
| Apple MacBook Air 13 inch 2015-03 | |
| Sunspider - 1.0 Total Score (Classer selon les valeurs) | |
| Lenovo U31-70 80M5003EGE | |
| Acer Aspire V3-372-50LK | |
| Asus Zenbook UX303UB-R4100T | |
| Asus Zenbook UX305CA-EHM1 | |
| Asus Zenbook UX303LB-R4079H | |
| Asus Zenbook UX305LA-FC012H | |
| HP Envy 13-d000ng | |
| Acer Aspire E5-473G-59QT | |
| JetStream 1.1 - 1.1 Total (Classer selon les valeurs) | |
| Lenovo U31-70 80M5003EGE | |
| Asus Zenbook UX303UB-R4100T | |
| Mozilla Kraken 1.1 - Total (Classer selon les valeurs) | |
| Lenovo U31-70 80M5003EGE | |
| Acer Aspire V3-372-50LK | |
| Asus Zenbook UX303UB-R4100T | |
| Asus Zenbook UX305LA-FC012H | |
| HP Envy 13-d000ng | |
| Acer Aspire E5-473G-59QT | |
| Octane V2 - Total Score (Classer selon les valeurs) | |
| Lenovo U31-70 80M5003EGE | |
| Acer Aspire V3-372-50LK | |
| Asus Zenbook UX303UB-R4100T | |
| Asus Zenbook UX305LA-FC012H | |
| HP Envy 13-d000ng | |
| Acer Aspire E5-473G-59QT | |
| Peacekeeper - --- (Classer selon les valeurs) | |
| Lenovo U31-70 80M5003EGE | |
| Asus Zenbook UX303UB-R4100T | |
| Asus Zenbook UX305LA-FC012H | |
| HP Envy 13-d000ng | |
* ... Moindre est la valeur, meilleures sont les performances
| PCMark 7 Score | 3819 points | |
| PCMark 8 Home Score Accelerated v2 | 2841 points | |
| PCMark 8 Creative Score Accelerated v2 | 3313 points | |
| PCMark 8 Work Score Accelerated v2 | 3811 points | |
Aide | ||
| PCMark 8 - Home Score Accelerated v2 (Classer selon les valeurs) | |
| Lenovo U31-70 80M5003EGE | |
| Acer Aspire V3-372-50LK | |
| Asus Zenbook UX303UB-R4100T | |
| Asus Zenbook UX305CA-EHM1 | |
| Asus Zenbook UX305LA-FC012H | |
| Apple MacBook Air 13 inch 2015-03 | |
| HP Envy 13-d000ng | |
| Acer Aspire E5-473G-59QT | |
| PCMark 7 - Score (Classer selon les valeurs) | |
| Lenovo U31-70 80M5003EGE | |
| Acer Aspire V3-372-50LK | |
| Asus Zenbook UX303UB-R4100T | |
| Asus Zenbook UX305CA-EHM1 | |
| Asus Zenbook UX303LB-R4079H | |
| Asus Zenbook UX305LA-FC012H | |
| Apple MacBook Air 13 inch 2015-03 | |
| HP Envy 13-d000ng | |
| Acer Aspire E5-473G-59QT | |

| 3DMark 06 Standard Score | 9199 points | |
| 3DMark 11 Performance | 1849 points | |
| 3DMark Ice Storm Standard Score | 45983 points | |
| 3DMark Cloud Gate Standard Score | 5778 points | |
| 3DMark Fire Strike Score | 1073 points | |
Aide | ||
| 3DMark 11 - 1280x720 Performance (Classer selon les valeurs) | |
| Lenovo U31-70 80M5003EGE | |
| Acer Aspire V3-372-50LK | |
| Asus Zenbook UX303UB-R4100T | |
| Asus Zenbook UX305CA-EHM1 | |
| Asus Zenbook UX303LB-R4079H | |
| Asus Zenbook UX305LA-FC012H | |
| Apple MacBook Air 13 inch 2015-03 | |
| HP Envy 13-d000ng | |
| Acer Aspire E5-473G-59QT | |
| Acer Aspire R14 R3-471TG-552E | |
| Asus X555LD-XX283H | |
| 3DMark 06 - 1280x1024 Standard Score AA:0x AF:0x (Classer selon les valeurs) | |
| Lenovo U31-70 80M5003EGE | |
| Asus Zenbook UX303UB-R4100T | |
| Asus Zenbook UX305LA-FC012H | |
| Apple MacBook Air 13 inch 2015-03 | |
| Acer Aspire E5-473G-59QT | |
| Bas | Moyen | Élevé | Ultra | |
|---|---|---|---|---|
| Tomb Raider (2013) | 83.6 | 43.9 | 25.9 | 11.8 |
| GRID: Autosport (2014) | 124.8 | 52.5 | 22.7 | 12.5 |
| Dirt Rally (2015) | 135.2 | 34.3 | 17.3 | 12.5 |
| FIFA 16 (2015) | 81.5 | 46 | 28.2 | |
| Anno 2205 (2015) | 30.4 | 17.5 | 8.5 | 5.3 |
| Call of Duty: Black Ops 3 (2015) | 28.6 | 17.6 | ||
| Fallout 4 (2015) | 23.2 | 15.4 | 9.3 | 6.2 |
| Star Wars Battlefront (2015) | 34.7 | 21 | 9.6 | 8.6 |
| Rainbow Six Siege (2015) | 48.3 | 30.1 | 15.2 | 12.4 |
| Just Cause 3 (2015) | 26.9 | 21.2 | 10.3 | 9.1 |
| Rise of the Tomb Raider (2016) | 18.3 | 11.3 | 6.4 | 3.7 |
| Tomb Raider - 1366x768 Normal Preset AA:FX AF:4x (Classer selon les valeurs) | |
| Lenovo U31-70 80M5003EGE | |
| Asus Zenbook UX303UB-R4100T | |
| Asus Zenbook UX305LA-FC012H | |
| Apple MacBook Air 13 inch 2015-03 | |
| HP Envy 13-d000ng | |
| Acer Aspire E5-473G-59QT | |
| Acer Aspire R14 R3-471TG-552E | |
| Asus X555LD-XX283H | |
| Star Wars Battlefront - 1024x768 Low Preset (Classer selon les valeurs) | |
| Lenovo U31-70 80M5003EGE | |
| Asus Zenbook UX303UB-R4100T | |
| FIFA 16 - 1366x768 High Preset AA:2x MS (Classer selon les valeurs) | |
| Lenovo U31-70 80M5003EGE | |
| Asus Zenbook UX303UB-R4100T | |
| Asus Zenbook UX305LA-FC012H | |
Degré de la nuisance sonore
| Au repos |
| 31.9 / 32.3 / 32.3 dB(A) |
| Disque dur |
| 32.5 dB(A) |
| Fortement sollicité |
| 40.8 / 46.6 dB(A) |
 | ||
30 dB silencieux 40 dB(A) audible 50 dB(A) bruyant |
||
min: | ||
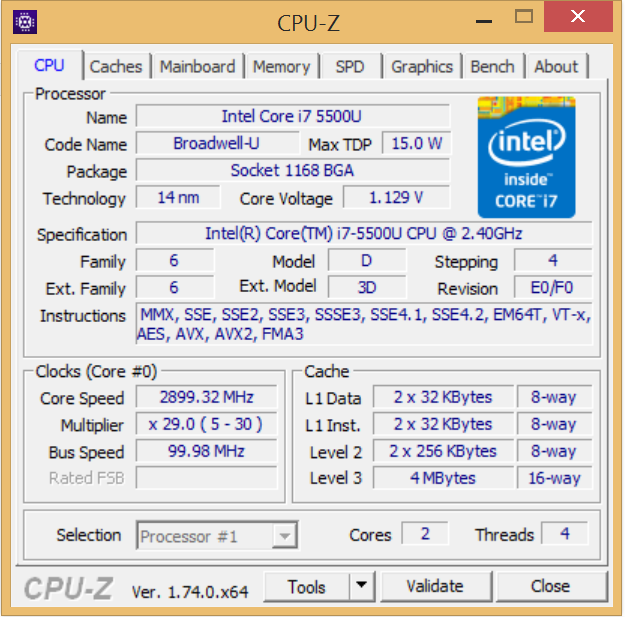
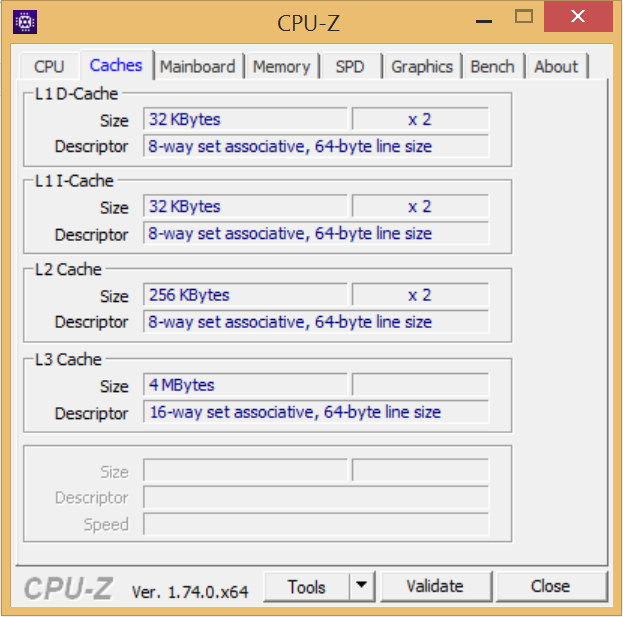
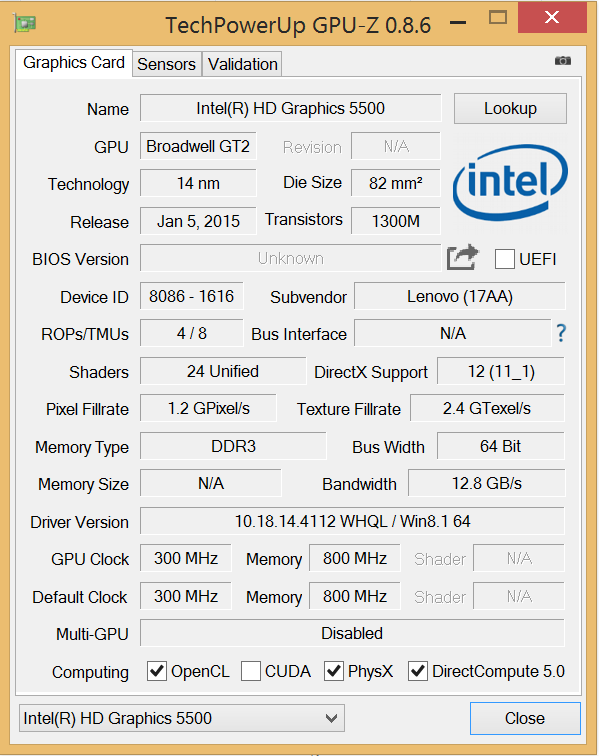
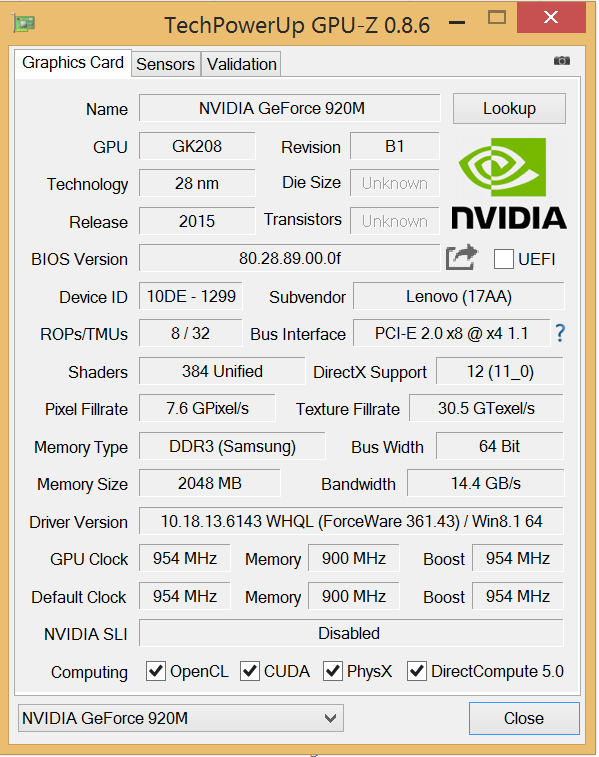
| Lenovo U31-70 80M5003EGE 5500U, GeForce 920M | Acer Aspire V3-372-50LK 6200U, HD Graphics 520 | Asus Zenbook UX303UB-R4100T 6500U, GeForce 940M | Asus Zenbook UX305LA-FC012H 5500U, HD Graphics 5500 | Apple MacBook Air 13 inch 2015-03 5650U, HD Graphics 6000 | Acer Aspire E5-473G-59QT 5200U, GeForce 940M | Lenovo U41-70 5500U, GeForce 940M | |
|---|---|---|---|---|---|---|---|
| Noise | 11% | 7% | 10% | 6% | 3% | 6% | |
| Idle Minimum * (dB) | 31.9 | 31.5 1% | 31.5 1% | 29.6 7% | 29.2 8% | 32.2 -1% | 29.6 7% |
| Idle Average * (dB) | 32.3 | 31.5 2% | 31.5 2% | 29.6 8% | 29.2 10% | 32.4 -0% | 29.6 8% |
| Idle Maximum * (dB) | 32.3 | 31.5 2% | 31.5 2% | 29.6 8% | 29.2 10% | 33.4 -3% | 32.4 -0% |
| Load Average * (dB) | 40.8 | 32.4 21% | 35.9 12% | 39.3 4% | 40.2 1% | 37.7 8% | 38 7% |
| Load Maximum * (dB) | 46.6 | 32.3 31% | 38.2 18% | 36 23% | 46.3 1% | 41 12% | 42.2 9% |
* ... Moindre est la valeur, meilleures sont les performances
(±) La température maximale du côté supérieur est de 40.8 °C / 105 F, par rapport à la moyenne de 35.9 °C / 97 F, allant de 21.4 à 59 °C pour la classe Subnotebook.
(±) Le fond chauffe jusqu'à un maximum de 43.8 °C / 111 F, contre une moyenne de 39.2 °C / 103 F
(+) En utilisation inactive, la température moyenne du côté supérieur est de 26.8 °C / 80 F, par rapport à la moyenne du dispositif de 30.8 °C / 87 F.
(+) Les repose-poignets et le pavé tactile sont plus froids que la température de la peau avec un maximum de 30.9 °C / 87.6 F et sont donc froids au toucher.
(-) La température moyenne de la zone de l'appui-paume de dispositifs similaires était de 28.2 °C / 82.8 F (-2.7 °C / #-4.8 F).
| Lenovo U31-70 80M5003EGE 5500U, GeForce 920M | Acer Aspire V3-372-50LK 6200U, HD Graphics 520 | Asus Zenbook UX303UB-R4100T 6500U, GeForce 940M | Asus Zenbook UX305LA-FC012H 5500U, HD Graphics 5500 | Apple MacBook Air 13 inch 2015-03 5650U, HD Graphics 6000 | Acer Aspire E5-473G-59QT 5200U, GeForce 940M | Lenovo U41-70 5500U, GeForce 940M | |
|---|---|---|---|---|---|---|---|
| Heat | -10% | -5% | 5% | 2% | -11% | 9% | |
| Maximum Upper Side * (°C) | 40.8 | 49.3 -21% | 56.6 -39% | 45.9 -13% | 43.8 -7% | 44.4 -9% | 44 -8% |
| Maximum Bottom * (°C) | 43.8 | 53.3 -22% | 54.3 -24% | 45 -3% | 42.1 4% | 46.7 -7% | 40 9% |
| Idle Upper Side * (°C) | 29.8 | 28.2 5% | 24 19% | 25.6 14% | 28.5 4% | 36 -21% | 24.8 17% |
| Idle Bottom * (°C) | 31.5 | 32.6 -3% | 24.2 23% | 25 21% | 28.9 8% | 33.4 -6% | 26.2 17% |
* ... Moindre est la valeur, meilleures sont les performances
| Éteint/en veille | |
| Au repos | |
| Fortement sollicité |
|
Légende:
min: | |
| Lenovo U31-70 80M5003EGE 5500U, GeForce 920M | Acer Aspire V3-372-50LK 6200U, HD Graphics 520 | Asus Zenbook UX303UB-R4100T 6500U, GeForce 940M | Asus Zenbook UX305LA-FC012H 5500U, HD Graphics 5500 | Apple MacBook Air 13 inch 2015-03 5650U, HD Graphics 6000 | Acer Aspire E5-473G-59QT 5200U, GeForce 940M | Lenovo U41-70 5500U, GeForce 940M | |
|---|---|---|---|---|---|---|---|
| Power Consumption | 12% | -7% | 24% | 22% | -13% | 13% | |
| Idle Minimum * (Watt) | 3.9 | 3.8 3% | 3.2 18% | 2.6 33% | 2.7 31% | 4.6 -18% | 3.2 18% |
| Idle Average * (Watt) | 6.8 | 5.8 15% | 7.6 -12% | 6.2 9% | 5.7 16% | 6.3 7% | 5.6 18% |
| Idle Maximum * (Watt) | 7 | 8.1 -16% | 8 -14% | 6.5 7% | 6 14% | 8.8 -26% | 5.7 19% |
| Load Average * (Watt) | 40 | 30.2 24% | 47 -18% | 30.8 23% | 32.1 20% | 43.3 -8% | 35.8 11% |
| Load Maximum * (Watt) | 51 | 32.4 36% | 55 -8% | 27 47% | 36.2 29% | 61.5 -21% | 50.3 1% |
* ... Moindre est la valeur, meilleures sont les performances
| Lenovo U31-70 80M5003EGE 35 Wh | Acer Aspire V3-372-50LK 51 Wh | Asus Zenbook UX303UB-R4100T 50 Wh | Asus Zenbook UX305LA-FC012H 56 Wh | Apple MacBook Air 13 inch 2015-03 54 Wh | Acer Aspire E5-473G-59QT 37 Wh | Lenovo U41-70 30 Wh | |
|---|---|---|---|---|---|---|---|
| Autonomie de la batterie | 67% | 67% | 116% | 125% | 8% | 13% | |
| Reader / Idle (h) | 8.8 | 15.1 72% | 16.6 89% | 24.5 178% | 26.2 198% | 9.4 7% | 9.1 3% |
| H.264 (h) | 4.6 | 6.9 50% | 9.7 111% | 5.1 11% | |||
| WiFi v1.3 (h) | 4.2 | 5.8 38% | 6.8 62% | 9.5 126% | 10.3 145% | 4.7 12% | 3.9 -7% |
| Load (h) | 1.2 | 2.3 92% | 2 67% | 1.8 50% | 1.6 33% | 1.2 0% | 1.7 42% |
Points positifs
Points négatifs
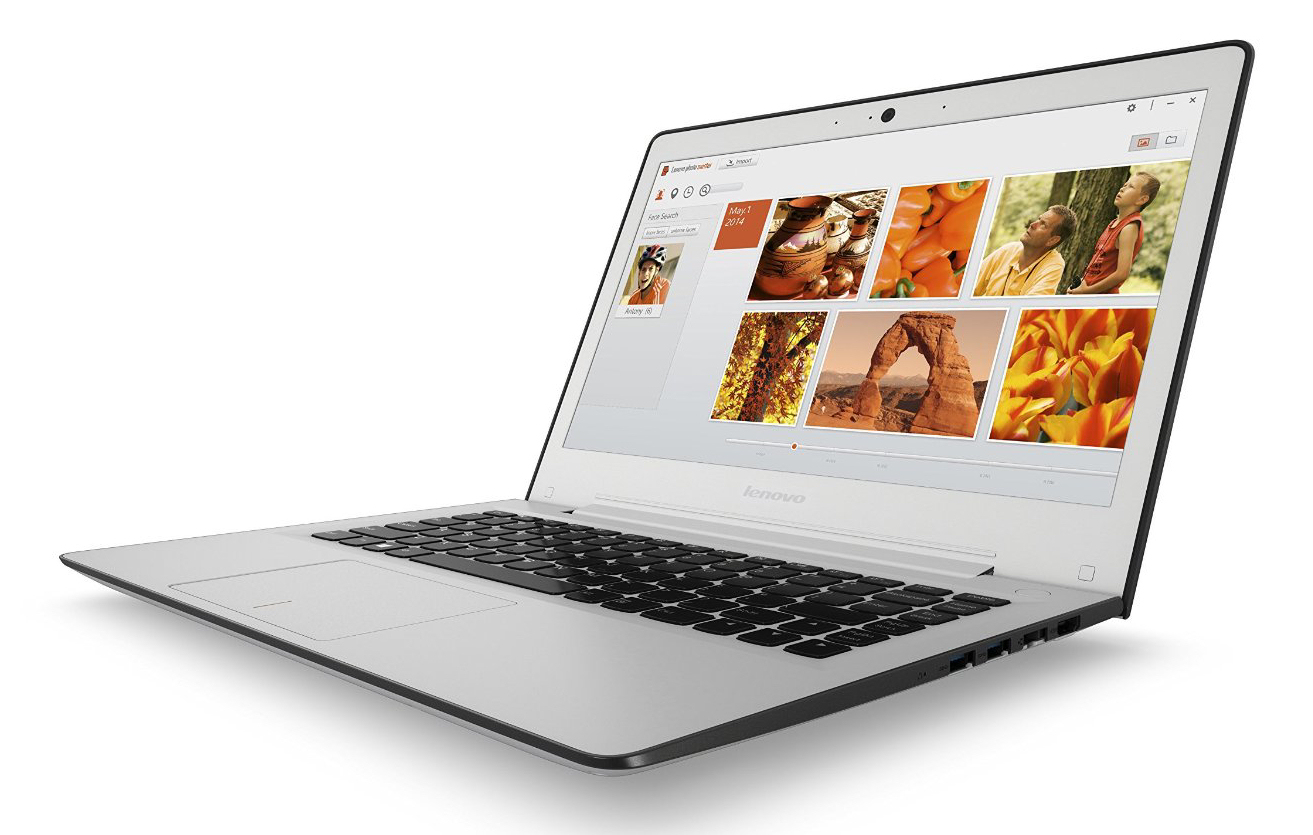
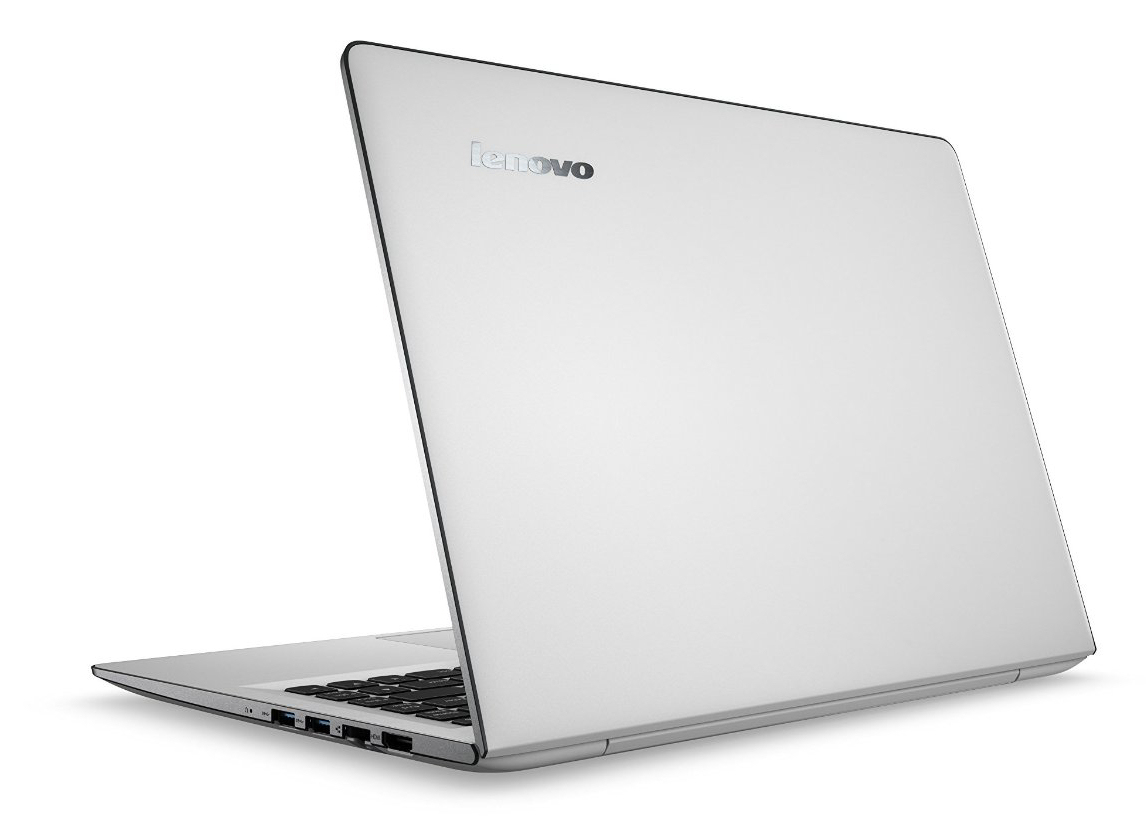
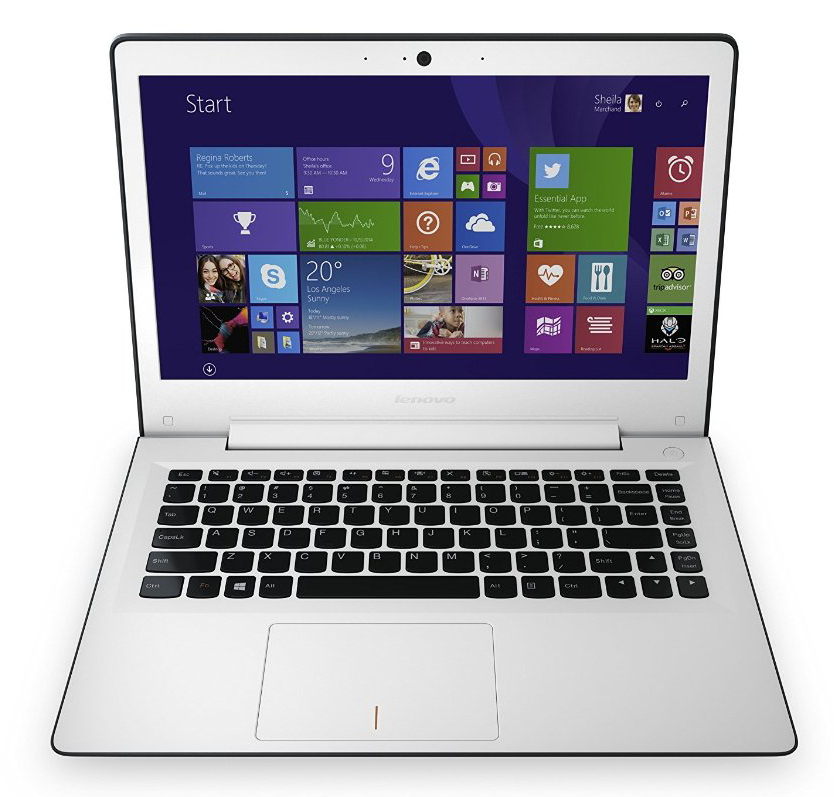
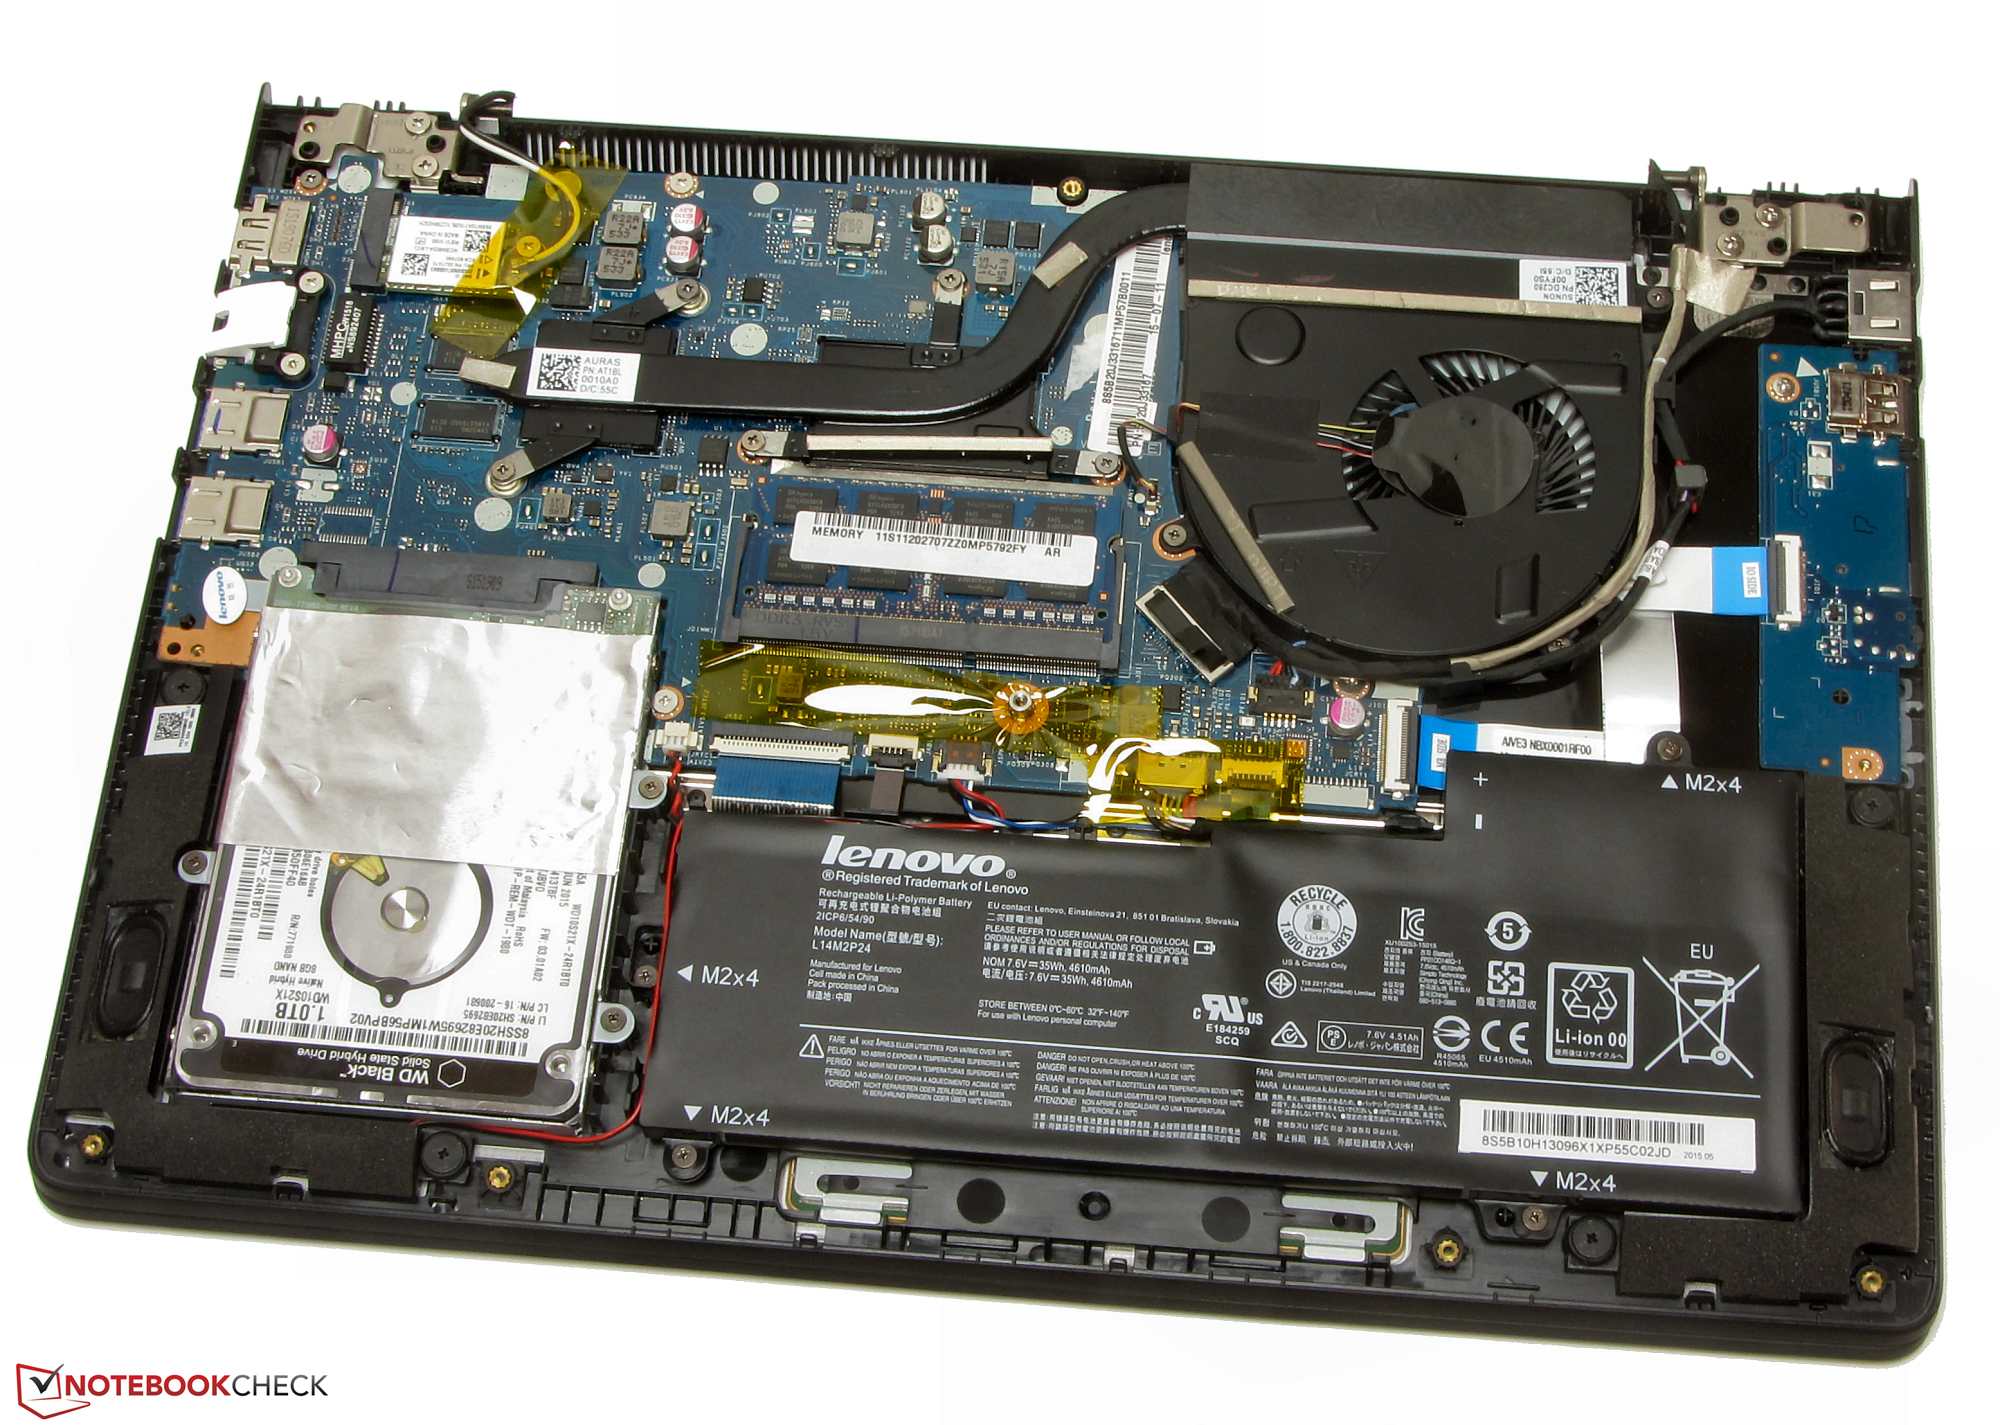
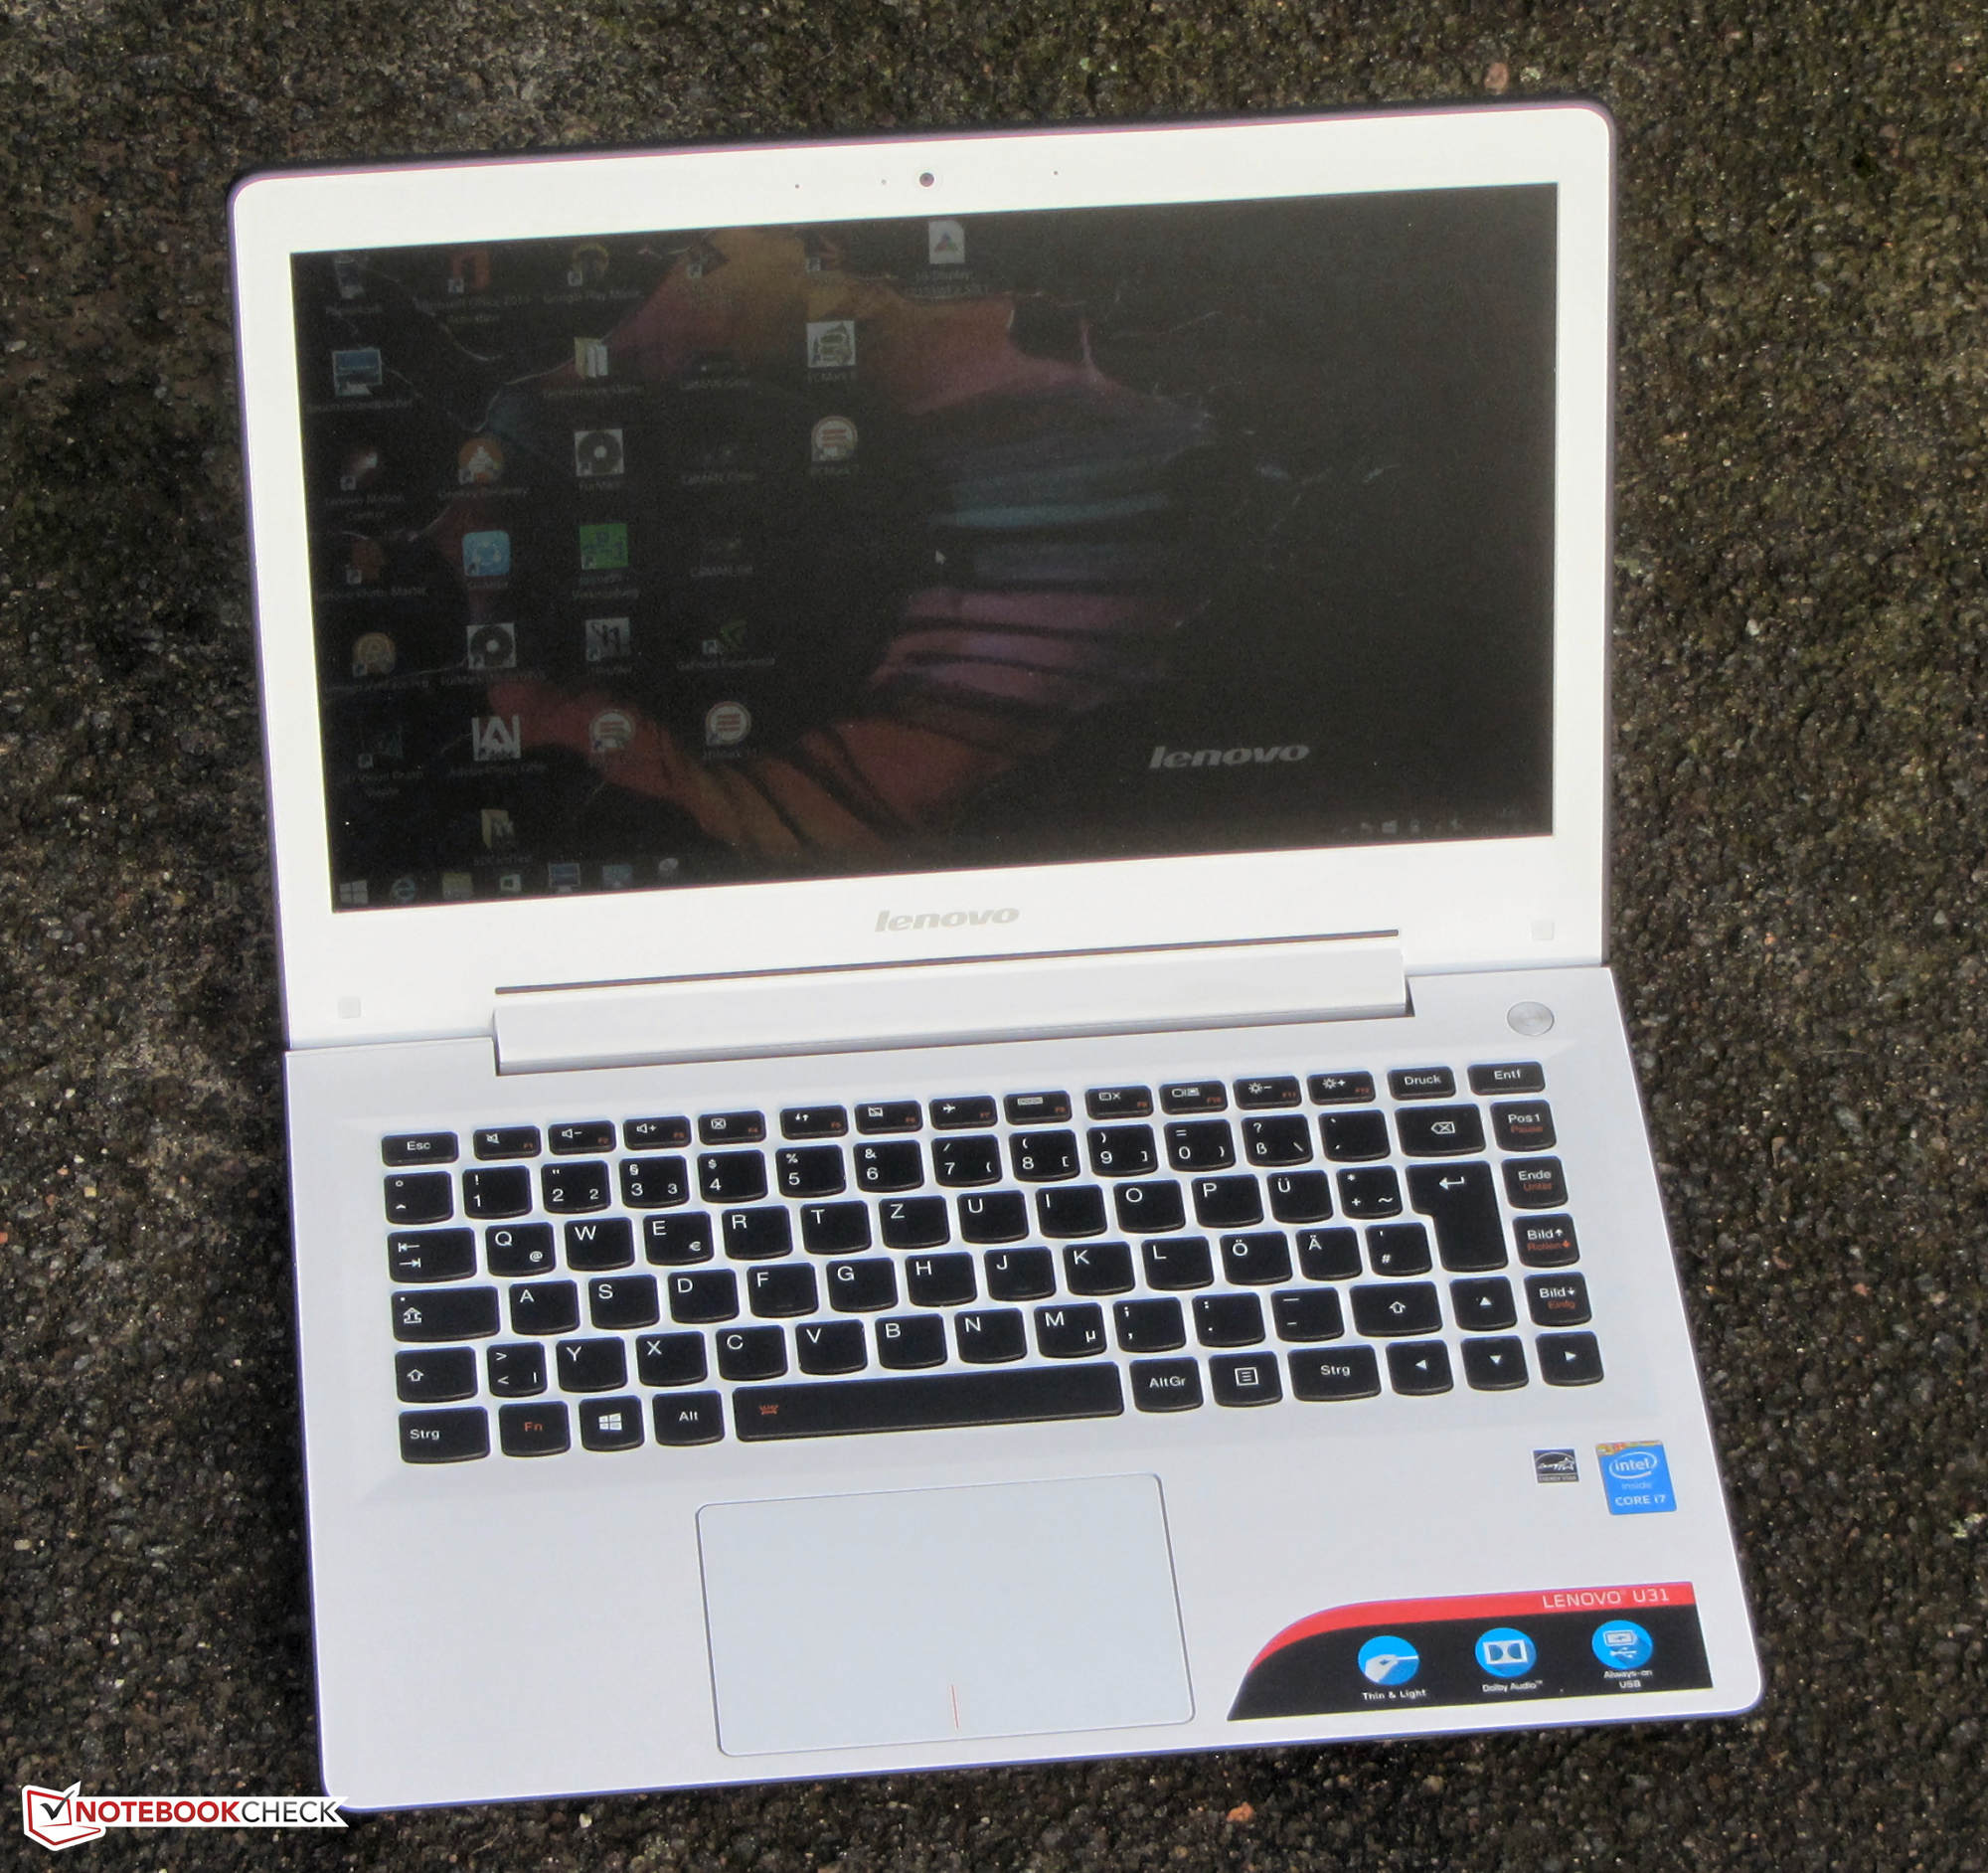
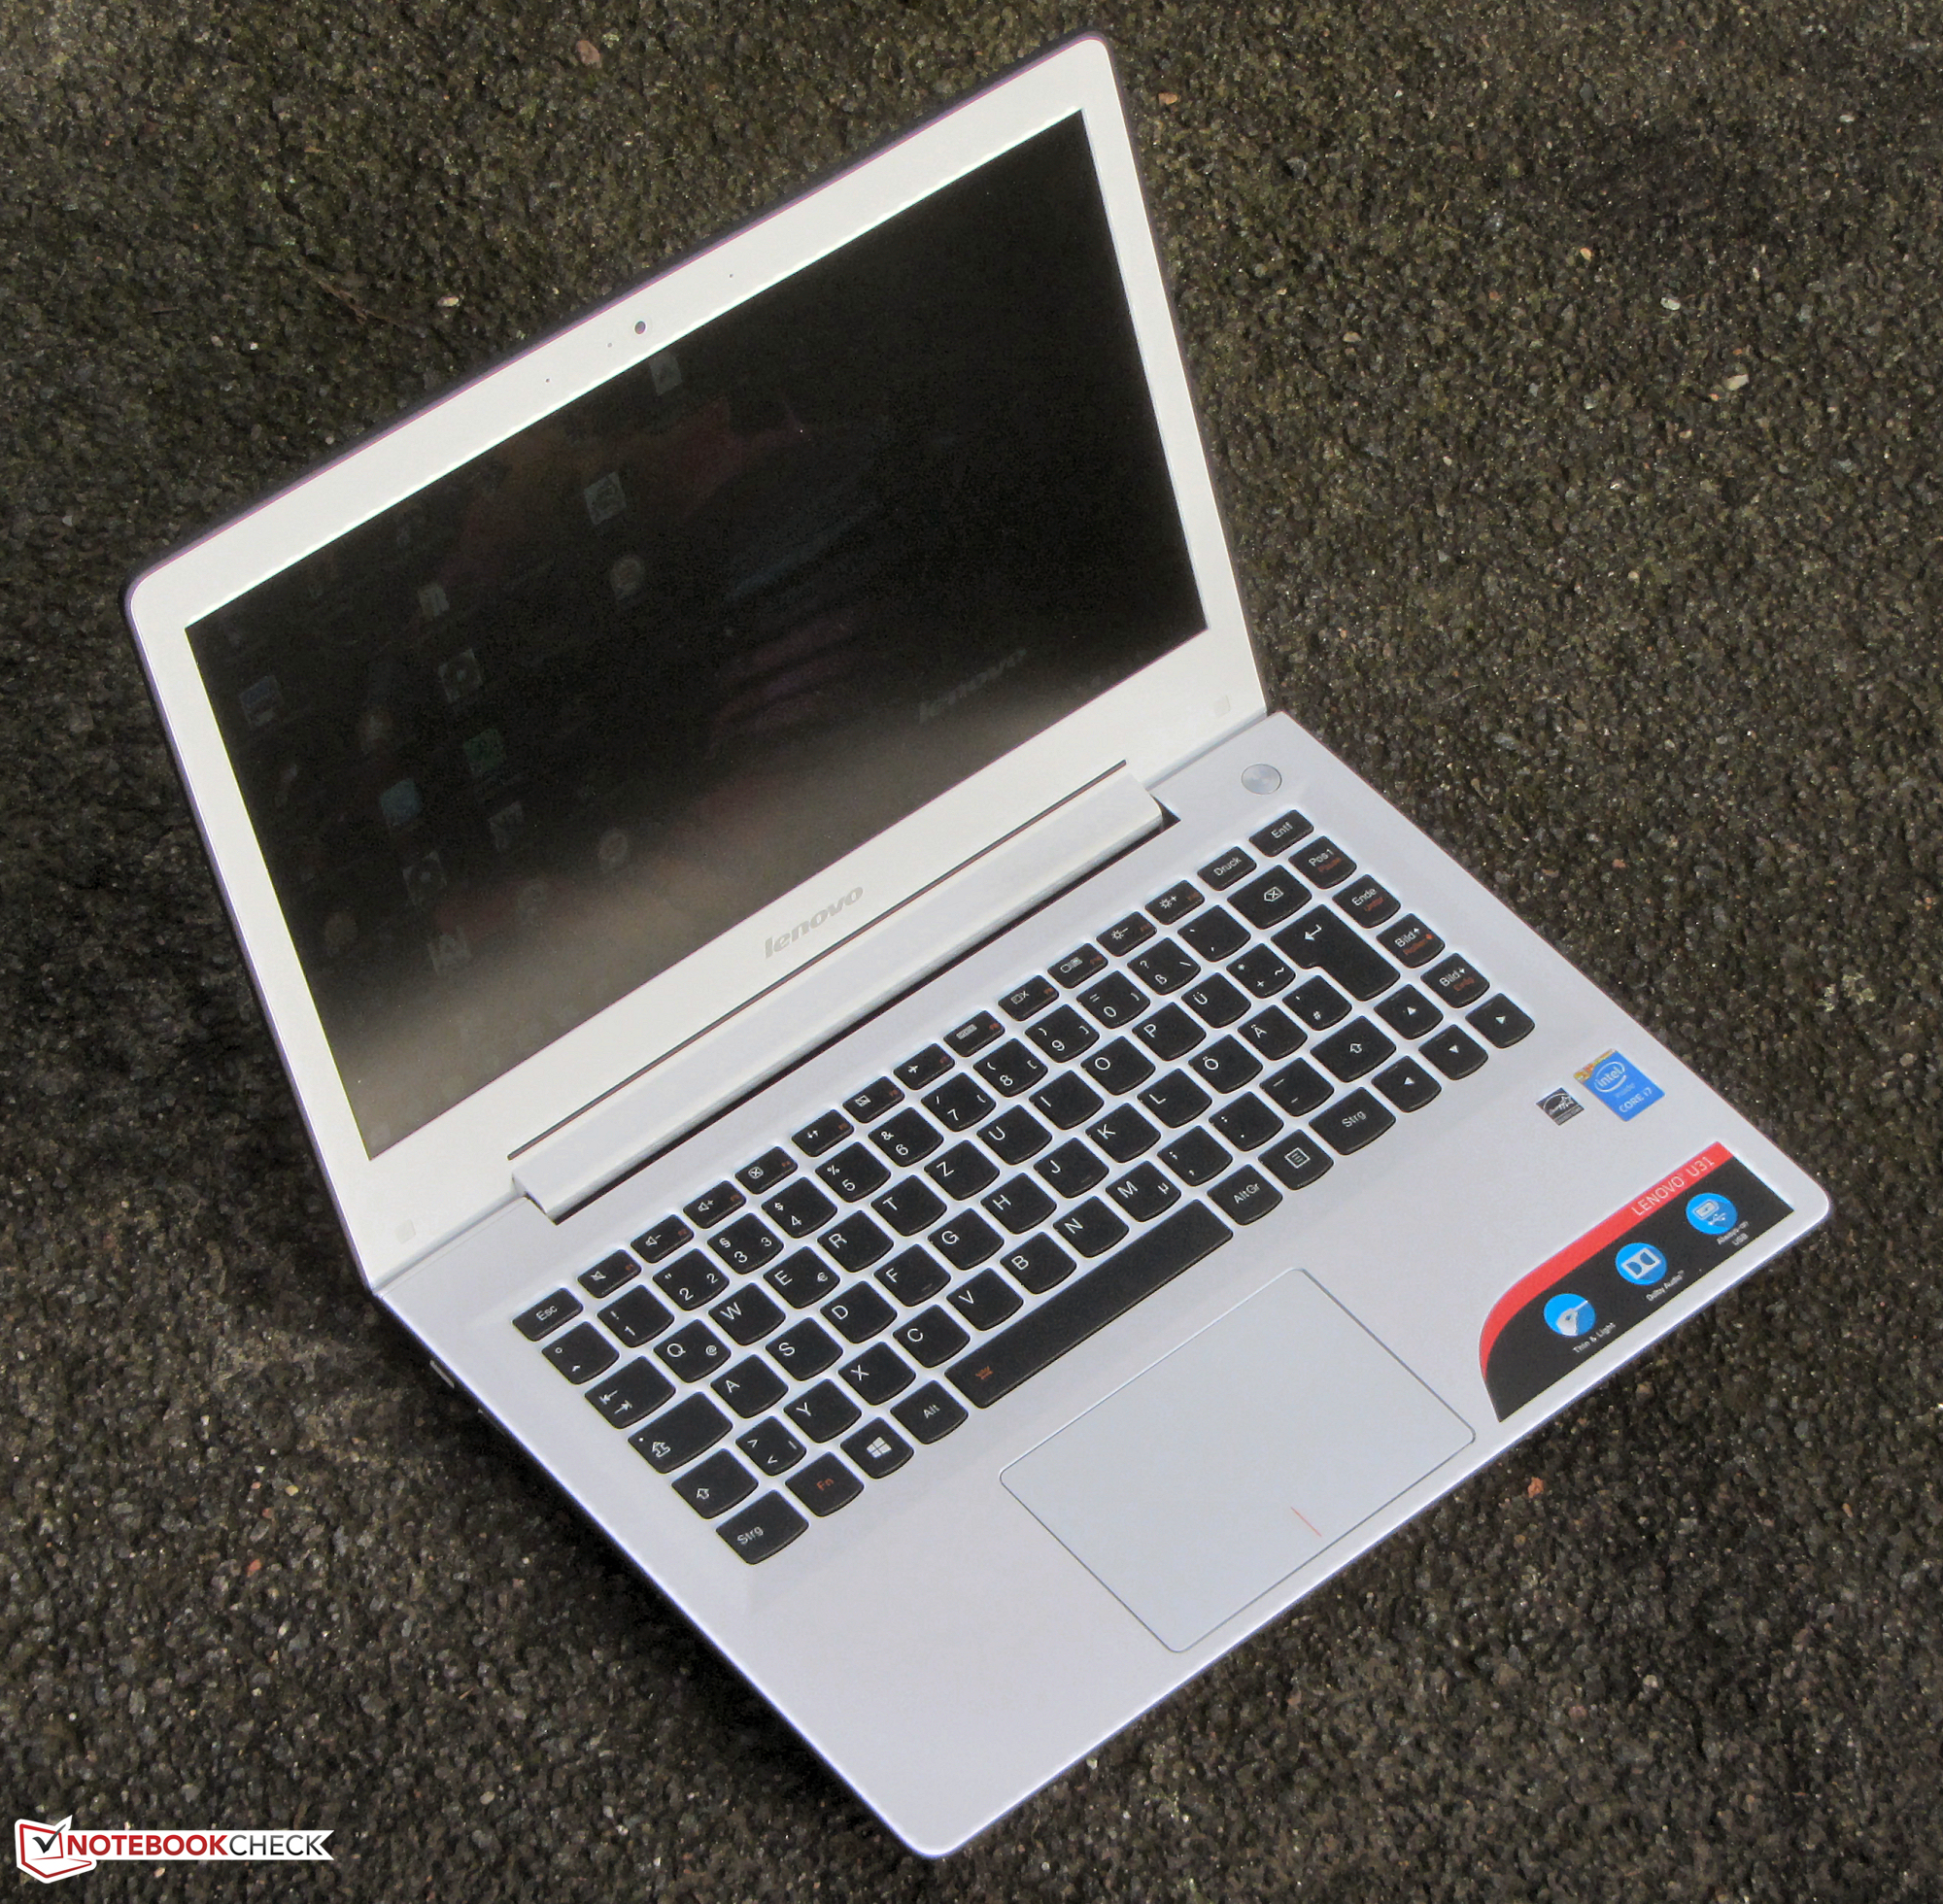
Le Lenovo U31-70 appartient à la catégorie des ultraportables de 13,3 pouces. Nous n'avons pas grand chose à dire sur sa puissance brute, la machine conviendra aux joueurs occasionnels. La chauffe est contenue tout comme le bruit généré. Le disque dur fournit un espace de stockage conséquent avec 1 To, le remplacer par un SSD est possible et s'avère relativement facile. L'écran intègre une dalle IPS qui convainc par ses angles de vue, sa luminosité et ses contrastes. Sans être exceptionnels, les périphériques d'entrée s'acquittent amplement de leur tâche.
L'autonomie de la batterie est bien trop faible, un ultraportable de 13,3 pouces devrait pourtant briller sur ce point.
Le prix est un peu élevé selon nous, à près de 970 euros pour la configuration testée (soit dit en passant est le modèle haut-de-gamme de la ligne U31-70), l'Asus Zenbook UX303UB-R4044T est vendu à peine 30 euros de plus pour une meilleure batterie et une carte graphique plus pêchue. Le U31-70 est plus attractif dans ses configurations moins puissantes, à l'image de la référence 80M5006UGE dotée d'un Core i3-5010U, d'un SSD de 128 Go et d'une dalle Full HD IPS. Ce modèle est néanmoins dénué d'une puce graphique dédiée et d'une licence Windows, mais ne coûte que 500 euros.
Pour plus de détails, vous trouverez la version complète (en anglais) de ce test ici.
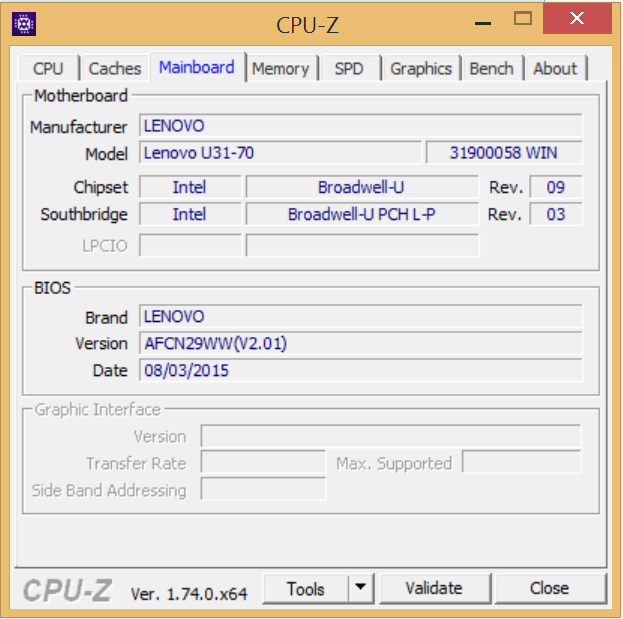
Lenovo U31-70 80M5003EGE
- 02/03/2016 v4.1 (old)
Sascha Mölck