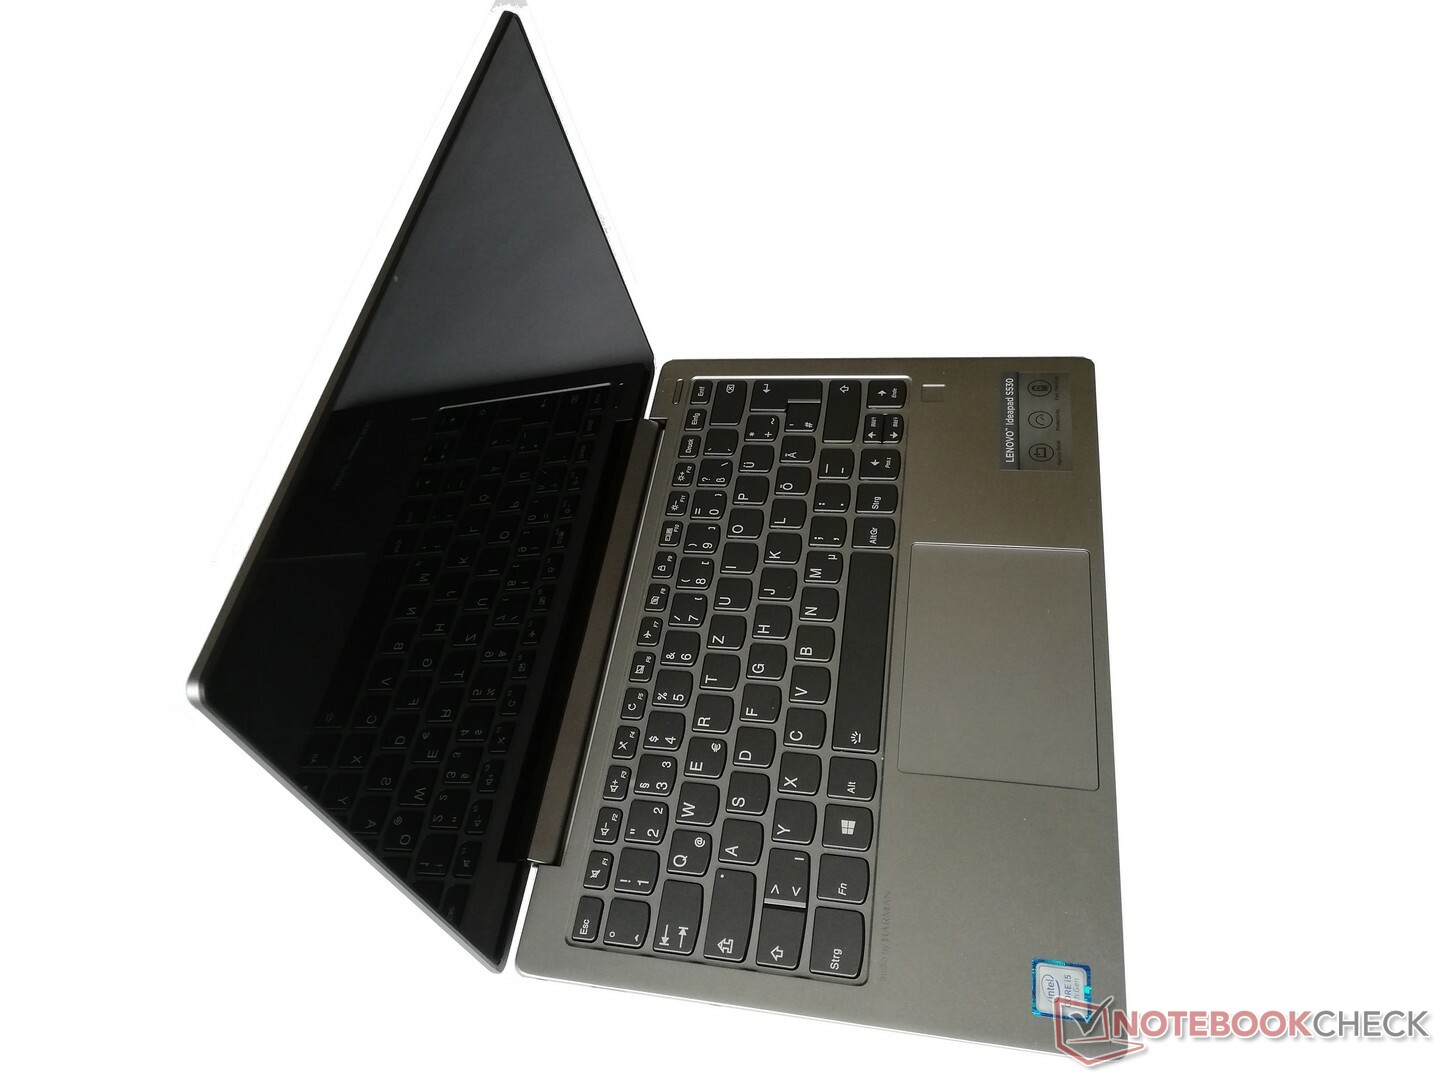
Courte critique de l'ultraportable Lenovo IdeaPad S530 (i5-8265U, UHD 620, FHD)

| |||||||||||||||||||||||||
Homogénéité de la luminosité: 78 %
Valeur mesurée au centre, sur batterie: 306 cd/m²
Contraste: 1457:1 (Valeurs des noirs: 0.21 cd/m²)
ΔE ColorChecker Calman: 5.96 | ∀{0.5-29.43 Ø4.71}
calibrated: 2.69
ΔE Greyscale Calman: 6.9 | ∀{0.09-98 Ø4.96}
90% sRGB (Argyll 1.6.3 3D)
59% AdobeRGB 1998 (Argyll 1.6.3 3D)
65.6% AdobeRGB 1998 (Argyll 3D)
89.7% sRGB (Argyll 3D)
68.6% Display P3 (Argyll 3D)
Gamma: 2.35
CCT: 7554 K
| Lenovo Ideapad S530-13IWL BOE07D7, , 1920x1080, 13.3" | Acer Spin 5 SP513-52N-54SF LC133LF102, , 1920x1080, 13.3" | Dell Inspiron 13-5379-9573 BOE BOE06A7, , 1920x1080, 13.3" | HP ProBook 430 G5-3KX72ES LGD052D, , 1920x1080, 13.3" | Asus ZenBook 13 UX333FA AU Optronics B133HAN05.C, , 1920x1080, 13.3" | Lenovo ThinkPad L390-20NR0013GE LP133WF2-SPL8, , 1920x1080, 13.3" | Lenovo IdeaPad 730S-13IWL 81JB0004US B133HAN05.1, , 1920x1080, 13.3" | |
|---|---|---|---|---|---|---|---|
| Display | 4% | -35% | -37% | 4% | -37% | 1% | |
| Display P3 Coverage (%) | 68.6 | 69.8 2% | 41.2 -40% | 40.23 -41% | 67.9 -1% | 40.42 -41% | 65.6 -4% |
| sRGB Coverage (%) | 89.7 | 94.6 5% | 61.7 -31% | 60.3 -33% | 97.4 9% | 60.4 -33% | 95.5 6% |
| AdobeRGB 1998 Coverage (%) | 65.6 | 69.3 6% | 42.6 -35% | 41.59 -37% | 69.2 5% | 41.8 -36% | 66.7 2% |
| Response Times | -5% | -10% | 4% | -29% | -2% | -55% | |
| Response Time Grey 50% / Grey 80% * (ms) | 41 ? | 49 ? -20% | 45 ? -10% | 41.6 ? -1% | 54.4 ? -33% | 42.8 ? -4% | 75.2 ? -83% |
| Response Time Black / White * (ms) | 30 ? | 27 ? 10% | 33 ? -10% | 27.2 ? 9% | 37.6 ? -25% | 30 ? -0% | 38 ? -27% |
| PWM Frequency (Hz) | 192 ? | 1000 ? | 192 ? | 20490 ? | 30490 ? | 544 | |
| Screen | 12% | -15% | -26% | 10% | -32% | 15% | |
| Brightness middle (cd/m²) | 306 | 295 -4% | 274 -10% | 262 -14% | 276 -10% | 298 -3% | 355.1 16% |
| Brightness (cd/m²) | 287 | 276 -4% | 272 -5% | 253 -12% | 263 -8% | 278 -3% | 336 17% |
| Brightness Distribution (%) | 78 | 88 13% | 81 4% | 82 5% | 89 14% | 81 4% | 83 6% |
| Black Level * (cd/m²) | 0.21 | 0.27 -29% | 0.32 -52% | 0.28 -33% | 0.21 -0% | 0.33 -57% | 0.32 -52% |
| Contrast (:1) | 1457 | 1093 -25% | 856 -41% | 936 -36% | 1314 -10% | 903 -38% | 1110 -24% |
| Colorchecker dE 2000 * | 5.96 | 2.97 50% | 5.57 7% | 5.7 4% | 4.85 19% | 6.5 -9% | 2.93 51% |
| Colorchecker dE 2000 max. * | 11.34 | 5.67 50% | 13.48 -19% | 22.4 -98% | 8.24 27% | 23.9 -111% | 4.39 61% |
| Colorchecker dE 2000 calibrated * | 2.69 | 4.8 -78% | 1.6 41% | 4.9 -82% | 1.83 32% | ||
| Greyscale dE 2000 * | 6.9 | 3.12 55% | 4.66 32% | 3.6 48% | 5.7 17% | 5.6 19% | 3.6 48% |
| Gamma | 2.35 94% | 2.45 90% | 2.53 87% | 2.15 102% | 2.08 106% | 2.08 106% | 2.071 106% |
| CCT | 7554 86% | 6676 97% | 7010 93% | 7096 92% | 7424 88% | 6669 97% | 7161 91% |
| Color Space (Percent of AdobeRGB 1998) (%) | 59 | 62 5% | 39 -34% | 38.3 -35% | 63 7% | 38.4 -35% | 61 3% |
| Color Space (Percent of sRGB) (%) | 90 | 94 4% | 61 -32% | 60.1 -33% | 98 9% | 60.1 -33% | 95 6% |
| Moyenne finale (programmes/paramètres) | 4% /
8% | -20% /
-18% | -20% /
-24% | -5% /
4% | -24% /
-29% | -13% /
4% |
* ... Moindre est la valeur, meilleures sont les performances
Temps de réponse de l'écran
| ↔ Temps de réponse noir à blanc | ||
|---|---|---|
| 30 ms ... hausse ↗ et chute ↘ combinées | ↗ 16 ms hausse | 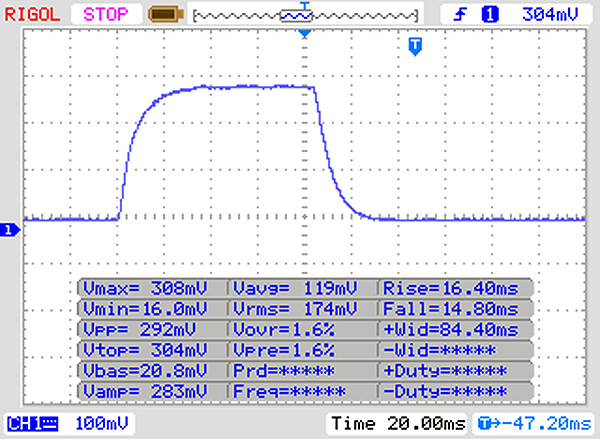 |
| ↘ 14 ms chute | ||
| L'écran souffre de latences très élevées, à éviter pour le jeu. En comparaison, tous les appareils testés affichent entre 0.1 (minimum) et 240 (maximum) ms. » 80 % des appareils testés affichent de meilleures performances. Cela signifie que les latences relevées sont moins bonnes que la moyenne (19.8 ms) de tous les appareils testés. | ||
| ↔ Temps de réponse gris 50% à gris 80% | ||
| 41 ms ... hausse ↗ et chute ↘ combinées | ↗ 22 ms hausse | 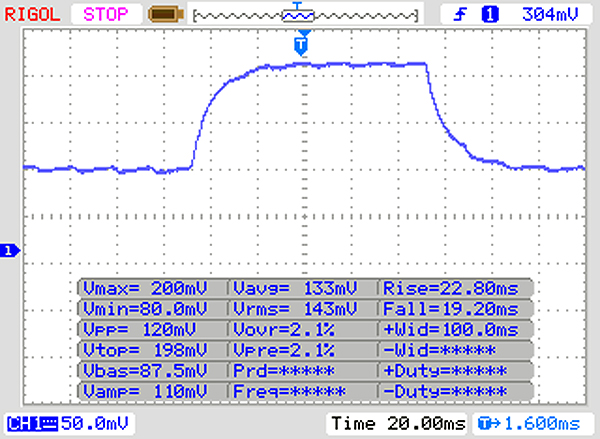 |
| ↘ 19 ms chute | ||
| L'écran souffre de latences très élevées, à éviter pour le jeu. En comparaison, tous les appareils testés affichent entre 0.165 (minimum) et 636 (maximum) ms. » 65 % des appareils testés affichent de meilleures performances. Cela signifie que les latences relevées sont moins bonnes que la moyenne (30.9 ms) de tous les appareils testés. | ||
Scintillement / MLI (Modulation de largeur d'impulsion)
| Scintillement / MLI (Modulation de largeur d'impulsion) décelé | 192 Hz | ≤ 90 Niveau de luminosité | 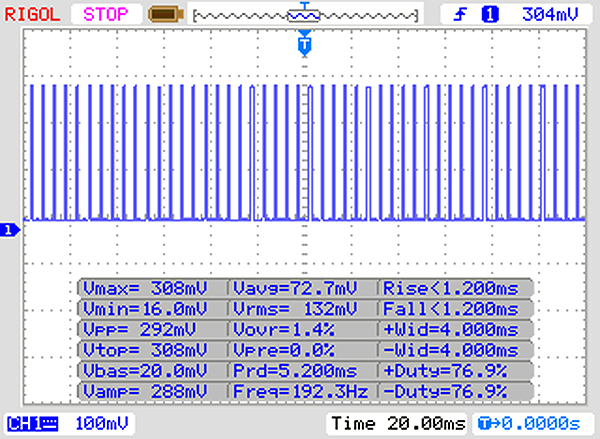 |
Le rétroéclairage de l'écran scintille à la fréquence de 192 Hz (certainement du fait de l'utilisation d'une MDI - Modulation de largeur d'impulsion) à un niveau de luminosité inférieur ou égal à 90 % . Aucun scintillement ne devrait être perceptible au-dessus de cette valeur. La fréquence de rafraîchissement de 192 Hz est relativement faible, les personnes les plus sensibles devraient percevoir un scintillement et être sujettes à une fatigue oculaire accrue (avec le niveau de luminosité indiqué) En comparaison, 52 % des appareils testés n'emploient pas MDI pour assombrir leur écran. Nous avons relevé une moyenne à 7744 (minimum : 5 - maximum : 343500) Hz dans le cas où une MDI était active. | |||

| PCMark 8 Home Score Accelerated v2 | 3359 points | |
| PCMark 8 Work Score Accelerated v2 | 4771 points | |
| PCMark 10 Score | 3764 points | |
Aide | ||
| Lenovo Ideapad S530-13IWL Lenovo UMIS AM610 RPFTJ256PDD2MWX | Acer Spin 5 SP513-52N-54SF Micron 1100 MTFDDAV256TBN | Dell Inspiron 13-5379-9573 Micron 1100 MTFDDAV256TBN | HP ProBook 430 G5-3KX72ES Toshiba XG5 KXG50ZNV512G | Asus ZenBook 13 UX333FA WDC PC SN520 SDAPNUW-256G | Lenovo ThinkPad L390-20NR0013GE Samsung SSD PM981 MZVLB256HAHQ | Lenovo IdeaPad 730S-13IWL 81JB0004US Samsung SSD PM981 MZVLB256HAHQ | Moyenne Lenovo UMIS AM610 RPFTJ256PDD2MWX | |
|---|---|---|---|---|---|---|---|---|
| CrystalDiskMark 5.2 / 6 | -41% | 16% | 15% | 66% | 46% | -22% | ||
| Write 4K (MB/s) | 101.5 | 71.2 -30% | 111.3 10% | 113.7 12% | 99.6 -2% | 117 15% | 82.8 ? -18% | |
| Read 4K (MB/s) | 44.47 | 25.36 -43% | 32.46 -27% | 43.18 -3% | 37.22 -16% | 40.65 -9% | 27.5 ? -38% | |
| Write Seq (MB/s) | 603 | 196.3 -67% | 526 -13% | 970 61% | 1432 137% | 1456 141% | 450 ? -25% | |
| Read Seq (MB/s) | 686 | 455.7 -34% | 1430 108% | 1085 58% | 2072 202% | 1181 72% | 606 ? -12% | |
| Write 4K Q32T1 (MB/s) | 298.1 | 261 -12% | 516 73% | 396.8 33% | 439.7 48% | 232.3 -22% | 259 ? -13% | |
| Read 4K Q32T1 (MB/s) | 358.7 | 231.8 -35% | 366.6 2% | 317.8 -11% | 264.8 -26% | 311.3 -13% | 317 ? -12% | |
| Write Seq Q32T1 (MB/s) | 872 | 510 -42% | 524 -40% | 518 -41% | 1549 78% | 1463 68% | 583 ? -33% | |
| Read Seq Q32T1 (MB/s) | 1611 | 525 -67% | 1783 11% | 1741 8% | 3318 106% | 3480 116% | 1242 ? -23% | |
| Write 4K Q8T8 (MB/s) | 828 | |||||||
| Read 4K Q8T8 (MB/s) | 897 | |||||||
| AS SSD | -45% | -52% | -8% | 0% | 47% | 36% | -20% | |
| Seq Read (MB/s) | 1377 | 486.3 -65% | 462.8 -66% | 1408 2% | 1186 -14% | 1779 29% | 2323 69% | 1068 ? -22% |
| Seq Write (MB/s) | 805 | 421.4 -48% | 365.7 -55% | 544 -32% | 809 0% | 1185 47% | 1395 73% | 542 ? -33% |
| 4K Read (MB/s) | 45.01 | 25.48 -43% | 24.71 -45% | 30.79 -32% | 39.69 -12% | 53.8 20% | 49.31 10% | 36.6 ? -19% |
| 4K Write (MB/s) | 88.9 | 80.8 -9% | 68.2 -23% | 105.1 18% | 114 28% | 137.5 55% | 100.7 13% | 81.5 ? -8% |
| 4K-64 Read (MB/s) | 767 | 235.5 -69% | 232.2 -70% | 701 -9% | 618 -19% | 786 2% | 765 0% | 624 ? -19% |
| 4K-64 Write (MB/s) | 611 | 216.5 -65% | 245.1 -60% | 447.2 -27% | 510 -17% | 1296 112% | 981 61% | 442 ? -28% |
| Access Time Read * (ms) | 0.141 | 0.11 22% | 0.13 8% | 0.063 55% | 0.068 52% | 0.048 66% | 0.058 59% | 0.1375 ? 2% |
| Access Time Write * (ms) | 0.043 | 0.055 -28% | 0.074 -72% | 0.049 -14% | 0.032 26% | 0.027 37% | 0.037 14% | 0.054 ? -26% |
| Score Read (Points) | 950 | 310 -67% | 303 -68% | 873 -8% | 776 -18% | 1018 7% | 1047 10% | 767 ? -19% |
| Score Write (Points) | 781 | 340 -56% | 350 -55% | 607 -22% | 705 -10% | 1552 99% | 1221 56% | 578 ? -26% |
| Score Total (Points) | 2200 | 813 -63% | 812 -63% | 1888 -14% | 1870 -15% | 3076 40% | 2770 26% | 1721 ? -22% |
| Copy ISO MB/s (MB/s) | 327.5 | 1129 | 1090 | 1495 | 898 | 290 ? | ||
| Copy Program MB/s (MB/s) | 157.3 | 319.1 | 714 | 389.7 | 181.4 | 220 ? | ||
| Copy Game MB/s (MB/s) | 246.6 | 767 | 413 | 893 | 270.5 | 280 ? | ||
| Moyenne finale (programmes/paramètres) | -45% /
-45% | -47% /
-47% | 4% /
2% | 8% /
6% | 57% /
55% | 41% /
40% | -21% /
-21% |
* ... Moindre est la valeur, meilleures sont les performances

| 3DMark 11 Performance | 2098 points | |
| 3DMark Cloud Gate Standard Score | 9949 points | |
| 3DMark Fire Strike Score | 1184 points | |
Aide | ||
| Thief | |
| 1024x768 Very Low Preset | |
| Lenovo Ideapad S530-13IWL | |
| Lenovo IdeaPad 730S-13IWL 81JB0004US | |
| Moyenne Intel UHD Graphics 620 (16.3 - 34.3, n=10) | |
| Dell Inspiron 13-5379-9573 | |
| 1366x768 Normal Preset AA:FX | |
| Lenovo Ideapad S530-13IWL | |
| Lenovo IdeaPad 730S-13IWL 81JB0004US | |
| Moyenne Intel UHD Graphics 620 (10.4 - 19.7, n=10) | |
| Dell Inspiron 13-5379-9573 | |
| 1366x768 High Preset AA:FXAA & Low SS AF:4x | |
| Lenovo IdeaPad 730S-13IWL 81JB0004US | |
| Moyenne Intel UHD Graphics 620 (8.5 - 15.1, n=5) | |
| Rise of the Tomb Raider | |
| 1024x768 Lowest Preset | |
| Lenovo Ideapad S530-13IWL | |
| Asus ZenBook 13 UX333FA | |
| Moyenne Intel UHD Graphics 620 (10.4 - 110.7, n=82) | |
| Lenovo IdeaPad 730S-13IWL 81JB0004US | |
| Dell Inspiron 13-5379-9573 | |
| Lenovo ThinkPad L390-20NR0013GE | |
| 1366x768 Medium Preset AF:2x | |
| Asus ZenBook 13 UX333FA | |
| Lenovo Ideapad S530-13IWL | |
| Moyenne Intel UHD Graphics 620 (6.5 - 49.3, n=62) | |
| Lenovo IdeaPad 730S-13IWL 81JB0004US | |
| Dell Inspiron 13-5379-9573 | |
| 1920x1080 High Preset AA:FX AF:4x | |
| Asus ZenBook 13 UX333FA | |
| Moyenne Intel UHD Graphics 620 (4.9 - 32, n=42) | |
| Lenovo IdeaPad 730S-13IWL 81JB0004US | |
| Bas | Moyen | Élevé | Ultra | |
|---|---|---|---|---|
| BioShock Infinite (2013) | 73.9 | 37.74 | 31.62 | 9.69 |
| Thief (2014) | 28 | 19.7 | ||
| Rise of the Tomb Raider (2016) | 22.45 | 13.41 |
Degré de la nuisance sonore
| Au repos |
| 30.4 / 30.4 / 30.4 dB(A) |
| Fortement sollicité |
| 34.4 / 37.4 dB(A) |
 | ||
30 dB silencieux 40 dB(A) audible 50 dB(A) bruyant |
||
min: | ||
(+) La température maximale du côté supérieur est de 39.4 °C / 103 F, par rapport à la moyenne de 35.9 °C / 97 F, allant de 21.4 à 59 °C pour la classe Subnotebook.
(±) Le fond chauffe jusqu'à un maximum de 40.5 °C / 105 F, contre une moyenne de 39.2 °C / 103 F
(+) En utilisation inactive, la température moyenne du côté supérieur est de 24.6 °C / 76 F, par rapport à la moyenne du dispositif de 30.8 °C / 87 F.
(+) Les repose-poignets et le pavé tactile atteignent la température maximale de la peau (32.4 °C / 90.3 F) et ne sont donc pas chauds.
(-) La température moyenne de la zone de l'appui-paume de dispositifs similaires était de 28.2 °C / 82.8 F (-4.2 °C / #-7.5 F).
Lenovo Ideapad S530-13IWL analyse audio
(-) | haut-parleurs pas très forts (66.8 dB)
Basses 100 - 315 Hz
(-) | presque aucune basse - en moyenne 19.6% plus bas que la médiane
(-) | les basses ne sont pas linéaires (15% delta à la fréquence précédente)
Médiums 400 - 2000 Hz
(±) | médiane supérieure - en moyenne 6.1% supérieure à la médiane
(±) | la linéarité des médiums est moyenne (7.7% delta à la fréquence précédente)
Aiguës 2 - 16 kHz
(+) | des sommets équilibrés - à seulement 1.4% de la médiane
(+) | les aigus sont linéaires (6.1% delta à la fréquence précédente)
Globalement 100 - 16 000 Hz
(±) | la linéarité du son global est moyenne (25.1% de différence avec la médiane)
Par rapport à la même classe
» 84% de tous les appareils testés de cette catégorie étaient meilleurs, 4% similaires, 12% pires
» Le meilleur avait un delta de 5%, la moyenne était de 18%, le pire était de 53%.
Par rapport à tous les appareils testés
» 77% de tous les appareils testés étaient meilleurs, 5% similaires, 18% pires
» Le meilleur avait un delta de 4%, la moyenne était de 23%, le pire était de 134%.
Apple MacBook 12 (Early 2016) 1.1 GHz analyse audio
(+) | les haut-parleurs peuvent jouer relativement fort (83.6# dB)
Basses 100 - 315 Hz
(±) | basse réduite - en moyenne 11.3% inférieure à la médiane
(±) | la linéarité des basses est moyenne (14.2% delta à la fréquence précédente)
Médiums 400 - 2000 Hz
(+) | médiane équilibrée - seulement 2.4% de la médiane
(+) | les médiums sont linéaires (5.5% delta à la fréquence précédente)
Aiguës 2 - 16 kHz
(+) | des sommets équilibrés - à seulement 2% de la médiane
(+) | les aigus sont linéaires (4.5% delta à la fréquence précédente)
Globalement 100 - 16 000 Hz
(+) | le son global est linéaire (10.2% différence à la médiane)
Par rapport à la même classe
» 7% de tous les appareils testés de cette catégorie étaient meilleurs, 2% similaires, 90% pires
» Le meilleur avait un delta de 5%, la moyenne était de 18%, le pire était de 53%.
Par rapport à tous les appareils testés
» 5% de tous les appareils testés étaient meilleurs, 1% similaires, 94% pires
» Le meilleur avait un delta de 4%, la moyenne était de 23%, le pire était de 134%.
| Éteint/en veille | |
| Au repos | |
| Fortement sollicité |
|
Légende:
min: | |
| Lenovo Ideapad S530-13IWL i5-8265U, UHD Graphics 620, Lenovo UMIS AM610 RPFTJ256PDD2MWX, IPS, 1920x1080, 13.3" | Acer Spin 5 SP513-52N-54SF i5-8250U, UHD Graphics 620, Micron 1100 MTFDDAV256TBN, IPS, 1920x1080, 13.3" | Dell Inspiron 13-5379-9573 i5-8250U, UHD Graphics 620, Micron 1100 MTFDDAV256TBN, IPS, 1920x1080, 13.3" | HP ProBook 430 G5-3KX72ES i5-8250U, UHD Graphics 620, Toshiba XG5 KXG50ZNV512G, IPS LED, 1920x1080, 13.3" | Asus ZenBook 13 UX333FA i5-8265U, UHD Graphics 620, WDC PC SN520 SDAPNUW-256G, IPS, 1920x1080, 13.3" | Lenovo ThinkPad L390-20NR0013GE i5-8265U, UHD Graphics 620, Samsung SSD PM981 MZVLB256HAHQ, IPS LED, 1920x1080, 13.3" | Lenovo IdeaPad 730S-13IWL 81JB0004US i5-8265U, UHD Graphics 620, Samsung SSD PM981 MZVLB256HAHQ, IPS, 1920x1080, 13.3" | Moyenne Intel UHD Graphics 620 | Moyenne de la classe Subnotebook | |
|---|---|---|---|---|---|---|---|---|---|
| Power Consumption | -6% | 2% | -15% | 18% | -12% | 1% | -10% | -15% | |
| Idle Minimum * (Watt) | 2.8 | 3.9 -39% | 3.2 -14% | 4.5 -61% | 1.6 43% | 3.8 -36% | 2.8 -0% | 3.81 ? -36% | 3.71 ? -33% |
| Idle Average * (Watt) | 5.6 | 8.2 -46% | 5.9 -5% | 6.8 -21% | 4.6 18% | 6.8 -21% | 5.5 2% | 6.94 ? -24% | 6.54 ? -17% |
| Idle Maximum * (Watt) | 7.4 | 8.8 -19% | 8.8 -19% | 8.8 -19% | 7.3 1% | 9.8 -32% | 7.7 -4% | 8.75 ? -18% | 7.89 ? -7% |
| Load Average * (Watt) | 41.6 | 28.5 31% | 31.2 25% | 36.8 12% | 37.9 9% | 32.4 22% | 39.9 4% | 35 ? 16% | 42.1 ? -1% |
| Load Maximum * (Watt) | 55 | 30.7 44% | 42.2 23% | 46.2 16% | 44.8 19% | 52 5% | 54.1 2% | 47.5 ? 14% | 65.1 ? -18% |
* ... Moindre est la valeur, meilleures sont les performances
| Lenovo Ideapad S530-13IWL i5-8265U, UHD Graphics 620, 45 Wh | Acer Spin 5 SP513-52N-54SF i5-8250U, UHD Graphics 620, 53.9 Wh | Dell Inspiron 13-5379-9573 i5-8250U, UHD Graphics 620, 42 Wh | HP ProBook 430 G5-3KX72ES i5-8250U, UHD Graphics 620, 48 Wh | Asus ZenBook 13 UX333FA i5-8265U, UHD Graphics 620, 50 Wh | Lenovo ThinkPad L390-20NR0013GE i5-8265U, UHD Graphics 620, 45 Wh | Lenovo IdeaPad 730S-13IWL 81JB0004US i5-8265U, UHD Graphics 620, 42 Wh | Moyenne de la classe Subnotebook | |
|---|---|---|---|---|---|---|---|---|
| Autonomie de la batterie | 26% | 6% | 6% | 75% | 11% | 68% | 93% | |
| Reader / Idle (h) | 13.5 | 15.3 13% | 27.8 106% | 16.2 20% | 28.6 ? 112% | |||
| WiFi v1.3 (h) | 6.6 | 8.3 26% | 5.4 -18% | 7 6% | 9.9 50% | 7 6% | 11.1 68% | 14.1 ? 114% |
| Load (h) | 1.3 | 1.6 23% | 2.2 69% | 1.4 8% | 1.998 ? 54% |
Points positifs
Points négatifs
Verdict
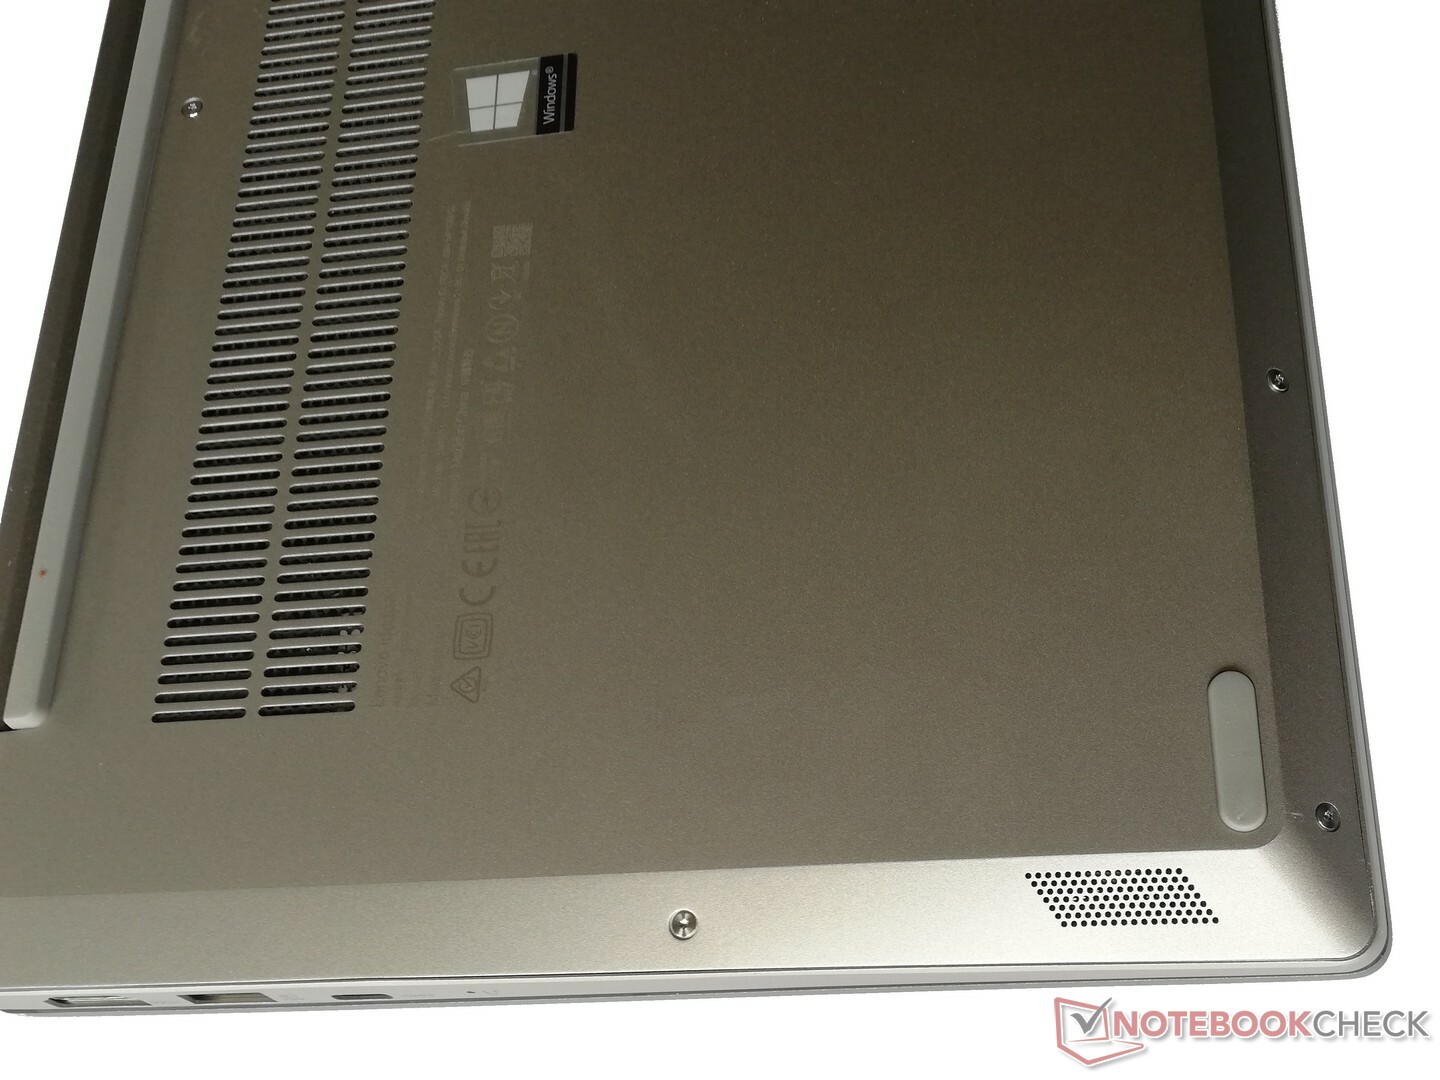
À l’issue de nos tests, on peut dire que le Lenovo IdeaPad S530 est un ultraportable puissant et nomade. Il possède suffisamment de ressources pour les logiciels de bureautique exigeants, et pour l’édition d’images light. Les possibilités de maintenance sont limitées, mais il est possible de nettoyer les ventilateurs et de remplacer le SSD.
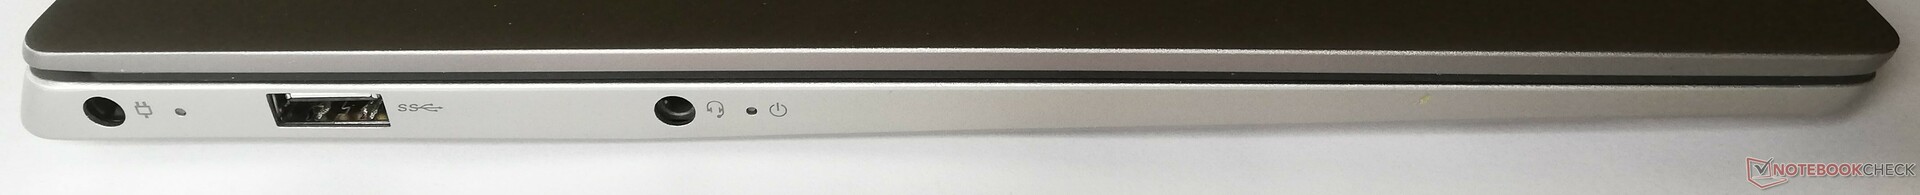
Le Lenovo IdeaPad S530 à bas prix propose de bonnes performances pour la bureautique, mais le nombre réduit de port doit être gardé à l’esprit.
Les utilisateurs devront également composer avec un écran sensible aux reflets, et avec un nombre limité de ports. Ce dernier problème peut être contourné avec des adaptateurs via les ports USB C Gen 2. Ceux qui peuvent accepter ces faiblesses et qui recherchent un PC portable léger et nomade pour la bureautique auront avec le Lenovo IdeaPad S530 un appareil puissant et réussi.
L’intégralité de cette critique est disponible en anglais en suivant ce lien.
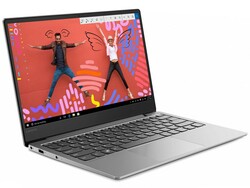
Lenovo Ideapad S530-13IWL
- 03/10/2019 v6 (old)
Mike Wobker