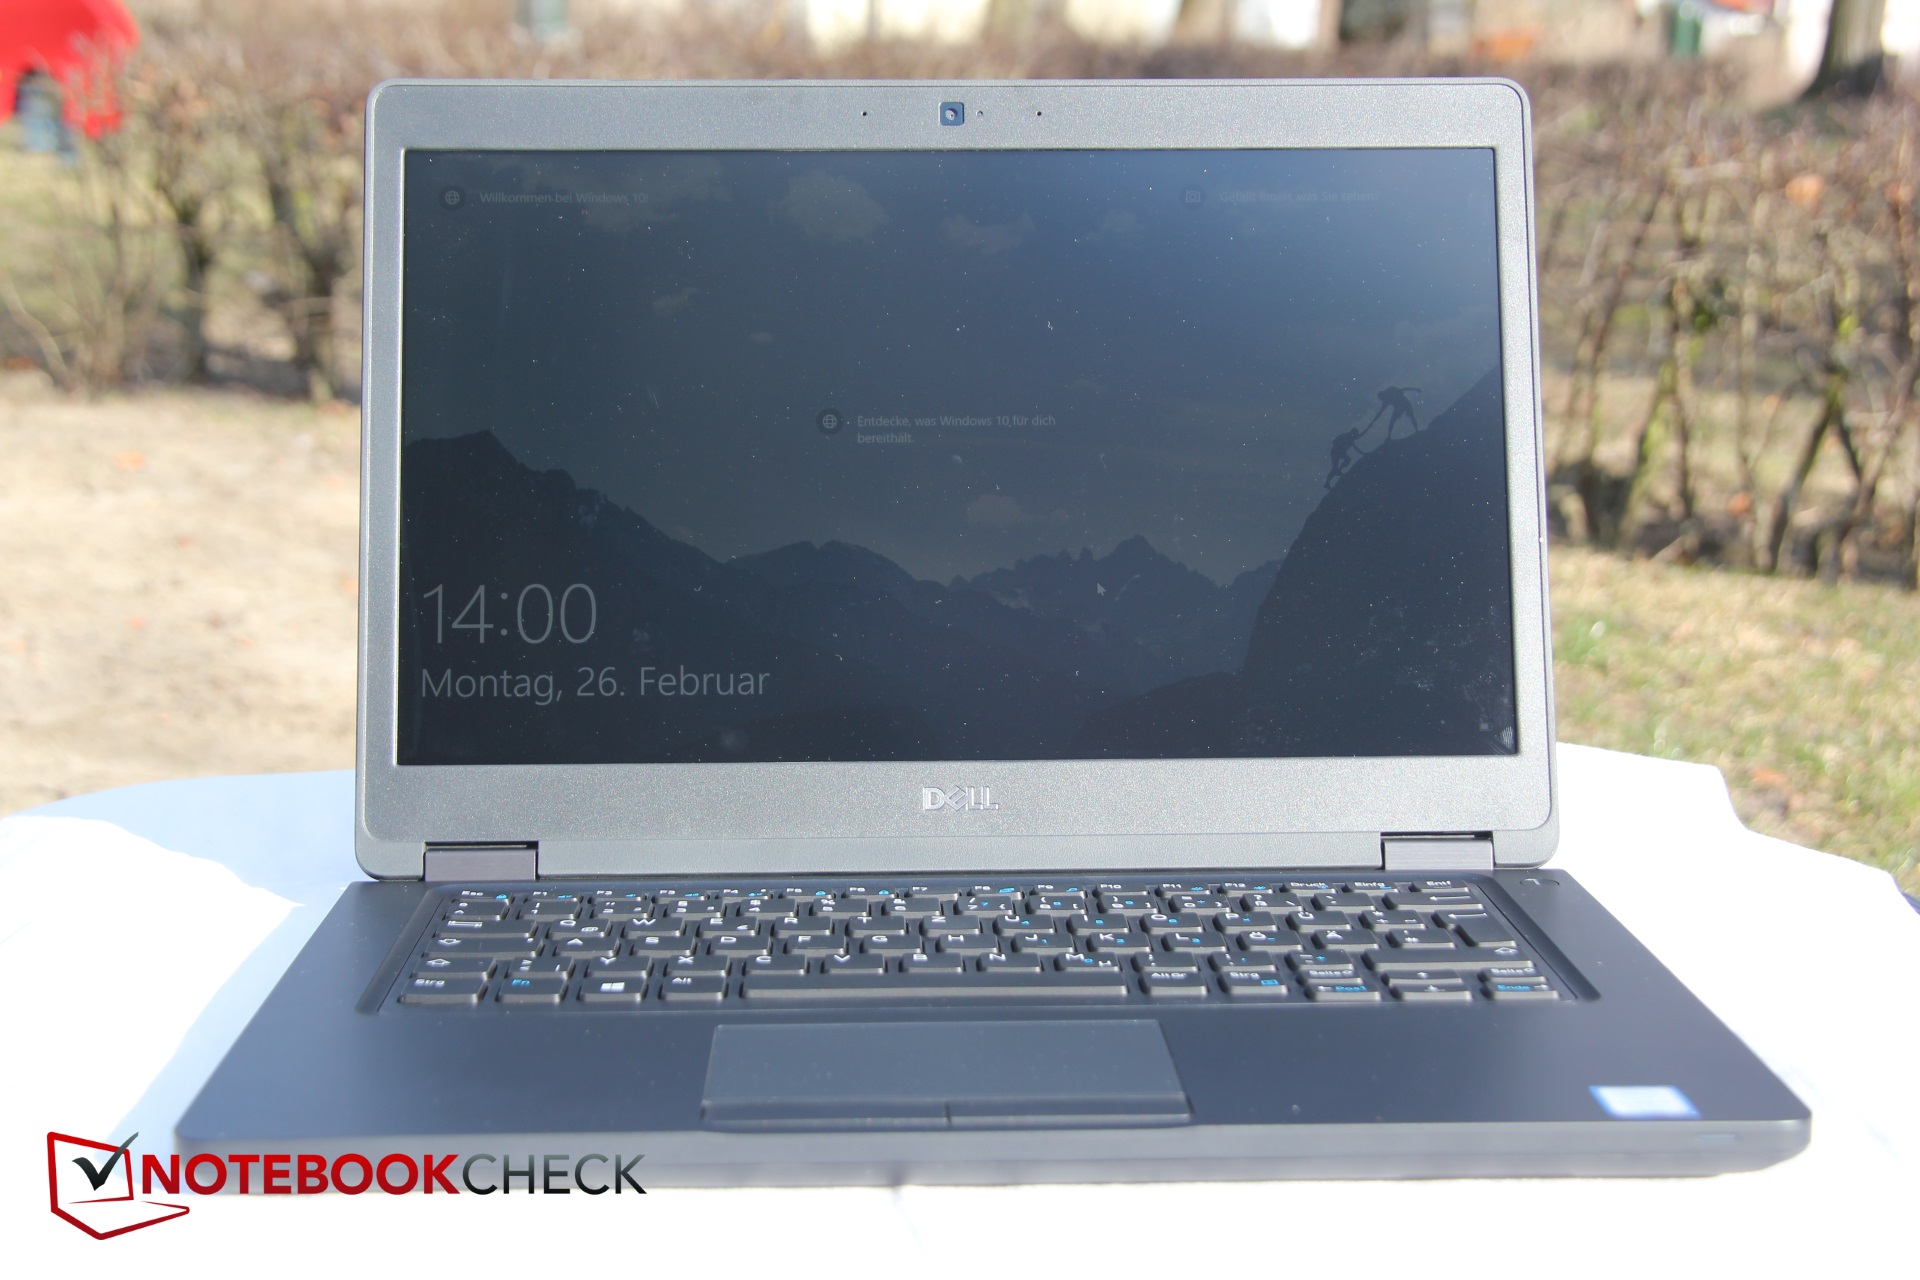
Courte critique du PC portable Dell Latitude 5490 (Core i7-8650U, écran tactile)
| BioShock Infinite | |
| 1280x720 Very Low Preset (Classer selon les valeurs) | |
| Dell Latitude 5490 | |
| HP EliteBook 840 G4-Z2V49ET ABD | |
| Lenovo ThinkPad T470-20HD002HGE | |
| 1366x768 Medium Preset (Classer selon les valeurs) | |
| Dell Latitude 5490 | |
| HP EliteBook 840 G4-Z2V49ET ABD | |
| Lenovo ThinkPad T470-20HD002HGE | |
| 1366x768 High Preset (Classer selon les valeurs) | |
| Dell Latitude 5490 | |
| HP EliteBook 840 G4-Z2V49ET ABD | |
| Lenovo ThinkPad T470-20HD002HGE | |
| 1920x1080 Ultra Preset, DX11 (DDOF) (Classer selon les valeurs) | |
| Dell Latitude 5490 | |
| HP EliteBook 840 G4-Z2V49ET ABD | |
| Lenovo ThinkPad T470-20HD002HGE | |
| SD Card Reader | |
| average JPG Copy Test (av. of 3 runs) | |
| Dell Latitude 5490-TD70X (Toshiba Exceria Pro SDXC 64 GB UHS-II) | |
| Dell Latitude 5490 (Toshiba Exceria Pro SDXC 64 GB UHS-II) | |
| Dell Latitude 5480 (Toshiba Exceria Pro SDXC 64 GB UHS-II) | |
| Lenovo ThinkPad T470-20HD002HGE (Toshiba Exceria Pro SDXC 64 GB UHS-II) | |
| HP EliteBook 840 G4-Z2V49ET ABD (Toshiba Exceria Pro SDXC 64 GB UHS-II) | |
| Moyenne de la classe Office (19.8 - 198.5, n=22, 2 dernières années) | |
| maximum AS SSD Seq Read Test (1GB) | |
| Dell Latitude 5480 (Toshiba Exceria Pro SDXC 64 GB UHS-II) | |
| Dell Latitude 5490-TD70X (Toshiba Exceria Pro SDXC 64 GB UHS-II) | |
| Dell Latitude 5490 (Toshiba Exceria Pro SDXC 64 GB UHS-II) | |
| Lenovo ThinkPad T470-20HD002HGE (Toshiba Exceria Pro SDXC 64 GB UHS-II) | |
| HP EliteBook 840 G4-Z2V49ET ABD (Toshiba Exceria Pro SDXC 64 GB UHS-II) | |
| Moyenne de la classe Office (27.4 - 249, n=21, 2 dernières années) | |
| Networking | |
| iperf3 transmit AX12 | |
| Dell Latitude 5490 | |
| Lenovo ThinkPad T470-20HD002HGE | |
| Dell Latitude 5490-TD70X | |
| HP EliteBook 840 G4-Z2V49ET ABD (jseb) | |
| Dell Latitude 5480 | |
| iperf3 receive AX12 | |
| Lenovo ThinkPad T470-20HD002HGE | |
| Dell Latitude 5490 | |
| Dell Latitude 5480 | |
| Dell Latitude 5490-TD70X | |
| HP EliteBook 840 G4-Z2V49ET ABD (jseb) | |
| |||||||||||||||||||||||||
Homogénéité de la luminosité: 87 %
Valeur mesurée au centre, sur batterie: 200.6 cd/m²
Contraste: 1254:1 (Valeurs des noirs: 0.16 cd/m²)
ΔE ColorChecker Calman: 8.36 | ∀{0.5-29.43 Ø4.73}
calibrated: 4.6
ΔE Greyscale Calman: 7.7 | ∀{0.09-98 Ø4.97}
54.2% sRGB (Argyll 1.6.3 3D)
34.5% AdobeRGB 1998 (Argyll 1.6.3 3D)
37.62% AdobeRGB 1998 (Argyll 3D)
54.6% sRGB (Argyll 3D)
36.42% Display P3 (Argyll 3D)
Gamma: 2.773
CCT: 6397 K
| Dell Latitude 5490 AUO133D, IPS, 14", 1920x1080 | Dell Latitude 5490-TD70X AU Optronics AUO263D, IPS, 14", 1920x1080 | Dell Latitude 5480 LG Philips LGD0553, IPS, 14", 1920x1080 | HP EliteBook 840 G4-Z2V49ET ABD AUO123D, TN, 14", 1920x1080 | Lenovo ThinkPad T480-20L6S01V00 Lenovo LP140WF6-SPB7, IPS, 14", 1920x1080 | Lenovo ThinkPad T470-20HD002HGE N140HCA-EAB, IPS, 14", 1920x1080 | |
|---|---|---|---|---|---|---|
| Display | 0% | 12% | 51% | 8% | 14% | |
| Display P3 Coverage (%) | 36.42 | 36.28 0% | 40.62 12% | 55.8 53% | 39.24 8% | 41.6 14% |
| sRGB Coverage (%) | 54.6 | 54.6 0% | 61.2 12% | 80.7 48% | 58.8 8% | 61.9 13% |
| AdobeRGB 1998 Coverage (%) | 37.62 | 37.48 0% | 41.96 12% | 57.7 53% | 40.56 8% | 43.06 14% |
| Response Times | -35% | -3% | -7% | -4% | -31% | |
| Response Time Grey 50% / Grey 80% * (ms) | 30.4 ? | 46.9 ? -54% | 32.8 ? -8% | 39 ? -28% | 35.6 ? -17% | 41.6 ? -37% |
| Response Time Black / White * (ms) | 27.2 ? | 31.2 ? -15% | 26.4 ? 3% | 23 ? 15% | 24.8 ? 9% | 34 ? -25% |
| PWM Frequency (Hz) | ||||||
| Screen | 11% | 11% | -28% | 14% | 11% | |
| Brightness middle (cd/m²) | 200.6 | 227 13% | 215.9 8% | 346 72% | 307 53% | 306 53% |
| Brightness (cd/m²) | 204 | 211 3% | 205 0% | 317 55% | 295 45% | 287 41% |
| Brightness Distribution (%) | 87 | 88 1% | 90 3% | 86 -1% | 90 3% | 88 1% |
| Black Level * (cd/m²) | 0.16 | 0.19 -19% | 0.22 -38% | 0.86 -438% | 0.25 -56% | 0.3 -88% |
| Contrast (:1) | 1254 | 1195 -5% | 981 -22% | 402 -68% | 1228 -2% | 1020 -19% |
| Colorchecker dE 2000 * | 8.36 | 5.6 33% | 5.1 39% | 8.64 -3% | 5.7 32% | 6.2 26% |
| Colorchecker dE 2000 max. * | 25.63 | 22.4 13% | 15.6 39% | 13.58 47% | 21.3 17% | 13.6 47% |
| Colorchecker dE 2000 calibrated * | 4.6 | 4.7 -2% | ||||
| Greyscale dE 2000 * | 7.7 | 2.4 69% | 4 48% | 11.24 -46% | 3.7 52% | 5.8 25% |
| Gamma | 2.773 79% | 2.44 90% | 2.41 91% | 2.62 84% | 2.11 104% | 2.04 108% |
| CCT | 6397 102% | 6506 100% | 6856 95% | 12530 52% | 7353 88% | 6277 104% |
| Color Space (Percent of AdobeRGB 1998) (%) | 34.5 | 34.5 0% | 41.96 22% | 52 51% | 37.4 8% | 39.62 15% |
| Color Space (Percent of sRGB) (%) | 54.2 | 54.4 0% | 61.15 13% | 80 48% | 58.7 8% | 61.44 13% |
| Moyenne finale (programmes/paramètres) | -8% /
3% | 7% /
10% | 5% /
-9% | 6% /
11% | -2% /
6% |
* ... Moindre est la valeur, meilleures sont les performances
Temps de réponse de l'écran
| ↔ Temps de réponse noir à blanc | ||
|---|---|---|
| 27.2 ms ... hausse ↗ et chute ↘ combinées | ↗ 16.4 ms hausse | 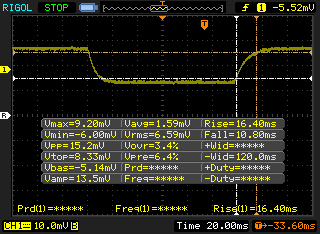 |
| ↘ 10.8 ms chute | ||
| L'écran souffre de latences relativement élevées, insuffisant pour le jeu. En comparaison, tous les appareils testés affichent entre 0.1 (minimum) et 240 (maximum) ms. » 69 % des appareils testés affichent de meilleures performances. Cela signifie que les latences relevées sont moins bonnes que la moyenne (19.9 ms) de tous les appareils testés. | ||
| ↔ Temps de réponse gris 50% à gris 80% | ||
| 30.4 ms ... hausse ↗ et chute ↘ combinées | ↗ 16.8 ms hausse | 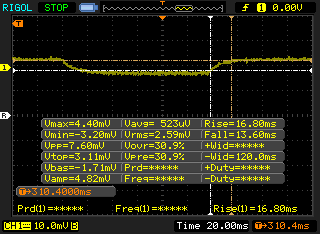 |
| ↘ 13.6 ms chute | ||
| L'écran souffre de latences très élevées, à éviter pour le jeu. En comparaison, tous les appareils testés affichent entre 0.165 (minimum) et 636 (maximum) ms. » 41 % des appareils testés affichent de meilleures performances. Cela signifie que les latences relevées sont similaires à la moyenne (31.1 ms) de tous les appareils testés. | ||
Scintillement / MLI (Modulation de largeur d'impulsion)
| Scintillement / MLI (Modulation de largeur d'impulsion) non décelé |  | ||
En comparaison, 52 % des appareils testés n'emploient pas MDI pour assombrir leur écran. Nous avons relevé une moyenne à 7791 (minimum : 5 - maximum : 343500) Hz dans le cas où une MDI était active. | |||
| Cinebench R15 | |
| CPU Single 64Bit | |
| Moyenne de la classe Office (99.5 - 312, n=75, 2 dernières années) | |
| Dell Latitude 5490 | |
| Moyenne Intel Core i7-8650U (128 - 178, n=17) | |
| Dell Latitude 5480 | |
| Lenovo ThinkPad T480-20L6S01V00 | |
| Dell Latitude 5490-TD70X | |
| Lenovo ThinkPad T470-20HD002HGE | |
| HP EliteBook 840 G4-Z2V49ET ABD | |
| CPU Multi 64Bit | |
| Moyenne de la classe Office (250 - 3380, n=75, 2 dernières années) | |
| Dell Latitude 5490 | |
| Lenovo ThinkPad T480-20L6S01V00 | |
| Dell Latitude 5490-TD70X | |
| Moyenne Intel Core i7-8650U (451 - 675, n=19) | |
| Dell Latitude 5480 | |
| HP EliteBook 840 G4-Z2V49ET ABD | |
| Lenovo ThinkPad T470-20HD002HGE | |
| wPrime 2.10 - 1024m | |
| Dell Latitude 5480 | |
| Moyenne de la classe Office (274 - 675, n=7, 2 dernières années) | |
| Dell Latitude 5490-TD70X | |
| Dell Latitude 5490 | |
| Moyenne Intel Core i7-8650U (268 - 335, n=3) | |
* ... Moindre est la valeur, meilleures sont les performances
| PCMark 8 | |
| Home Score Accelerated v2 | |
| Moyenne de la classe Office (n=12 dernières années) | |
| Dell Latitude 5490 | |
| Dell Latitude 5480 | |
| Moyenne Intel Core i7-8650U, Intel UHD Graphics 620 (3216 - 4103, n=10) | |
| Dell Latitude 5490-TD70X | |
| Lenovo ThinkPad T480-20L6S01V00 | |
| Lenovo ThinkPad T470-20HD002HGE | |
| HP EliteBook 840 G4-Z2V49ET ABD | |
| Work Score Accelerated v2 | |
| Moyenne de la classe Office (n=12 dernières années) | |
| Dell Latitude 5490 | |
| Lenovo ThinkPad T480-20L6S01V00 | |
| Dell Latitude 5480 | |
| Moyenne Intel Core i7-8650U, Intel UHD Graphics 620 (3926 - 5200, n=8) | |
| Dell Latitude 5490-TD70X | |
| Lenovo ThinkPad T470-20HD002HGE | |
| HP EliteBook 840 G4-Z2V49ET ABD | |
| Creative Score Accelerated v2 | |
| Dell Latitude 5490 | |
| Dell Latitude 5480 | |
| Moyenne Intel Core i7-8650U, Intel UHD Graphics 620 (4454 - 5225, n=6) | |
| HP EliteBook 840 G4-Z2V49ET ABD | |
| Lenovo ThinkPad T470-20HD002HGE | |
| PCMark 8 Home Score Accelerated v2 | 4065 points | |
| PCMark 8 Creative Score Accelerated v2 | 5225 points | |
| PCMark 8 Work Score Accelerated v2 | 5200 points | |
| PCMark 10 Score | 4066 points | |
Aide | ||
| Dell Latitude 5490 Samsung PM961 MZVLW256HEHP | Dell Latitude 5490-TD70X Toshiba KSG60ZMV512G | HP EliteBook 840 G4-Z2V49ET ABD Samsung PM961 MZVLW256HEHP | Lenovo ThinkPad T480-20L6S01V00 Samsung SSD PM981 MZVLB512HAJQ | Moyenne Samsung PM961 MZVLW256HEHP | |
|---|---|---|---|---|---|
| AS SSD | -20% | 64% | -457% | -33% | |
| Copy Game MB/s (MB/s) | 273.6 | 505 85% | 355.1 30% | 676 147% | 537 ? 96% |
| Copy Program MB/s (MB/s) | 214 | 213 0% | 269.7 26% | 254.8 19% | 343 ? 60% |
| Copy ISO MB/s (MB/s) | 514 | 426.6 -17% | 735 43% | 921 79% | 1004 ? 95% |
| Score Total (Points) | 1834 | 1067 -42% | 3006 64% | 2348 28% | 2565 ? 40% |
| Score Write (Points) | 449 | 381 -15% | 767 71% | 147 -67% | 587 ? 31% |
| Score Read (Points) | 916 | 455 -50% | 1524 66% | 1480 62% | 1378 ? 50% |
| Access Time Write * (ms) | 0.037 | 0.052 -41% | 0.027 27% | 2.515 -6697% | 0.4637 ? -1153% |
| Access Time Read * (ms) | 0.067 | 0.07 -4% | 0.044 34% | 0.041 39% | 0.06777 ? -1% |
| 4K-64 Write (MB/s) | 300.9 | 259.5 -14% | 510 69% | 96.2 -68% | 419 ? 39% |
| 4K-64 Read (MB/s) | 793 | 383.6 -52% | 1215 53% | 1278 61% | 1112 ? 40% |
| 4K Write (MB/s) | 93.6 | 91.7 -2% | 140.2 50% | 1.76 -98% | 91.6 ? -2% |
| 4K Read (MB/s) | 45.99 | 23.75 -48% | 49.21 7% | 58 26% | 45.1 ? -2% |
| Seq Write (MB/s) | 541 | 300.6 -44% | 1167 116% | 487.1 -10% | 960 ? 77% |
| Seq Read (MB/s) | 768 | 473.1 -38% | 2603 239% | 1441 88% | 2019 ? 163% |
* ... Moindre est la valeur, meilleures sont les performances

| 3DMark 11 | |
| 1280x720 Performance GPU | |
| Moyenne de la classe Office (2551 - 18313, n=68, 2 dernières années) | |
| Lenovo ThinkPad T480-20L6S01V00 | |
| Dell Latitude 5490 | |
| Moyenne Intel UHD Graphics 620 (1144 - 3432, n=244) | |
| Dell Latitude 5480 | |
| Dell Latitude 5490-TD70X | |
| Lenovo ThinkPad T470-20HD002HGE | |
| HP EliteBook 840 G4-Z2V49ET ABD | |
| 1280x720 Performance Combined | |
| Moyenne de la classe Office (2054 - 16787, n=68, 2 dernières années) | |
| Lenovo ThinkPad T480-20L6S01V00 | |
| Dell Latitude 5490 | |
| Moyenne Intel UHD Graphics 620 (927 - 2505, n=244) | |
| Dell Latitude 5480 | |
| Dell Latitude 5490-TD70X | |
| Lenovo ThinkPad T470-20HD002HGE | |
| HP EliteBook 840 G4-Z2V49ET ABD | |
| 3DMark | |
| 1280x720 Cloud Gate Standard Graphics | |
| Moyenne de la classe Office (11640 - 118515, n=37, 2 dernières années) | |
| Lenovo ThinkPad T480-20L6S01V00 | |
| Dell Latitude 5490 | |
| Moyenne Intel UHD Graphics 620 (6205 - 16400, n=225) | |
| Dell Latitude 5480 | |
| Dell Latitude 5490-TD70X | |
| HP EliteBook 840 G4-Z2V49ET ABD | |
| Lenovo ThinkPad T470-20HD002HGE | |
| 1920x1080 Fire Strike Graphics | |
| Moyenne de la classe Office (736 - 21871, n=72, 2 dernières années) | |
| Lenovo ThinkPad T480-20L6S01V00 | |
| Moyenne Intel UHD Graphics 620 (557 - 2608, n=213) | |
| Dell Latitude 5490 | |
| Dell Latitude 5480 | |
| Dell Latitude 5490-TD70X | |
| Lenovo ThinkPad T470-20HD002HGE | |
| HP EliteBook 840 G4-Z2V49ET ABD | |
| 3DMark 06 Standard Score | 11732 points | |
| 3DMark 11 Performance | 1989 points | |
| 3DMark Cloud Gate Standard Score | 8914 points | |
| 3DMark Fire Strike Score | 1062 points | |
Aide | ||
| BioShock Infinite | |
| 1280x720 Very Low Preset (Classer selon les valeurs) | |
| Dell Latitude 5490 | |
| HP EliteBook 840 G4-Z2V49ET ABD | |
| Lenovo ThinkPad T470-20HD002HGE | |
| Moyenne Intel UHD Graphics 620 (18.3 - 90.2, n=187) | |
| 1366x768 Medium Preset (Classer selon les valeurs) | |
| Dell Latitude 5490 | |
| HP EliteBook 840 G4-Z2V49ET ABD | |
| Lenovo ThinkPad T470-20HD002HGE | |
| Moyenne Intel UHD Graphics 620 (11.5 - 45.5, n=187) | |
| 1366x768 High Preset (Classer selon les valeurs) | |
| Dell Latitude 5490 | |
| HP EliteBook 840 G4-Z2V49ET ABD | |
| Lenovo ThinkPad T470-20HD002HGE | |
| Moyenne Intel UHD Graphics 620 (8.1 - 35.9, n=187) | |
| 1920x1080 Ultra Preset, DX11 (DDOF) (Classer selon les valeurs) | |
| Dell Latitude 5490 | |
| HP EliteBook 840 G4-Z2V49ET ABD | |
| Lenovo ThinkPad T470-20HD002HGE | |
| Moyenne Intel UHD Graphics 620 (4.5 - 17, n=176) | |
| Bas | Moyen | Élevé | Ultra | |
|---|---|---|---|---|
| BioShock Infinite (2013) | 64 | 35 | 29 | 10 |
Degré de la nuisance sonore
| Au repos |
| 27.8 / 27.8 / 31 dB(A) |
| Fortement sollicité |
| 34.2 / 42.7 dB(A) |
 | ||
30 dB silencieux 40 dB(A) audible 50 dB(A) bruyant |
||
min: | ||
| Dell Latitude 5490 UHD Graphics 620, i7-8650U, Samsung PM961 MZVLW256HEHP | Dell Latitude 5490-TD70X UHD Graphics 620, i5-8350U, Toshiba KSG60ZMV512G | Dell Latitude 5480 HD Graphics 620, i7-7600U, Toshiba SG5 256GB THNSNK256GVN8 | HP EliteBook 840 G4-Z2V49ET ABD HD Graphics 620, i5-7200U, Samsung PM961 MZVLW256HEHP | Lenovo ThinkPad T480-20L6S01V00 GeForce MX150, i5-8550U, Samsung SSD PM981 MZVLB512HAJQ | Lenovo ThinkPad T470-20HD002HGE HD Graphics 620, i5-7200U, Samsung PM961 NVMe MZVLW512HMJP | |
|---|---|---|---|---|---|---|
| Noise | -2% | -8% | -2% | 1% | 5% | |
| arrêt / environnement * (dB) | 27.8 | 28.8 -4% | 31 -12% | 29 -4% | 28 -1% | |
| Idle Minimum * (dB) | 27.8 | 28.8 -4% | 29.6 -6% | 31 -12% | 29 -4% | 28 -1% |
| Idle Average * (dB) | 27.8 | 28.8 -4% | 29.6 -6% | 31 -12% | 29 -4% | 28 -1% |
| Idle Maximum * (dB) | 31 | 30.9 -0% | 29.6 5% | 31 -0% | 29 6% | 29.4 5% |
| Load Average * (dB) | 34.2 | 35.6 -4% | 42 -23% | 33.5 2% | 35.6 -4% | 31.4 8% |
| Load Maximum * (dB) | 42.7 | 41.4 3% | 47.1 -10% | 33.7 21% | 35.6 17% | 34.6 19% |
| Witcher 3 ultra * (dB) | 32.5 |
* ... Moindre est la valeur, meilleures sont les performances
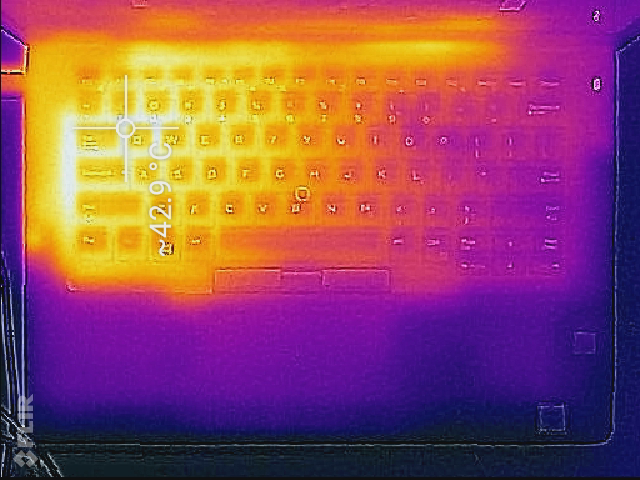
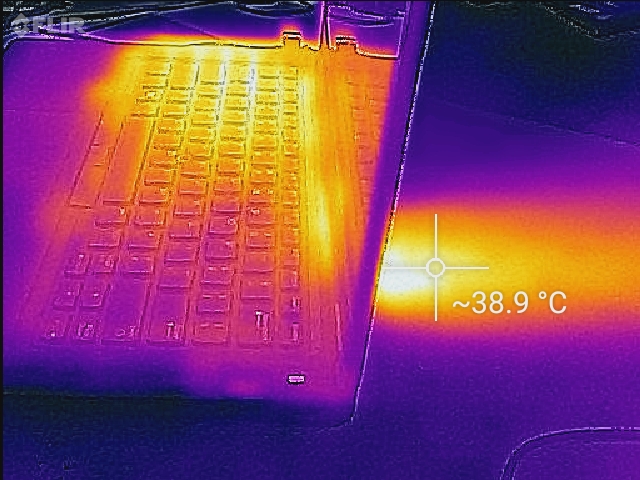
(±) La température maximale du côté supérieur est de 43.4 °C / 110 F, par rapport à la moyenne de 34.3 °C / 94 F, allant de 21.2 à 62.5 °C pour la classe Office.
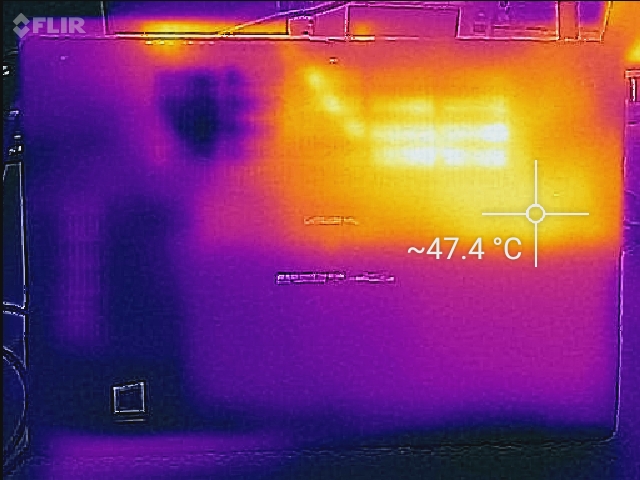
(-) Le fond chauffe jusqu'à un maximum de 47.8 °C / 118 F, contre une moyenne de 36.8 °C / 98 F
(+) En utilisation inactive, la température moyenne du côté supérieur est de 26.3 °C / 79 F, par rapport à la moyenne du dispositif de 29.5 °C / 85 F.
(+) Les repose-poignets et le pavé tactile sont plus froids que la température de la peau avec un maximum de 28.2 °C / 82.8 F et sont donc froids au toucher.
(±) La température moyenne de la zone de l'appui-paume de dispositifs similaires était de 27.5 °C / 81.5 F (-0.7 °C / #-1.3 F).
Dell Latitude 5490 analyse audio
(±) | le niveau sonore du haut-parleur est moyen mais bon (78.3# dB)
Basses 100 - 315 Hz
(-) | presque aucune basse - en moyenne 15.5% plus bas que la médiane
(±) | la linéarité des basses est moyenne (9.3% delta à la fréquence précédente)
Médiums 400 - 2000 Hz
(+) | médiane équilibrée - seulement 3.9% de la médiane
(±) | la linéarité des médiums est moyenne (9.5% delta à la fréquence précédente)
Aiguës 2 - 16 kHz
(+) | des sommets équilibrés - à seulement 1.5% de la médiane
(+) | les aigus sont linéaires (1.7% delta à la fréquence précédente)
Globalement 100 - 16 000 Hz
(±) | la linéarité du son global est moyenne (17.4% de différence avec la médiane)
Par rapport à la même classe
» 26% de tous les appareils testés de cette catégorie étaient meilleurs, 7% similaires, 67% pires
» Le meilleur avait un delta de 7%, la moyenne était de 21%, le pire était de 53%.
Par rapport à tous les appareils testés
» 33% de tous les appareils testés étaient meilleurs, 8% similaires, 59% pires
» Le meilleur avait un delta de 4%, la moyenne était de 24%, le pire était de 134%.
Lenovo ThinkPad T470-20HD002HGE analyse audio
(±) | le niveau sonore du haut-parleur est moyen mais bon (80.4# dB)
Basses 100 - 315 Hz
(-) | presque aucune basse - en moyenne 16.6% plus bas que la médiane
(±) | la linéarité des basses est moyenne (8.8% delta à la fréquence précédente)
Médiums 400 - 2000 Hz
(+) | médiane équilibrée - seulement 4.3% de la médiane
(+) | les médiums sont linéaires (6.7% delta à la fréquence précédente)
Aiguës 2 - 16 kHz
(±) | sommets plus élevés - en moyenne 5.4% plus élevés que la médiane
(±) | la linéarité des aigus est moyenne (13.3% delta à la fréquence précédente)
Globalement 100 - 16 000 Hz
(±) | la linéarité du son global est moyenne (18.7% de différence avec la médiane)
Par rapport à la même classe
» 34% de tous les appareils testés de cette catégorie étaient meilleurs, 7% similaires, 59% pires
» Le meilleur avait un delta de 7%, la moyenne était de 21%, le pire était de 53%.
Par rapport à tous les appareils testés
» 43% de tous les appareils testés étaient meilleurs, 8% similaires, 50% pires
» Le meilleur avait un delta de 4%, la moyenne était de 24%, le pire était de 134%.
| Éteint/en veille | |
| Au repos | |
| Fortement sollicité |
|
Légende:
min: | |
| Dell Latitude 5490 i7-8650U, UHD Graphics 620, Samsung PM961 MZVLW256HEHP, IPS, 1920x1080, 14" | Dell Latitude 5490-TD70X i5-8350U, UHD Graphics 620, Toshiba KSG60ZMV512G, IPS, 1920x1080, 14" | Dell Latitude 5480 i7-7600U, HD Graphics 620, Toshiba SG5 256GB THNSNK256GVN8, IPS, 1920x1080, 14" | HP EliteBook 840 G4-Z2V49ET ABD i5-7200U, HD Graphics 620, Samsung PM961 MZVLW256HEHP, TN, 1920x1080, 14" | Lenovo ThinkPad T470-20HD002HGE i5-7200U, HD Graphics 620, Samsung PM961 NVMe MZVLW512HMJP, IPS, 1920x1080, 14" | |
|---|---|---|---|---|---|
| Power Consumption | 0% | -3% | 19% | 19% | |
| Idle Minimum * (Watt) | 3.9 | 3.3 15% | 6.64 -70% | 2.9 26% | 3.21 18% |
| Idle Average * (Watt) | 6.2 | 5.54 11% | 6.67 -8% | 5.6 10% | 6.15 1% |
| Idle Maximum * (Watt) | 7.7 | 6.59 14% | 7.78 -1% | 8.15 -6% | 6.82 11% |
| Load Average * (Watt) | 43.9 | 42.4 3% | 30.83 30% | 30.6 30% | 28.5 35% |
| Load Maximum * (Watt) | 47.7 | 67.6 -42% | 31.7 34% | 31 35% | 34.5 28% |
* ... Moindre est la valeur, meilleures sont les performances
| Dell Latitude 5490 i7-8650U, UHD Graphics 620, 68 Wh | Dell Latitude 5490-TD70X i5-8350U, UHD Graphics 620, 68 Wh | Dell Latitude 5480 i7-7600U, HD Graphics 620, 68 Wh | HP EliteBook 840 G4-Z2V49ET ABD i5-7200U, HD Graphics 620, 51 Wh | Lenovo ThinkPad T470-20HD002HGE i5-7200U, HD Graphics 620, 48 Wh | |
|---|---|---|---|---|---|
| Autonomie de la batterie | 29% | 39% | -18% | -37% | |
| WiFi v1.3 (h) | 11.6 | 15 29% | 16.1 39% | 9.5 -18% | 7.3 -37% |
| Reader / Idle (h) | 25.9 | 24.1 | 19.3 | ||
| Load (h) | 1.6 | 2.7 | 3.1 | 1.8 |
Points positifs
Points négatifs

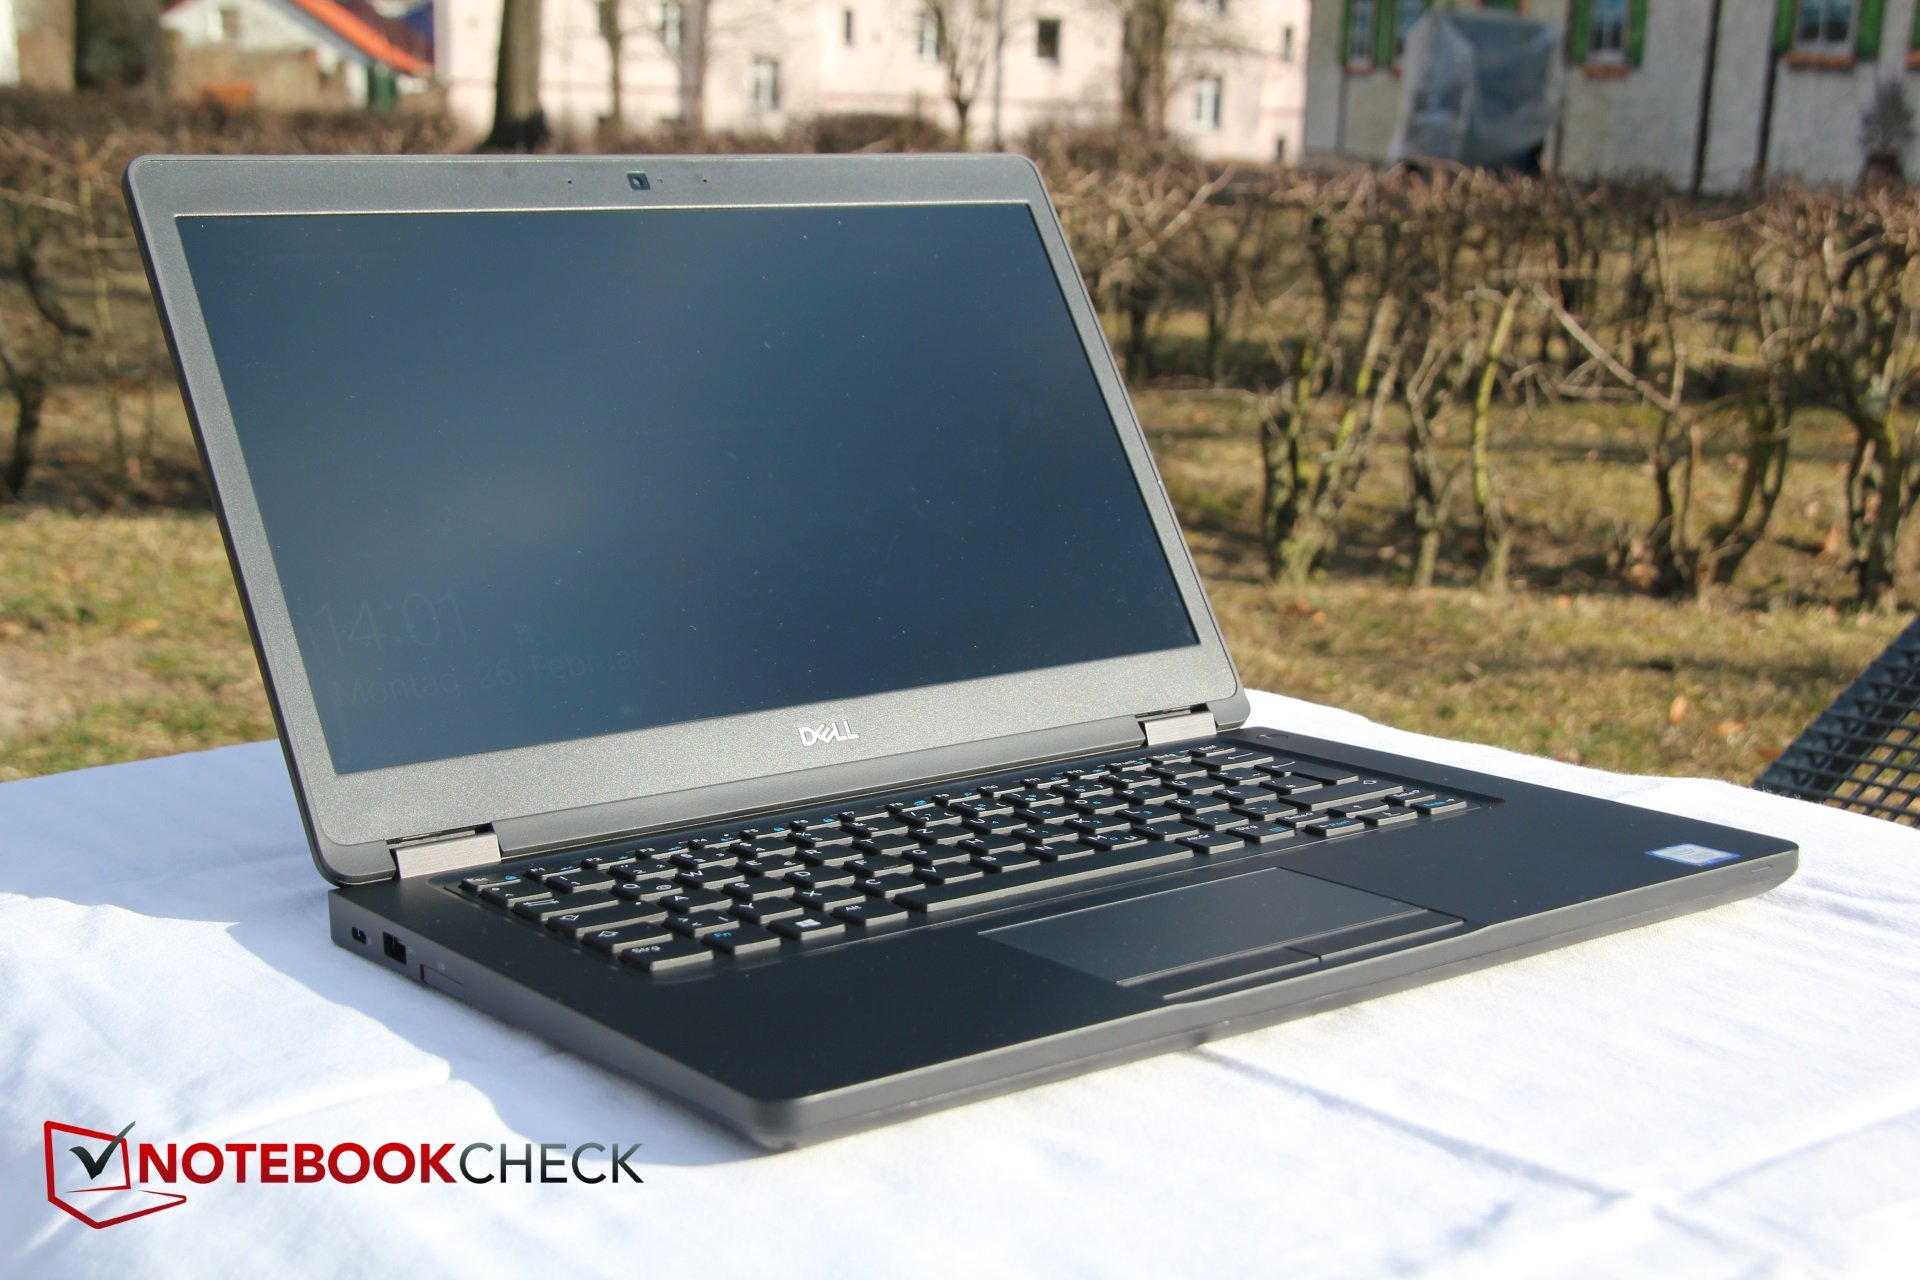
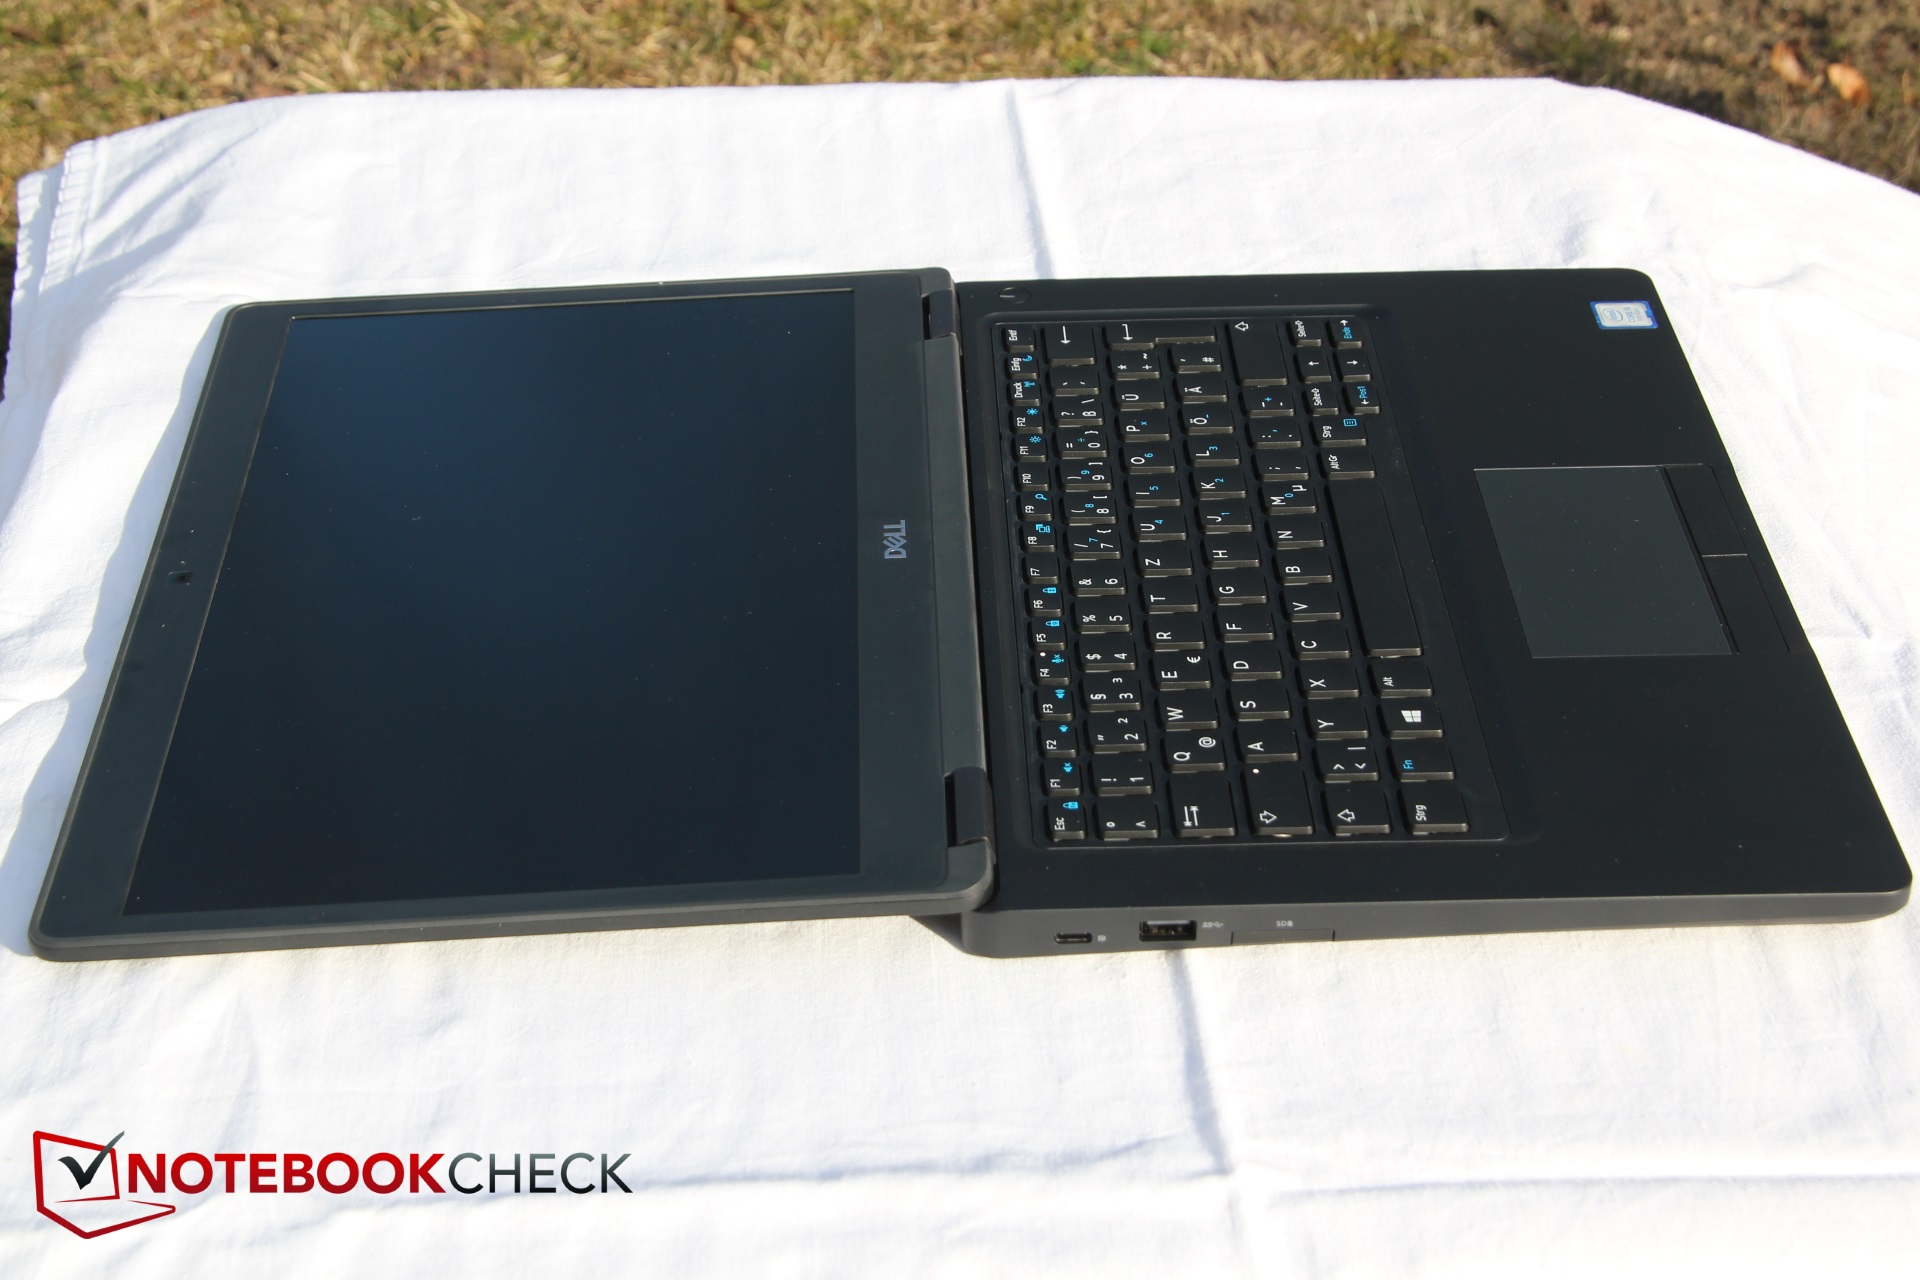
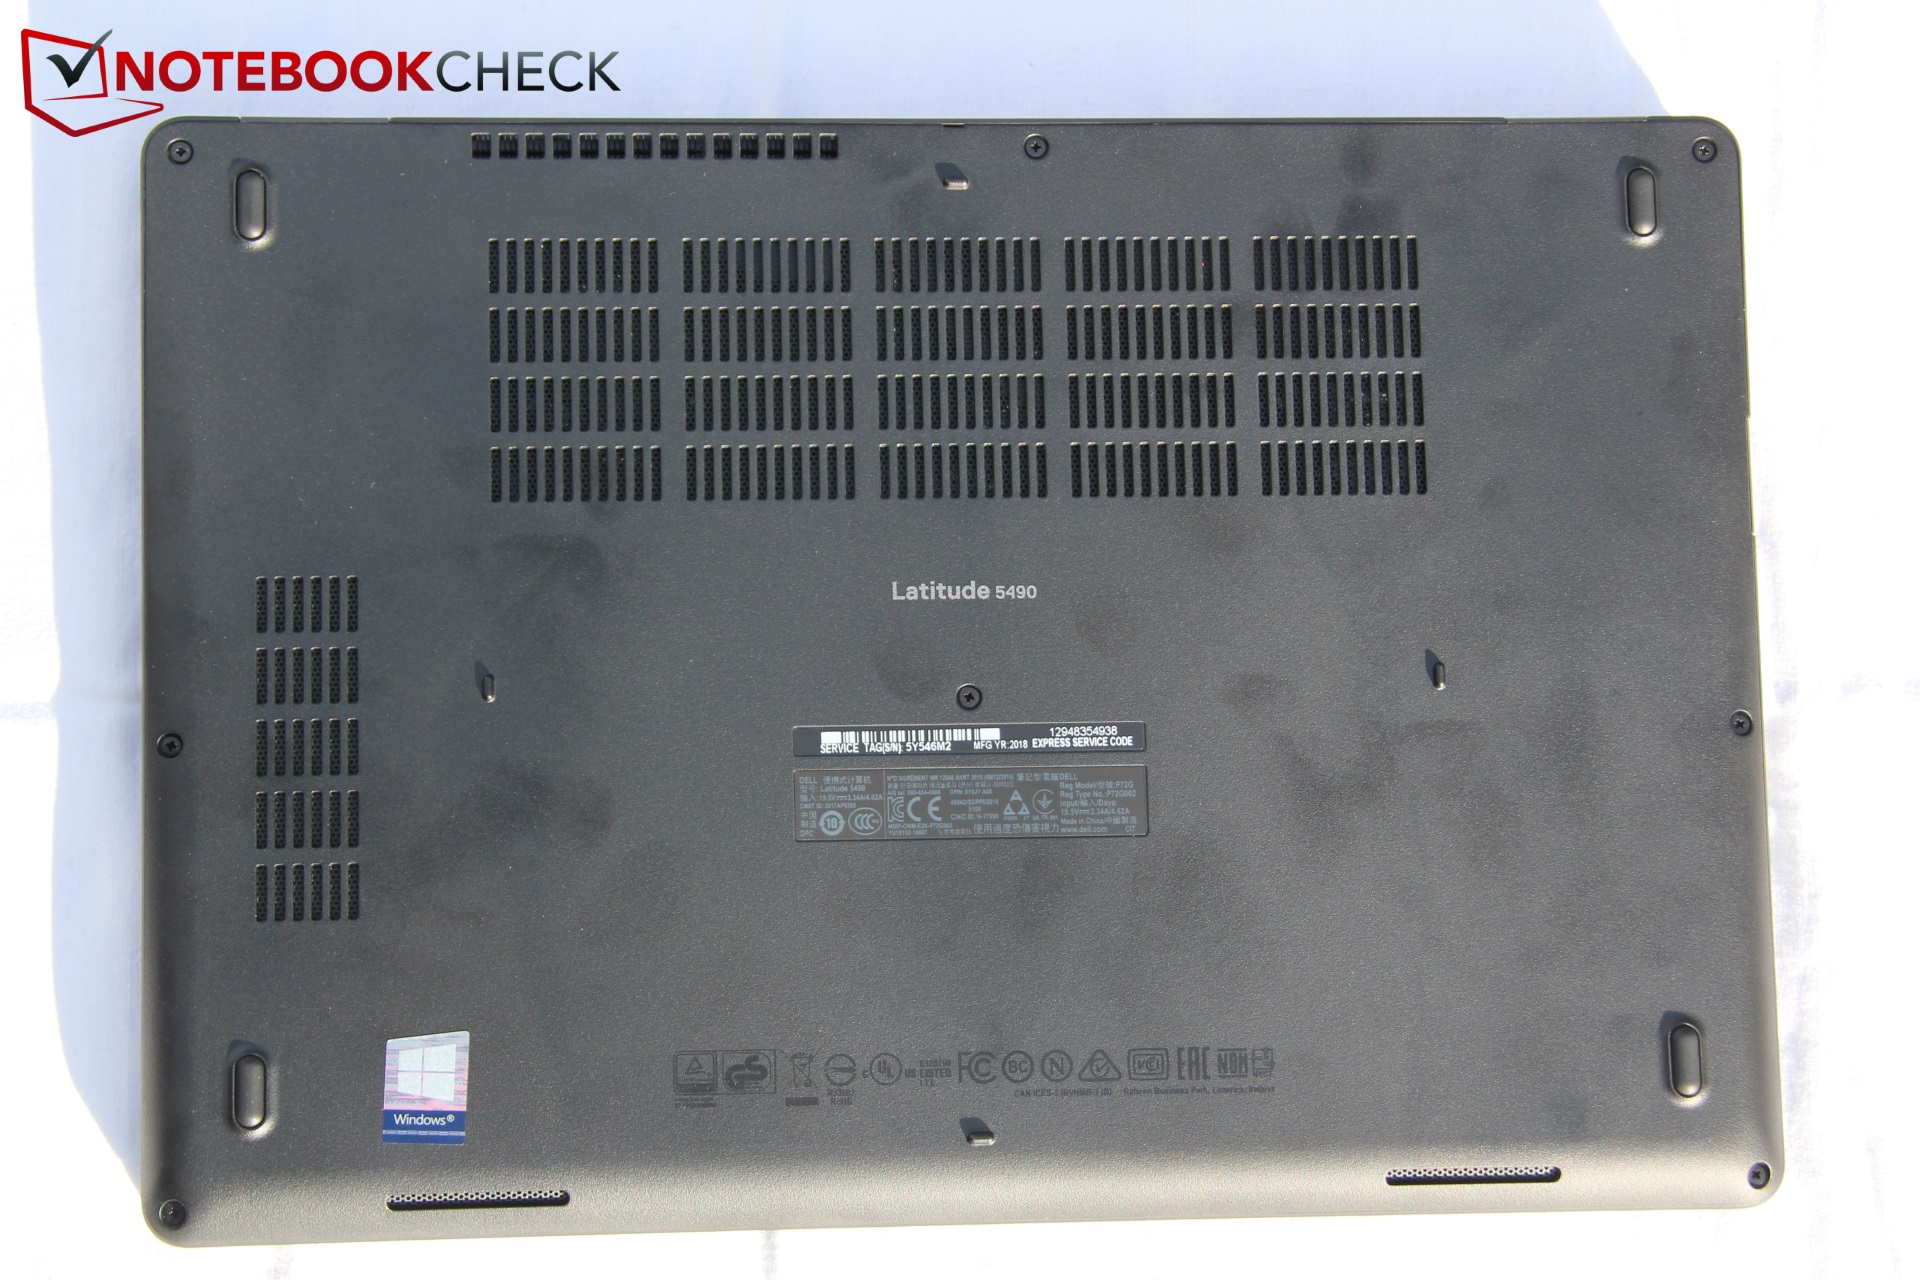
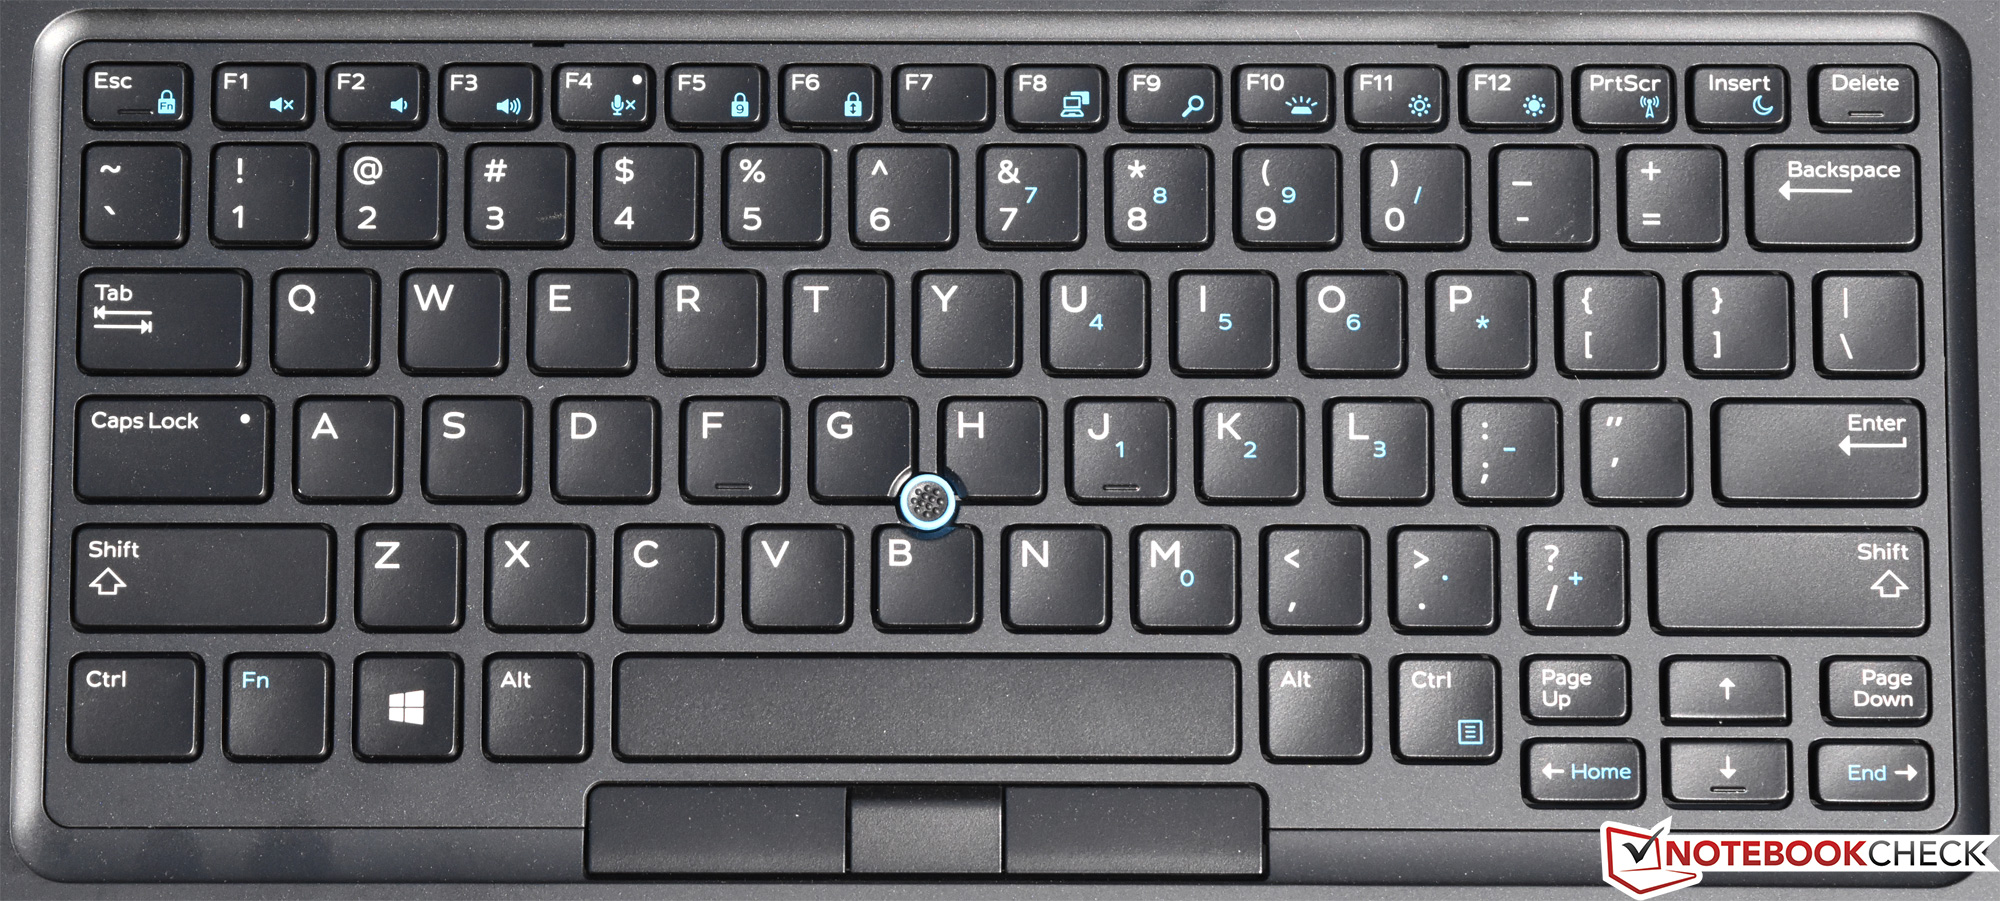
Le Latitude 5490 est une machine sans fioritures, centrée sur la productivité. Il est performant, son châssis est robuste, ses ports abondants, ses périphériques d’entrée excellents, et son autonomie exceptionnellement bonne. Il est également très silencieux et discret en utilisation classique - ce qui le rend bien adapté au contexte professionnel. Les avantages de cette configuration à 1 888 $ par rapport à la version que nous avons évalué en mars, sont des performances simple cœur bien plus élevées et multi cœur légèrement meilleures, un SSD NVMe plus performant, plus de fonctionnalités de sécurité, un clavier rétroéclairé, et un écran tactile. Tous ces éléments sont appréciables, mis à part l’écran tactile qui empire un écran déjà mauvais, en transformant cette dalle sombre antireflet et blafarde en une dalle brillante blafarde et ultra réfléchissante parfois presque inutilisable. Nous l’avions déjà dit, le 5490 a désespérément besoin d’un écran plus lumineux avec une finition anti-reflet.
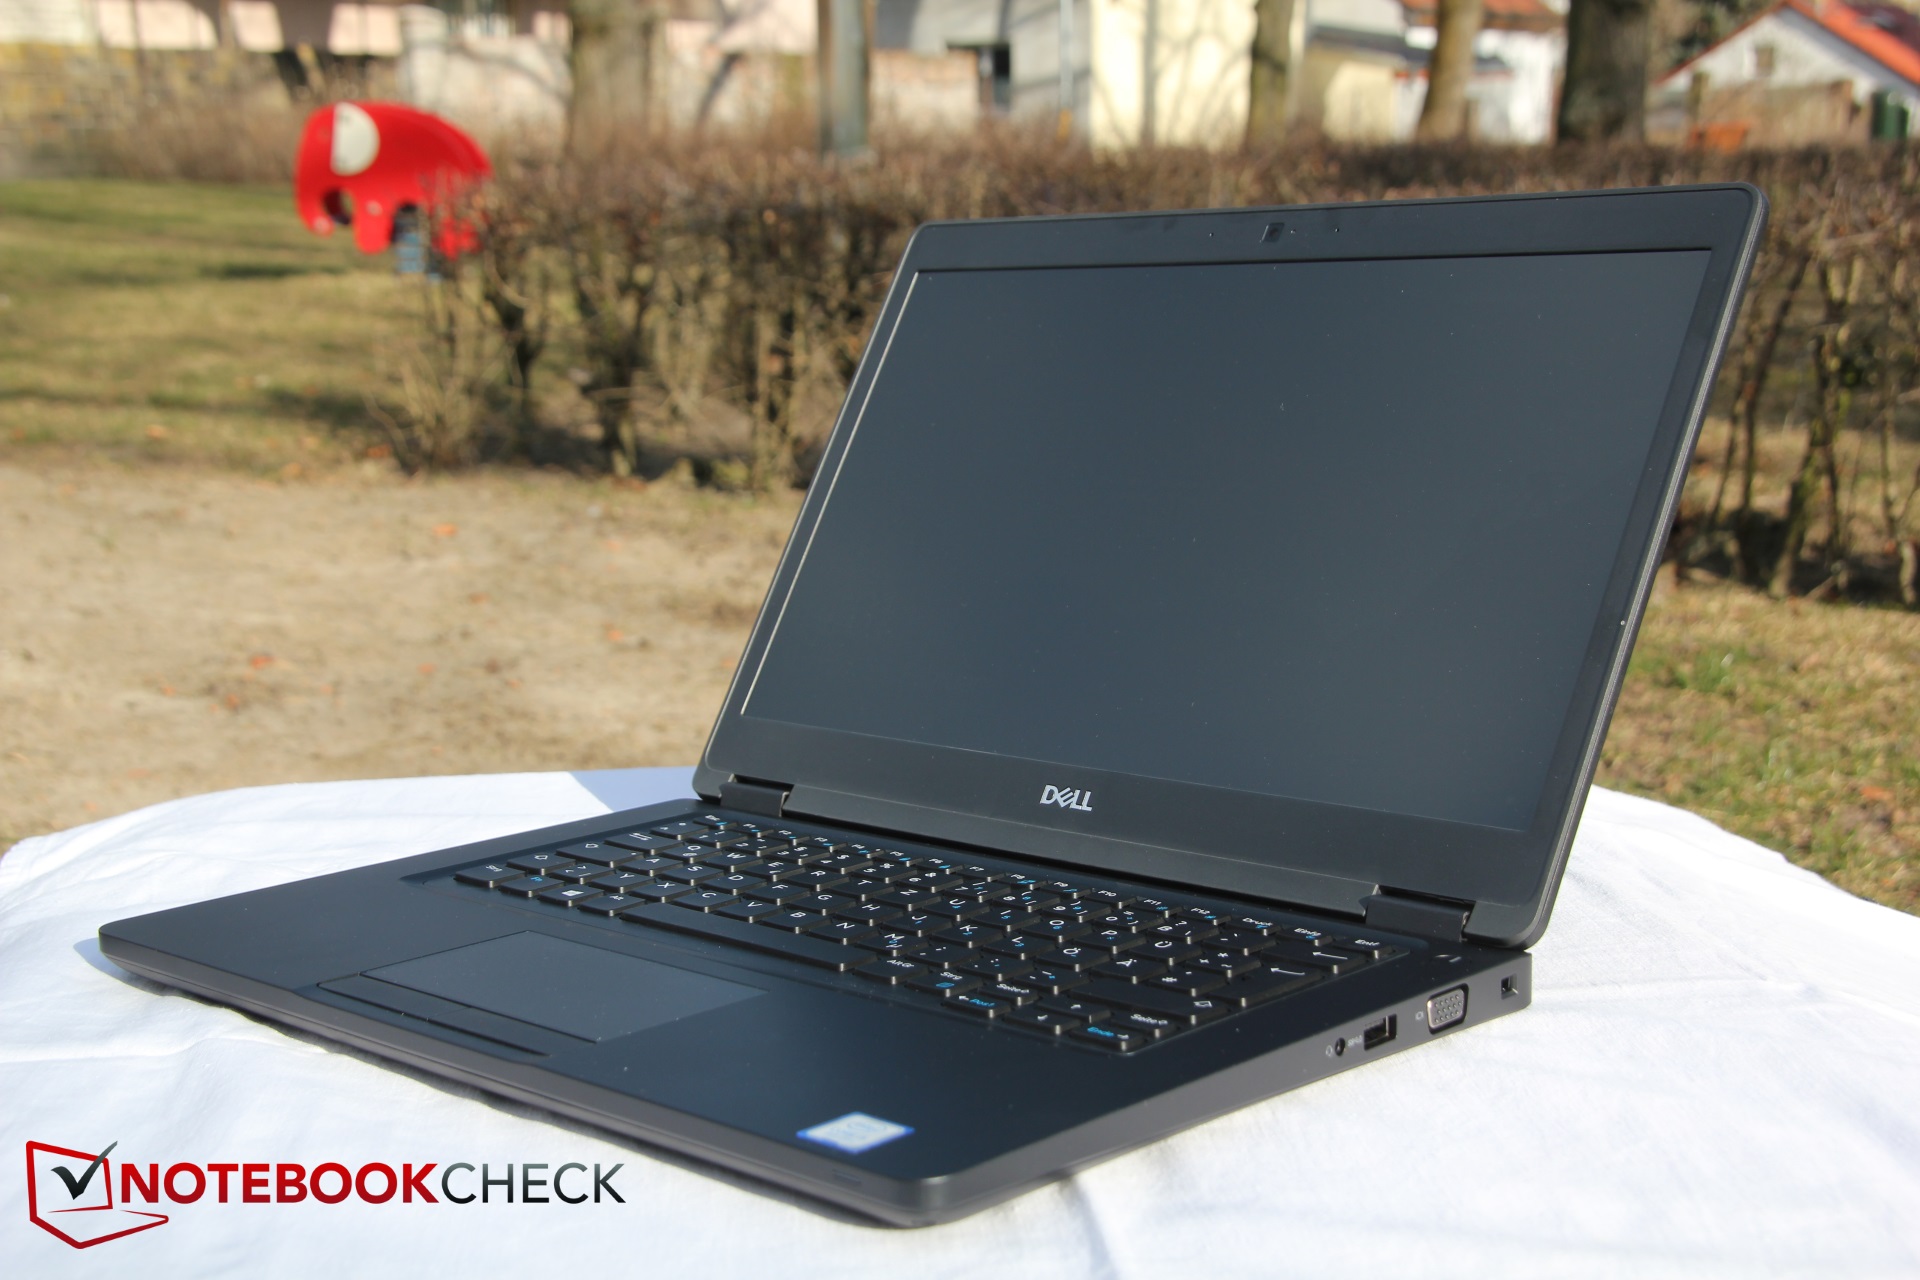
Aucune machine n’est parfaite, mais en termes de performances et d’autonomie, le Latitude 5490 possède peu de concurrents. Si seulement son écran était meilleur, nous aurions pu le recommander de tout cœur.
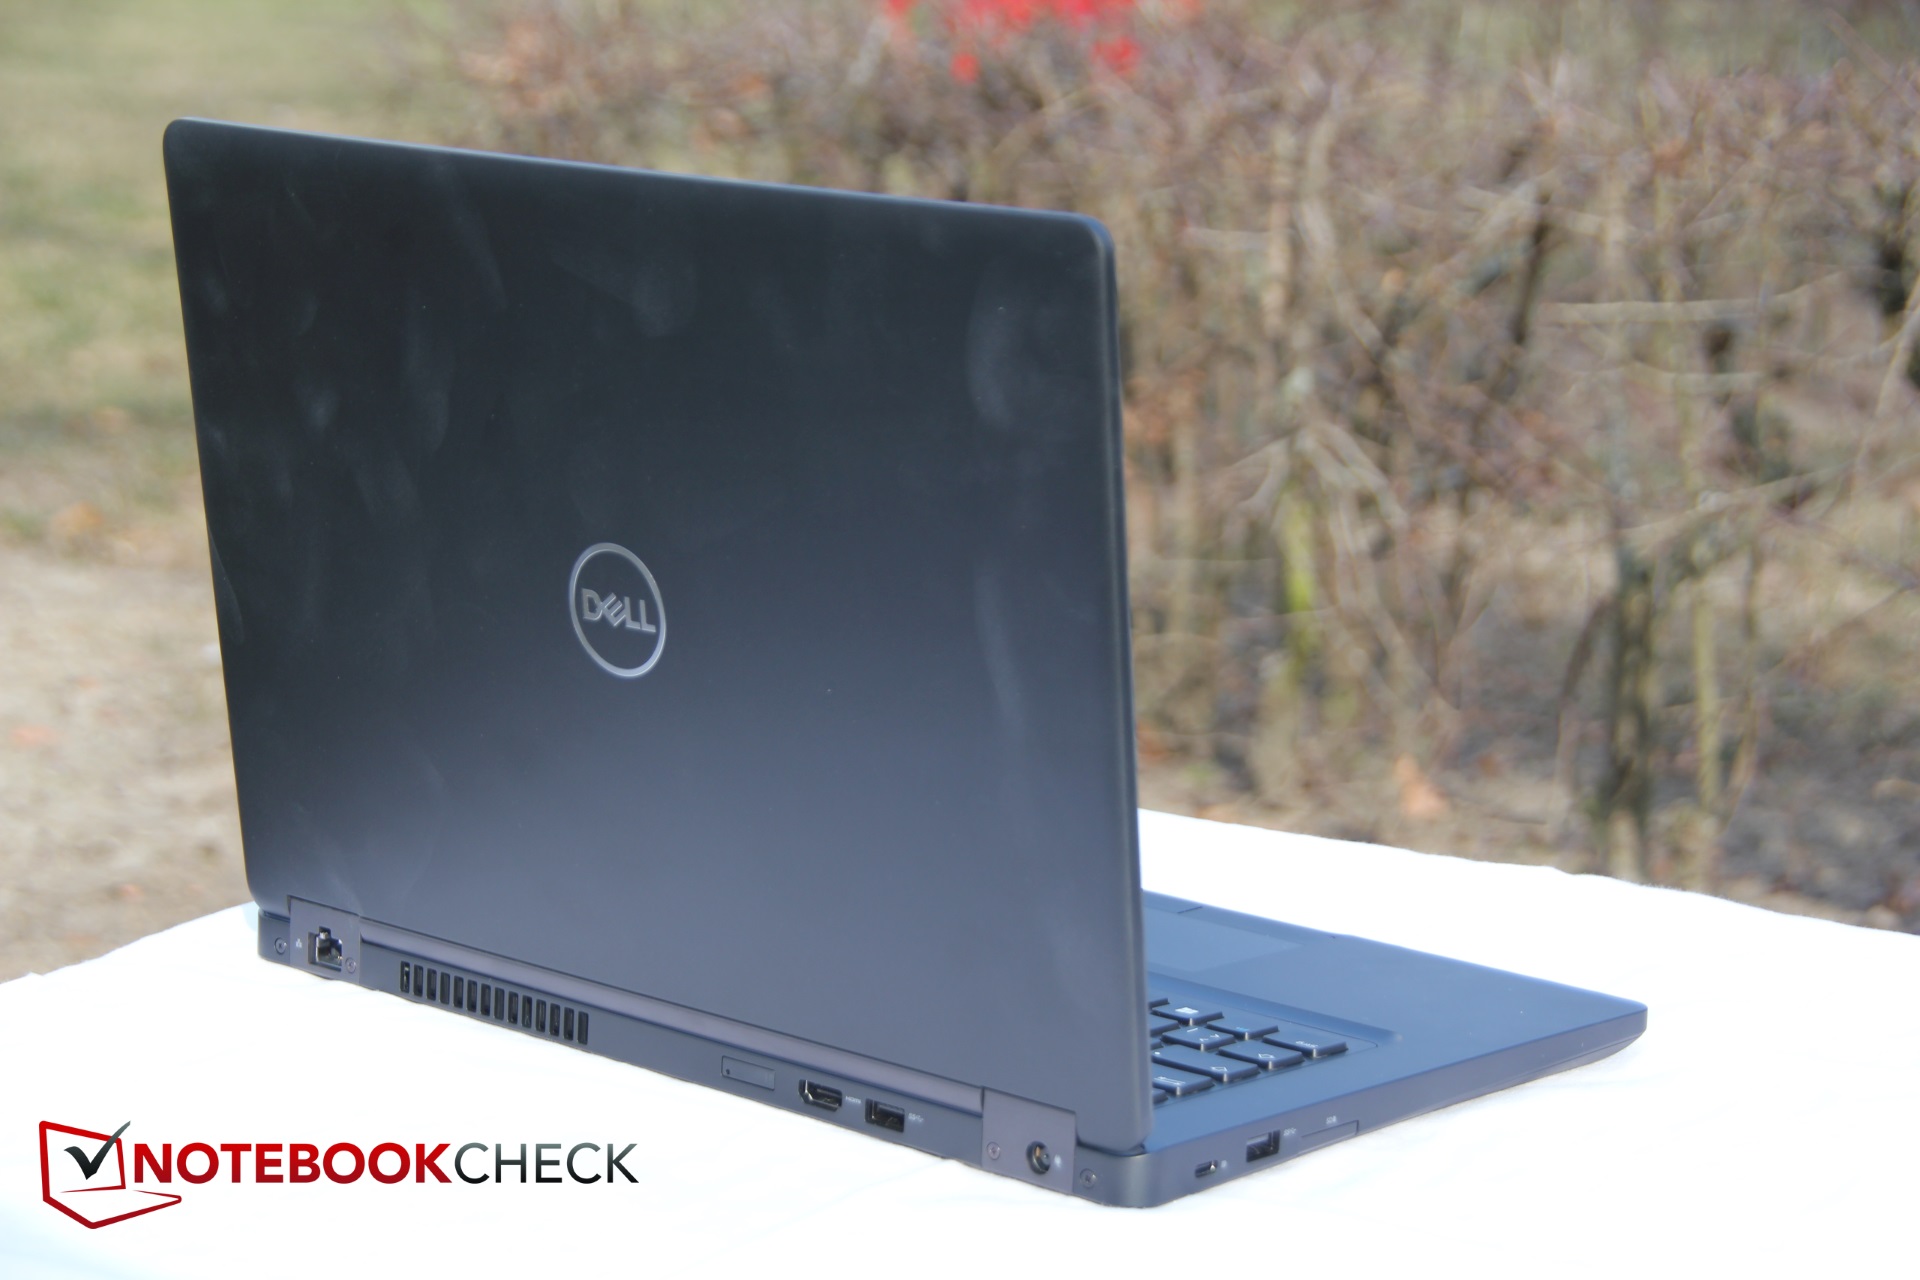
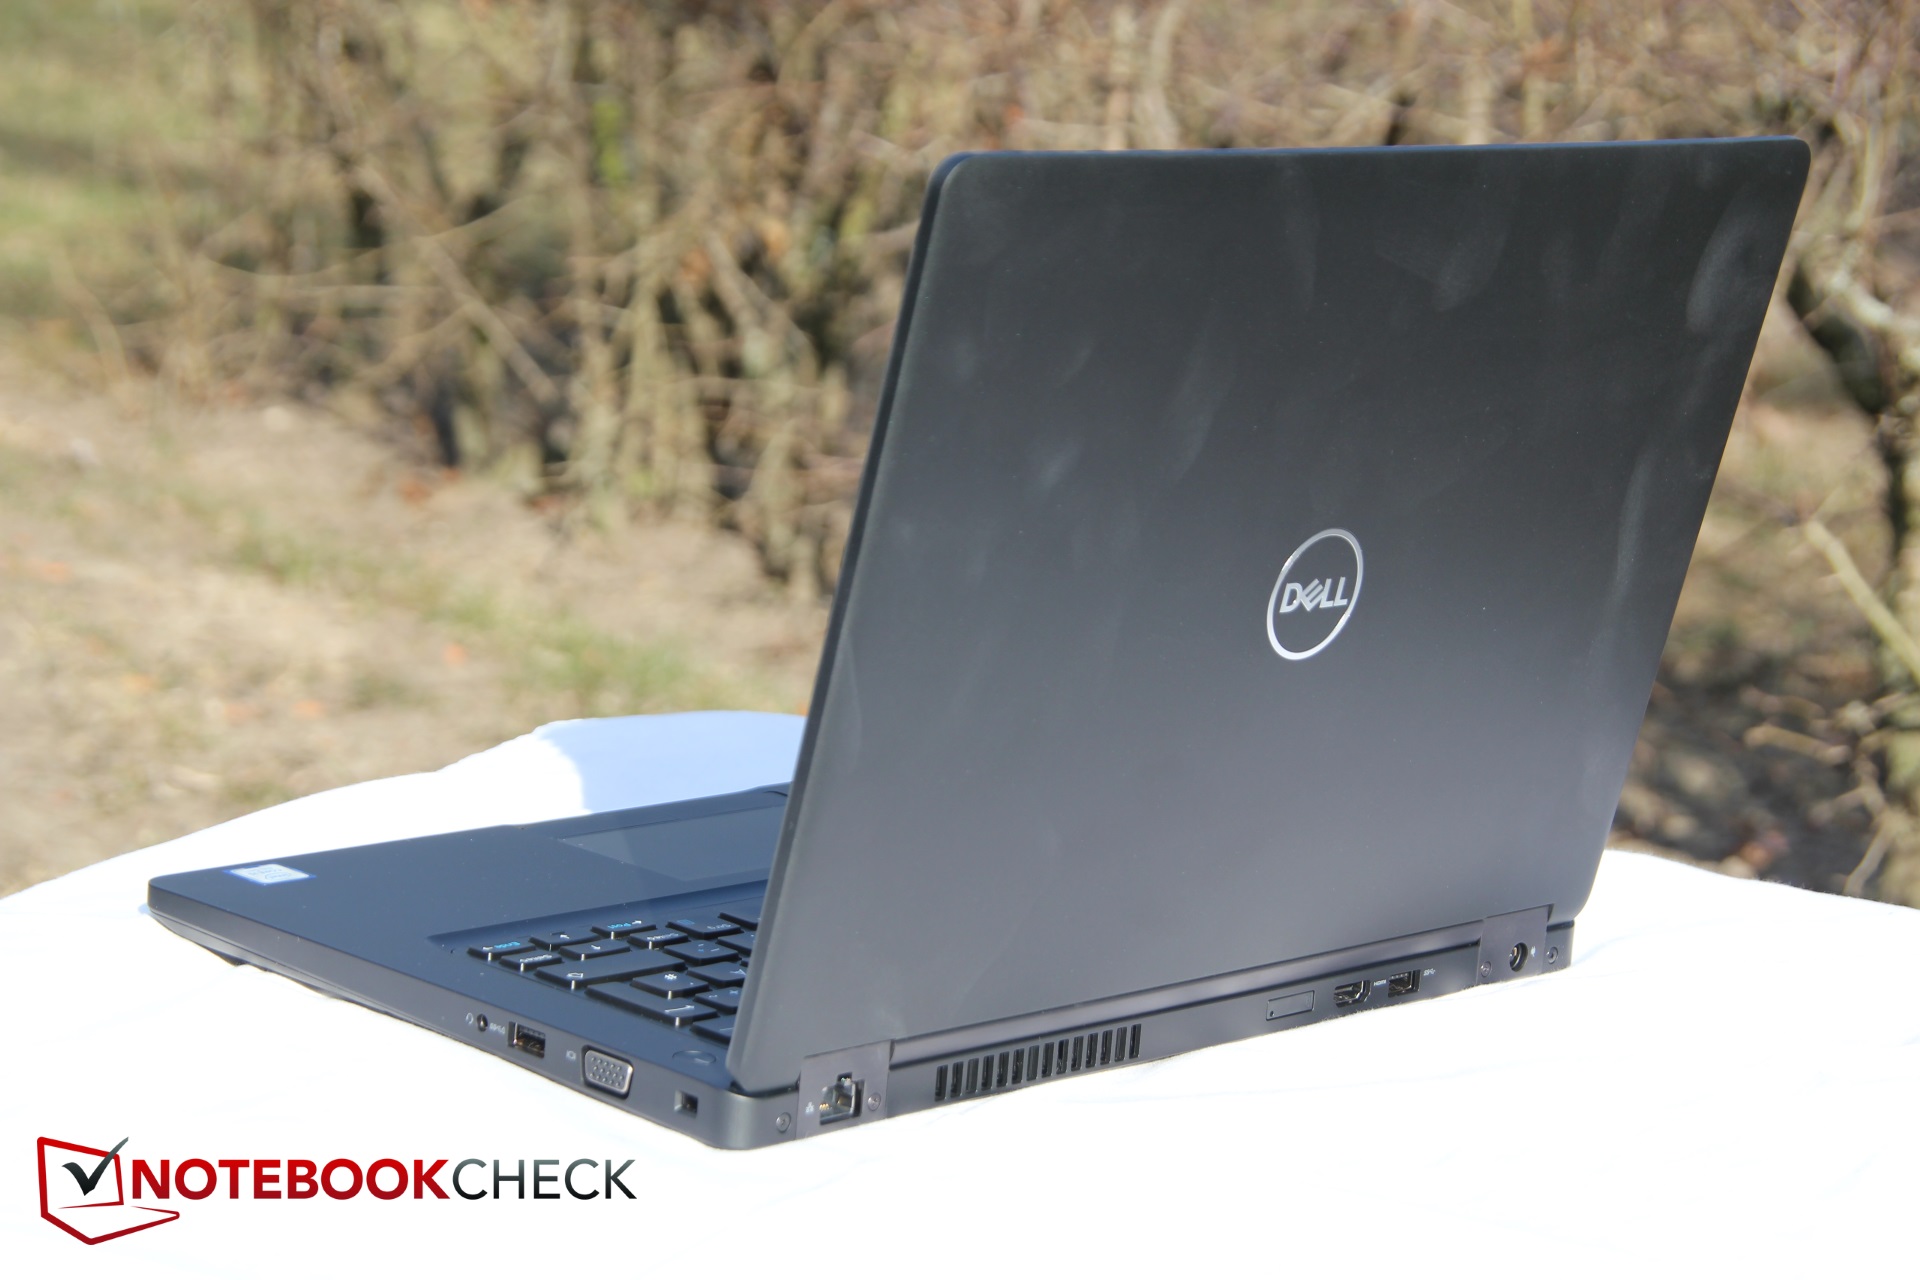
En plus de ce problème majeur, nous pouvons recenser quelques autres défauts : la machine est plutôt lourde, elle ne possède pas de Thunderbolt 3, et sa consommation énergétique et ses températures en surface sont loin d’être idéales. Certains concurrents – comme les HP EliteBook 840 G4 ou Lenovo ThinkPad T480 gèrent mieux cela. Les Latitudes 7490 et 7390 de Dell sont également excellents (mais plus chers), et possèdent très peu de défauts.
L’intégralité de cette critique est disponible en anglais en suivant ce lien.
Dell Latitude 5490
- 05/12/2018 v6 (old)
Steve Schardein
Price comparison
