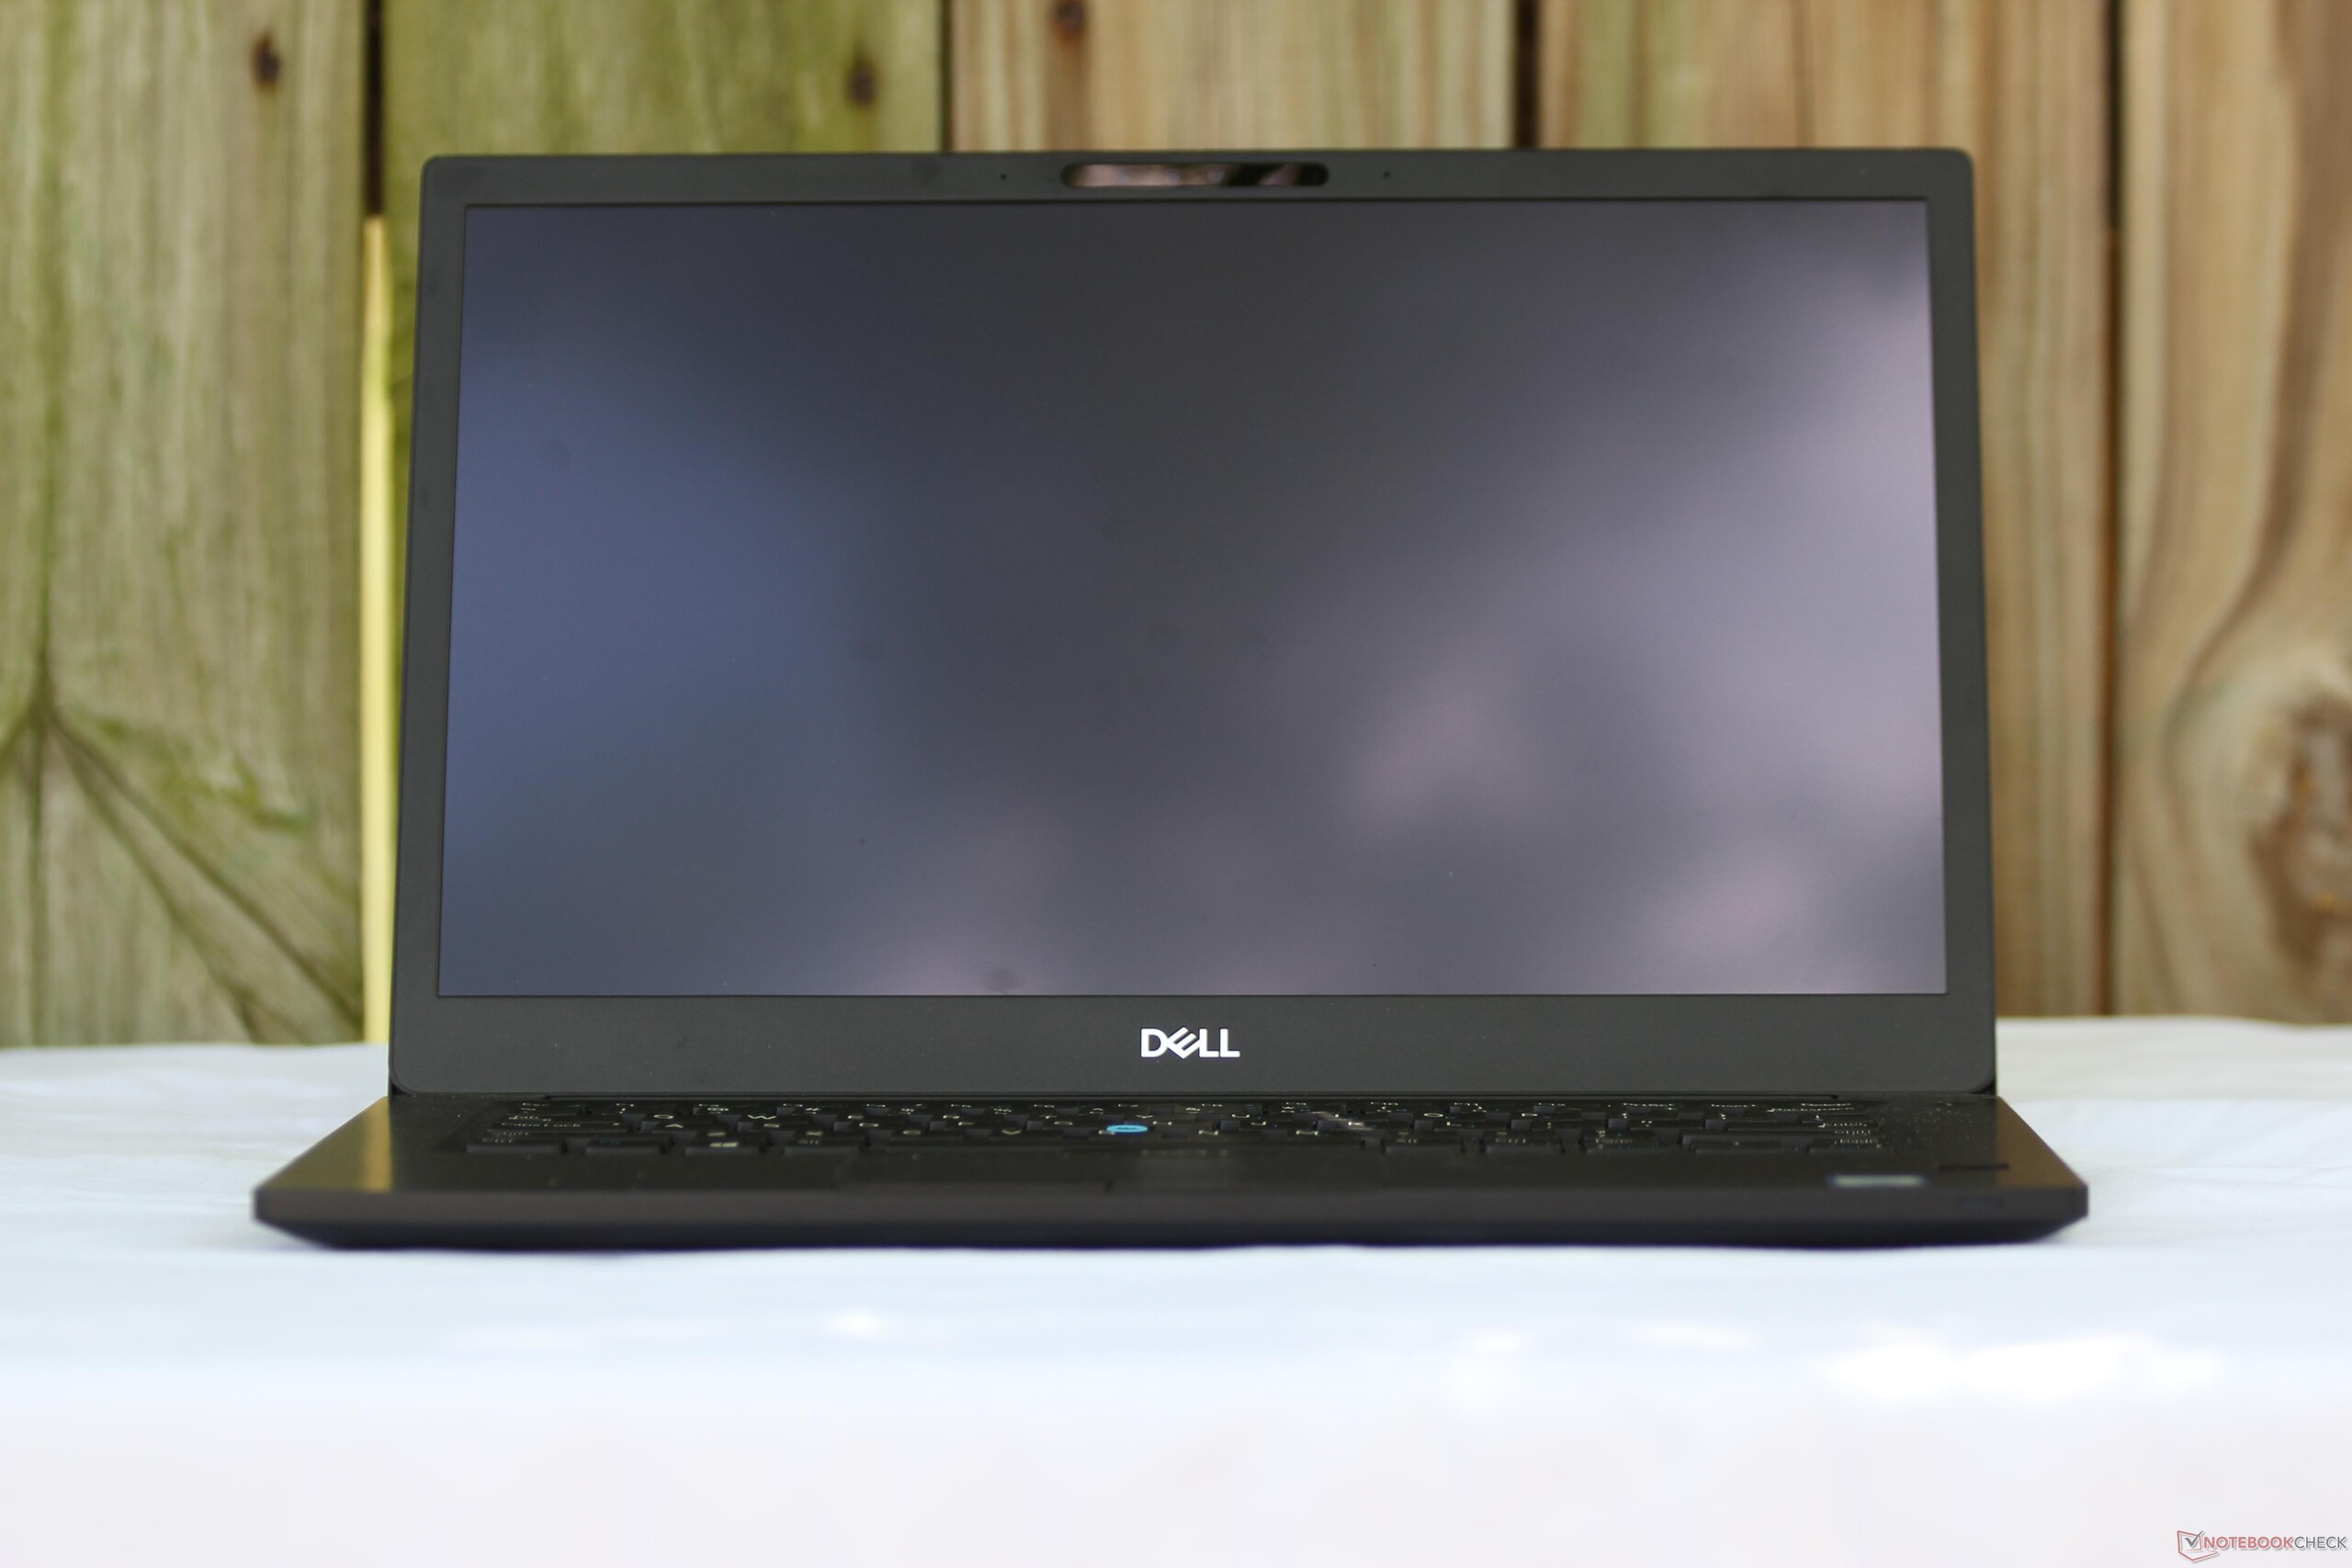
Courte critique du PC portable Dell Latitude 7490 (i7-8650U, écran tactile FHD)


| SD Card Reader | |
| average JPG Copy Test (av. of 3 runs) | |
| Lenovo ThinkPad X1 Carbon 2018-20KGS03900 (Toshiba Exceria Pro M501) | |
| Dell Latitude 7490 (Toshiba Exceria Pro M501 UHS-II) | |
| Lenovo ThinkPad T480-20L6S01V00 (Toshiba Exceria Pro SDXC 64 GB UHS-II) | |
| Dell Latitude 7480 (Toshiba (Exceria Pro SDXC UHS-II 64 GB) | |
| Toshiba Tecra X40-D | |
| Lenovo ThinkPad T480s-20L8S02E00 (Toshiba Exceria Pro SDXC 64 GB UHS-II) | |
| Moyenne de la classe Office (19.8 - 198.5, n=22, 2 dernières années) | |
| maximum AS SSD Seq Read Test (1GB) | |
| Lenovo ThinkPad X1 Carbon 2018-20KGS03900 (Toshiba Exceria Pro M501) | |
| Dell Latitude 7490 (Toshiba Exceria Pro M501 UHS-II) | |
| Dell Latitude 7480 (Toshiba (Exceria Pro SDXC UHS-II 64 GB) | |
| Lenovo ThinkPad T480s-20L8S02E00 (Toshiba Exceria Pro SDXC 64 GB UHS-II) | |
| Toshiba Tecra X40-D | |
| Lenovo ThinkPad T480-20L6S01V00 (Toshiba Exceria Pro SDXC 64 GB UHS-II) | |
| Moyenne de la classe Office (27.4 - 249, n=21, 2 dernières années) | |
| |||||||||||||||||||||||||
Homogénéité de la luminosité: 87 %
Valeur mesurée au centre, sur batterie: 328.2 cd/m²
Contraste: 887:1 (Valeurs des noirs: 0.37 cd/m²)
ΔE ColorChecker Calman: 3.82 | ∀{0.5-29.43 Ø4.72}
calibrated: 3.5
ΔE Greyscale Calman: 3 | ∀{0.09-98 Ø4.97}
88% sRGB (Argyll 1.6.3 3D)
58% AdobeRGB 1998 (Argyll 1.6.3 3D)
64.8% AdobeRGB 1998 (Argyll 3D)
88.8% sRGB (Argyll 3D)
63.6% Display P3 (Argyll 3D)
Gamma: 2.36
CCT: 6962 K
| Dell Latitude 7490 AU Optronics AU0223D, IPS, 14", 1920x1080 | Dell Latitude 7480 LG Philips LGD0557, IPS, 14", 1920x1080 | Lenovo ThinkPad T480-20L6S01V00 Lenovo LP140WF6-SPB7, IPS, 14", 1920x1080 | Lenovo ThinkPad T480s-20L8S02E00 LP140QH2-SPB1, IPS LED, 14", 2560x1440 | Lenovo ThinkPad X1 Carbon 2018-20KGS03900 B140QAN02.0, IPS, 14", 2560x1440 | Toshiba Tecra X40-D Toshiba TOS508F, IPS, 14", 1920x1080 | Asus ASUSPRO B9440UA-GV0100T AU Optronics AUO353D / B140HAN03.5, IPS, 14", 1920x1080 | HP Elitebook 1040 G4-2XU40UT Chi Mei CMN14D7, IPS, 14", 1920x1080 | |
|---|---|---|---|---|---|---|---|---|
| Display | 3% | -36% | 11% | 35% | -34% | 1% | 7% | |
| Display P3 Coverage (%) | 63.6 | 65.4 3% | 39.24 -38% | 71.4 12% | 87.7 38% | 40.55 -36% | 64 1% | 66.8 5% |
| sRGB Coverage (%) | 88.8 | 92.3 4% | 58.8 -34% | 96.6 9% | 100 13% | 61 -31% | 89.1 0% | 97.1 9% |
| AdobeRGB 1998 Coverage (%) | 64.8 | 65.8 2% | 40.56 -37% | 72.1 11% | 99.9 54% | 41.89 -35% | 65.2 1% | 69 6% |
| Response Times | 10% | 25% | 20% | -14% | 19% | 2% | 18% | |
| Response Time Grey 50% / Grey 80% * (ms) | 48.4 ? | 40.8 ? 16% | 35.6 ? 26% | 36 ? 26% | 59.2 ? -22% | 38 ? 21% | 48.8 ? -1% | 34.4 ? 29% |
| Response Time Black / White * (ms) | 32.4 ? | 31.2 ? 4% | 24.8 ? 23% | 28 ? 14% | 34.4 ? -6% | 26.8 ? 17% | 30.8 ? 5% | 30 ? 7% |
| PWM Frequency (Hz) | 20410 ? | 26040 ? | ||||||
| Screen | 7% | -36% | 5% | 40% | -45% | -40% | 1% | |
| Brightness middle (cd/m²) | 328.2 | 344 5% | 307 -6% | 311 -5% | 578 76% | 283.9 -13% | 319 -3% | 295.9 -10% |
| Brightness (cd/m²) | 305 | 321 5% | 295 -3% | 302 -1% | 533 75% | 261 -14% | 294 -4% | 287 -6% |
| Brightness Distribution (%) | 87 | 85 -2% | 90 3% | 91 5% | 84 -3% | 85 -2% | 87 0% | 87 0% |
| Black Level * (cd/m²) | 0.37 | 0.32 14% | 0.25 32% | 0.36 3% | 0.38 -3% | 0.25 32% | 0.26 30% | 0.23 38% |
| Contrast (:1) | 887 | 1075 21% | 1228 38% | 864 -3% | 1521 71% | 1136 28% | 1227 38% | 1287 45% |
| Colorchecker dE 2000 * | 3.82 | 2.6 32% | 5.7 -49% | 3 21% | 1.9 50% | 6.4 -68% | 7.1 -86% | 2.83 26% |
| Colorchecker dE 2000 max. * | 5.58 | 7.8 -40% | 21.3 -282% | 6.1 -9% | 3.8 32% | 18.7 -235% | 13.7 -146% | 7.34 -32% |
| Colorchecker dE 2000 calibrated * | 3.5 | 4.7 -34% | 1.7 51% | 0.8 77% | ||||
| Greyscale dE 2000 * | 3 | 2.6 13% | 3.7 -23% | 4 -33% | 3 -0% | 6.3 -110% | 9.61 -220% | 5.2 -73% |
| Gamma | 2.36 93% | 2.28 96% | 2.11 104% | 2.17 101% | 2.14 103% | 2.39 92% | 2.33 94% | 2.28 96% |
| CCT | 6962 93% | 7050 92% | 7353 88% | 6961 93% | 6377 102% | 6511 100% | 6021 108% | 7056 92% |
| Color Space (Percent of AdobeRGB 1998) (%) | 58 | 65.82 13% | 37.4 -36% | 66.7 15% | 88.8 53% | 38 -34% | 54.01 -7% | 63 9% |
| Color Space (Percent of sRGB) (%) | 88 | 92.27 5% | 58.7 -33% | 96.7 10% | 100 14% | 60 -32% | 83.02 -6% | 97 10% |
| Moyenne finale (programmes/paramètres) | 7% /
6% | -16% /
-28% | 12% /
8% | 20% /
32% | -20% /
-34% | -12% /
-27% | 9% /
4% |
* ... Moindre est la valeur, meilleures sont les performances
Temps de réponse de l'écran
| ↔ Temps de réponse noir à blanc | ||
|---|---|---|
| 32.4 ms ... hausse ↗ et chute ↘ combinées | ↗ 18.8 ms hausse | 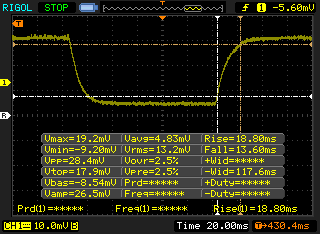 |
| ↘ 13.6 ms chute | ||
| L'écran souffre de latences très élevées, à éviter pour le jeu. En comparaison, tous les appareils testés affichent entre 0.1 (minimum) et 240 (maximum) ms. » 88 % des appareils testés affichent de meilleures performances. Cela signifie que les latences relevées sont moins bonnes que la moyenne (19.8 ms) de tous les appareils testés. | ||
| ↔ Temps de réponse gris 50% à gris 80% | ||
| 48.4 ms ... hausse ↗ et chute ↘ combinées | ↗ 27.6 ms hausse | 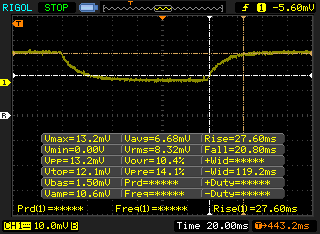 |
| ↘ 20.8 ms chute | ||
| L'écran souffre de latences très élevées, à éviter pour le jeu. En comparaison, tous les appareils testés affichent entre 0.165 (minimum) et 636 (maximum) ms. » 84 % des appareils testés affichent de meilleures performances. Cela signifie que les latences relevées sont moins bonnes que la moyenne (31 ms) de tous les appareils testés. | ||
Scintillement / MLI (Modulation de largeur d'impulsion)
| Scintillement / MLI (Modulation de largeur d'impulsion) non décelé | 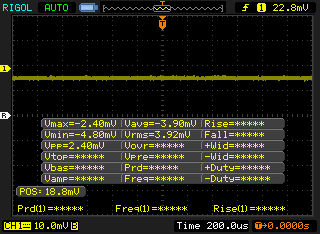 | ||
En comparaison, 52 % des appareils testés n'emploient pas MDI pour assombrir leur écran. Nous avons relevé une moyenne à 7747 (minimum : 5 - maximum : 343500) Hz dans le cas où une MDI était active. | |||
* ... Moindre est la valeur, meilleures sont les performances
| PCMark 8 Home Score Accelerated v2 | 4029 points | |
| PCMark 8 Creative Score Accelerated v2 | 5165 points | |
| PCMark 8 Work Score Accelerated v2 | 5155 points | |
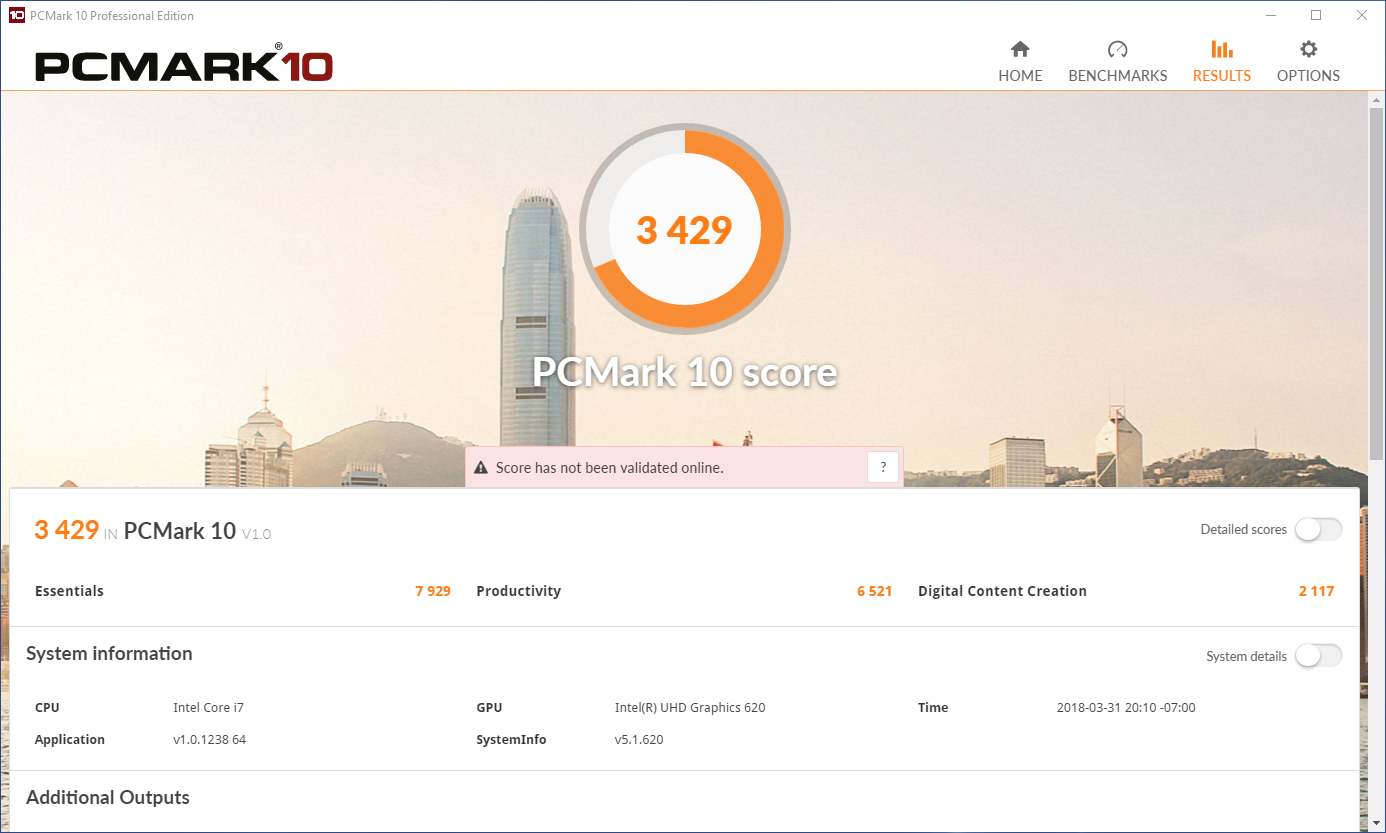
| PCMark 10 Score | 3429 points | |
Aide | ||
| Dell Latitude 7490 Samsung PM961 MZVLW256HEHP | Dell Latitude 7480 Intel SSDSCKKF256H6 | Lenovo ThinkPad T480-20L6S01V00 Samsung SSD PM981 MZVLB512HAJQ | Lenovo ThinkPad T480s-20L8S02E00 Samsung SSD PM981 MZVLB512HAJQ | Lenovo ThinkPad X1 Carbon 2018-20KGS03900 Samsung SSD PM981 MZVLB512HAJQ | Toshiba Tecra X40-D Samsung PM961 MZVLW256HEHP | Asus ASUSPRO B9440UA-GV0100T Micron SSD 1100 (MTFDDAV256TBN) | HP Elitebook 1040 G4-2XU40UT Toshiba XG4 NVMe (THNSN5512GPUK) | Moyenne Samsung PM961 MZVLW256HEHP | |
|---|---|---|---|---|---|---|---|---|---|
| AS SSD | -59% | -603% | 76% | 78% | 22% | -62% | -16% | -98% | |
| Copy Game MB/s (MB/s) | 382.3 | 228.1 -40% | 676 77% | 1110 190% | 1107 190% | 394.2 3% | 537 ? 40% | ||
| Copy Program MB/s (MB/s) | 227.1 | 148.2 -35% | 254.8 12% | 387.5 71% | 460.2 103% | 133.7 -41% | 343 ? 51% | ||
| Copy ISO MB/s (MB/s) | 872 | 262.3 -70% | 921 6% | 1412 62% | 1247 43% | 534 -39% | 1004 ? 15% | ||
| Score Total (Points) | 2350 | 764 -67% | 2348 0% | 4115 75% | 3529 50% | 3576 52% | 842 -64% | 2299 -2% | 2565 ? 9% |
| Score Write (Points) | 536 | 249 -54% | 147 -73% | 1708 219% | 1801 236% | 675 26% | 372 -31% | 848 58% | 587 ? 10% |
| Score Read (Points) | 1242 | 338 -73% | 1480 19% | 1623 31% | 1168 -6% | 1963 58% | 307 -75% | 979 -21% | 1378 ? 11% |
| Access Time Write * (ms) | 0.03 | 0.042 -40% | 2.515 -8283% | 0.033 -10% | 0.027 10% | 0.028 7% | 0.054 -80% | 0.038 -27% | 0.4637 ? -1446% |
| Access Time Read * (ms) | 0.04 | 0.082 -105% | 0.041 -2% | 0.045 -13% | 0.029 27% | 0.061 -53% | 0.088 -120% | 0.105 -163% | 0.06777 ? -69% |
| 4K-64 Write (MB/s) | 329.6 | 125.4 -62% | 96.2 -71% | 1456 342% | 1529 364% | 438.4 33% | 252.9 -23% | 662 101% | 419 ? 27% |
| 4K-64 Read (MB/s) | 955 | 260 -73% | 1278 34% | 1329 39% | 876 -8% | 1663 74% | 234 -75% | 782 -18% | 1112 ? 16% |
| 4K Write (MB/s) | 114.9 | 86.6 -25% | 1.76 -98% | 114.4 0% | 134.3 17% | 124.8 9% | 77.5 -33% | 100.1 -13% | 91.6 ? -20% |
| 4K Read (MB/s) | 48.13 | 28.89 -40% | 58 21% | 49.81 3% | 52.4 9% | 51.6 7% | 24.21 -50% | 38.49 -20% | 45.1 ? -6% |
| Seq Write (MB/s) | 919 | 367.5 -60% | 487.1 -47% | 1382 50% | 1376 50% | 1117 22% | 419.6 -54% | 863 -6% | 960 ? 4% |
| Seq Read (MB/s) | 2385 | 492.8 -79% | 1441 -40% | 2440 2% | 2396 0% | 2479 4% | 490.2 -79% | 1585 -34% | 2019 ? -15% |
* ... Moindre est la valeur, meilleures sont les performances

| 3DMark Cloud Gate Standard Score | 8591 points | |
| 3DMark Fire Strike Score | 1077 points | |
Aide | ||
| Rocket League | |
| 1280x720 Performance (Classer selon les valeurs) | |
| Dell Latitude 7490 | |
| Moyenne Intel UHD Graphics 620 (20.1 - 95, n=26) | |
| 1920x1080 Performance (Classer selon les valeurs) | |
| Dell Latitude 7490 | |
| Moyenne Intel UHD Graphics 620 (17.1 - 78.4, n=13) | |
| 1920x1080 Quality AA:Medium FX (Classer selon les valeurs) | |
| Dell Latitude 7490 | |
| Moyenne Intel UHD Graphics 620 (13.1 - 43, n=24) | |
| 1920x1080 High Quality AA:High FX (Classer selon les valeurs) | |
| Dell Latitude 7490 | |
| Asus Zephyrus M GM501 | |
| Moyenne Intel UHD Graphics 620 (13.2 - 24.7, n=21) | |
| Bas | Moyen | Élevé | Ultra | |
|---|---|---|---|---|
| BioShock Infinite (2013) | 53 | 35 | 30 | 10 |
| Civilization 6 (2016) | 33 | 15 | 6 | 5 |
| Rocket League (2017) | 50 | 32 | 20 |
Degré de la nuisance sonore
| Au repos |
| 28.2 / 28.2 / 31.4 dB(A) |
| Fortement sollicité |
| 31.7 / 41.2 dB(A) |
 | ||
30 dB silencieux 40 dB(A) audible 50 dB(A) bruyant |
||
min: | ||
| Dell Latitude 7490 UHD Graphics 620, i7-8650U, Samsung PM961 MZVLW256HEHP | Dell Latitude 7480 HD Graphics 620, i7-7600U, Intel SSDSCKKF256H6 | Lenovo ThinkPad T480-20L6S01V00 GeForce MX150, i5-8550U, Samsung SSD PM981 MZVLB512HAJQ | Lenovo ThinkPad T480s-20L8S02E00 GeForce MX150, i5-8550U, Samsung SSD PM981 MZVLB512HAJQ | Lenovo ThinkPad X1 Carbon 2018-20KGS03900 UHD Graphics 620, i5-8550U, Samsung SSD PM981 MZVLB512HAJQ | Toshiba Tecra X40-D HD Graphics 620, i7-7600U, Samsung PM961 MZVLW256HEHP | Asus ASUSPRO B9440UA-GV0100T HD Graphics 620, i5-7200U, Micron SSD 1100 (MTFDDAV256TBN) | HP Elitebook 1040 G4-2XU40UT HD Graphics 630, i7-7820HQ, Toshiba XG4 NVMe (THNSN5512GPUK) | |
|---|---|---|---|---|---|---|---|---|
| Noise | 7% | 0% | -2% | -1% | 2% | -3% | 3% | |
| arrêt / environnement * (dB) | 28.2 | 29 -3% | 29 -3% | 28.9 -2% | 28 1% | 29 -3% | 28.2 -0% | |
| Idle Minimum * (dB) | 28.2 | 28.6 -1% | 29 -3% | 29 -3% | 28.9 -2% | 28 1% | 29 -3% | 28.2 -0% |
| Idle Average * (dB) | 28.2 | 28.6 -1% | 29 -3% | 29 -3% | 28.9 -2% | 28 1% | 29 -3% | 28.2 -0% |
| Idle Maximum * (dB) | 31.4 | 28.6 9% | 29 8% | 29 8% | 32.5 -4% | 28.2 10% | 29 8% | 28.2 10% |
| Load Average * (dB) | 31.7 | 30.2 5% | 35.6 -12% | 36.5 -15% | 35.1 -11% | 33.2 -5% | 36.7 -16% | 33.3 -5% |
| Load Maximum * (dB) | 41.2 | 31.2 24% | 35.6 14% | 38.2 7% | 35.1 15% | 39.9 3% | 40.2 2% | 35.3 14% |
| Witcher 3 ultra * (dB) | 32.5 | 32.8 |
* ... Moindre est la valeur, meilleures sont les performances
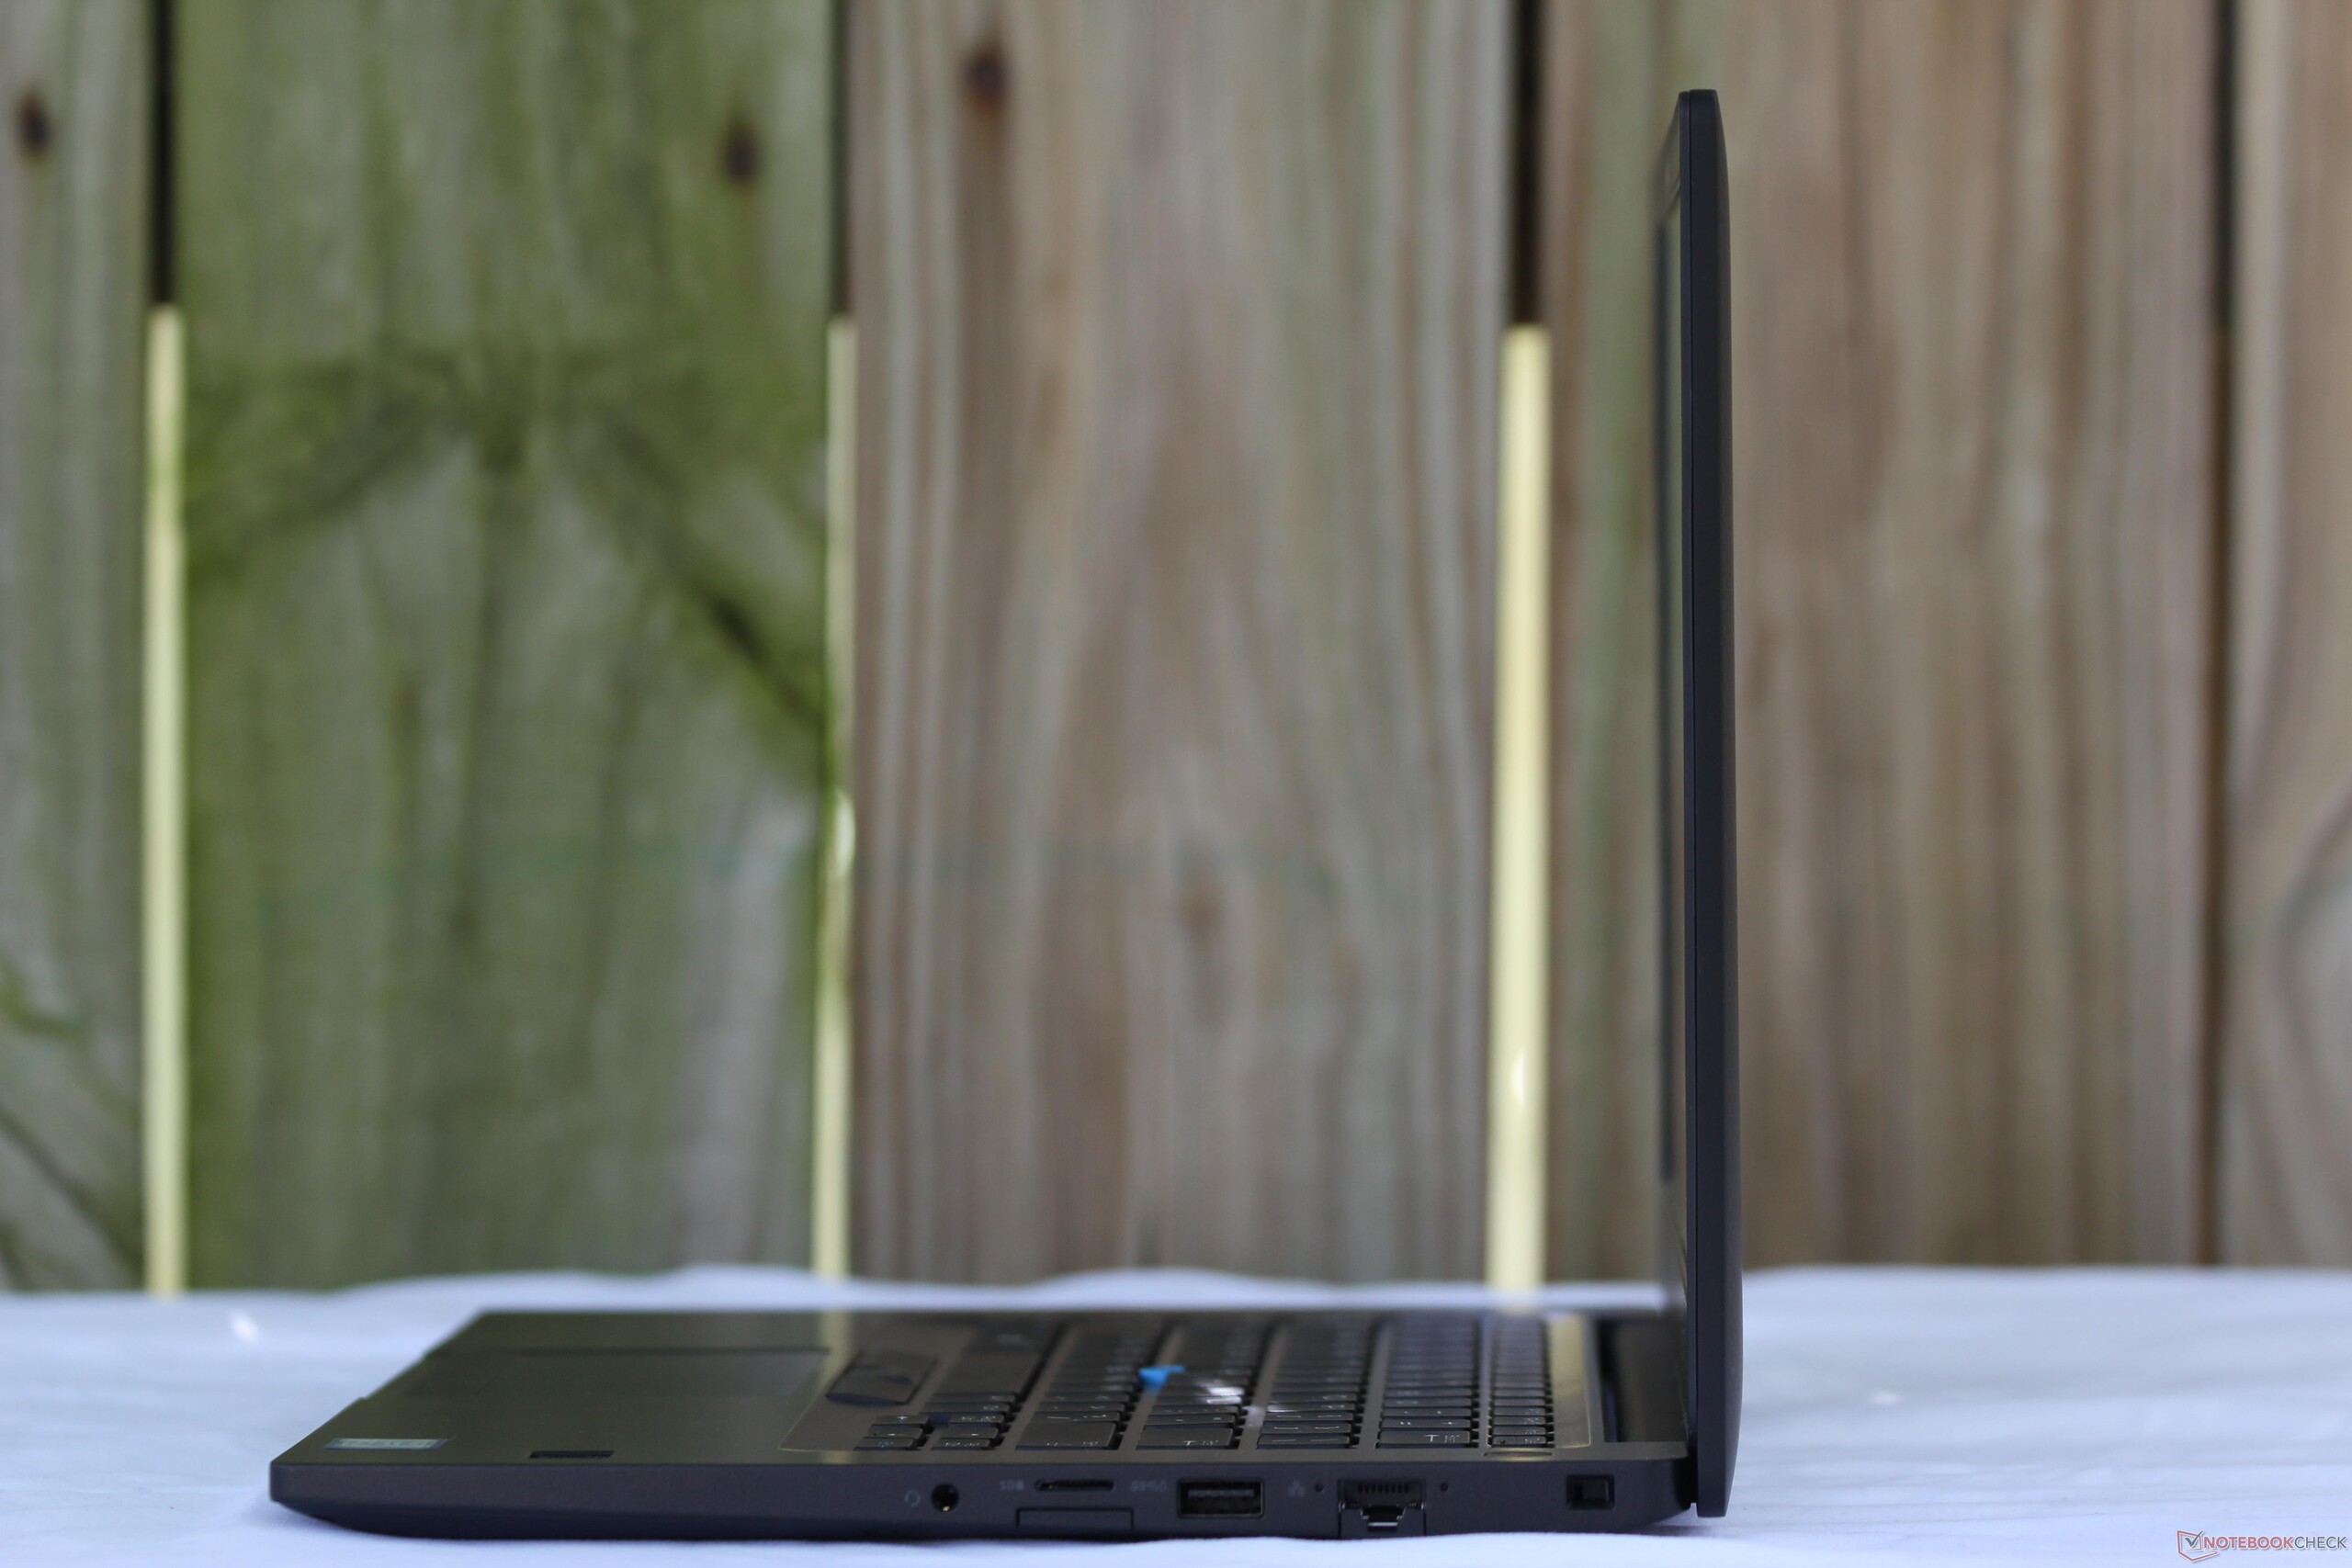
(±) La température maximale du côté supérieur est de 45 °C / 113 F, par rapport à la moyenne de 34.3 °C / 94 F, allant de 21.2 à 62.5 °C pour la classe Office.
(-) Le fond chauffe jusqu'à un maximum de 56 °C / 133 F, contre une moyenne de 36.8 °C / 98 F
(+) En utilisation inactive, la température moyenne du côté supérieur est de 25.2 °C / 77 F, par rapport à la moyenne du dispositif de 29.5 °C / 85 F.
(+) Les repose-poignets et le pavé tactile sont plus froids que la température de la peau avec un maximum de 28 °C / 82.4 F et sont donc froids au toucher.
(±) La température moyenne de la zone de l'appui-paume de dispositifs similaires était de 27.5 °C / 81.5 F (-0.5 °C / #-0.9 F).
Dell Latitude 7490 analyse audio
(±) | le niveau sonore du haut-parleur est moyen mais bon (73.8# dB)
Basses 100 - 315 Hz
(±) | basse réduite - en moyenne 14.8% inférieure à la médiane
(±) | la linéarité des basses est moyenne (9.4% delta à la fréquence précédente)
Médiums 400 - 2000 Hz
(+) | médiane équilibrée - seulement 4.4% de la médiane
(±) | la linéarité des médiums est moyenne (8% delta à la fréquence précédente)
Aiguës 2 - 16 kHz
(+) | des sommets équilibrés - à seulement 4.4% de la médiane
(±) | la linéarité des aigus est moyenne (8.2% delta à la fréquence précédente)
Globalement 100 - 16 000 Hz
(±) | la linéarité du son global est moyenne (19.9% de différence avec la médiane)
Par rapport à la même classe
» 42% de tous les appareils testés de cette catégorie étaient meilleurs, 9% similaires, 49% pires
» Le meilleur avait un delta de 7%, la moyenne était de 21%, le pire était de 53%.
Par rapport à tous les appareils testés
» 51% de tous les appareils testés étaient meilleurs, 7% similaires, 42% pires
» Le meilleur avait un delta de 4%, la moyenne était de 23%, le pire était de 134%.
Lenovo ThinkPad T480s-20L8S02E00 analyse audio
(±) | le niveau sonore du haut-parleur est moyen mais bon (78.9# dB)
Basses 100 - 315 Hz
(-) | presque aucune basse - en moyenne 19.4% plus bas que la médiane
(±) | la linéarité des basses est moyenne (12.1% delta à la fréquence précédente)
Médiums 400 - 2000 Hz
(±) | médiane supérieure - en moyenne 6.5% supérieure à la médiane
(±) | la linéarité des médiums est moyenne (9.6% delta à la fréquence précédente)
Aiguës 2 - 16 kHz
(+) | des sommets équilibrés - à seulement 3.5% de la médiane
(±) | la linéarité des aigus est moyenne (7.6% delta à la fréquence précédente)
Globalement 100 - 16 000 Hz
(±) | la linéarité du son global est moyenne (22.1% de différence avec la médiane)
Par rapport à la même classe
» 58% de tous les appareils testés de cette catégorie étaient meilleurs, 8% similaires, 34% pires
» Le meilleur avait un delta de 7%, la moyenne était de 21%, le pire était de 53%.
Par rapport à tous les appareils testés
» 64% de tous les appareils testés étaient meilleurs, 6% similaires, 30% pires
» Le meilleur avait un delta de 4%, la moyenne était de 23%, le pire était de 134%.
| Éteint/en veille | |
| Au repos | |
| Fortement sollicité |
|
Légende:
min: | |
| Dell Latitude 7490 i7-8650U, UHD Graphics 620, Samsung PM961 MZVLW256HEHP, IPS, 1920x1080, 14" | Dell Latitude 7480 i7-7600U, HD Graphics 620, Intel SSDSCKKF256H6, IPS, 1920x1080, 14" | Lenovo ThinkPad T480-20L6S01V00 i5-8550U, GeForce MX150, Samsung SSD PM981 MZVLB512HAJQ, IPS, 1920x1080, 14" | Lenovo ThinkPad T480s-20L8S02E00 i5-8550U, GeForce MX150, Samsung SSD PM981 MZVLB512HAJQ, IPS LED, 2560x1440, 14" | Lenovo ThinkPad X1 Carbon 2018-20KGS03900 i5-8550U, UHD Graphics 620, Samsung SSD PM981 MZVLB512HAJQ, IPS, 2560x1440, 14" | Toshiba Tecra X40-D i7-7600U, HD Graphics 620, Samsung PM961 MZVLW256HEHP, IPS, 1920x1080, 14" | Asus ASUSPRO B9440UA-GV0100T i5-7200U, HD Graphics 620, Micron SSD 1100 (MTFDDAV256TBN), IPS, 1920x1080, 14" | HP Elitebook 1040 G4-2XU40UT i7-7820HQ, HD Graphics 630, Toshiba XG4 NVMe (THNSN5512GPUK), IPS, 1920x1080, 14" | |
|---|---|---|---|---|---|---|---|---|
| Power Consumption | 8% | -31% | -31% | -29% | 2% | 11% | -31% | |
| Idle Minimum * (Watt) | 3.1 | 4.32 -39% | 3.6 -16% | 3.4 -10% | 3.8 -23% | 5.2 -68% | 3.1 -0% | 5.1 -65% |
| Idle Average * (Watt) | 6.5 | 6.27 4% | 7.1 -9% | 7.5 -15% | 8.9 -37% | 6.9 -6% | 6.1 6% | 7 -8% |
| Idle Maximum * (Watt) | 7.6 | 6.35 16% | 9.5 -25% | 10.8 -42% | 11.9 -57% | 7 8% | 6.8 11% | 11.7 -54% |
| Load Average * (Watt) | 43 | 29.82 31% | 63.9 -49% | 55.4 -29% | 47.5 -10% | 24.6 43% | 27.4 36% | 41.2 4% |
| Load Maximum * (Watt) | 43.8 | 30.64 30% | 67.3 -54% | 70.3 -61% | 52.5 -20% | 30.1 31% | 43.7 -0% | 56.9 -30% |
| Witcher 3 ultra * (Watt) | 53.9 | 34 |
* ... Moindre est la valeur, meilleures sont les performances
| Dell Latitude 7490 i7-8650U, UHD Graphics 620, 60 Wh | Dell Latitude 7480 i7-7600U, HD Graphics 620, 60 Wh | Lenovo ThinkPad T480-20L6S01V00 i5-8550U, GeForce MX150, 72 Wh | Lenovo ThinkPad T480s-20L8S02E00 i5-8550U, GeForce MX150, 57 Wh | Lenovo ThinkPad X1 Carbon 2018-20KGS03900 i5-8550U, UHD Graphics 620, 57 Wh | Toshiba Tecra X40-D i7-7600U, HD Graphics 620, 48 Wh | Asus ASUSPRO B9440UA-GV0100T i5-7200U, HD Graphics 620, 48 Wh | HP Elitebook 1040 G4-2XU40UT i7-7820HQ, HD Graphics 630, 67 Wh | |
|---|---|---|---|---|---|---|---|---|
| Autonomie de la batterie | 57% | 57% | 1% | 11% | -6% | 12% | 15% | |
| Reader / Idle (h) | 18.6 | 27.7 49% | 27.9 50% | 22.8 23% | 22.1 19% | 14.6 -22% | 19 2% | 22.5 21% |
| WiFi v1.3 (h) | 9.4 | 12 28% | 13.2 40% | 8.8 -6% | 8.7 -7% | 6 -36% | 8.9 -5% | 11.1 18% |
| Load (h) | 1.5 | 2.9 93% | 2.7 80% | 1.3 -13% | 1.8 20% | 2.1 40% | 2.1 40% | 1.6 7% |
Points positifs
Points négatifs
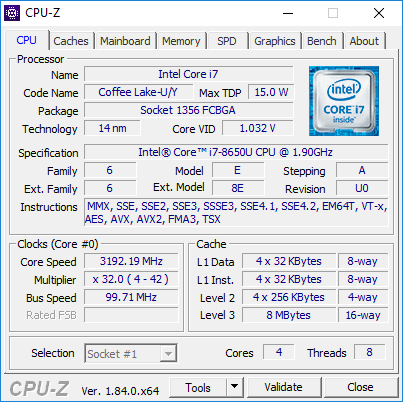
Dell a fait un excellent travail avec le Latitude 7490, mais avant tout parce que le travail avait déjà été fait avec le 7480 : le nouveau modèle reprend presque tout du modèle de l’an dernier. Le gros avantage du Latitude 7490 par rapport au 7480 est son processeur Intel quatre cœurs de 8e génération. Malgré la même enveloppe thermique de 15 W propre à la série U, les CPU Kaby Lake R doublent presque les performances de leur prédécesseurs de 7e génération. Le Latitude 7490 est un bon exemple des gains de puissances permis par cette nouvelle génération, mais illustre également les sacrifices qui ont dû être faits : le thermal throttling est ici un problème majeur. En cas de fortes sollicitations, le processeur est capable d’atteindre tout son potentiel, mais que sur de brefs moments.
Nous allons être francs : si vous possédez déjà un Latitude 7480, vous pouvez laisser passer le 7490. Les performances CPU supplémentaires ne seront visibles que dans les tâches ultra exigeantes, et à moins que votre cahier des charges inclut un travail sur des tableurs ultra complexes, ou d’autres tâches gourmandes en CPU, la mise à niveau ne vaut pas le coup. Mais si vous devez acheter un nouveau portable pro, ou devez remplacer maintenant une machine qui a quelques années de service derrière elle, le Latitude 7490 doit absolument être pris en compte. Dell a conçu une excellente machine qui rivalise avec les meilleurs.
L’intégralité de cette critique est disponible en anglais en suivant ce lien.
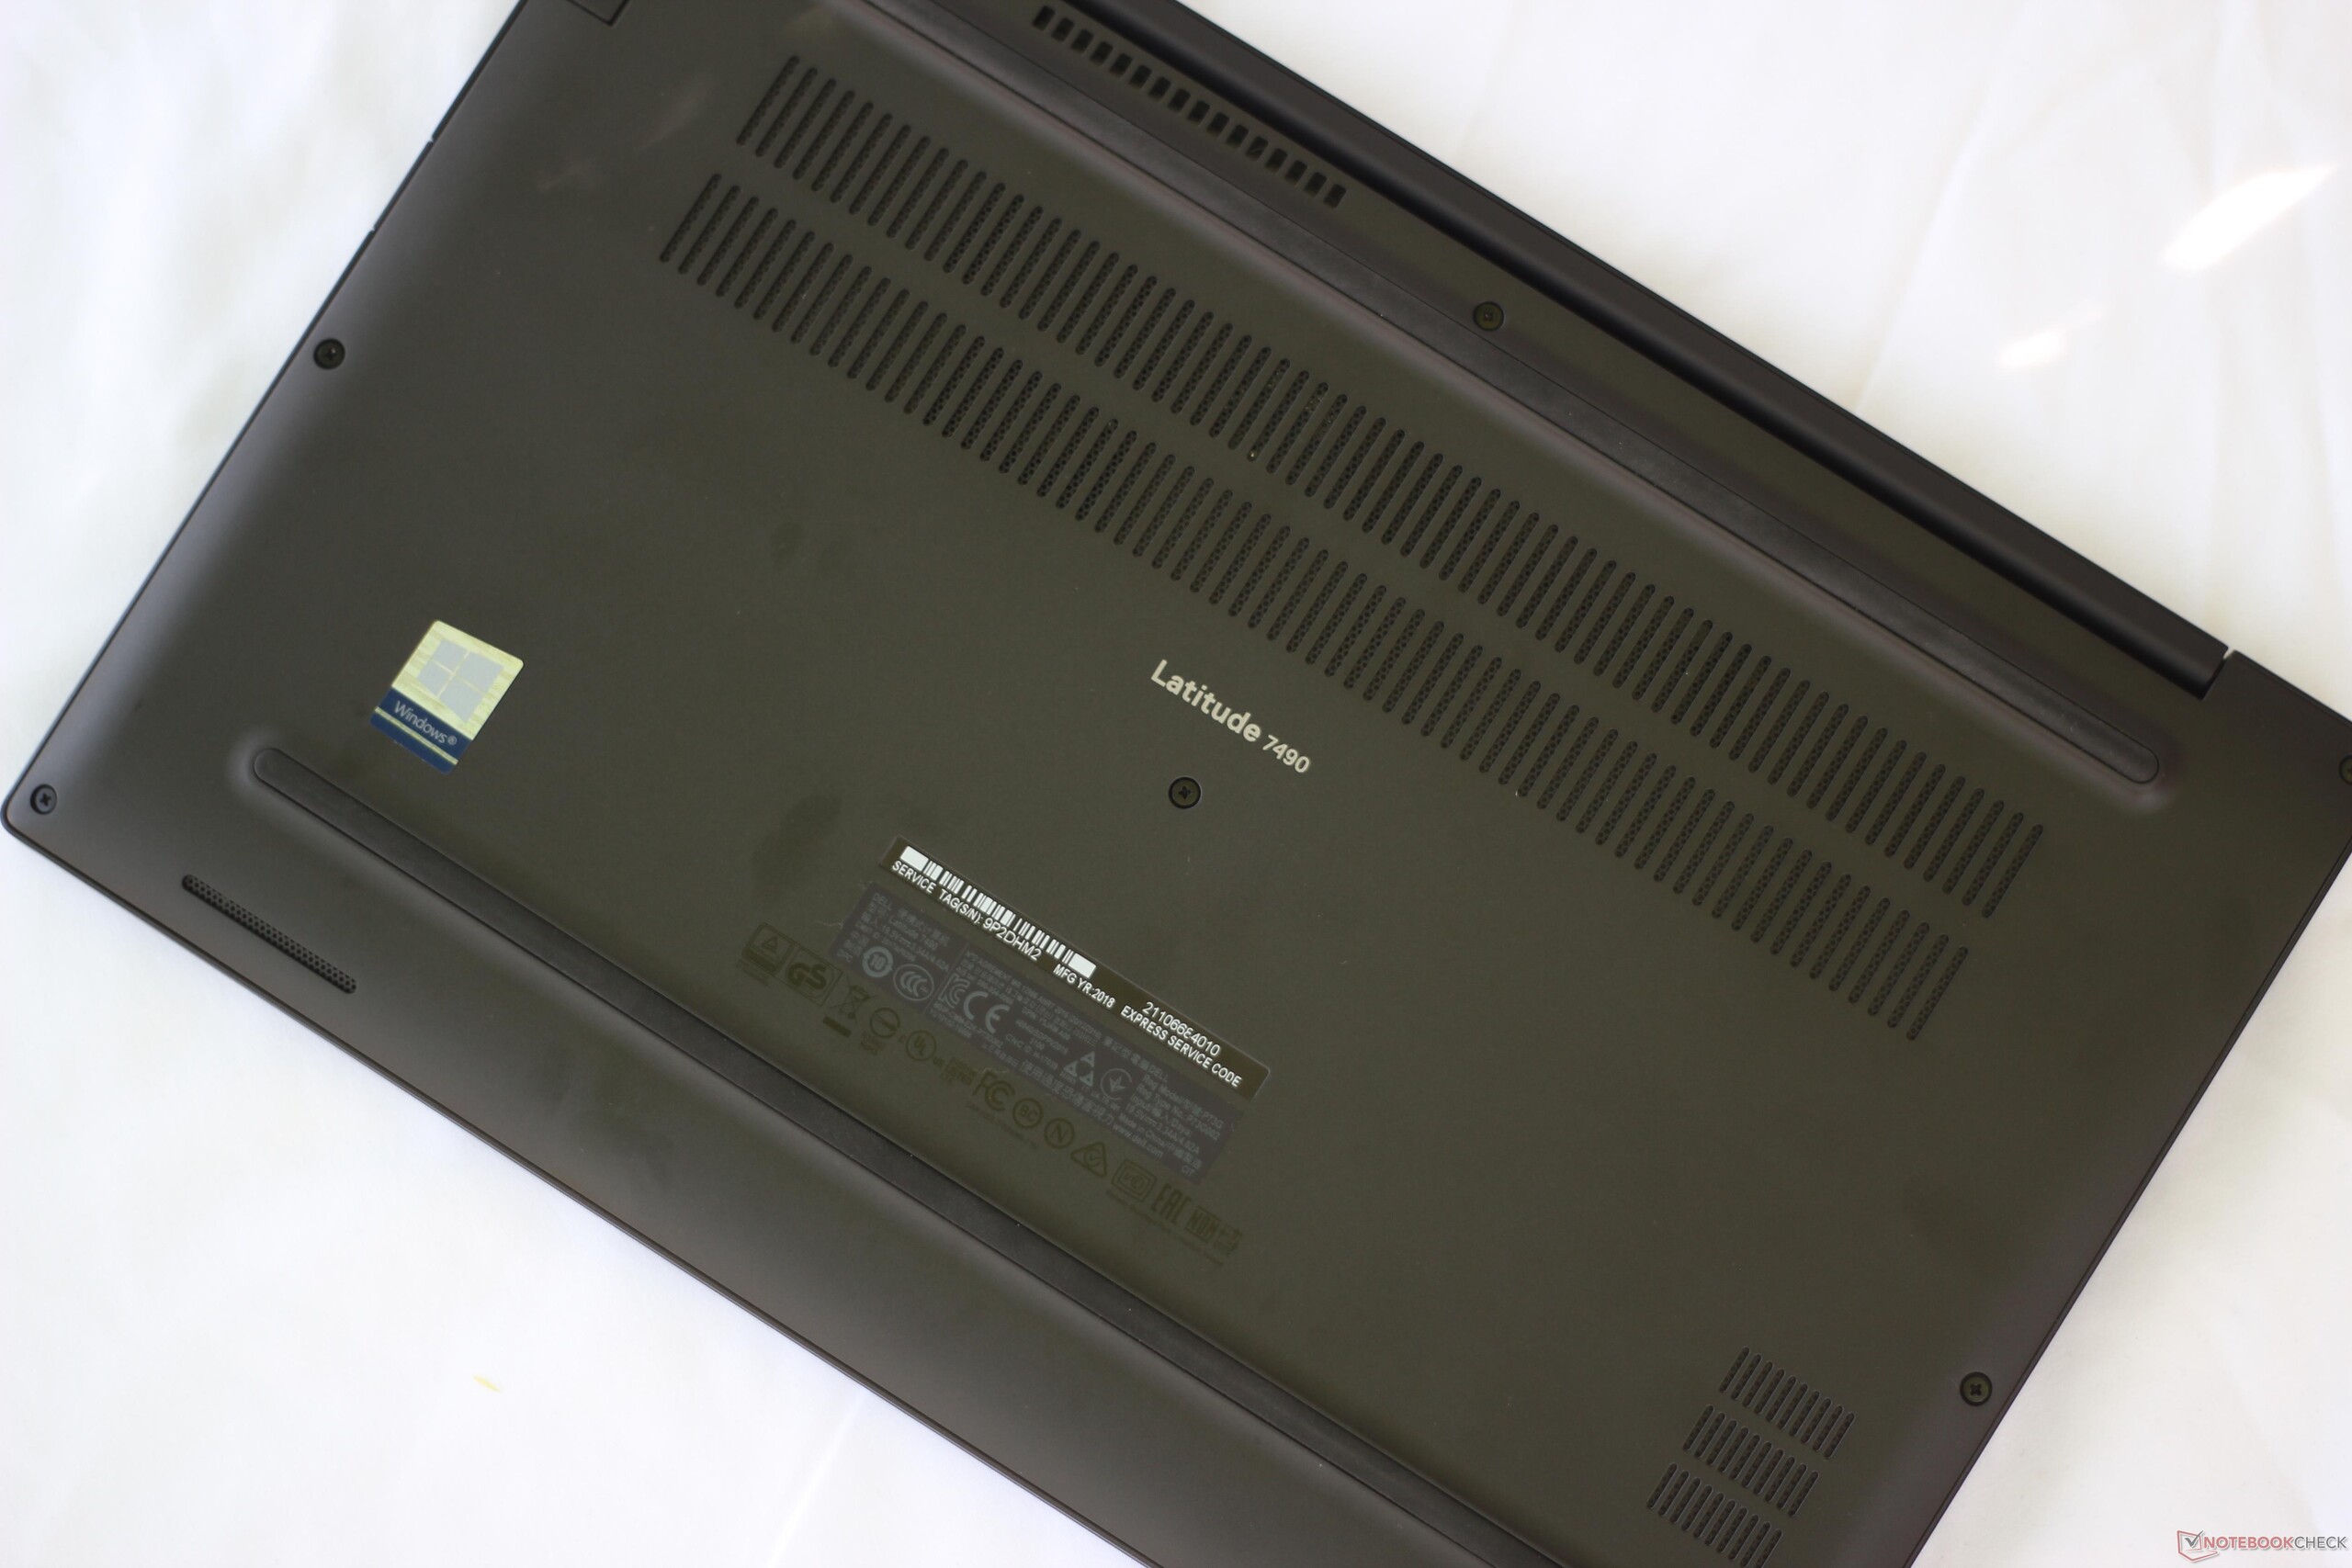
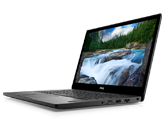
Dell Latitude 7490
- 04/08/2018 v6 (old)
Sam Medley
Price comparison
