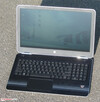
Courte critique du PC portable HP Pavilion 15-aw004ng
Top 10
» Le Top 10 des PC portables multimédia
» Le Top 10 des PC portables de jeu
» Le Top 10 des PC portables de jeu légers
» Le Top 10 des ordinateurs portables bureautiques
» Le Top 10 des PC portables bureautiques premium/professionnels
» Le Top 10 des Stations de travail mobiles
» Le Top 10 des Ultraportables
» Le Top 10 des Ultrabooks
» Le Top 10 des Convertibles
» Le Top 10 des Tablettes
» Le Top 10 des Tablettes Windows
» Le Top 10 des Smartphones
» Le Top 10 des PC Portables á moins de 300 euros
» Le Top 10 des PC Portables á moins de 500 euros
» Le Top 25 des meilleurs écrans d'ordinateurs
Size Comparison
| SD Card Reader | |
| average JPG Copy Test (av. of 3 runs) | |
| Toshiba Satellite L50-C-275 | |
| HP Pavilion 15-aw004ng W8Y60EA | |
| Lenovo Ideapad 500-15ACZ | |
| Lenovo Ideapad 310-15ISK | |
| Asus F555UB-XO043T | |
| Acer Aspire E5-552G-F62G | |
| maximum AS SSD Seq Read Test (1GB) | |
| Toshiba Satellite L50-C-275 | |
| HP Pavilion 15-aw004ng W8Y60EA | |
| Lenovo Ideapad 500-15ACZ | |
| Lenovo Ideapad 310-15ISK | |
| Asus F555UB-XO043T | |
| Acer Aspire E5-552G-F62G | |
| Networking | |
| iperf Server (receive) TCP 1 m | |
| Lenovo Ideapad 310-15ISK | |
| HP Pavilion 15-aw004ng W8Y60EA | |
| iperf Client (transmit) TCP 1 m | |
| Lenovo Ideapad 310-15ISK | |
| HP Pavilion 15-aw004ng W8Y60EA | |
| |||||||||||||||||||||||||
Homogénéité de la luminosité: 89 %
Valeur mesurée au centre, sur batterie: 139 cd/m²
Contraste: 490:1 (Valeurs des noirs: 0.49 cd/m²)
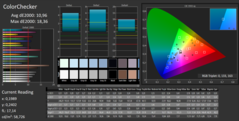
ΔE ColorChecker Calman: 10.96 | ∀{0.5-29.43 Ø4.76}
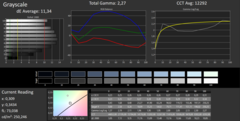
ΔE Greyscale Calman: 11.34 | ∀{0.09-98 Ø5}
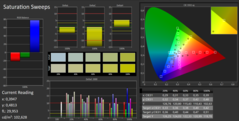
60% sRGB (Argyll 1.6.3 3D)
39% AdobeRGB 1998 (Argyll 1.6.3 3D)
41.71% AdobeRGB 1998 (Argyll 3D)
60.3% sRGB (Argyll 3D)
40.35% Display P3 (Argyll 3D)
Gamma: 2.27
CCT: 12292 K
| HP Pavilion 15-aw004ng W8Y60EA TN LED, 1920x1080 | Acer Aspire E5-552G-F62G TN LED, 1920x1080 | Lenovo Ideapad 500-15ACZ TN LED, 1920x1080 | Toshiba Satellite L50-C-275 IPS, 1920x1080 | Asus F555UB-XO043T TN LED, 1366x768 | Lenovo Ideapad 310-15ISK TN LED, 1366x768 | |
|---|---|---|---|---|---|---|
| Display | -8% | -1% | 47% | -5% | -8% | |
| Display P3 Coverage (%) | 40.35 | 37.13 -8% | 39.82 -1% | 64.1 59% | 38.22 -5% | 37.06 -8% |
| sRGB Coverage (%) | 60.3 | 55.9 -7% | 59.7 -1% | 82.9 37% | 57.5 -5% | 55.8 -7% |
| AdobeRGB 1998 Coverage (%) | 41.71 | 38.36 -8% | 41.16 -1% | 60.6 45% | 39.49 -5% | 38.29 -8% |
| Response Times | -3% | -5% | 25% | -15% | 19% | |
| Response Time Grey 50% / Grey 80% * (ms) | 41 ? | 45 ? -10% | 43 ? -5% | 24 ? 41% | 46 ? -12% | 27 ? 34% |
| Response Time Black / White * (ms) | 23 ? | 22 ? 4% | 24 ? -4% | 21 ? 9% | 27 ? -17% | 22 ? 4% |
| PWM Frequency (Hz) | 50 ? | 50 ? | 50 ? | |||
| Screen | -3% | -3% | 46% | 9% | 5% | |
| Brightness middle (cd/m²) | 240 | 200 -17% | 238 -1% | 294 23% | 214 -11% | 200 -17% |
| Brightness (cd/m²) | 228 | 196 -14% | 221 -3% | 285 25% | 205 -10% | 198 -13% |
| Brightness Distribution (%) | 89 | 76 -15% | 84 -6% | 83 -7% | 82 -8% | 83 -7% |
| Black Level * (cd/m²) | 0.49 | 0.34 31% | 0.49 -0% | 0.26 47% | 0.46 6% | 0.28 43% |
| Contrast (:1) | 490 | 588 20% | 486 -1% | 1131 131% | 465 -5% | 714 46% |
| Colorchecker dE 2000 * | 10.96 | 11.54 -5% | 11.19 -2% | 5.07 54% | 6.52 41% | 10.63 3% |
| Colorchecker dE 2000 max. * | 18.36 | 19.36 -5% | 19.6 -7% | 9.33 49% | 9.1 50% | 15.69 15% |
| Greyscale dE 2000 * | 11.34 | 12.98 -14% | 11.53 -2% | 4.25 63% | 7.05 38% | 11.19 1% |
| Gamma | 2.27 97% | 2.58 85% | 2.41 91% | 2.49 88% | 2.41 91% | 1.78 124% |
| CCT | 12292 53% | 14060 46% | 13057 50% | 6597 99% | 8623 75% | 11258 58% |
| Color Space (Percent of AdobeRGB 1998) (%) | 39 | 36 -8% | 38 -3% | 54 38% | 36.6 -6% | 35 -10% |
| Color Space (Percent of sRGB) (%) | 60 | 56 -7% | 60 0% | 83 38% | 57.8 -4% | 56 -7% |
| Moyenne finale (programmes/paramètres) | -5% /
-4% | -3% /
-2% | 39% /
43% | -4% /
3% | 5% /
5% |
* ... Moindre est la valeur, meilleures sont les performances
Scintillement / MLI (Modulation de largeur d'impulsion)
| Scintillement / MLI (Modulation de largeur d'impulsion) non décelé | ||
En comparaison, 53 % des appareils testés n'emploient pas MDI pour assombrir leur écran. Nous avons relevé une moyenne à 8039 (minimum : 5 - maximum : 343500) Hz dans le cas où une MDI était active. | ||
Temps de réponse de l'écran
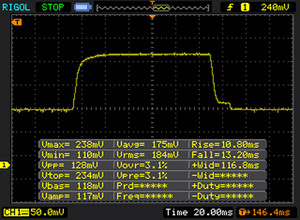
| ↔ Temps de réponse noir à blanc | ||
|---|---|---|
| 23 ms ... hausse ↗ et chute ↘ combinées | ↗ 10 ms hausse | |
| ↘ 13 ms chute | ||
| L'écran montre de bons temps de réponse, mais insuffisant pour du jeu compétitif. En comparaison, tous les appareils testés affichent entre 0.1 (minimum) et 240 (maximum) ms. » 51 % des appareils testés affichent de meilleures performances. Cela signifie que les latences relevées sont moins bonnes que la moyenne (20.1 ms) de tous les appareils testés. | ||
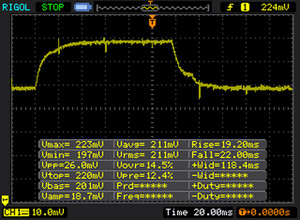
| ↔ Temps de réponse gris 50% à gris 80% | ||
| 41 ms ... hausse ↗ et chute ↘ combinées | ↗ 19 ms hausse | |
| ↘ 22 ms chute | ||
| L'écran souffre de latences très élevées, à éviter pour le jeu. En comparaison, tous les appareils testés affichent entre 0.165 (minimum) et 636 (maximum) ms. » 64 % des appareils testés affichent de meilleures performances. Cela signifie que les latences relevées sont moins bonnes que la moyenne (31.5 ms) de tous les appareils testés. | ||
| Geekbench 3 | |
| 32 Bit Single-Core Score | |
| Asus F555UB-XO043T | |
| Toshiba Satellite L50-C-275 | |
| Asus F555LJ-XX110H | |
| HP Pavilion 15-aw004ng W8Y60EA | |
| Lenovo Ideapad 500-15ACZ | |
| 32 Bit Multi-Core Score | |
| Asus F555UB-XO043T | |
| Toshiba Satellite L50-C-275 | |
| HP Pavilion 15-aw004ng W8Y60EA | |
| Lenovo Ideapad 500-15ACZ | |
| Asus F555LJ-XX110H | |
| JetStream 1.1 - Total Score | |
| Lenovo Ideapad 310-15ISK | |
| Asus F555UB-XO043T | |
| Toshiba Satellite L50-C-275 | |
| HP Pavilion 15-aw004ng W8Y60EA | |
| Lenovo Ideapad 500-15ACZ | |
| Mozilla Kraken 1.1 - Total | |
| Asus F555LJ-XX110H | |
| Lenovo Ideapad 500-15ACZ | |
| HP Pavilion 15-aw004ng W8Y60EA | |
| Asus F555UB-XO043T | |
| Toshiba Satellite L50-C-275 | |
| Octane V2 - Total Score | |
| Toshiba Satellite L50-C-275 | |
| Asus F555UB-XO043T | |
| HP Pavilion 15-aw004ng W8Y60EA | |
| Lenovo Ideapad 500-15ACZ | |
| Asus F555LJ-XX110H | |
* ... Moindre est la valeur, meilleures sont les performances
| PCMark 7 Score | 4340 points | |
| PCMark 8 Home Score Accelerated v2 | 2904 points | |
| PCMark 8 Creative Score Accelerated v2 | 3569 points | |
| PCMark 8 Work Score Accelerated v2 | 3883 points | |
Aide | ||
| HP Pavilion 15-aw004ng W8Y60EA | Acer Aspire E5-552G-F62G Western Digital Scorpio Blue WD5000LPVX | Lenovo Ideapad 500-15ACZ Seagate Momentus SpinPoint M8 ST1000LM024 | Toshiba Satellite L50-C-275 Samsung SSD PM871 MZNLN256HCHP | Asus F555UB-XO043T Seagate Momentus SpinPoint M8 ST1000LM024 | |
|---|---|---|---|---|---|
| CrystalDiskMark 3.0 | -88% | -89% | 67% | -89% | |
| Read Seq (MB/s) | 503 | 110.7 -78% | 96.3 -81% | 490.6 -2% | 108.5 -78% |
| Write Seq (MB/s) | 316.6 | 108.9 -66% | 95.9 -70% | 304.1 -4% | 106.2 -66% |
| Read 512 (MB/s) | 261.9 | 36.71 -86% | 36.46 -86% | 414.6 58% | 34.52 -87% |
| Write 512 (MB/s) | 281.2 | 53.7 -81% | 42.75 -85% | 299.6 7% | 42.45 -85% |
| Read 4k (MB/s) | 17.04 | 0.415 -98% | 0.451 -97% | 36.82 116% | 0.391 -98% |
| Write 4k (MB/s) | 46.55 | 1.261 -97% | 0.895 -98% | 99.5 114% | 0.855 -98% |
| Read 4k QD32 (MB/s) | 125 | 1.126 -99% | 0.847 -99% | 333.4 167% | 0.774 -99% |
| Write 4k QD32 (MB/s) | 131.4 | 1.312 -99% | 0.892 -99% | 236.8 80% | 0.852 -99% |
| 3DMark 06 Standard Score | 8878 points | |
| 3DMark Vantage P Result | 6853 points | |
| 3DMark 11 Performance | 2979 points | |
| 3DMark Ice Storm Standard Score | 44367 points | |
| 3DMark Cloud Gate Standard Score | 5225 points | |
| 3DMark Fire Strike Score | 1678 points | |
| 3DMark Fire Strike Extreme Score | 686 points | |
| 3DMark Time Spy Score | 315 points | |
Aide | ||
| 3DMark 11 - 1280x720 Performance GPU | |
| Acer Aspire E5-552G-F62G | |
| HP Pavilion 15-aw004ng W8Y60EA | |
| Lenovo Ideapad 500-15ACZ | |
| Asus F555UB-XO043T | |
| HP Pavilion 15-aw004ng | |
| Toshiba Satellite L50-C-275 | |
| Lenovo Ideapad 310-15ISK | |
| 3DMark | |
| 1280x720 Cloud Gate Standard Graphics | |
| HP Pavilion 15-aw004ng W8Y60EA | |
| Acer Aspire E5-552G-F62G | |
| Lenovo Ideapad 500-15ACZ | |
| Asus F555UB-XO043T | |
| Toshiba Satellite L50-C-275 | |
| HP Pavilion 15-aw004ng | |
| 1920x1080 Fire Strike Graphics | |
| HP Pavilion 15-aw004ng W8Y60EA | |
| Asus F555UB-XO043T | |
| Toshiba Satellite L50-C-275 | |
| Lenovo Ideapad 500-15ACZ | |
| HP Pavilion 15-aw004ng | |
| Bas | Moyen | Élevé | Ultra | |
|---|---|---|---|---|
| Counter-Strike: GO (2012) | 82 | 77.8 | 71.7 | 50.3 |
| Tomb Raider (2013) | 83.6 | 55.7 | 46.3 | 21.8 |
| BioShock Infinite (2013) | 72.7 | 42.9 | 33.7 | 11.7 |
| Battlefield 4 (2013) | 50.1 | 37.2 | 23.4 | 7.7 |
| Middle-earth: Shadow of Mordor (2014) | 33.3 | 21.3 | 12.2 | |
| Alien: Isolation (2014) | 51.6 | 42.7 | 28 | |
| F1 2014 (2014) | 59 | 42 | 39 | 24 |
| Dragon Age: Inquisition (2014) | 40.8 | 27.8 | 9.6 | |
| Battlefield Hardline (2015) | 37.7 | 29.3 | 14 | 8.3 |
| GTA V (2015) | 54.6 | 52.4 | 11.7 | |
| Batman: Arkham Knight (2015) | 19 | 17 | 7 | |
| Metal Gear Solid V (2015) | 60 | 37.5 | 13.3 | |
| FIFA 16 (2015) | 77.5 | 53.8 | 25 | |
| Anno 2205 (2015) | 36 | 17.8 | 7.4 | |
| Call of Duty: Black Ops 3 (2015) | 38.1 | 26.2 | 11.7 | |
| Assassin's Creed Syndicate (2015) | 15.9 | 13.1 | 6.6 | |
| Rainbow Six Siege (2015) | 53.5 | 33.7 | 13.3 | |
| Rise of the Tomb Raider (2016) | 24.4 | 13.9 | 7.7 | |
| XCOM 2 (2016) | 22 | 8 | 5.2 | |
| Far Cry Primal (2016) | 23 | 10 | 9 | |
| The Division (2016) | 23.3 | 15.1 | 7.1 | |
| Hitman 2016 (2016) | 18.6 | 17.7 | 10.5 | |
| Need for Speed 2016 (2016) | 25.6 | 22.6 | 11.7 | 9.5 |
| Ashes of the Singularity (2016) | 14.2 | 7 | 6.2 | |
| Doom (2016) | 22.4 | 12.8 | 8.3 | |
| Mirror's Edge Catalyst (2016) | 26.4 | 12.8 | 5.8 | |
| No Man's Sky (2016) | 21.8 | 18 | 10 | |
| Deus Ex Mankind Divided (2016) | 15.1 | 10.9 | 5.4 |
| BioShock Infinite - 1366x768 Medium Preset | |
| Asus F555UB-XO043T | |
| Toshiba Satellite L50-C-275 | |
| HP Pavilion 15-aw004ng W8Y60EA | |
| HP Pavilion 15-aw004ng | |
| Lenovo Ideapad 310-15ISK | |
| Lenovo Ideapad 500-15ACZ | |
| Tomb Raider - 1366x768 Normal Preset AA:FX AF:4x | |
| Toshiba Satellite L50-C-275 | |
| HP Pavilion 15-aw004ng W8Y60EA | |
| Lenovo Ideapad 500-15ACZ | |
| Battlefield 4 - 1024x768 Low Preset | |
| HP Pavilion 15-aw004ng | |
| HP Pavilion 15-aw004ng W8Y60EA | |
| Lenovo Ideapad 500-15ACZ | |
| Acer Aspire E5-552G-F62G | |
| FIFA 16 - 1366x768 High Preset AA:2x MS | |
| HP Pavilion 15-aw004ng W8Y60EA | |
| Lenovo Ideapad 500-15ACZ | |
| Acer Aspire E5-552G-F62G | |
| GTA V - 1024x768 Lowest Settings possible | |
| Lenovo Ideapad 310-15ISK | |
| HP Pavilion 15-aw004ng W8Y60EA | |
| F1 2014 - 1920x1080 High Preset | |
| Lenovo Ideapad 310-15ISK | |
| HP Pavilion 15-aw004ng W8Y60EA | |
| Lenovo Ideapad 500-15ACZ | |
| Counter-Strike: GO - 1366x768 High AA:2x MS AF:4x | |
| HP Pavilion 15-aw004ng W8Y60EA | |
Degré de la nuisance sonore
| Au repos |
| 31.7 / 31.9 / 31.9 dB(A) |
| Disque dur |
| 32.2 dB(A) |
| Lecteur DVD |
| 36.6 / dB(A) |
| Fortement sollicité |
| 41 / 42.7 dB(A) |
 | ||
30 dB silencieux 40 dB(A) audible 50 dB(A) bruyant |
||
min: | ||
| HP Pavilion 15-aw004ng W8Y60EA A10-9600P, Radeon R8 M445DX | Acer Aspire E5-552G-F62G FX-8800P, Radeon R8 M365DX | Lenovo Ideapad 500-15ACZ A10-8700P, Radeon R6 M340DX | Toshiba Satellite L50-C-275 6200U, GeForce 930M | Asus F555UB-XO043T 6200U, GeForce 940M | Lenovo Ideapad 310-15ISK 6500U, GeForce 920MX | |
|---|---|---|---|---|---|---|
| Noise | 3% | 0% | 9% | -4% | -1% | |
| arrêt / environnement * (dB) | 31.2 | 31.3 -0% | 31.3 -0% | 22 29% | 31.2 -0% | |
| Idle Minimum * (dB) | 31.7 | 32.4 -2% | 33.1 -4% | 31.3 1% | 34 -7% | 32.6 -3% |
| Idle Average * (dB) | 31.9 | 33.2 -4% | 33.3 -4% | 31.3 2% | 34 -7% | 32.6 -2% |
| Idle Maximum * (dB) | 31.9 | 33.2 -4% | 33.5 -5% | 32.2 -1% | 34.2 -7% | 33.8 -6% |
| Load Average * (dB) | 41 | 36.5 11% | 38.9 5% | 36.4 11% | 38.9 5% | 40.2 2% |
| Load Maximum * (dB) | 42.7 | 34.4 19% | 38.9 9% | 36.6 14% | 43.6 -2% | 40.4 5% |
* ... Moindre est la valeur, meilleures sont les performances
(+) La température maximale du côté supérieur est de 33.4 °C / 92 F, par rapport à la moyenne de 36.9 °C / 98 F, allant de 21.1 à 71 °C pour la classe Multimedia.
(+) Le fond chauffe jusqu'à un maximum de 32.9 °C / 91 F, contre une moyenne de 39.2 °C / 103 F
(+) En utilisation inactive, la température moyenne du côté supérieur est de 26 °C / 79 F, par rapport à la moyenne du dispositif de 31.3 °C / 88 F.
(+) Les repose-poignets et le pavé tactile sont plus froids que la température de la peau avec un maximum de 27 °C / 80.6 F et sont donc froids au toucher.
(±) La température moyenne de la zone de l'appui-paume de dispositifs similaires était de 28.7 °C / 83.7 F (+1.7 °C / #3.1 F).
| HP Pavilion 15-aw004ng W8Y60EA A10-9600P, Radeon R8 M445DX | Acer Aspire E5-552G-F62G FX-8800P, Radeon R8 M365DX | Lenovo Ideapad 500-15ACZ A10-8700P, Radeon R6 M340DX | Toshiba Satellite L50-C-275 6200U, GeForce 930M | Asus F555UB-XO043T 6200U, GeForce 940M | Lenovo Ideapad 310-15ISK 6500U, GeForce 920MX | |
|---|---|---|---|---|---|---|
| Heat | -5% | -4% | -13% | -8% | -10% | |
| Maximum Upper Side * (°C) | 33.4 | 34 -2% | 36 -8% | 42.5 -27% | 33.2 1% | 38.6 -16% |
| Maximum Bottom * (°C) | 32.9 | 39.6 -20% | 39.2 -19% | 46.9 -43% | 44 -34% | 42 -28% |
| Idle Upper Side * (°C) | 27.7 | 27.7 -0% | 27.1 2% | 25.8 7% | 28.2 -2% | 28.1 -1% |
| Idle Bottom * (°C) | 29.4 | 29 1% | 26.6 10% | 26 12% | 28.1 4% | 28.1 4% |
* ... Moindre est la valeur, meilleures sont les performances
HP Pavilion 15-aw004ng W8Y60EA analyse audio
(-) | haut-parleurs pas très forts (68 dB)
Basses 100 - 315 Hz
(-) | presque aucune basse - en moyenne 22.8% plus bas que la médiane
(+) | les basses sont linéaires (5.9% delta à la fréquence précédente)
Médiums 400 - 2000 Hz
(±) | médiane supérieure - en moyenne 5.5% supérieure à la médiane
(±) | la linéarité des médiums est moyenne (12.2% delta à la fréquence précédente)
Aiguës 2 - 16 kHz
(+) | des sommets équilibrés - à seulement 4.7% de la médiane
(+) | les aigus sont linéaires (4.7% delta à la fréquence précédente)
Globalement 100 - 16 000 Hz
(±) | la linéarité du son global est moyenne (29.1% de différence avec la médiane)
Par rapport à la même classe
» 94% de tous les appareils testés de cette catégorie étaient meilleurs, 2% similaires, 4% pires
» Le meilleur avait un delta de 5%, la moyenne était de 17%, le pire était de 45%.
Par rapport à tous les appareils testés
» 87% de tous les appareils testés étaient meilleurs, 2% similaires, 11% pires
» Le meilleur avait un delta de 4%, la moyenne était de 24%, le pire était de 134%.
Apple MacBook 12 (Early 2016) 1.1 GHz analyse audio
(+) | les haut-parleurs peuvent jouer relativement fort (83.6# dB)
Basses 100 - 315 Hz
(±) | basse réduite - en moyenne 11.3% inférieure à la médiane
(±) | la linéarité des basses est moyenne (14.2% delta à la fréquence précédente)
Médiums 400 - 2000 Hz
(+) | médiane équilibrée - seulement 2.4% de la médiane
(+) | les médiums sont linéaires (5.5% delta à la fréquence précédente)
Aiguës 2 - 16 kHz
(+) | des sommets équilibrés - à seulement 2% de la médiane
(+) | les aigus sont linéaires (4.5% delta à la fréquence précédente)
Globalement 100 - 16 000 Hz
(+) | le son global est linéaire (10.2% différence à la médiane)
Par rapport à la même classe
» 7% de tous les appareils testés de cette catégorie étaient meilleurs, 2% similaires, 91% pires
» Le meilleur avait un delta de 5%, la moyenne était de 18%, le pire était de 53%.
Par rapport à tous les appareils testés
» 4% de tous les appareils testés étaient meilleurs, 1% similaires, 94% pires
» Le meilleur avait un delta de 4%, la moyenne était de 24%, le pire était de 134%.
| Éteint/en veille | |
| Au repos | |
| Fortement sollicité |
|
Légende:
min: | |
| HP Pavilion 15-aw004ng W8Y60EA A10-9600P, Radeon R8 M445DX | Acer Aspire E5-552G-F62G FX-8800P, Radeon R8 M365DX | Lenovo Ideapad 500-15ACZ A10-8700P, Radeon R6 M340DX | Toshiba Satellite L50-C-275 6200U, GeForce 930M | Asus F555UB-XO043T 6200U, GeForce 940M | Lenovo Ideapad 310-15ISK 6500U, GeForce 920MX | |
|---|---|---|---|---|---|---|
| Power Consumption | -2% | -10% | 4% | 13% | 2% | |
| Idle Minimum * (Watt) | 5.5 | 6.7 -22% | 6.8 -24% | 4.7 15% | 4.7 15% | 7 -27% |
| Idle Average * (Watt) | 8.2 | 9.8 -20% | 10.5 -28% | 9.9 -21% | 6.5 21% | 8 2% |
| Idle Maximum * (Watt) | 9.5 | 10.6 -12% | 11 -16% | 10.1 -6% | 6.8 28% | 8.4 12% |
| Load Average * (Watt) | 44.5 | 46 -3% | 41.6 7% | 36 19% | 42.7 4% | 38.8 13% |
| Load Maximum * (Watt) | 58 | 32 45% | 51 12% | 51 12% | 59 -2% | 52.8 9% |
* ... Moindre est la valeur, meilleures sont les performances
| HP Pavilion 15-aw004ng W8Y60EA 41 Wh | Acer Aspire E5-552G-F62G 37 Wh | Lenovo Ideapad 500-15ACZ 32 Wh | Toshiba Satellite L50-C-275 45 Wh | Asus F555UB-XO043T 37 Wh | |
|---|---|---|---|---|---|
| Autonomie de la batterie | -32% | -31% | 35% | 37% | |
| Reader / Idle (h) | 9.3 | 6.7 -28% | 6.1 -34% | ||
| H.264 (h) | 3.2 | 2.8 -13% | |||
| WiFi v1.3 (h) | 4.3 | 2.8 -35% | 3.1 -28% | 5.8 35% | 5.9 37% |
| Load (h) | 1.6 | 0.8 -50% |
Points positifs
Points négatifs
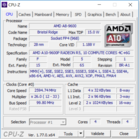
Le processeur AMD présent dans le modèle que nous avons testé offre des performances suffisantes pour une utilisation quotidienne. Le PC reste la plupart du temps silencieux et chauffe à peine. La présence d'un SSD participe à la fluidité du système. Malheureusement, il n'y a pas de trappe de maintenance, donc pour changer le SSD il faudra démonter le PC. Le clavier est convenable pour l'utilisation à domicile, l'autonomie n'a rien de spécial. HP aurait pu offrir de meilleures performances sur ces aspects.
Pour environ 550 €, le Pavilion 15-aw004ng est un bon PC polyvalent pour les utilisateurs aux besoins basiques.
A ce prix relativement peu élevé, HP a inclut un écran Full HD ainsi qu'un système double GPU. Par contre, l'écran n'est pas très lumineux, le contraste est faible et les angles de vision restreints. De plus, en termes de performances en jeu, le système à double GPU AMD n'est pas aussi performant que ce que propose le concurrent Nvidia. La garantie est limitée à un an. En résumé, HP propose un PC de 15.6 pouces abordable avec des défauts évidents, qui devrait convenir seulement à une poignée d'utilisateurs.
Pour plus de détails, la version complète de ce test (en anglais) est disponible ici.
HP Pavilion 15-aw004ng W8Y60EA
- 09/22/2016 v5.1 (old)
Sascha Mölck


