Courte critique du PC portable Lenovo ThinkPad E580 (i5-8250U, UHD 620, SSD)
| SD Card Reader | |
| average JPG Copy Test (av. of 3 runs) | |
| Schenker Slim 15 L17 (Toshiba Exceria Pro SDXC 64 GB UHS-II) | |
| HP ProBook 450 G5-2UB53EA (Toshiba Exceria Pro SDXC 64 GB UHS-II) | |
| Lenovo ThinkPad E580-20KSCTO1WW (Toshiba Exceria Pro M501) | |
| Lenovo ThinkPad E580-20KS001RGE (Toshiba Exceria Pro SDXC 64 GB UHS-II) | |
| Moyenne de la classe Office (19.8 - 198.5, n=22, 2 dernières années) | |
| Acer TravelMate P2510-M-51ZQ (Toshiba Exceria Pro SDXC 64 GB UHS-II) | |
| Dell Vostro 15 3568 (Toshiba Exceria Pro SDXC 64 GB UHS-II) | |
| maximum AS SSD Seq Read Test (1GB) | |
| HP ProBook 450 G5-2UB53EA (Toshiba Exceria Pro SDXC 64 GB UHS-II) | |
| Lenovo ThinkPad E580-20KSCTO1WW (Toshiba Exceria Pro M501) | |
| Schenker Slim 15 L17 (Toshiba Exceria Pro SDXC 64 GB UHS-II) | |
| Lenovo ThinkPad E580-20KS001RGE (Toshiba Exceria Pro SDXC 64 GB UHS-II) | |
| Moyenne de la classe Office (27.4 - 249, n=21, 2 dernières années) | |
| Acer TravelMate P2510-M-51ZQ (Toshiba Exceria Pro SDXC 64 GB UHS-II) | |
| Dell Vostro 15 3568 (Toshiba Exceria Pro SDXC 64 GB UHS-II) | |
| Networking | |
| iperf3 transmit AX12 | |
| Acer TravelMate P2510-M-51ZQ | |
| Lenovo ThinkPad E570-20H6S02M00 | |
| Schenker Slim 15 L17 | |
| HP ProBook 450 G5-2UB53EA | |
| Lenovo ThinkPad E580-20KS001RGE | |
| Dell Vostro 15 3568 | |
| Lenovo ThinkPad E580-20KSCTO1WW | |
| iperf3 receive AX12 | |
| HP ProBook 450 G5-2UB53EA | |
| Schenker Slim 15 L17 | |
| Acer TravelMate P2510-M-51ZQ | |
| Lenovo ThinkPad E570-20H6S02M00 | |
| Dell Vostro 15 3568 | |
| Lenovo ThinkPad E580-20KSCTO1WW | |
| Lenovo ThinkPad E580-20KS001RGE | |
| |||||||||||||||||||||||||
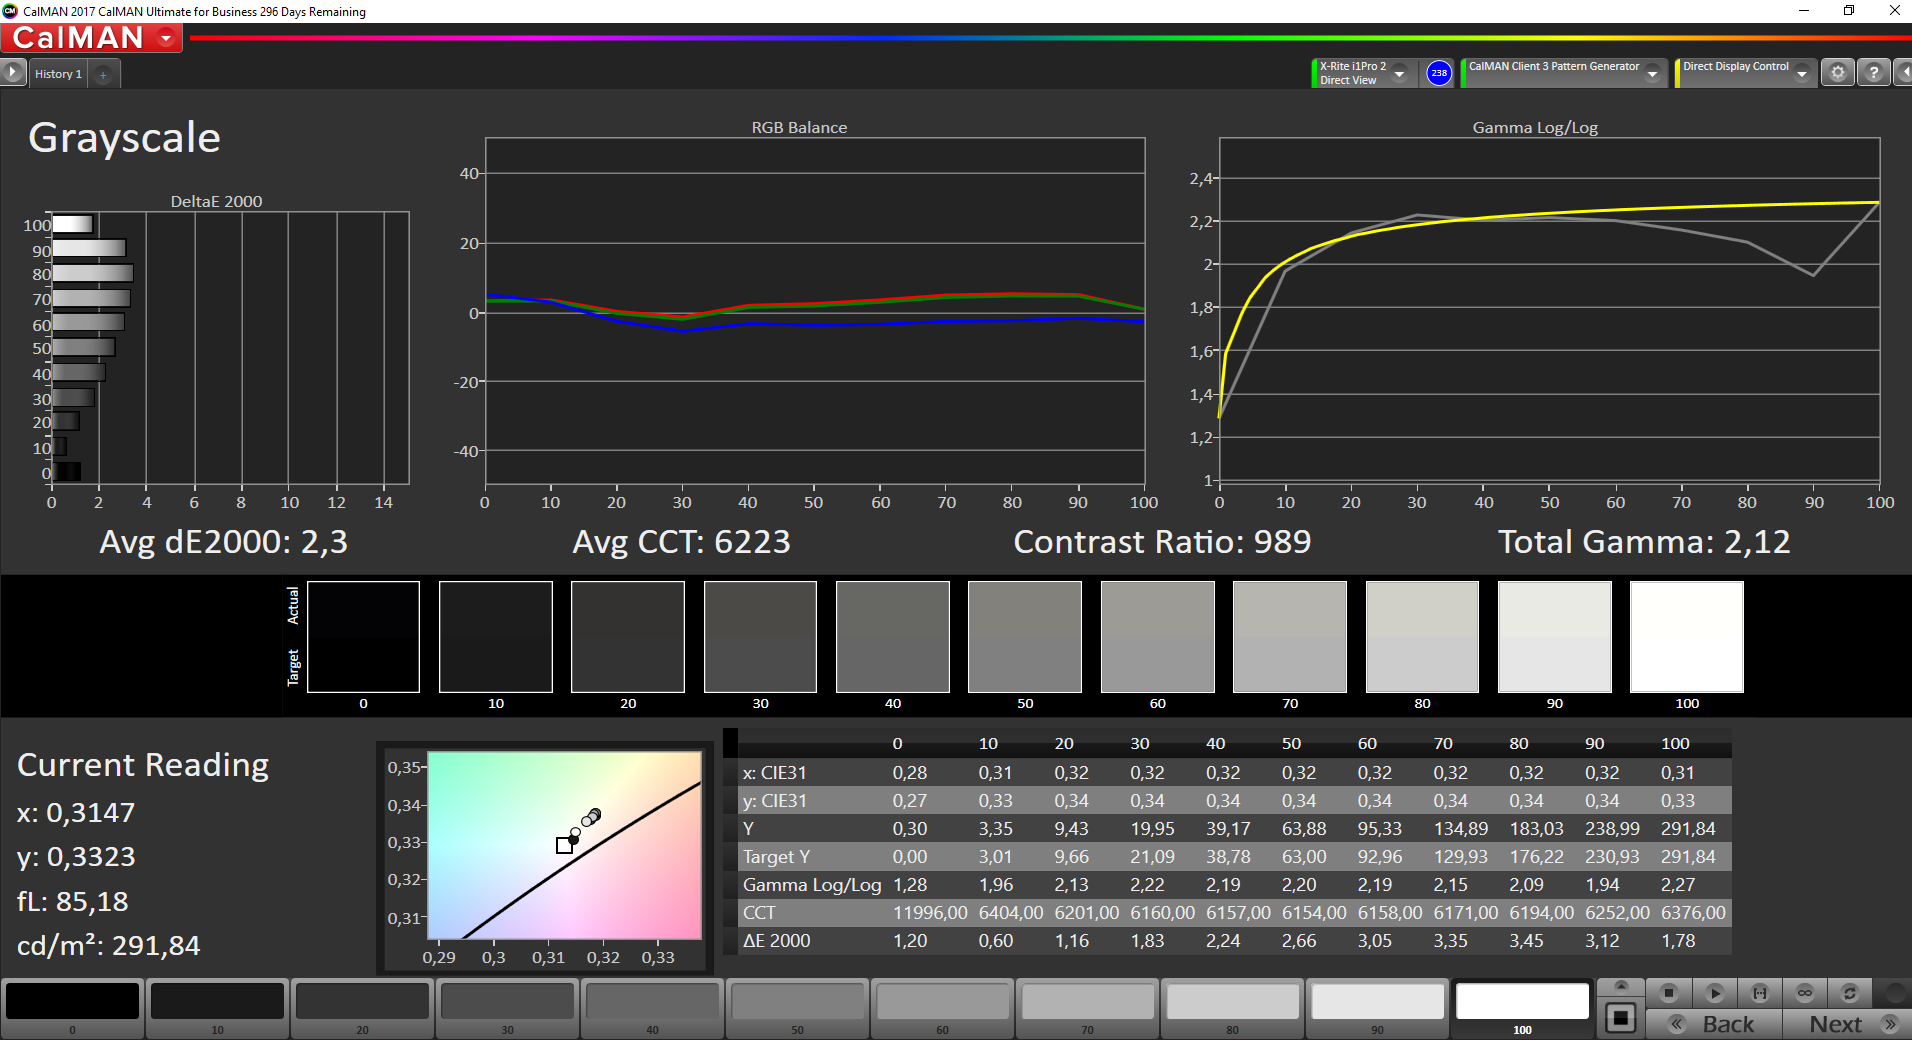
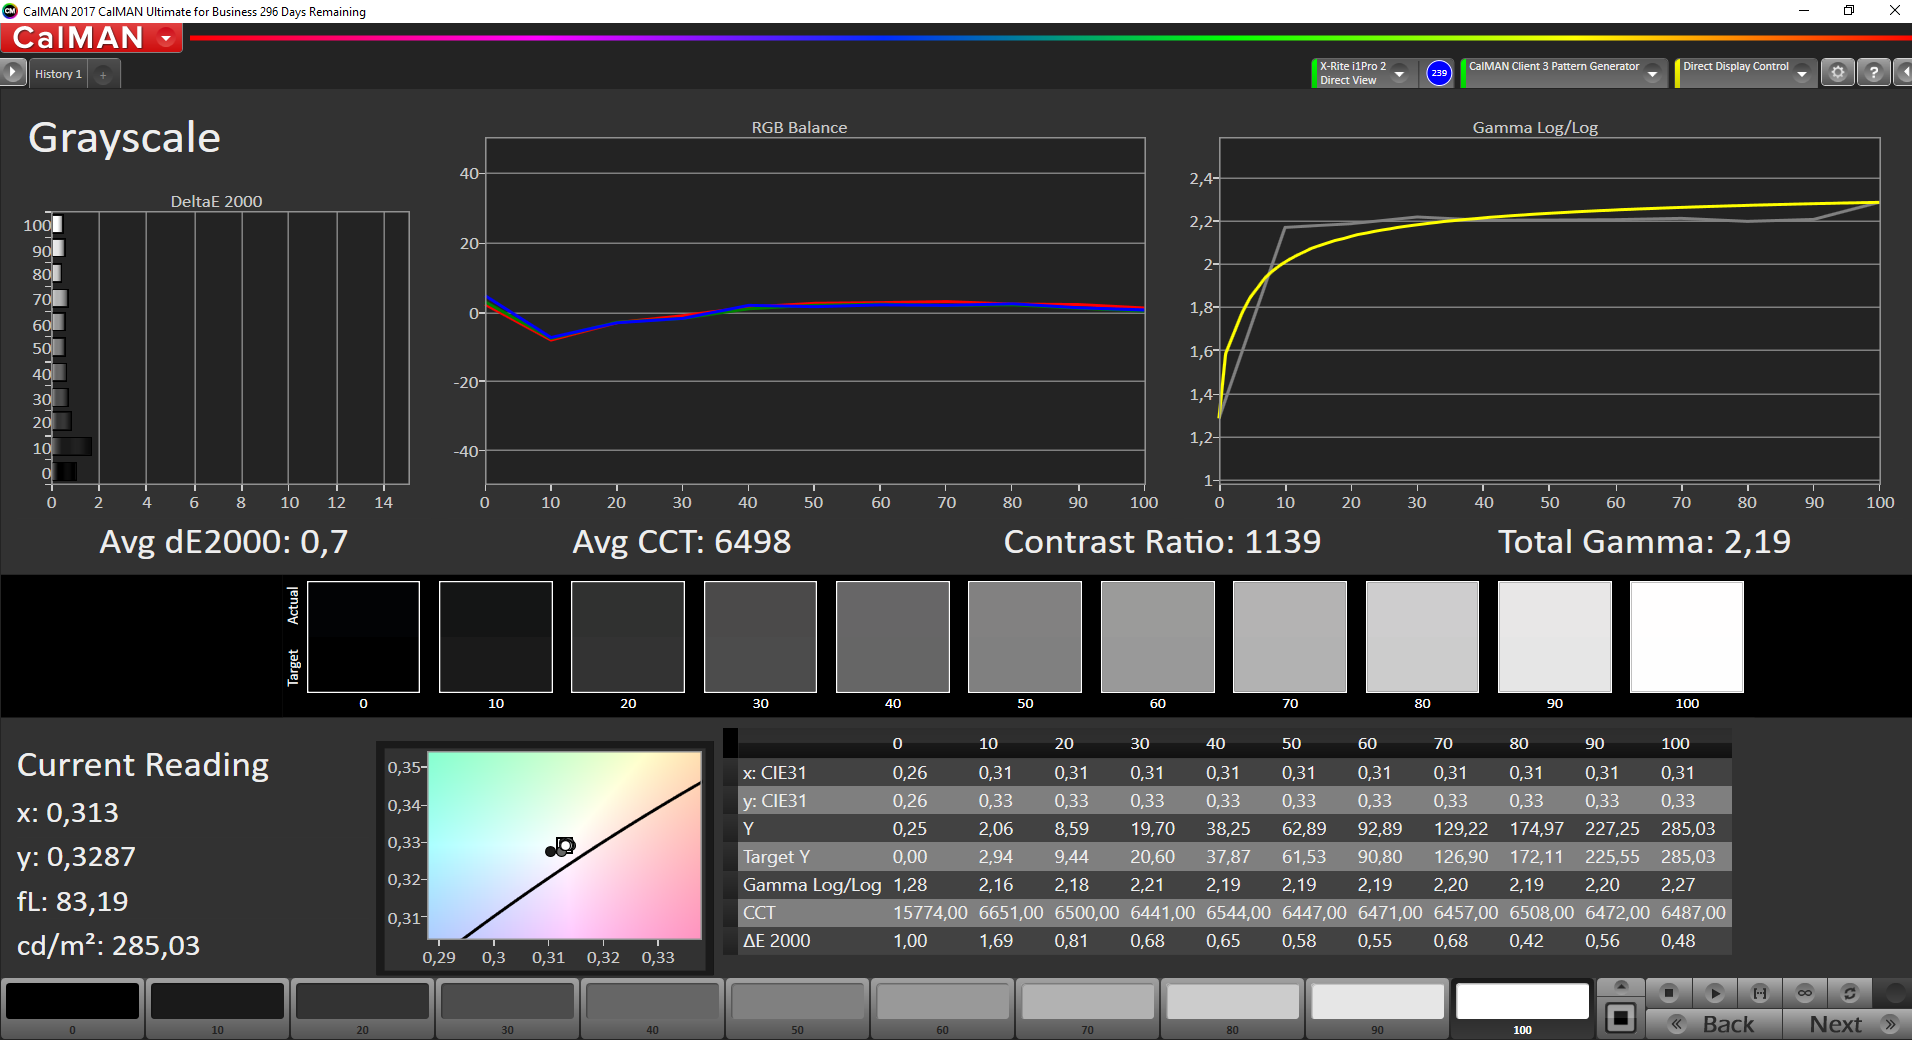
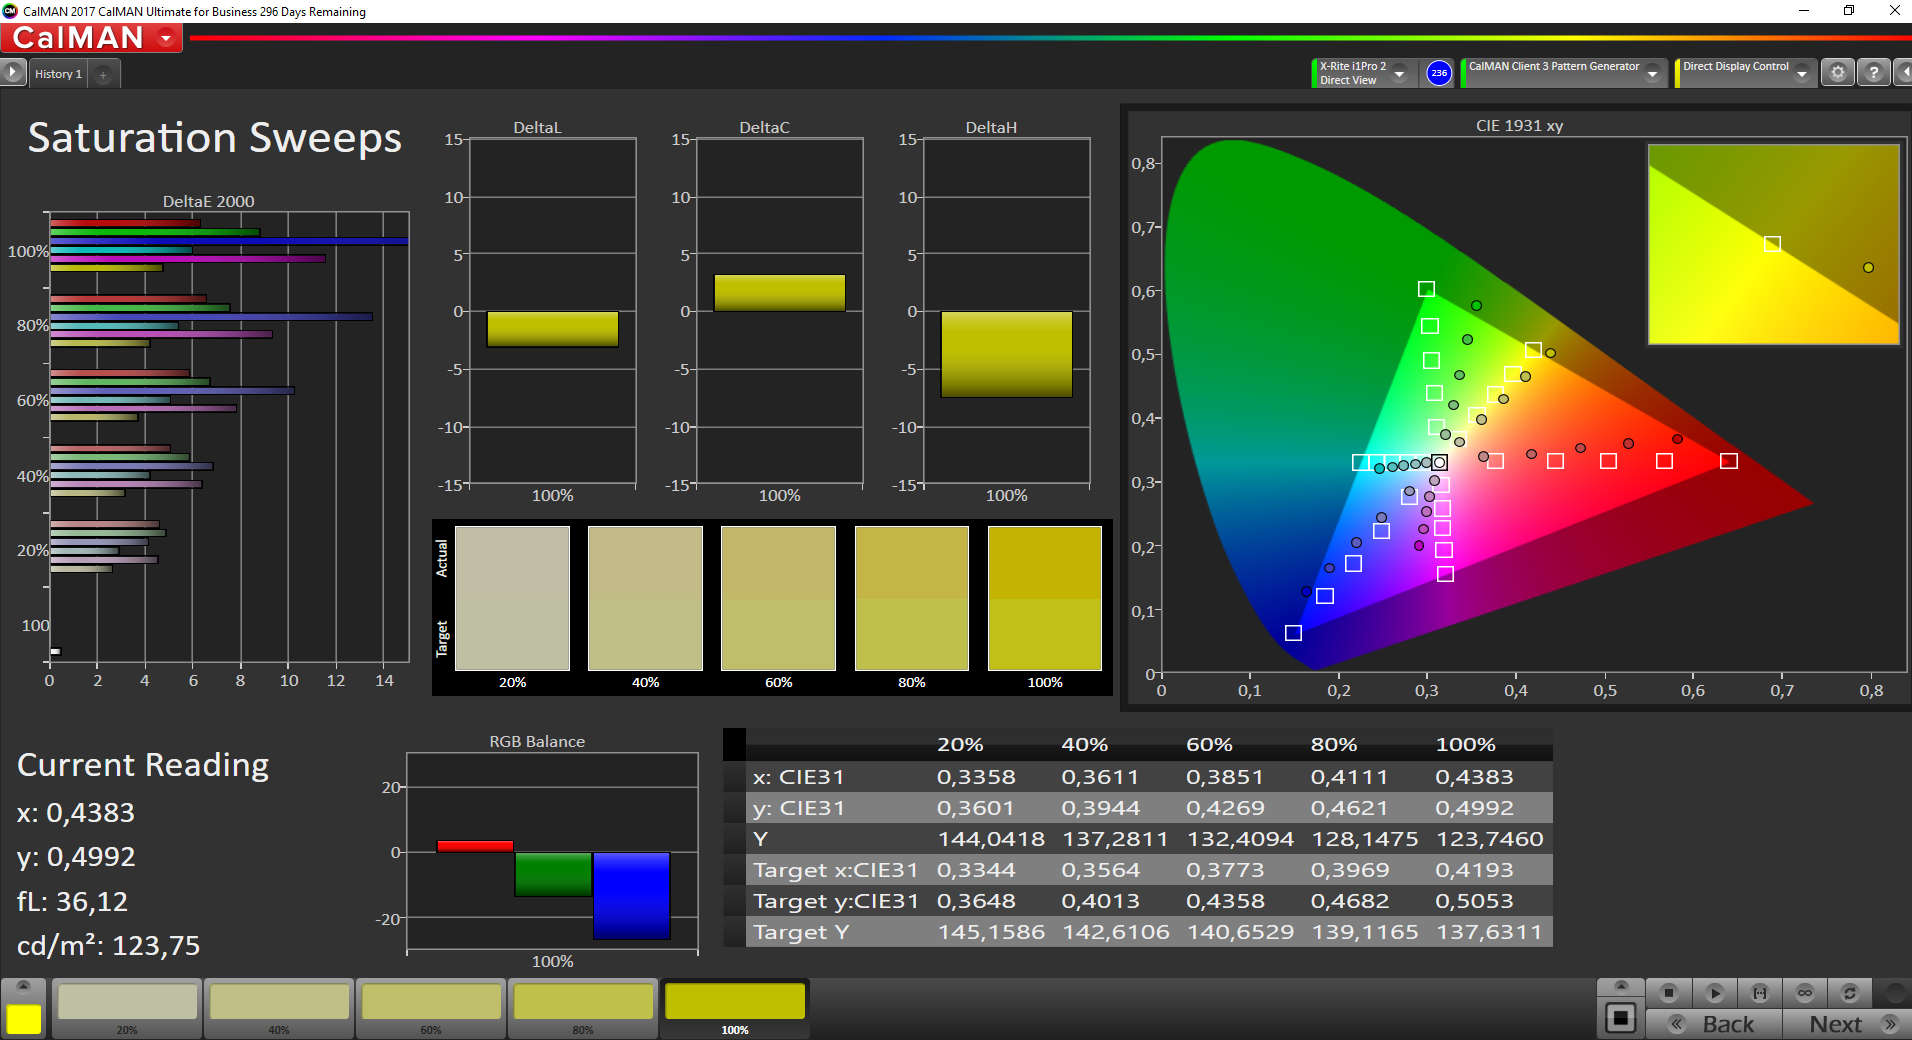
Homogénéité de la luminosité: 84 %
Valeur mesurée au centre, sur batterie: 291 cd/m²
Contraste: 973:1 (Valeurs des noirs: 0.3 cd/m²)
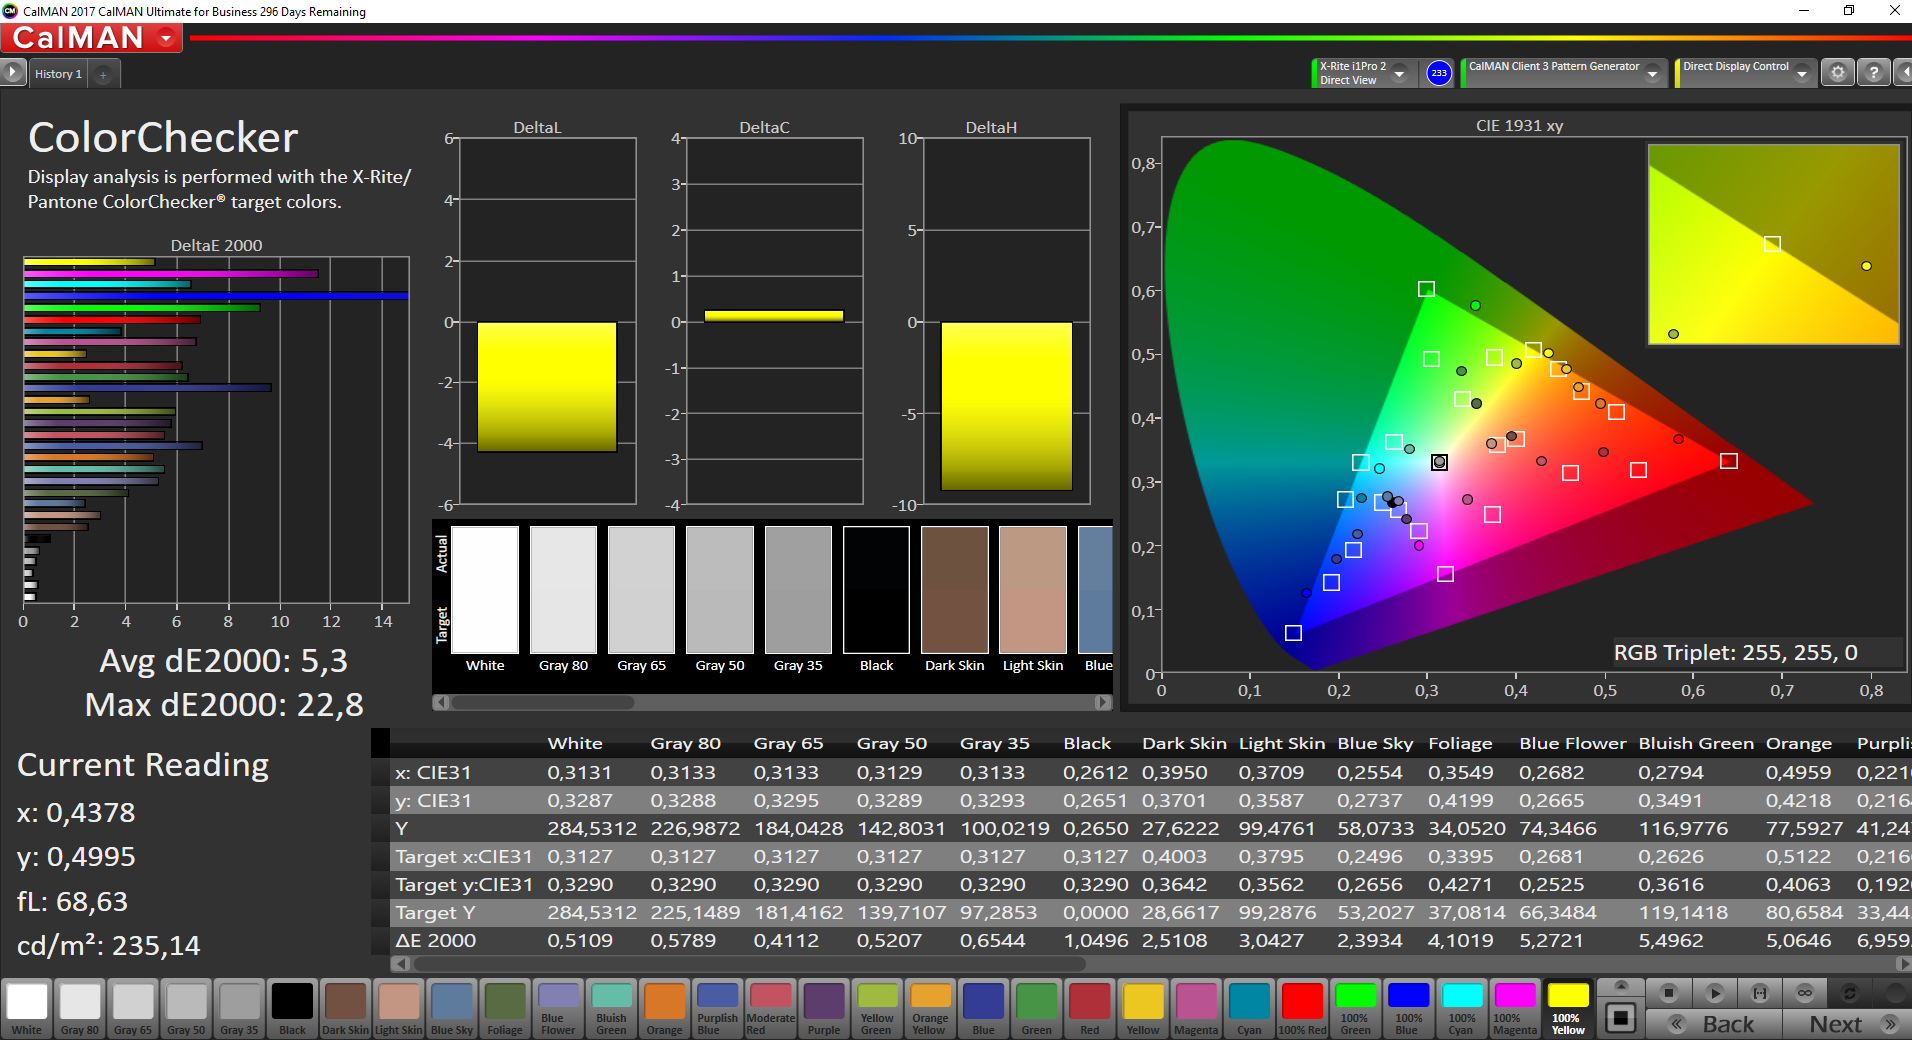
ΔE ColorChecker Calman: 5.8 | ∀{0.5-29.43 Ø4.71}
ΔE Greyscale Calman: 2.3 | ∀{0.09-98 Ø4.96}
58% sRGB (Argyll 1.6.3 3D)
37.6% AdobeRGB 1998 (Argyll 1.6.3 3D)
41.15% AdobeRGB 1998 (Argyll 3D)
58.5% sRGB (Argyll 3D)
39.83% Display P3 (Argyll 3D)
Gamma: 2.12
CCT: 6223 K
| Lenovo ThinkPad E580-20KSCTO1WW BOE NV156FHM-N49, , 1920x1080, 15.6" | Lenovo ThinkPad E580-20KS001RGE BOE NV156FHM-N49, , 1920x1080, 15.6" | Lenovo ThinkPad E570-20H6S02M00 Lenovo NT156WHM-N42, , 1366x768, 15.6" | HP ProBook 450 G5-2UB53EA AUO41ED, , 1920x1080, 15.6" | Acer TravelMate P2510-M-51ZQ Chi Mei CMN15D3 / N156HCE-EAA, , 1920x1080, 15.6" | Schenker Slim 15 L17 LG LP156WF6, , 1920x1080, 15.6" | Dell Vostro 15 3568 BOE0690 / NT15N41 / Dell C1JFR, , 1920x1080, 15.6" | |
|---|---|---|---|---|---|---|---|
| Display | -0% | -7% | -3% | 7% | 50% | -0% | |
| Display P3 Coverage (%) | 39.83 | 40 0% | 36.79 -8% | 38.04 -4% | 42.44 7% | 63.9 60% | 39.39 -1% |
| sRGB Coverage (%) | 58.5 | 58.2 -1% | 55.4 -5% | 57.3 -2% | 63.2 8% | 82.8 42% | 59.3 1% |
| AdobeRGB 1998 Coverage (%) | 41.15 | 41.32 0% | 38.01 -8% | 39.31 -4% | 43.94 7% | 60.5 47% | 40.69 -1% |
| Response Times | 8% | 35% | -2% | 11% | 20% | 45% | |
| Response Time Grey 50% / Grey 80% * (ms) | 48.4 ? | 48 ? 1% | 46 ? 5% | 52.4 ? -8% | 45 ? 7% | 40 ? 17% | 39 ? 19% |
| Response Time Black / White * (ms) | 37.6 ? | 32 ? 15% | 13 ? 65% | 36 ? 4% | 32 ? 15% | 29.2 ? 22% | 11 ? 71% |
| PWM Frequency (Hz) | 22030 ? | 25000 ? | 200 ? | 25000 ? | 20660 ? | 28410 ? | |
| Screen | 13% | -76% | -18% | -11% | 17% | -74% | |
| Brightness middle (cd/m²) | 292 | 290 -1% | 242 -17% | 252 -14% | 215 -26% | 333 14% | 195 -33% |
| Brightness (cd/m²) | 272 | 267 -2% | 233 -14% | 249 -8% | 198 -27% | 336 24% | 195 -28% |
| Brightness Distribution (%) | 84 | 81 -4% | 73 -13% | 88 5% | 78 -7% | 93 11% | 89 6% |
| Black Level * (cd/m²) | 0.3 | 0.19 37% | 0.59 -97% | 0.22 27% | 0.32 -7% | 0.3 -0% | 0.44 -47% |
| Contrast (:1) | 973 | 1526 57% | 410 -58% | 1145 18% | 672 -31% | 1110 14% | 443 -54% |
| Colorchecker dE 2000 * | 5.8 | 4.9 16% | 10.9 -88% | 6.9 -19% | 5.15 11% | 4.7 19% | 12.23 -111% |
| Colorchecker dE 2000 max. * | 22.4 | 9.52 57% | 20.84 7% | 18.4 18% | 10.89 51% | 9.7 57% | 20.85 7% |
| Greyscale dE 2000 * | 2.3 | 2.92 -27% | 13.07 -468% | 6.9 -200% | 4.25 -85% | 3.5 -52% | 13.39 -482% |
| Gamma | 2.12 104% | 2.31 95% | 2.37 93% | 2.43 91% | 2.61 84% | 2.26 97% | 2.5 88% |
| CCT | 6223 104% | 6091 107% | 13123 50% | 7524 86% | 6603 98% | 6339 103% | 15759 41% |
| Color Space (Percent of AdobeRGB 1998) (%) | 37.6 | 37 -2% | 35 -7% | 36.3 -3% | 40 6% | 54.2 44% | 38 1% |
| Color Space (Percent of sRGB) (%) | 58 | 58 0% | 55 -5% | 57.2 -1% | 63 9% | 82.7 43% | 59 2% |
| Moyenne finale (programmes/paramètres) | 7% /
10% | -16% /
-47% | -8% /
-13% | 2% /
-4% | 29% /
24% | -10% /
-43% |
* ... Moindre est la valeur, meilleures sont les performances


Temps de réponse de l'écran
| ↔ Temps de réponse noir à blanc | ||
|---|---|---|
| 37.6 ms ... hausse ↗ et chute ↘ combinées | ↗ 21.2 ms hausse | 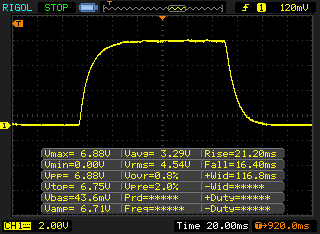 |
| ↘ 16.4 ms chute | ||
| L'écran souffre de latences très élevées, à éviter pour le jeu. En comparaison, tous les appareils testés affichent entre 0.1 (minimum) et 240 (maximum) ms. » 95 % des appareils testés affichent de meilleures performances. Cela signifie que les latences relevées sont moins bonnes que la moyenne (19.8 ms) de tous les appareils testés. | ||
| ↔ Temps de réponse gris 50% à gris 80% | ||
| 48.4 ms ... hausse ↗ et chute ↘ combinées | ↗ 25.6 ms hausse | 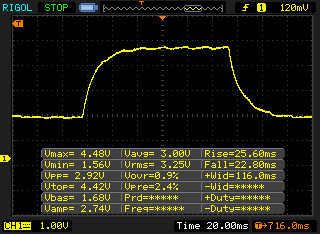 |
| ↘ 22.8 ms chute | ||
| L'écran souffre de latences très élevées, à éviter pour le jeu. En comparaison, tous les appareils testés affichent entre 0.165 (minimum) et 636 (maximum) ms. » 84 % des appareils testés affichent de meilleures performances. Cela signifie que les latences relevées sont moins bonnes que la moyenne (31 ms) de tous les appareils testés. | ||
Scintillement / MLI (Modulation de largeur d'impulsion)
| Scintillement / MLI (Modulation de largeur d'impulsion) décelé | 22030 Hz | ≤ 99 Niveau de luminosité | 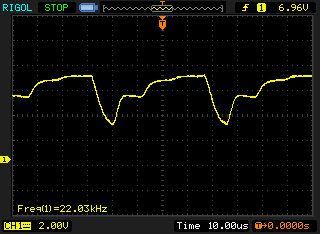 |
Le rétroéclairage de l'écran scintille à la fréquence de 22030 Hz (certainement du fait de l'utilisation d'une MDI - Modulation de largeur d'impulsion) à un niveau de luminosité inférieur ou égal à 99 % . Aucun scintillement ne devrait être perceptible au-dessus de cette valeur. La fréquence de rafraîchissement de 22030 Hz est élevée, la grande majorité des utilisateurs ne devrait pas percevoir de scintillements et être sujette à une fatigue oculaire accrue. En comparaison, 52 % des appareils testés n'emploient pas MDI pour assombrir leur écran. Nous avons relevé une moyenne à 7754 (minimum : 5 - maximum : 343500) Hz dans le cas où une MDI était active. | |||

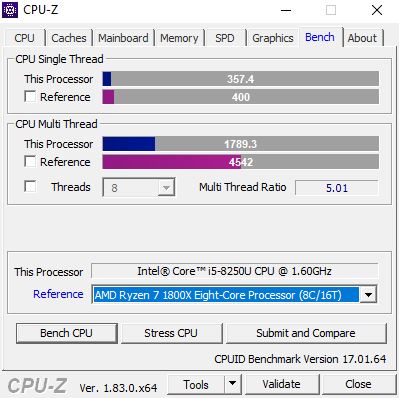
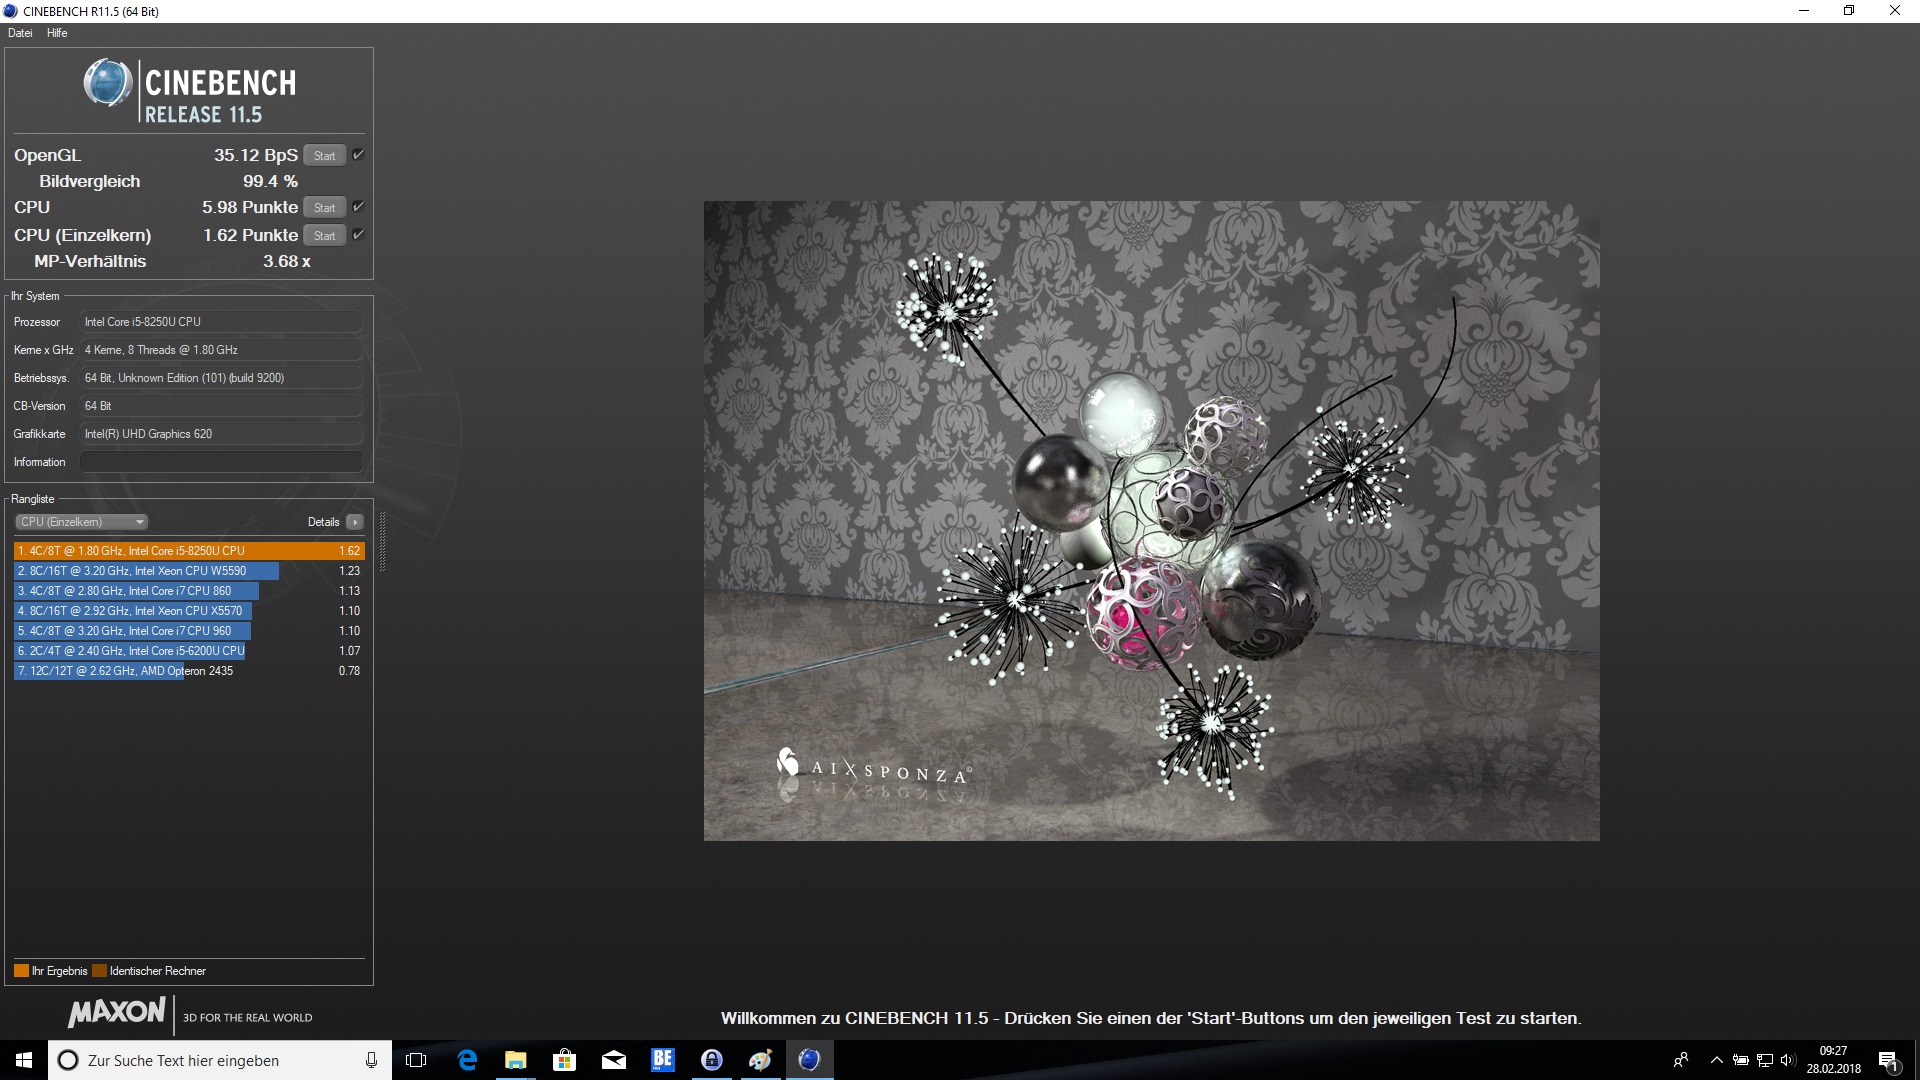
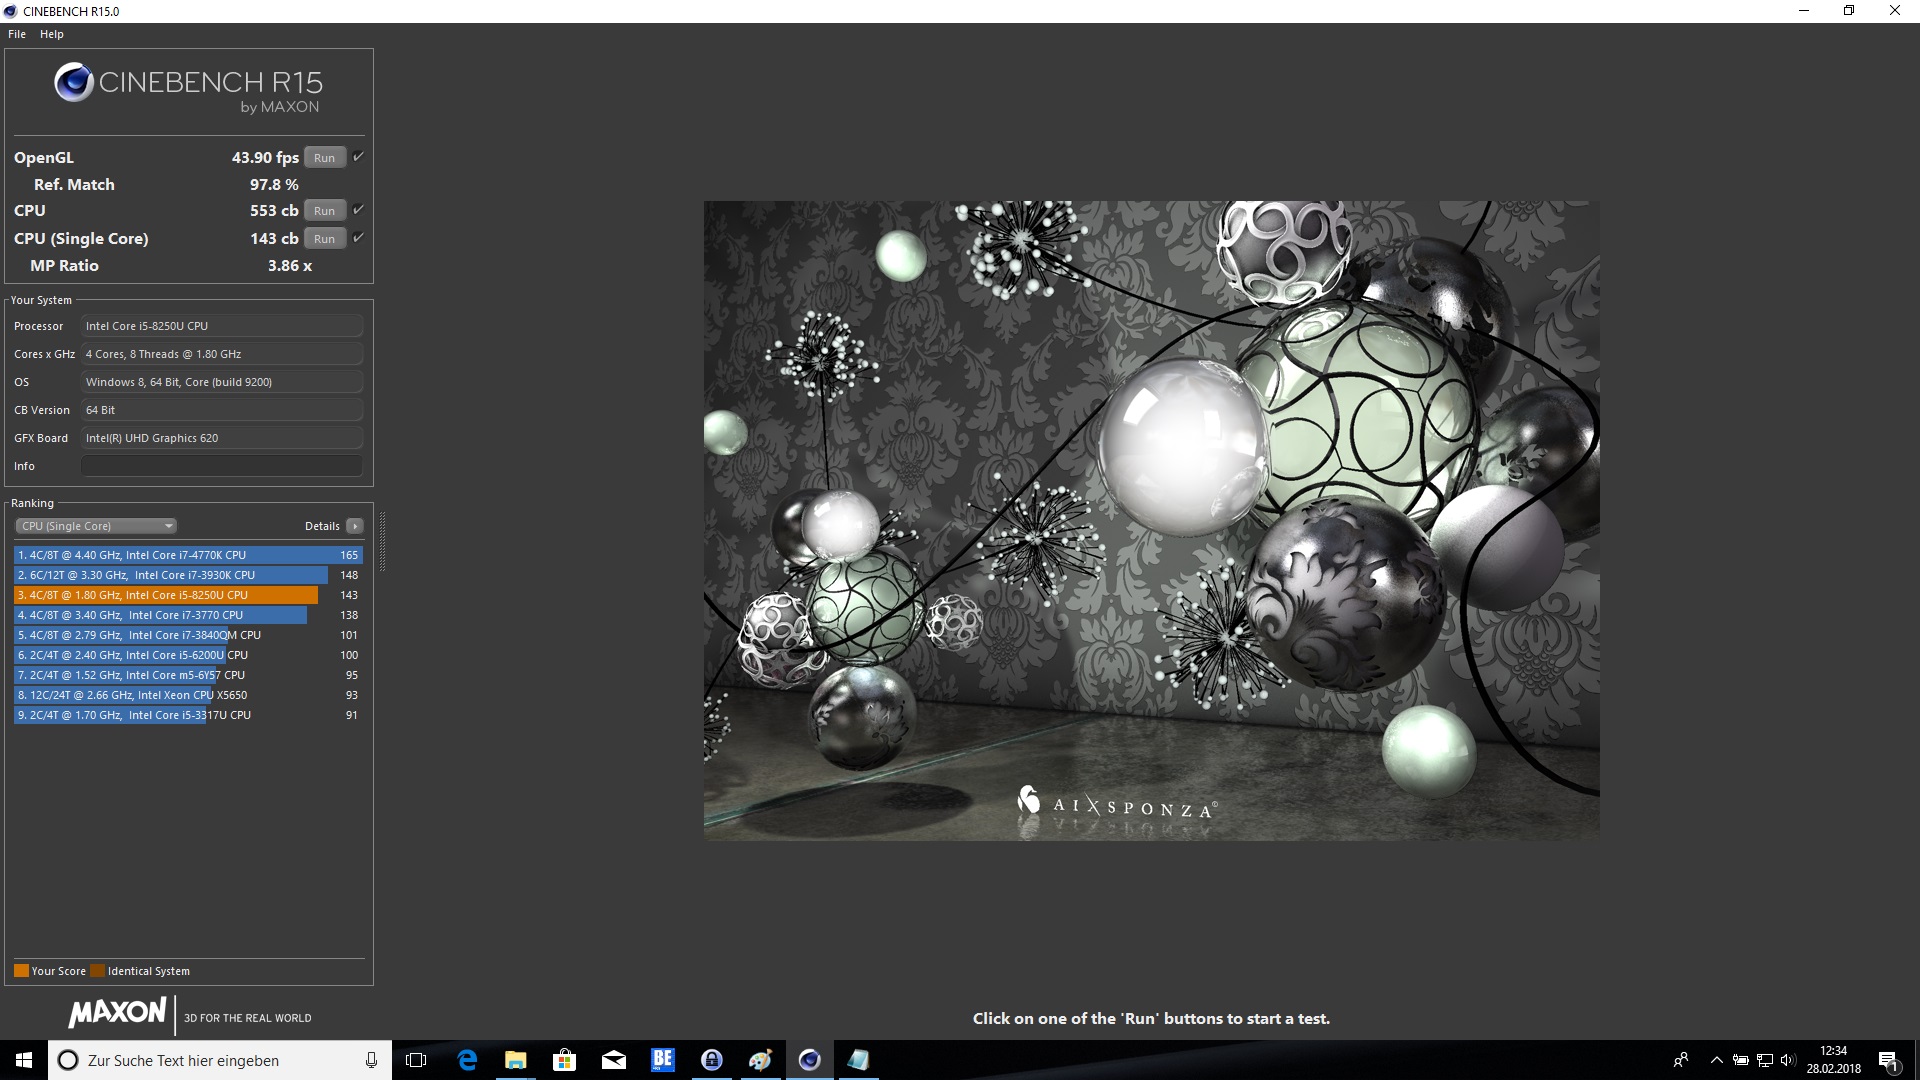
| Cinebench R11.5 | |
| CPU Single 64Bit | |
| Moyenne de la classe Office (2 - 3.6, n=14, 2 dernières années) | |
| Schenker Slim 15 L17 | |
| Lenovo ThinkPad E580-20KSCTO1WW | |
| Moyenne Intel Core i5-8250U (0.91 - 1.79, n=35) | |
| Lenovo ThinkPad E570-20H6S02M00 | |
| CPU Multi 64Bit | |
| Moyenne de la classe Office (9.76 - 31.5, n=14, 2 dernières années) | |
| Moyenne Intel Core i5-8250U (3.15 - 7.76, n=35) | |
| Lenovo ThinkPad E580-20KSCTO1WW | |
| Schenker Slim 15 L17 | |
| Lenovo ThinkPad E570-20H6S02M00 | |
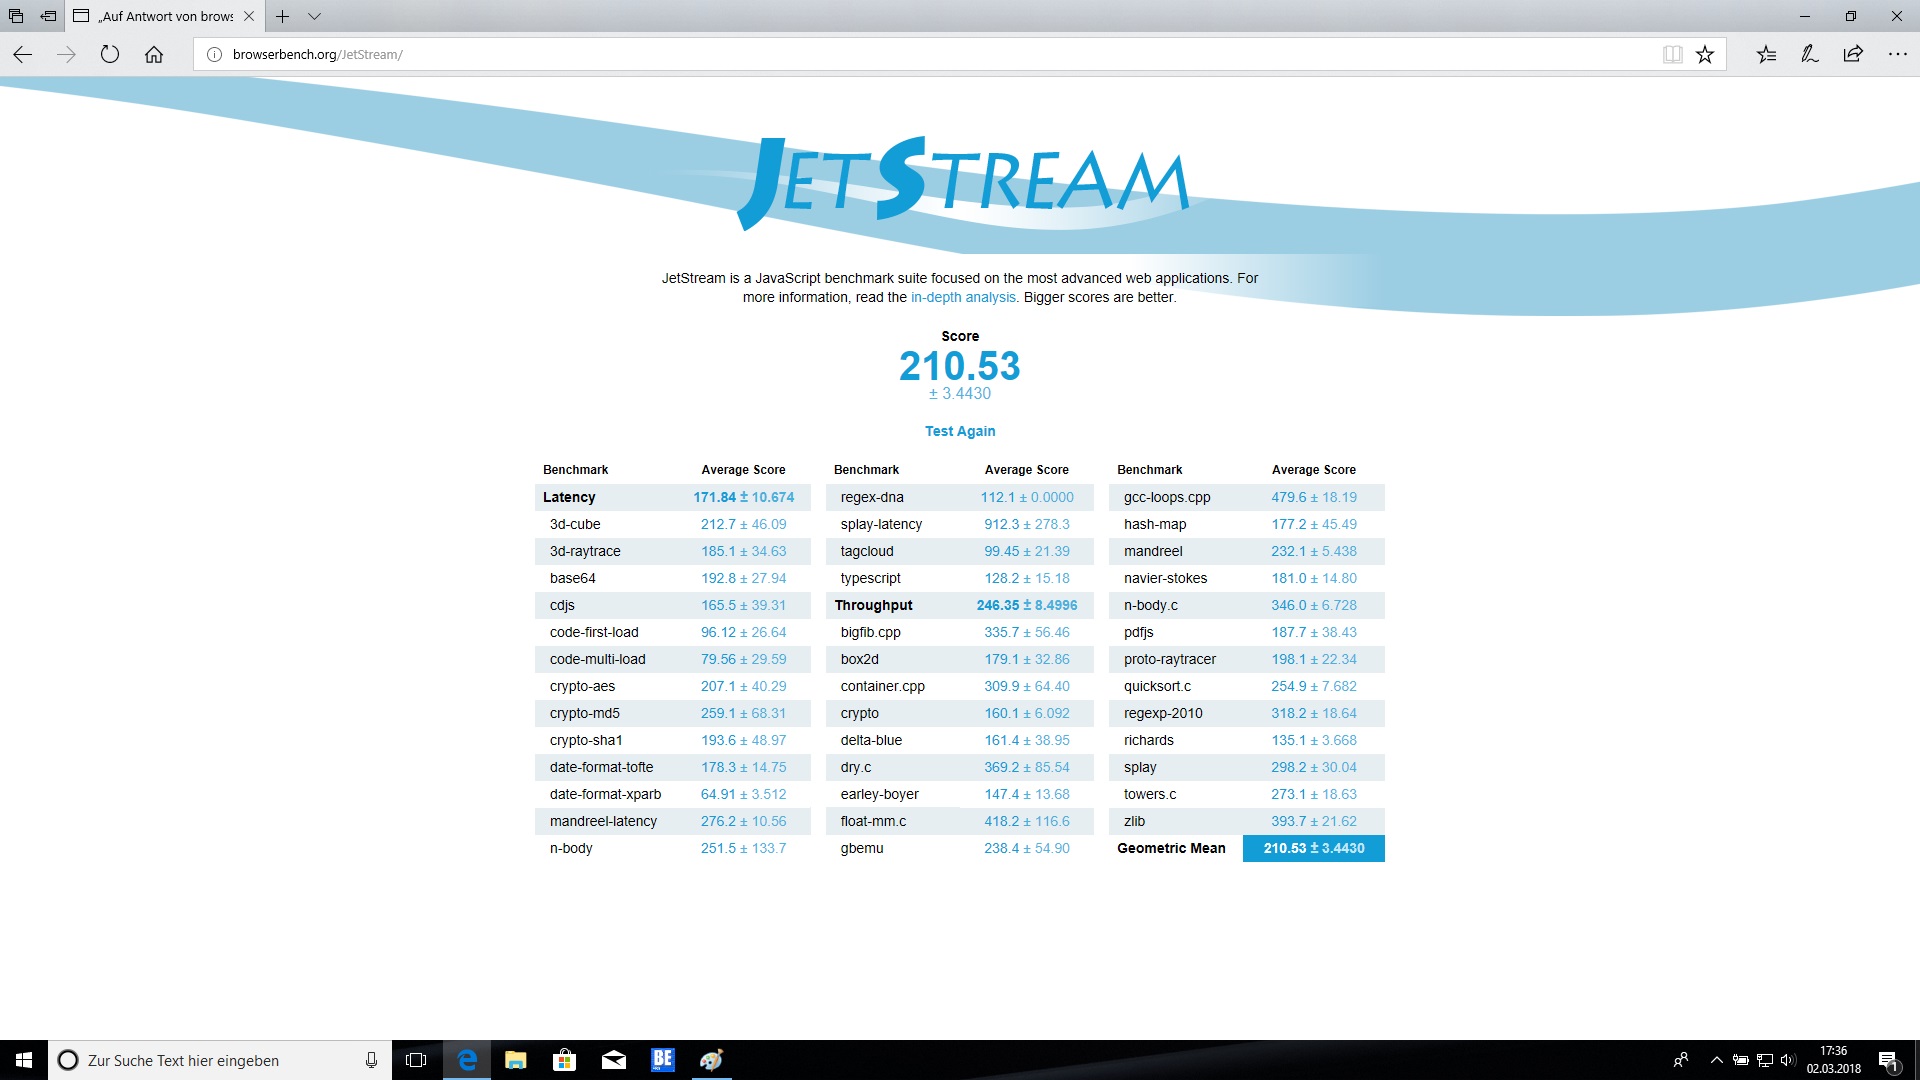
| JetStream 1.1 - 1.1 Total | |
| Lenovo ThinkPad E580-20KS001RGE | |
| Schenker Slim 15 L17 | |
| HP ProBook 450 G5-2UB53EA | |
| Moyenne Intel Core i5-8250U (151.5 - 256, n=78) | |
| Lenovo ThinkPad E570-20H6S02M00 | |
| Lenovo ThinkPad E580-20KSCTO1WW | |
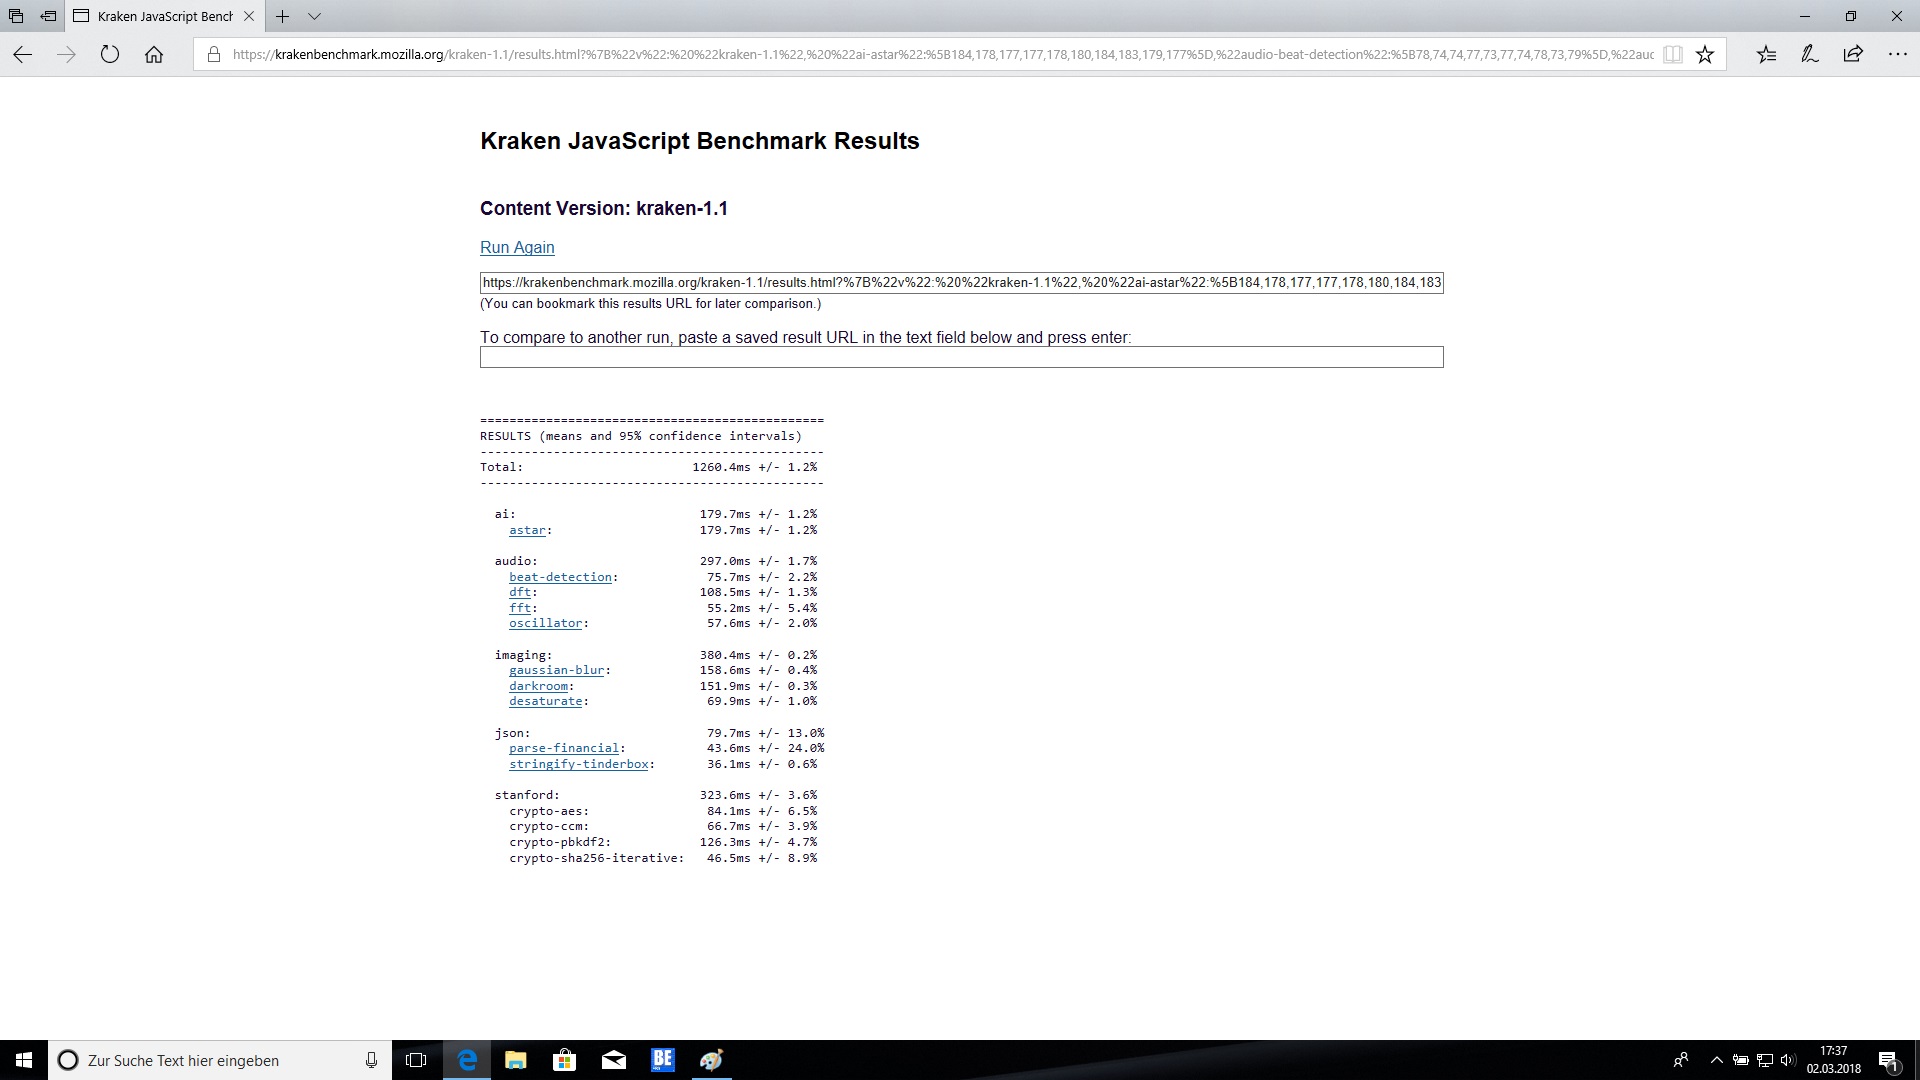
| Mozilla Kraken 1.1 - Total | |
| Lenovo ThinkPad E580-20KSCTO1WW | |
| Moyenne Intel Core i5-8250U (986 - 1532, n=59) | |
| Lenovo ThinkPad E570-20H6S02M00 | |
| Schenker Slim 15 L17 | |
| Lenovo ThinkPad E580-20KS001RGE | |
| Moyenne de la classe Office (391 - 1297, n=78, 2 dernières années) | |
* ... Moindre est la valeur, meilleures sont les performances
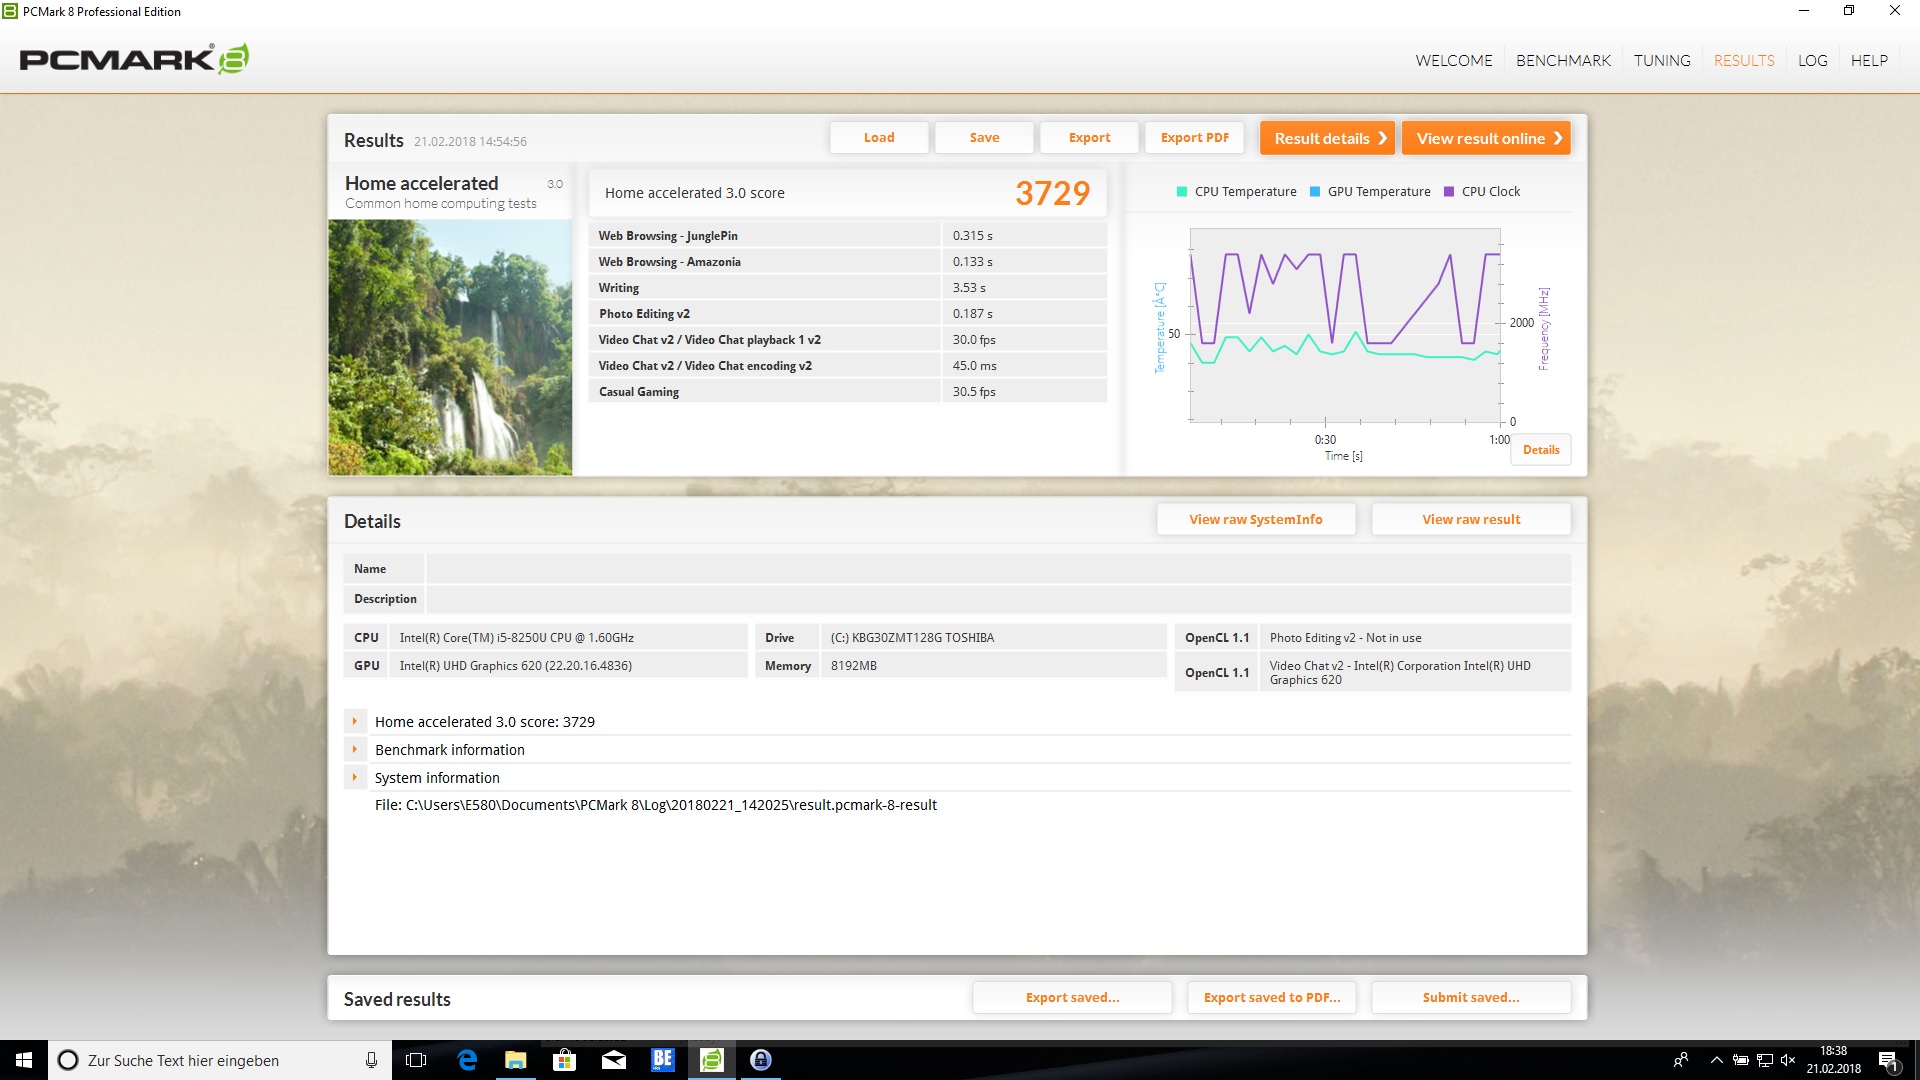
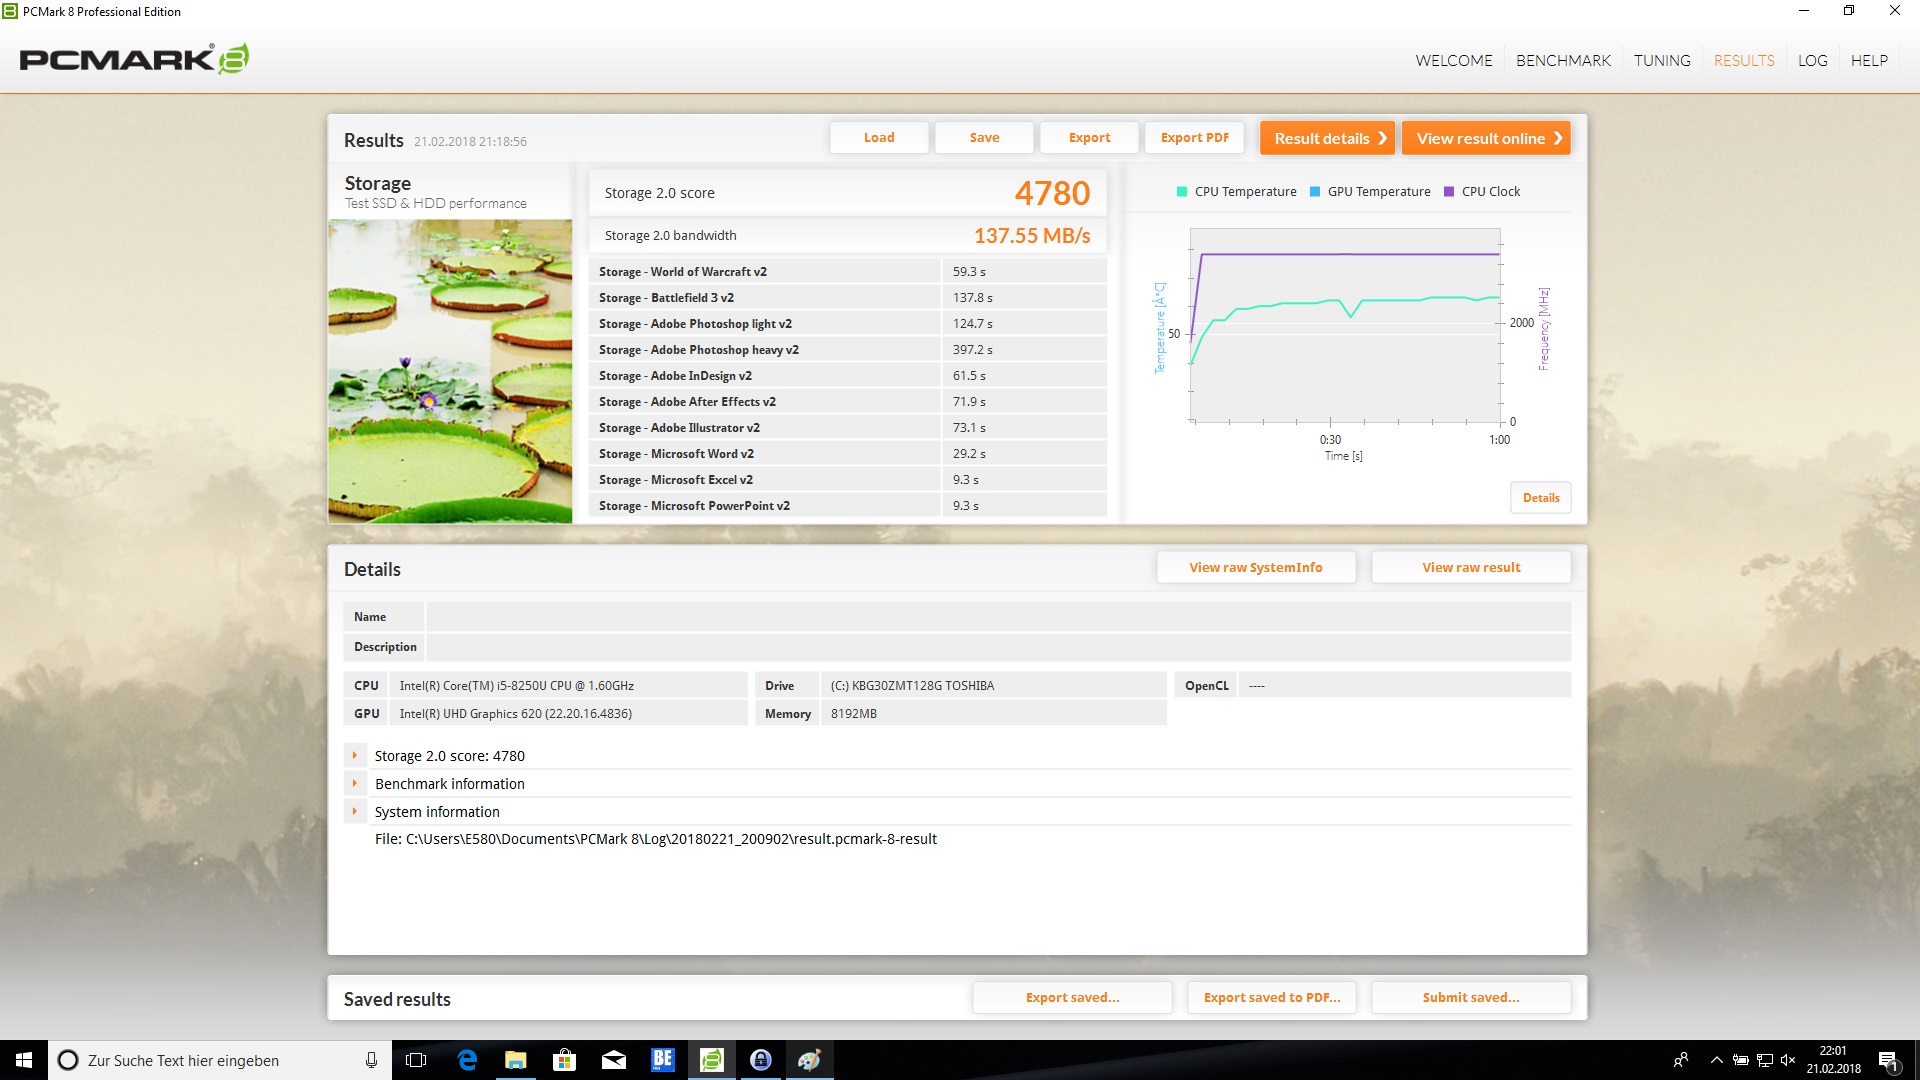
| PCMark 8 Home Score Accelerated v2 | 3729 points | |
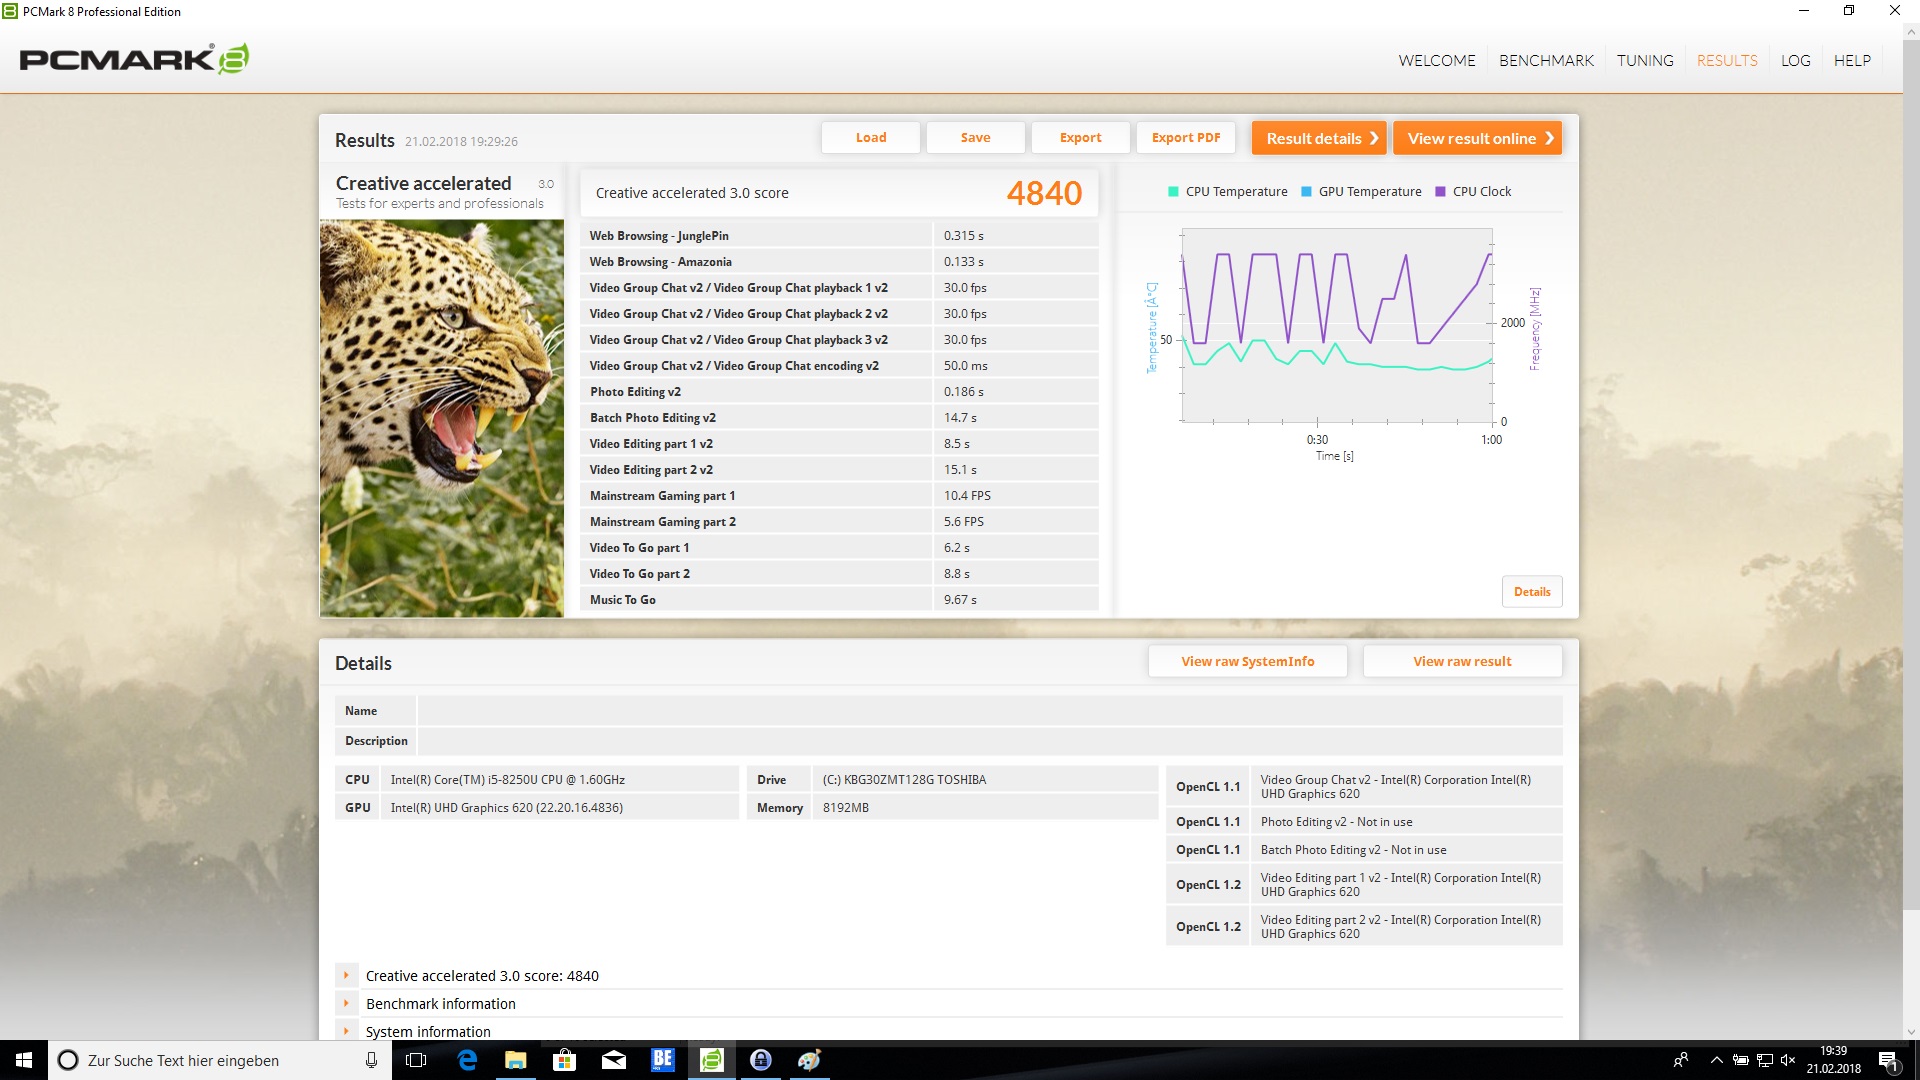
| PCMark 8 Creative Score Accelerated v2 | 4840 points | |
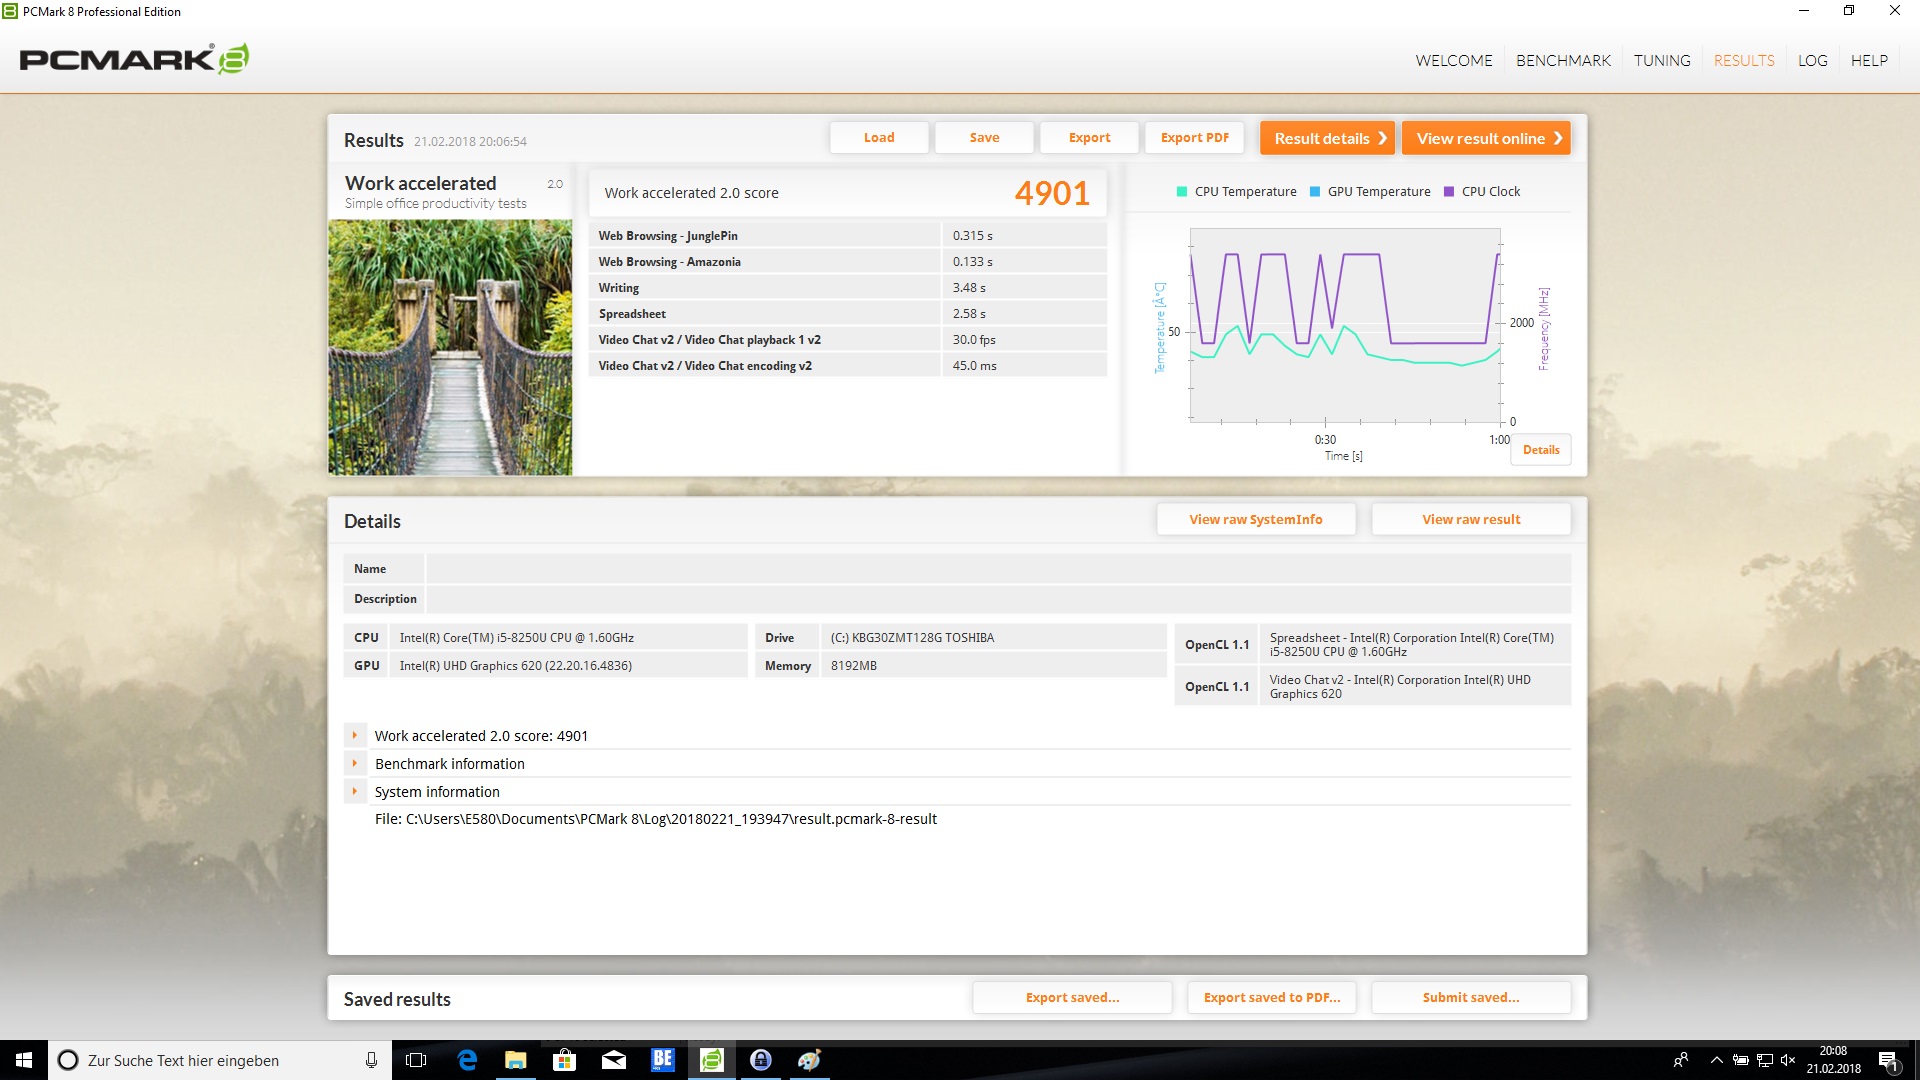
| PCMark 8 Work Score Accelerated v2 | 4901 points | |
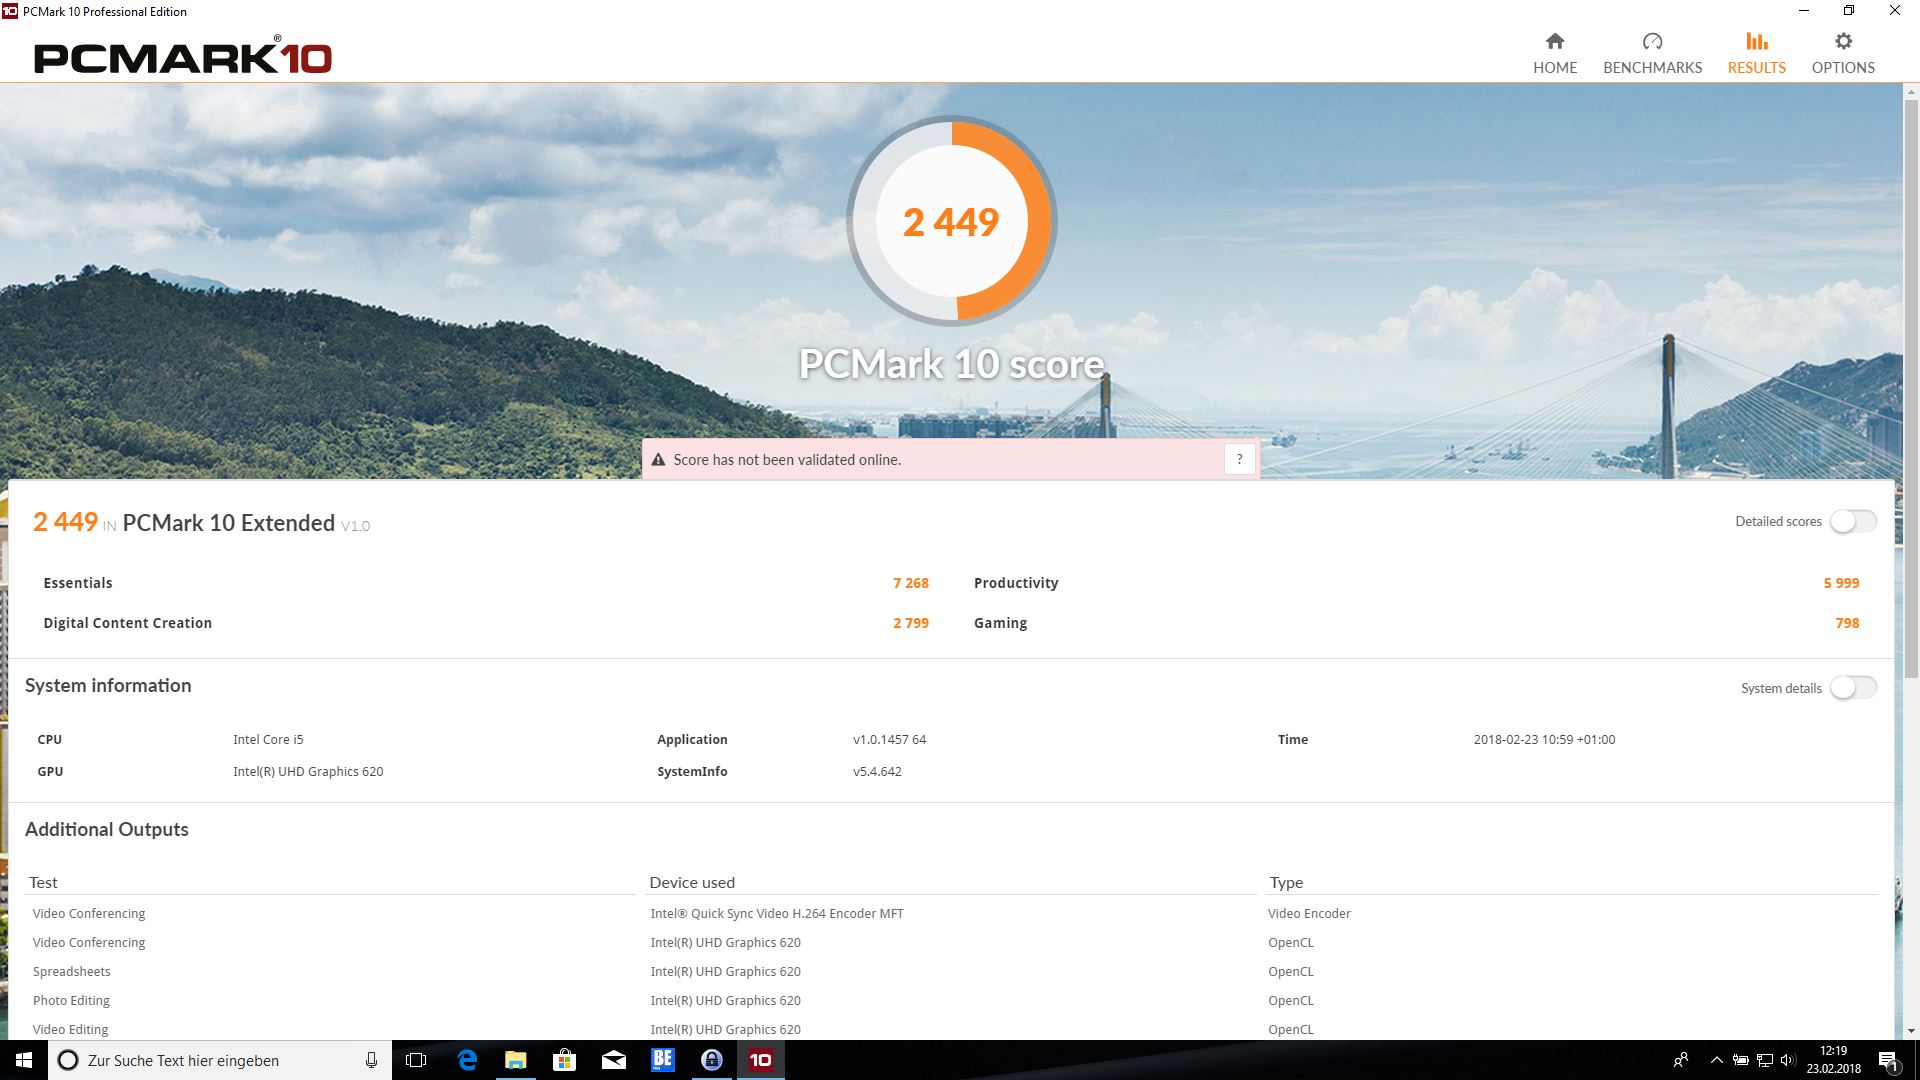
| PCMark 10 Score | 2449 points | |
Aide | ||
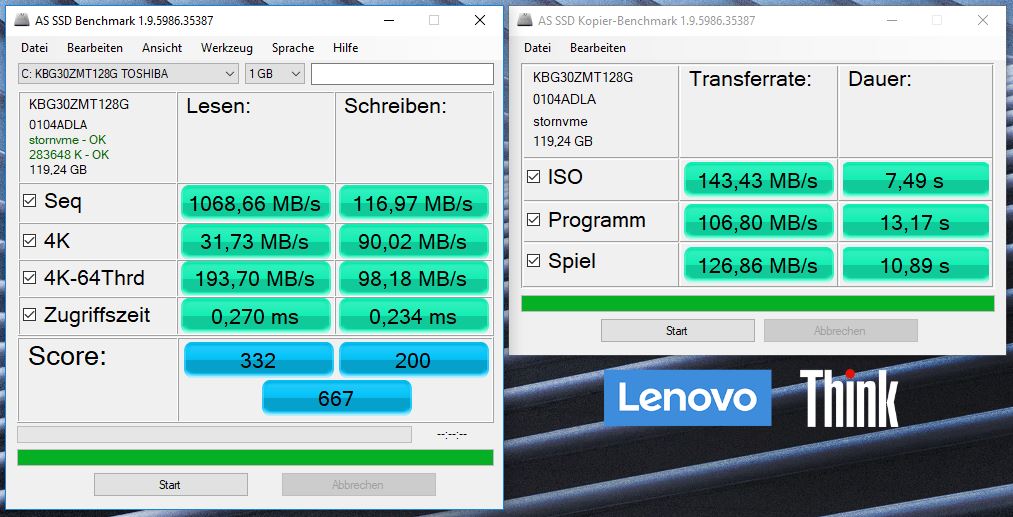
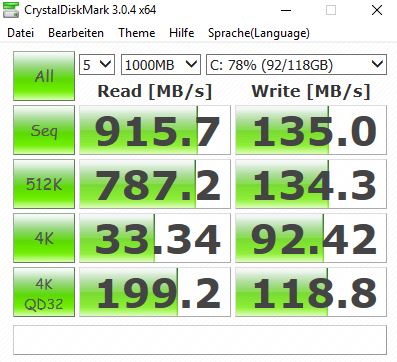
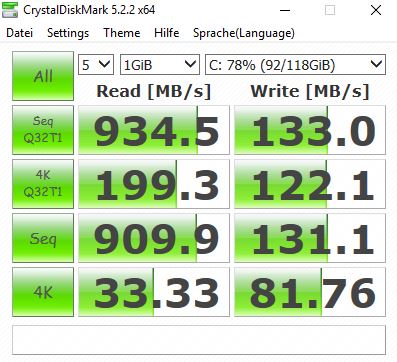
| Lenovo ThinkPad E580-20KSCTO1WW Toshiba KBG30ZMT128G | Lenovo ThinkPad E580-20KS001RGE Lenovo LENSE20256GMSP34MEAT2TA | Lenovo ThinkPad E570-20H6S02M00 Samsung PM961 MZVLW256HEHP | HP ProBook 450 G5-2UB53EA SanDisk SD8SN8U256G1006 | Acer TravelMate P2510-M-51ZQ SK Hynix HFS256G39TND-N210A | Schenker Slim 15 L17 Samsung SSD 960 Pro 512 GB m.2 | Dell Vostro 15 3568 Micron 1100 MTFDDAV256TBN | |
|---|---|---|---|---|---|---|---|
| CrystalDiskMark 3.0 | 53% | 243% | 32% | 34% | 345% | -4% | |
| Read Seq (MB/s) | 916 | 1280 40% | 1589 73% | 502 -45% | 498.1 -46% | 1958 114% | 469.3 -49% |
| Write Seq (MB/s) | 135 | 639 373% | 1217 801% | 451.6 235% | 260.1 93% | 1776 1216% | 179.7 33% |
| Read 512 (MB/s) | 787 | 1011 28% | 1155 47% | 372.5 -53% | 328.5 -58% | 819 4% | 359.6 -54% |
| Write 512 (MB/s) | 134.3 | 115.4 -14% | 783 483% | 269.7 101% | 260.9 94% | 1157 762% | 183.7 37% |
| Read 4k (MB/s) | 33.34 | 30.87 -7% | 59.7 79% | 27.76 -17% | 32.59 -2% | 54 62% | 26.01 -22% |
| Write 4k (MB/s) | 92.4 | 72.6 -21% | 148.8 61% | 52.4 -43% | 84.2 -9% | 157.7 71% | 68.7 -26% |
| Read 4k QD32 (MB/s) | 199.2 | 257.3 29% | 473.6 138% | 260.2 31% | 359.7 81% | 605 204% | 242.4 22% |
| Write 4k QD32 (MB/s) | 118.8 | 118.2 -1% | 428.7 261% | 177.7 50% | 262 121% | 511 330% | 147.1 24% |

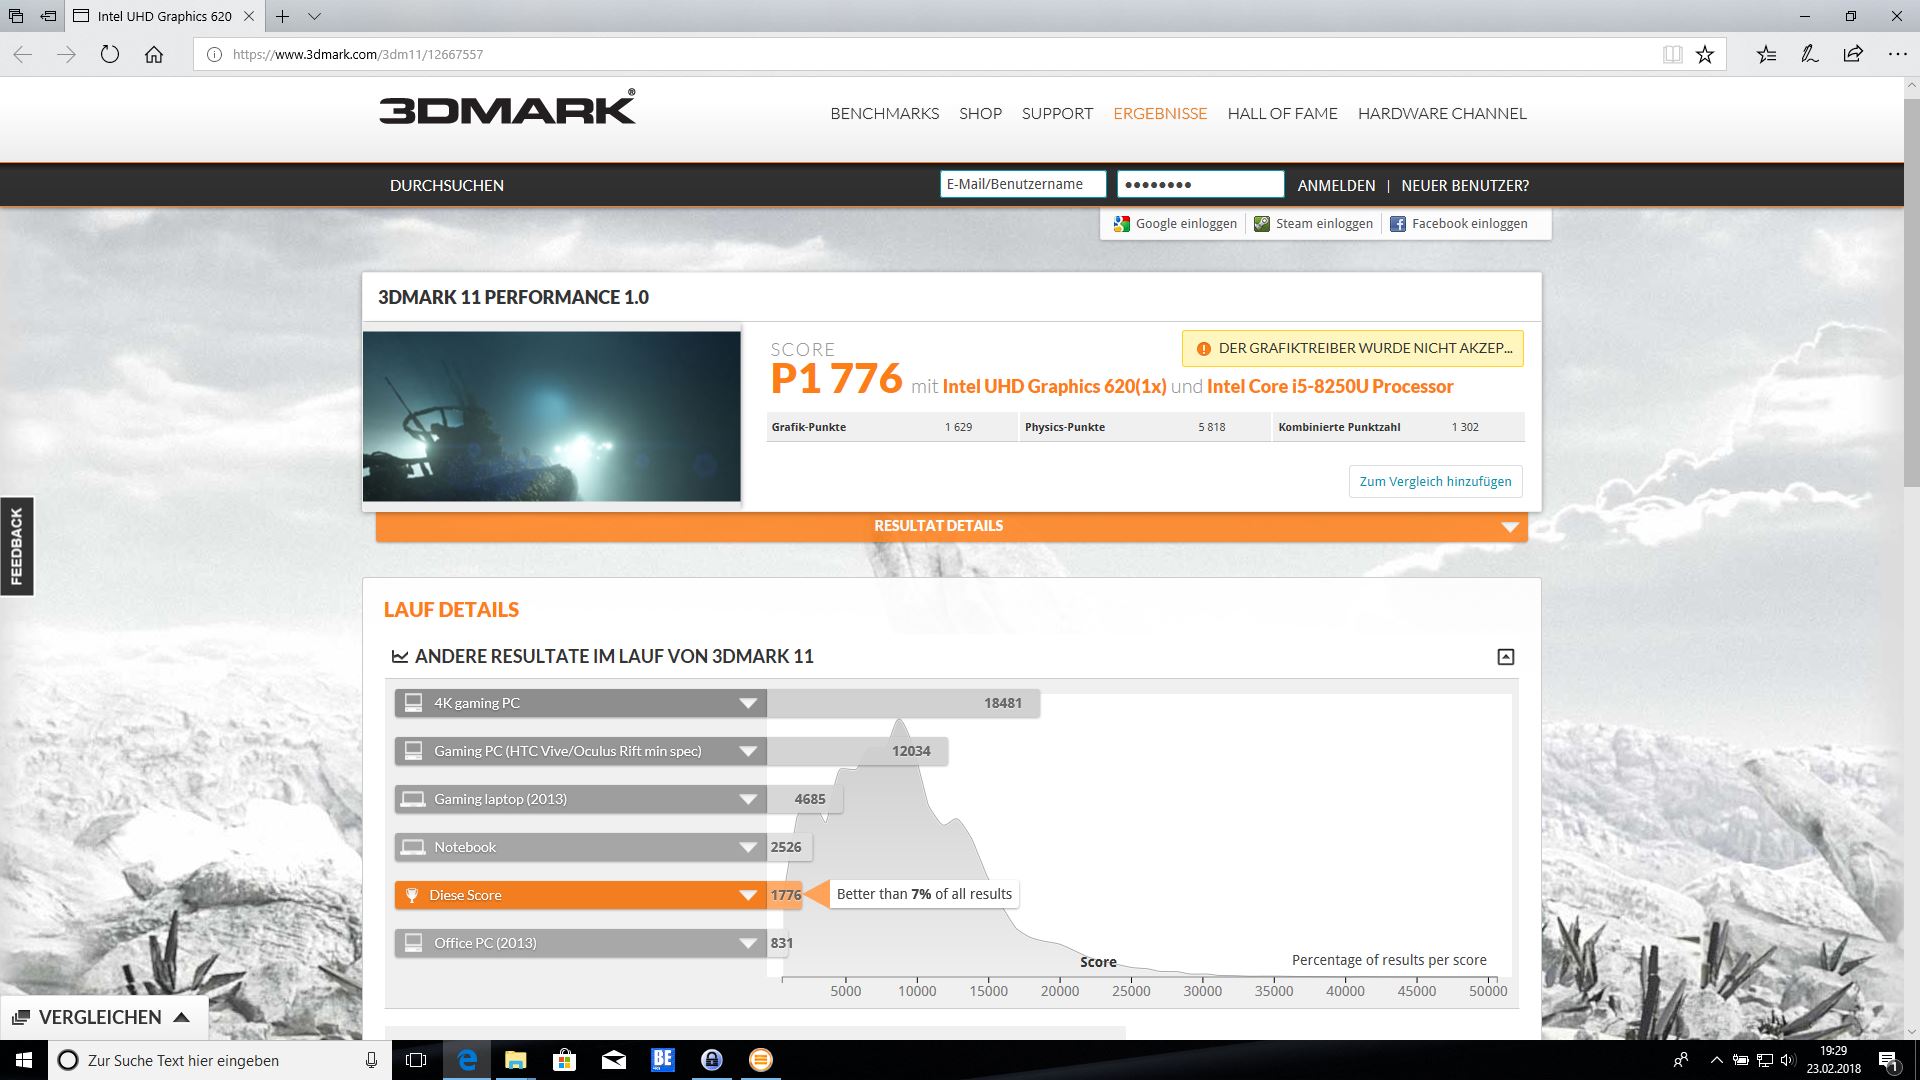
| 3DMark 11 Performance | 1776 points | |
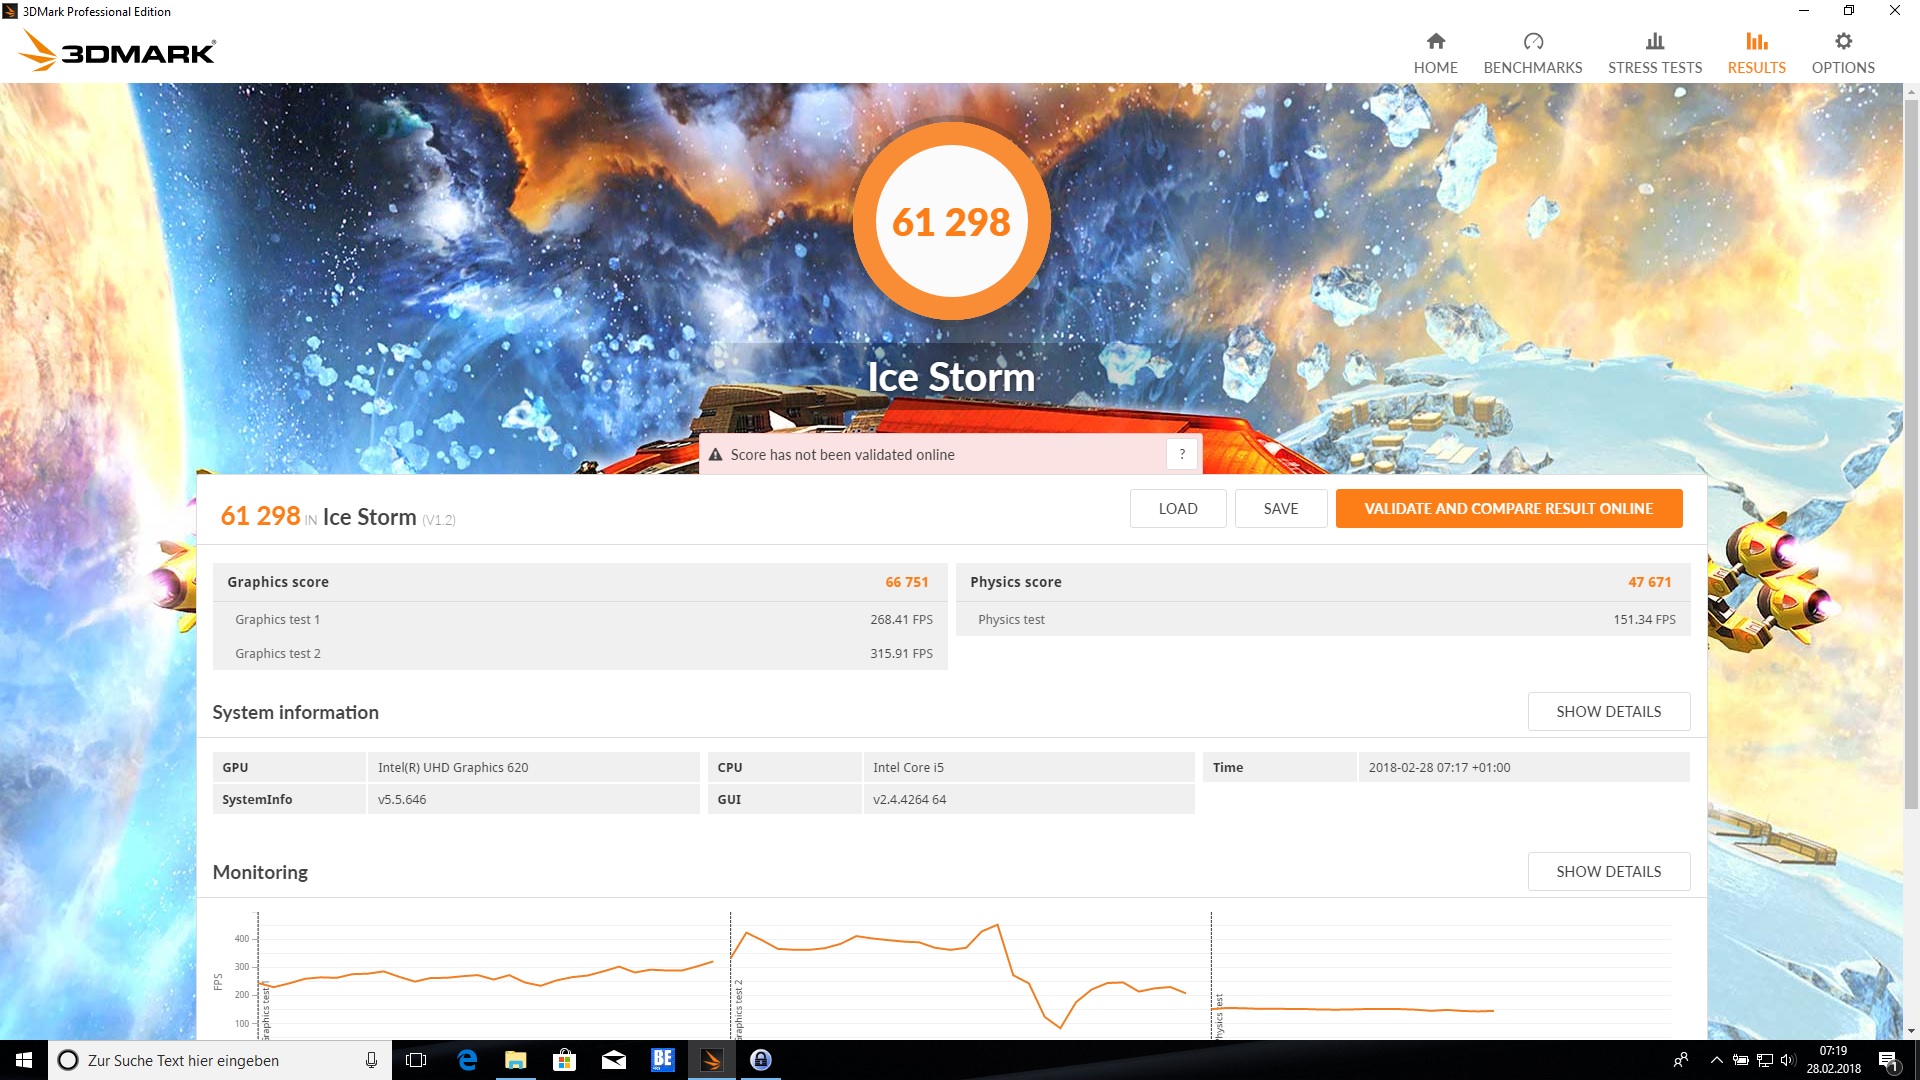
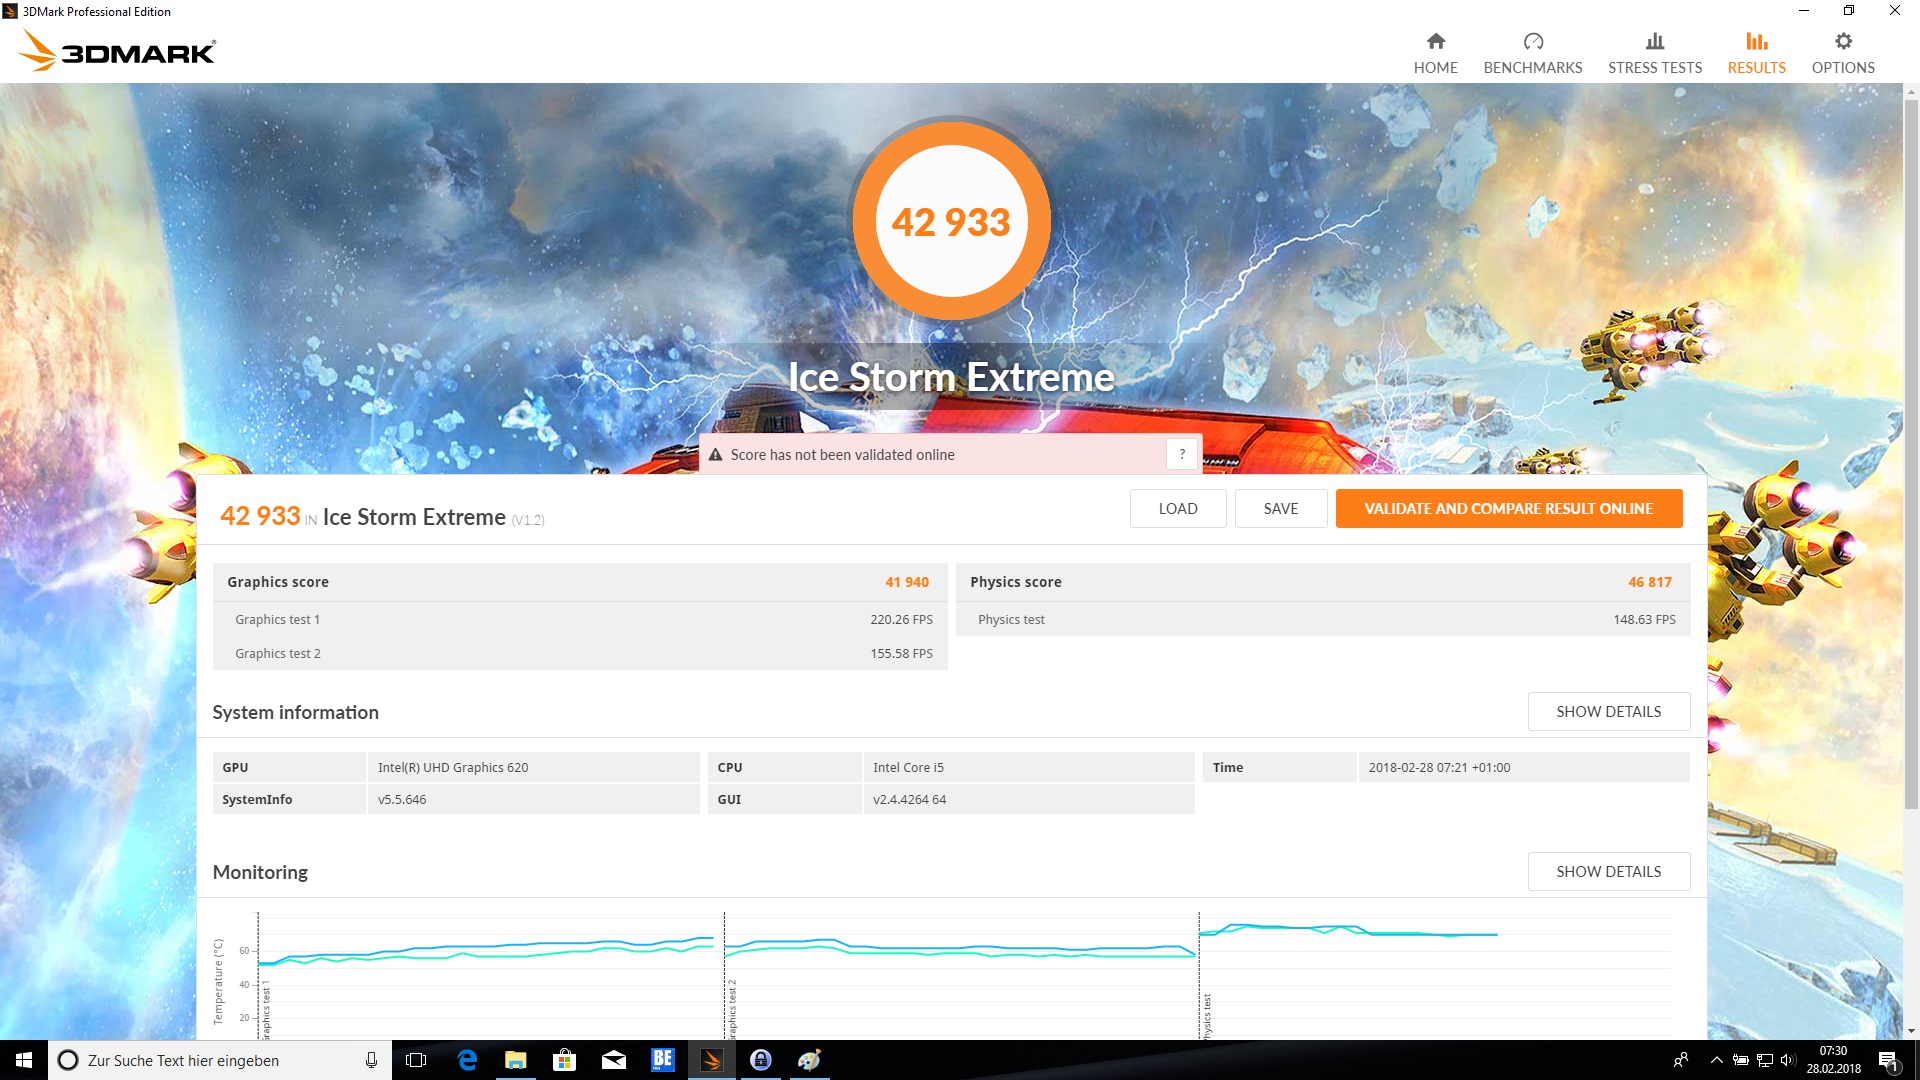
| 3DMark Ice Storm Standard Score | 61298 points | |
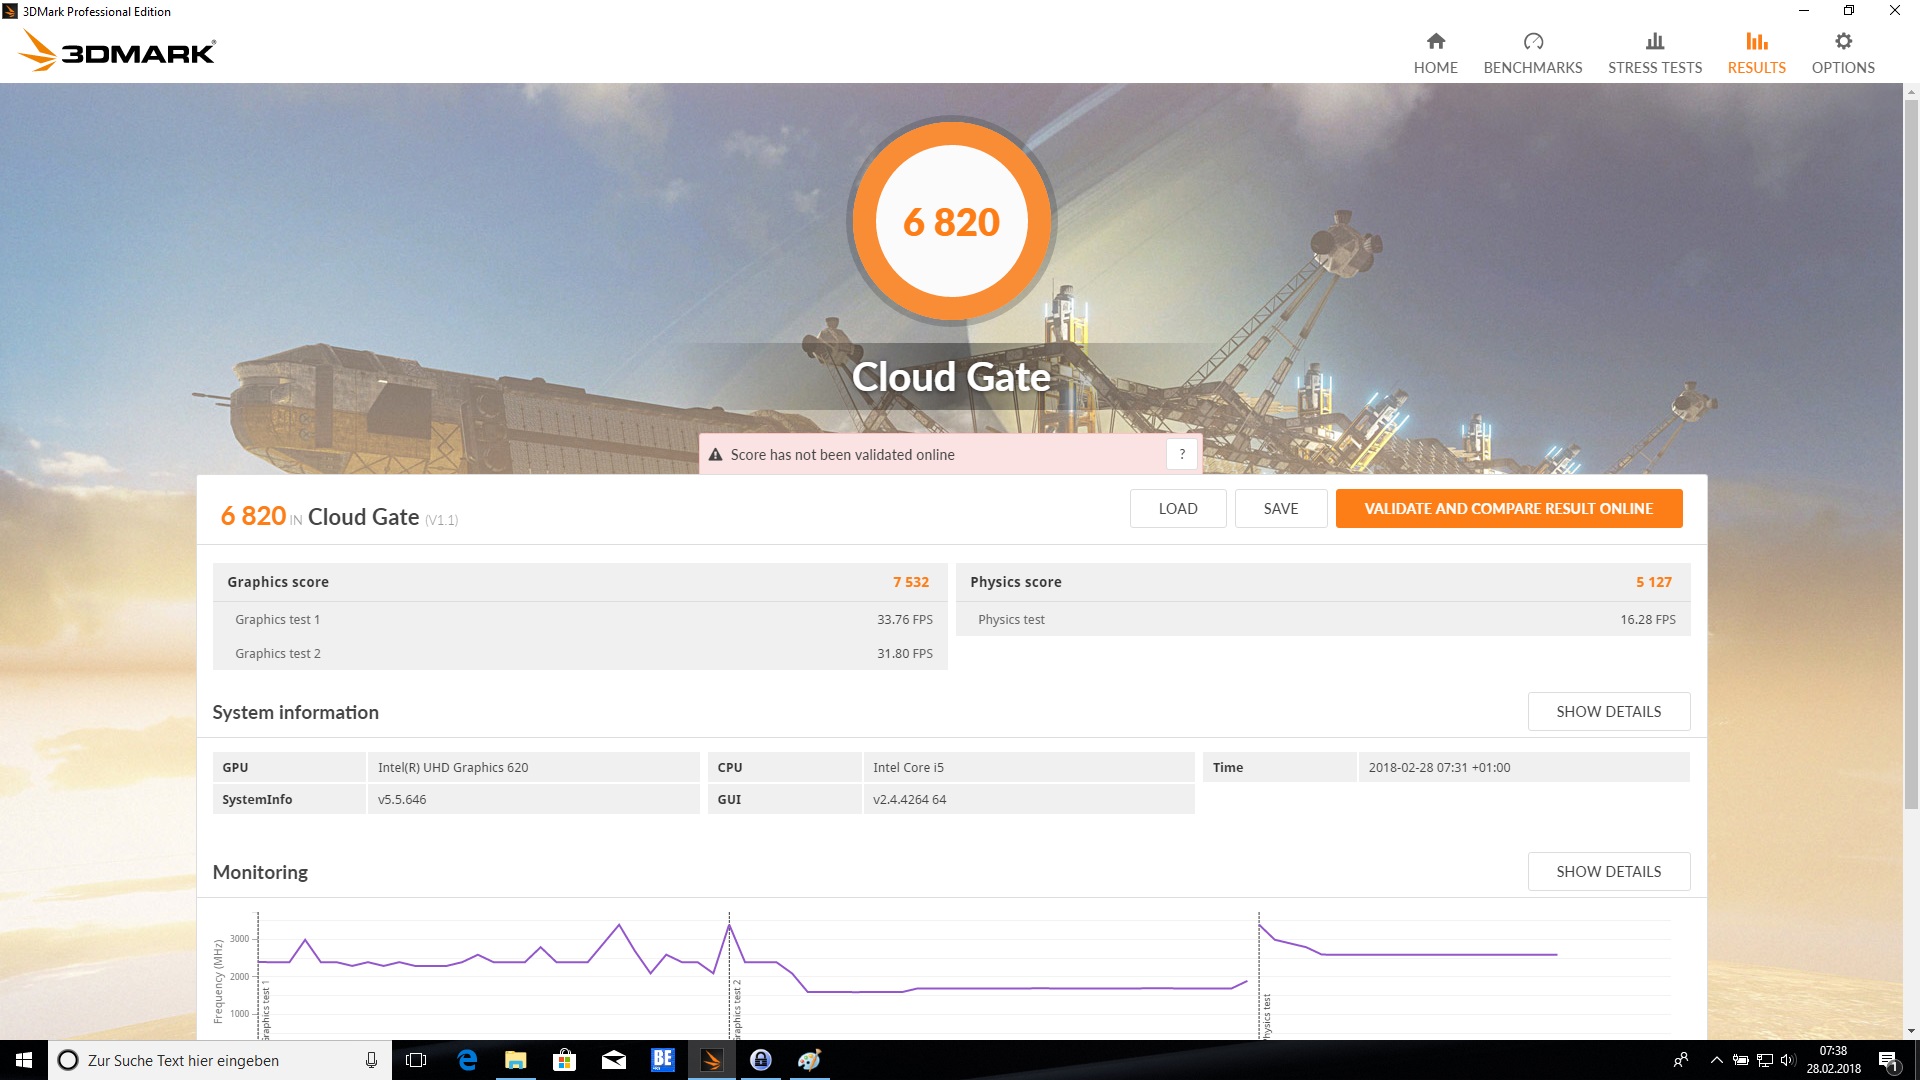
| 3DMark Cloud Gate Standard Score | 6820 points | |
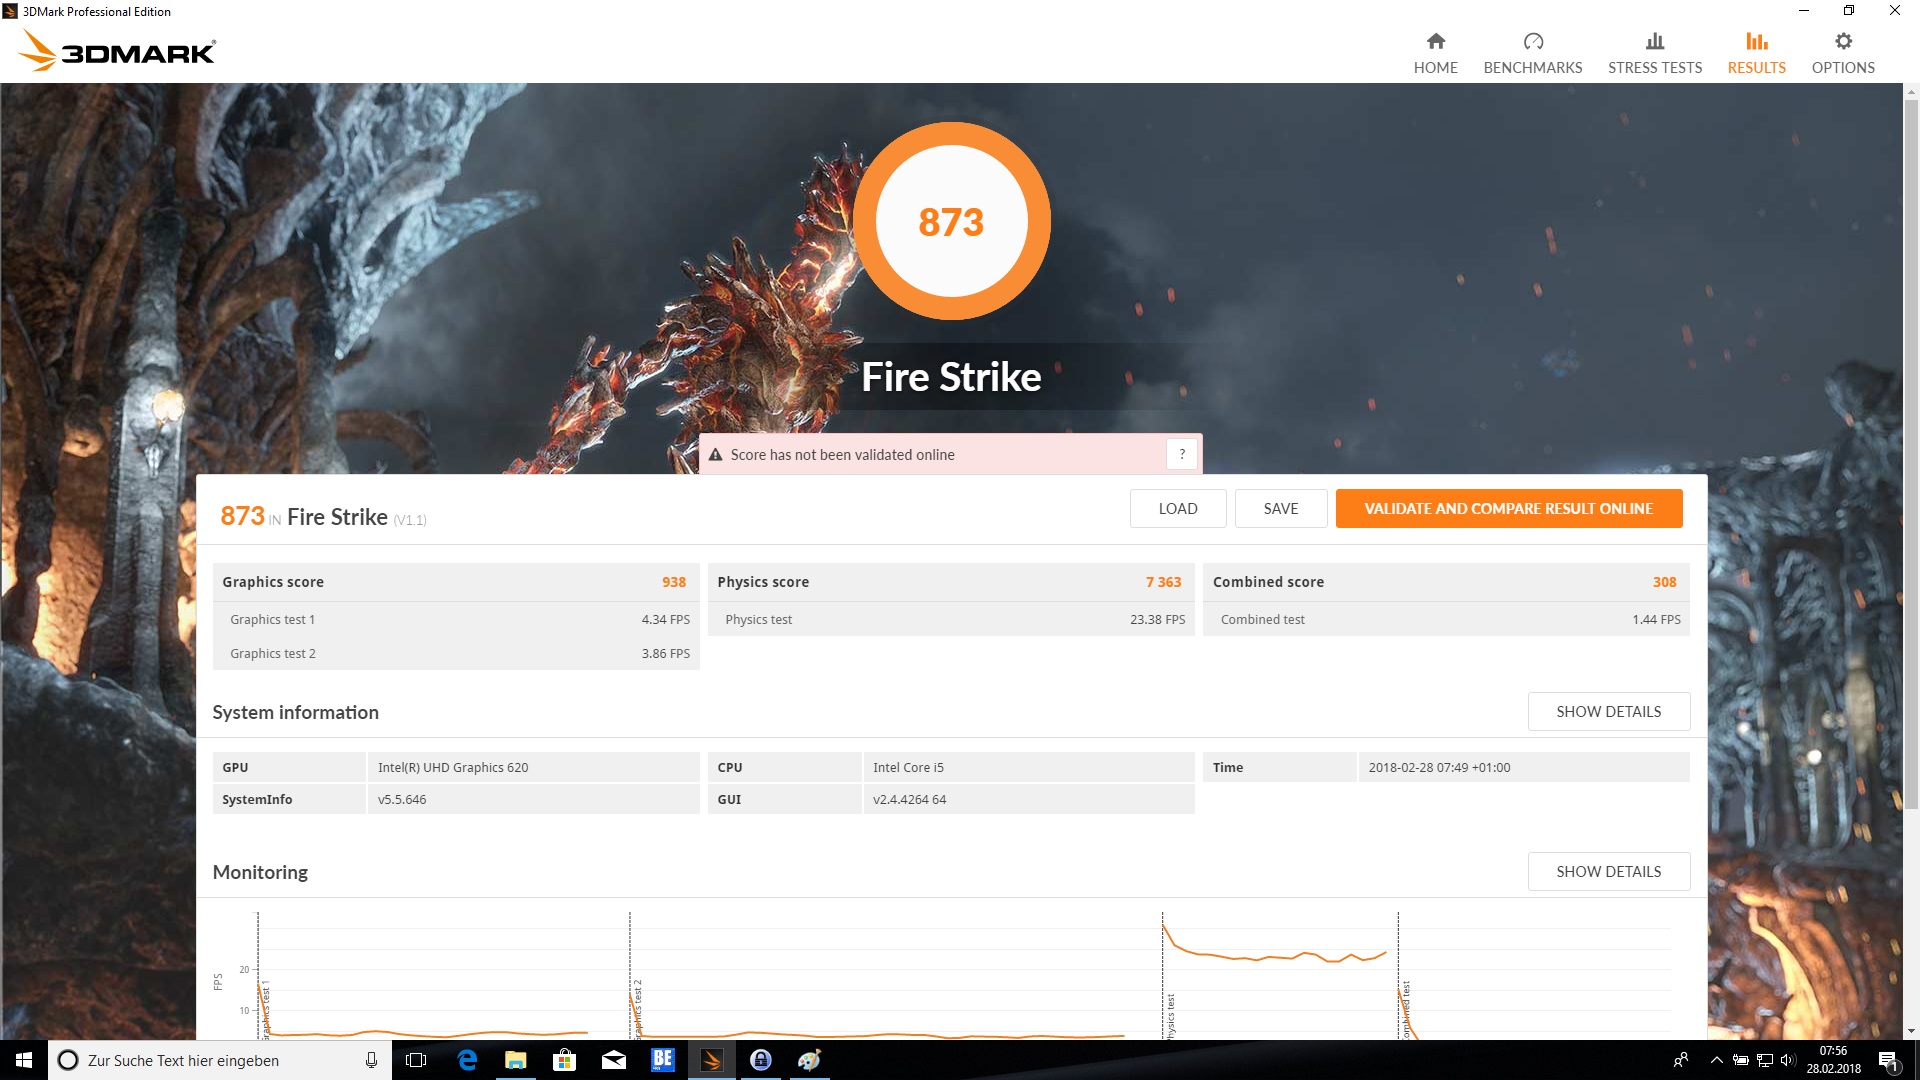
| 3DMark Fire Strike Score | 873 points | |
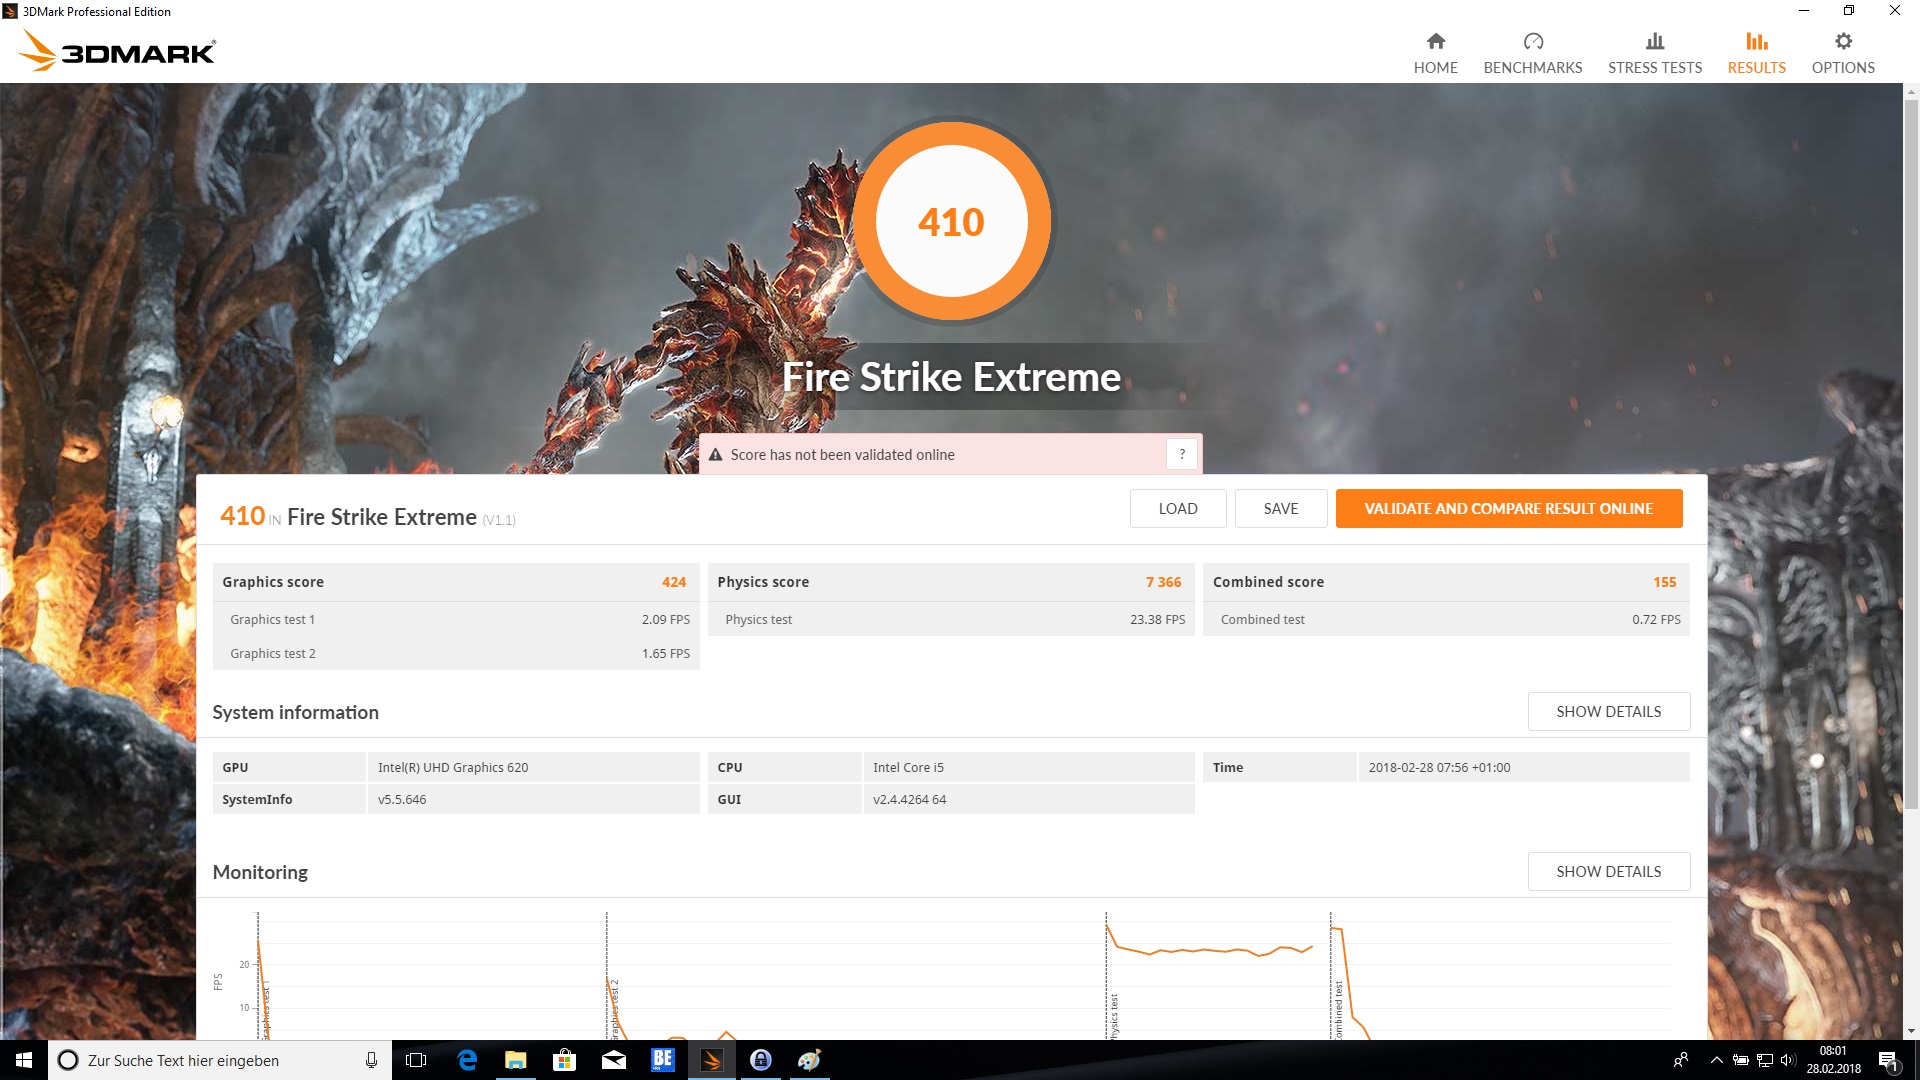
| 3DMark Fire Strike Extreme Score | 410 points | |
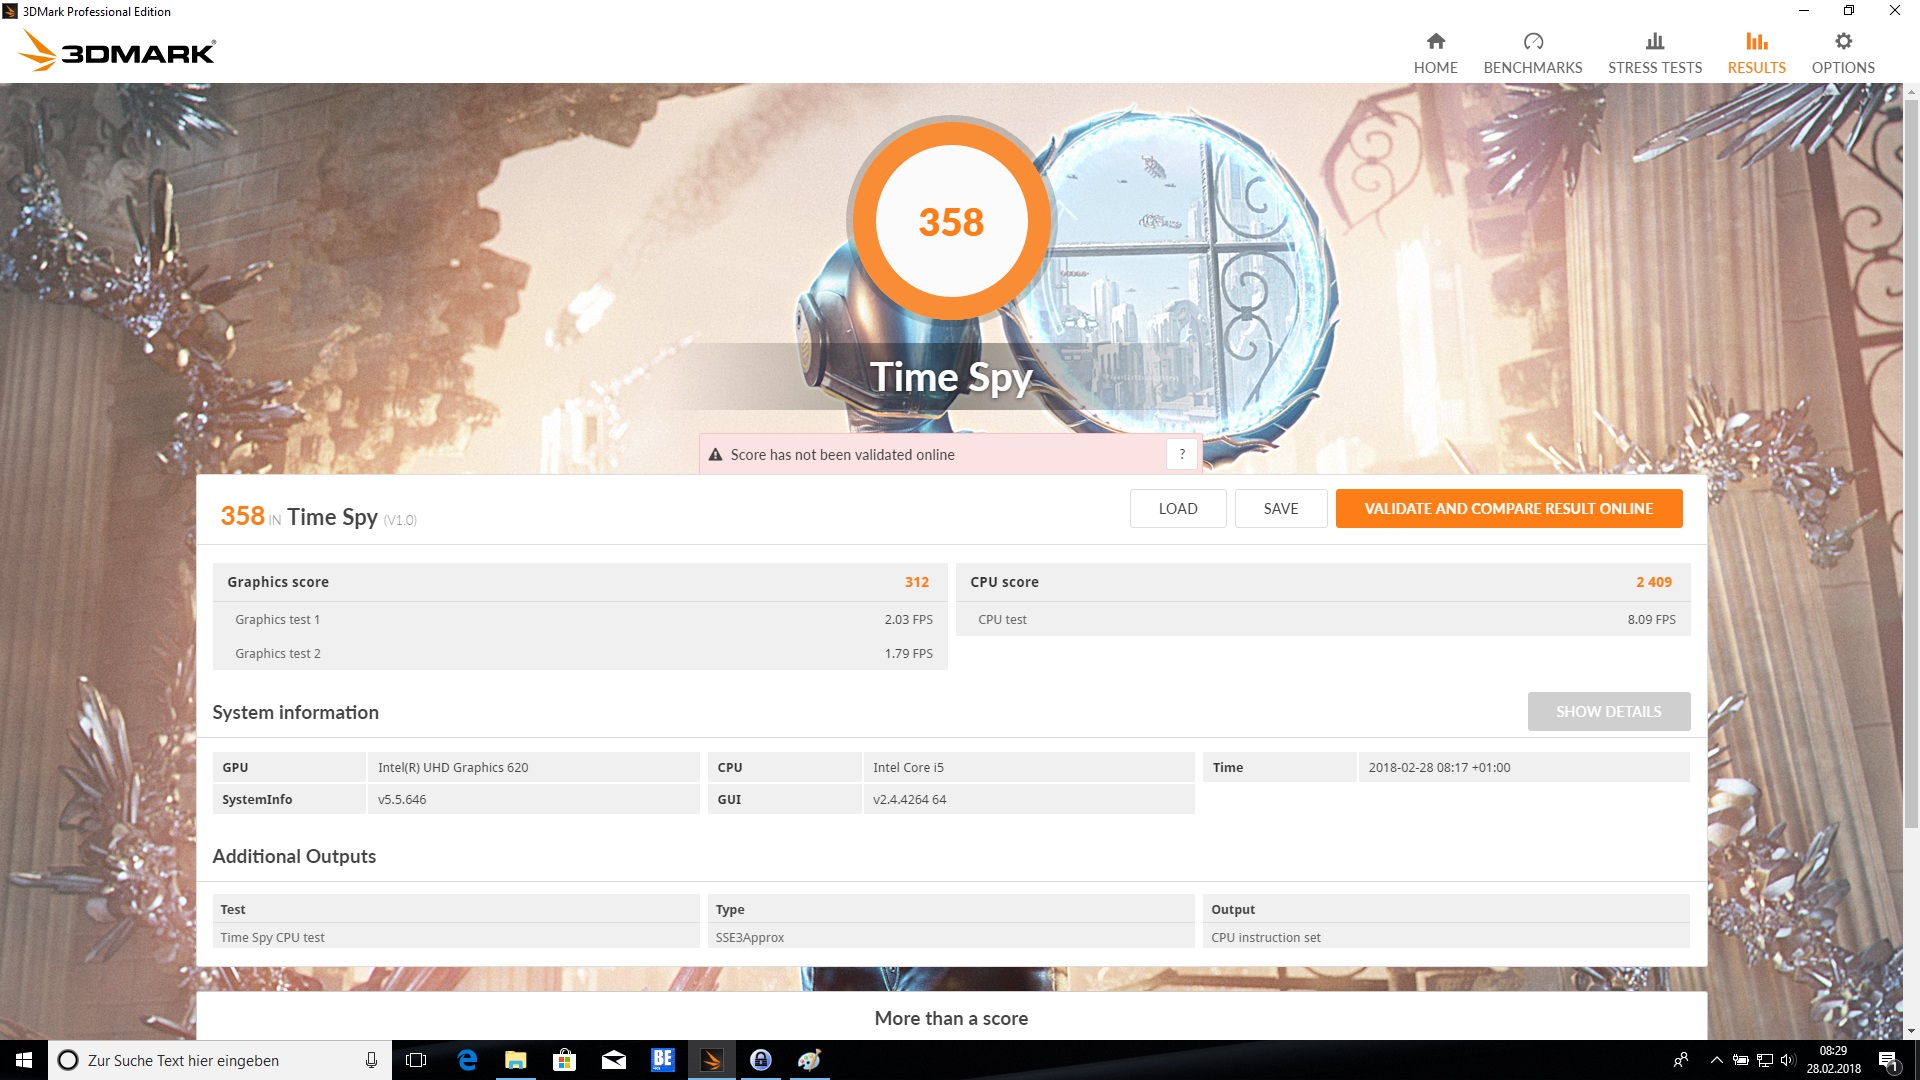
| 3DMark Time Spy Score | 358 points | |
Aide | ||
| Bas | Moyen | Élevé | Ultra | |
|---|---|---|---|---|
| BioShock Infinite (2013) | 46.1 | 27.7 | 22.9 | 7.6 |
| The Witcher 3 (2015) | 15.7 | 9.9 | 5.4 | |
| Rise of the Tomb Raider (2016) | 17.2 | 10.6 | 6.1 |
Degré de la nuisance sonore
| Au repos |
| 29.1 / 29.1 / 30.2 dB(A) |
| Fortement sollicité |
| 30.8 / 32.8 dB(A) |
 | ||
30 dB silencieux 40 dB(A) audible 50 dB(A) bruyant |
||
min: | ||
| Lenovo ThinkPad E580-20KSCTO1WW UHD Graphics 620, i5-8250U, Toshiba KBG30ZMT128G | Lenovo ThinkPad E580-20KS001RGE Radeon RX 550 (Laptop), i5-8550U, Lenovo LENSE20256GMSP34MEAT2TA | Lenovo ThinkPad E570-20H6S02M00 HD Graphics 620, i5-7200U, Samsung PM961 MZVLW256HEHP | HP ProBook 450 G5-2UB53EA UHD Graphics 620, i5-8250U, SanDisk SD8SN8U256G1006 | Acer TravelMate P2510-M-51ZQ HD Graphics 620, i5-7200U, SK Hynix HFS256G39TND-N210A | Schenker Slim 15 L17 UHD Graphics 620, i5-8550U, Samsung SSD 960 Pro 512 GB m.2 | Dell Vostro 15 3568 HD Graphics 620, i5-7200U, Micron 1100 MTFDDAV256TBN | |
|---|---|---|---|---|---|---|---|
| Noise | -9% | -2% | 1% | -10% | -7% | -7% | |
| arrêt / environnement * (dB) | 29.1 | 30.1 -3% | 30.6 -5% | 29.1 -0% | 31.4 -8% | 29.1 -0% | 30.2 -4% |
| Idle Minimum * (dB) | 29.1 | 30.1 -3% | 30.6 -5% | 29.1 -0% | 31.8 -9% | 29.1 -0% | 30.2 -4% |
| Idle Average * (dB) | 29.1 | 30.1 -3% | 30.6 -5% | 29.1 -0% | 31.8 -9% | 29.1 -0% | 30.2 -4% |
| Idle Maximum * (dB) | 30.2 | 31.6 -5% | 30.6 -1% | 29.1 4% | 31.8 -5% | 30.5 -1% | 30.2 -0% |
| Load Average * (dB) | 30.8 | 37.7 -22% | 31.8 -3% | 31.4 -2% | 36.6 -19% | 31.2 -1% | 36.4 -18% |
| Load Maximum * (dB) | 32.8 | 38 -16% | 31.3 5% | 32 2% | 36.5 -11% | 45.9 -40% | 36.5 -11% |
* ... Moindre est la valeur, meilleures sont les performances

(±) La température maximale du côté supérieur est de 40.4 °C / 105 F, par rapport à la moyenne de 34.3 °C / 94 F, allant de 21.2 à 62.5 °C pour la classe Office.
(±) Le fond chauffe jusqu'à un maximum de 43.7 °C / 111 F, contre une moyenne de 36.8 °C / 98 F
(+) En utilisation inactive, la température moyenne du côté supérieur est de 20.4 °C / 69 F, par rapport à la moyenne du dispositif de 29.5 °C / 85 F.
(+) Les repose-poignets et le pavé tactile sont plus froids que la température de la peau avec un maximum de 22.6 °C / 72.7 F et sont donc froids au toucher.
(+) La température moyenne de la zone de l'appui-paume de dispositifs similaires était de 27.5 °C / 81.5 F (+4.9 °C / #8.8 F).
| Lenovo ThinkPad E580-20KSCTO1WW UHD Graphics 620, i5-8250U, Toshiba KBG30ZMT128G | Lenovo ThinkPad E580-20KS001RGE Radeon RX 550 (Laptop), i5-8550U, Lenovo LENSE20256GMSP34MEAT2TA | Lenovo ThinkPad E570-20H6S02M00 HD Graphics 620, i5-7200U, Samsung PM961 MZVLW256HEHP | HP ProBook 450 G5-2UB53EA UHD Graphics 620, i5-8250U, SanDisk SD8SN8U256G1006 | Acer TravelMate P2510-M-51ZQ HD Graphics 620, i5-7200U, SK Hynix HFS256G39TND-N210A | Schenker Slim 15 L17 UHD Graphics 620, i5-8550U, Samsung SSD 960 Pro 512 GB m.2 | Dell Vostro 15 3568 HD Graphics 620, i5-7200U, Micron 1100 MTFDDAV256TBN | |
|---|---|---|---|---|---|---|---|
| Heat | -33% | -1% | -4% | 6% | -6% | 3% | |
| Maximum Upper Side * (°C) | 40.4 | 60 -49% | 33.2 18% | 42.2 -4% | 32 21% | 38.5 5% | 35.6 12% |
| Maximum Bottom * (°C) | 43.7 | 57 -30% | 39.4 10% | 45.5 -4% | 35.5 19% | 41.8 4% | 35.3 19% |
| Idle Upper Side * (°C) | 21.4 | 29.1 -36% | 25.9 -21% | 23.9 -12% | 25.6 -20% | 26.4 -23% | 25.1 -17% |
| Idle Bottom * (°C) | 25.5 | 30.2 -18% | 27.8 -9% | 24.2 5% | 25.1 2% | 27.9 -9% | 26.1 -2% |
* ... Moindre est la valeur, meilleures sont les performances
| Éteint/en veille | |
| Au repos | |
| Fortement sollicité |
|
Légende:
min: | |
| Lenovo ThinkPad E580-20KSCTO1WW i5-8250U, UHD Graphics 620, Toshiba KBG30ZMT128G, IPS LED, 1920x1080, 15.6" | Lenovo ThinkPad E580-20KS001RGE i5-8550U, Radeon RX 550 (Laptop), Lenovo LENSE20256GMSP34MEAT2TA, IPS LED, 1920x1080, 15.6" | Lenovo ThinkPad E570-20H6S02M00 i5-7200U, HD Graphics 620, Samsung PM961 MZVLW256HEHP, TN LED, 1366x768, 15.6" | HP ProBook 450 G5-2UB53EA i5-8250U, UHD Graphics 620, SanDisk SD8SN8U256G1006, IPS LED, 1920x1080, 15.6" | Acer TravelMate P2510-M-51ZQ i5-7200U, HD Graphics 620, SK Hynix HFS256G39TND-N210A, IPS, 1920x1080, 15.6" | Schenker Slim 15 L17 i5-8550U, UHD Graphics 620, Samsung SSD 960 Pro 512 GB m.2, IPS, 1920x1080, 15.6" | Dell Vostro 15 3568 i5-7200U, HD Graphics 620, Micron 1100 MTFDDAV256TBN, TN LED, 1920x1080, 15.6" | |
|---|---|---|---|---|---|---|---|
| Power Consumption | -65% | 16% | -3% | 2% | -53% | 21% | |
| Idle Minimum * (Watt) | 3.4 | 7.4 -118% | 2.9 15% | 3.6 -6% | 3.4 -0% | 7.2 -112% | 3 12% |
| Idle Average * (Watt) | 6.7 | 10.4 -55% | 5.8 13% | 6.2 7% | 5.8 13% | 10.9 -63% | 5.5 18% |
| Idle Maximum * (Watt) | 7.7 | 10.3 -34% | 6.6 14% | 7.2 6% | 8 -4% | 12.6 -64% | 5.7 26% |
| Load Average * (Watt) | 31.1 | 57 -83% | 29 7% | 35.2 -13% | 38 -22% | 37 -19% | 27 13% |
| Load Maximum * (Watt) | 42.9 | 57 -33% | 29.4 31% | 46.4 -8% | 32 25% | 45.5 -6% | 27.4 36% |
* ... Moindre est la valeur, meilleures sont les performances
| Lenovo ThinkPad E580-20KSCTO1WW i5-8250U, UHD Graphics 620, 45 Wh | Lenovo ThinkPad E580-20KS001RGE i5-8550U, Radeon RX 550 (Laptop), 45 Wh | Lenovo ThinkPad E570-20H6S02M00 i5-7200U, HD Graphics 620, 42 Wh | HP ProBook 450 G5-2UB53EA i5-8250U, UHD Graphics 620, 48 Wh | Acer TravelMate P2510-M-51ZQ i5-7200U, HD Graphics 620, 48 Wh | Schenker Slim 15 L17 i5-8550U, UHD Graphics 620, 44 Wh | Dell Vostro 15 3568 i5-7200U, HD Graphics 620, 40 Wh | |
|---|---|---|---|---|---|---|---|
| Autonomie de la batterie | 2% | 5% | 10% | 17% | -34% | 1% | |
| Reader / Idle (h) | 14.4 | 14.4 0% | 18.1 26% | 15.2 6% | 7.4 -49% | 14.6 1% | |
| H.264 (h) | 7.3 | 9.1 25% | 6.5 -11% | 4.3 -41% | |||
| WiFi v1.3 (h) | 7 | 6.7 -4% | 7.2 3% | 7.7 10% | 8.8 26% | 4.6 -34% | 6.3 -10% |
| Load (h) | 1.6 | 1.4 -13% | 1.6 0% | 1.9 19% | 1.4 -13% | 1.8 13% |
Points positifs
Points négatifs

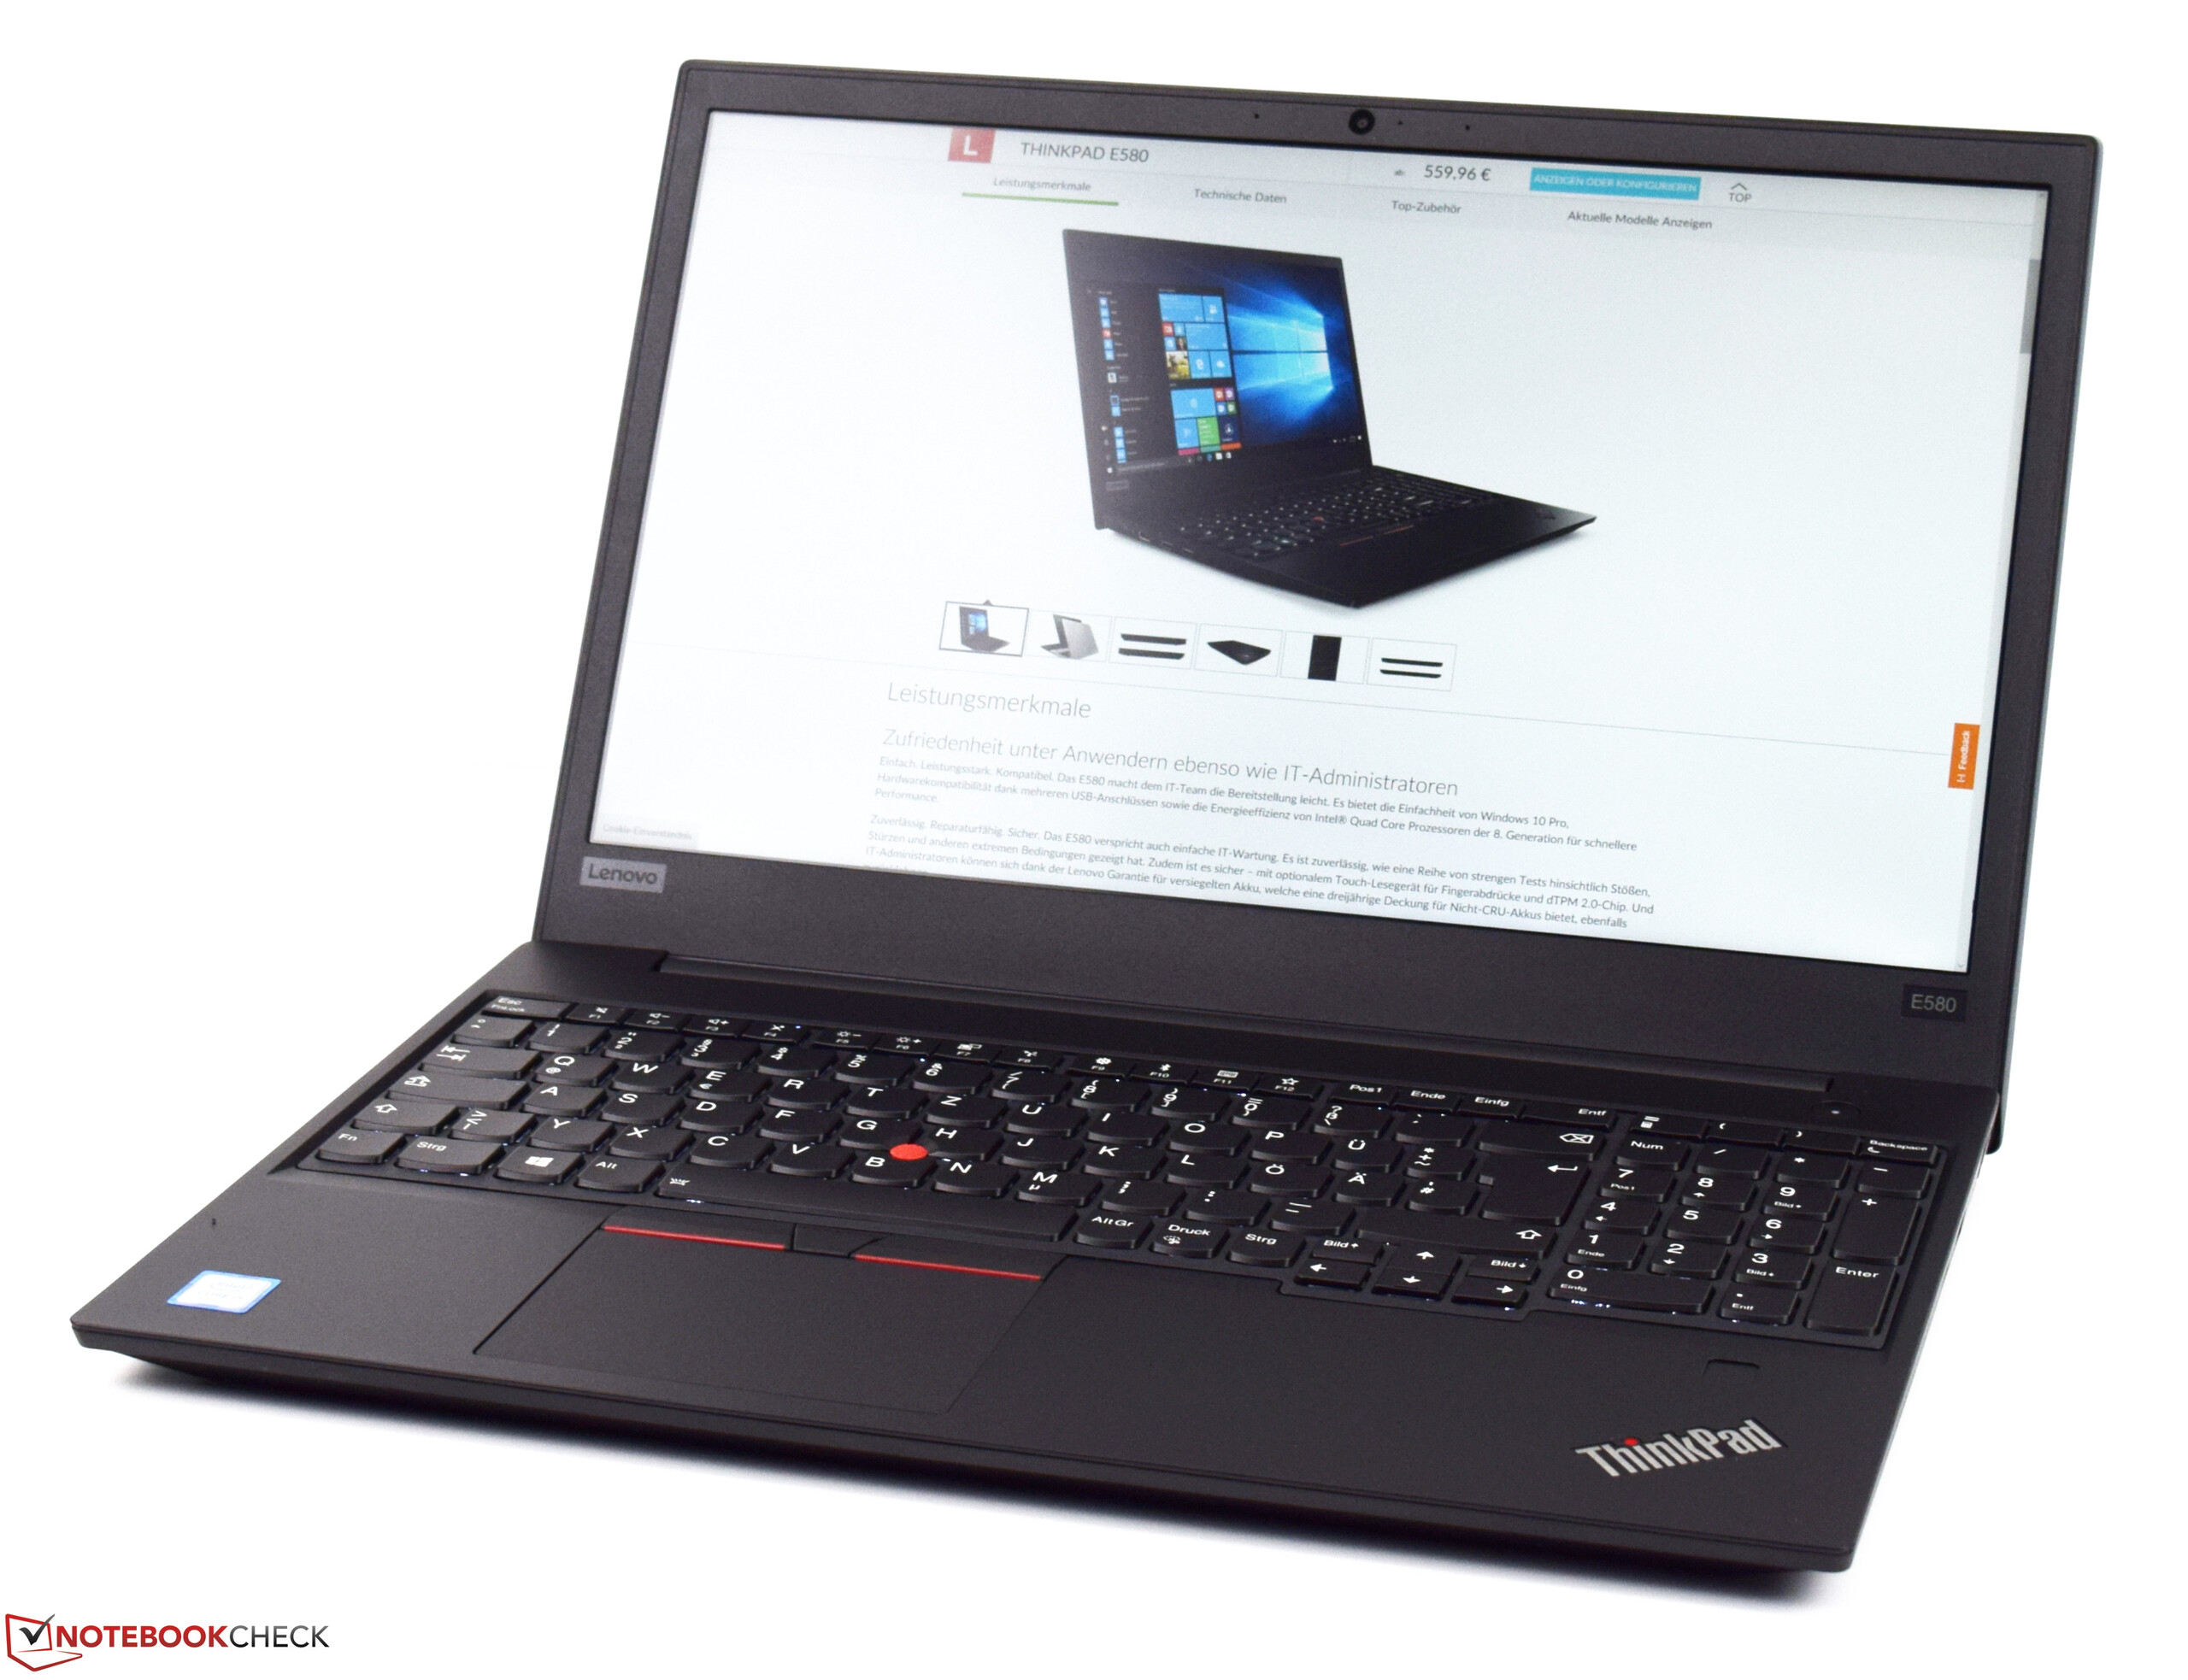
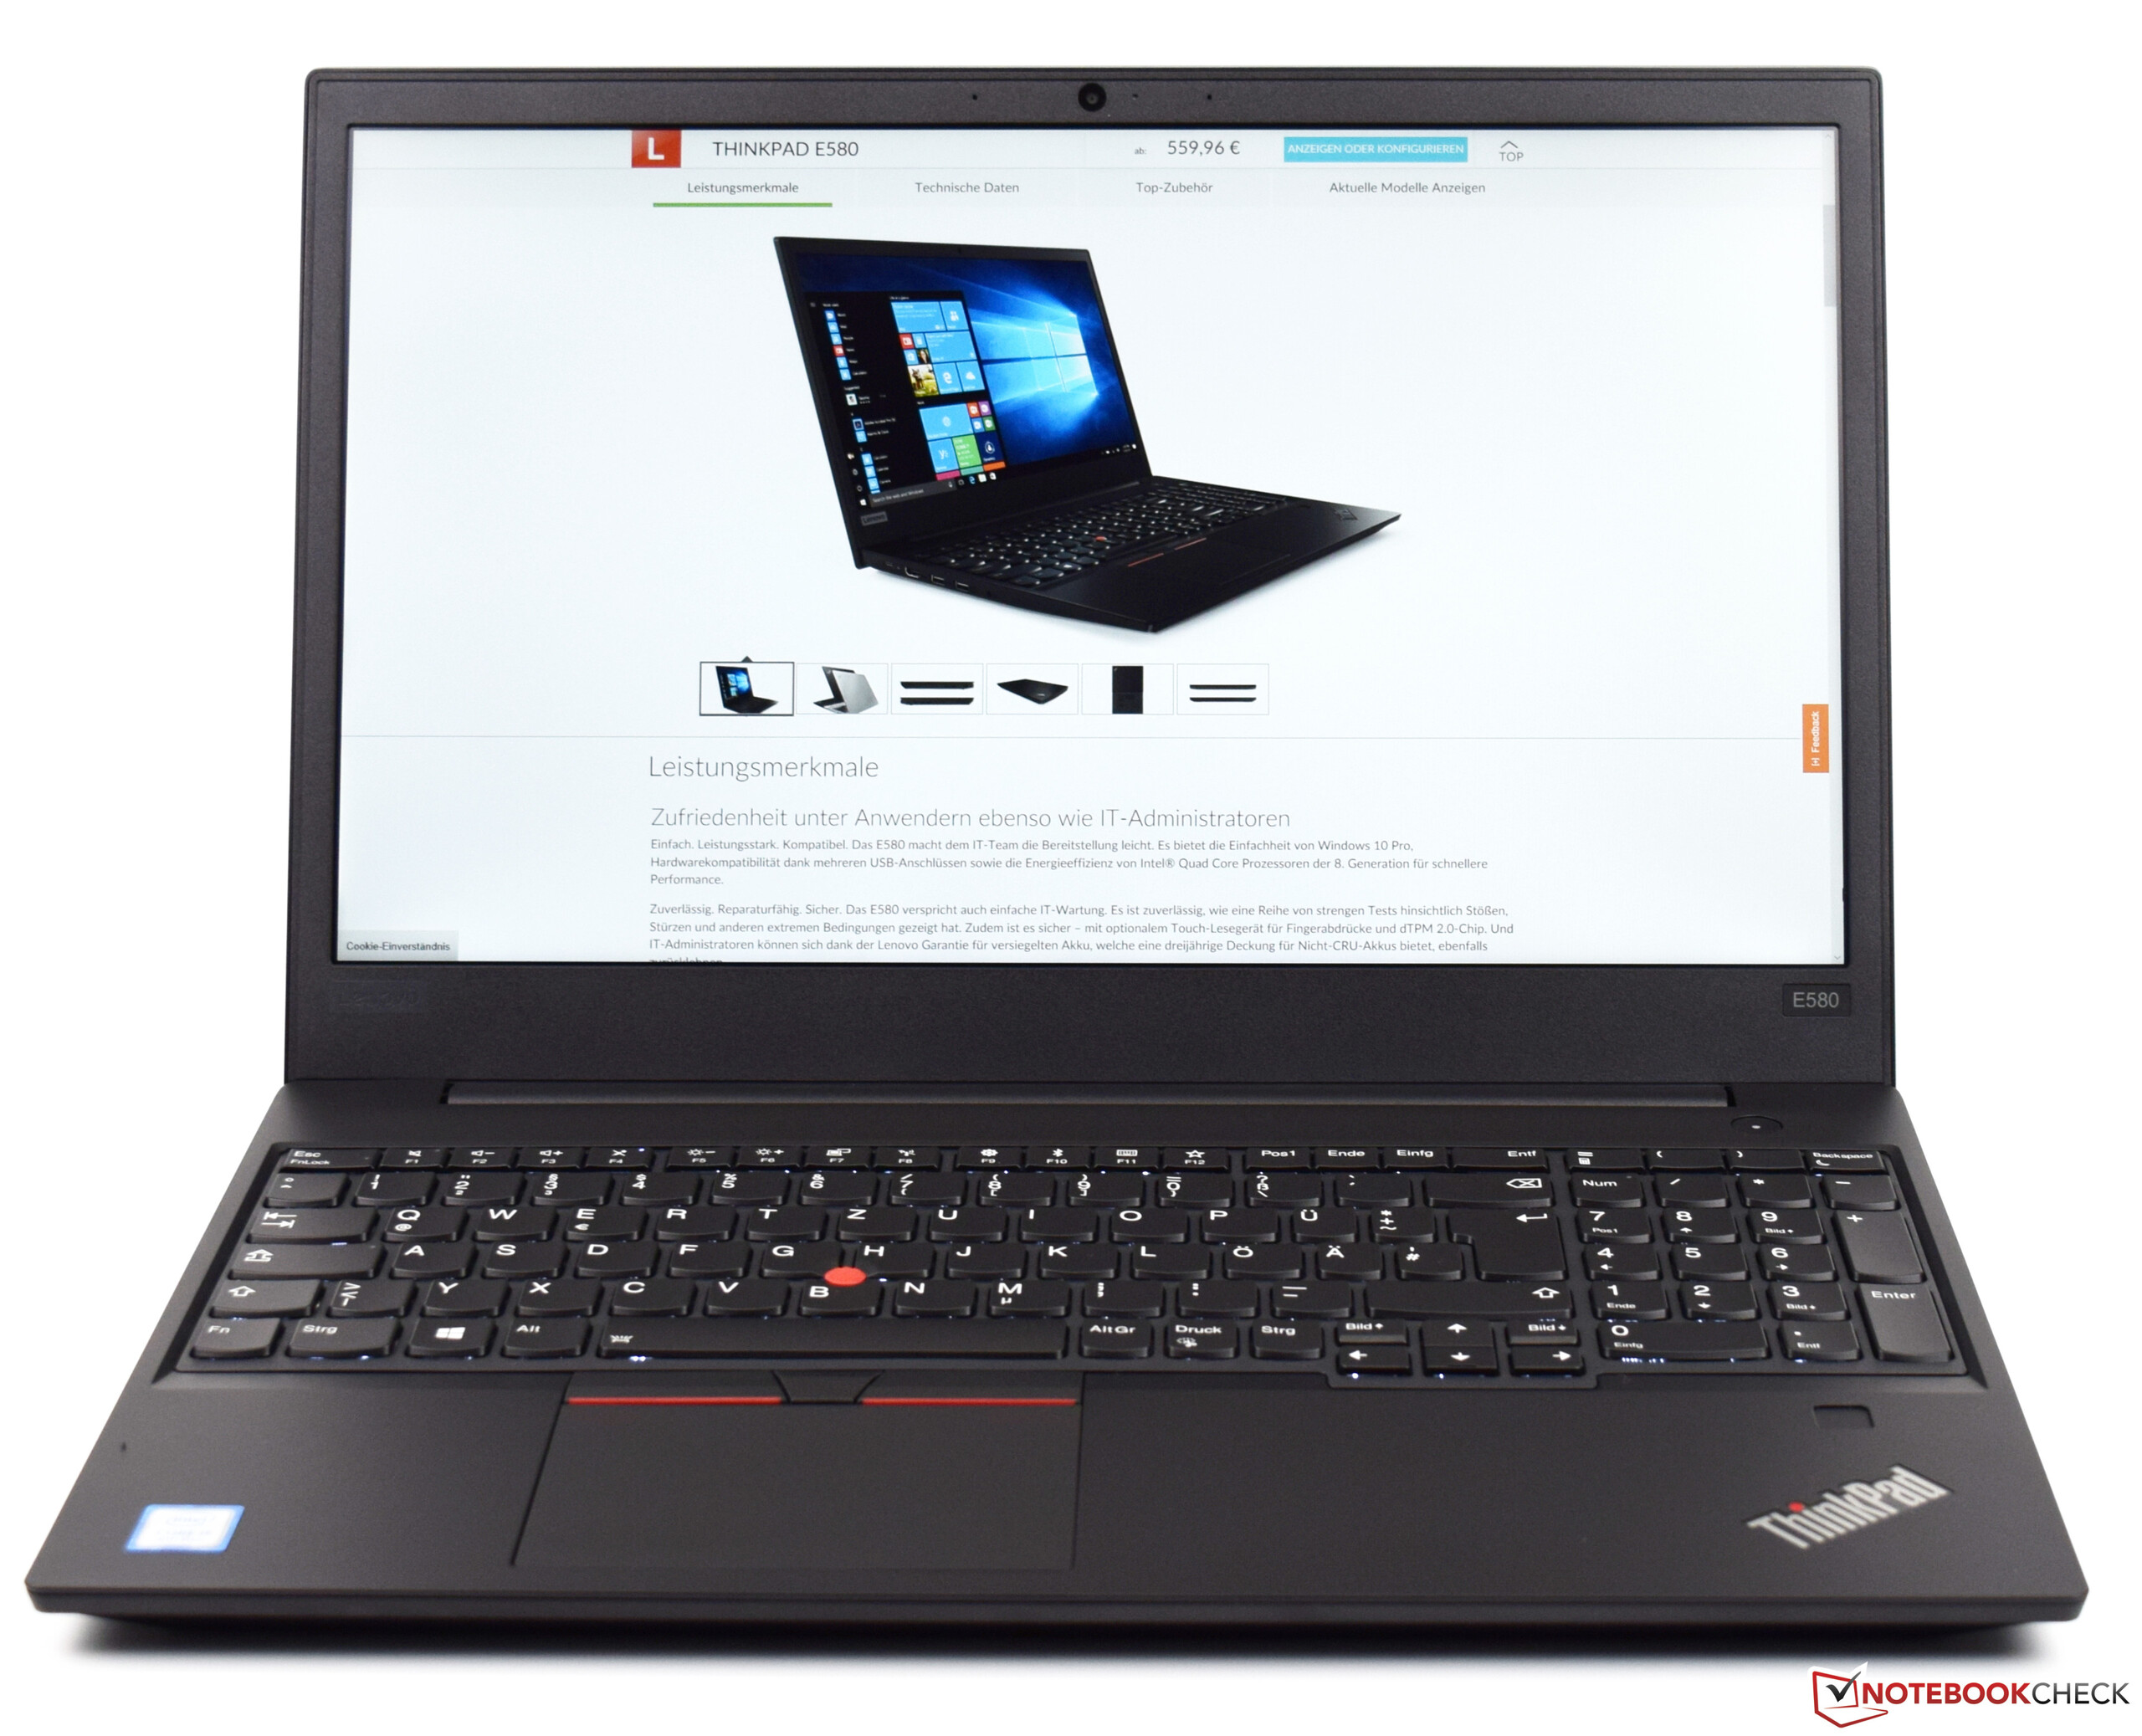
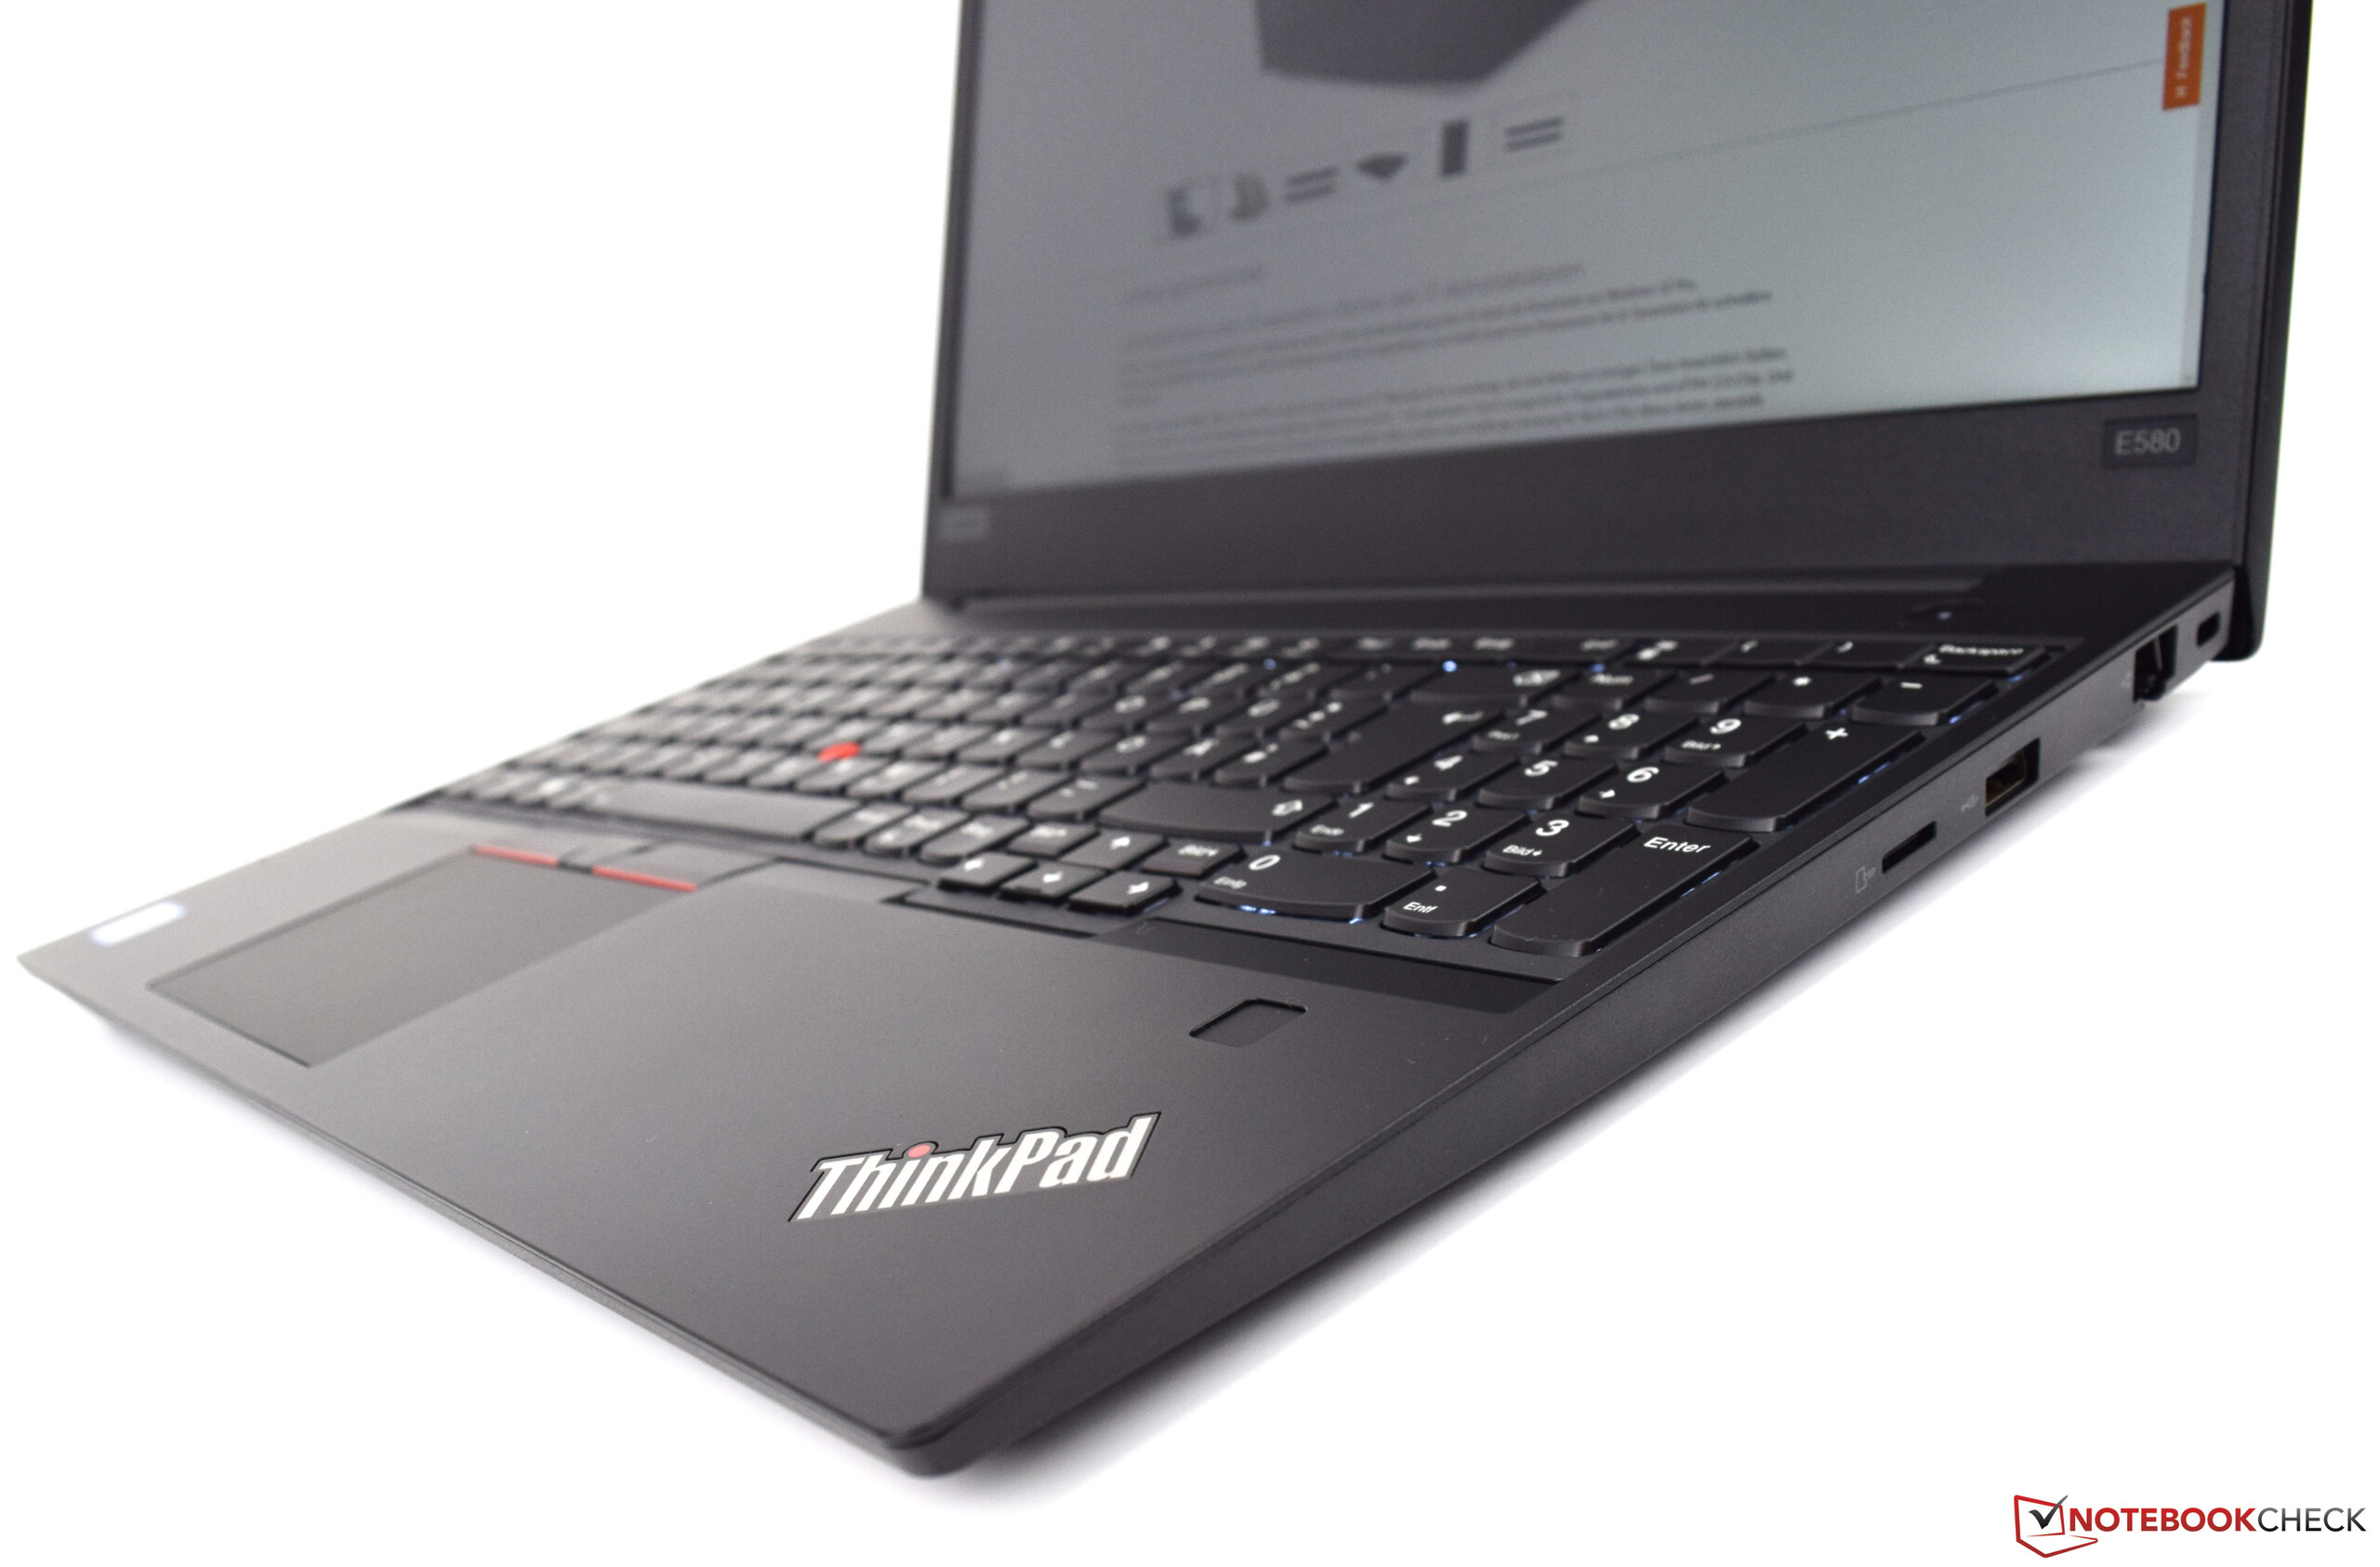
Le Lenovo ThinkPad E580 est un portable de bureau d’entrée de gamme équipé du processeur puissant et récent Intel Core i5-8250U. Ses 8 Go de RAM DDR4 devraient suffire pour les tâches de bureautique courantes, mais son SSD de 128 Go risque de se révéler un peu juste avec le temps – un SSD de 256 Go aurait été un meilleur choix. Néanmoins la version 128 Go possède de nombreux atouts. Il faut tout particulièrement relever l’écran IPS, surtout vu le prix de l’appareil. Les portables bureautique abordables sont d’habitude équipés d’écrans TN limités et bon marché.
Le ThinkPad E580 de Lenovo comble parfaitement les besoins d’un portable de bureau abordable. La capacité de stockage de 128 Go du SSD est un compromis acceptable, et les performances globales de l’appareil sont tout à fait honnêtes vu le faible prix de l’appareil. L’appareil mérite donc d’être recommandé.
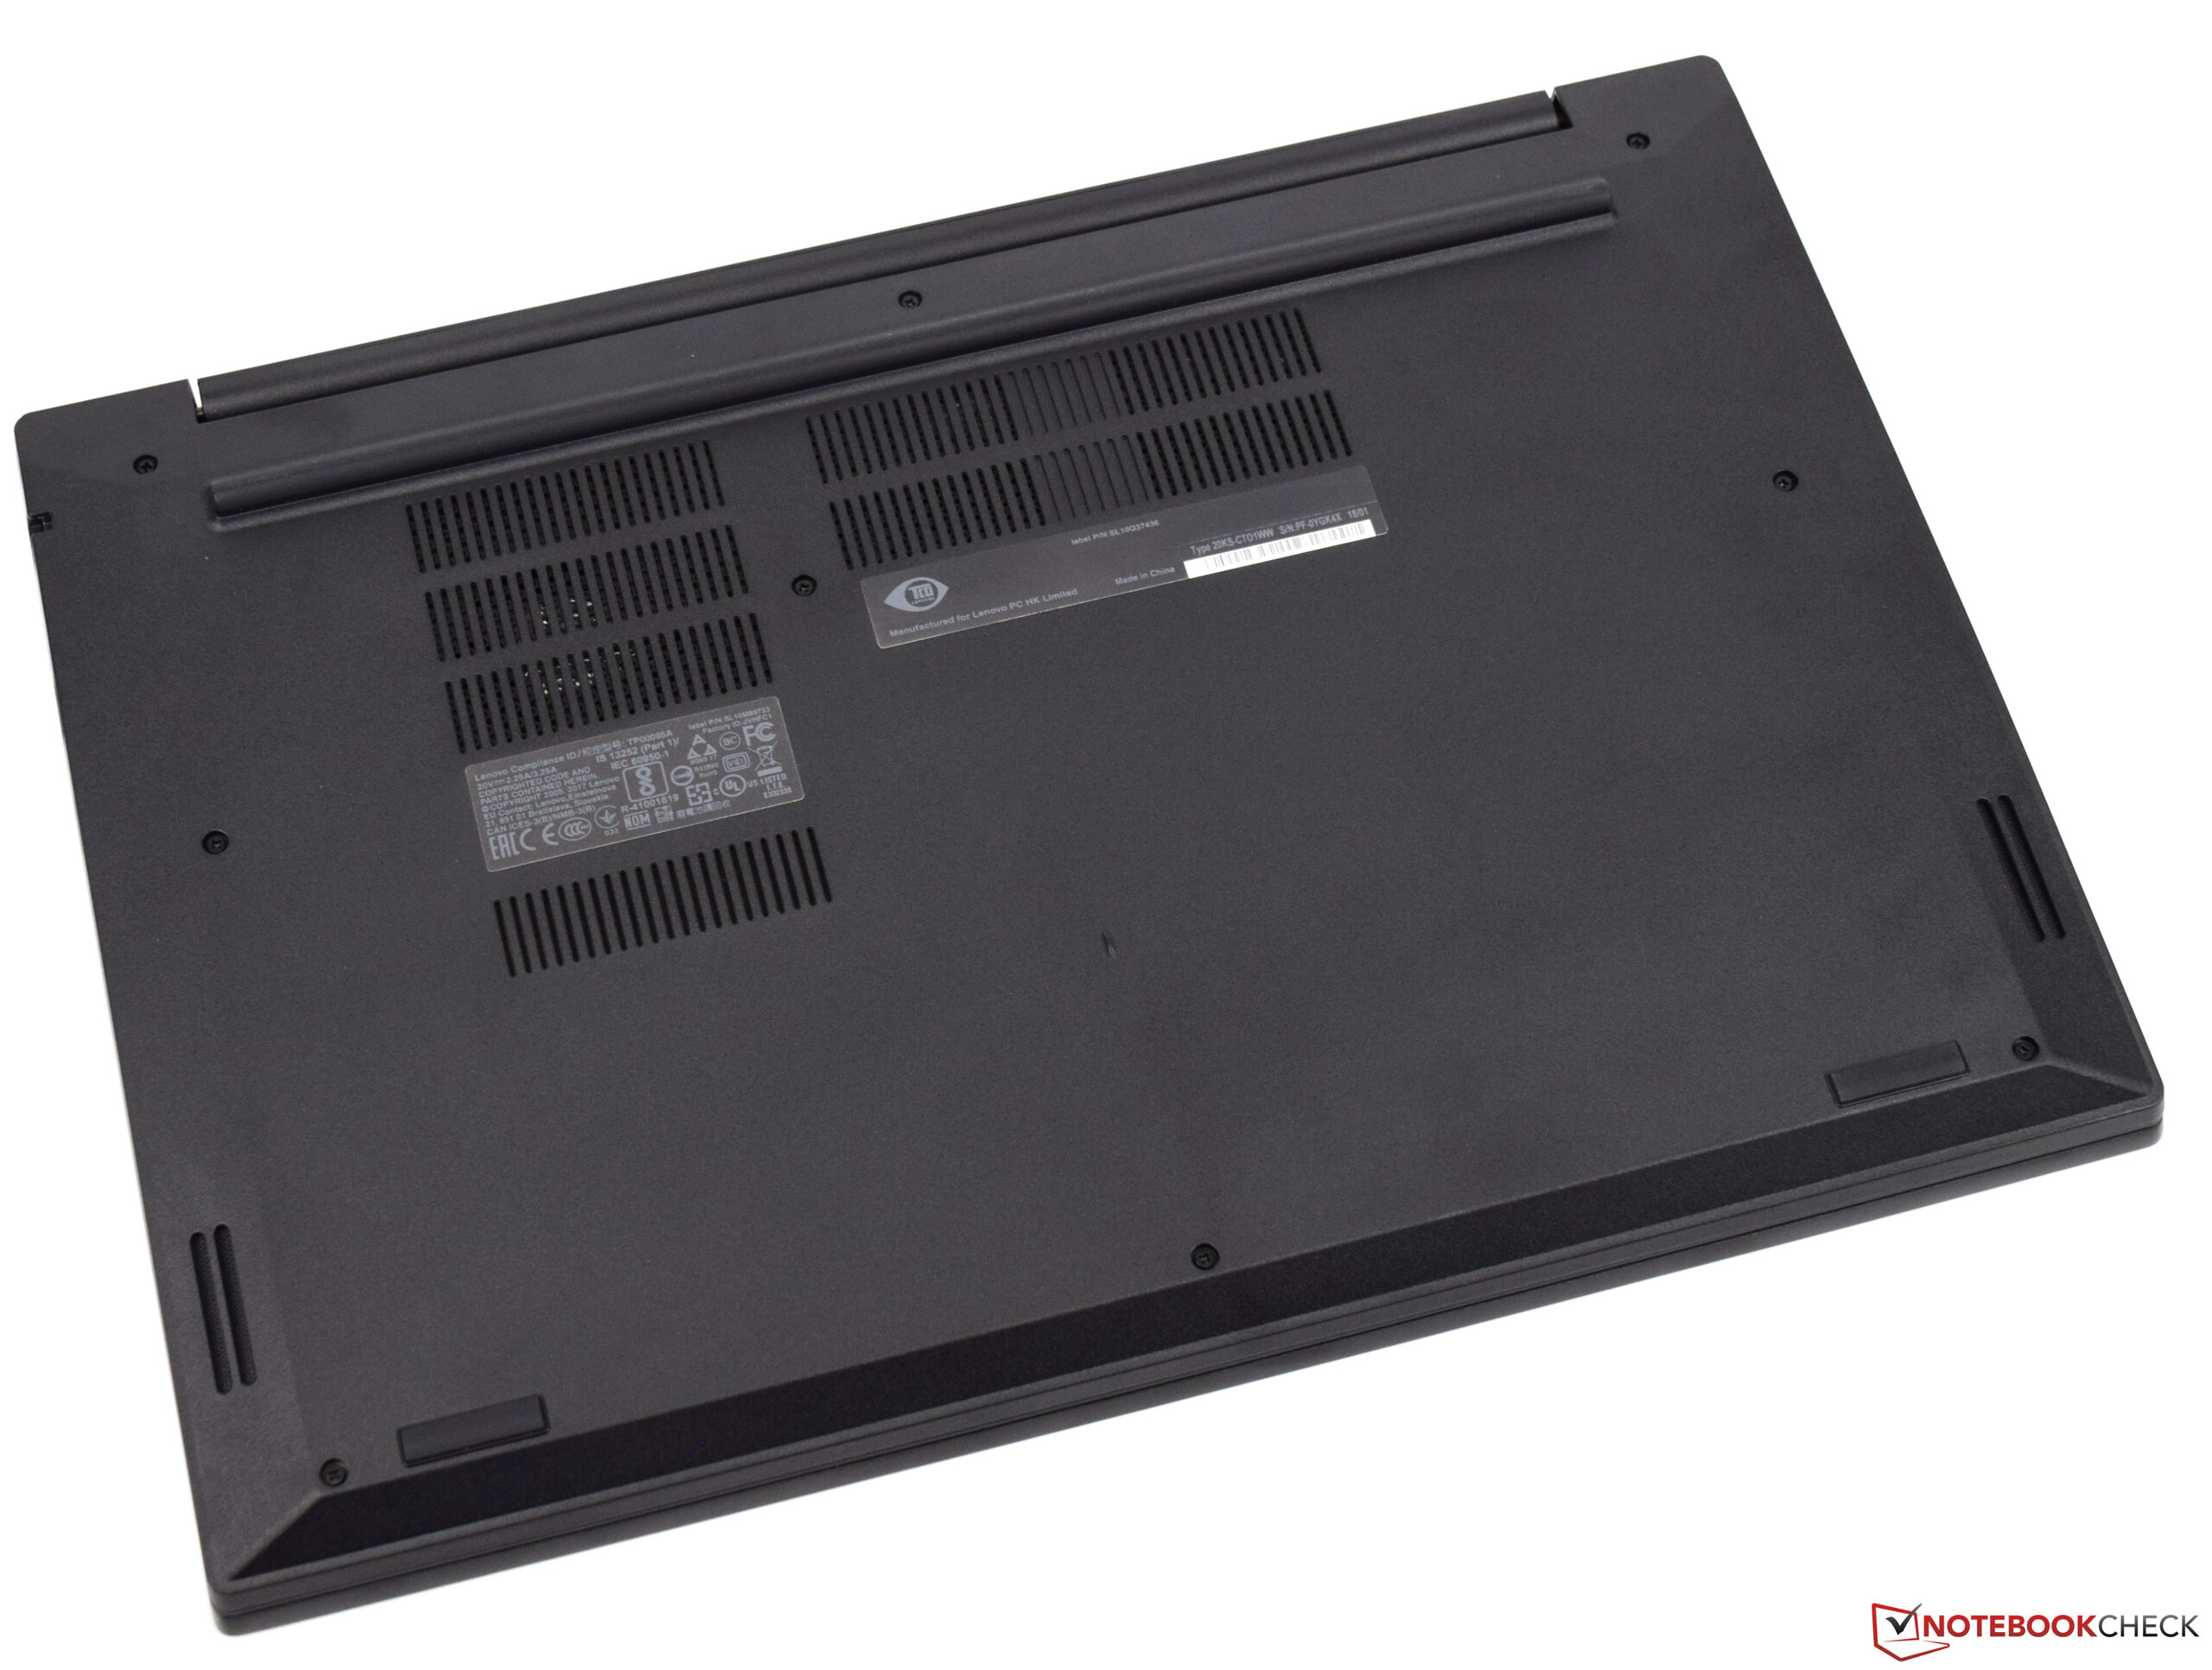
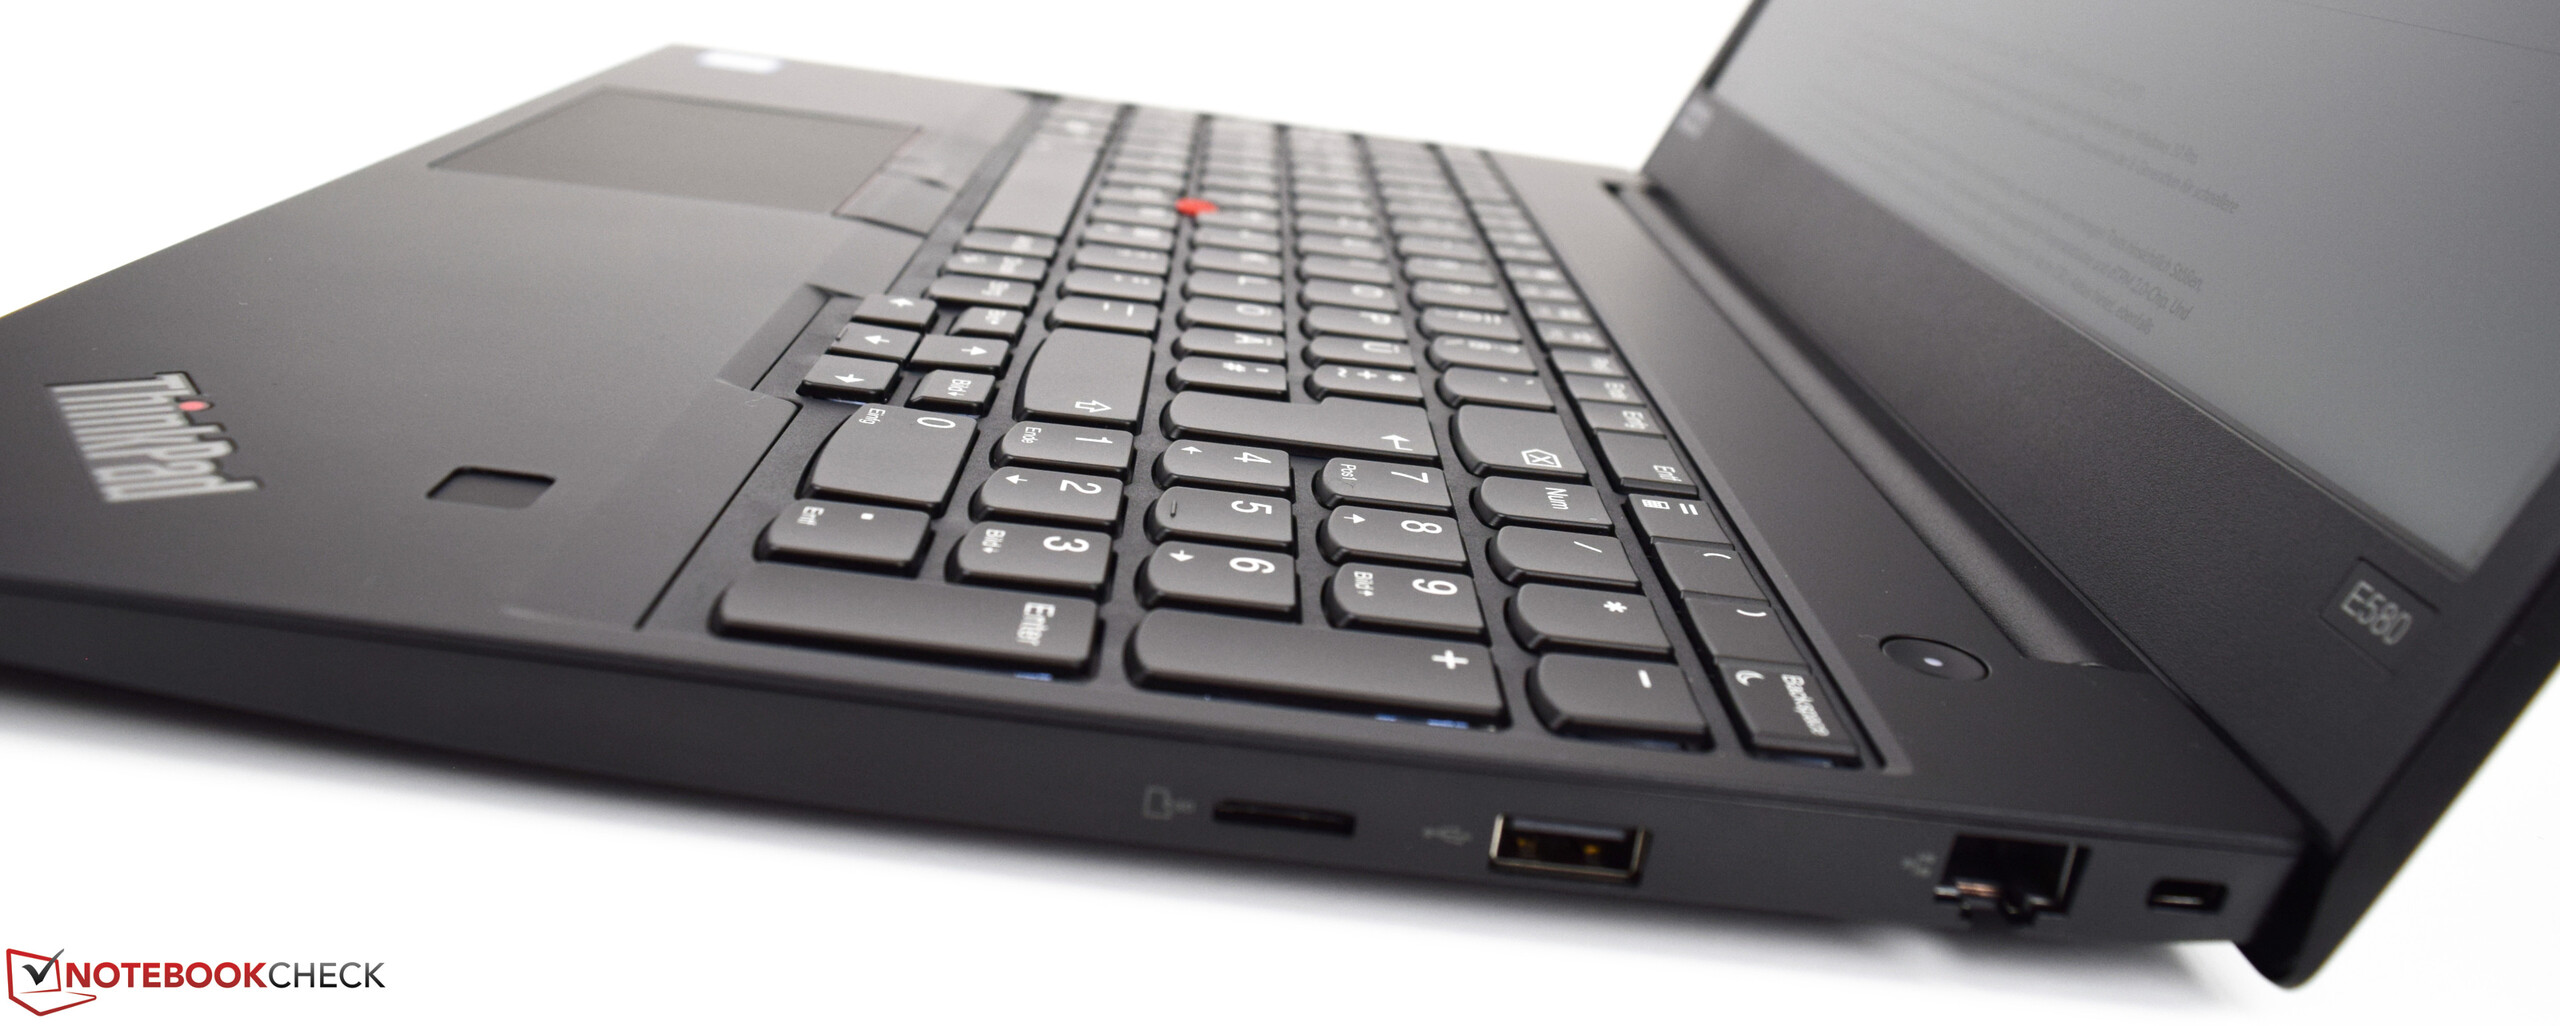
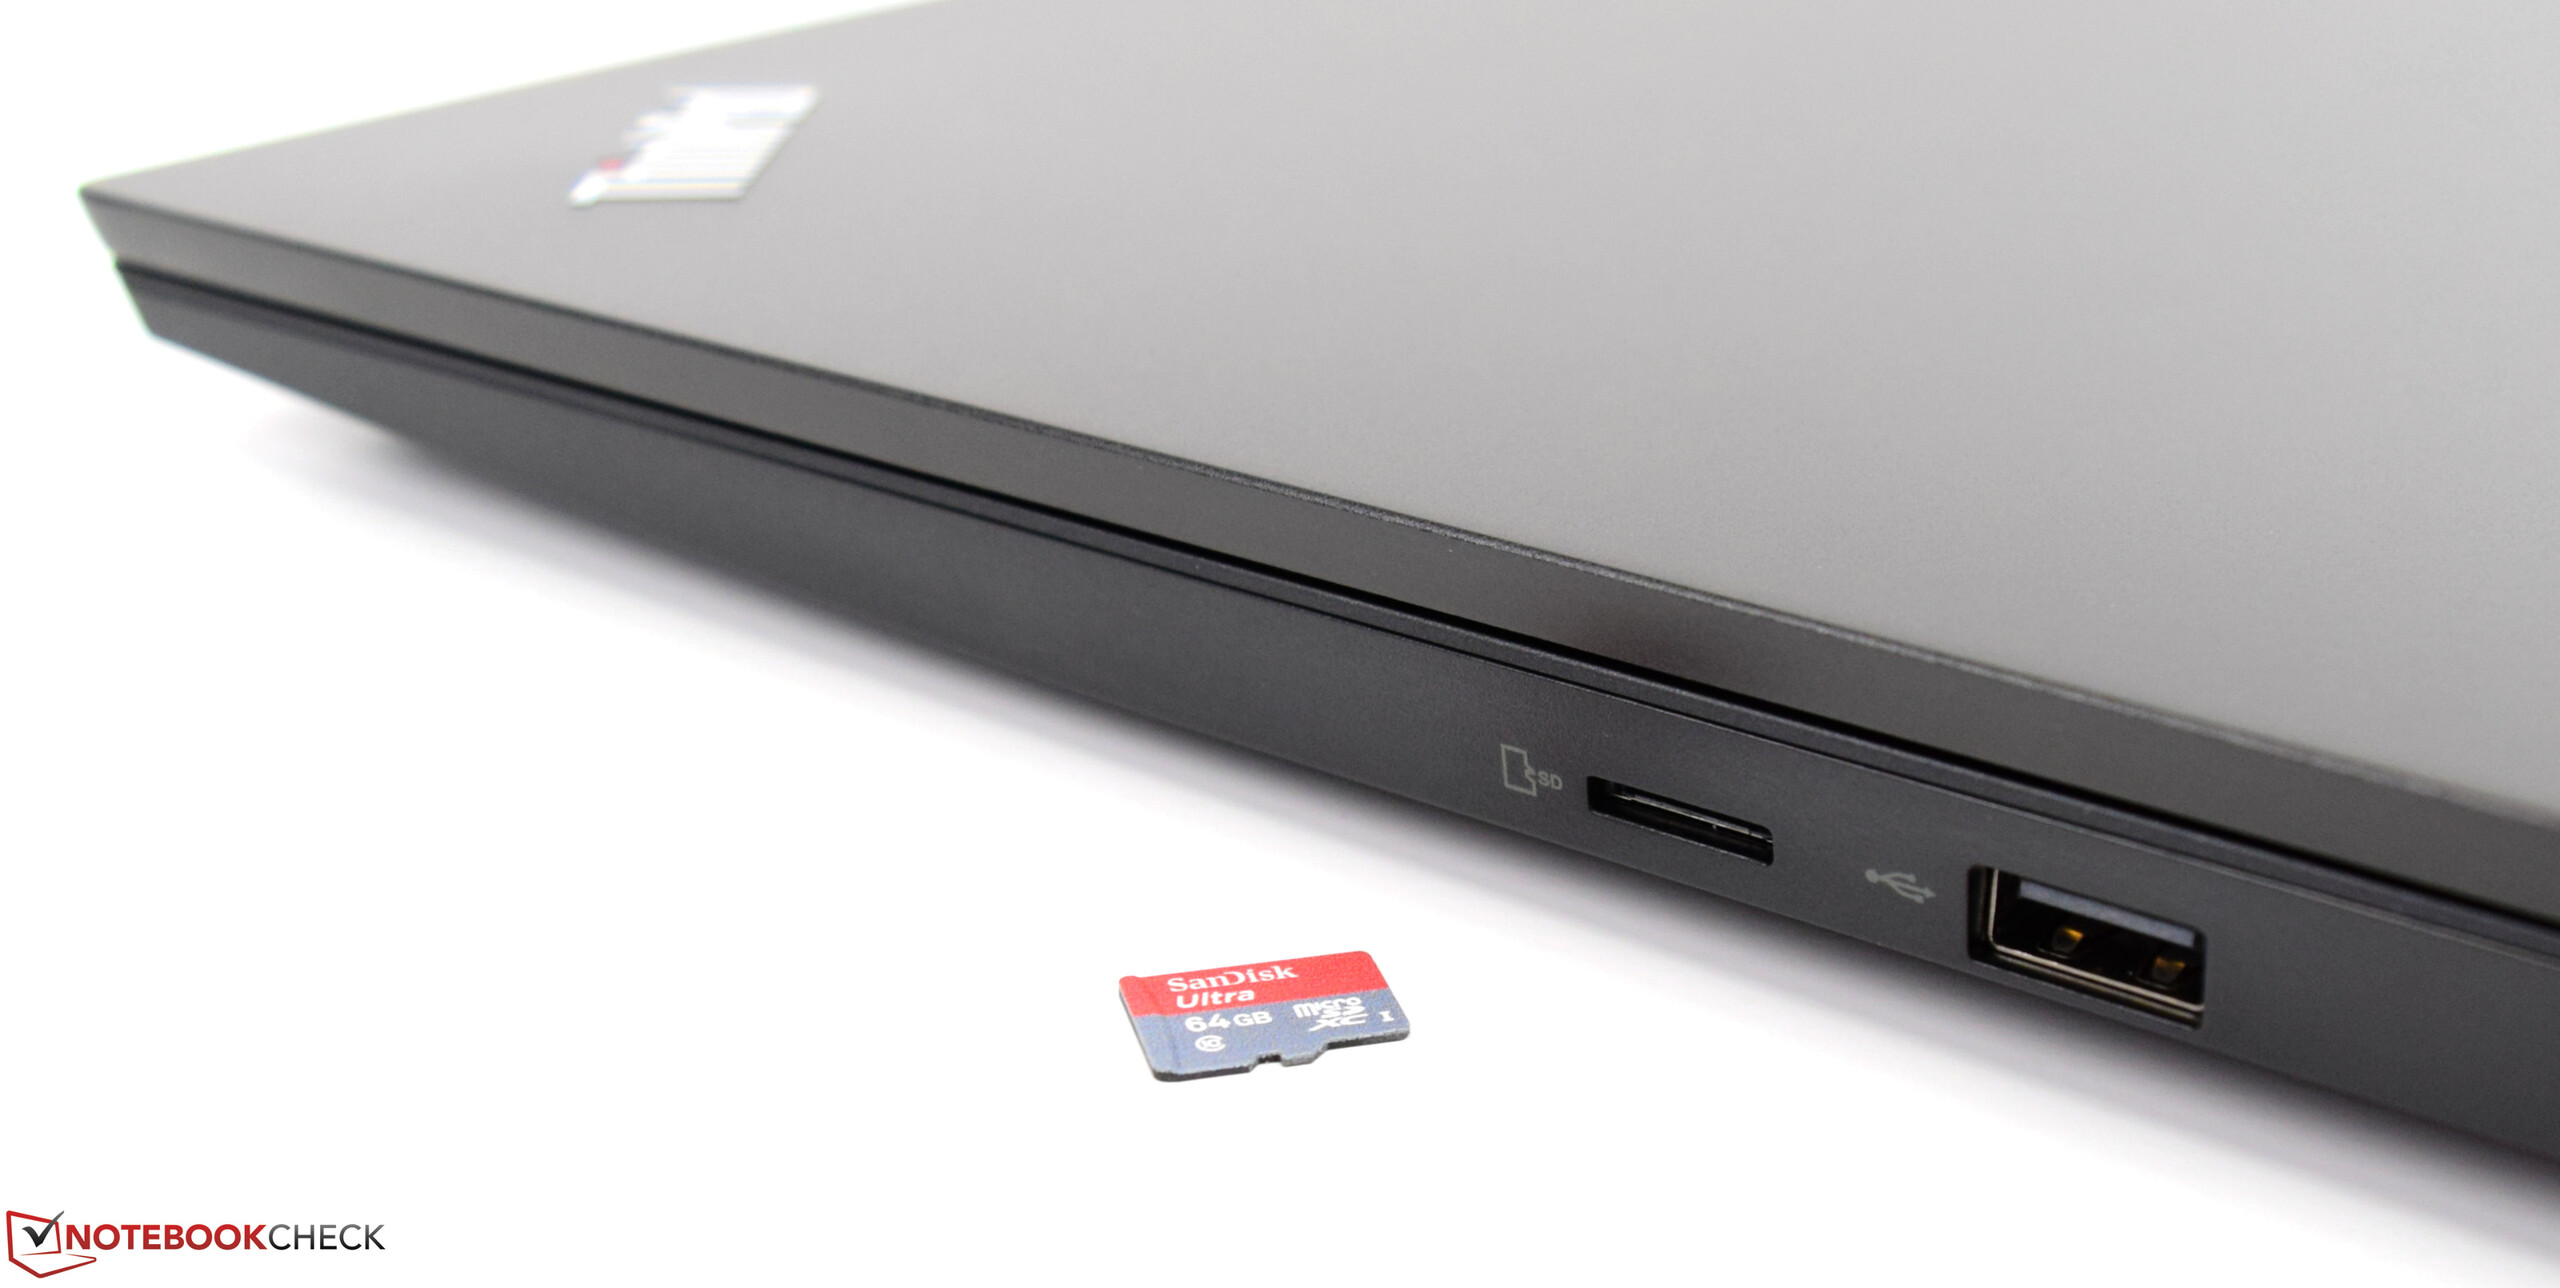
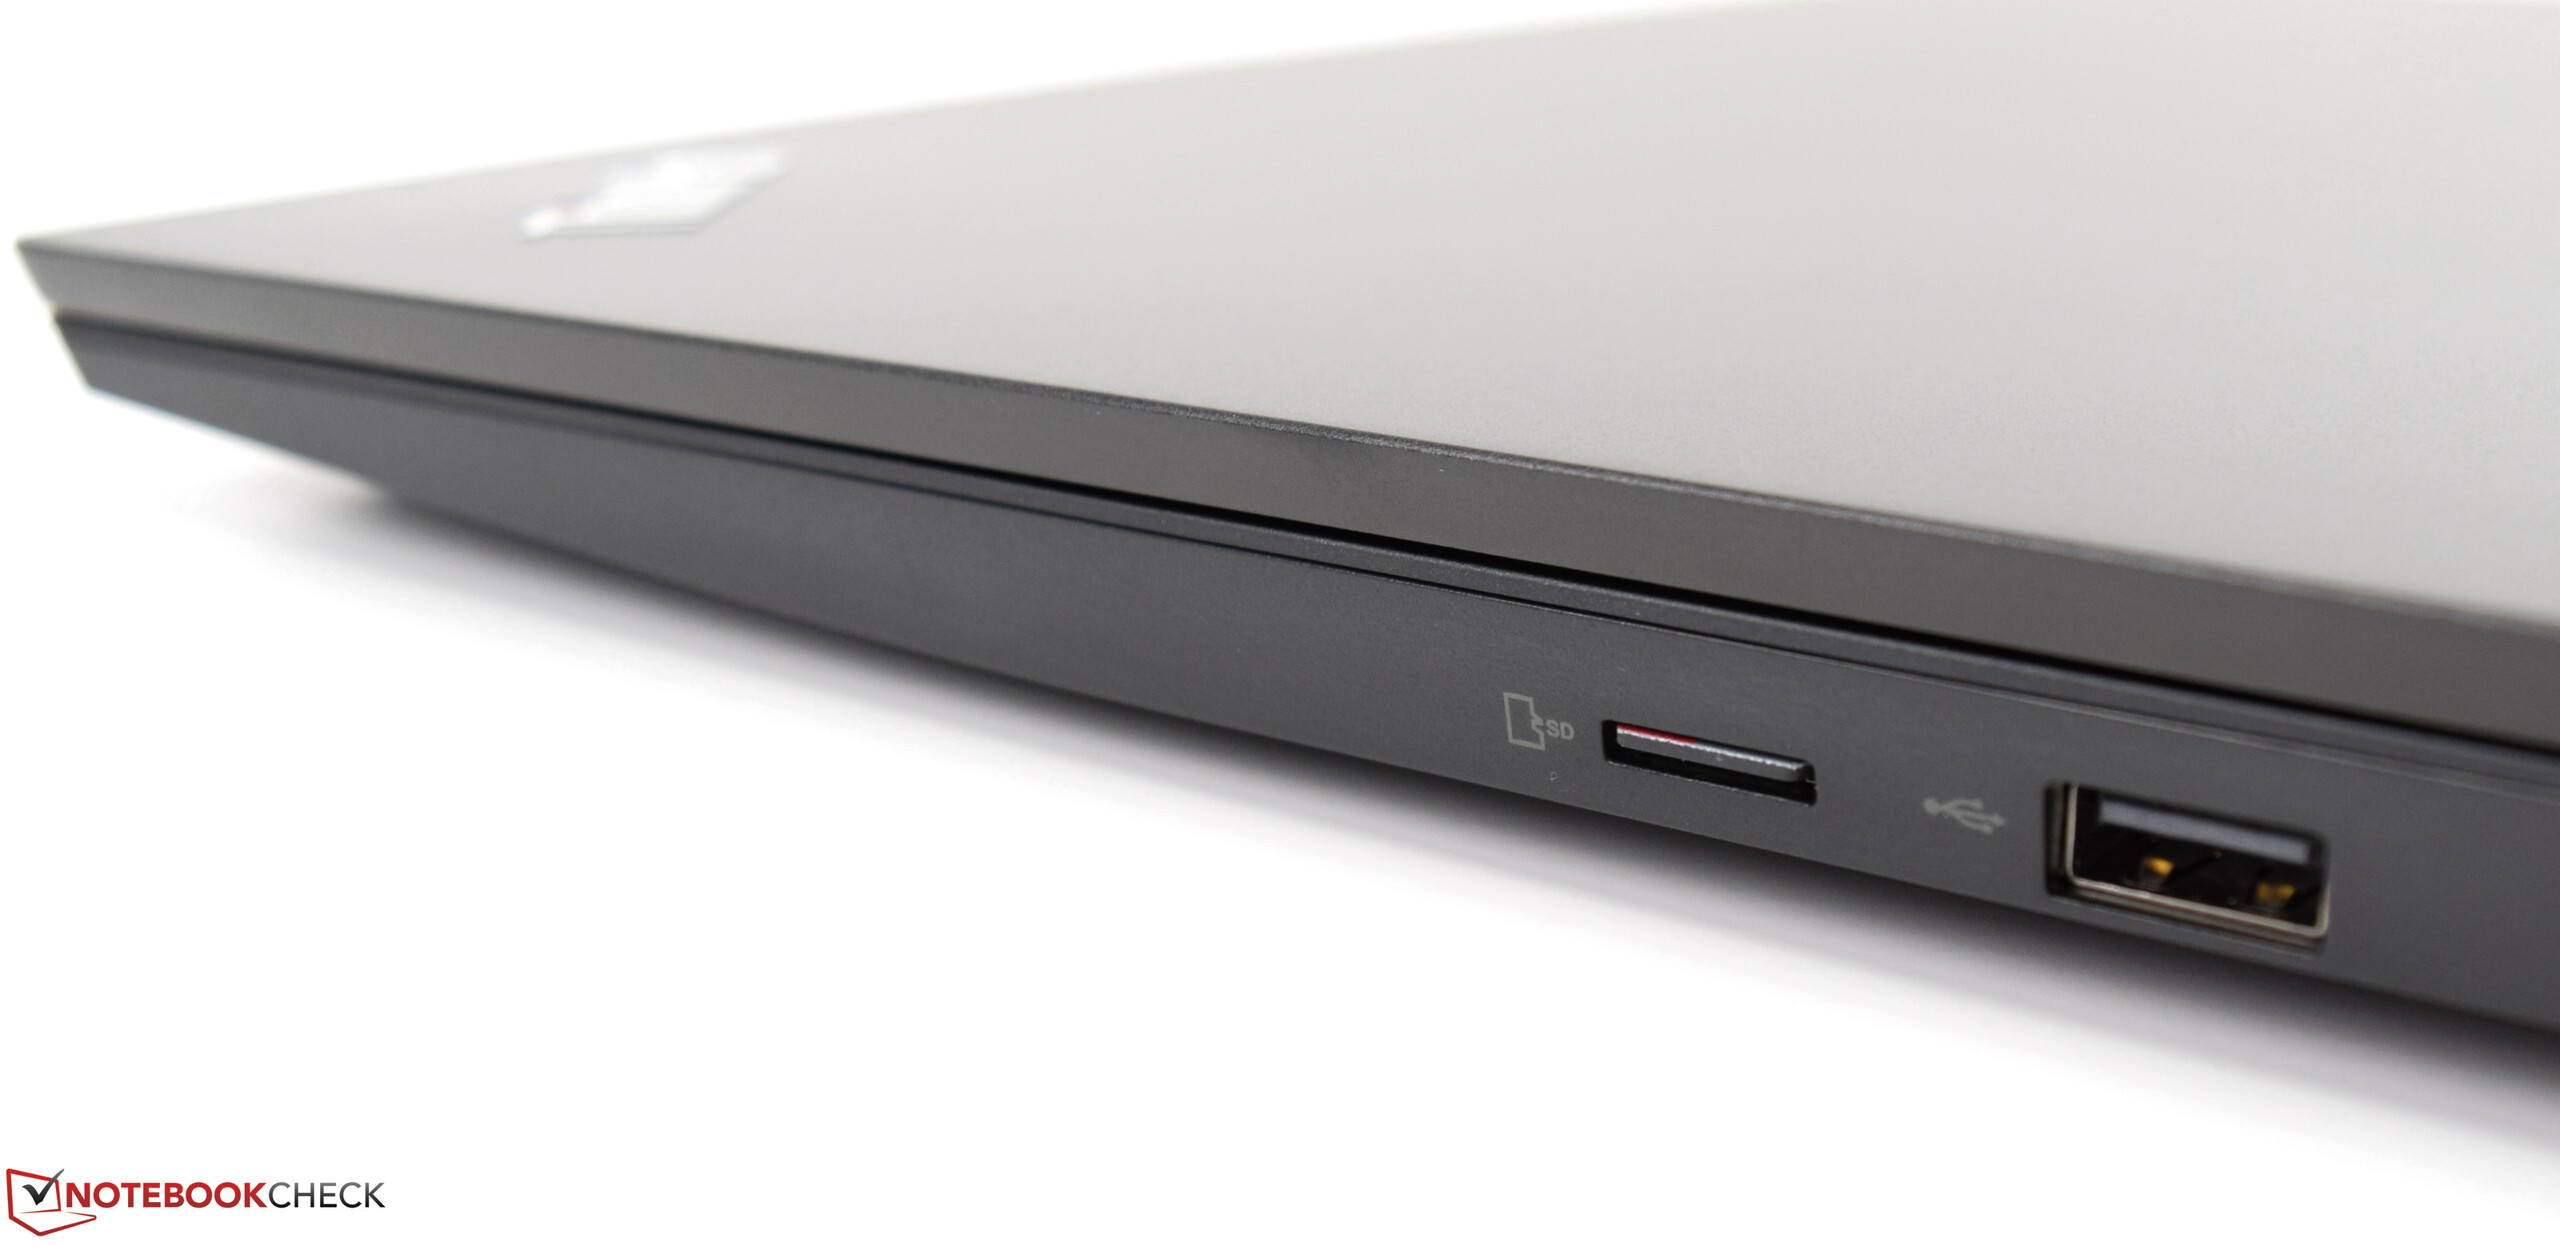
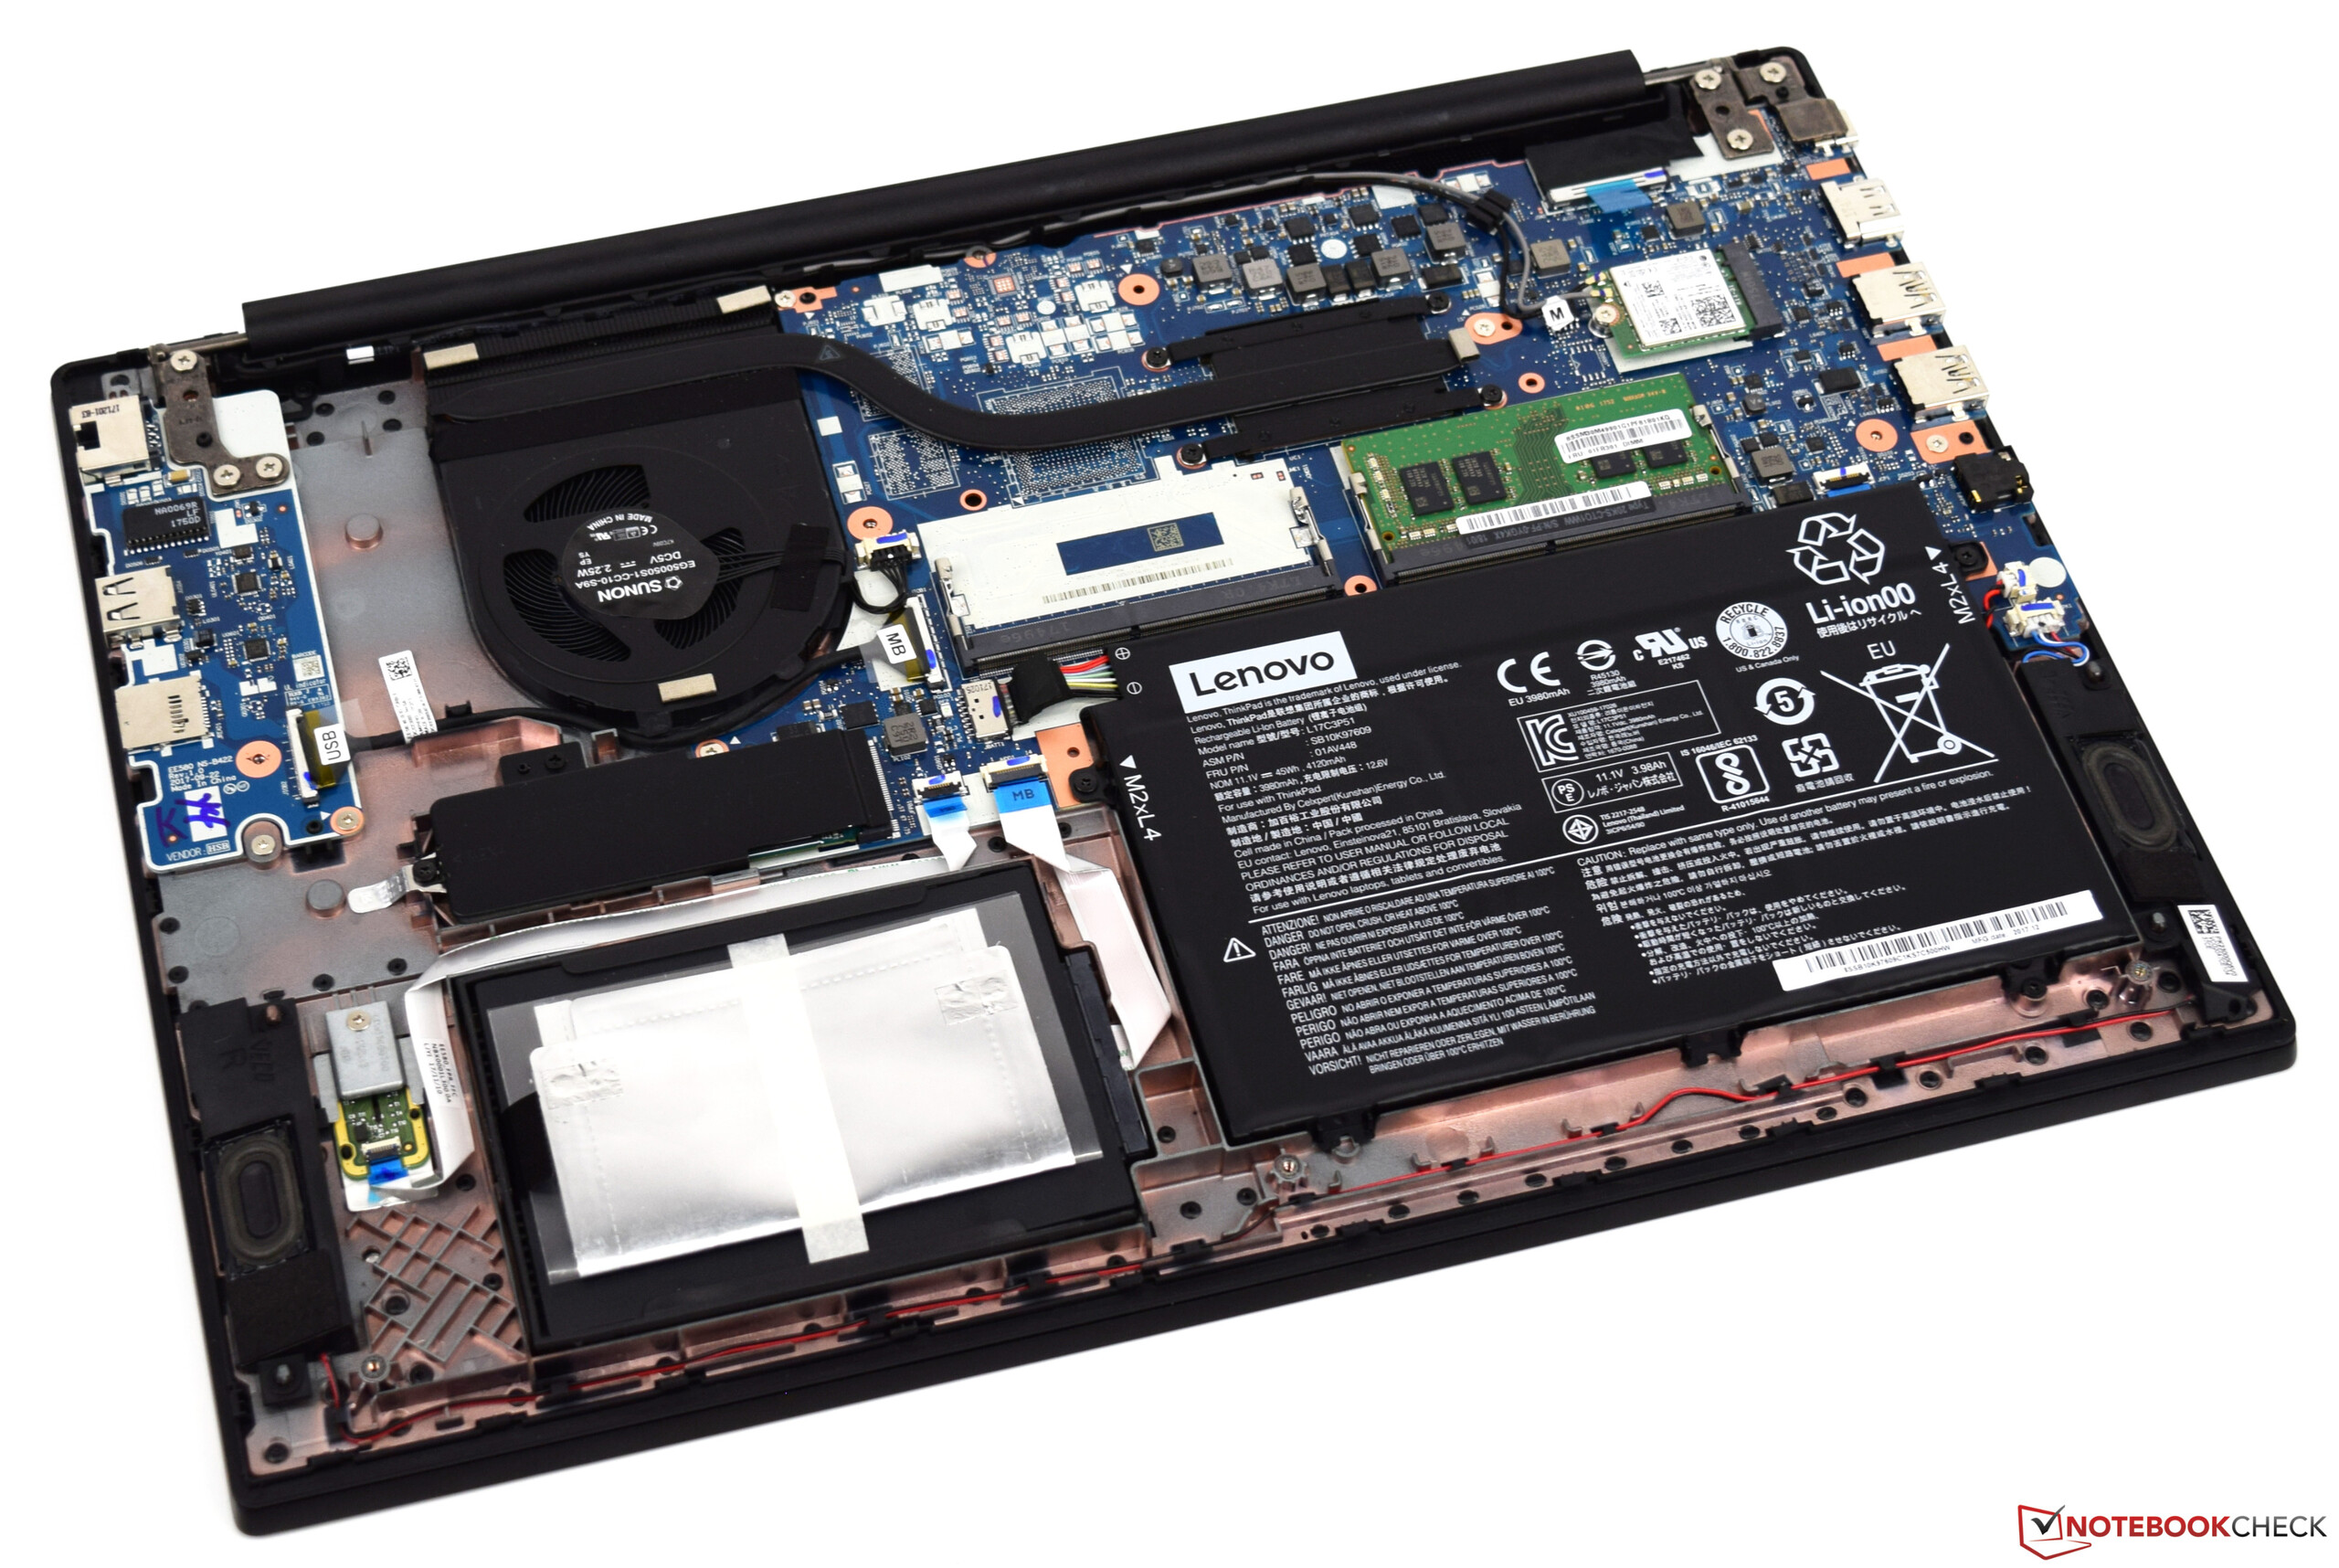
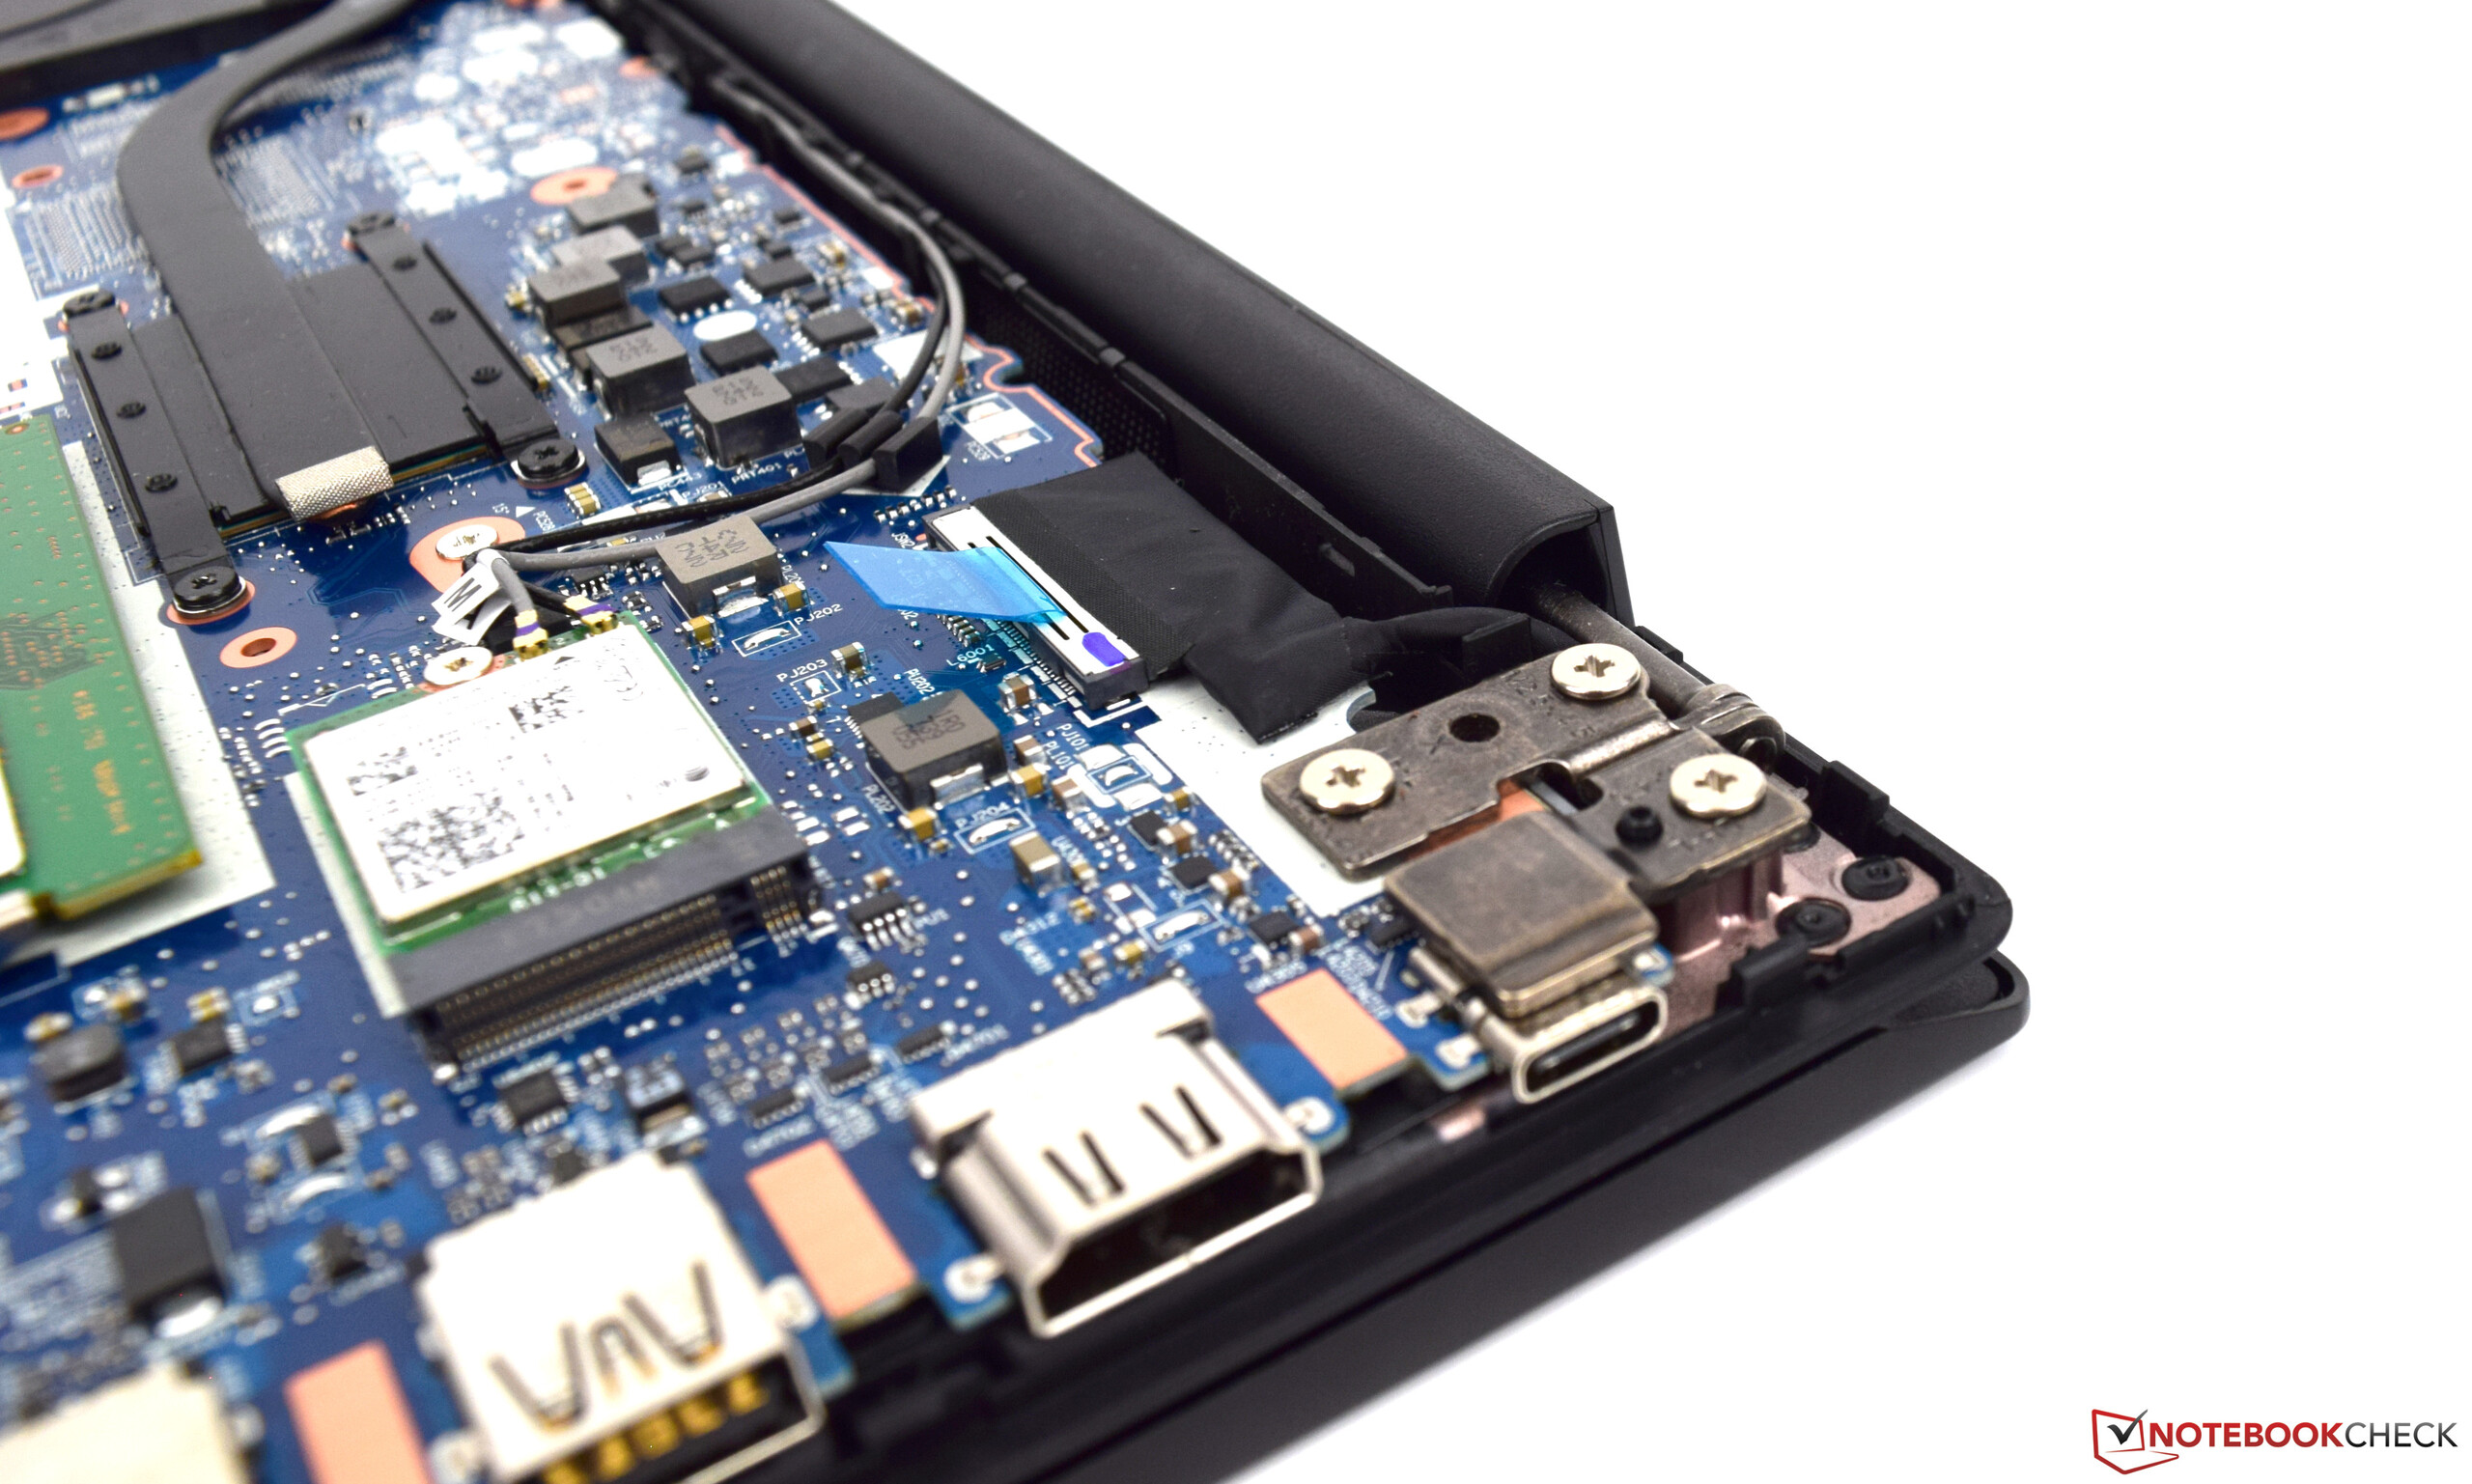
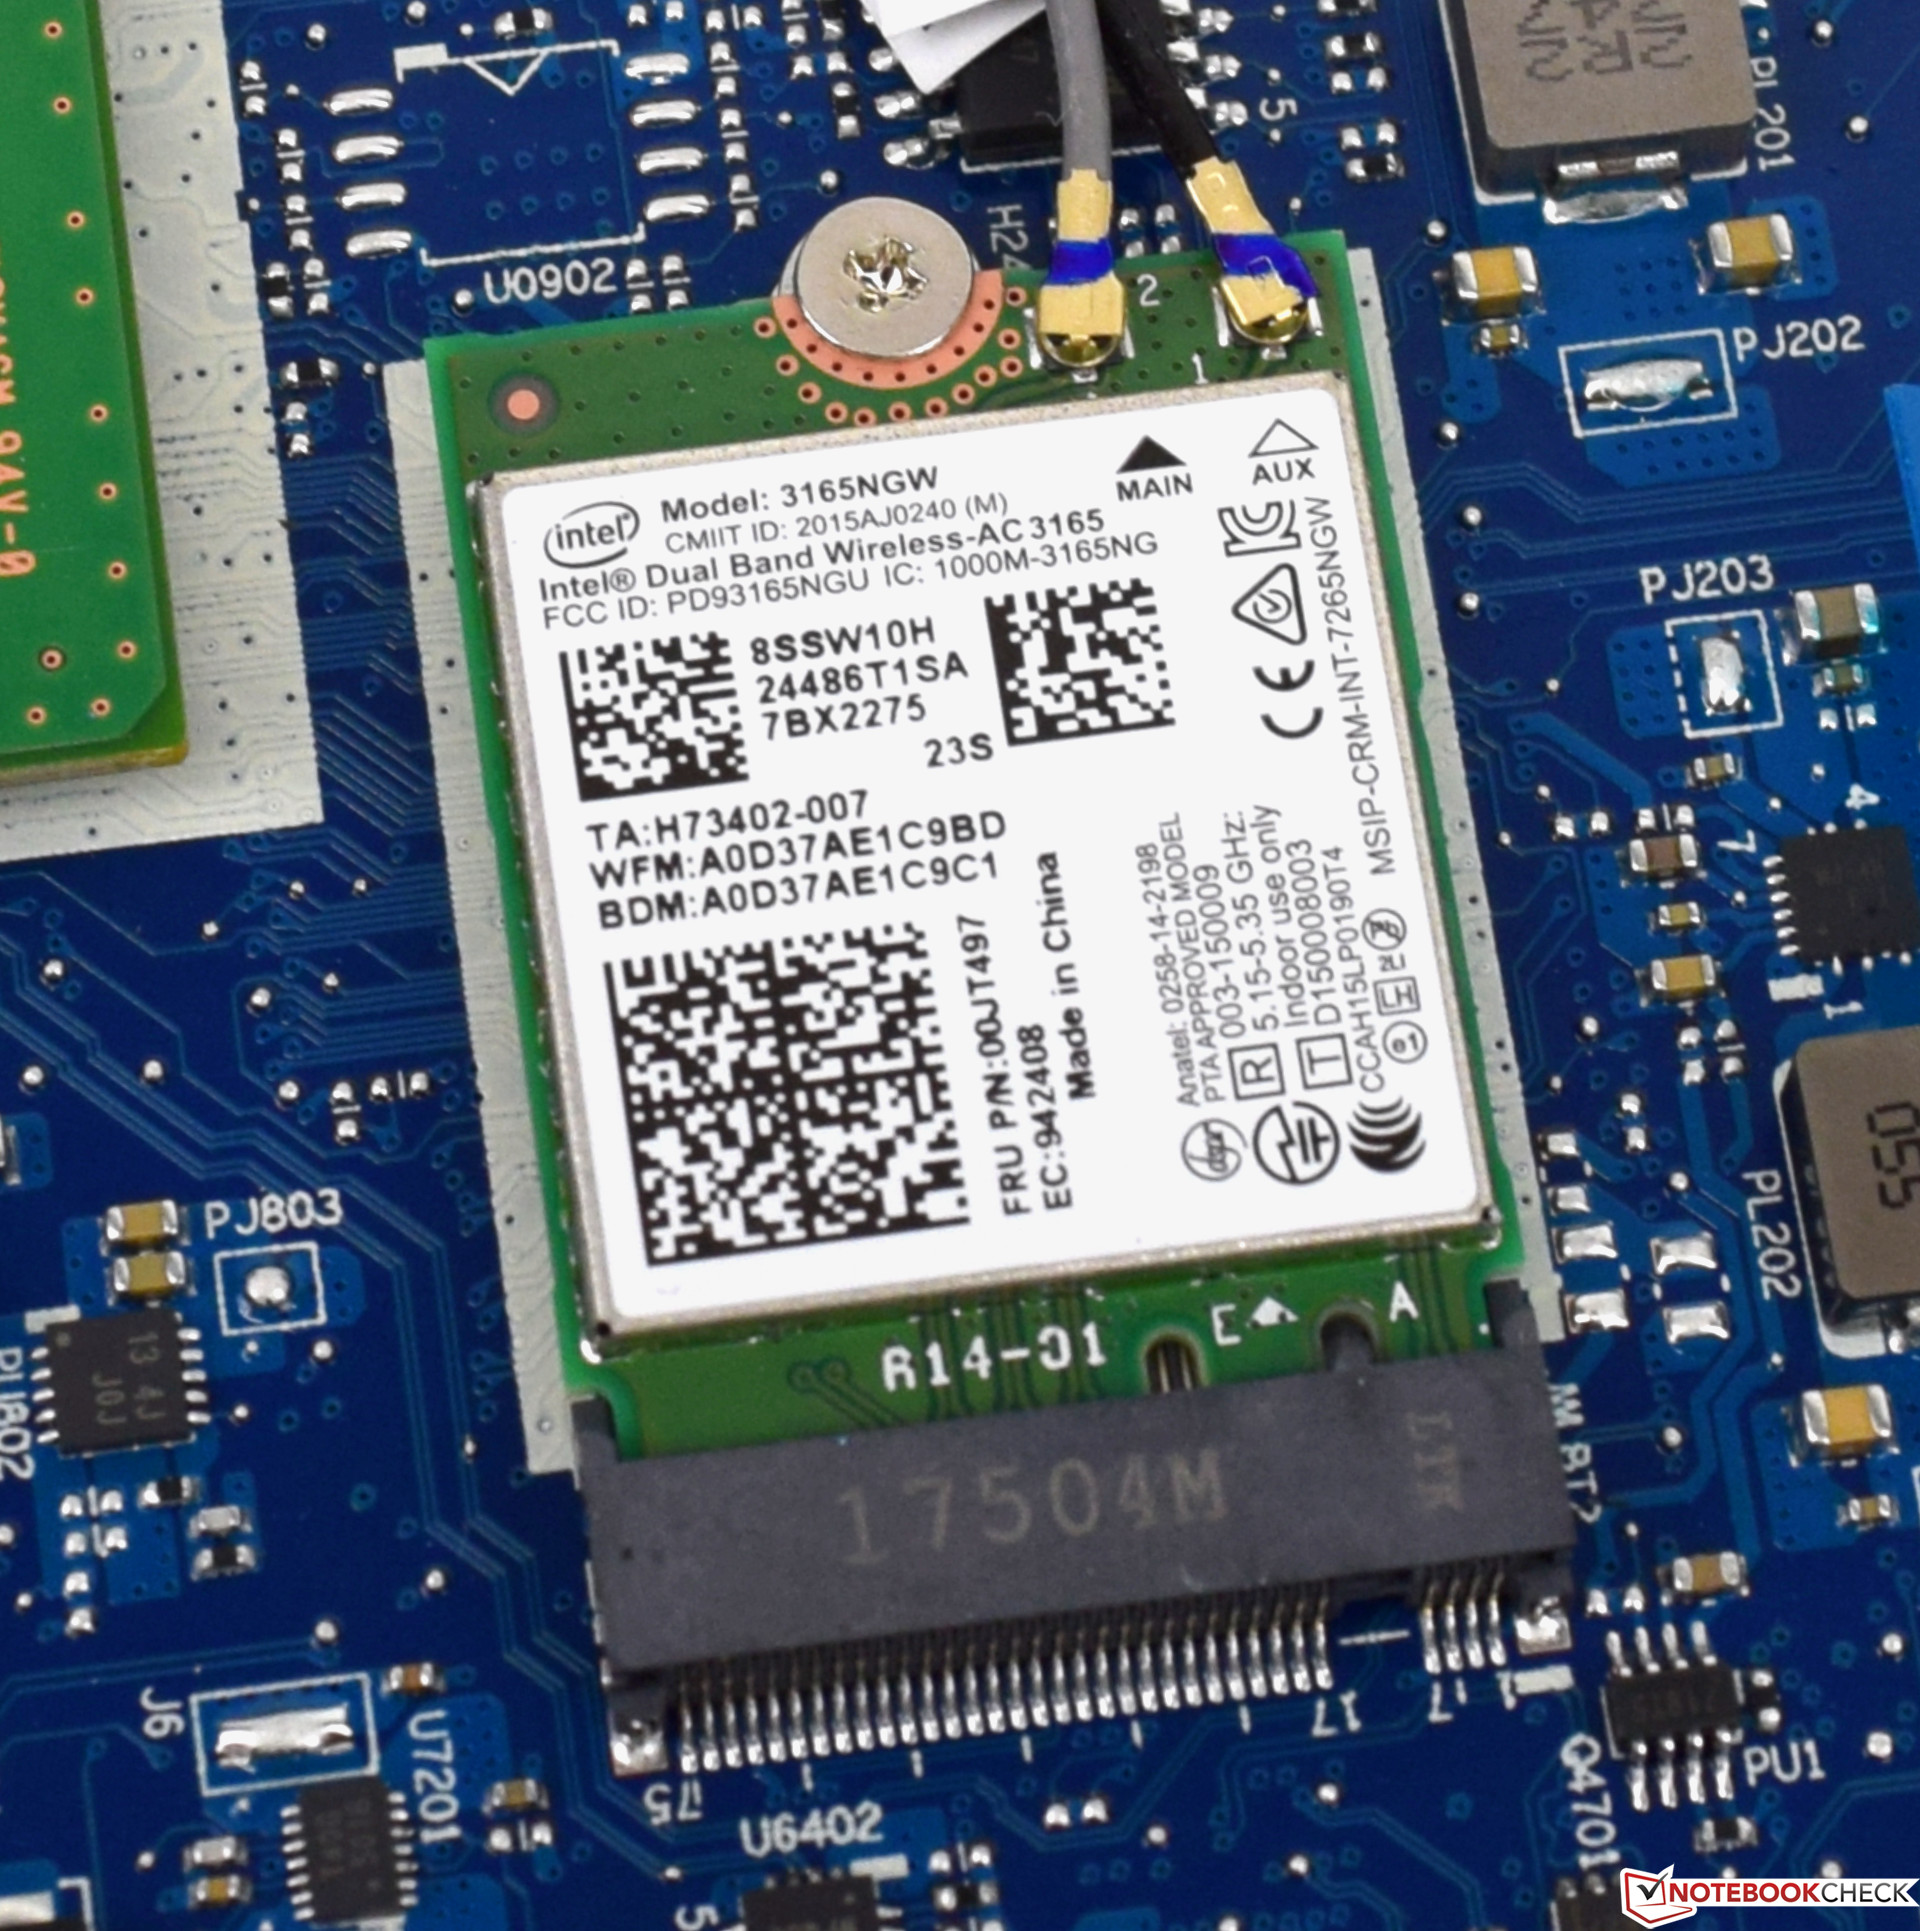
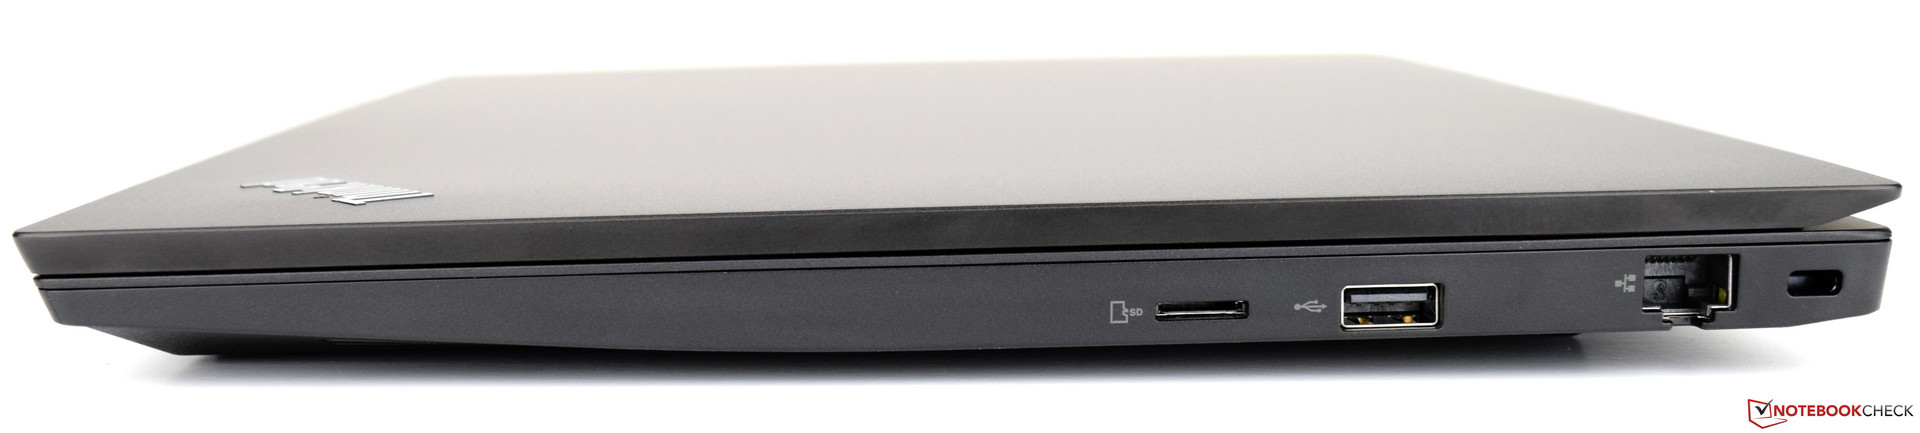
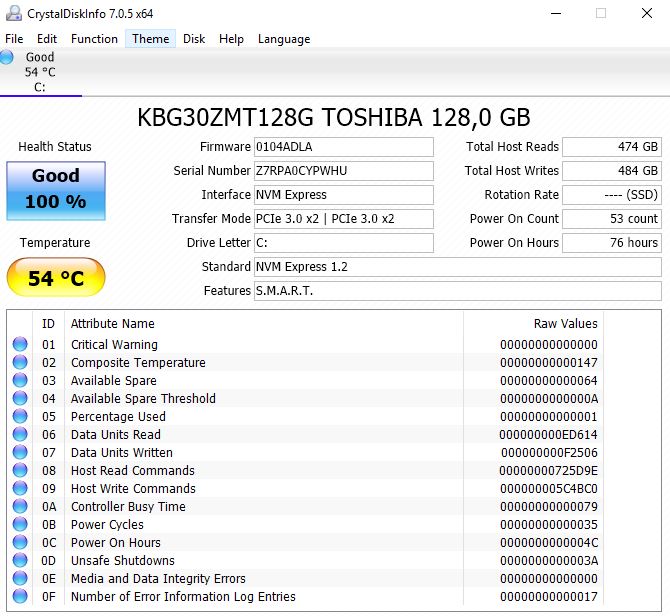
En plus de la très bonne qualité de fabrication, nous souhaitons également souligner l’évolutivité de la machine, malgré l’absence de trappe de maintenance, et la qualité reconnue des périphériques d’entrée. Et même si le SSD de 128 Go se situe dans la moyenne basse des capacités de stockage, et qu’il est un peu lent, c’est toujours mieux que d’avoir un disque dur. Nous soupçonnons des problèmes de pilotes quant à ses performances limitées. Le lecteur de carte micro SD est un autre point faible de l’appareil – une régression incompréhensible par rapport au modèle de l’an dernier.
L’intégralité de cette critique est disponible en anglais en suivant ce lien.
Lenovo ThinkPad E580-20KSCTO1WW
- 03/06/2018 v6 (old)
Sebastian Bade
Price comparison
