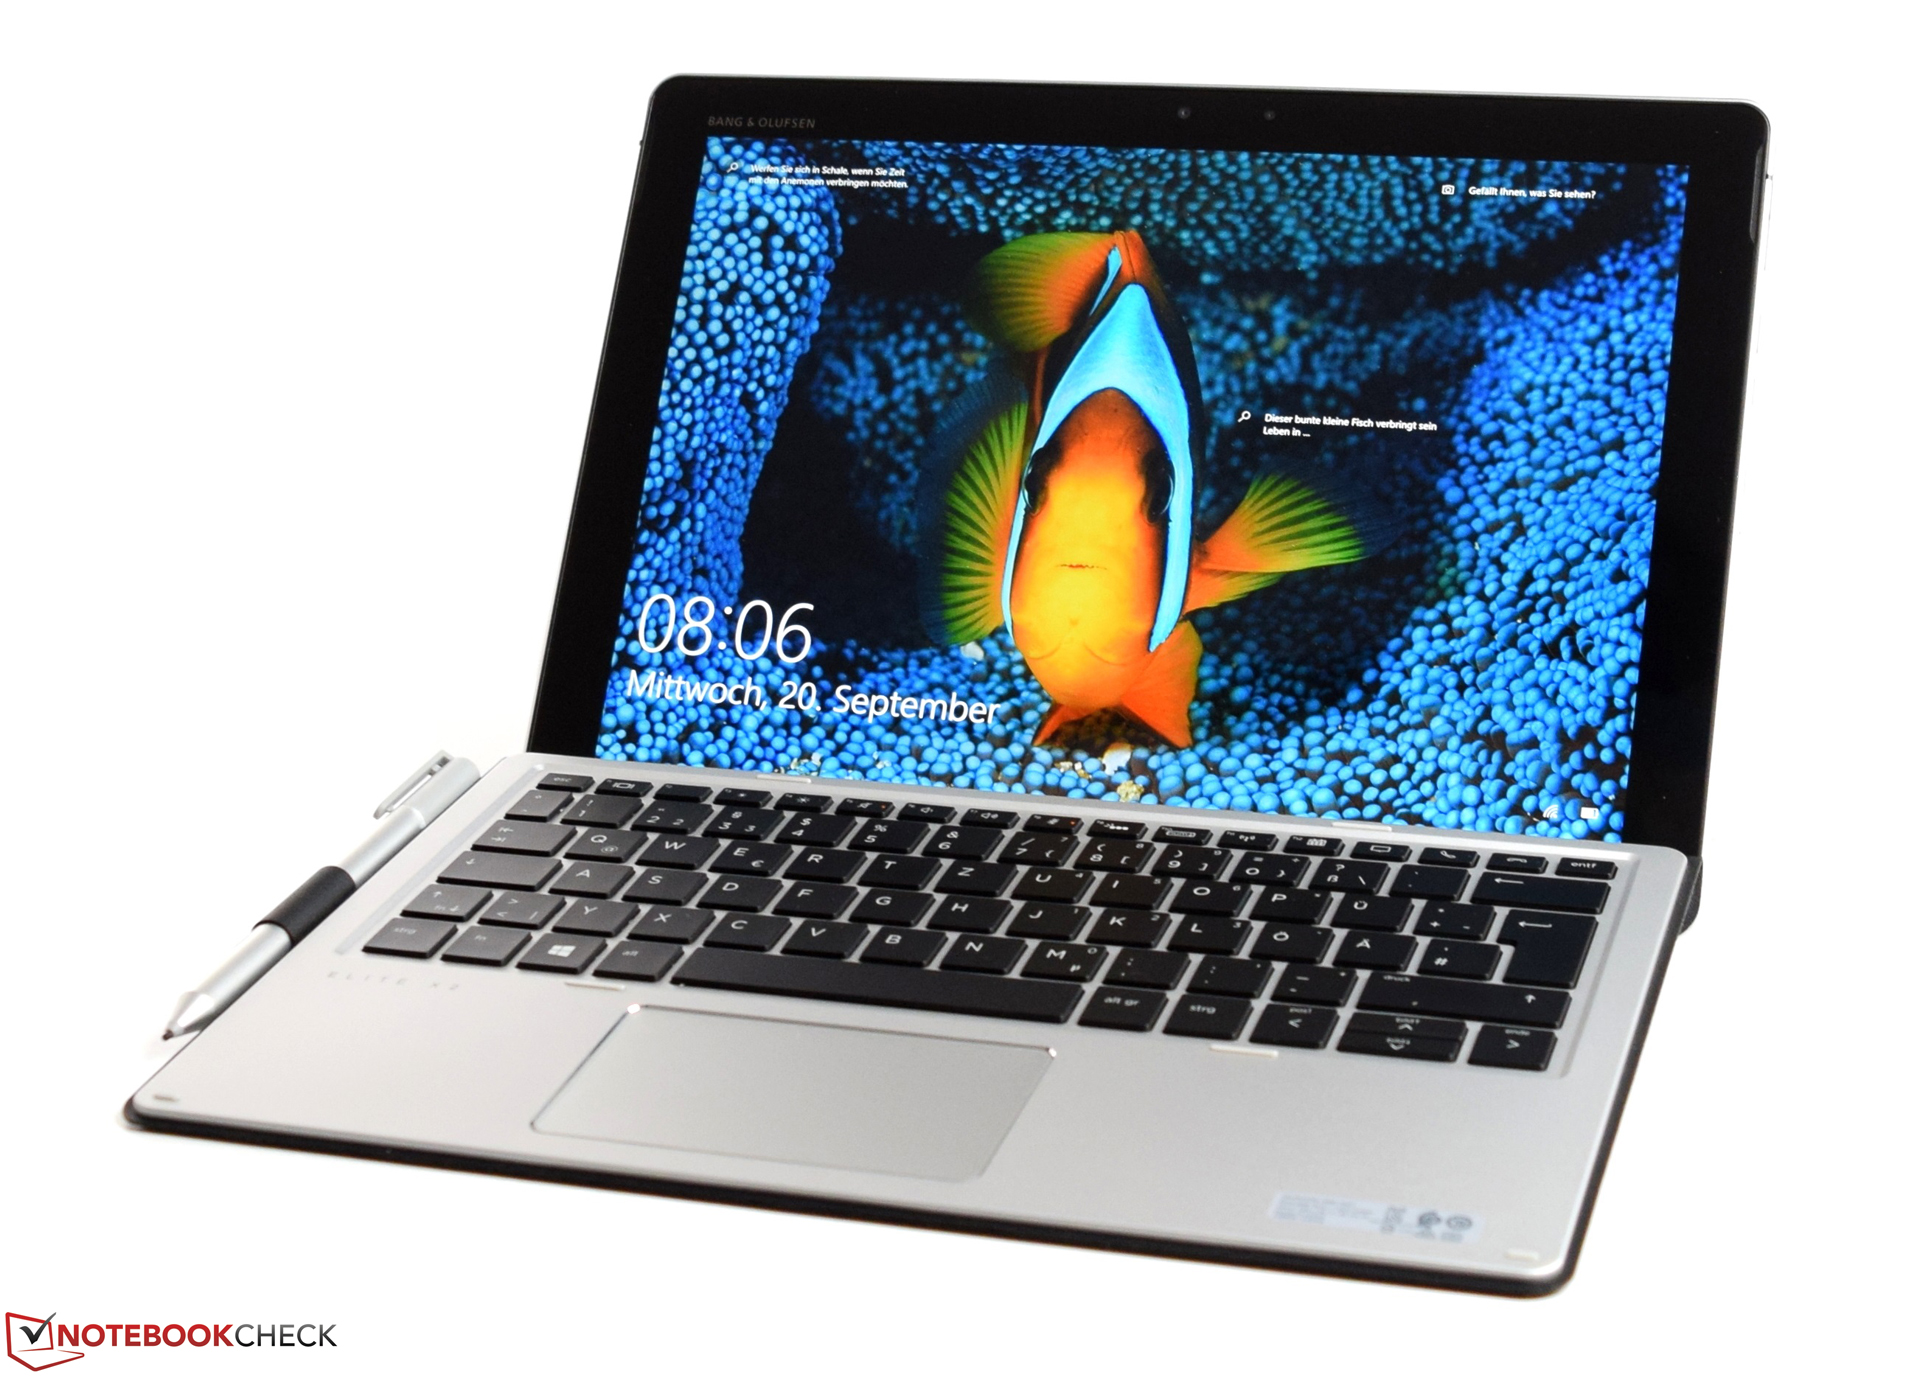
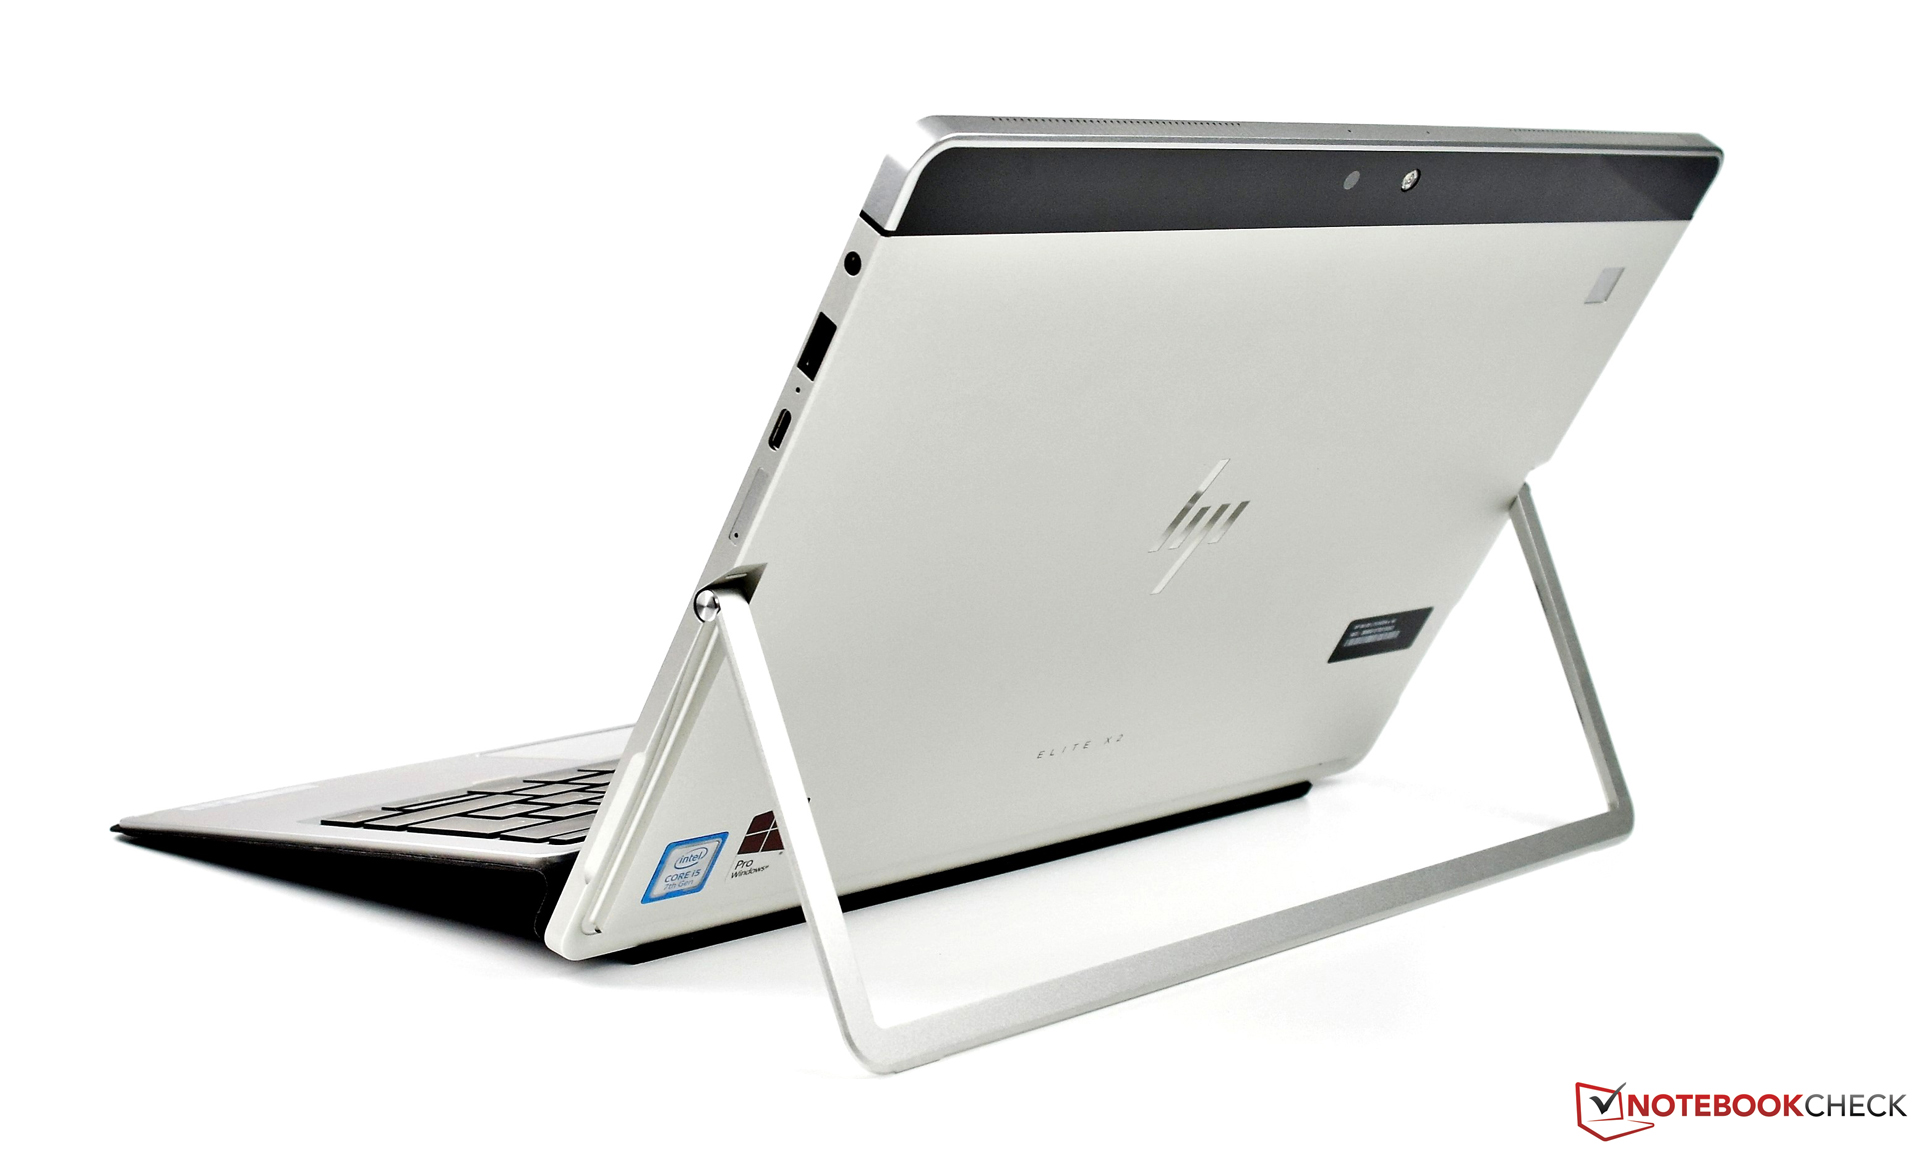
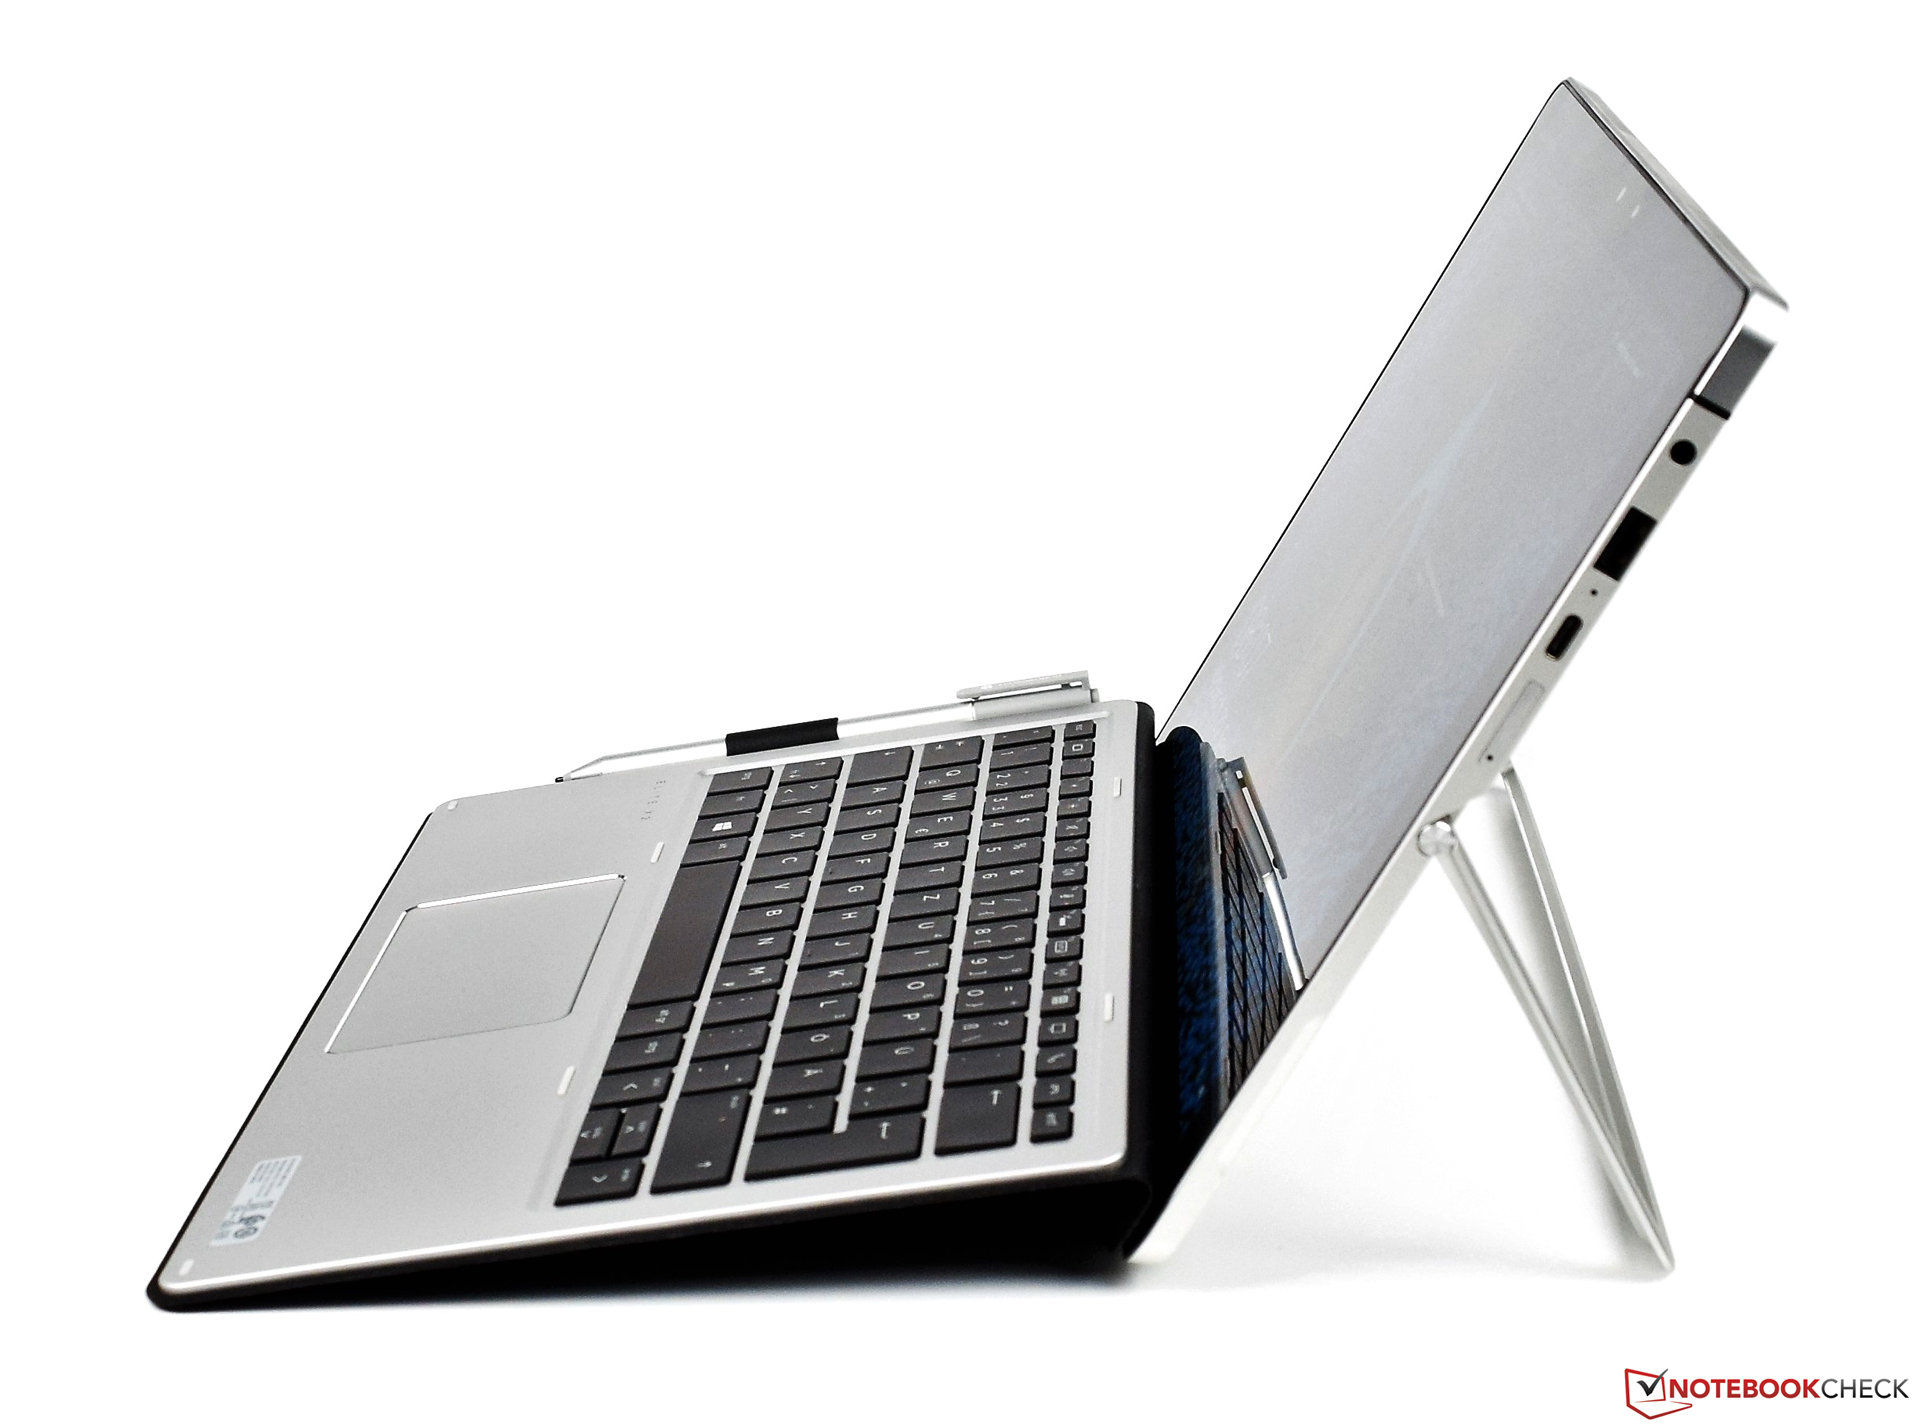
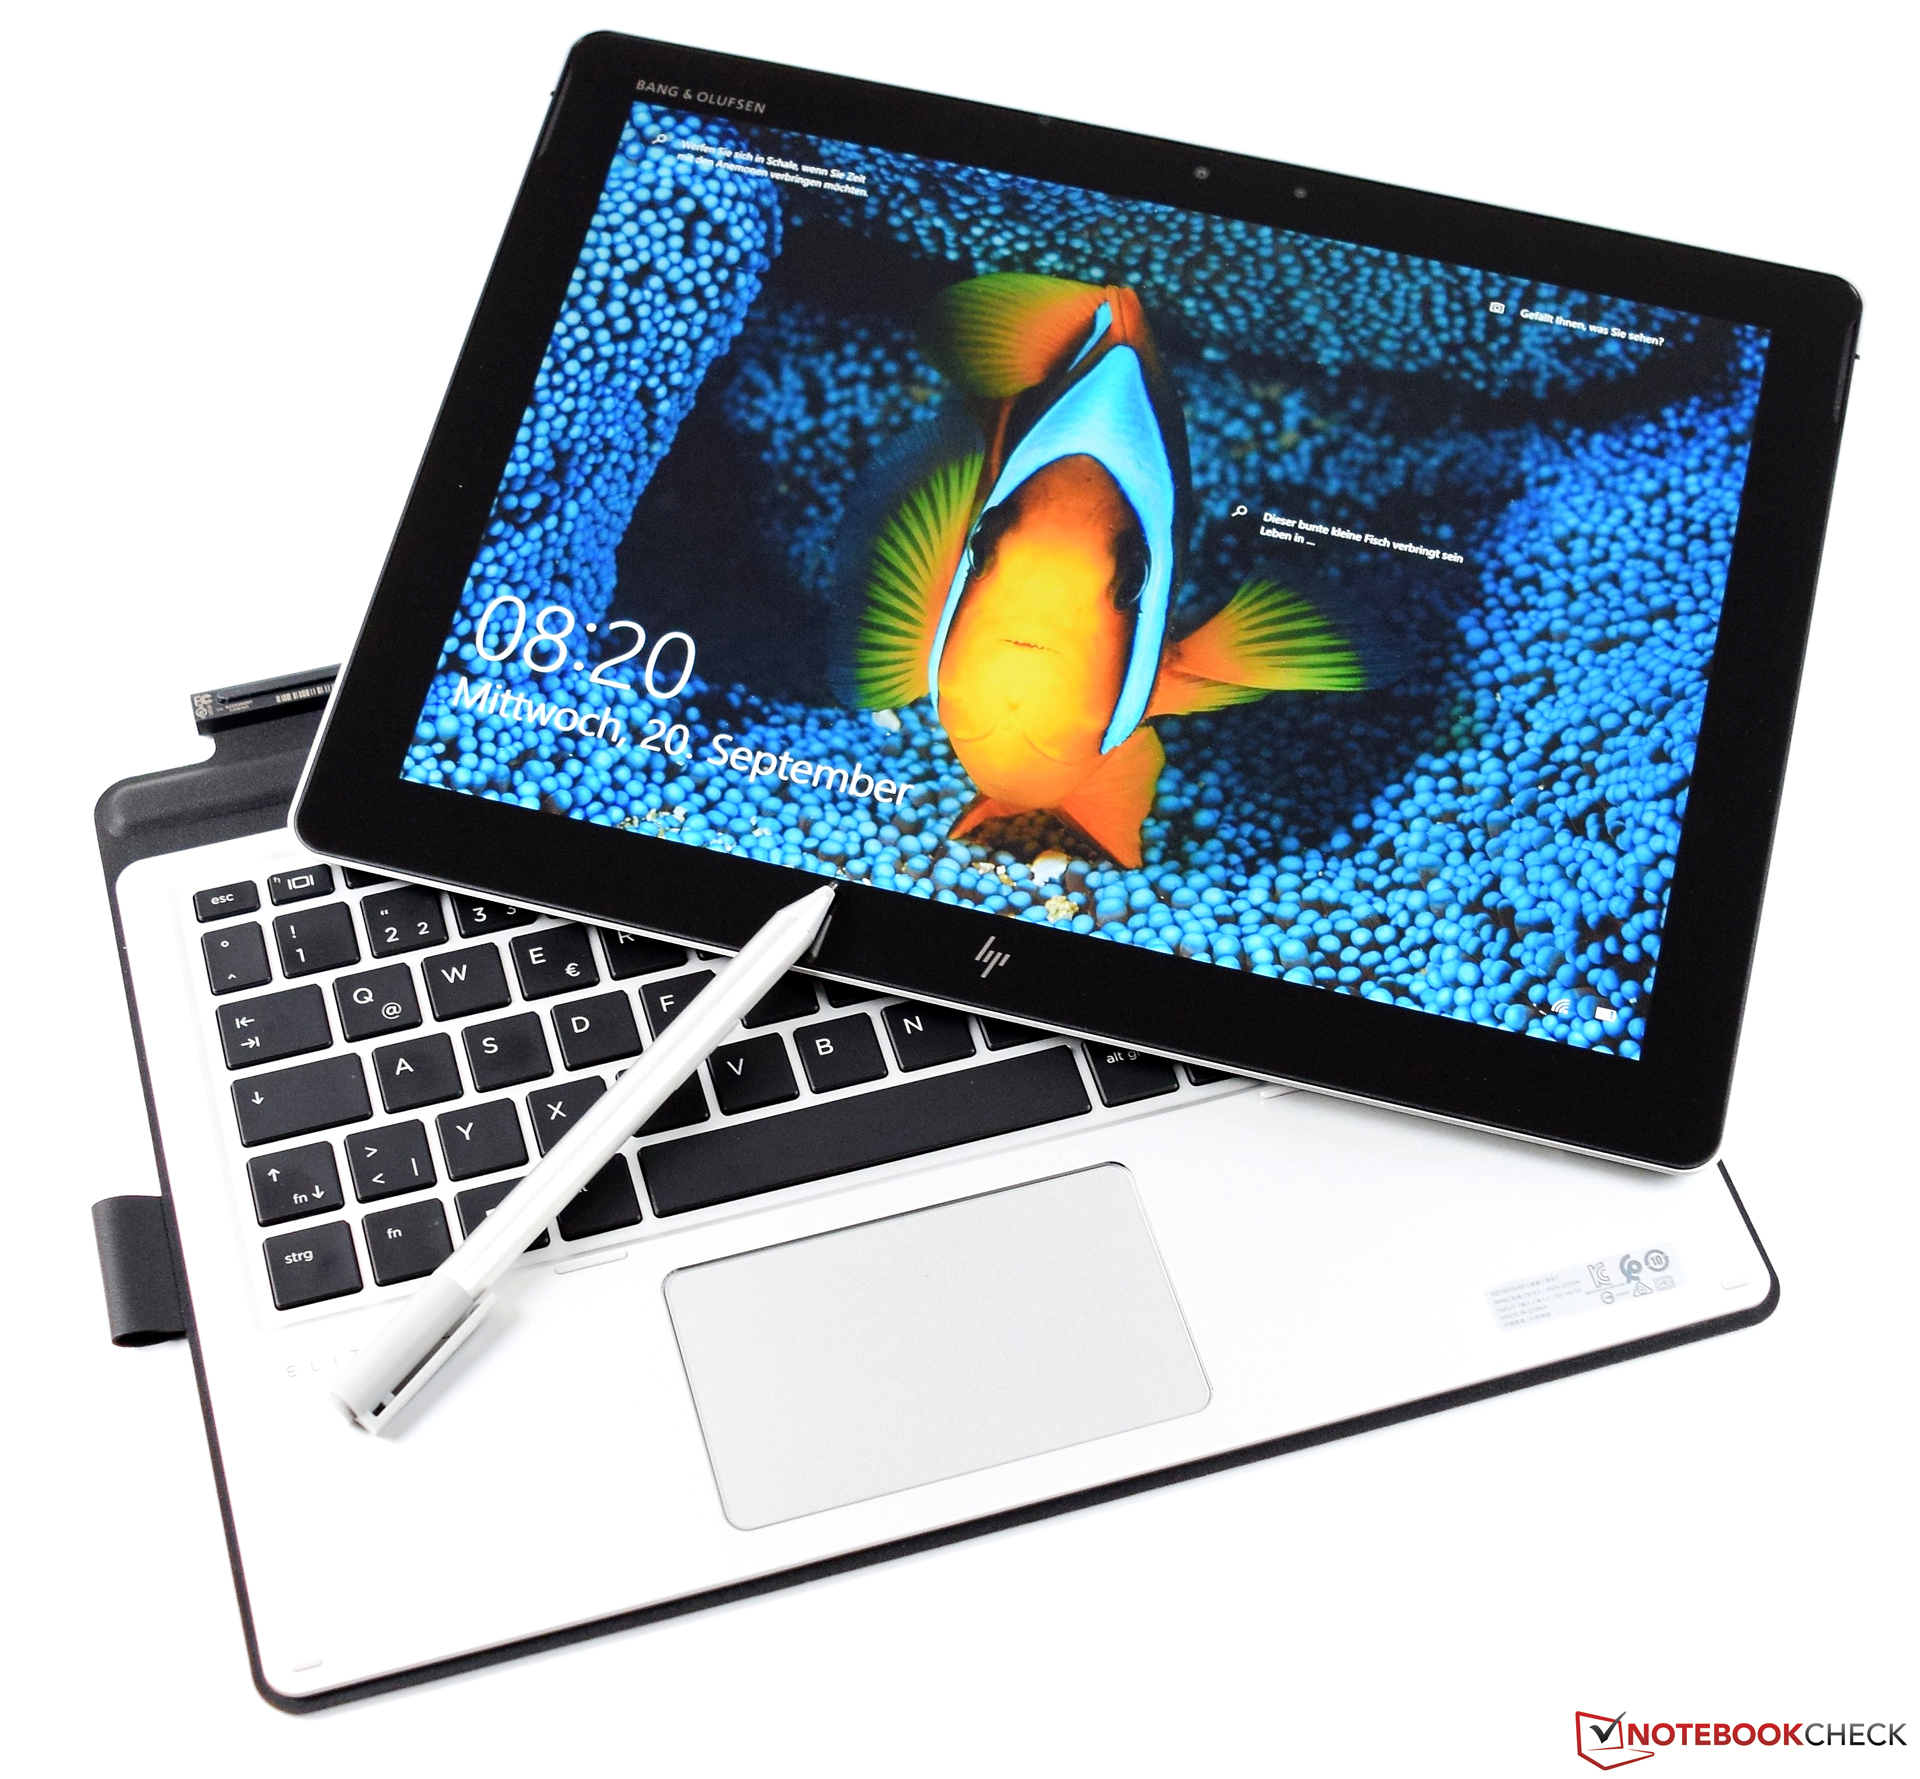
Courte critique du convertible HP Elite x2 1012 G2 (i5-7200U, 256 GB, 8 GB)


| SD Card Reader | |
| average JPG Copy Test (av. of 3 runs) | |
| HP Elite x2 1012 G2-1LV76EA (Toshiba Exceria Pro M501) | |
| Lenovo ThinkPad X1 Yoga 2017 20JES03T00 (Toshiba Exceria Pro M401) | |
| Dell Latitude 12 5285 2-in-1 (Toshiba THN-M401S0640E2) | |
| maximum AS SSD Seq Read Test (1GB) | |
| Lenovo ThinkPad X1 Yoga 2017 20JES03T00 (Toshiba Exceria Pro M401) | |
| HP Elite x2 1012 G2-1LV76EA (Toshiba Exceria Pro M501) | |
| Dell Latitude 12 5285 2-in-1 (Toshiba THN-M401S0640E2) | |
| |||||||||||||||||||||||||
Homogénéité de la luminosité: 88 %
Valeur mesurée au centre, sur batterie: 440 cd/m²
Contraste: 1080:1 (Valeurs des noirs: 0.41 cd/m²)
ΔE ColorChecker Calman: 2.6 | ∀{0.5-29.43 Ø4.72}
ΔE Greyscale Calman: 3 | ∀{0.09-98 Ø4.97}
98% sRGB (Argyll 1.6.3 3D)
62.6% AdobeRGB 1998 (Argyll 1.6.3 3D)
68.7% AdobeRGB 1998 (Argyll 3D)
98% sRGB (Argyll 3D)
66.7% Display P3 (Argyll 3D)
Gamma: 2.38
CCT: 6780 K
| HP Elite x2 1012 G2-1LV76EA Samsung SDC4A49, , 2716x1824, 12.3" | Microsoft Surface Pro (2017) i5 LG Display LP123WQ112604, , 2736x1824, 12.3" | Lenovo ThinkPad X1 Yoga 2017 20JES03T00 LEN4140, , 2560x1440, 14" | Dell Latitude 12 5285 2-in-1 BOE06DC, , 1920x1280, 12.3" | Acer Switch 5 SW512-52-5819 WST KL.1200w.004, , 2160x1440, 12" | Toshiba Portege X20W-D-10R Toshiba TOS508F, , 1920x1080, 12.5" | HP Elite x2 1012 G1 LG Philips, , 1920x1280, 12.1" | |
|---|---|---|---|---|---|---|---|
| Display | 1% | -5% | -12% | 1% | -22% | ||
| Display P3 Coverage (%) | 66.7 | 67.6 1% | 62.8 -6% | 58.8 -12% | 68.7 3% | 53.8 -19% | |
| sRGB Coverage (%) | 98 | 99 1% | 94 -4% | 87.5 -11% | 96.8 -1% | 73.7 -25% | |
| AdobeRGB 1998 Coverage (%) | 68.7 | 69.1 1% | 64.7 -6% | 60.6 -12% | 70.4 2% | 53.8 -22% | |
| Response Times | -13% | 89% | -18% | -1% | -64% | 11% | |
| Response Time Grey 50% / Grey 80% * (ms) | 45.6 ? | 42 ? 8% | 3.6 ? 92% | 42.4 ? 7% | 37 ? 19% | 67 ? -47% | 33.2 ? 27% |
| Response Time Black / White * (ms) | 21.6 ? | 29 ? -34% | 3.2 ? 85% | 30.8 ? -43% | 26 ? -20% | 39 ? -81% | 22.8 ? -6% |
| PWM Frequency (Hz) | 2119 ? | 21000 | 240.4 ? | 210.1 ? | |||
| Screen | -3% | -37% | -20% | -49% | -34% | -52% | |
| Brightness middle (cd/m²) | 443 | 417 -6% | 243 -45% | 523.2 18% | 369 -17% | 442 0% | 322 -27% |
| Brightness (cd/m²) | 446 | 401 -10% | 240 -46% | 522 17% | 331 -26% | 410 -8% | 319 -28% |
| Brightness Distribution (%) | 88 | 88 0% | 95 8% | 88 0% | 75 -15% | 86 -2% | 97 10% |
| Black Level * (cd/m²) | 0.41 | 0.29 29% | 0.42 -2% | 0.46 -12% | 0.22 46% | 0.42 -2% | |
| Contrast (:1) | 1080 | 1438 33% | 1246 15% | 802 -26% | 2009 86% | 767 -29% | |
| Colorchecker dE 2000 * | 2.6 | 3.63 -40% | 5.3 -104% | 4 -54% | 5.52 -112% | 5.22 -101% | 6.02 -132% |
| Colorchecker dE 2000 max. * | 4 | 6.74 -69% | 8.9 -123% | 8.6 -115% | 9.29 -132% | 11.84 -196% | 10.06 -152% |
| Greyscale dE 2000 * | 3 | 2.18 27% | 3.7 -23% | 5.5 -83% | 6.95 -132% | 7.88 -163% | 6.29 -110% |
| Gamma | 2.38 92% | 3.09 71% | 1.78 124% | 2.16 102% | 2.58 85% | 2.51 88% | 2.4 92% |
| CCT | 6780 96% | 6767 96% | 6202 105% | 7546 86% | 7009 93% | 6756 96% | 7712 84% |
| Color Space (Percent of AdobeRGB 1998) (%) | 62.6 | 63 1% | 84.8 35% | 64.86 4% | 56 -11% | 64 2% | 47.8 -24% |
| Color Space (Percent of sRGB) (%) | 98 | 99 1% | 100 2% | 93.97 -4% | 88 -10% | 97 -1% | 73.2 -25% |
| Moyenne finale (programmes/paramètres) | -5% /
-4% | 26% /
-12% | -14% /
-17% | -21% /
-35% | -32% /
-31% | -21% /
-38% |
* ... Moindre est la valeur, meilleures sont les performances
Temps de réponse de l'écran
| ↔ Temps de réponse noir à blanc | ||
|---|---|---|
| 21.6 ms ... hausse ↗ et chute ↘ combinées | ↗ 9.2 ms hausse | 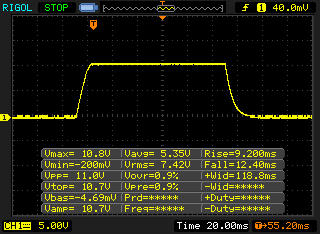 |
| ↘ 12.4 ms chute | ||
| L'écran montre de bons temps de réponse, mais insuffisant pour du jeu compétitif. En comparaison, tous les appareils testés affichent entre 0.1 (minimum) et 240 (maximum) ms. » 48 % des appareils testés affichent de meilleures performances. Cela signifie que les latences relevées sont similaires à la moyenne (19.8 ms) de tous les appareils testés. | ||
| ↔ Temps de réponse gris 50% à gris 80% | ||
| 45.6 ms ... hausse ↗ et chute ↘ combinées | ↗ 23.6 ms hausse | 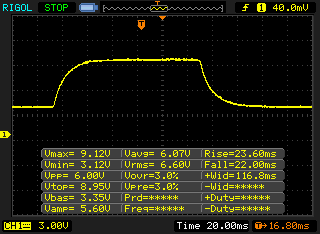 |
| ↘ 22 ms chute | ||
| L'écran souffre de latences très élevées, à éviter pour le jeu. En comparaison, tous les appareils testés affichent entre 0.165 (minimum) et 636 (maximum) ms. » 78 % des appareils testés affichent de meilleures performances. Cela signifie que les latences relevées sont moins bonnes que la moyenne (31 ms) de tous les appareils testés. | ||
Scintillement / MLI (Modulation de largeur d'impulsion)
| Scintillement / MLI (Modulation de largeur d'impulsion) décelé | 2119 Hz | ≤ 50 Niveau de luminosité | 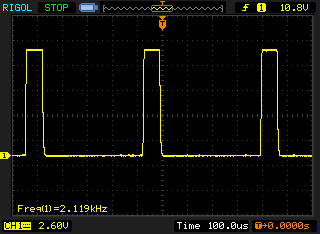 |
Le rétroéclairage de l'écran scintille à la fréquence de 2119 Hz (certainement du fait de l'utilisation d'une MDI - Modulation de largeur d'impulsion) à un niveau de luminosité inférieur ou égal à 50 % . Aucun scintillement ne devrait être perceptible au-dessus de cette valeur. La fréquence de rafraîchissement de 2119 Hz est élevée, la grande majorité des utilisateurs ne devrait pas percevoir de scintillements et être sujette à une fatigue oculaire accrue. En comparaison, 52 % des appareils testés n'emploient pas MDI pour assombrir leur écran. Nous avons relevé une moyenne à 7769 (minimum : 5 - maximum : 343500) Hz dans le cas où une MDI était active. | |||
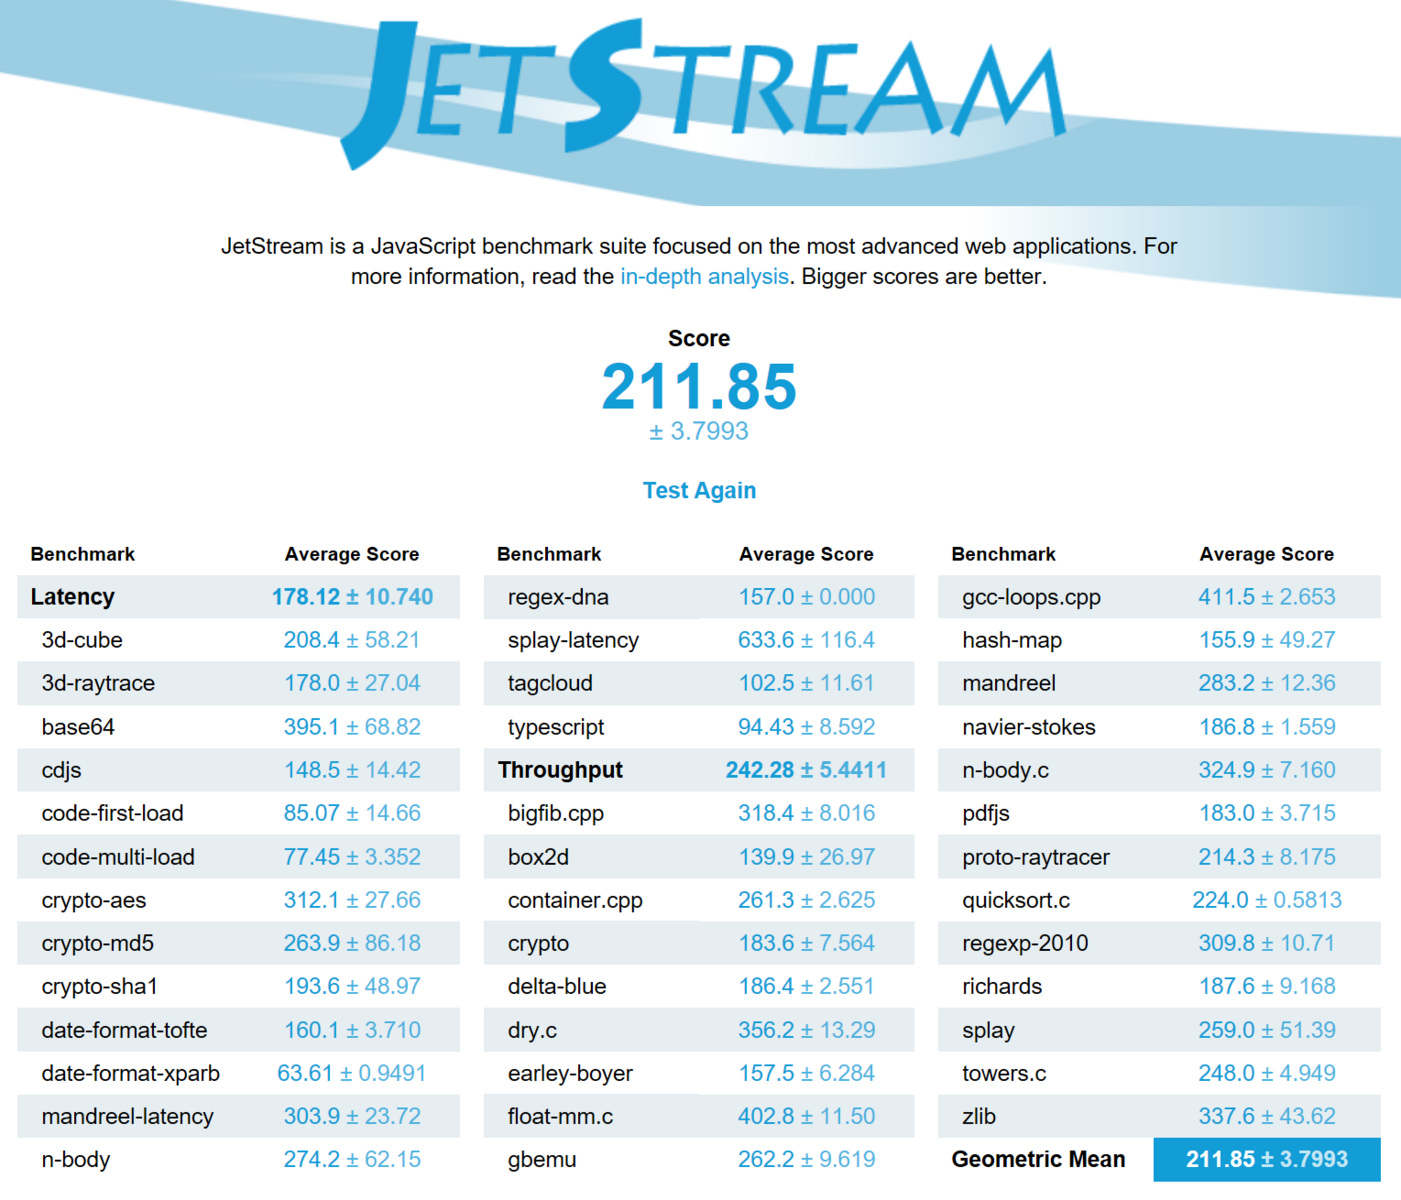
| JetStream 1.1 - 1.1 Total | |
| Lenovo ThinkPad X1 Yoga 2017 20JES03T00 | |
| Toshiba Portege X20W-D-10R | |
| Acer Switch 5 SW512-52-5819 | |
| Microsoft Surface Pro (2017) i5 | |
| HP Elite x2 1012 G2-1LV76EA | |
| HP Elite x2 1012 G1 | |
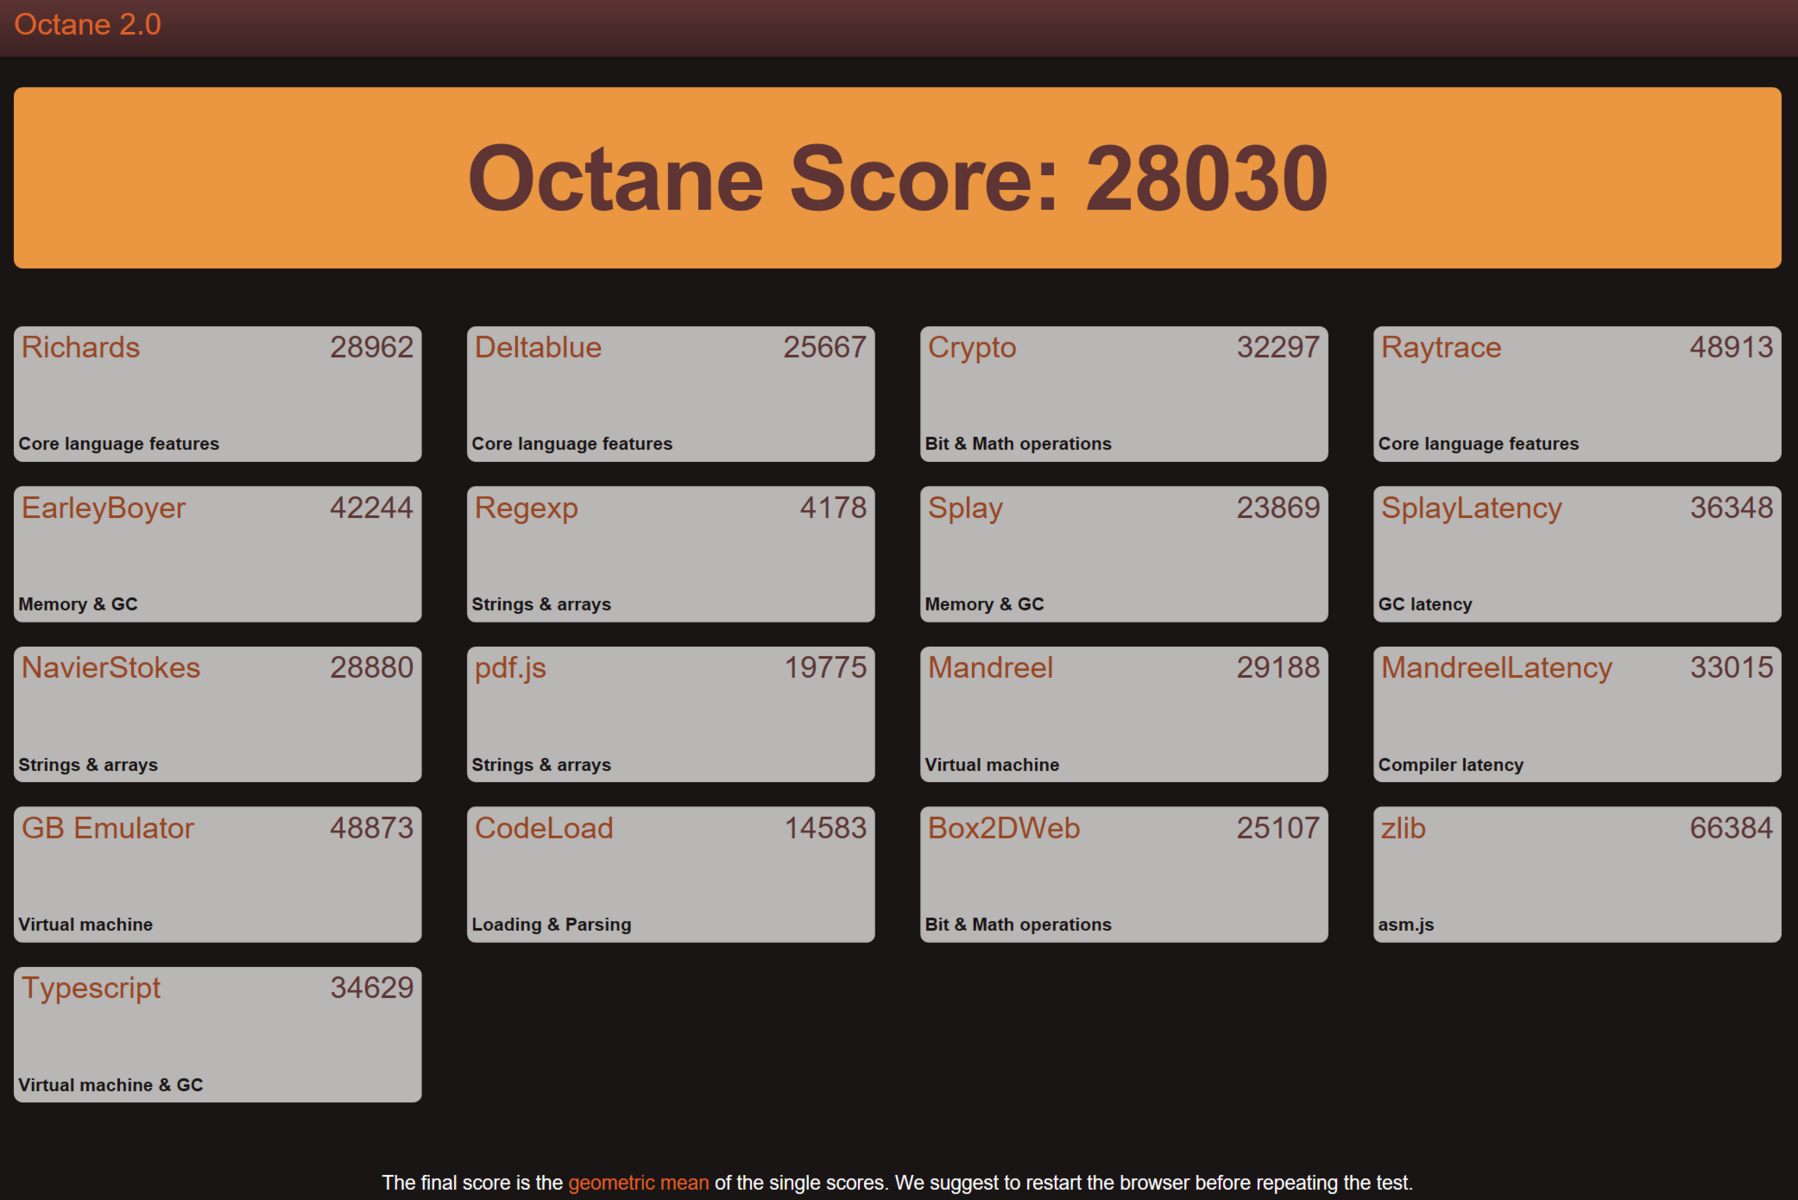
| Octane V2 - Total Score | |
| Toshiba Portege X20W-D-10R | |
| Microsoft Surface Pro (2017) i5 | |
| Acer Switch 5 SW512-52-5819 | |
| Lenovo ThinkPad X1 Yoga 2017 20JES03T00 | |
| HP Elite x2 1012 G2-1LV76EA | |
| HP Elite x2 1012 G1 | |
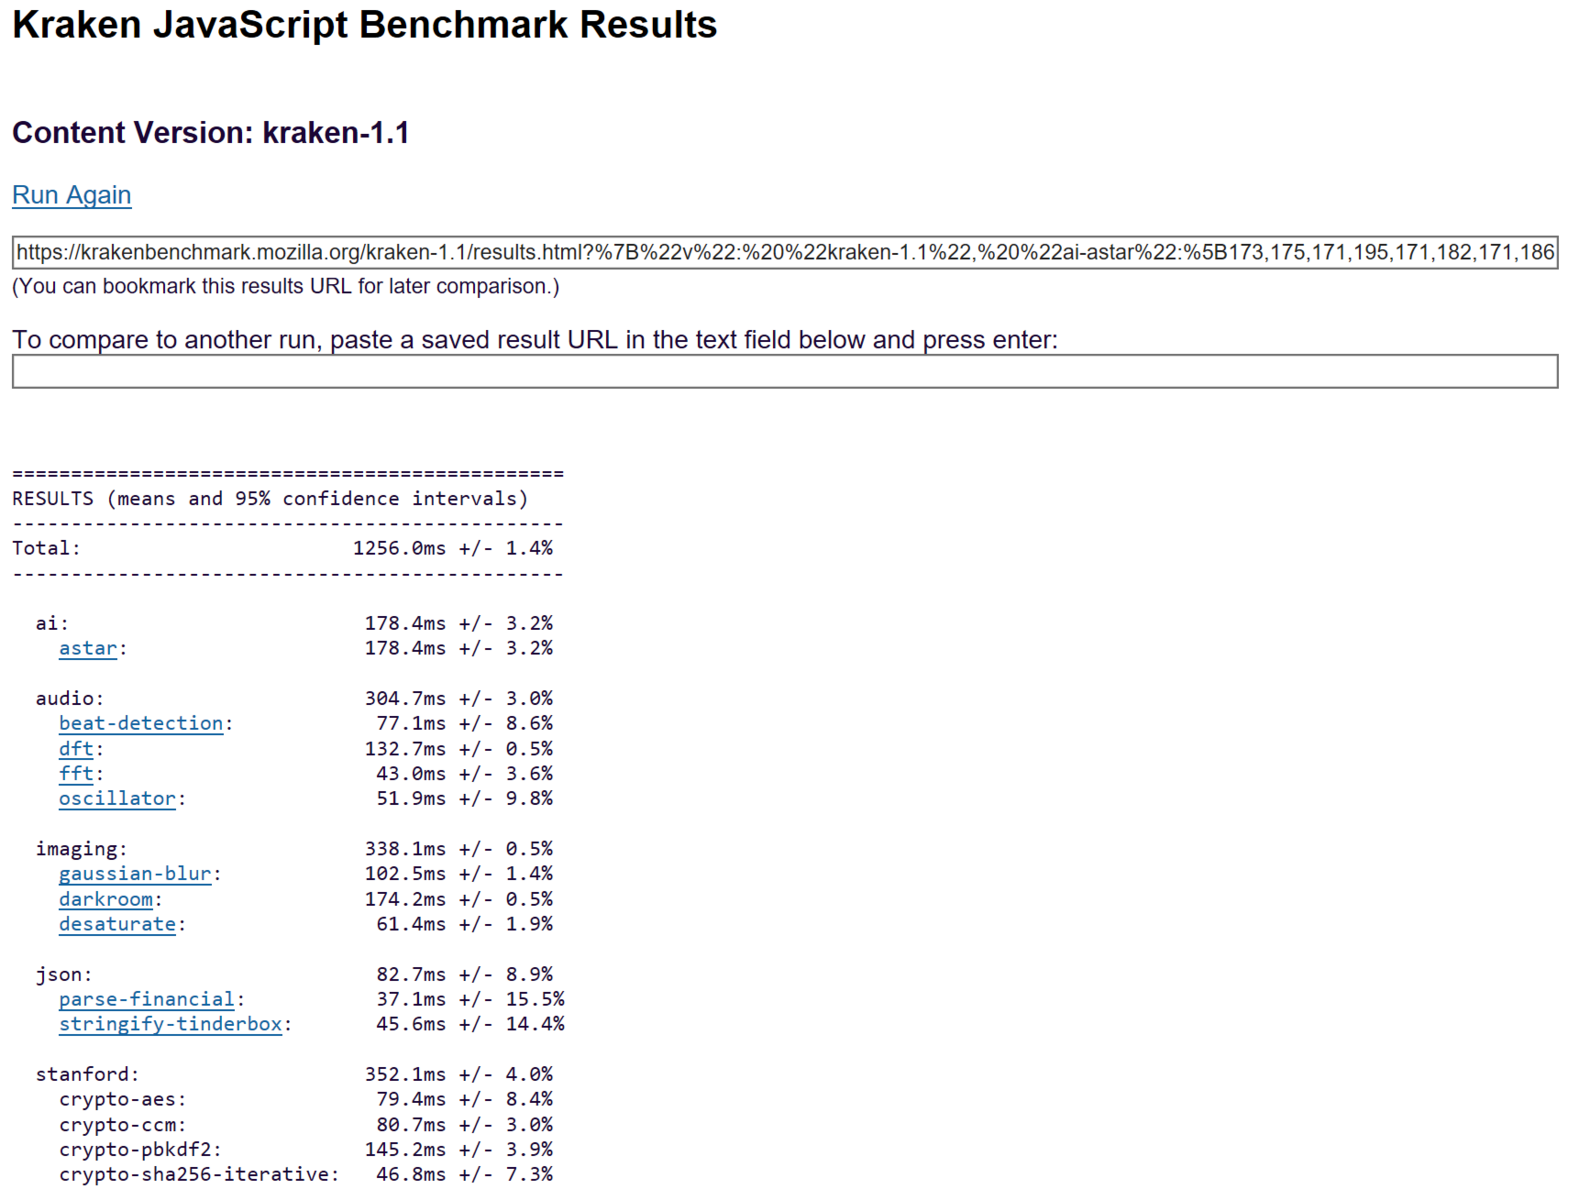
| Mozilla Kraken 1.1 - Total | |
| HP Elite x2 1012 G1 | |
| HP Elite x2 1012 G2-1LV76EA | |
| Acer Switch 5 SW512-52-5819 | |
| Toshiba Portege X20W-D-10R | |
| Lenovo ThinkPad X1 Yoga 2017 20JES03T00 | |
* ... Moindre est la valeur, meilleures sont les performances
| PCMark 10 | |
| Score | |
| Acer Switch 5 SW512-52-5819 | |
| HP Elite x2 1012 G2-1LV76EA | |
| Microsoft Surface Pro (2017) i5 | |
| Productivity | |
| Acer Switch 5 SW512-52-5819 | |
| HP Elite x2 1012 G2-1LV76EA | |
| Microsoft Surface Pro (2017) i5 | |
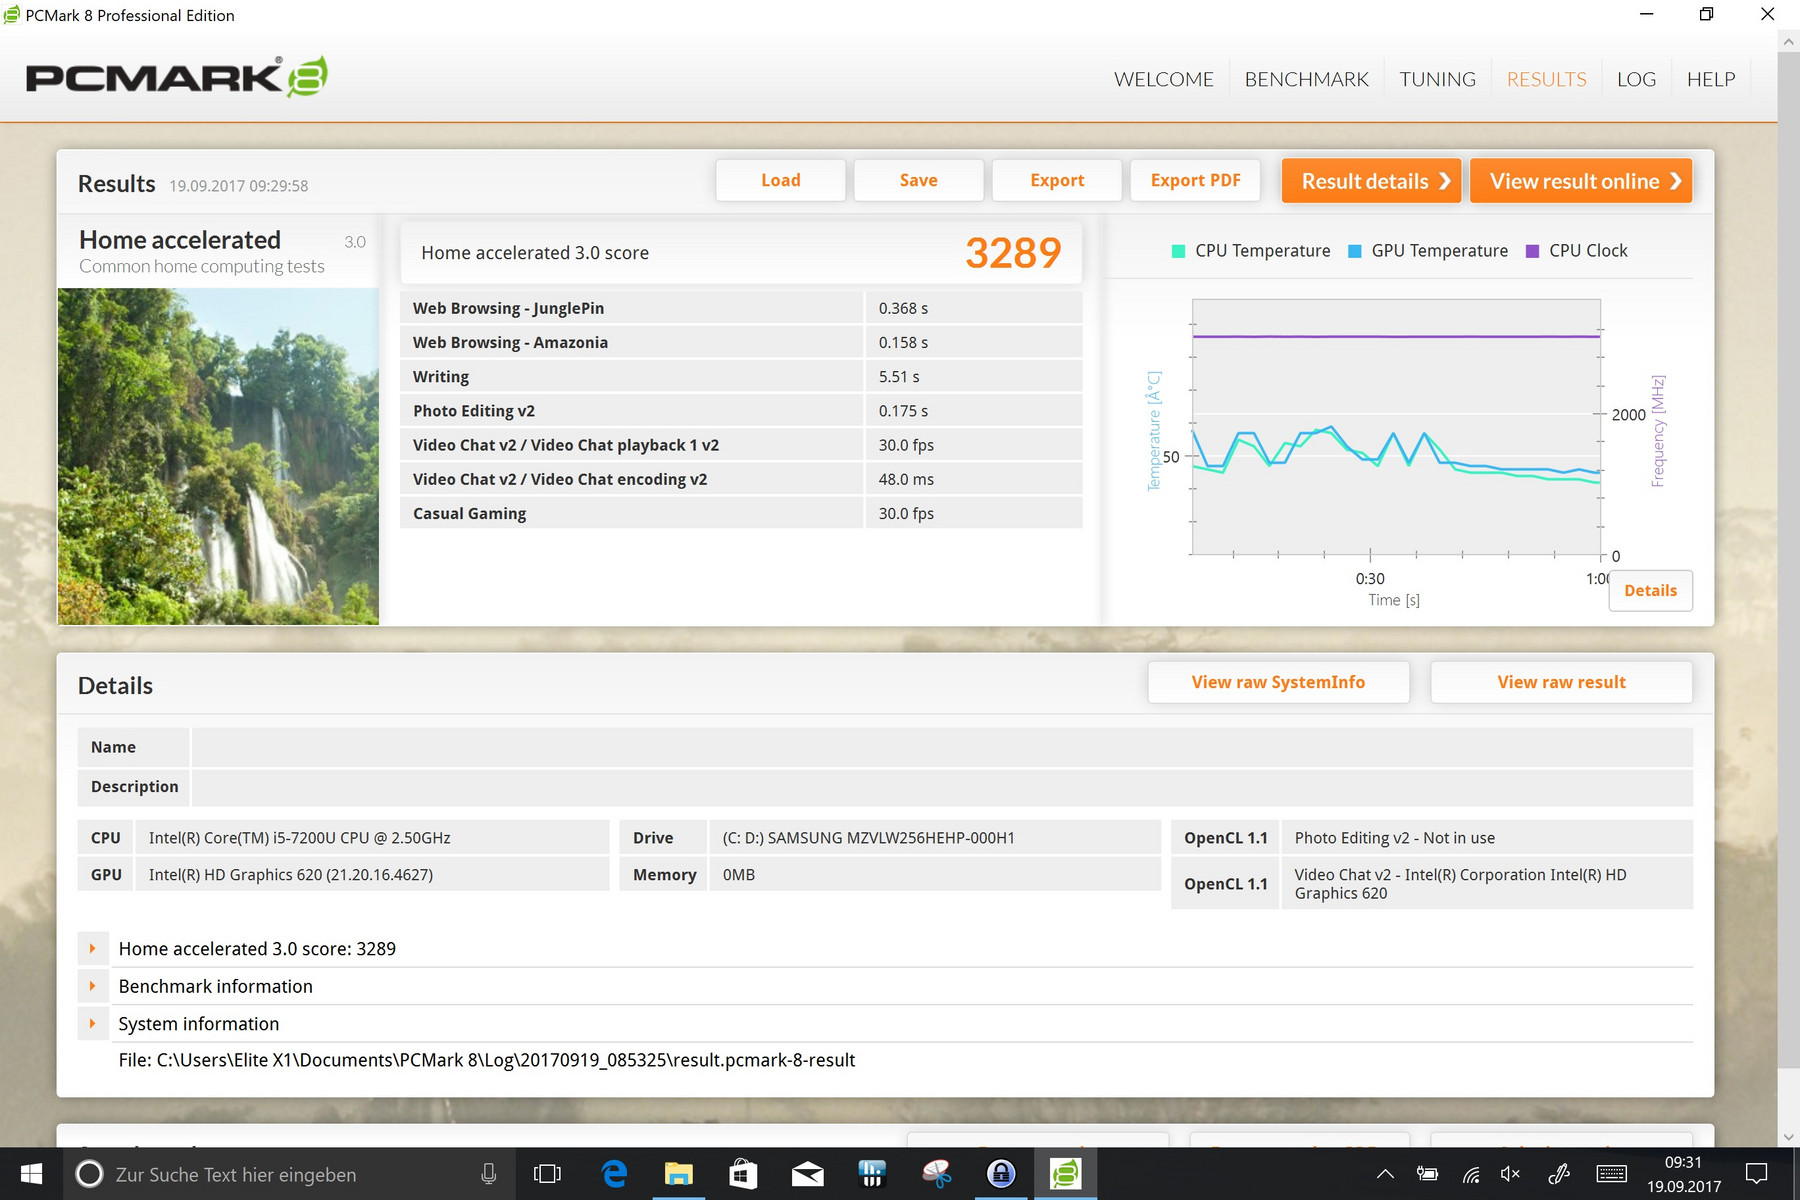
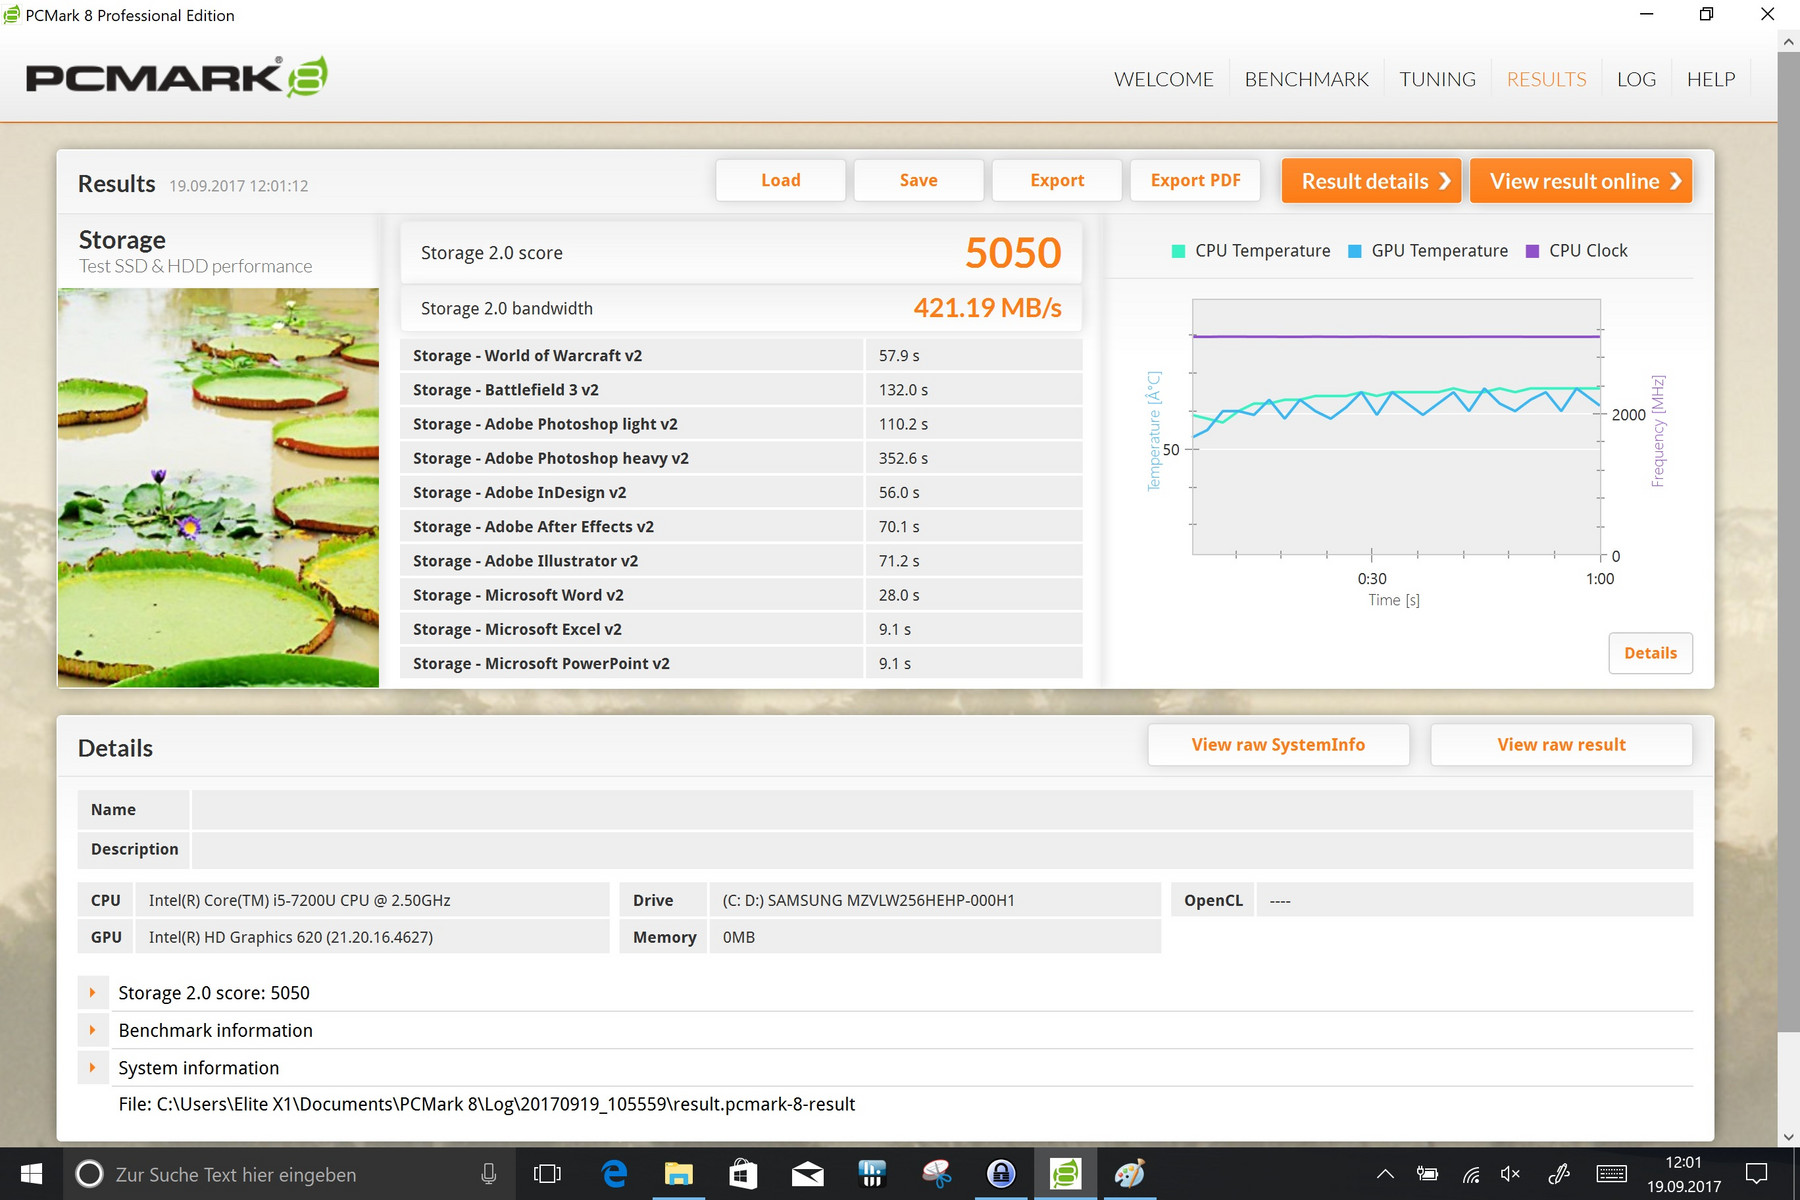
| PCMark 8 Home Score Accelerated v2 | 3289 points | |
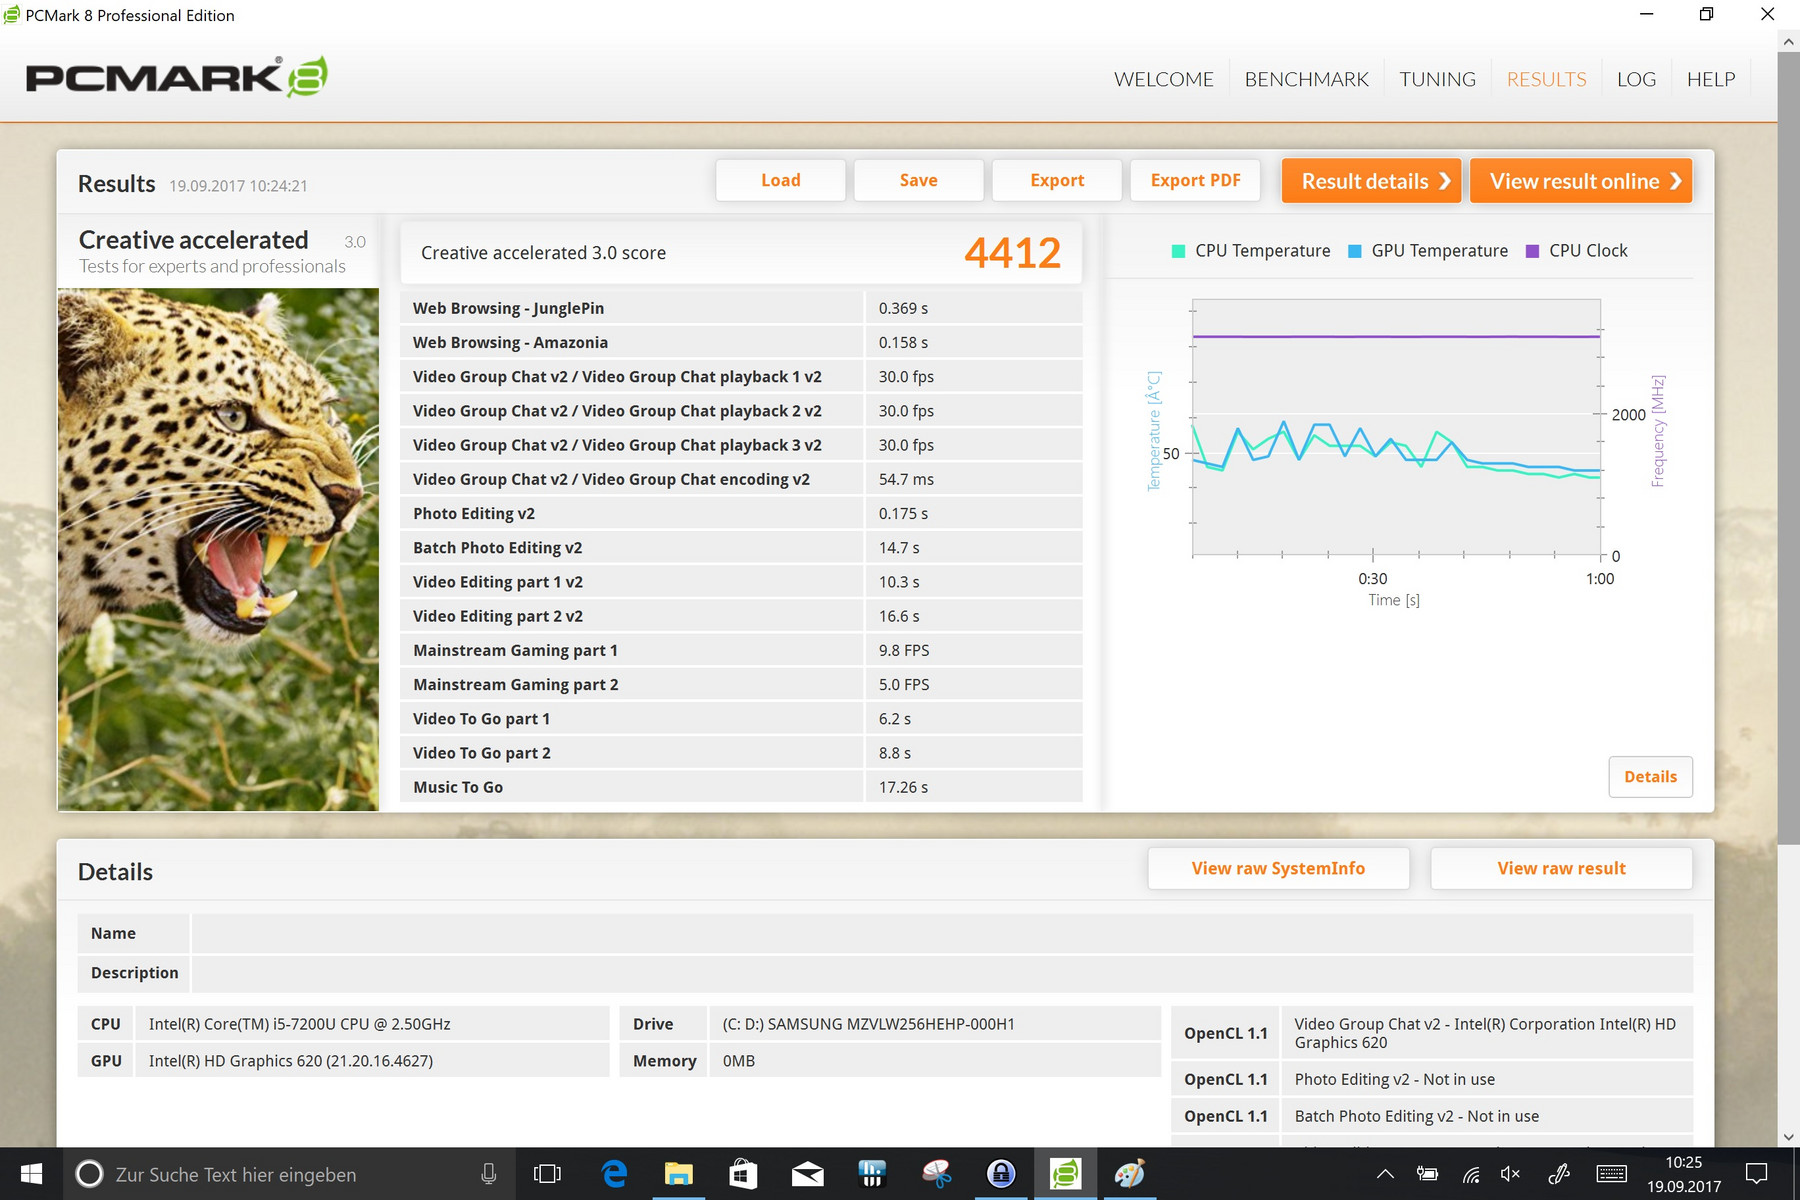
| PCMark 8 Creative Score Accelerated v2 | 4412 points | |
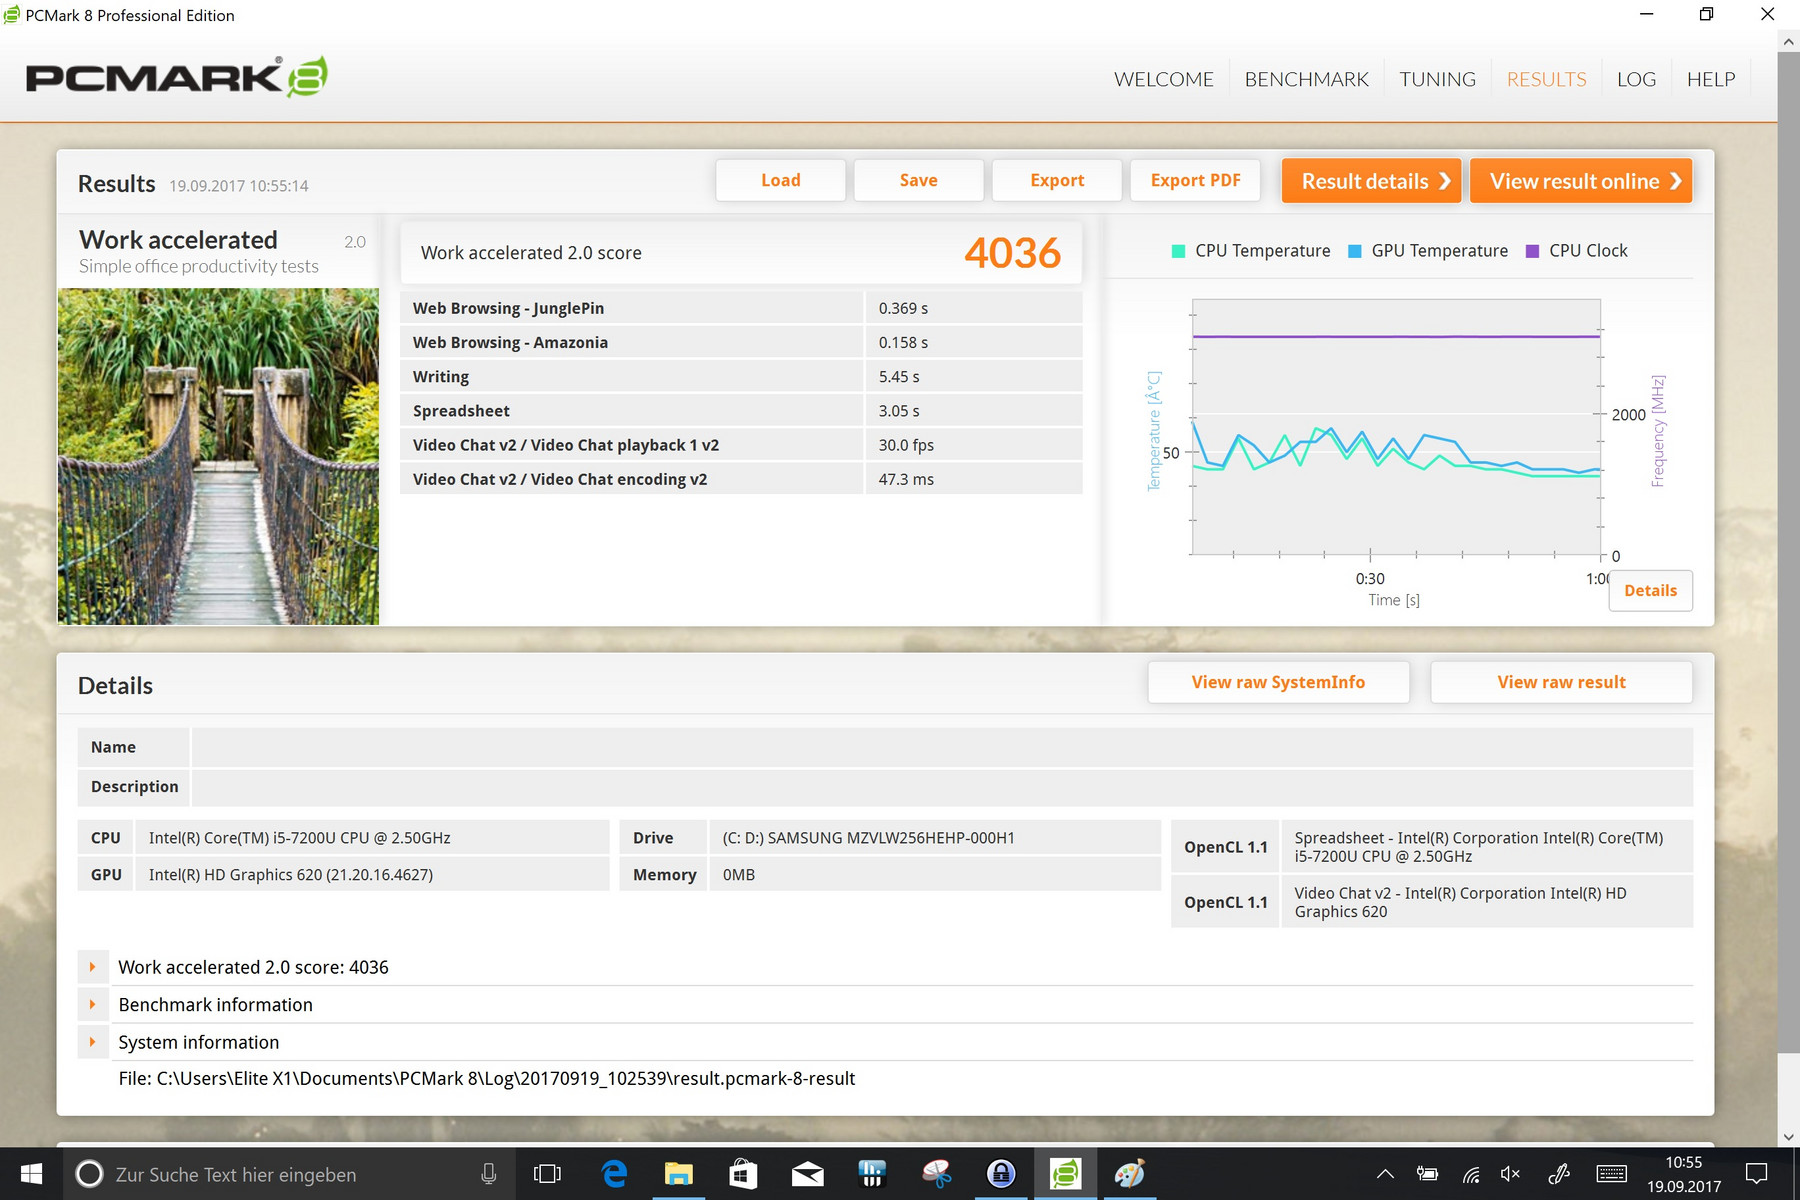
| PCMark 8 Work Score Accelerated v2 | 4036 points | |
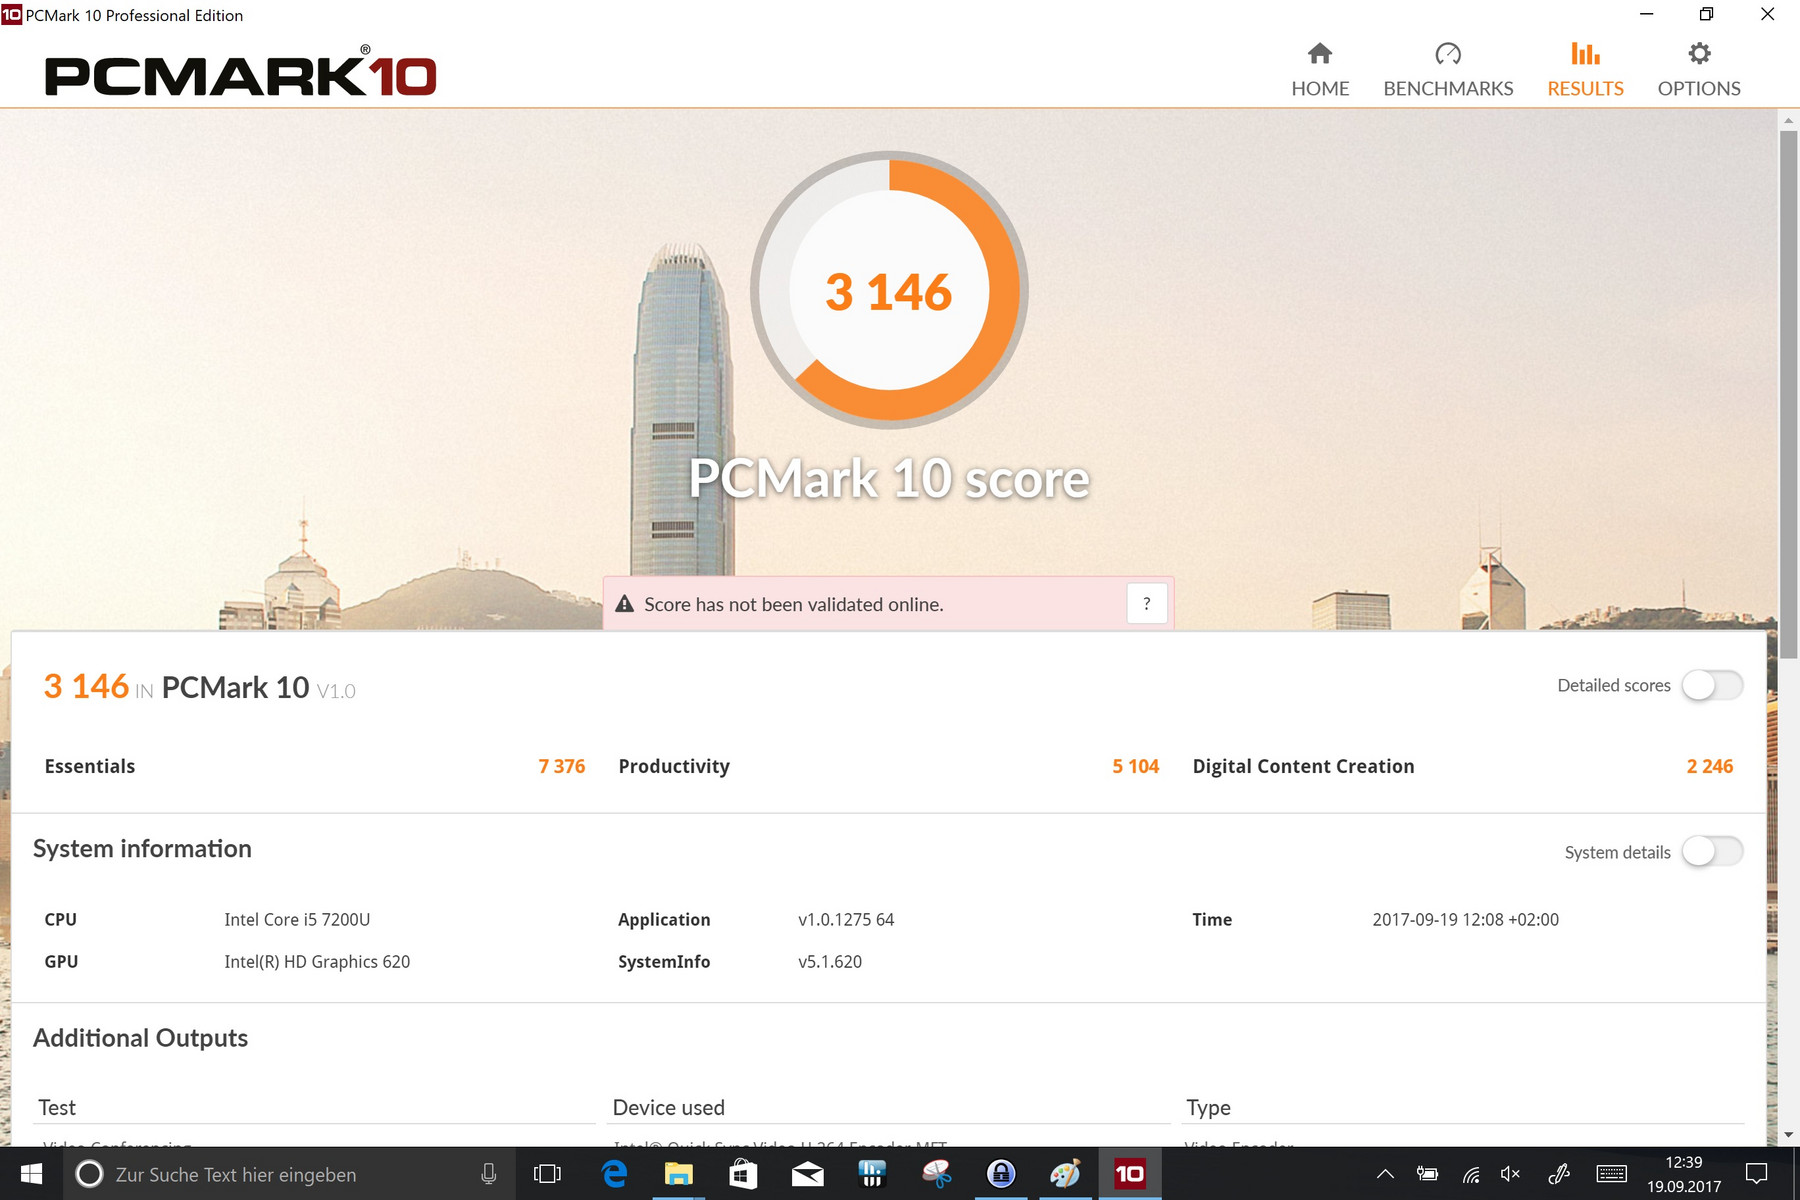
| PCMark 10 Score | 3146 points | |
Aide | ||
| HP Elite x2 1012 G2-1LV76EA Samsung PM961 MZVLW256HEHP | Microsoft Surface Pro (2017) i5 Samsung PM971 KUS030202M | Lenovo ThinkPad X1 Yoga 2017 20JES03T00 Samsung SSD PM961 1TB M.2 PCIe 3.0 x4 NVMe (MZVLW1T0) | Dell Latitude 12 5285 2-in-1 Samsung PM961 MZVLW256HEHP | Acer Switch 5 SW512-52-5819 Intel SSD 600p SSDPEKKW512G7 | Toshiba Portege X20W-D-10R Toshiba SG5 THNSNK512GVN8 | HP Elite x2 1012 G1 Liteon L8H-256V2G | |
|---|---|---|---|---|---|---|---|
| CrystalDiskMark 3.0 | -34% | 21% | -30% | -28% | -57% | -56% | |
| Read Seq (MB/s) | 1875 | 723 -61% | 2004 7% | 1294 -31% | 1066 -43% | 469 -75% | 501 -73% |
| Write Seq (MB/s) | 1261 | 853 -32% | 1693 34% | 865 -31% | 593 -53% | 277.3 -78% | 297.2 -76% |
| Read 512 (MB/s) | 1235 | 225 -82% | 1040 -16% | 406 -67% | 653 -47% | 404.4 -67% | 351.7 -72% |
| Write 512 (MB/s) | 844 | 445 -47% | 1292 53% | 589 -30% | 535 -37% | 266.6 -68% | 295.7 -65% |
| Read 4k (MB/s) | 56.9 | 46 -19% | 58.2 2% | 31.75 -44% | 35.92 -37% | 25.24 -56% | 28.31 -50% |
| Write 4k (MB/s) | 145.4 | 125 -14% | 182.2 25% | 72.2 -50% | 128.3 -12% | 89.4 -39% | 90.3 -38% |
| Read 4k QD32 (MB/s) | 398.3 | 423 6% | 632 59% | 493.3 24% | 460.6 16% | 322.5 -19% | 285 -28% |
| Write 4k QD32 (MB/s) | 472.5 | 373 -21% | 507 7% | 434.5 -8% | 425.4 -10% | 208.1 -56% | 268.4 -43% |

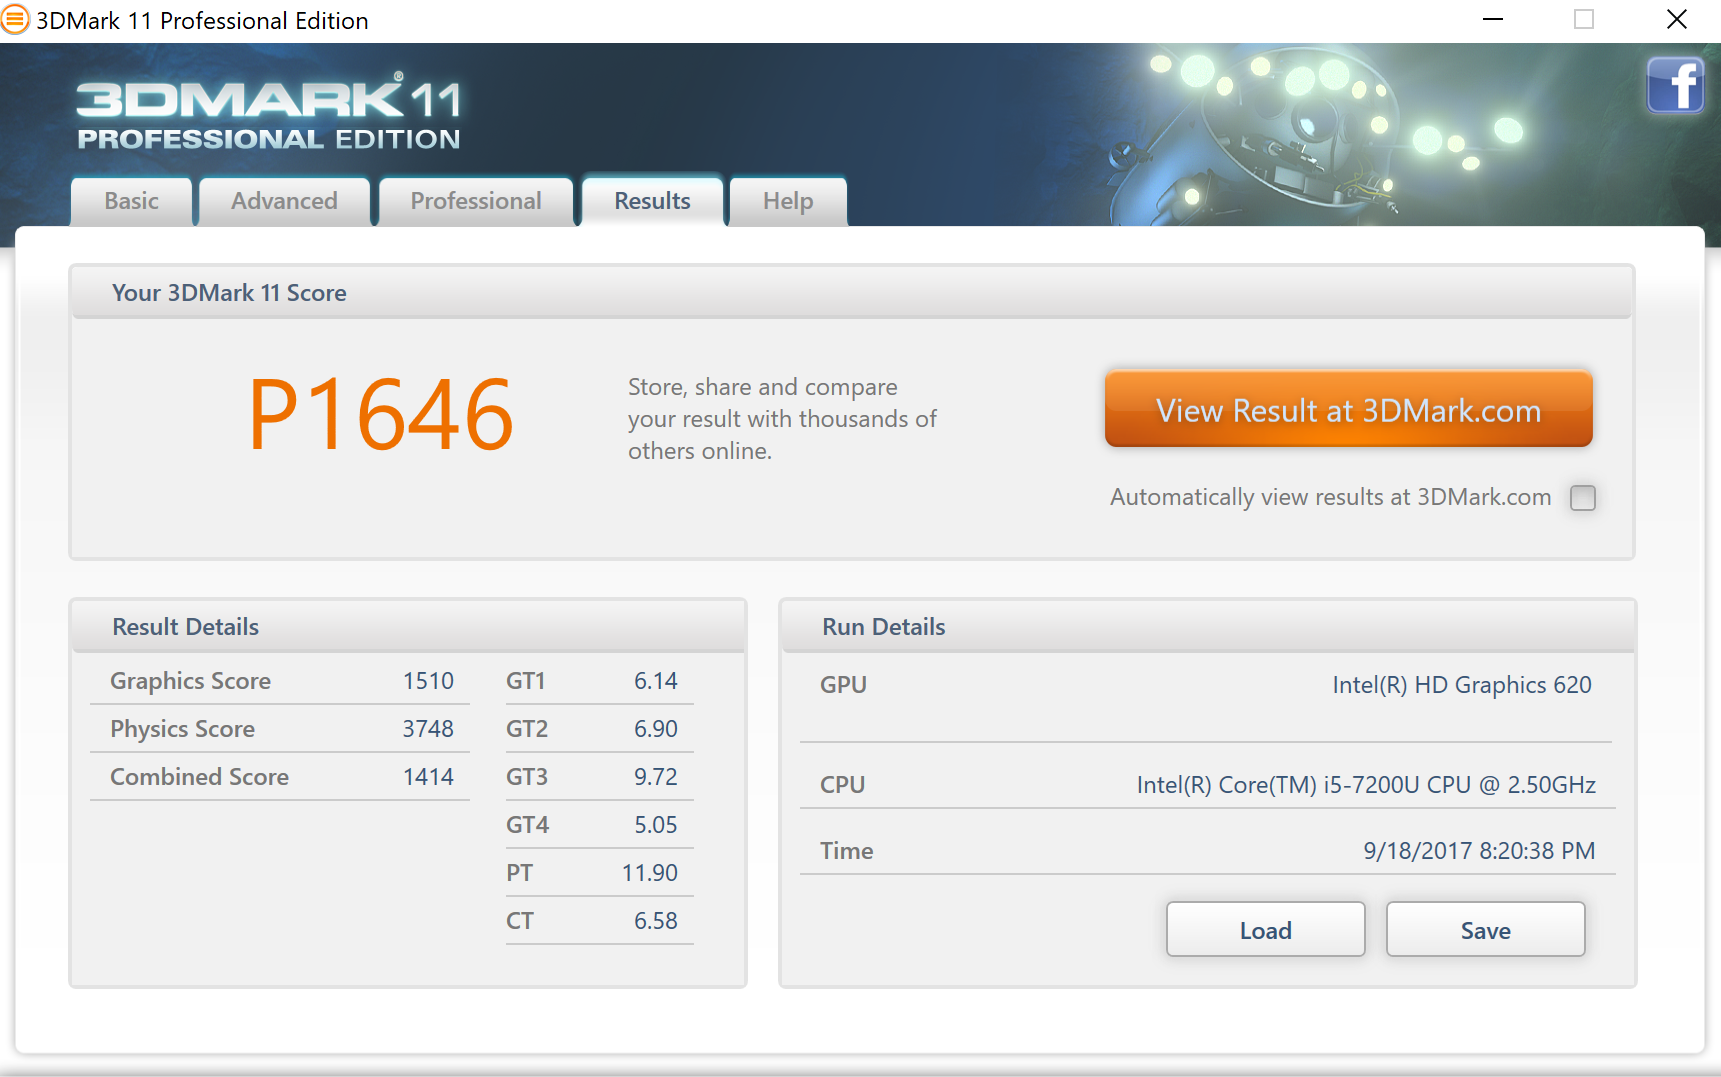
| 3DMark 11 Performance | 1646 points | |
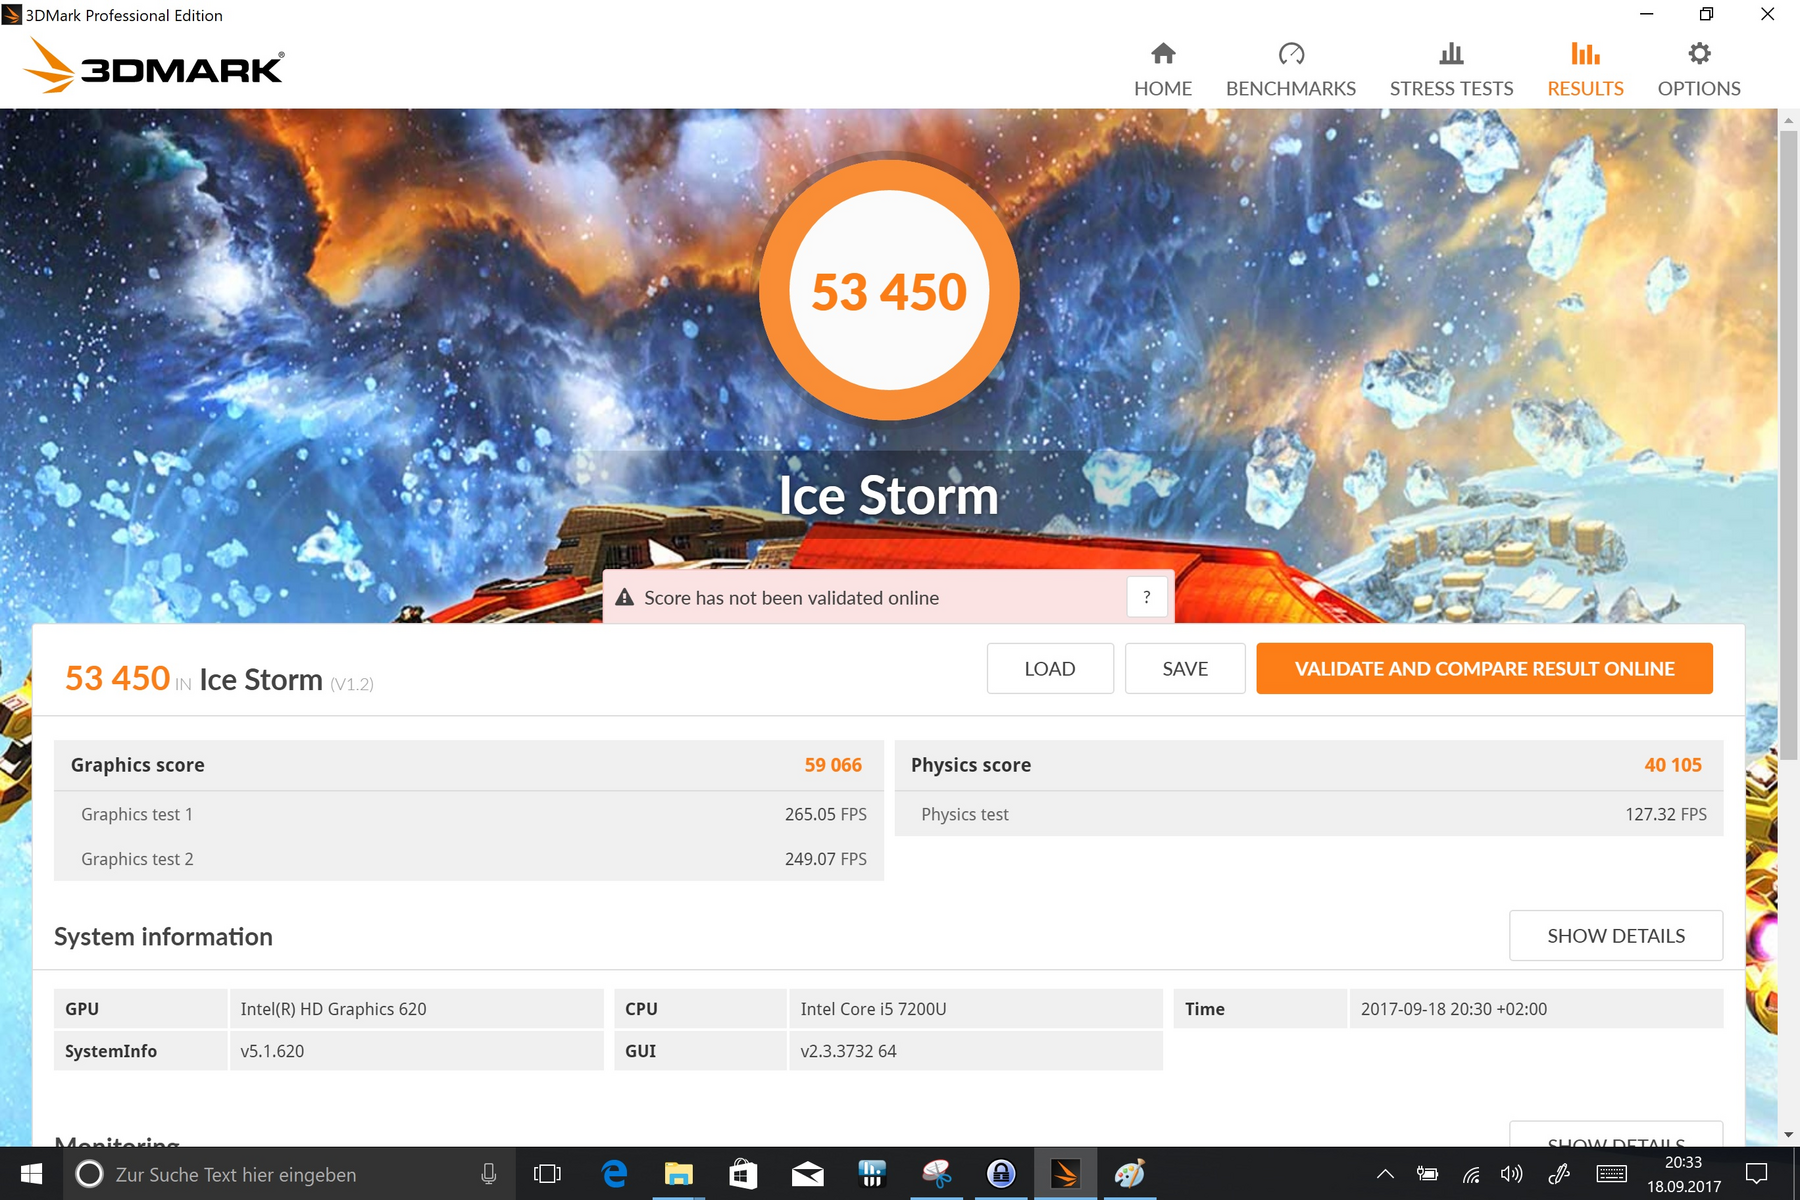
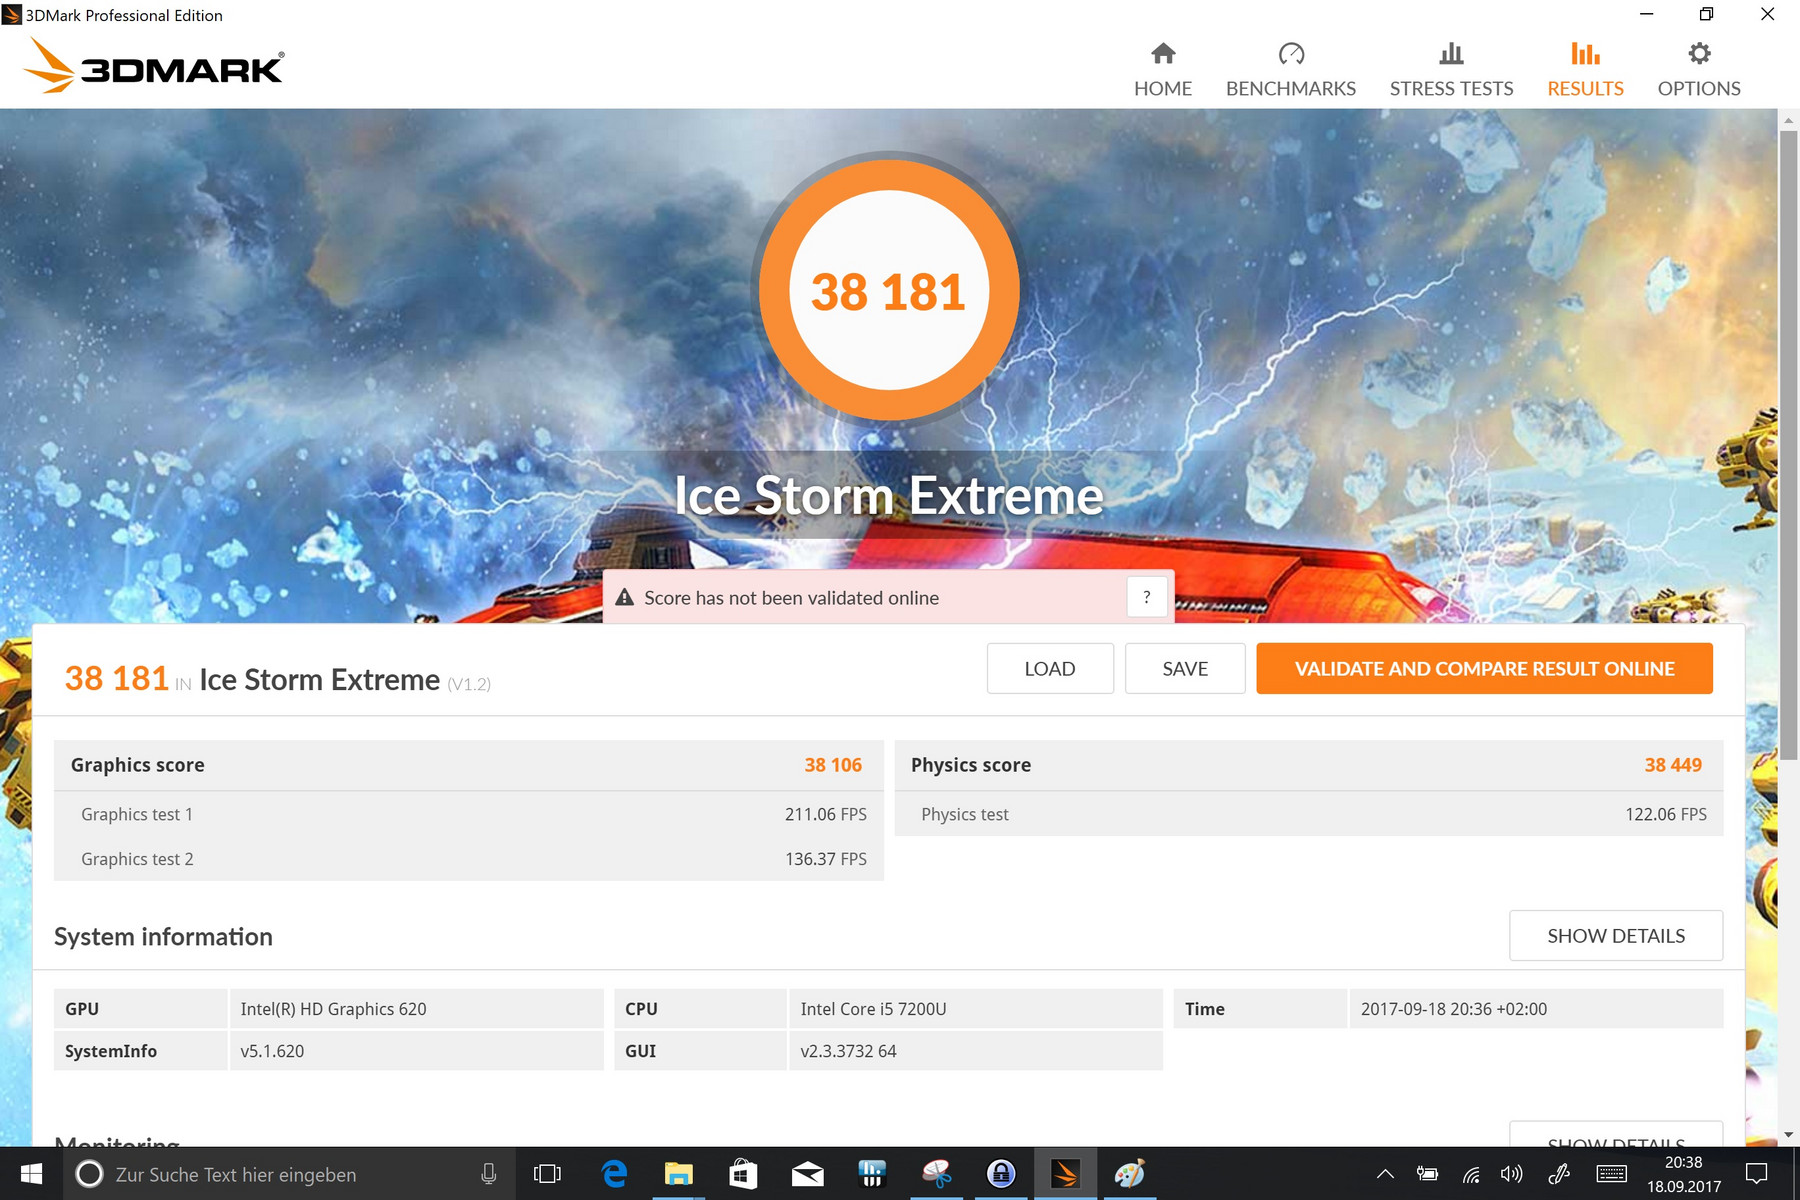
| 3DMark Ice Storm Standard Score | 53450 points | |
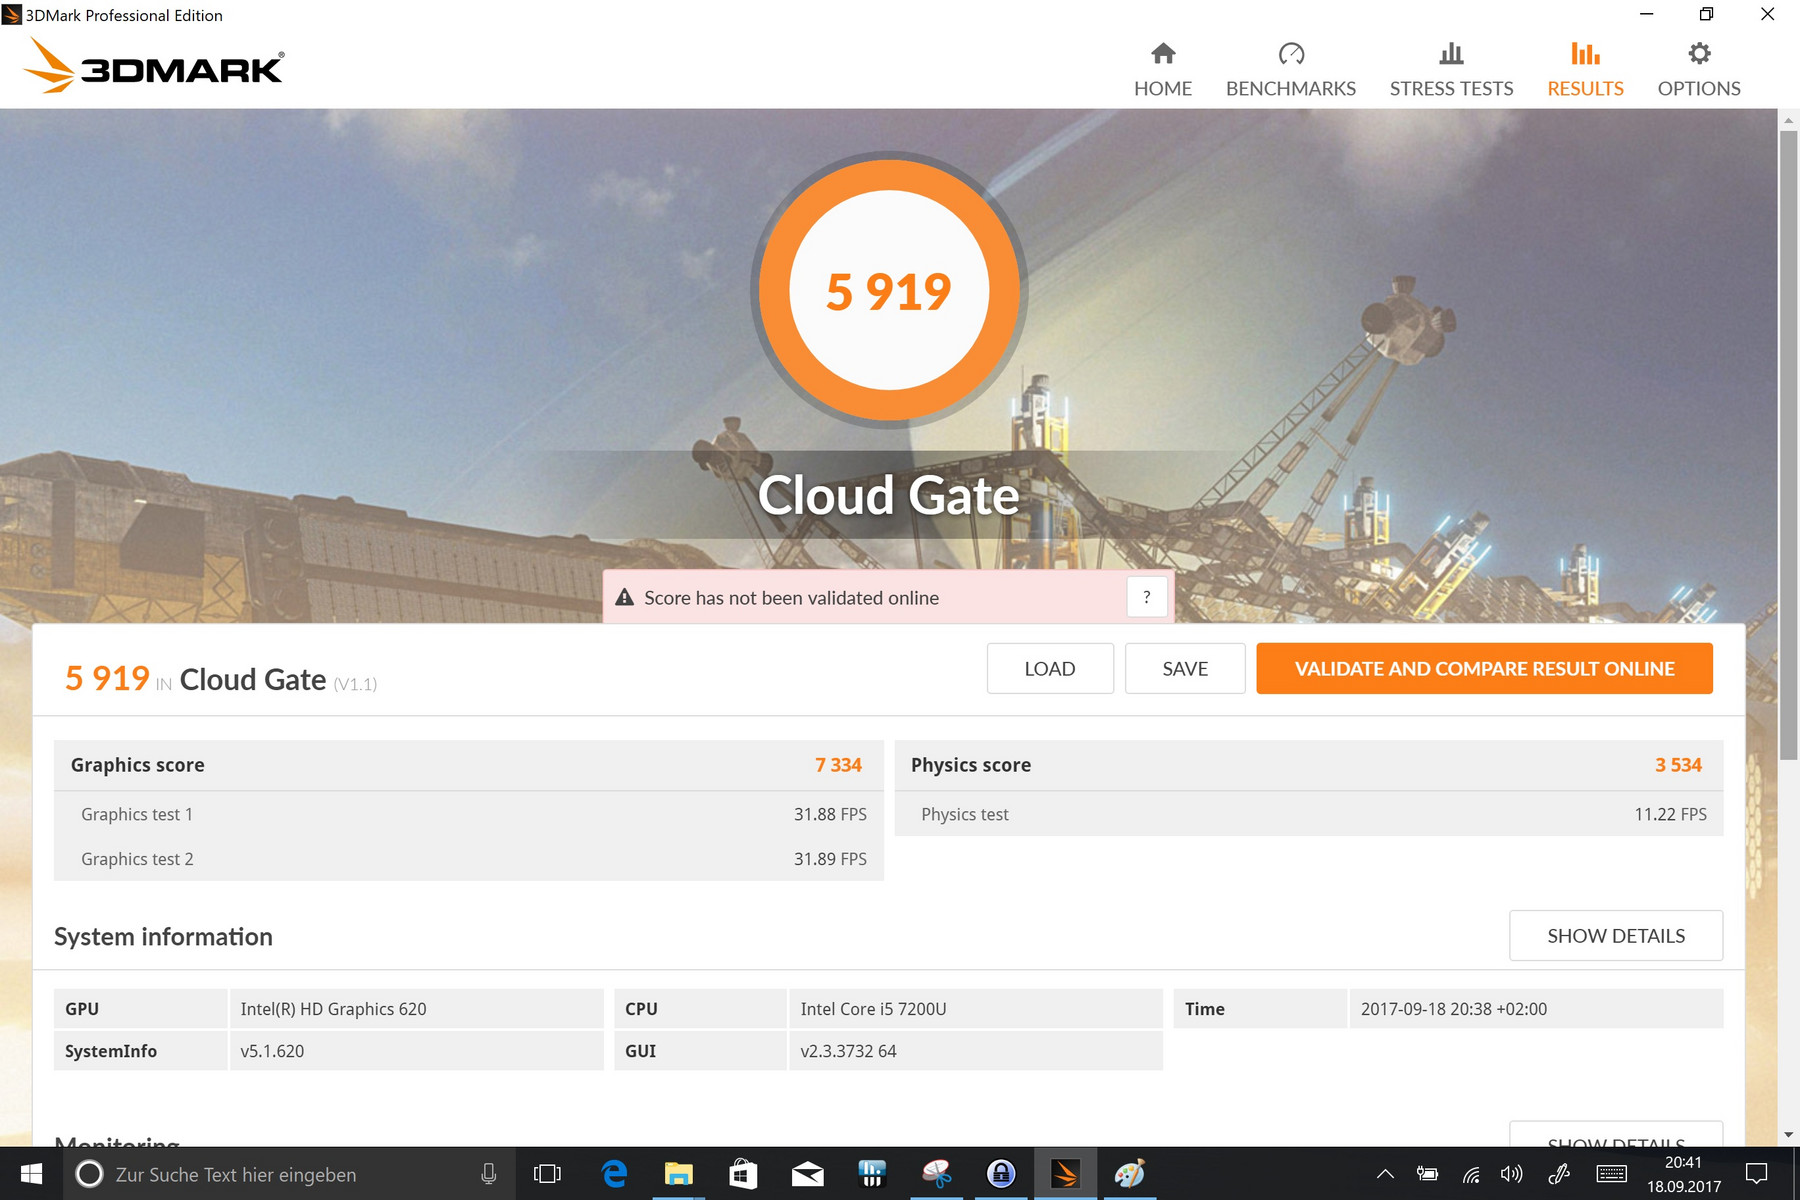
| 3DMark Cloud Gate Standard Score | 5919 points | |
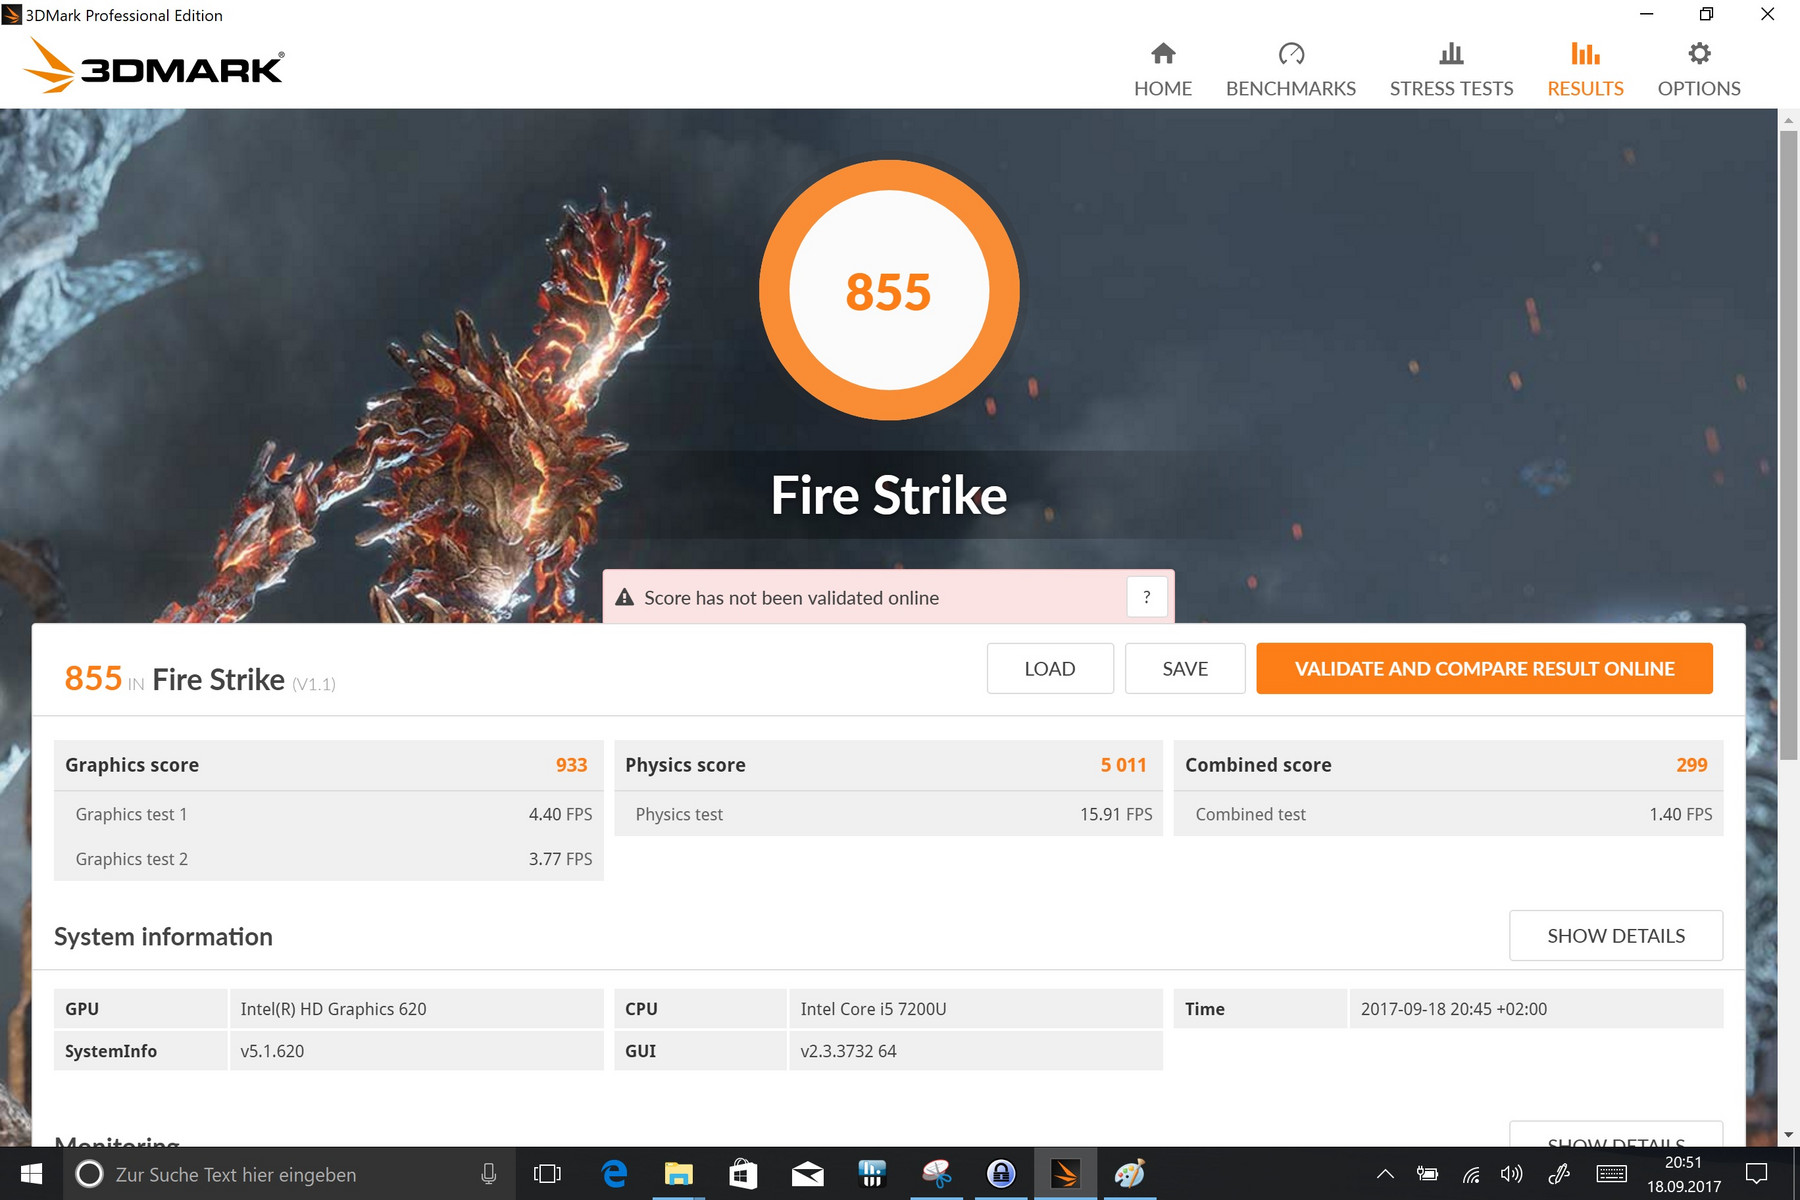
| 3DMark Fire Strike Score | 855 points | |
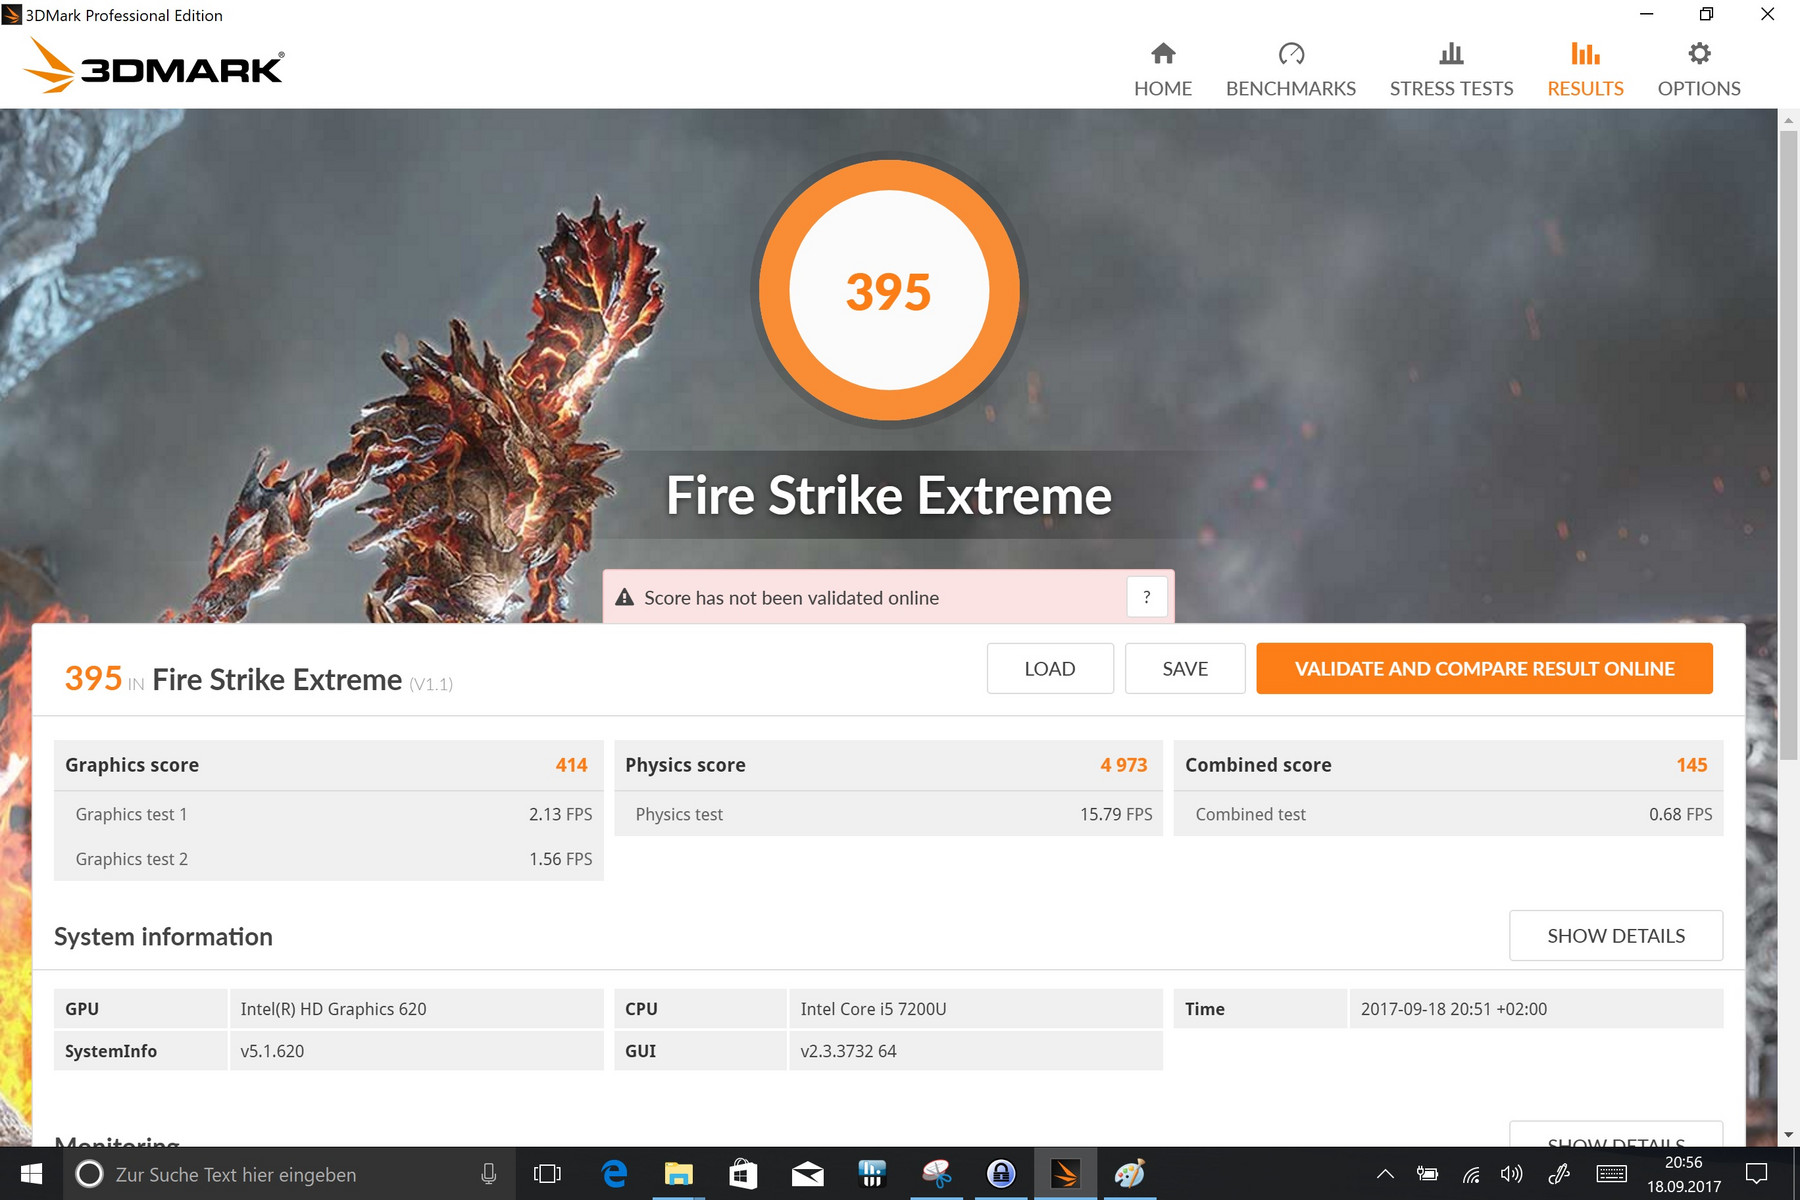
| 3DMark Fire Strike Extreme Score | 395 points | |
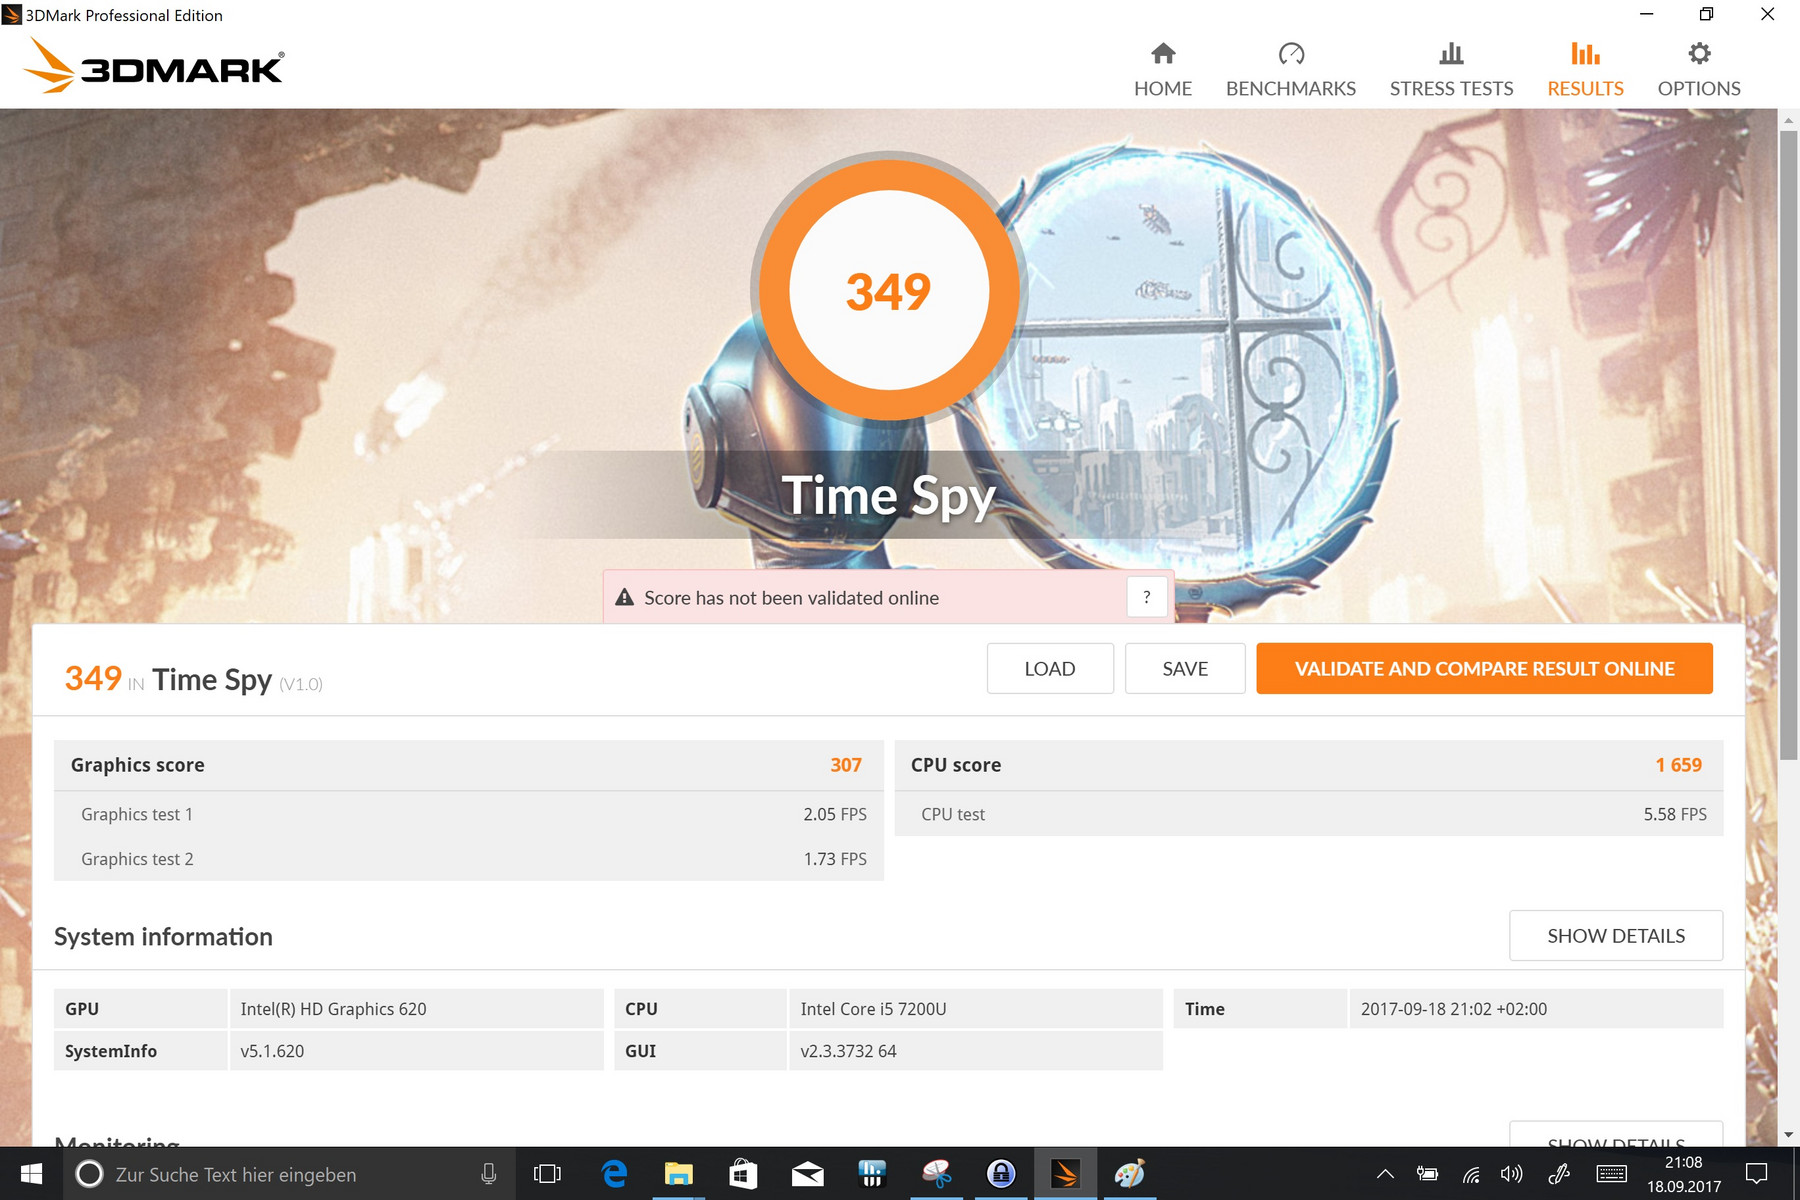
| 3DMark Time Spy Score | 349 points | |
Aide | ||
| Bas | Moyen | Élevé | Ultra | |
|---|---|---|---|---|
| BioShock Infinite (2013) | 52.9 | 30.5 | 25.2 | 7.5 |
| Battlefield 4 (2013) | 40.6 | 27.2 | 18.3 | 6.1 |
| Rise of the Tomb Raider (2016) | 20.1 | 11.9 | 6.8 | 4.3 |
Degré de la nuisance sonore
| Au repos |
| 29.5 / 29.5 / 29.5 dB(A) |
| Fortement sollicité |
| 30.6 / 32.5 dB(A) |
 | ||
30 dB silencieux 40 dB(A) audible 50 dB(A) bruyant |
||
min: | ||
| HP Elite x2 1012 G2-1LV76EA HD Graphics 620, i5-7200U, Samsung PM961 MZVLW256HEHP | Microsoft Surface Pro (2017) i5 HD Graphics 620, i5-7300U, Samsung PM971 KUS030202M | Lenovo ThinkPad X1 Yoga 2017 20JES03T00 HD Graphics 620, i7-7600U, Samsung SSD PM961 1TB M.2 PCIe 3.0 x4 NVMe (MZVLW1T0) | Dell Latitude 12 5285 2-in-1 HD Graphics 620, i7-7600U, Samsung PM961 MZVLW256HEHP | Acer Switch 5 SW512-52-5819 HD Graphics 620, i7-7500U, Intel SSD 600p SSDPEKKW512G7 | Toshiba Portege X20W-D-10R HD Graphics 620, i7-7600U, Toshiba SG5 THNSNK512GVN8 | HP Elite x2 1012 G1 HD Graphics 515, 6Y54, Liteon L8H-256V2G | |
|---|---|---|---|---|---|---|---|
| Noise | -8% | 2% | -2% | ||||
| arrêt / environnement * (dB) | 29.5 | 29.3 1% | 28.2 4% | 30.4 -3% | |||
| Idle Minimum * (dB) | 29.5 | 29.3 1% | 28.2 4% | 30.5 -3% | |||
| Idle Average * (dB) | 29.5 | 31.1 -5% | 28.2 4% | 30.5 -3% | |||
| Idle Maximum * (dB) | 29.5 | 33.3 -13% | 28.2 4% | 30.5 -3% | |||
| Load Average * (dB) | 30.6 | 33.3 -9% | 30.4 1% | 31.2 -2% | |||
| Load Maximum * (dB) | 32.5 | 38.9 -20% | 34 -5% | 31.3 4% |
* ... Moindre est la valeur, meilleures sont les performances
| HP Elite x2 1012 G2-1LV76EA HD Graphics 620, i5-7200U, Samsung PM961 MZVLW256HEHP | Microsoft Surface Pro (2017) i5 HD Graphics 620, i5-7300U, Samsung PM971 KUS030202M | Lenovo ThinkPad X1 Yoga 2017 20JES03T00 HD Graphics 620, i7-7600U, Samsung SSD PM961 1TB M.2 PCIe 3.0 x4 NVMe (MZVLW1T0) | Dell Latitude 12 5285 2-in-1 HD Graphics 620, i7-7600U, Samsung PM961 MZVLW256HEHP | Acer Switch 5 SW512-52-5819 HD Graphics 620, i7-7500U, Intel SSD 600p SSDPEKKW512G7 | Toshiba Portege X20W-D-10R HD Graphics 620, i7-7600U, Toshiba SG5 THNSNK512GVN8 | HP Elite x2 1012 G1 HD Graphics 515, 6Y54, Liteon L8H-256V2G | |
|---|---|---|---|---|---|---|---|
| Heat | -9% | 2% | -3% | -9% | 22% | -1% | |
| Maximum Upper Side * (°C) | 42.3 | 39.2 7% | 47.5 -12% | 38.2 10% | 44.7 -6% | 35.7 16% | 39 8% |
| Maximum Bottom * (°C) | 44.5 | 40.3 9% | 44.8 -1% | 48.6 -9% | 47.5 -7% | 24.2 46% | 41.2 7% |
| Idle Upper Side * (°C) | 29.5 | 37 -25% | 23.7 20% | 29.6 -0% | 29.7 -1% | 23.4 21% | 29.5 -0% |
| Idle Bottom * (°C) | 25.2 | 32.3 -28% | 24.6 2% | 28.8 -14% | 30.7 -22% | 24.2 4% | 29.8 -18% |
* ... Moindre est la valeur, meilleures sont les performances
(±) La température maximale du côté supérieur est de 42.3 °C / 108 F, par rapport à la moyenne de 35.4 °C / 96 F, allant de 19.6 à 60 °C pour la classe Convertible.
(±) Le fond chauffe jusqu'à un maximum de 44.5 °C / 112 F, contre une moyenne de 36.9 °C / 98 F
(+) En utilisation inactive, la température moyenne du côté supérieur est de 26.9 °C / 80 F, par rapport à la moyenne du dispositif de 30.3 °C / 87 F.
(+) Les repose-poignets et le pavé tactile atteignent la température maximale de la peau (35.9 °C / 96.6 F) et ne sont donc pas chauds.
(-) La température moyenne de la zone de l'appui-paume de dispositifs similaires était de 28 °C / 82.4 F (-7.9 °C / #-14.2 F).
HP Elite x2 1012 G2-1LV76EA analyse audio
(-) | haut-parleurs pas très forts (71 dB)
Basses 100 - 315 Hz
(-) | presque aucune basse - en moyenne 21.3% plus bas que la médiane
(±) | la linéarité des basses est moyenne (10% delta à la fréquence précédente)
Médiums 400 - 2000 Hz
(+) | médiane équilibrée - seulement 4.2% de la médiane
(±) | la linéarité des médiums est moyenne (7.9% delta à la fréquence précédente)
Aiguës 2 - 16 kHz
(±) | sommets plus élevés - en moyenne 8.9% plus élevés que la médiane
(-) | les aigus ne sont pas linéaires (16.8% delta à la fréquence précédente)
Globalement 100 - 16 000 Hz
(-) | le son global n'est pas linéaire (35.1% de différence à la médiane)
Par rapport à la même classe
» 94% de tous les appareils testés de cette catégorie étaient meilleurs, 2% similaires, 4% pires
» Le meilleur avait un delta de 6%, la moyenne était de 20%, le pire était de 57%.
Par rapport à tous les appareils testés
» 93% de tous les appareils testés étaient meilleurs, 1% similaires, 6% pires
» Le meilleur avait un delta de 4%, la moyenne était de 24%, le pire était de 134%.
Microsoft Surface Pro (2017) i5 analyse audio
(-) | haut-parleurs pas très forts (68 dB)
Basses 100 - 315 Hz
(±) | basse réduite - en moyenne 9.7% inférieure à la médiane
(±) | la linéarité des basses est moyenne (7% delta à la fréquence précédente)
Médiums 400 - 2000 Hz
(+) | médiane équilibrée - seulement 4.6% de la médiane
(+) | les médiums sont linéaires (6.3% delta à la fréquence précédente)
Aiguës 2 - 16 kHz
(+) | des sommets équilibrés - à seulement 2.1% de la médiane
(+) | les aigus sont linéaires (5.2% delta à la fréquence précédente)
Globalement 100 - 16 000 Hz
(±) | la linéarité du son global est moyenne (18.2% de différence avec la médiane)
Par rapport à la même classe
» 40% de tous les appareils testés de cette catégorie étaient meilleurs, 7% similaires, 53% pires
» Le meilleur avait un delta de 6%, la moyenne était de 20%, le pire était de 57%.
Par rapport à tous les appareils testés
» 39% de tous les appareils testés étaient meilleurs, 8% similaires, 53% pires
» Le meilleur avait un delta de 4%, la moyenne était de 24%, le pire était de 134%.
| Éteint/en veille | |
| Au repos | |
| Fortement sollicité |
|
Légende:
min: | |
| HP Elite x2 1012 G2-1LV76EA i5-7200U, HD Graphics 620, Samsung PM961 MZVLW256HEHP, IPS, 2716x1824, 12.3" | Microsoft Surface Pro (2017) i5 i5-7300U, HD Graphics 620, Samsung PM971 KUS030202M, IPS, 2736x1824, 12.3" | Lenovo ThinkPad X1 Yoga 2017 20JES03T00 i7-7600U, HD Graphics 620, Samsung SSD PM961 1TB M.2 PCIe 3.0 x4 NVMe (MZVLW1T0), OLED, 2560x1440, 14" | Dell Latitude 12 5285 2-in-1 i7-7600U, HD Graphics 620, Samsung PM961 MZVLW256HEHP, IPS, 1920x1280, 12.3" | Acer Switch 5 SW512-52-5819 i7-7500U, HD Graphics 620, Intel SSD 600p SSDPEKKW512G7, IPS, 2160x1440, 12" | Toshiba Portege X20W-D-10R i7-7600U, HD Graphics 620, Toshiba SG5 THNSNK512GVN8, IPS, 1920x1080, 12.5" | HP Elite x2 1012 G1 6Y54, HD Graphics 515, Liteon L8H-256V2G, IPS, 1920x1280, 12.1" | |
|---|---|---|---|---|---|---|---|
| Power Consumption | 25% | -4% | 24% | 23% | 37% | 26% | |
| Idle Minimum * (Watt) | 4.1 | 3.6 12% | 4.9 -20% | 2.85 30% | 3.86 6% | 3.4 17% | 3.7 10% |
| Idle Average * (Watt) | 9.2 | 8.1 12% | 7.6 17% | 6.76 27% | 6.4 30% | 5.8 37% | 6.8 26% |
| Idle Maximum * (Watt) | 11.1 | 8.7 22% | 13.8 -24% | 6.91 38% | 7.17 35% | 6.7 40% | 7.6 32% |
| Load Average * (Watt) | 33.8 | 25.5 25% | 33.4 1% | 32.88 3% | 30.5 10% | 21.4 37% | 22.5 33% |
| Load Maximum * (Watt) | 49.2 | 23.5 52% | 46.5 5% | 37.41 24% | 32.4 34% | 21.6 56% | 34.5 30% |
* ... Moindre est la valeur, meilleures sont les performances

| HP Elite x2 1012 G2-1LV76EA i5-7200U, HD Graphics 620, 47 Wh | Microsoft Surface Pro (2017) i5 i5-7300U, HD Graphics 620, 45 Wh | Lenovo ThinkPad X1 Yoga 2017 20JES03T00 i7-7600U, HD Graphics 620, 56 Wh | Dell Latitude 12 5285 2-in-1 i7-7600U, HD Graphics 620, 42 Wh | Acer Switch 5 SW512-52-5819 i7-7500U, HD Graphics 620, Wh | Toshiba Portege X20W-D-10R i7-7600U, HD Graphics 620, 44 Wh | HP Elite x2 1012 G1 6Y54, HD Graphics 515, 37 Wh | |
|---|---|---|---|---|---|---|---|
| Autonomie de la batterie | 49% | -4% | 12% | -17% | 40% | 4% | |
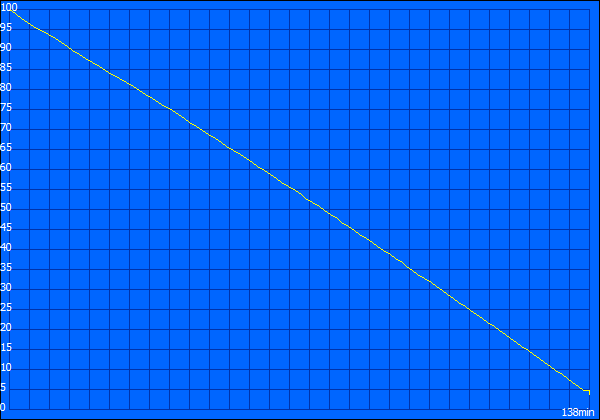
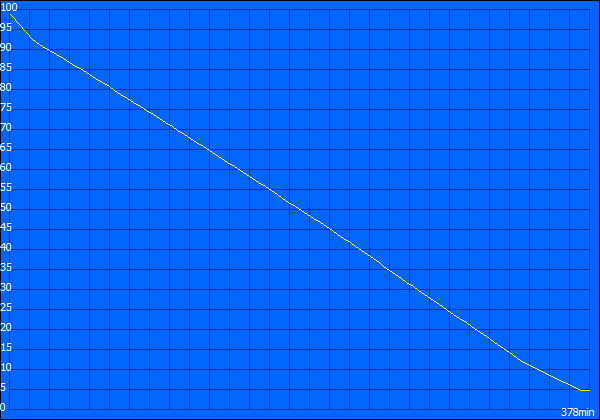
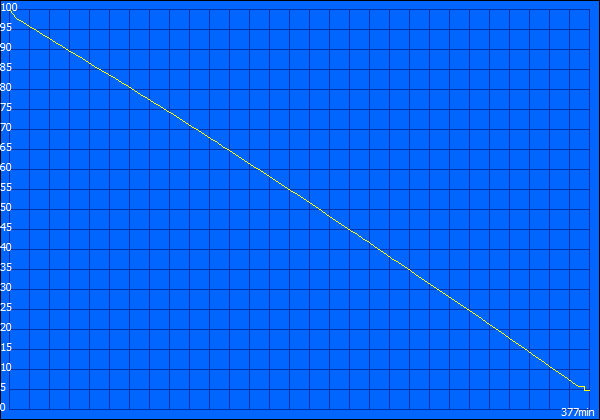
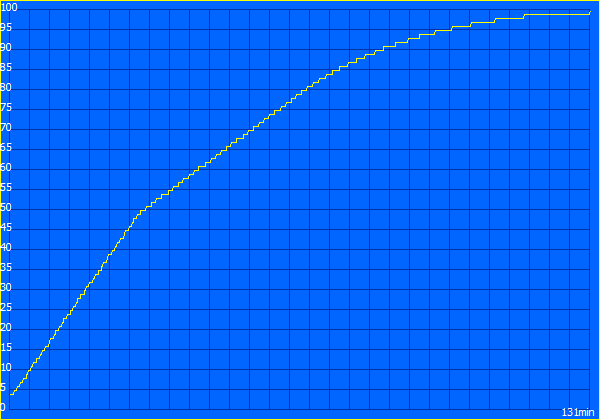
| Reader / Idle (h) | 13.9 | 17.6 27% | 13.1 -6% | 17.9 29% | 11.9 -14% | 16.7 20% | 12.2 -12% |
| H.264 (h) | 6.3 | 6.8 8% | 7.2 14% | ||||
| WiFi v1.3 (h) | 6.3 | 12.4 97% | 6.1 -3% | 8.1 29% | 5.9 -6% | 12 90% | 7.4 17% |
| Load (h) | 2.3 | 2.8 22% | 2 -13% | 1.8 -22% | 1.6 -30% | 2.5 9% | 2.2 -4% |
Points positifs
Points négatifs

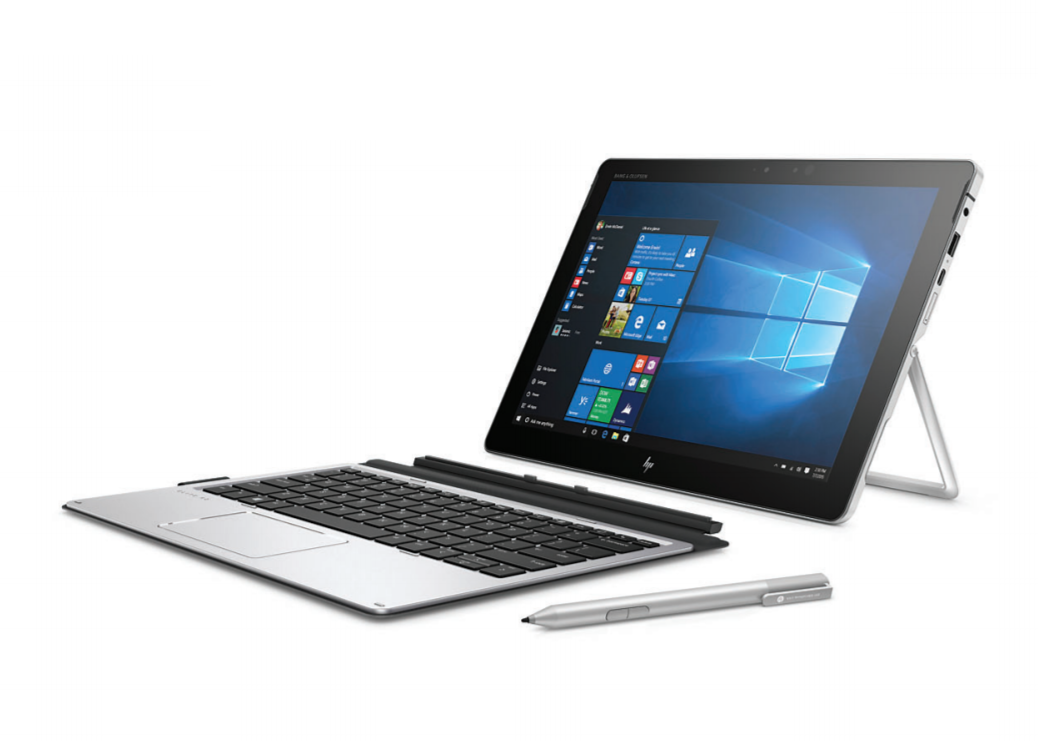
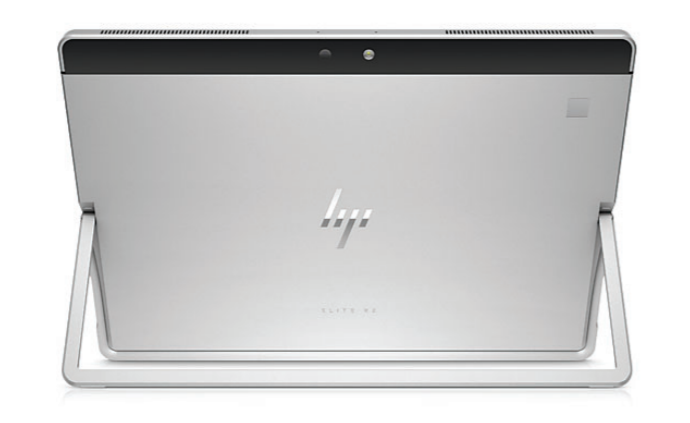
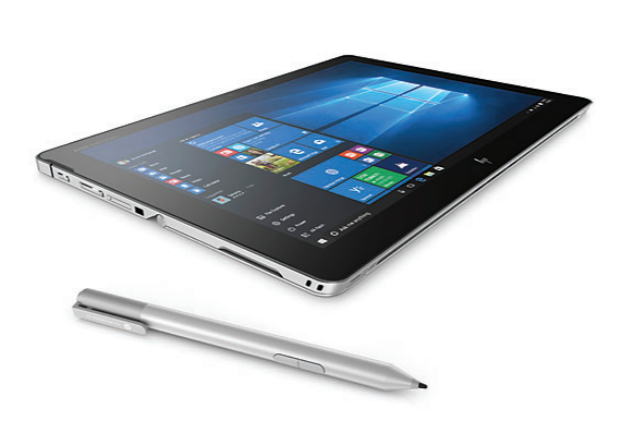
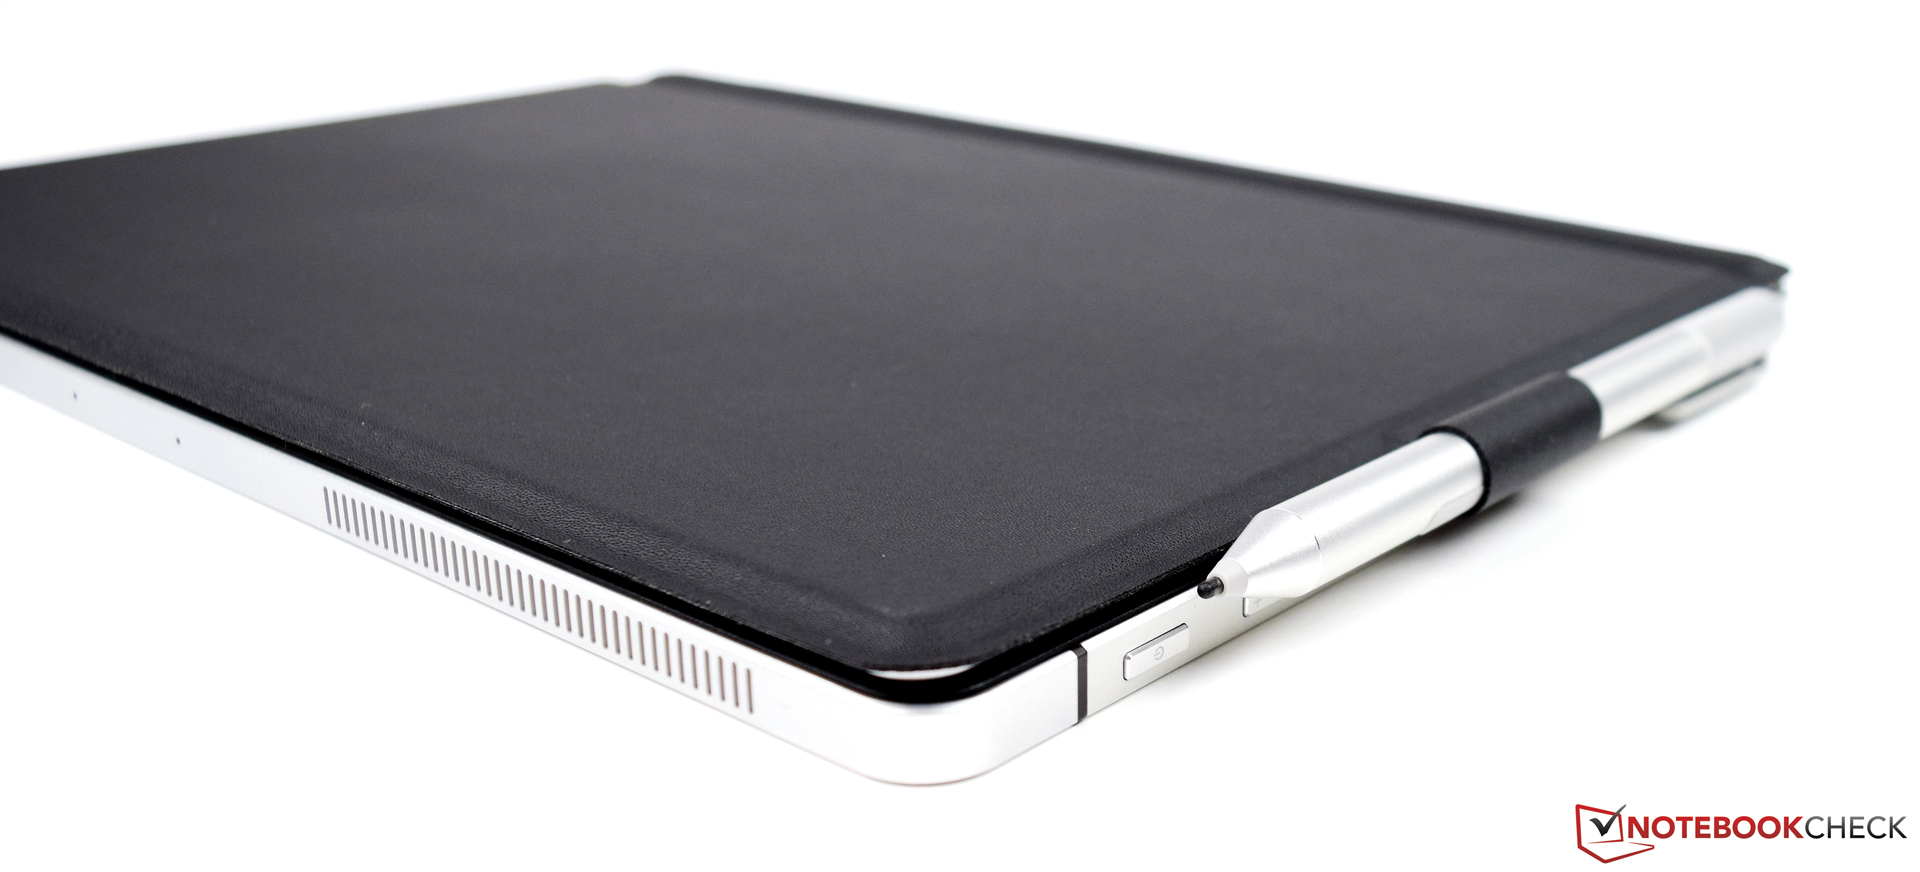
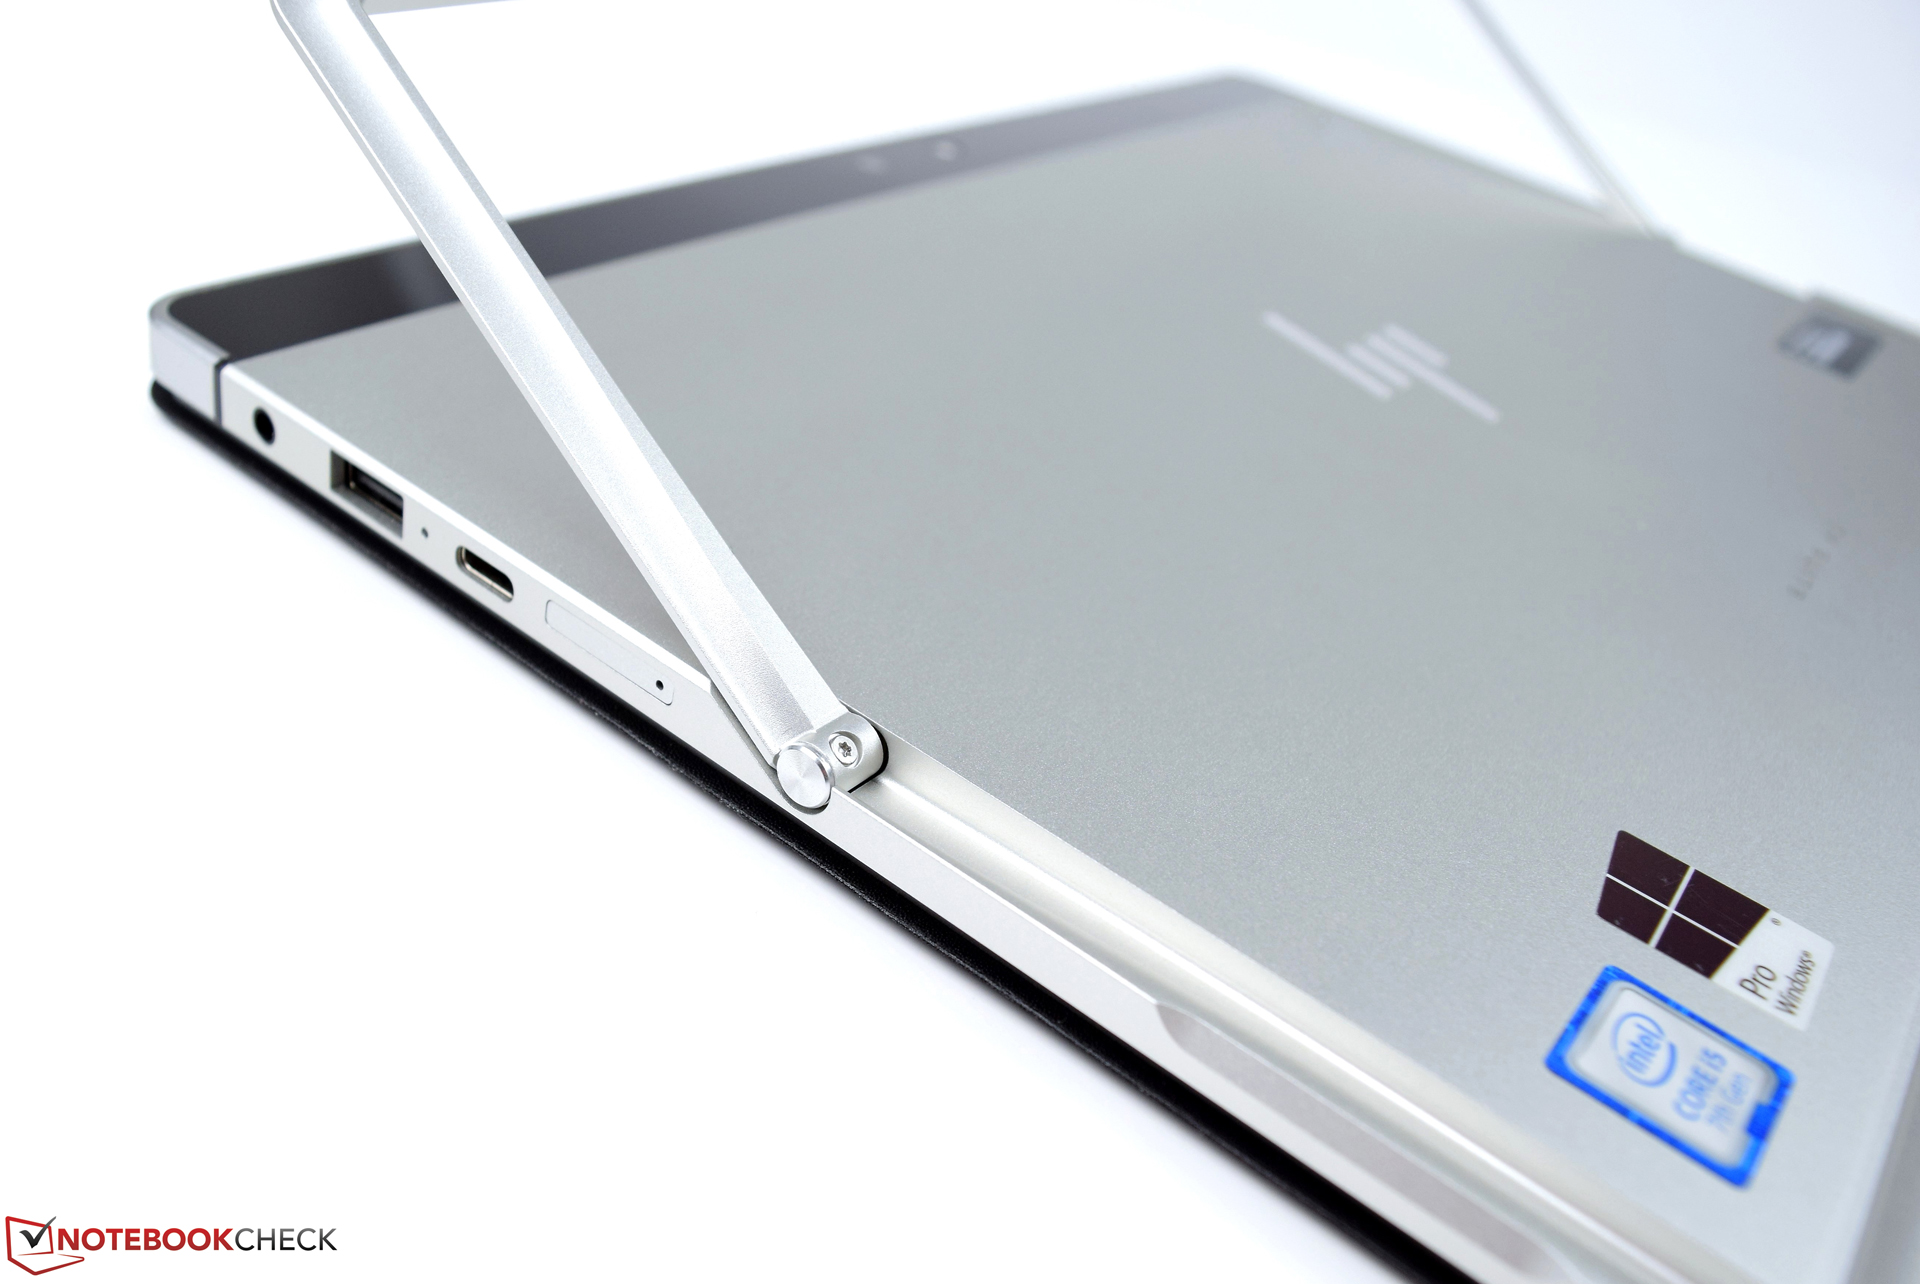
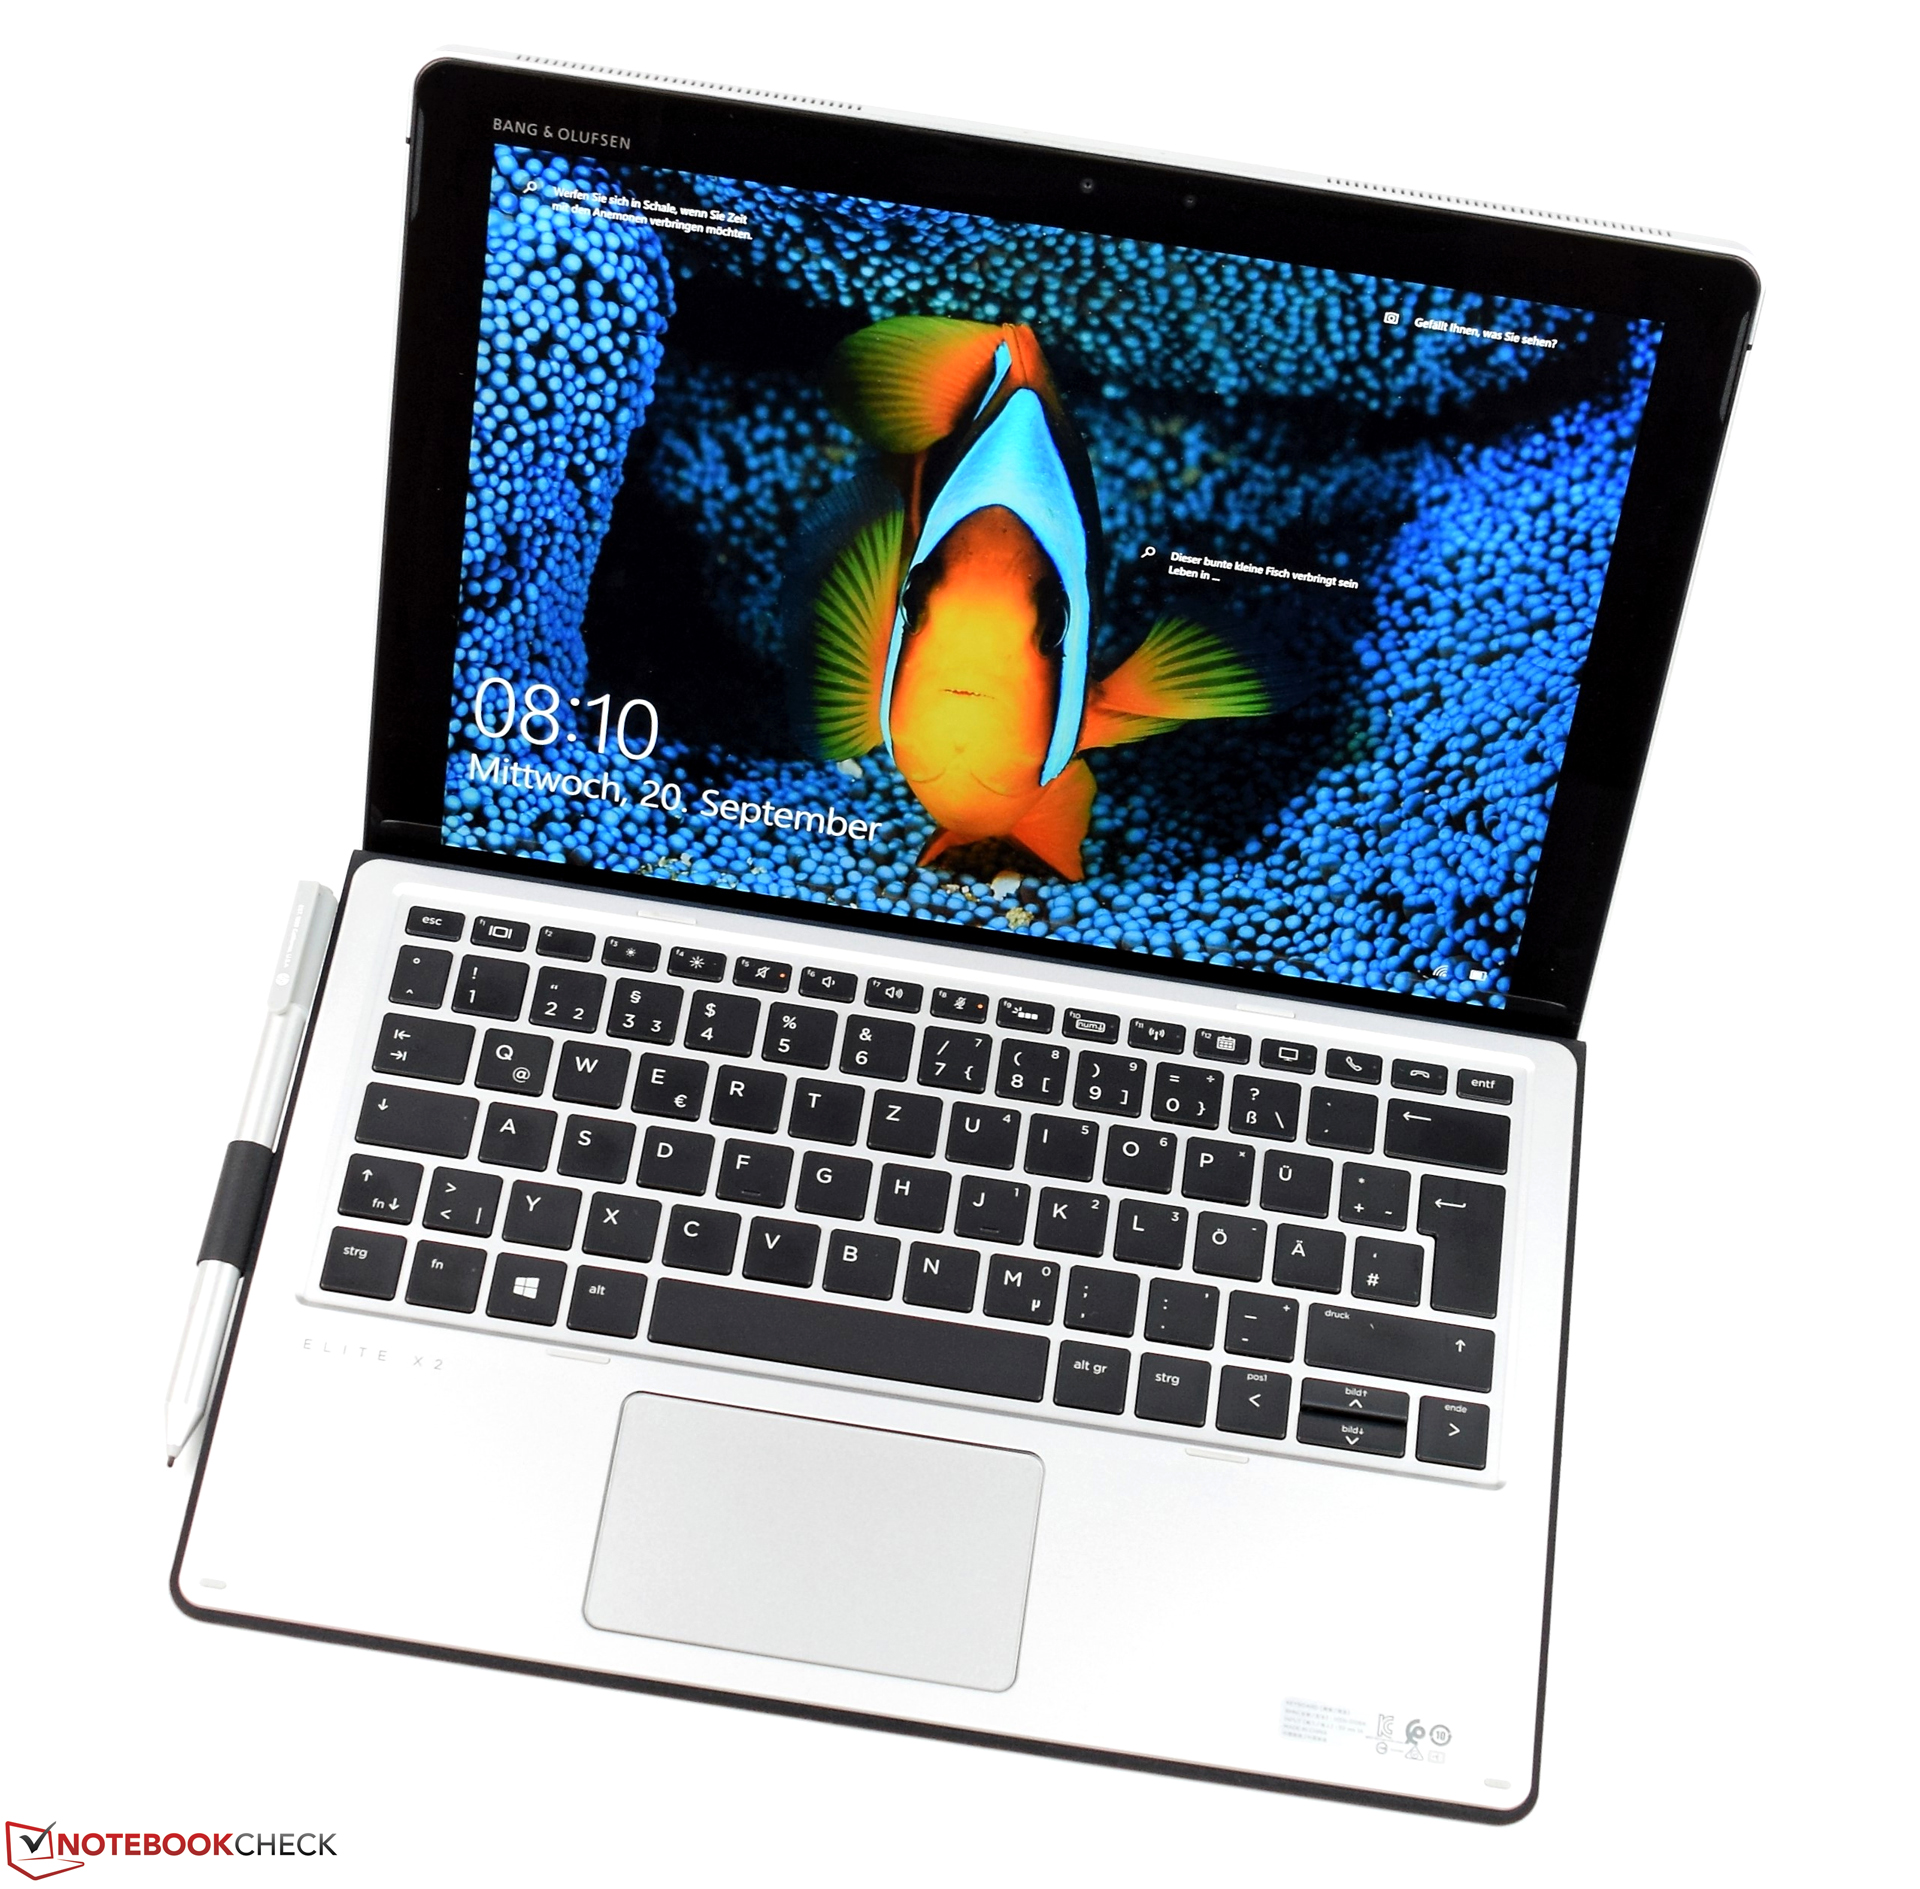
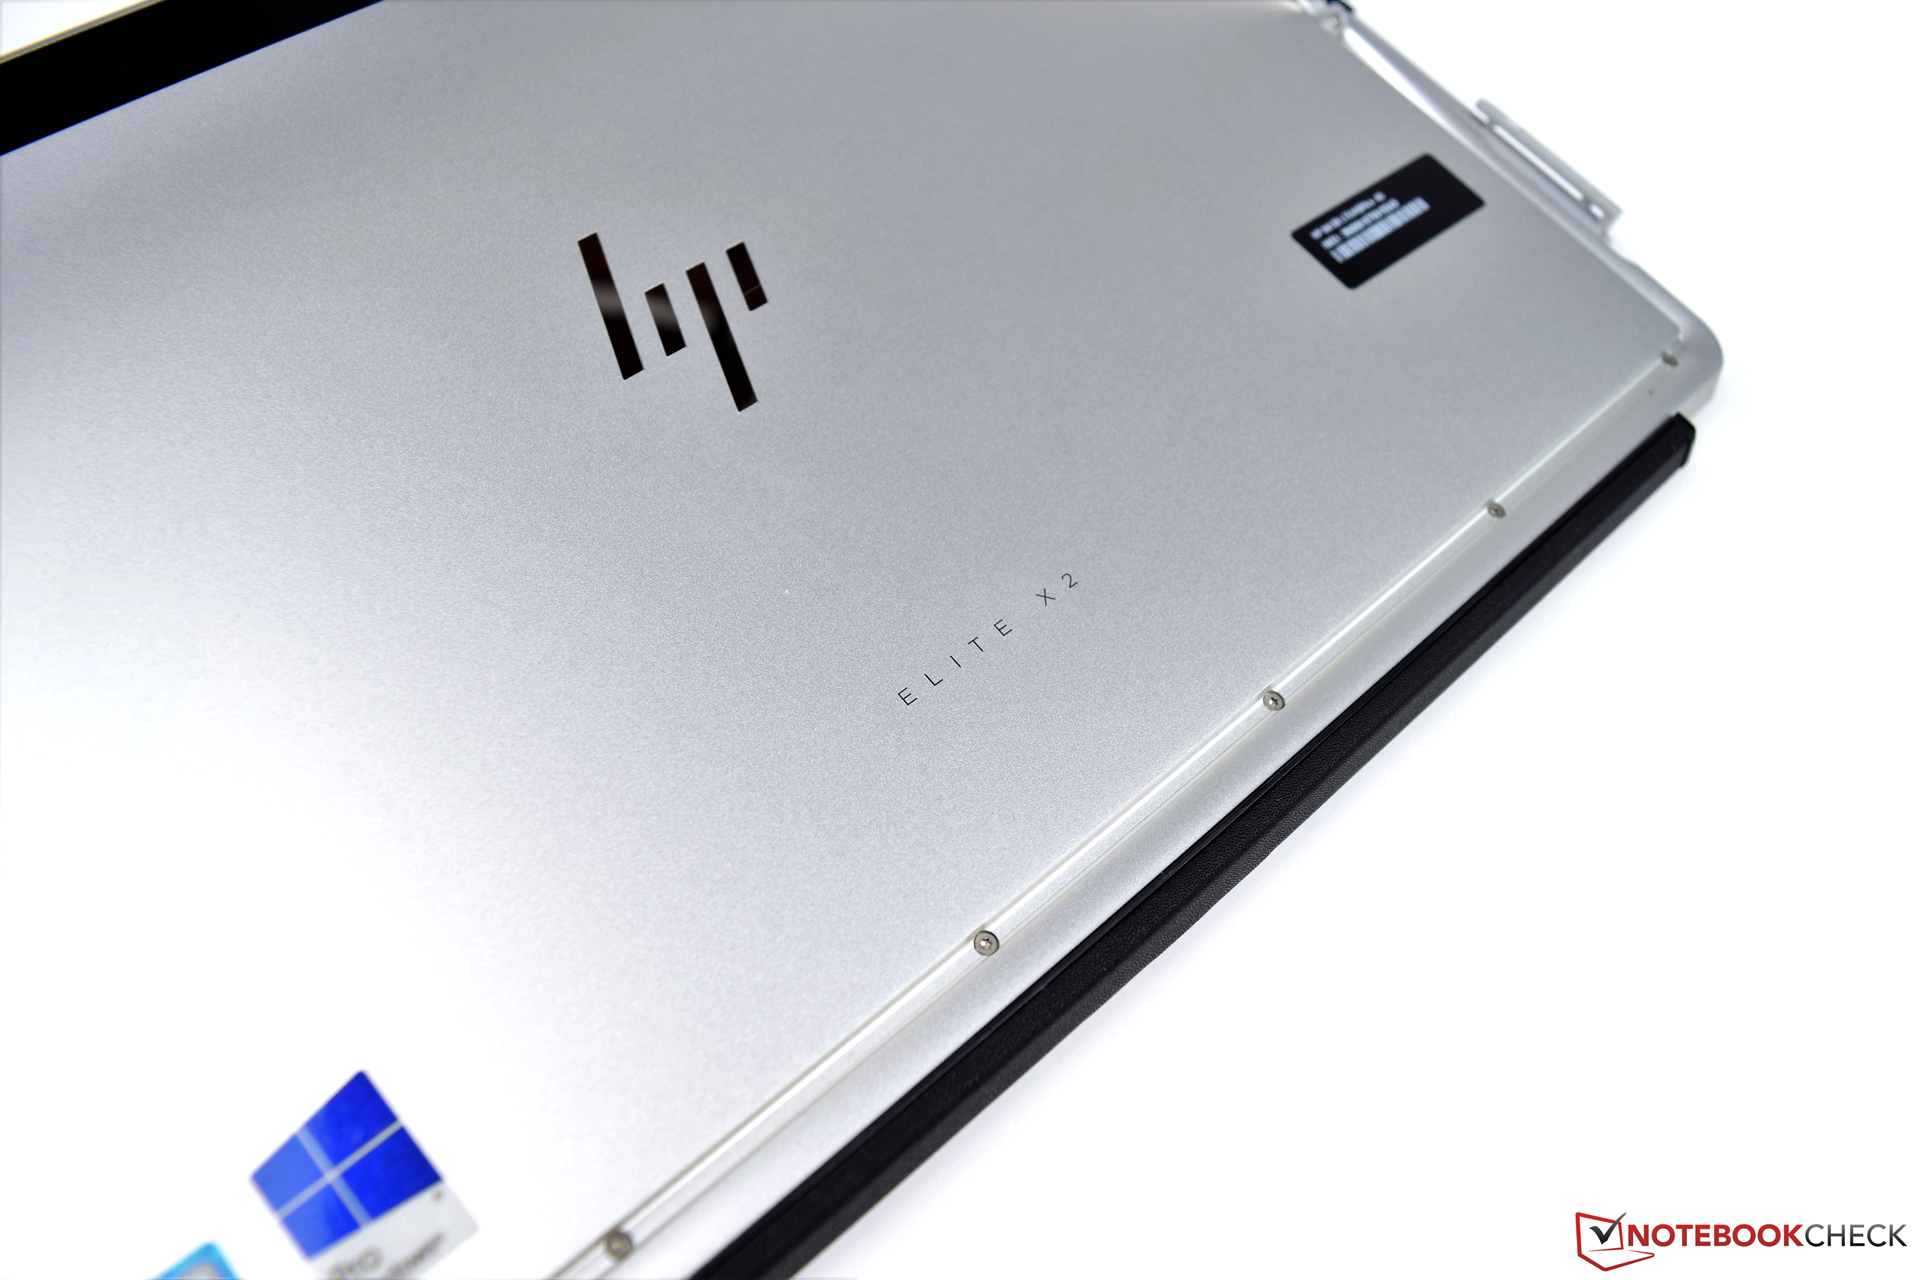
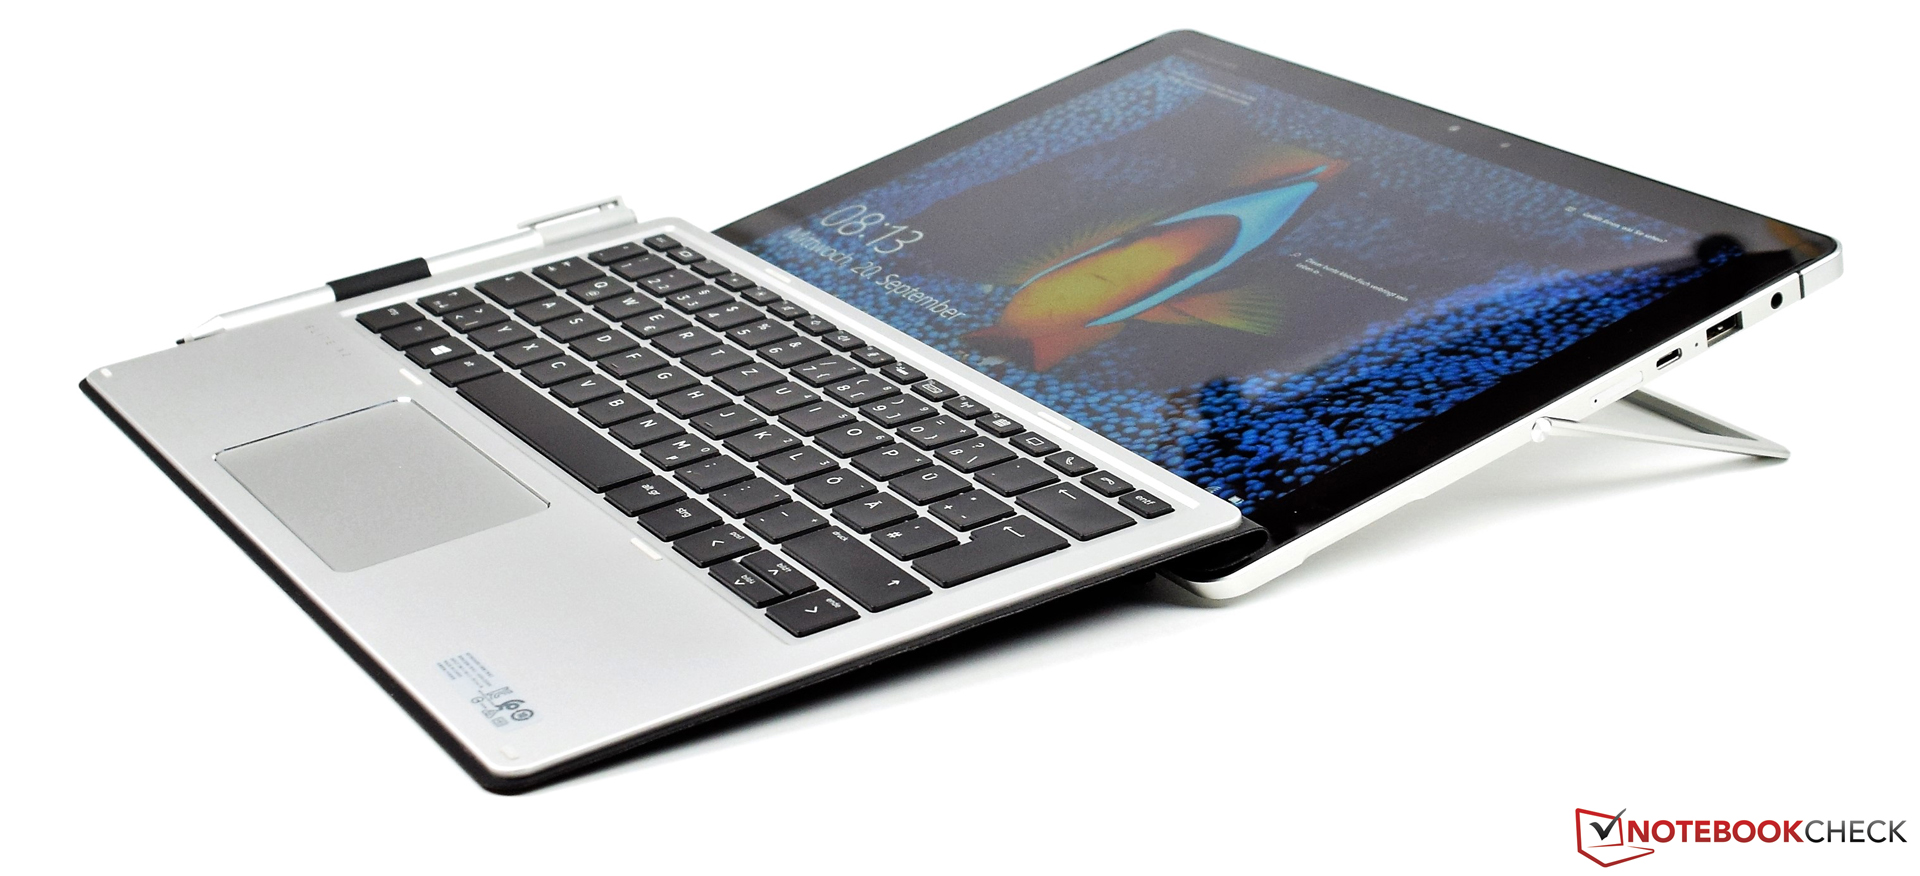
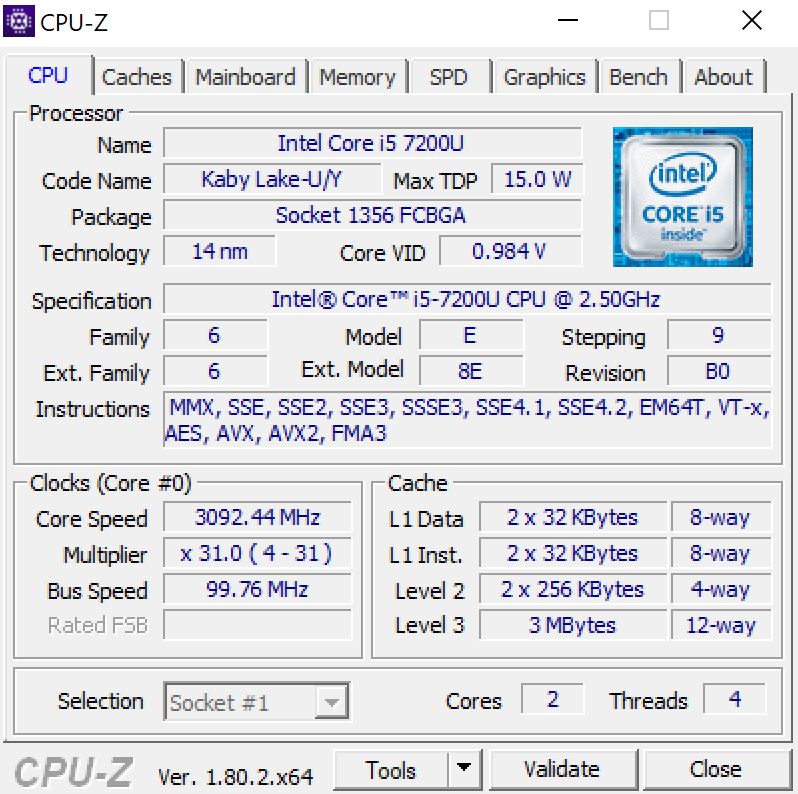
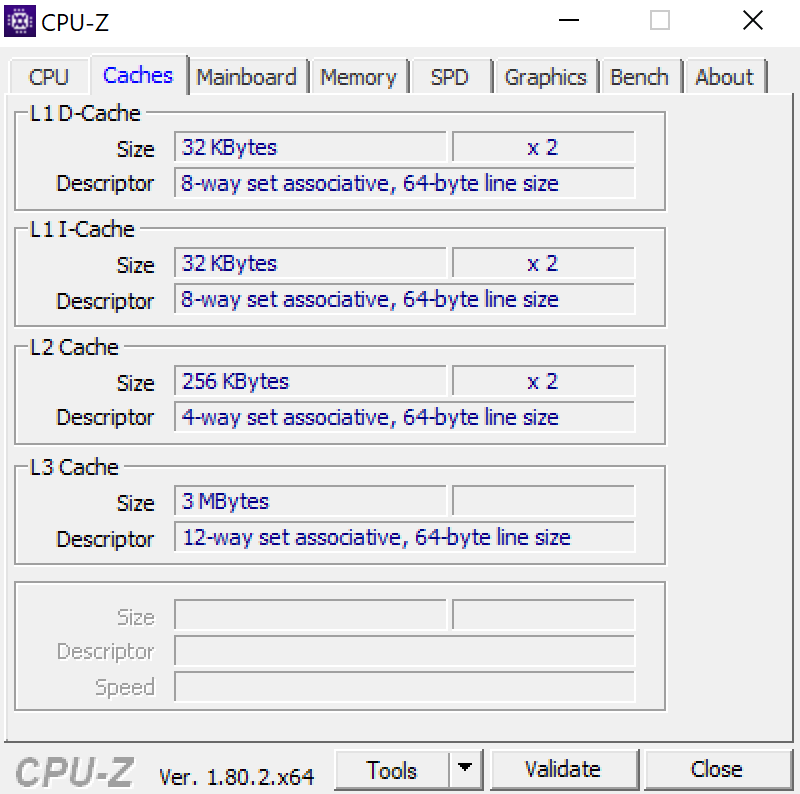
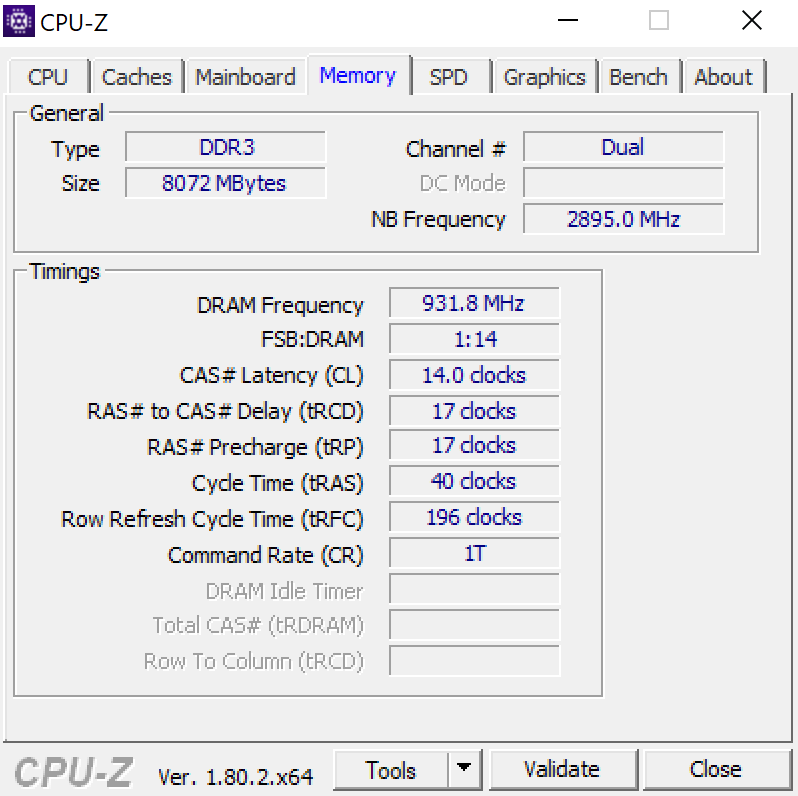
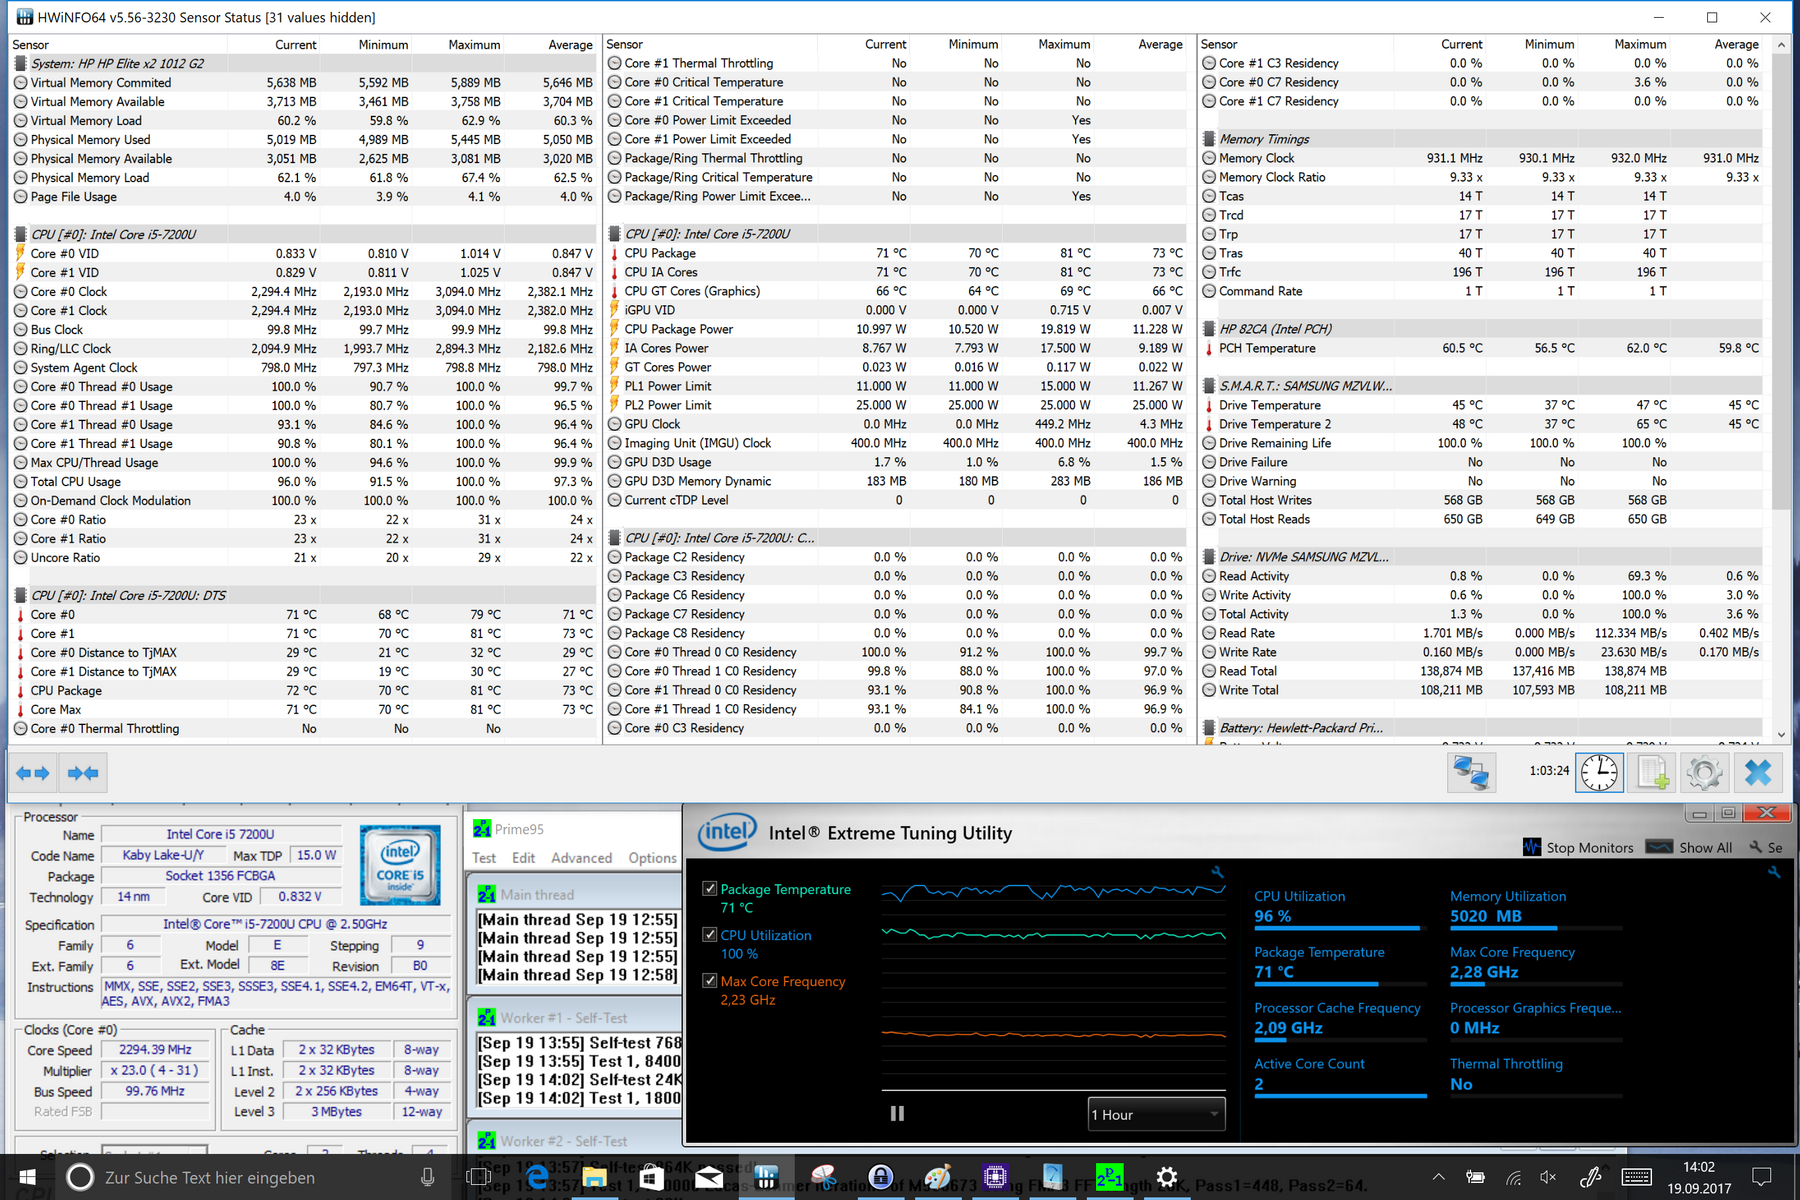
L’Elite x2 1012 G2 de HP est un convertible élégant du secteur pro, et prend le relais du Elite x2 1012 G1. L’élégant design familier est séduisant, et le choix des matériaux donne une sensation de haute qualité à l’utilisateur quand il prend en main l’appareil. Notre version de test coûte 1 720 €, avec un processeur Intel Core i5-7200U rapide et adapté aux exigences professionnelles. Les 8 Go de RAM et le SSD de 256 Go permettent au système d’être fluide.
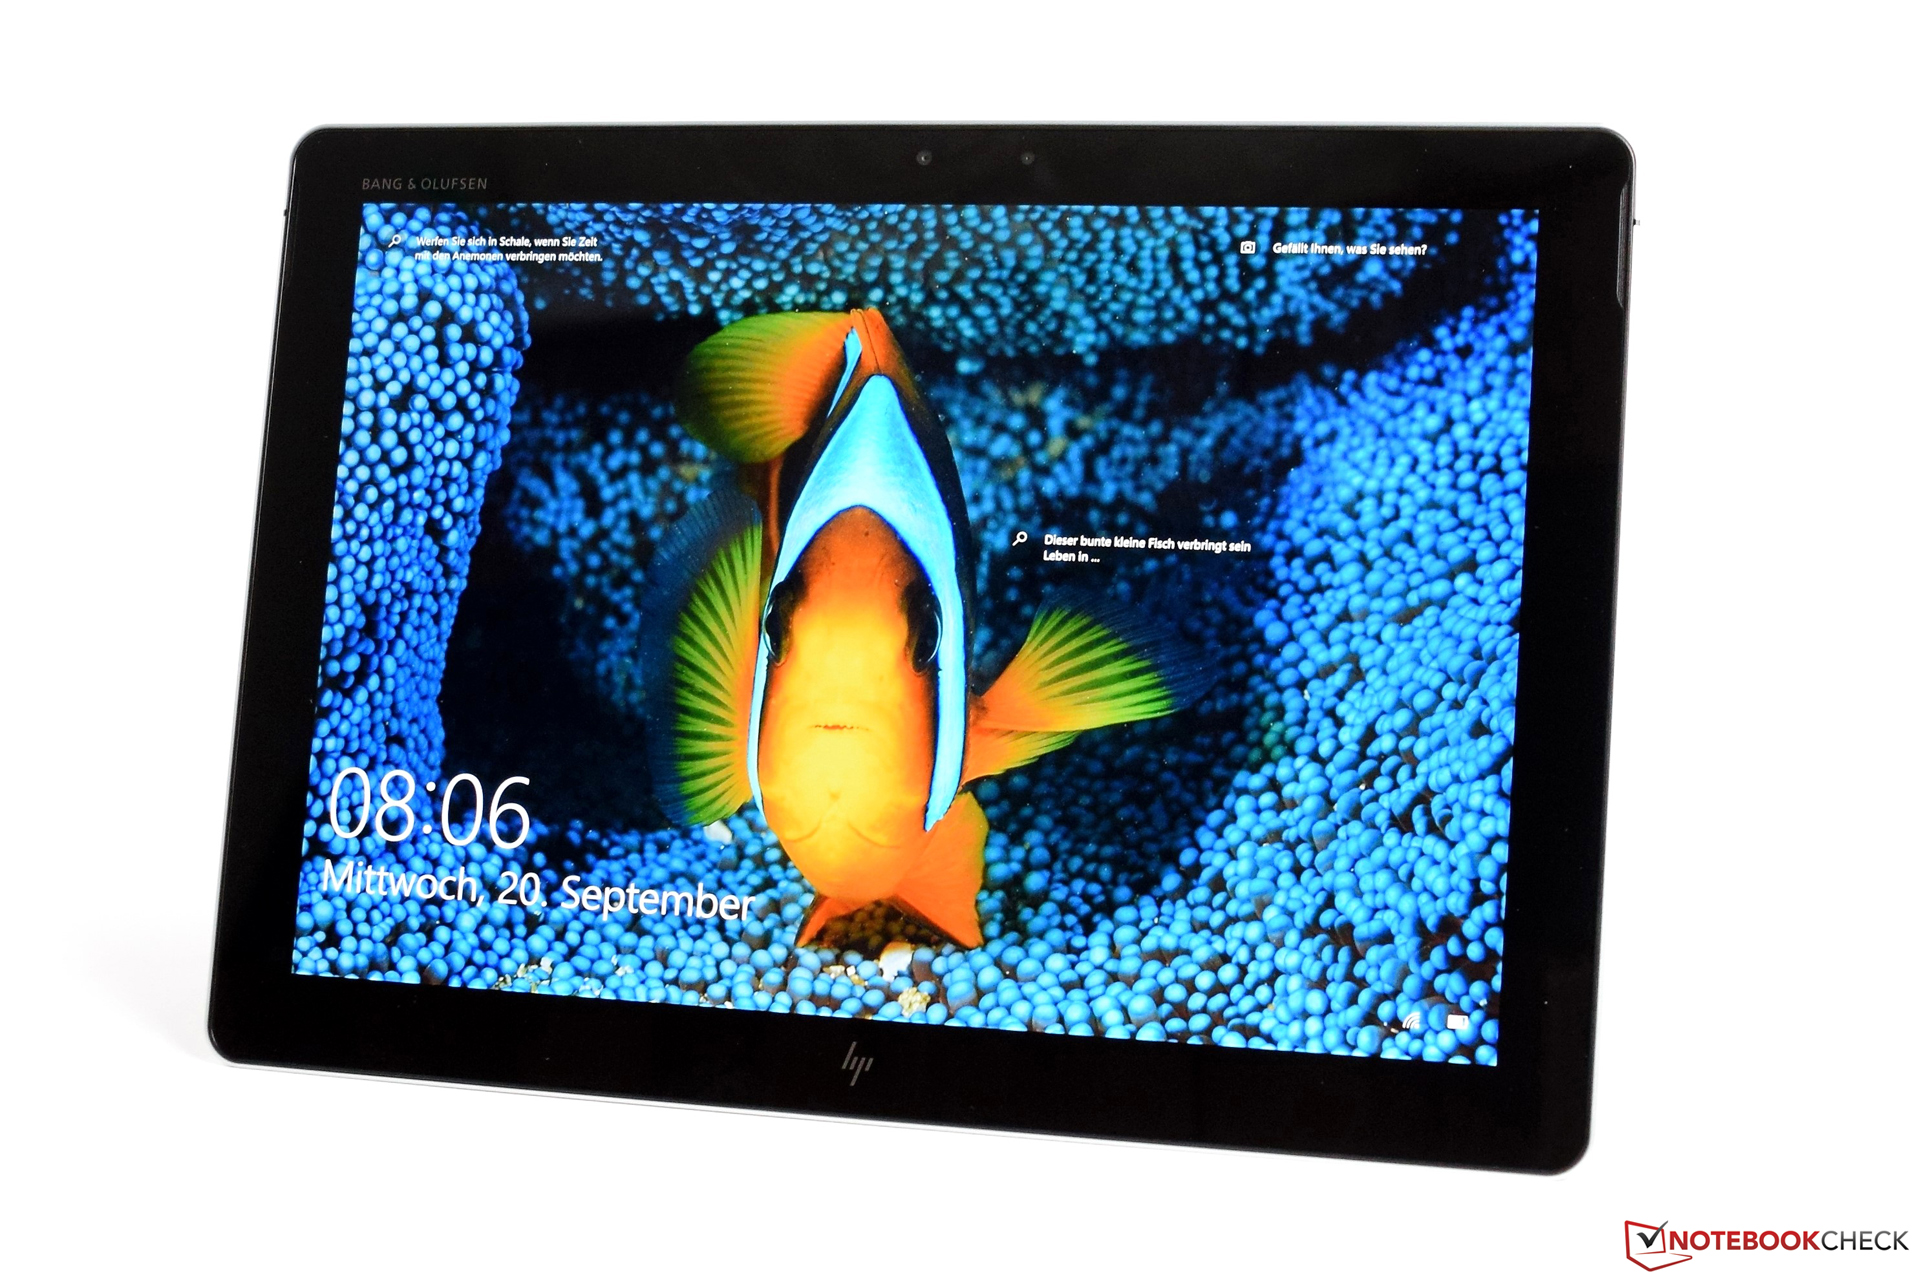
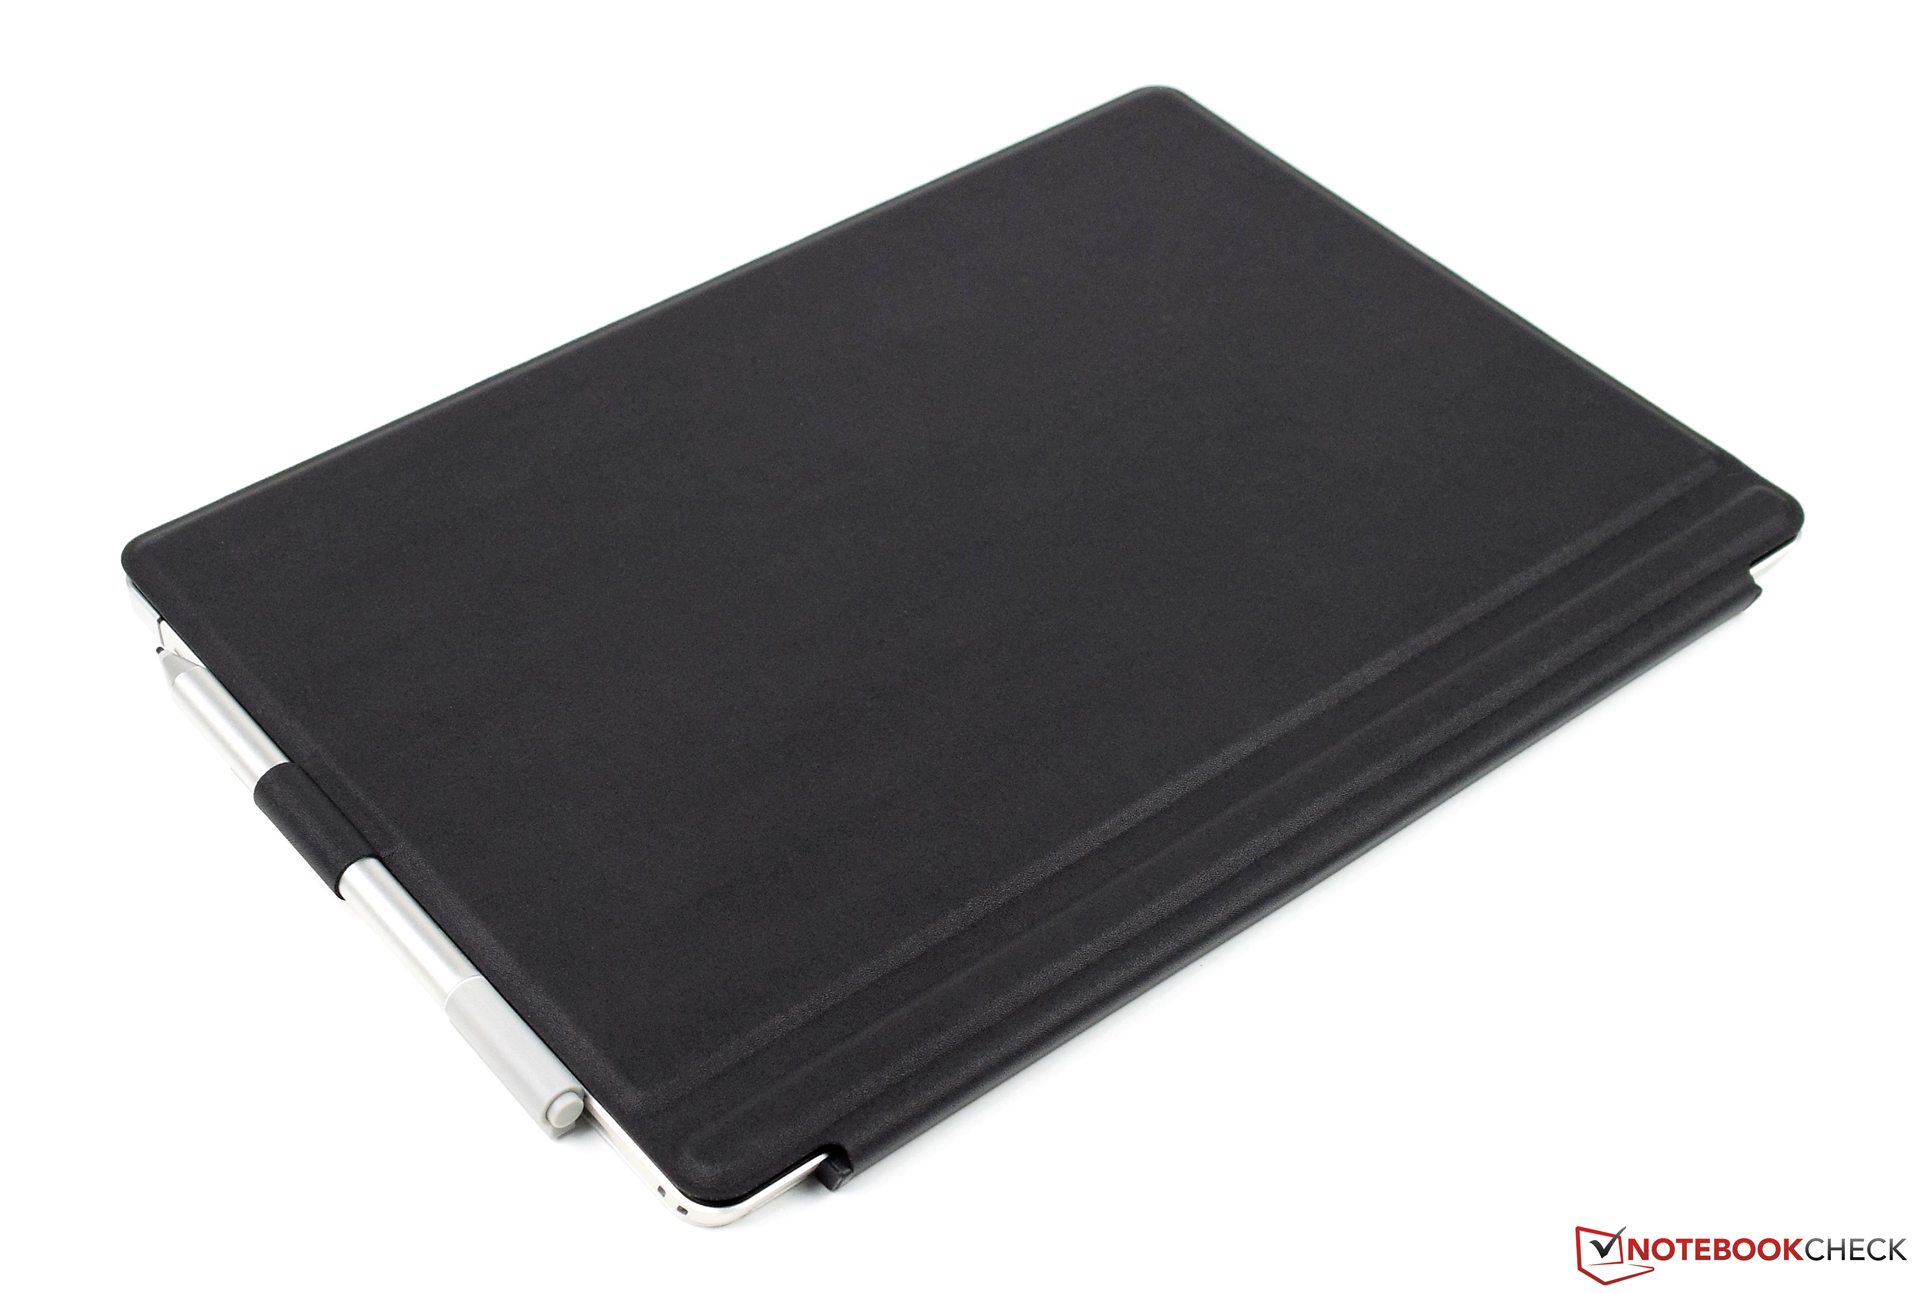
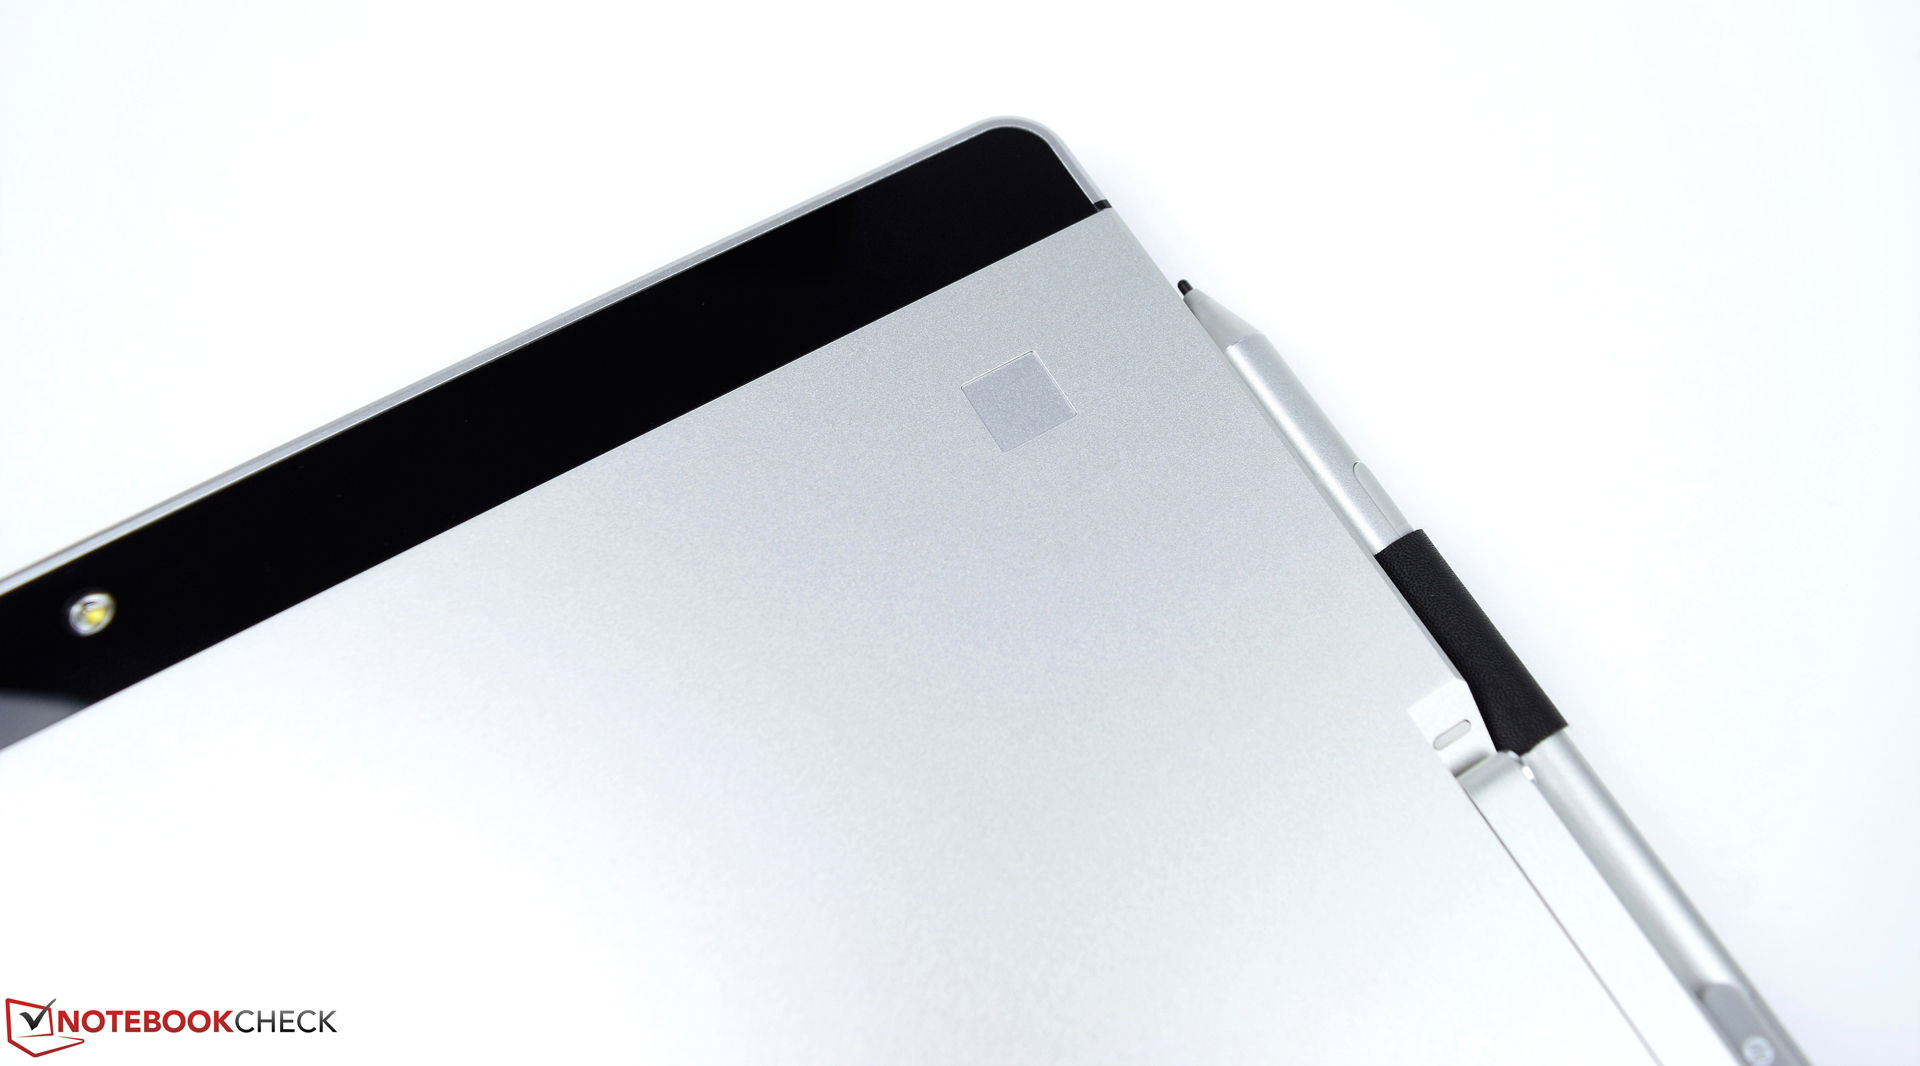
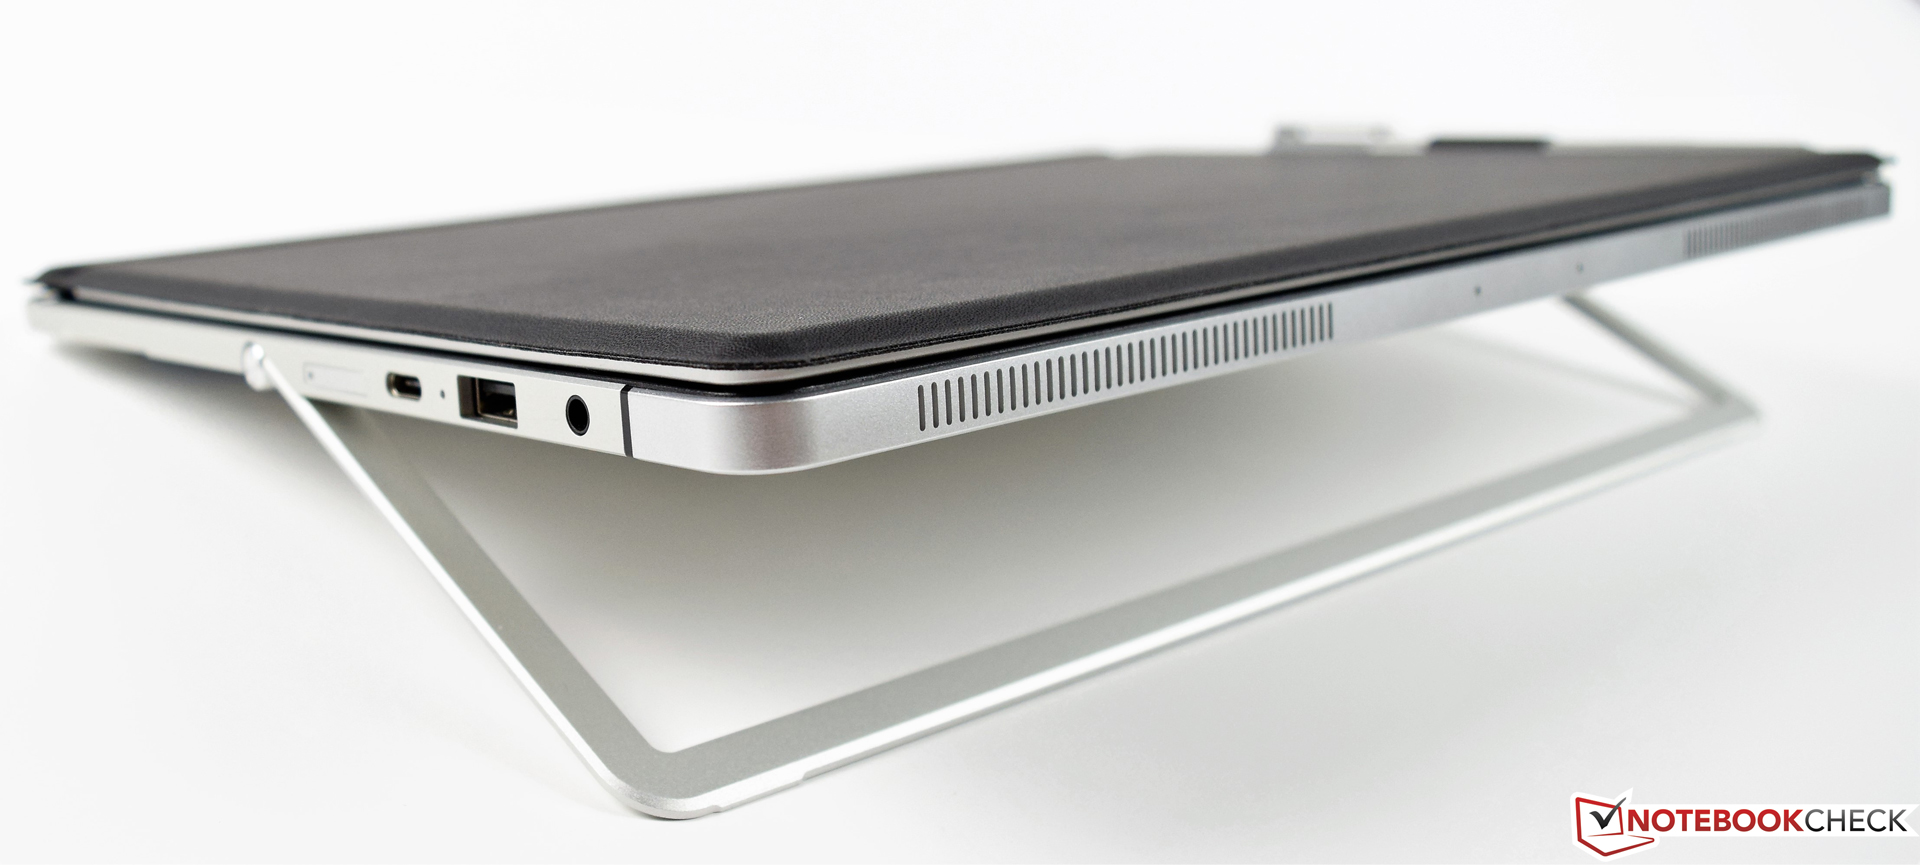
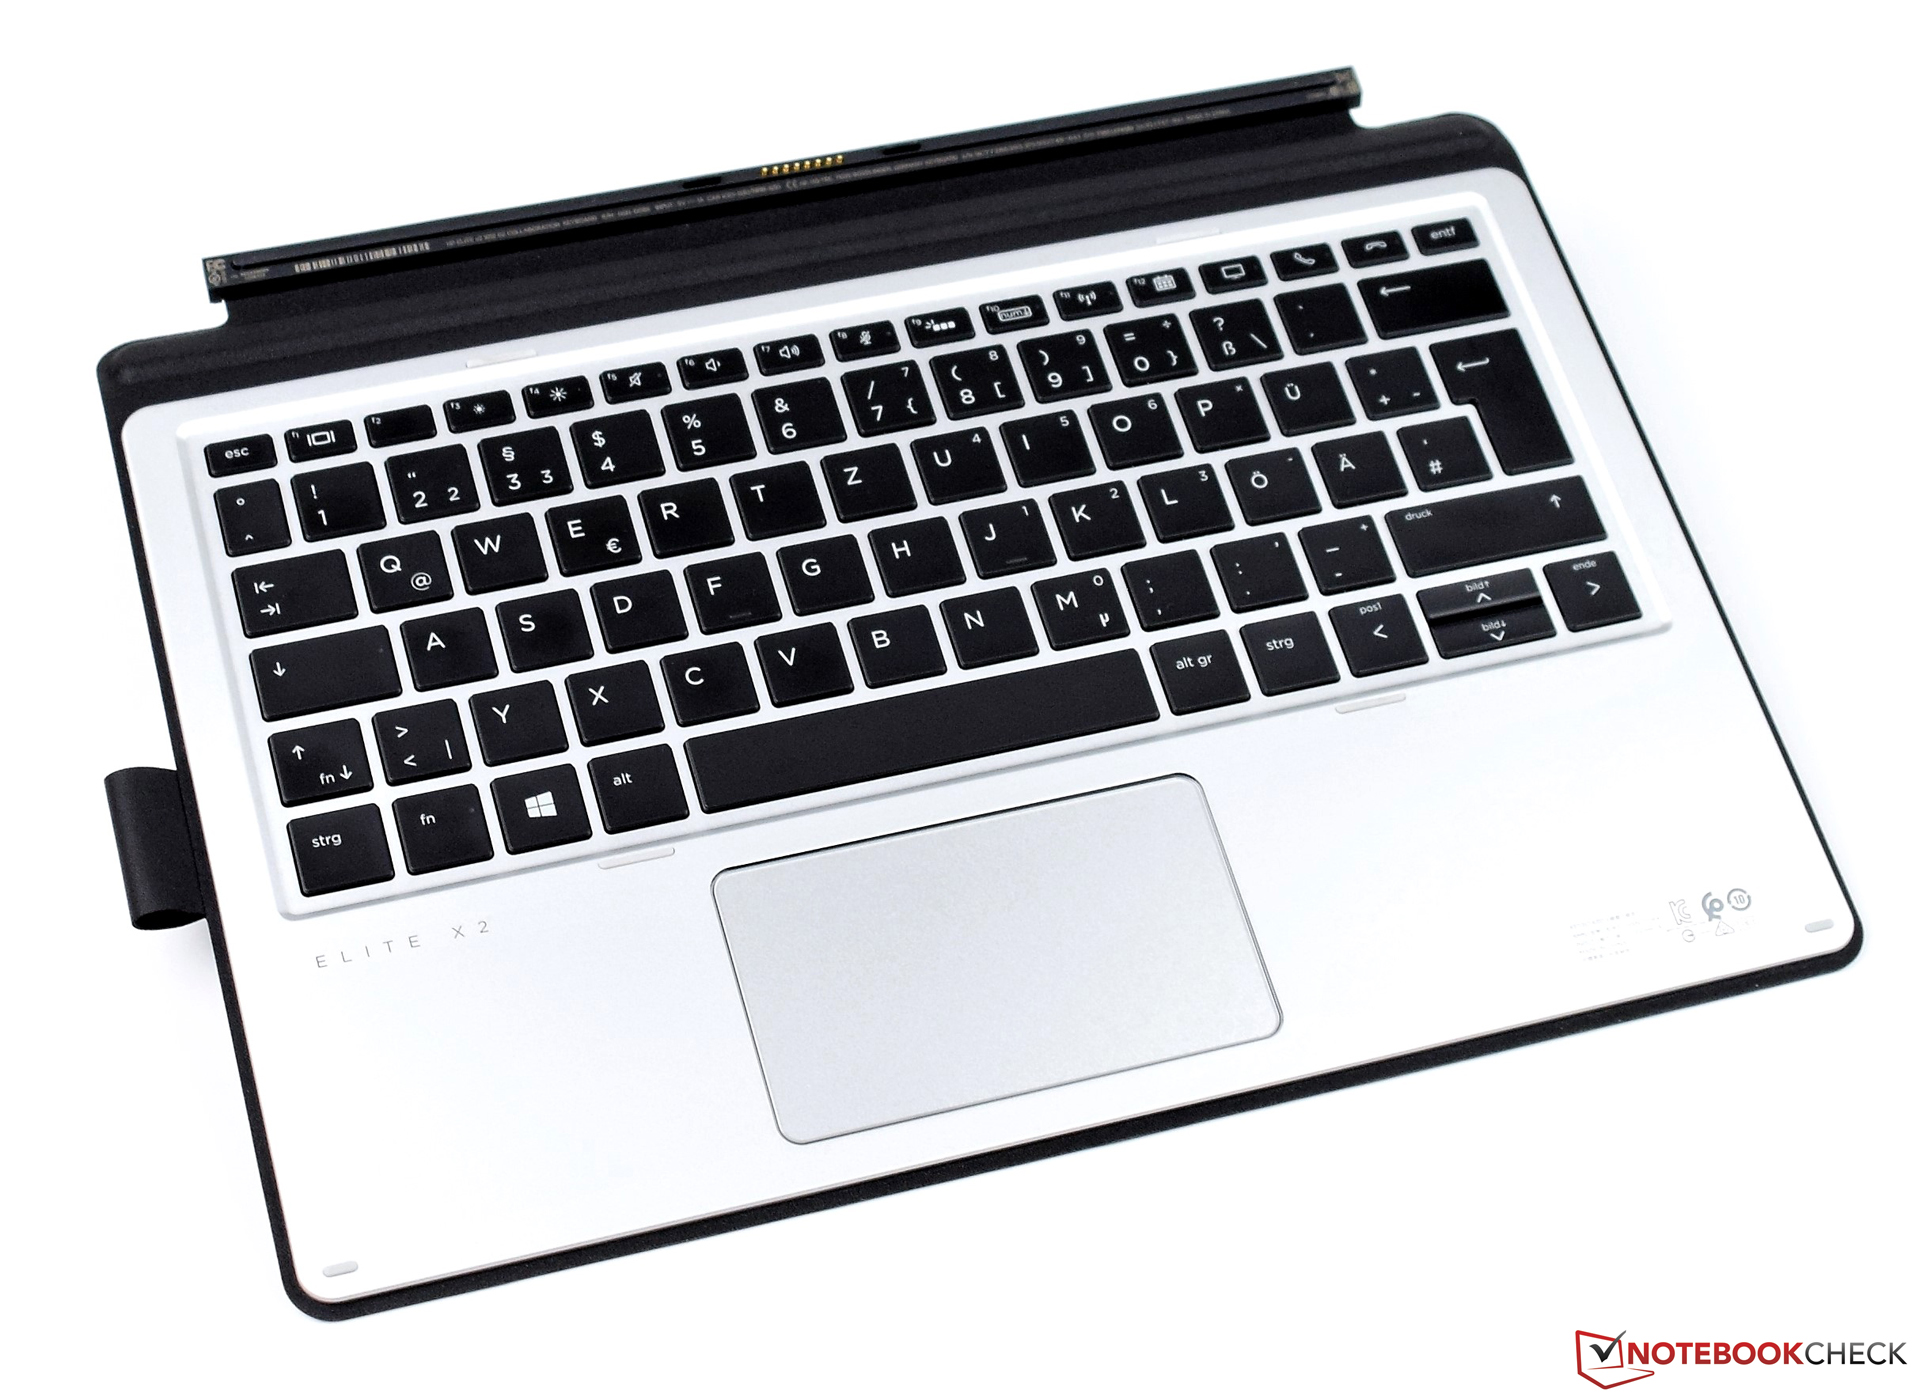
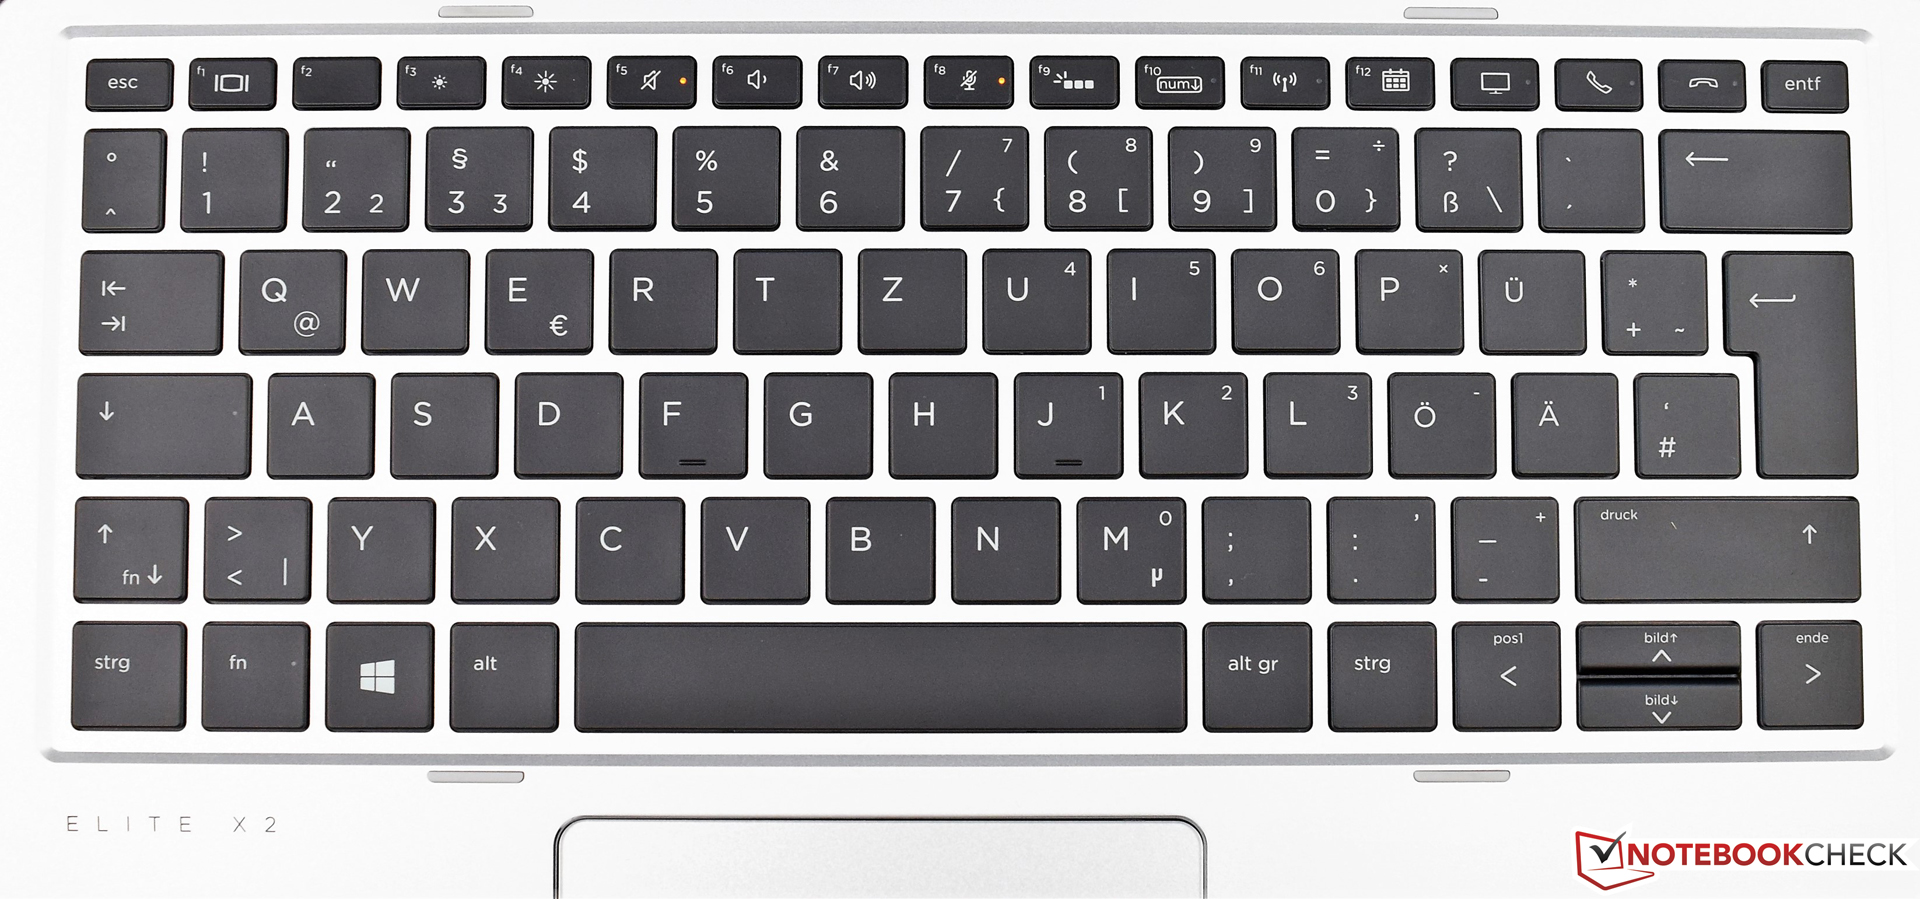
Le HP Elite x2 1012 G2 nous a convaincu grâce à sa construction impeccable est son très bon écran. Des accessoires pratiques, comme le dock clavier ou le stylet actif, multiplient les possibilités d’utilisation et encouragent la productivité.
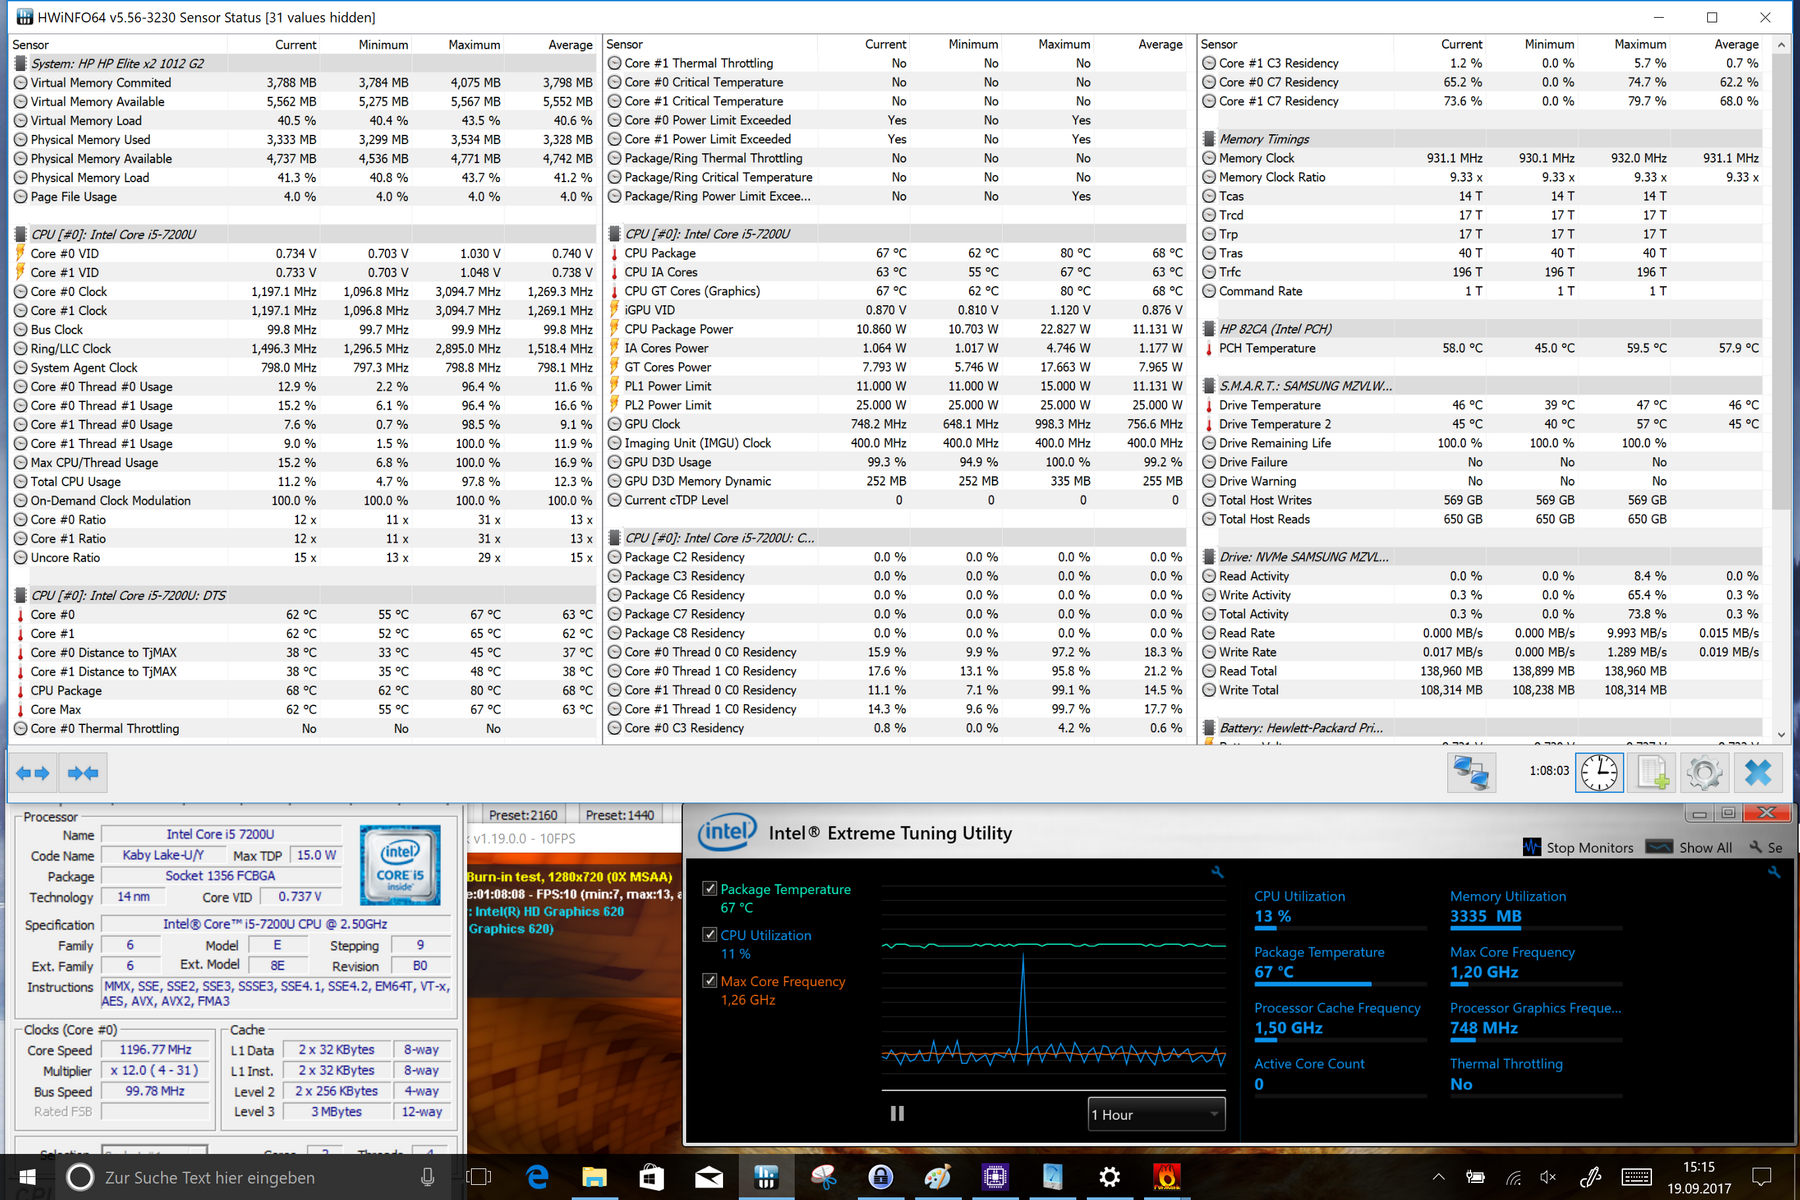
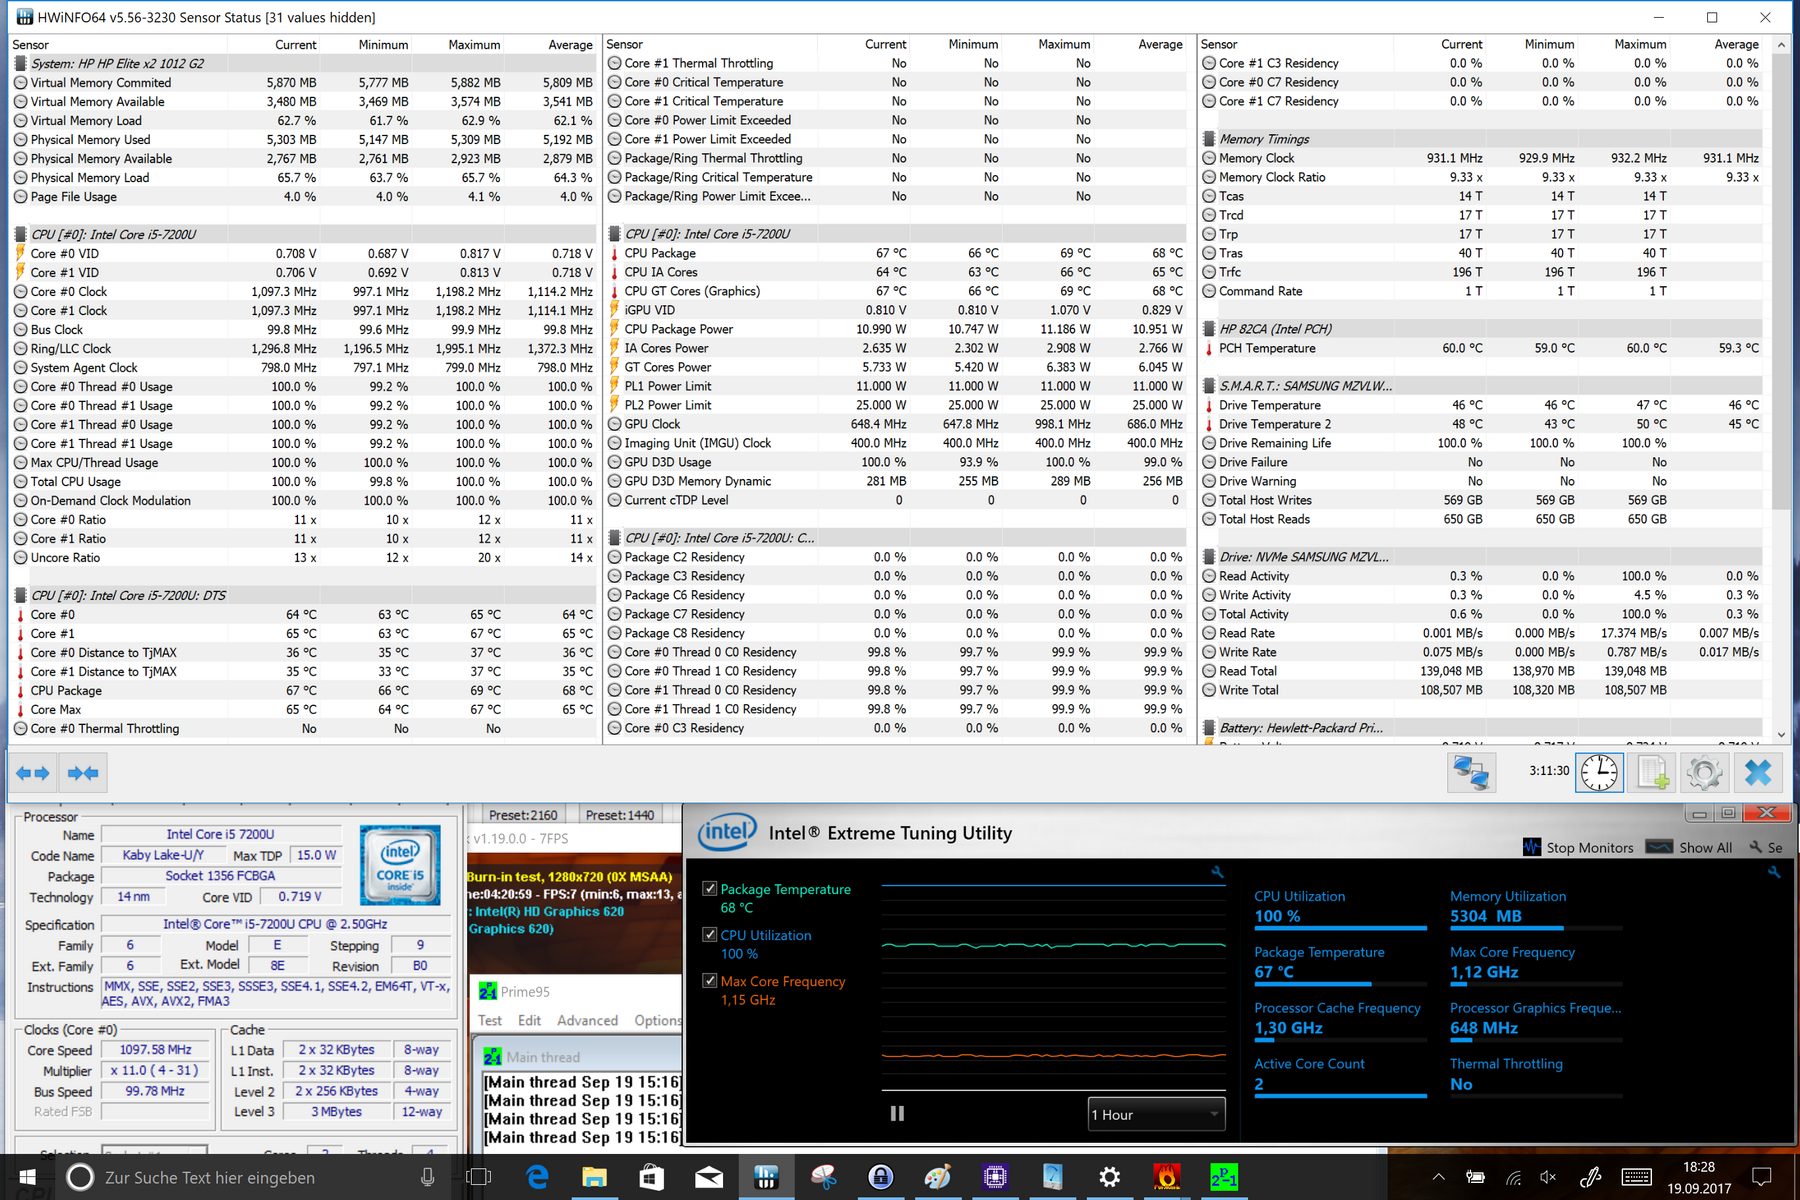
En plus de cette construction impeccable, nous avons apprécié l’écran haut résolution et les accessoires. Les performances sont également d’un bon niveau, même si le système de refroidissement atteint rapidement ses limites en cas de sollicitations continues. De ce fait, cela vaut le coup s’il est vraiment judicieux de choisir le modèle Core i7. HP a clairement réussi à améliorer les performances à tous les niveaux par rapport au prédécesseur.
L’intégralité de cette critique est disponible en anglais en suivant ce lien.
HP Elite x2 1012 G2-1LV76EA
- 09/22/2017 v6 (old)
Sebastian Bade