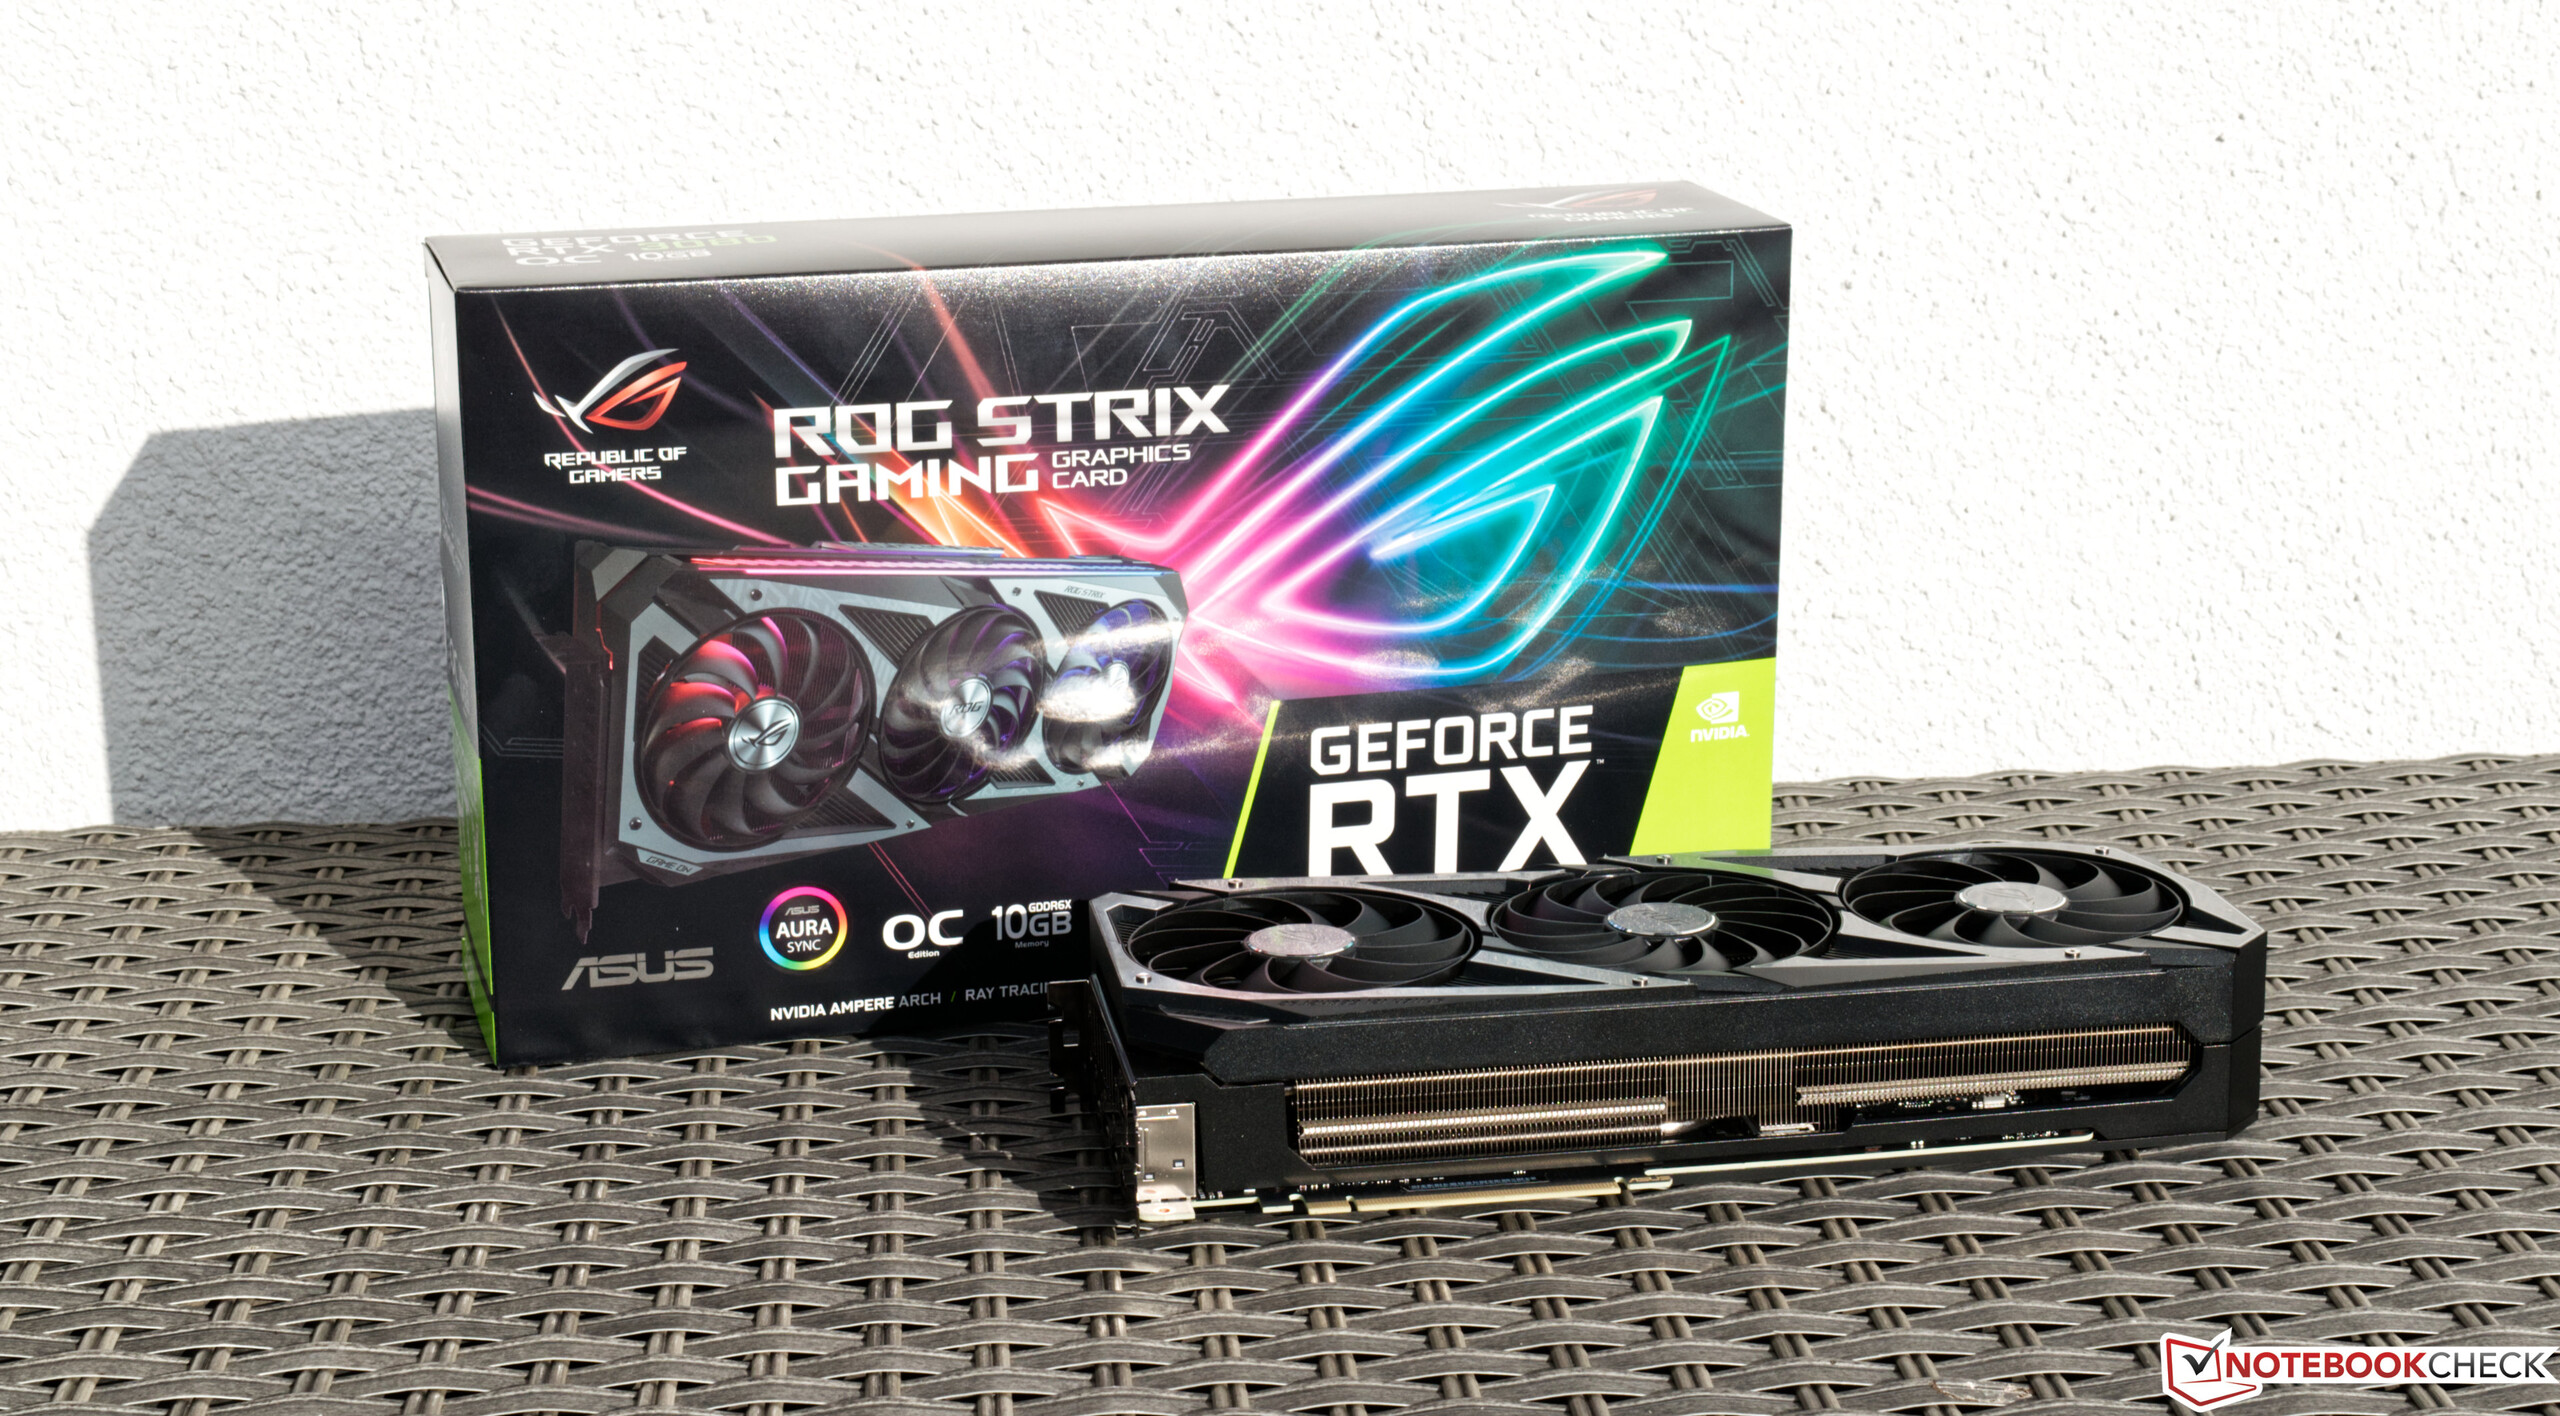
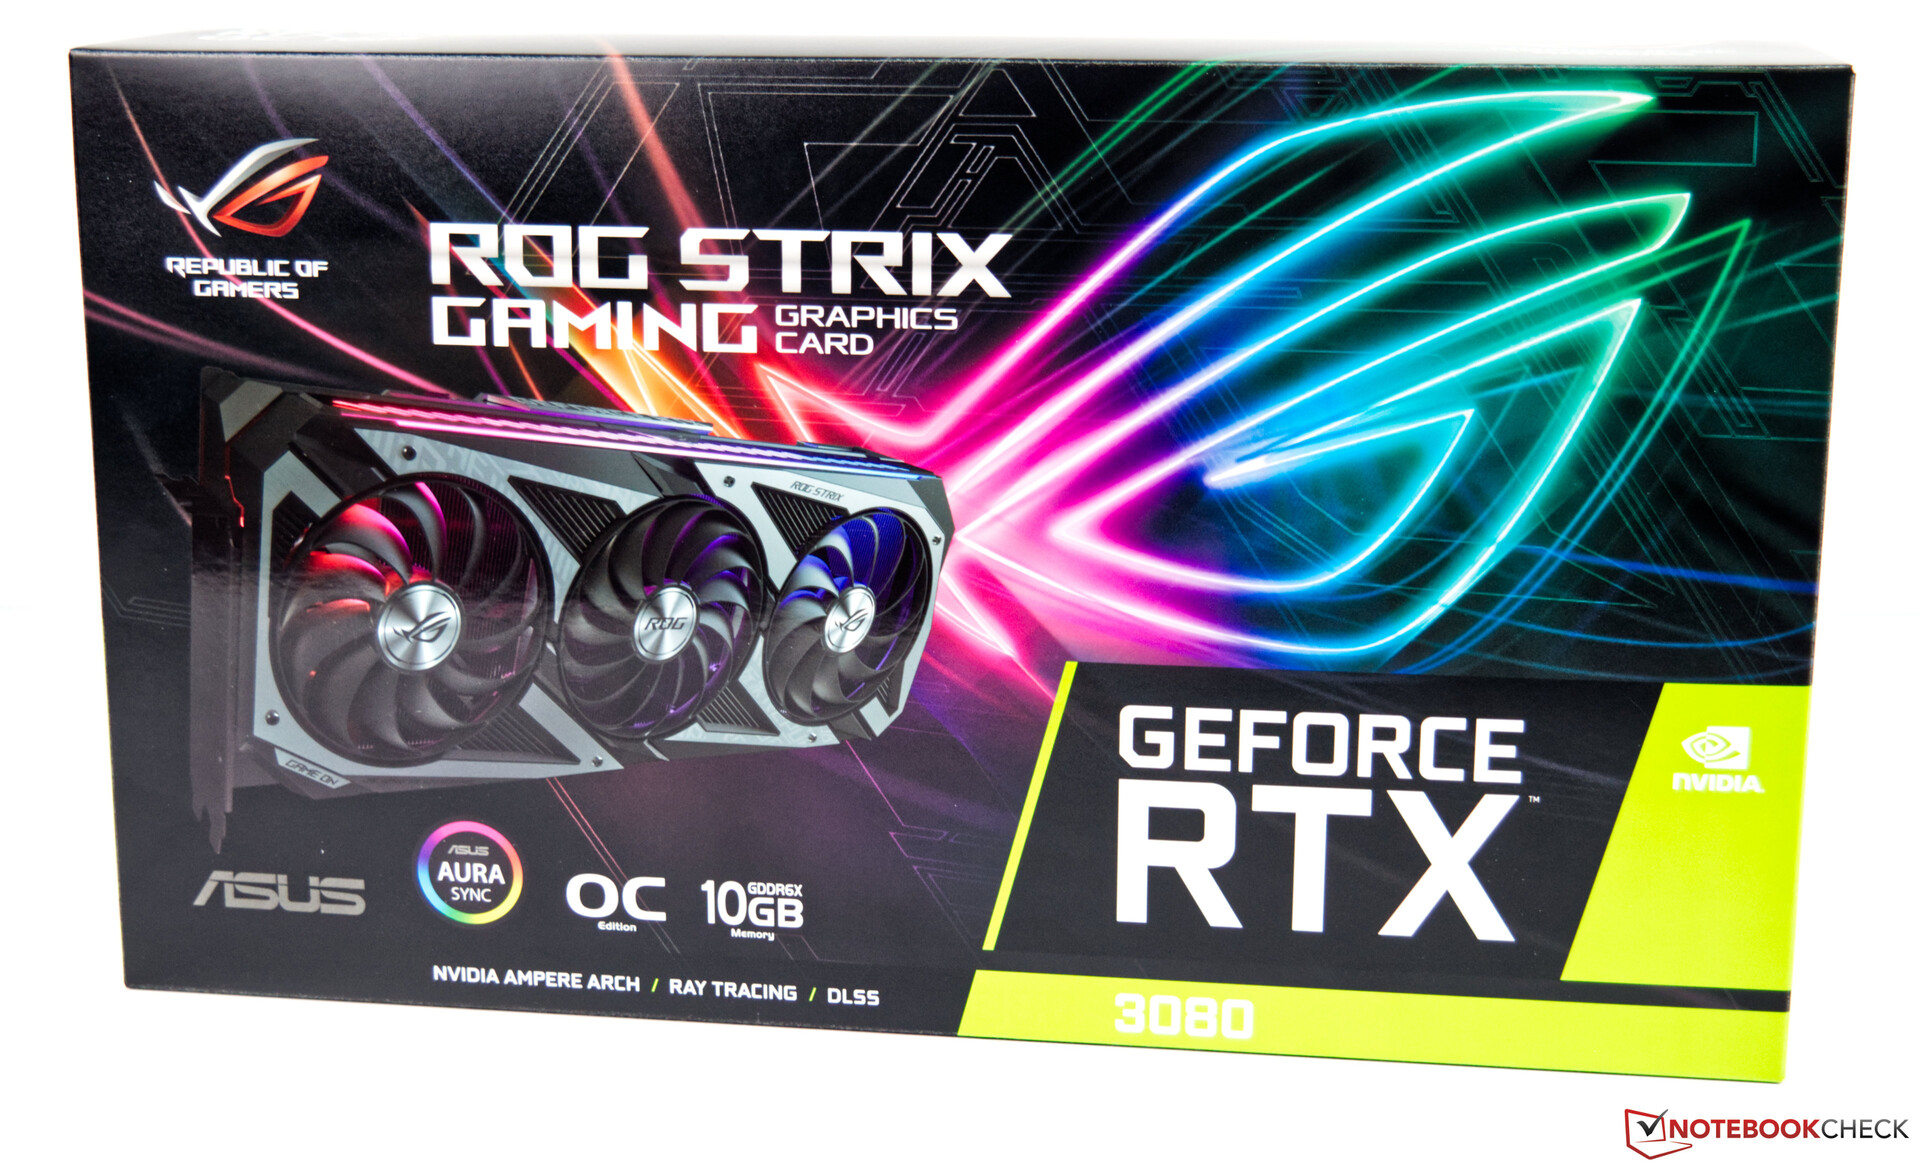
Test de la carte graphique de bureau Asus GeForce RTX 3080 ROG Strix Gaming OC

Le segment des serveurs a commencé à bénéficier de la nouvelle architecture Ampère des cartes graphiques Nvidia plus tôt en 2020. Environ six mois plus tard, les modèles grand public ont suivi, ce qui devrait apporter une bouffée d'air frais au marché des cartes graphiques de bureau. Cependant, après l'introduction de la nouvelle série RTX 3000, le désenchantement a été très grand, car le grand nombre de commandes n'a pas pu et ne peut toujours pas être entièrement couvert
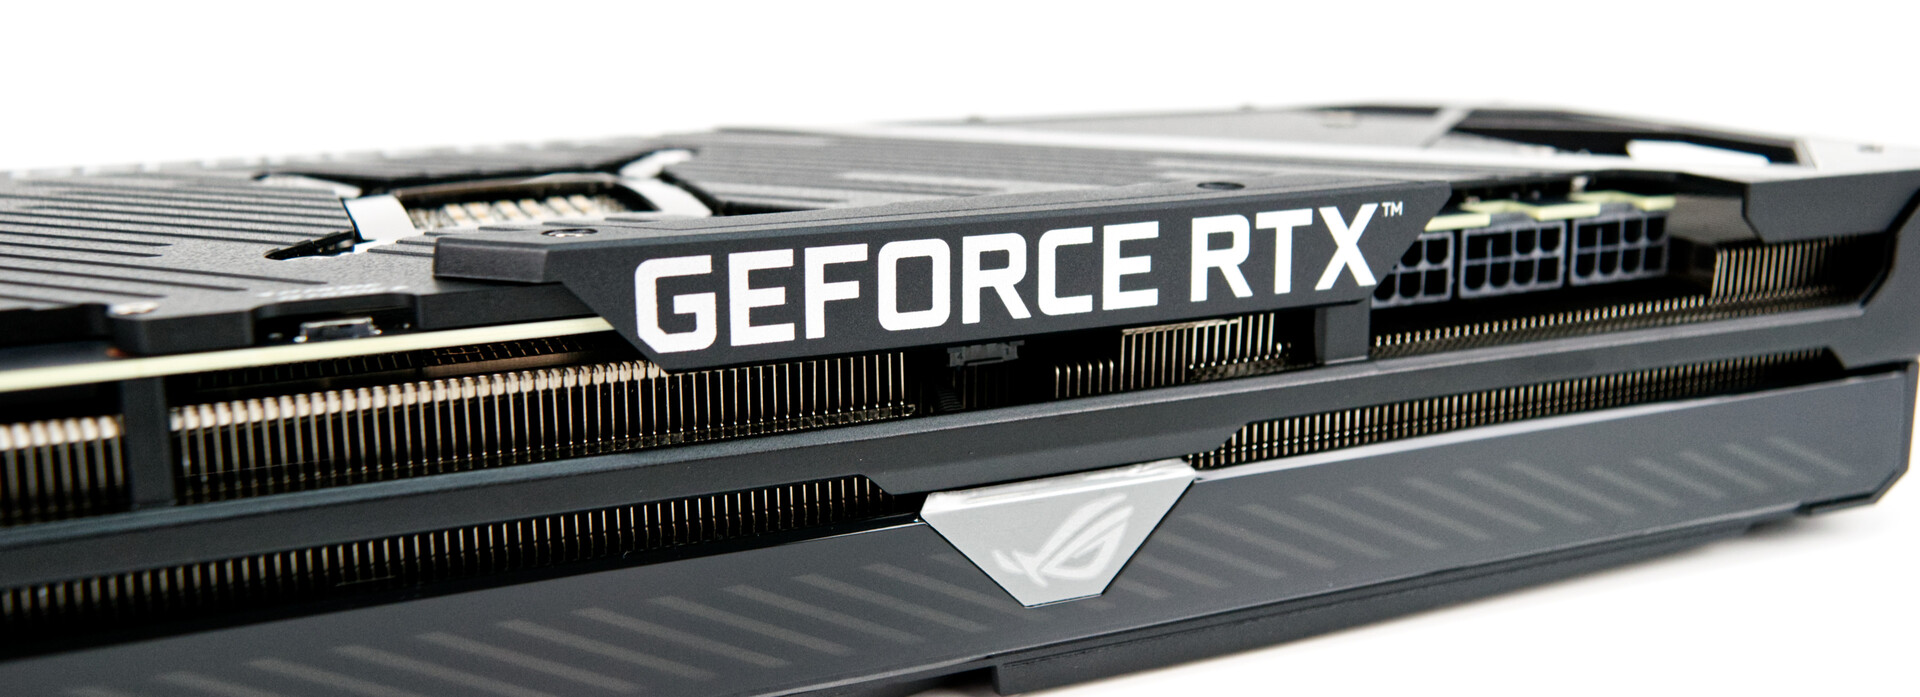
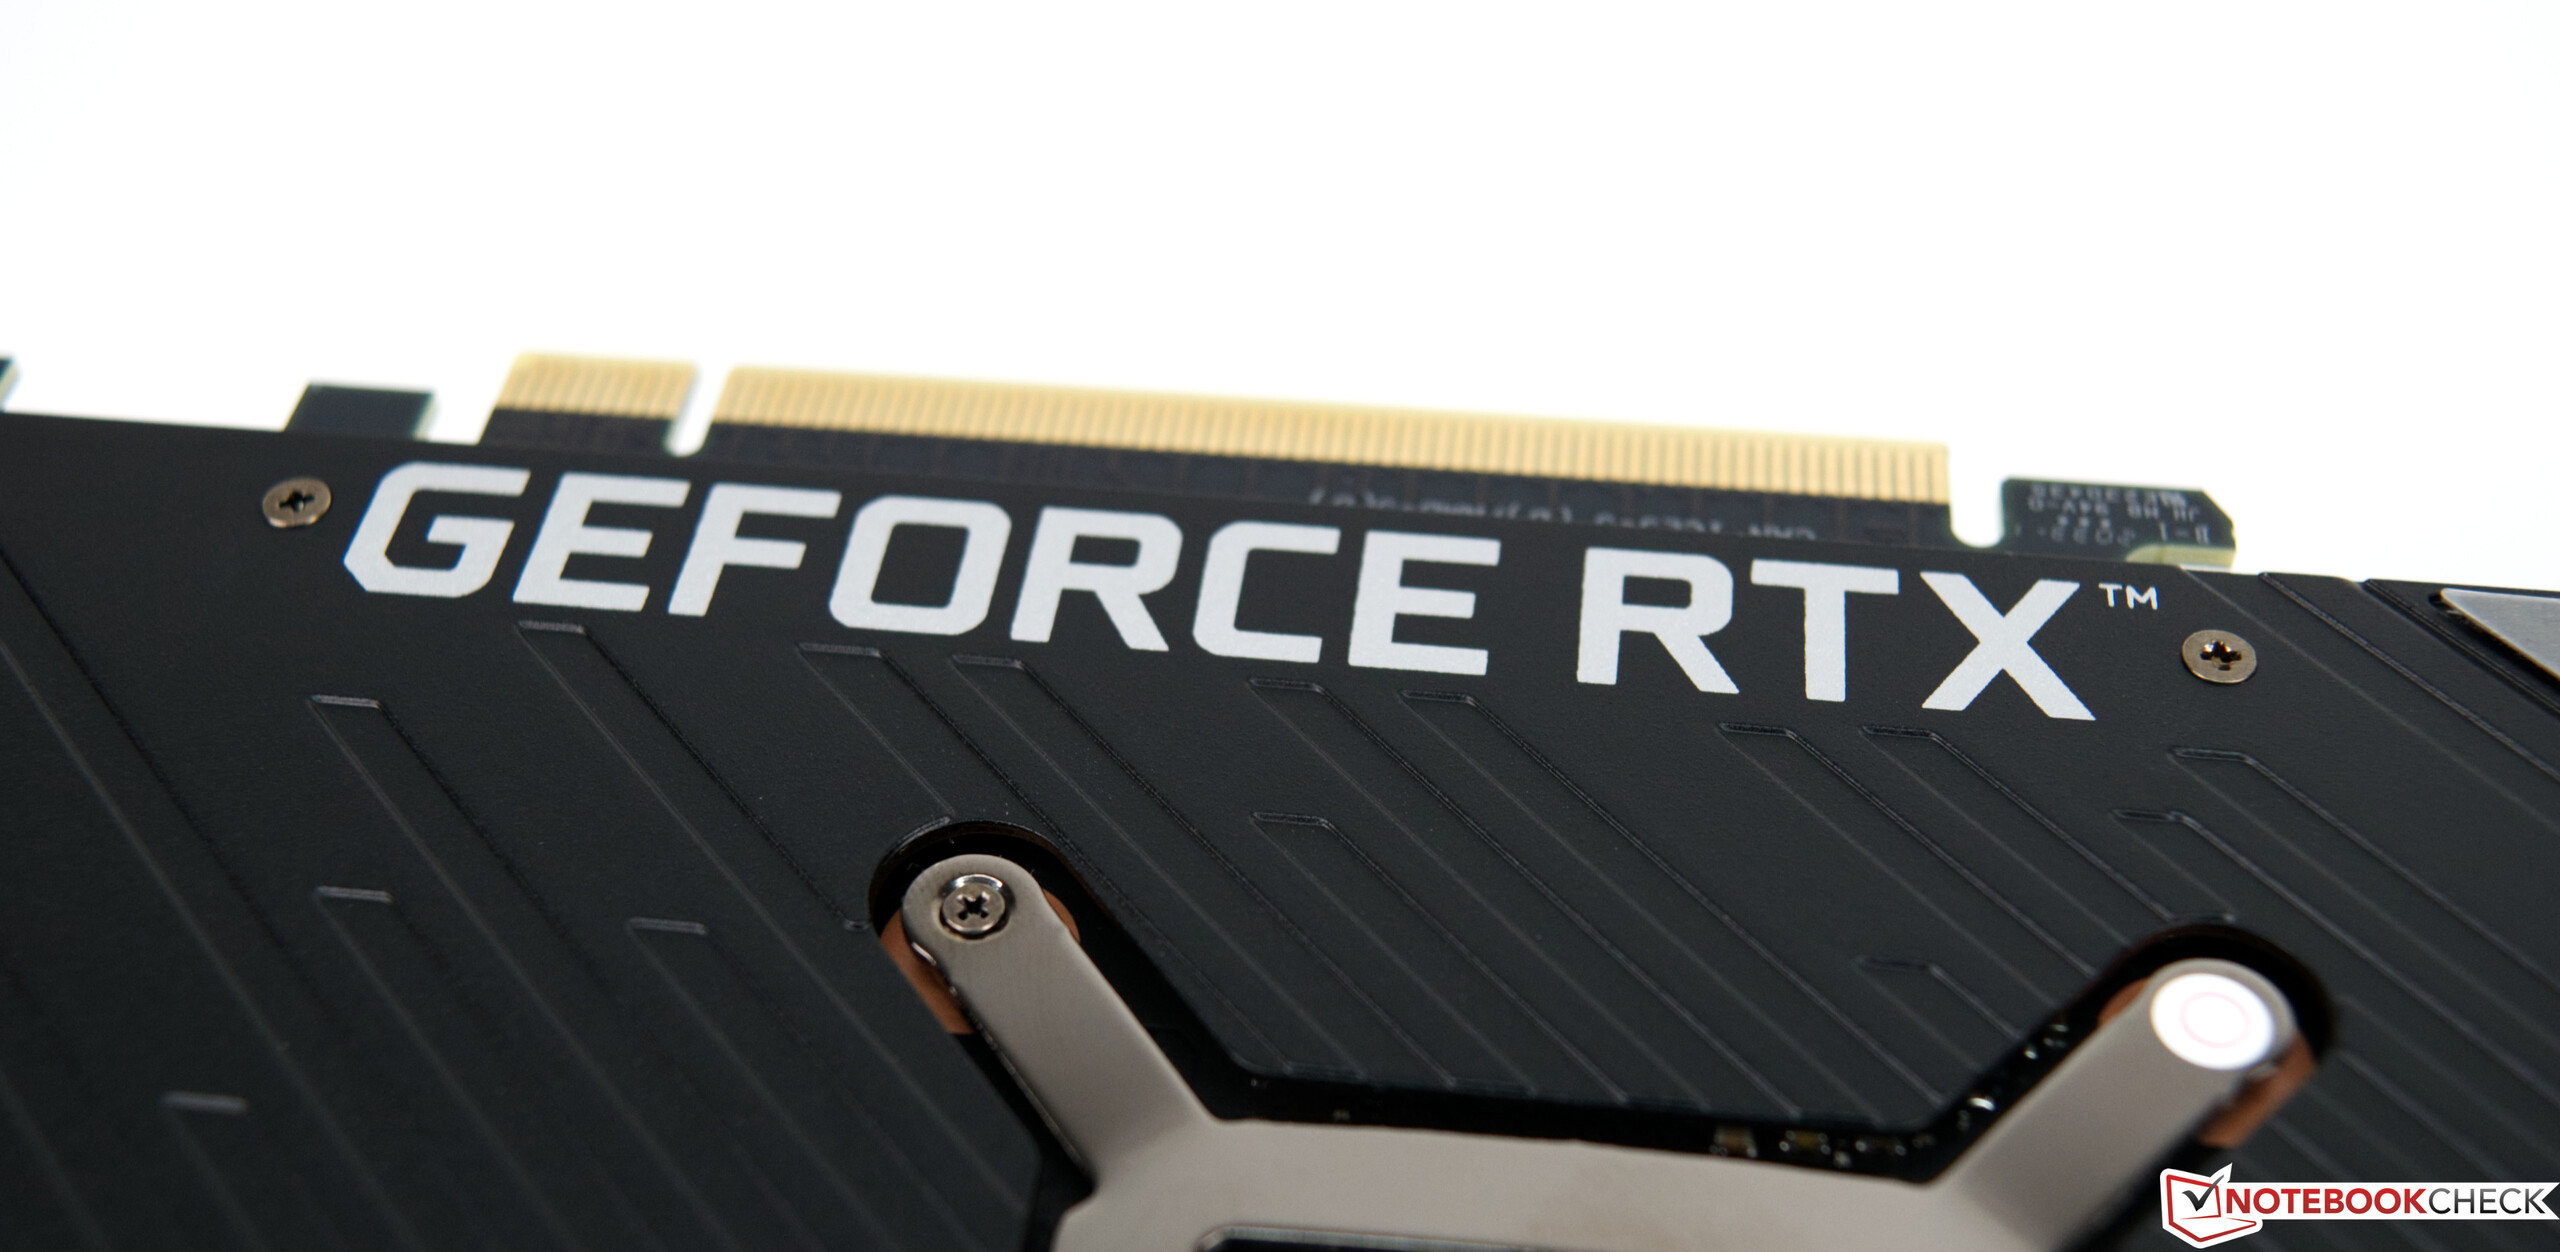
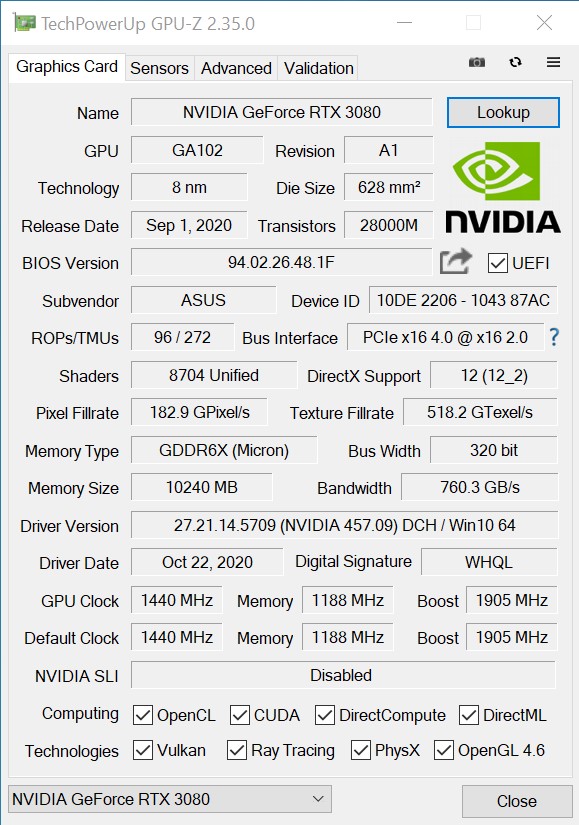
Ceux qui ont réussi à obtenir un modèle des nouvelles cartes graphiques Nvidia seront récompensés par de très bonnes performances tout au long du processus ; nous pouvons le révéler bien avant. Pour cet examen, cependant, nous avons reçu un échantillon de test d'Asus, qui diffère sensiblement de l'édition des fondateurs. Mais rien n'a changé en ce qui concerne la base de la puce GA102 Ampère. Il en va de même pour la VRAM, qui est identique à 10 Go GDDR6X sur tous les modèles RTX 3080. Asus accorde cependant une marge de manœuvre un peu plus grande à la GeForce RTX 3080 ROG Strix Gaming OC en matière de boosting - elle est de presque 200 MHz par rapport à la Founders Edition de Nvidia.
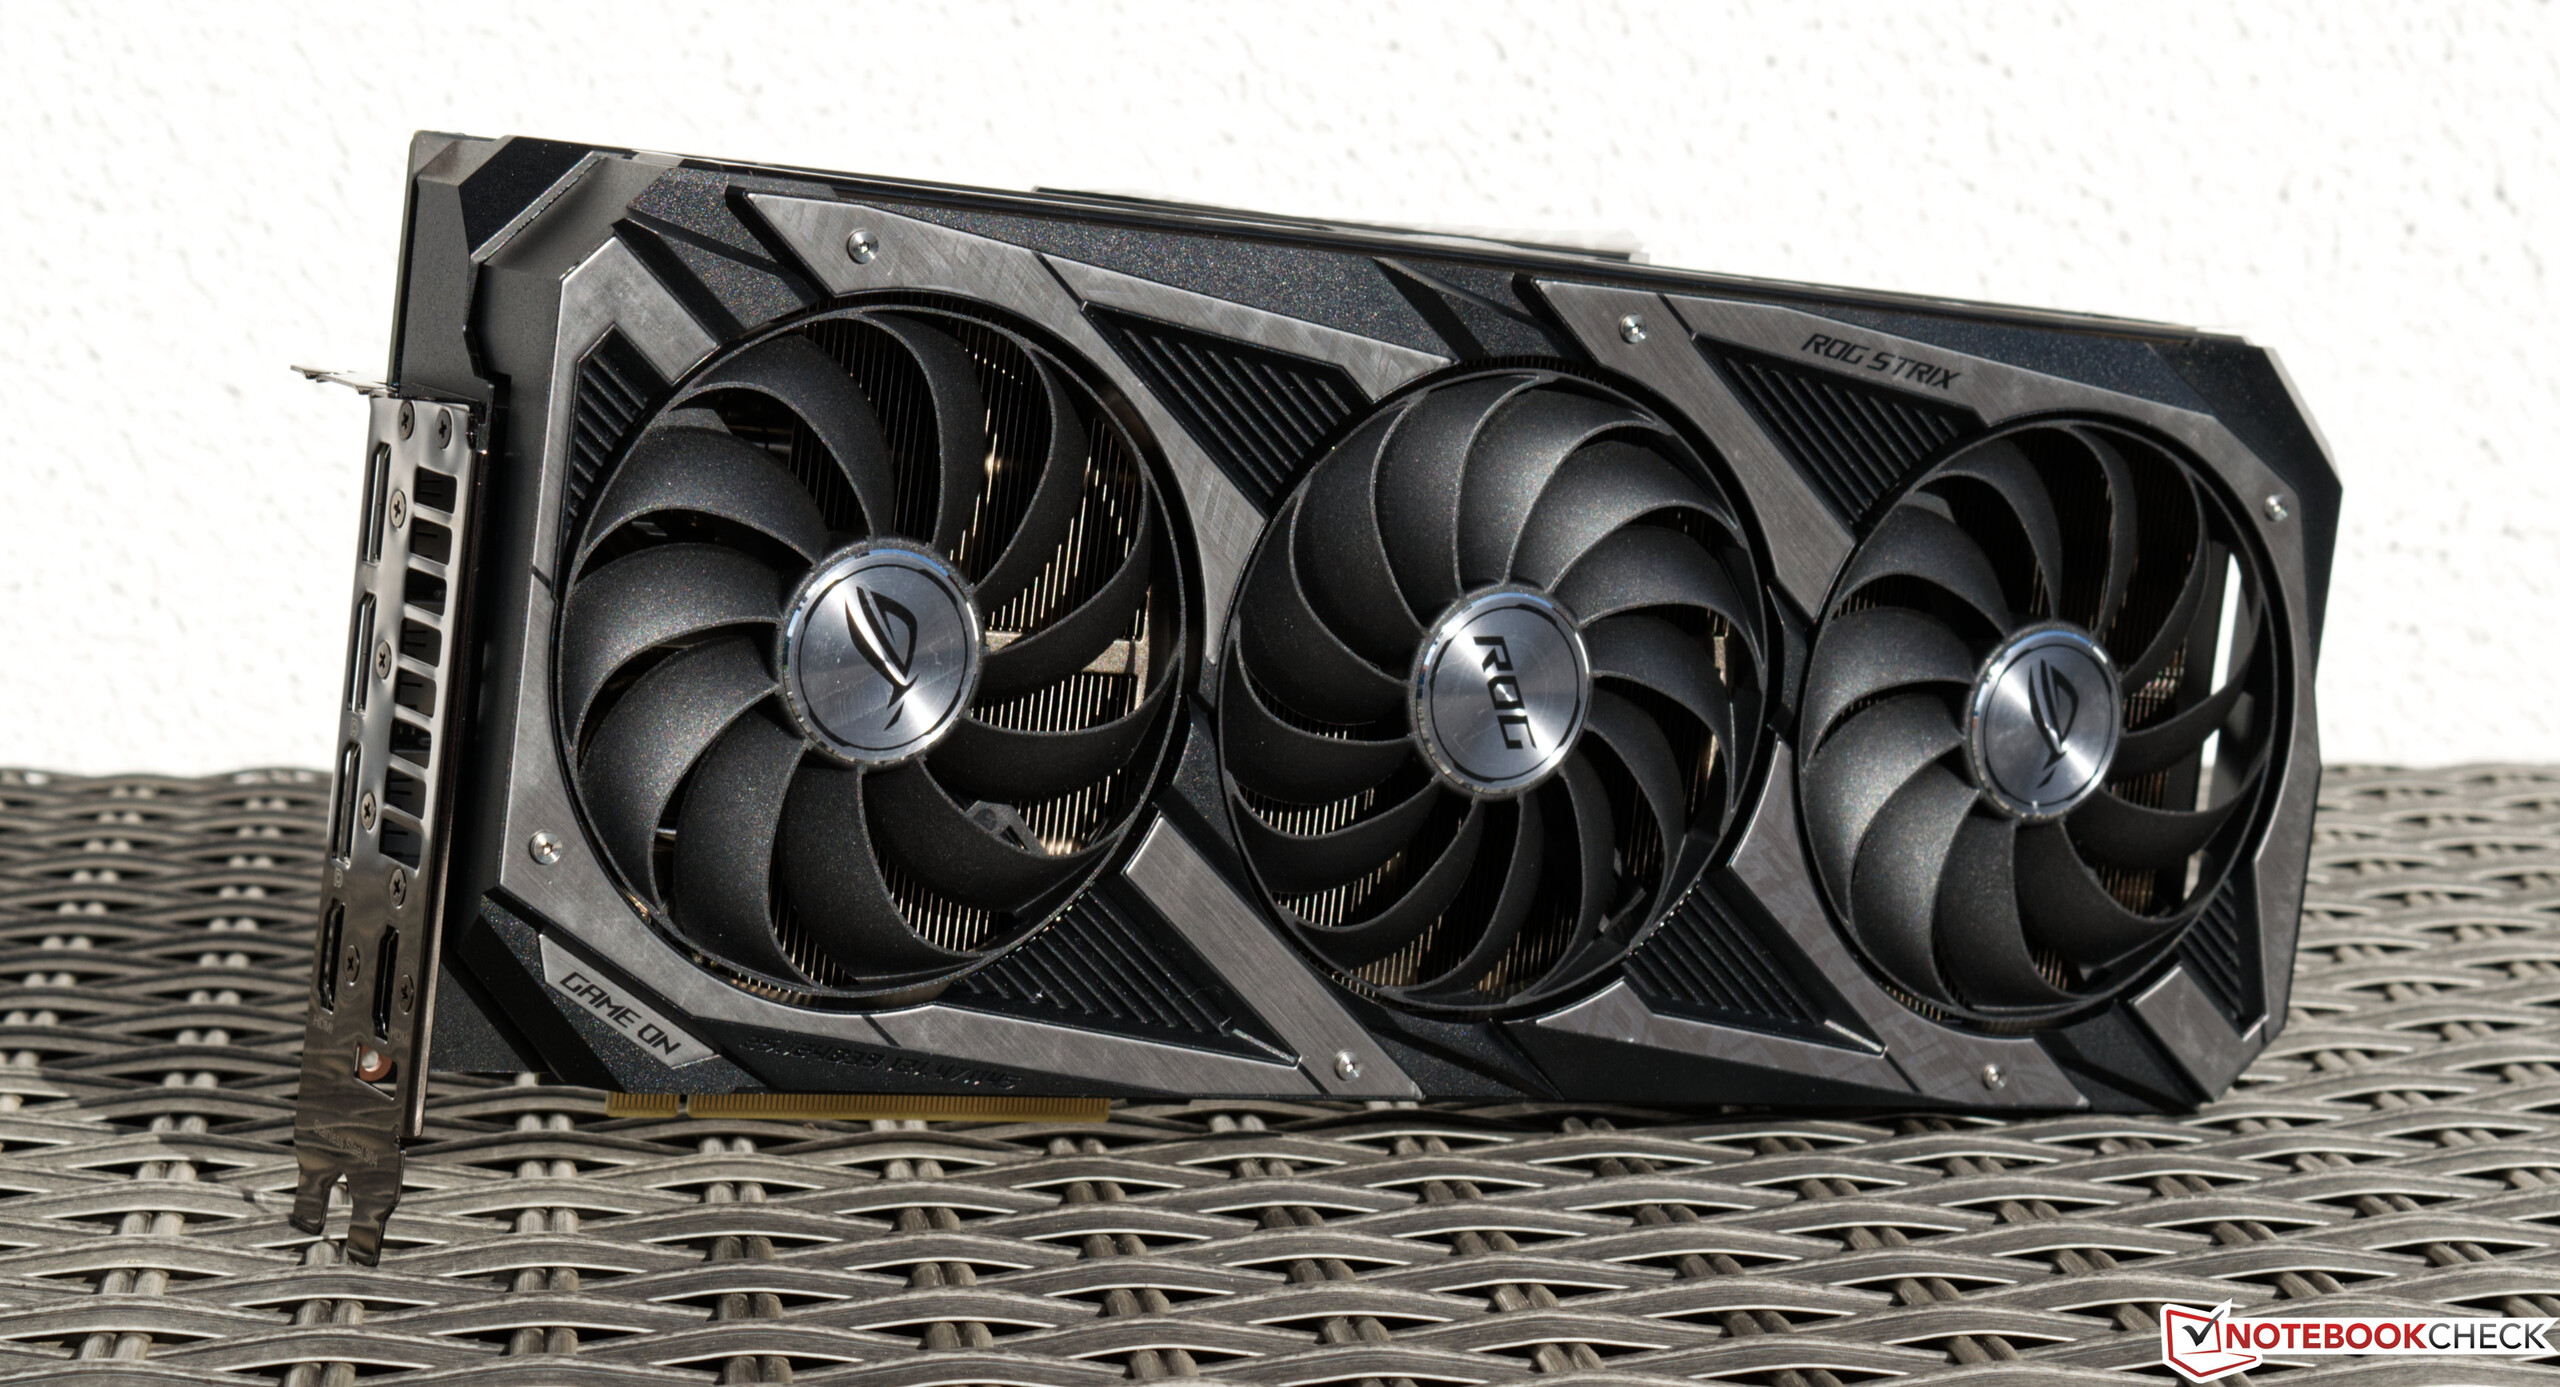
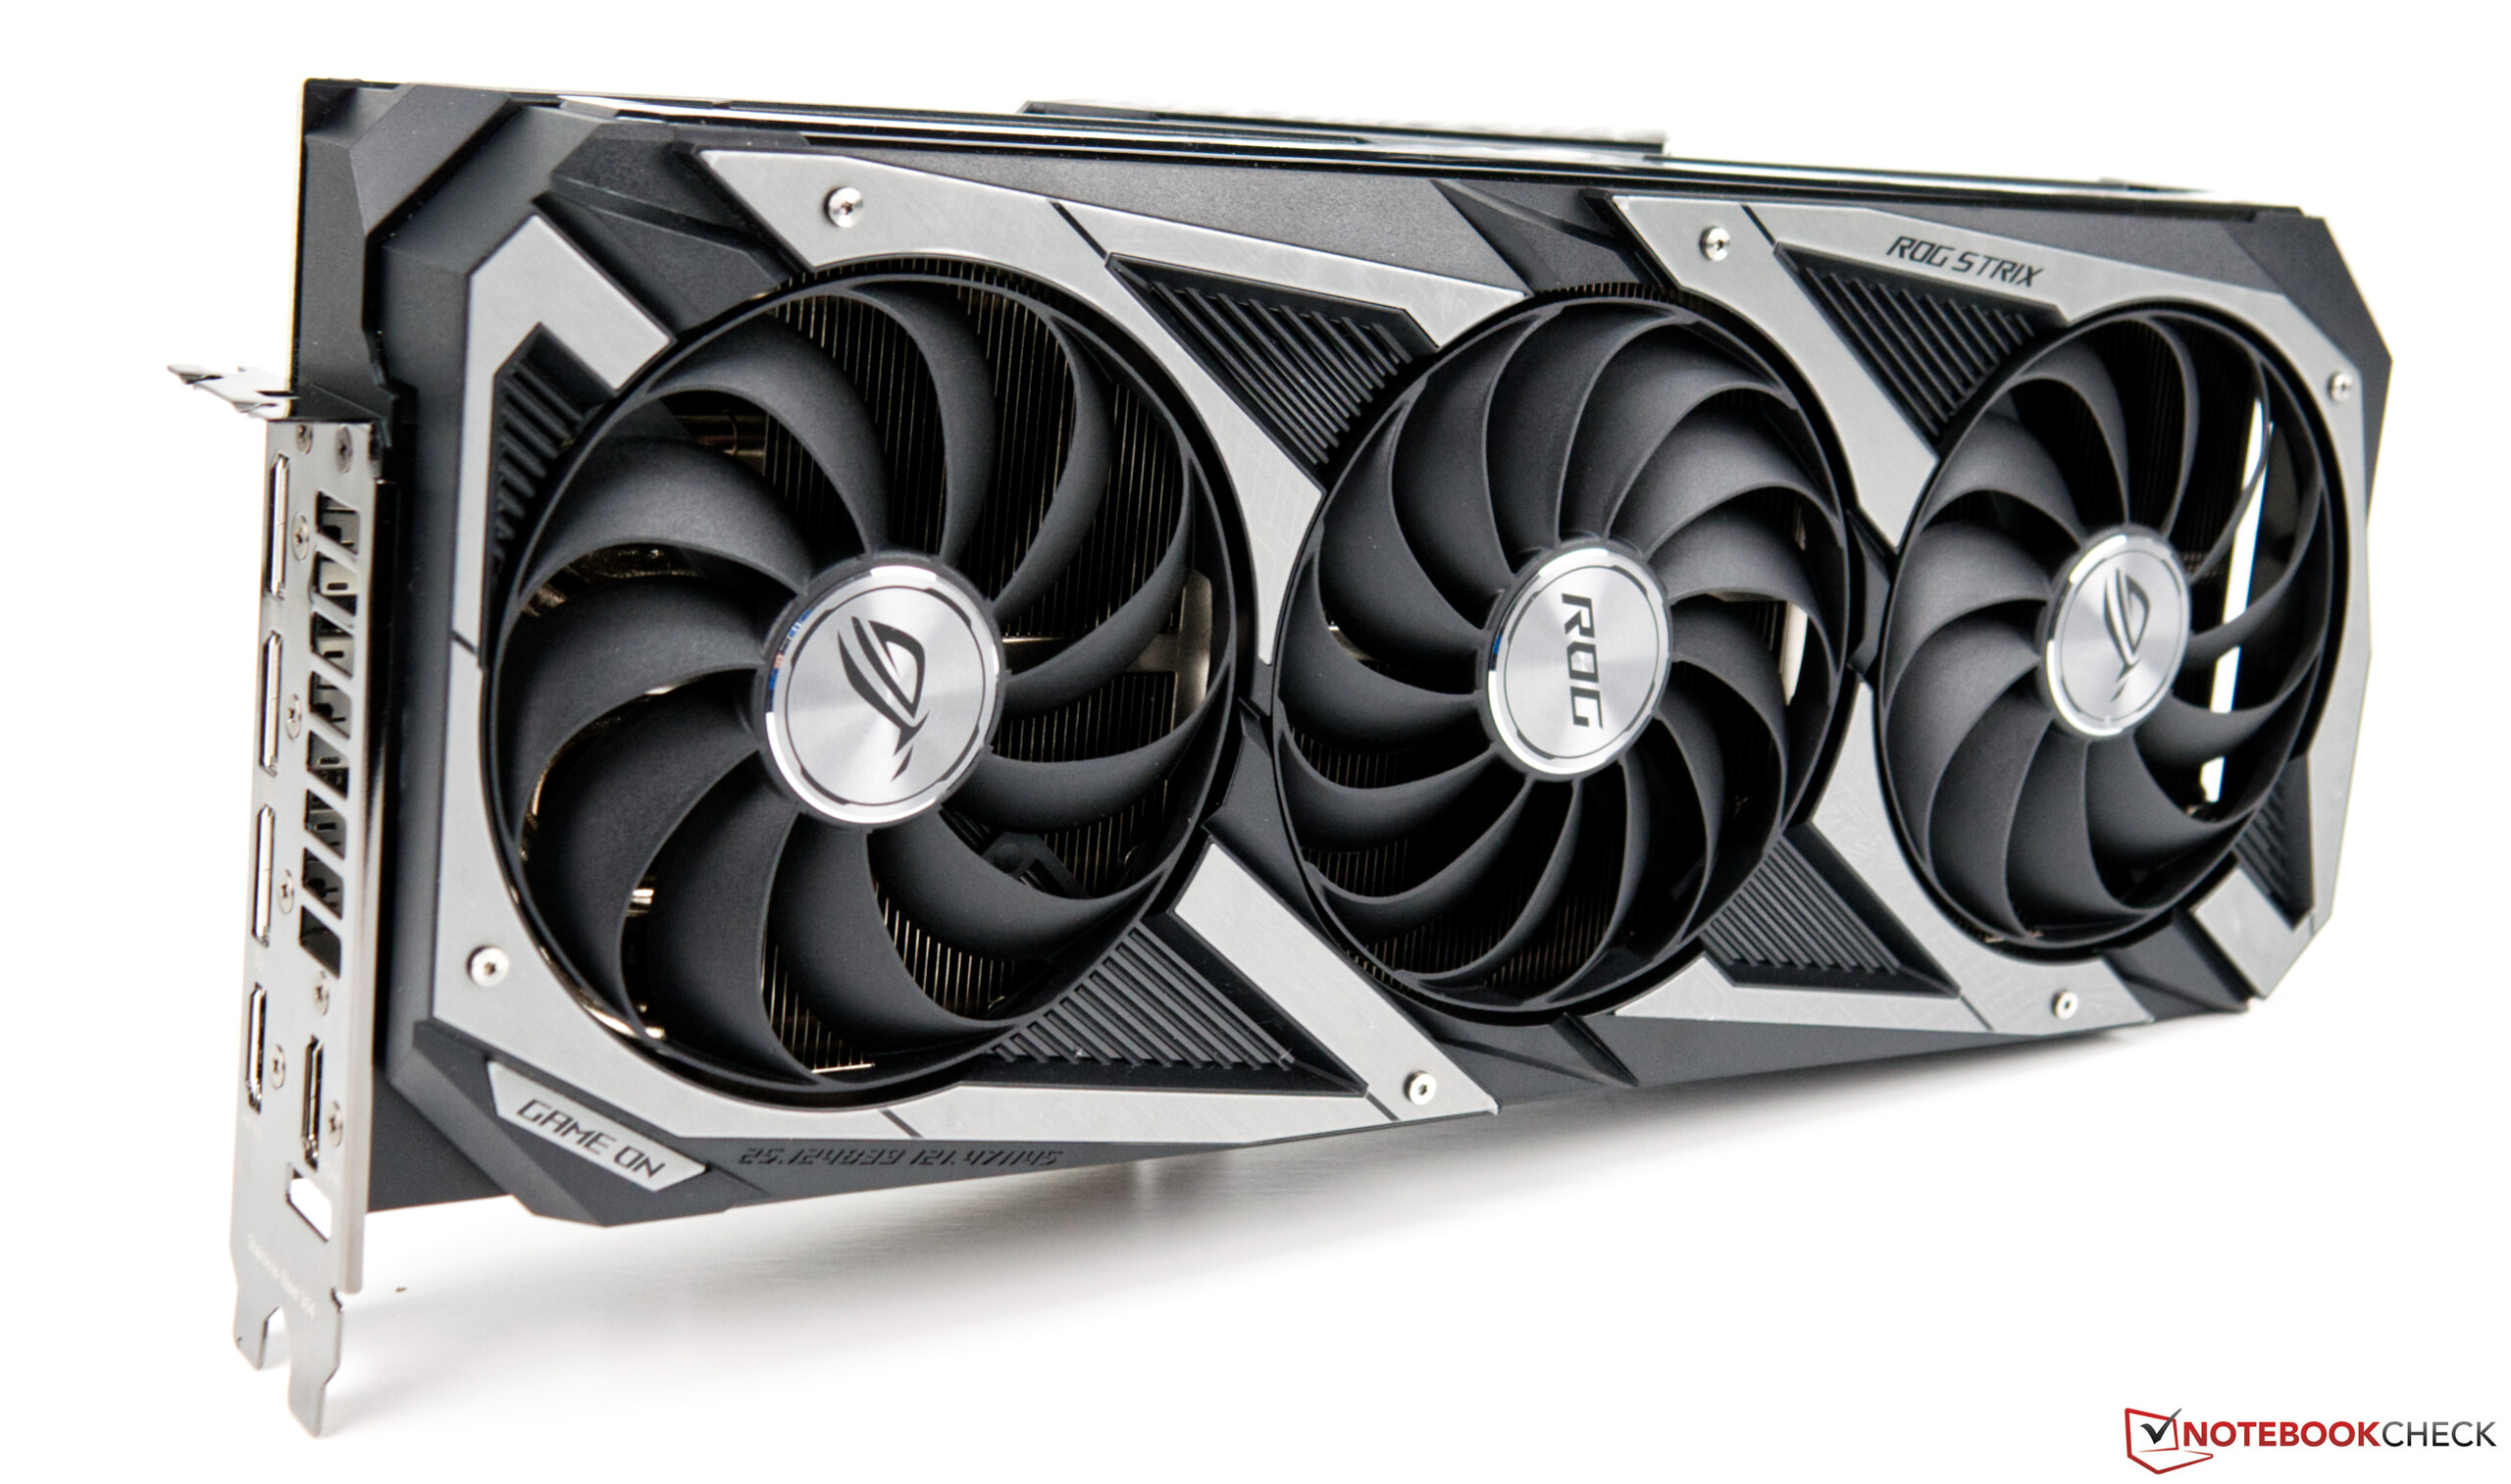
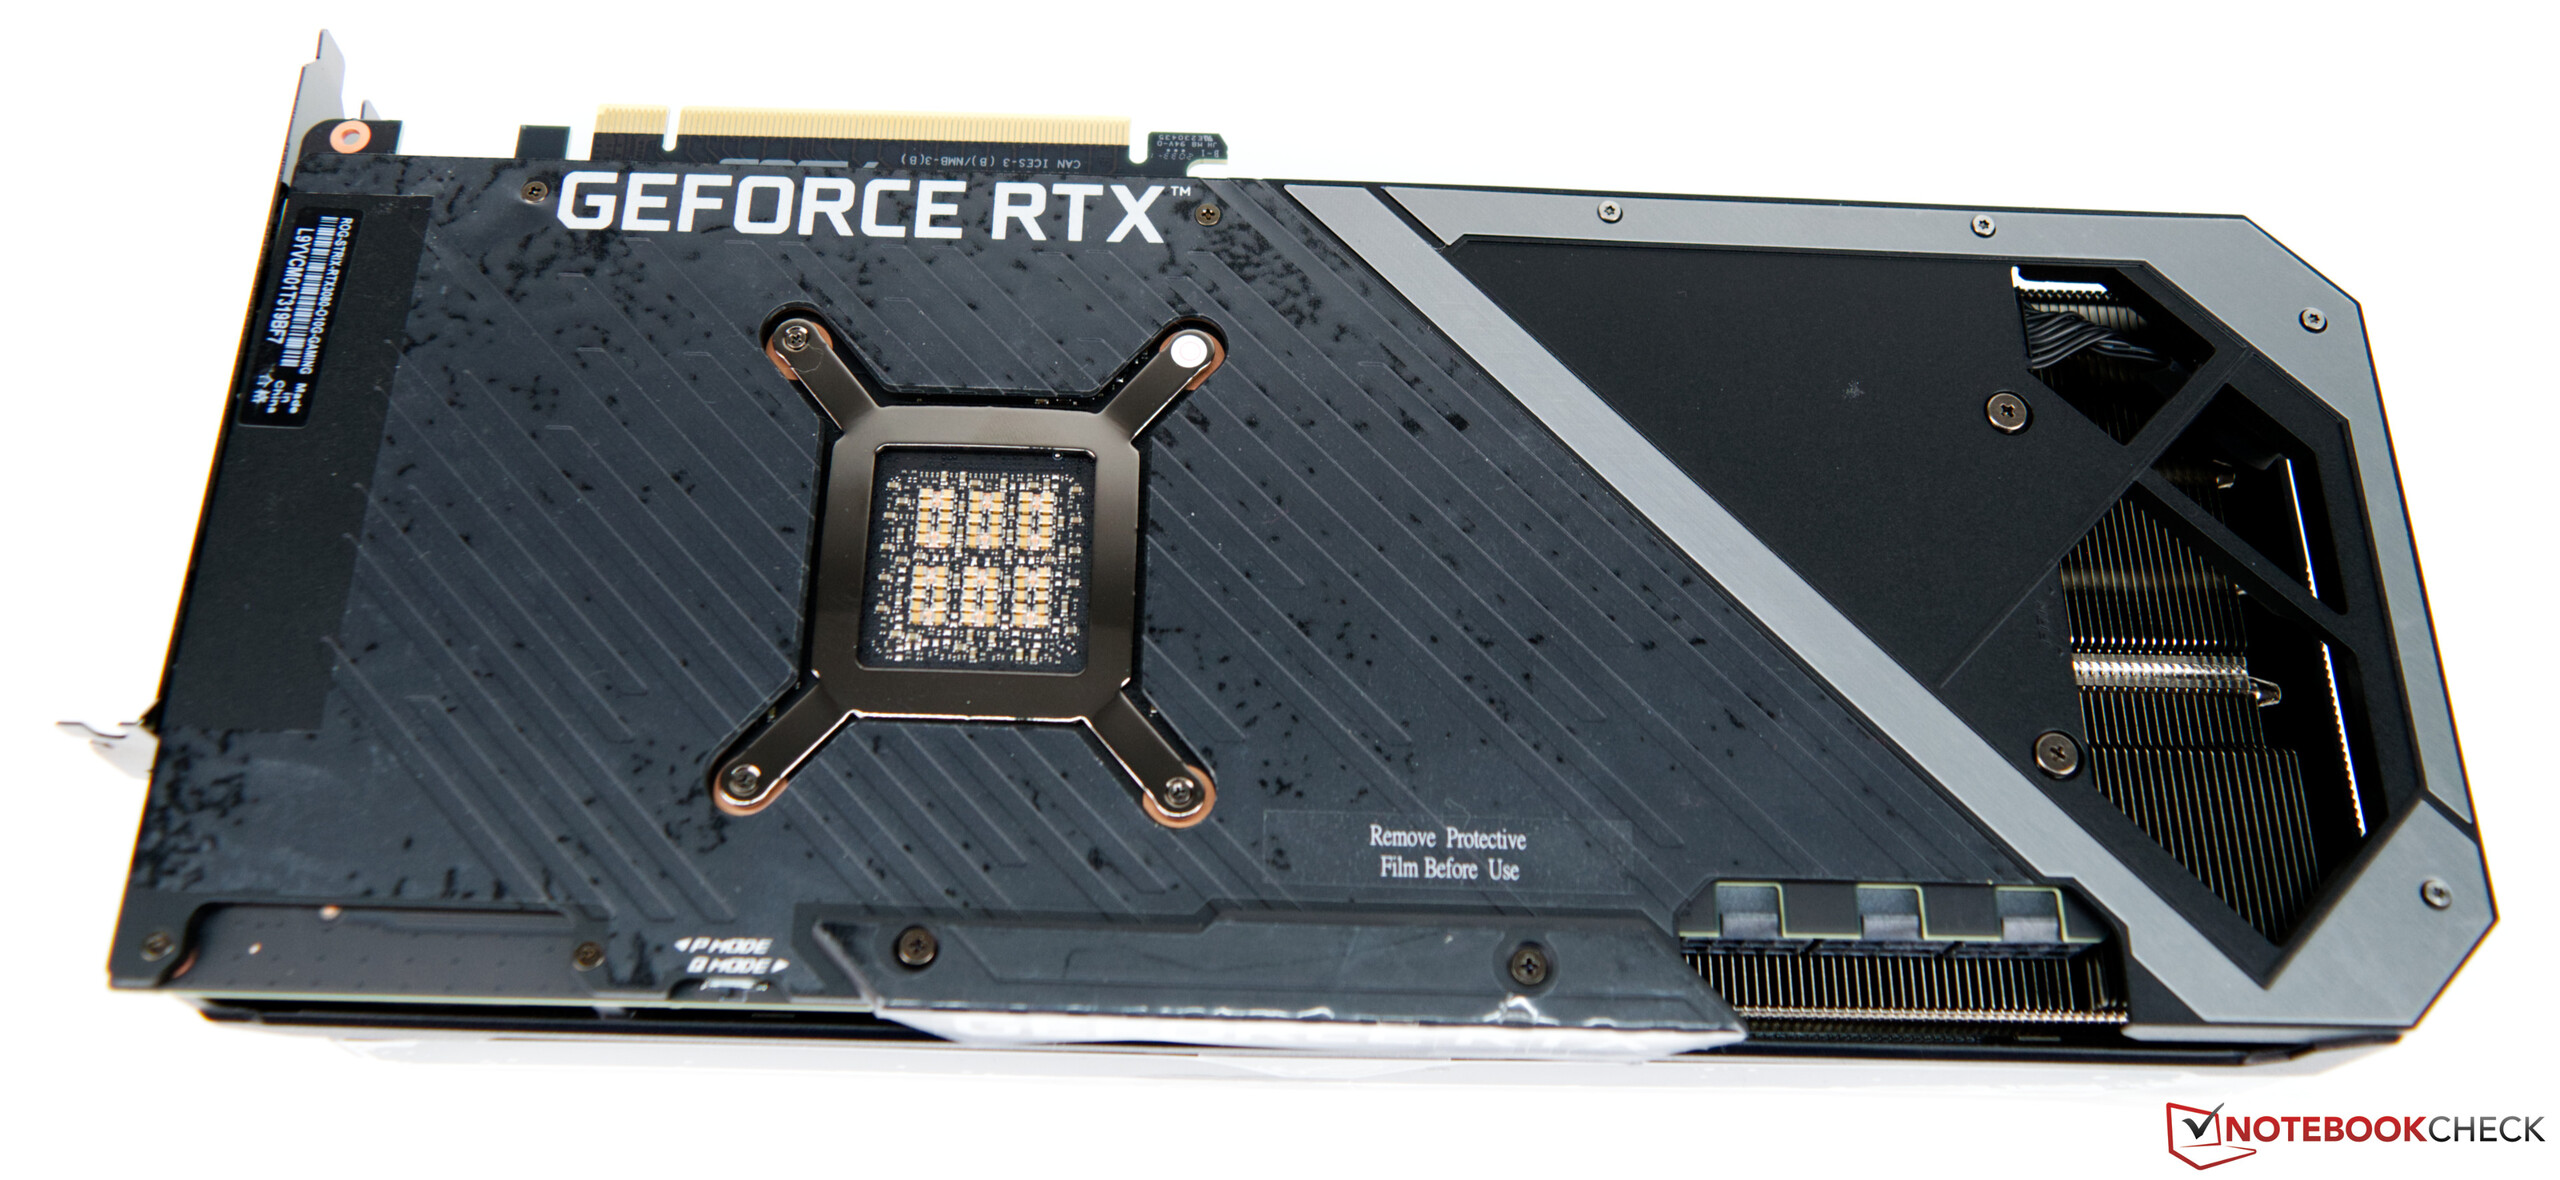
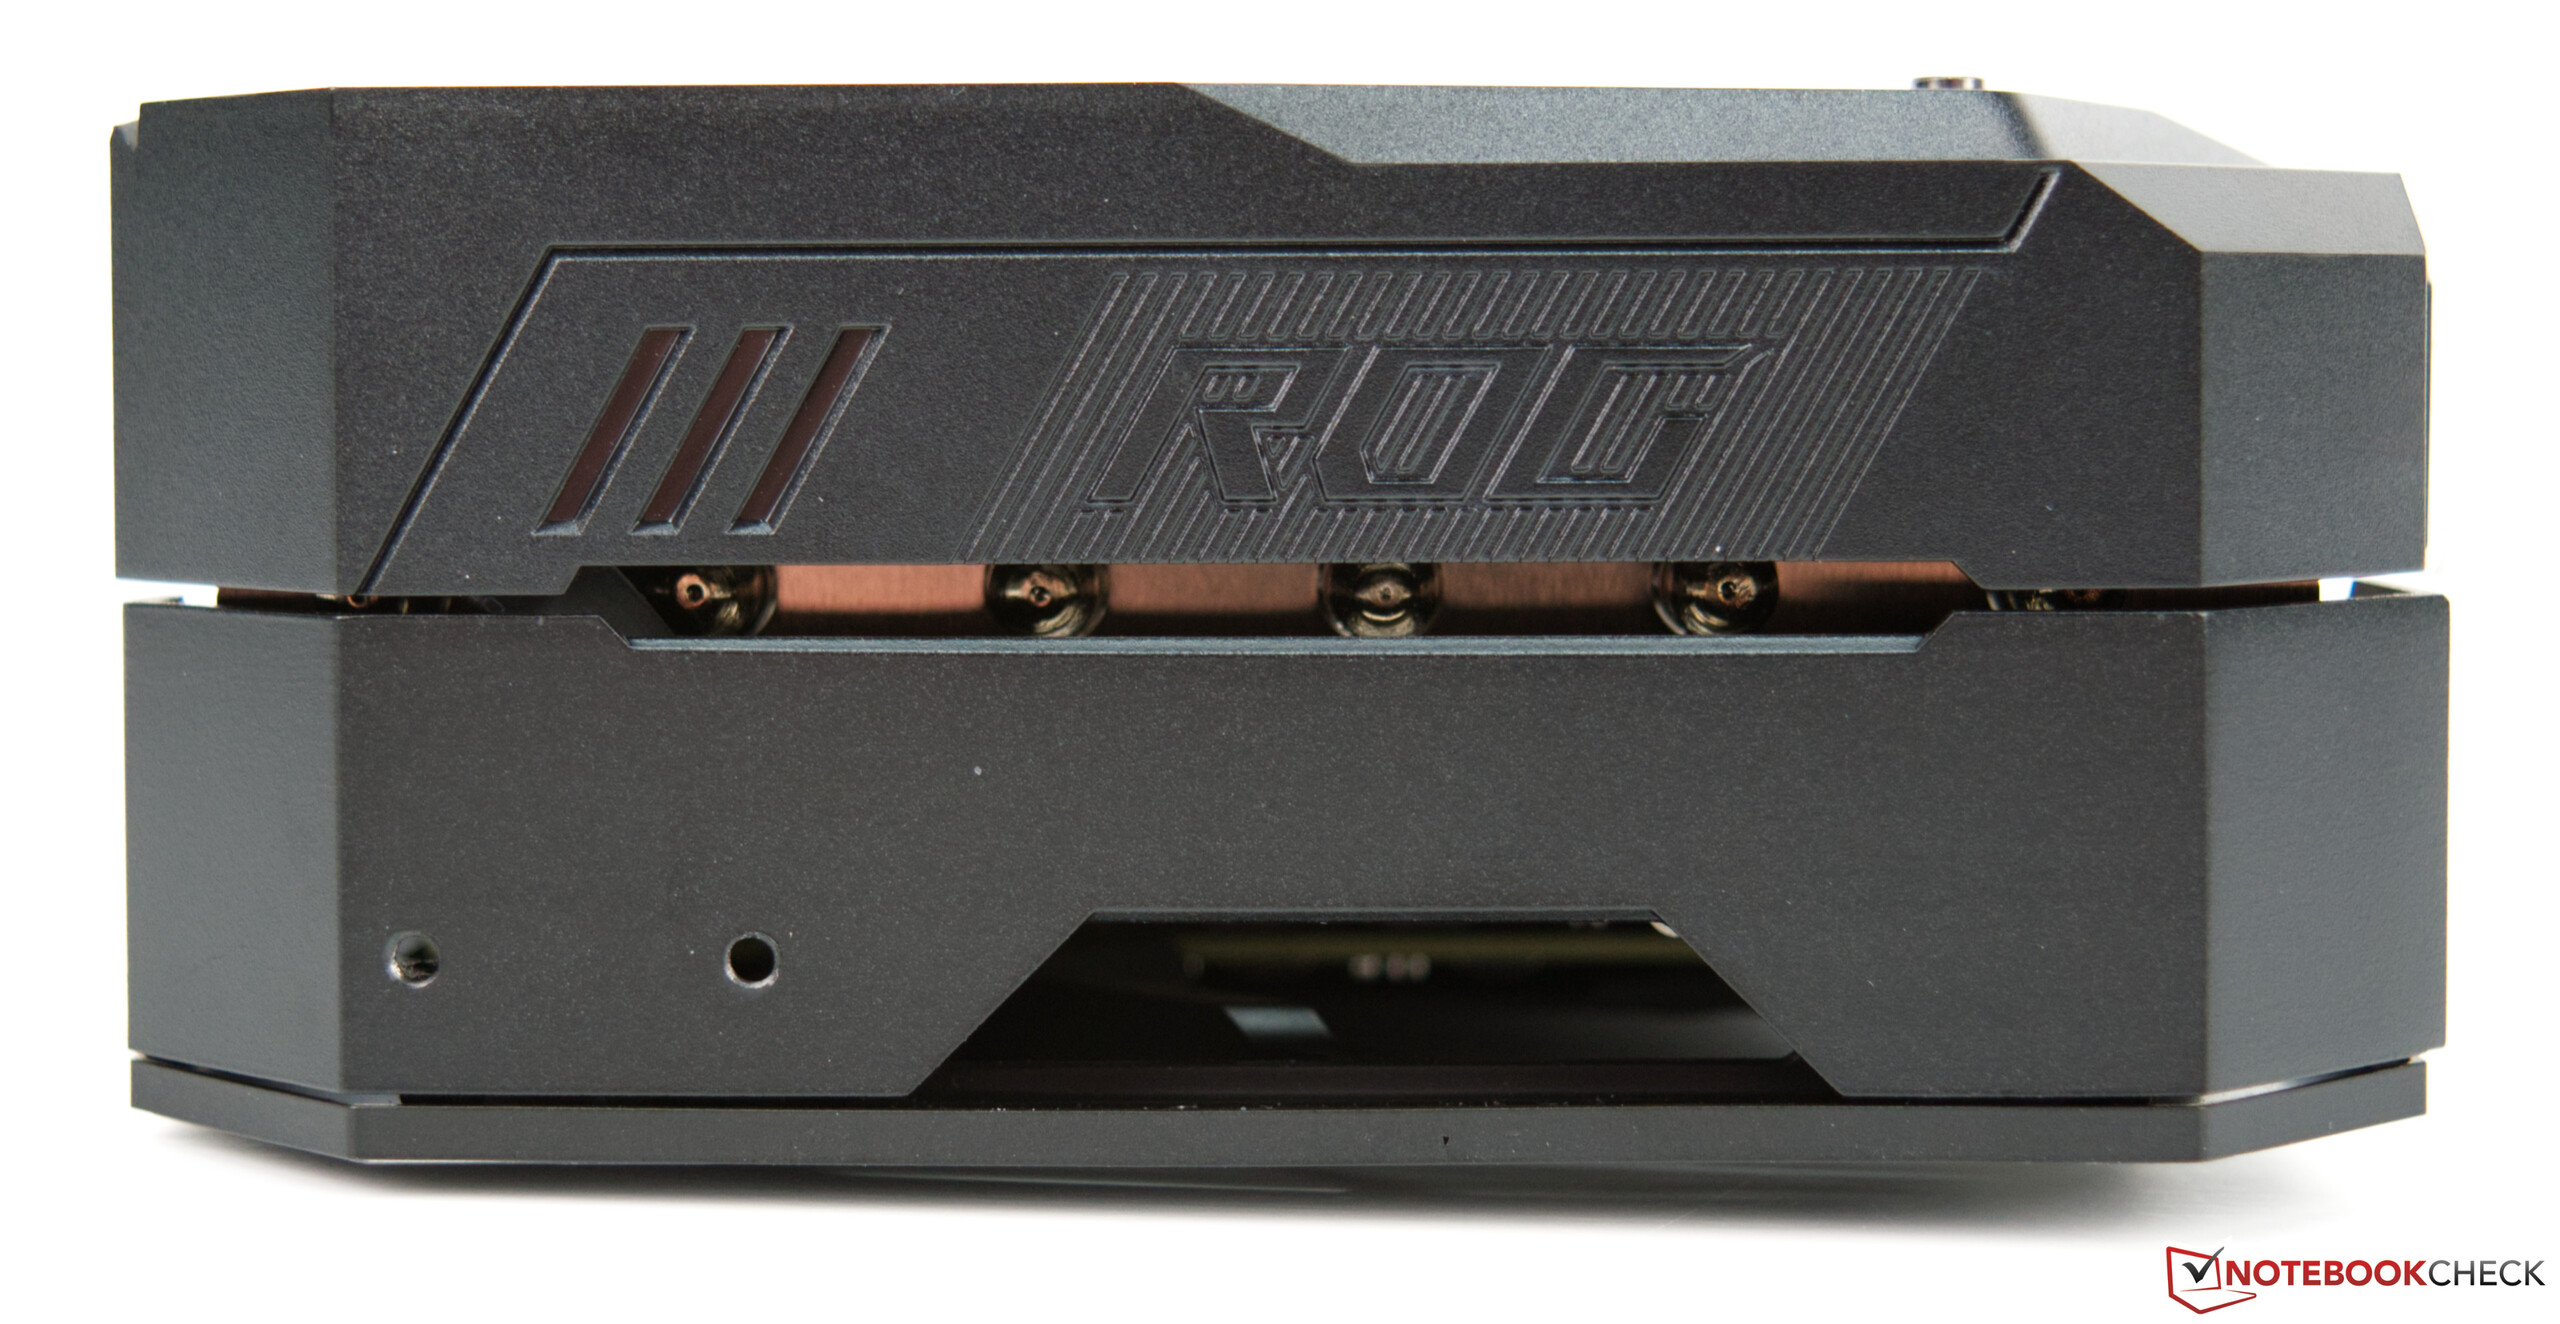
De plus, Asus a doté son modèle RTX 3080 haut de gamme d'un refroidisseur à triple fente très puissant. Dans l'ensemble, la carte graphique mesure un peu moins de 32 centimètres, ce qui doit absolument être pris en compte lors de l'achat de ce GPU. Tous les boîtiers n'offrent pas autant d'espace pour un tel monstre de carte graphique.
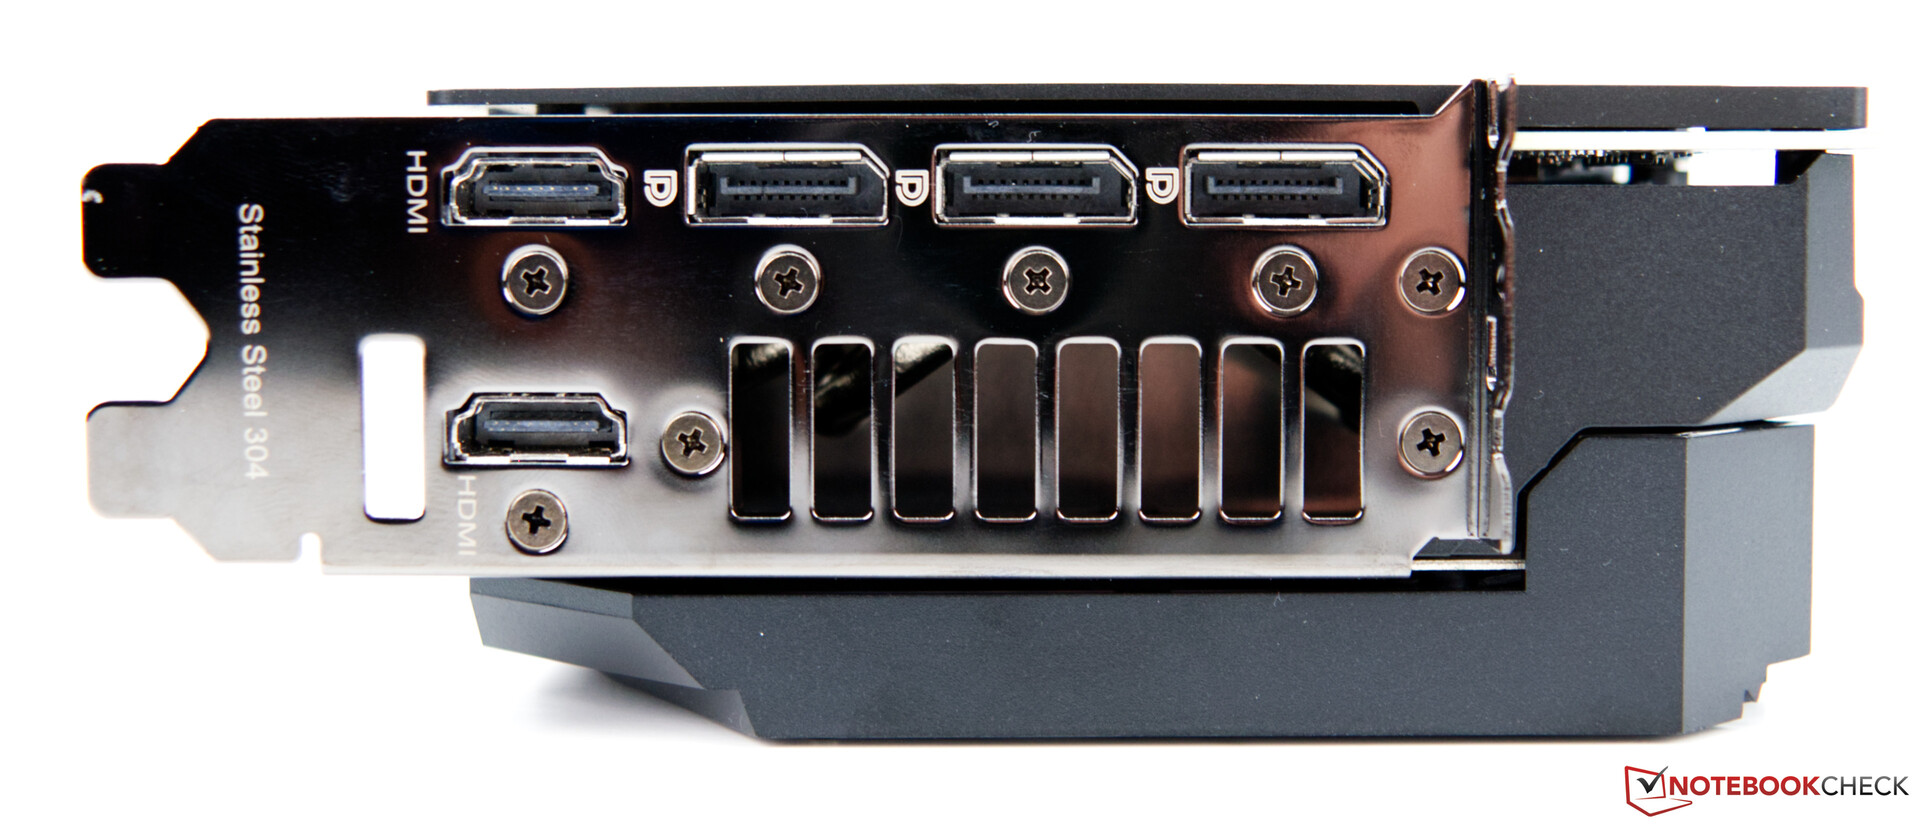
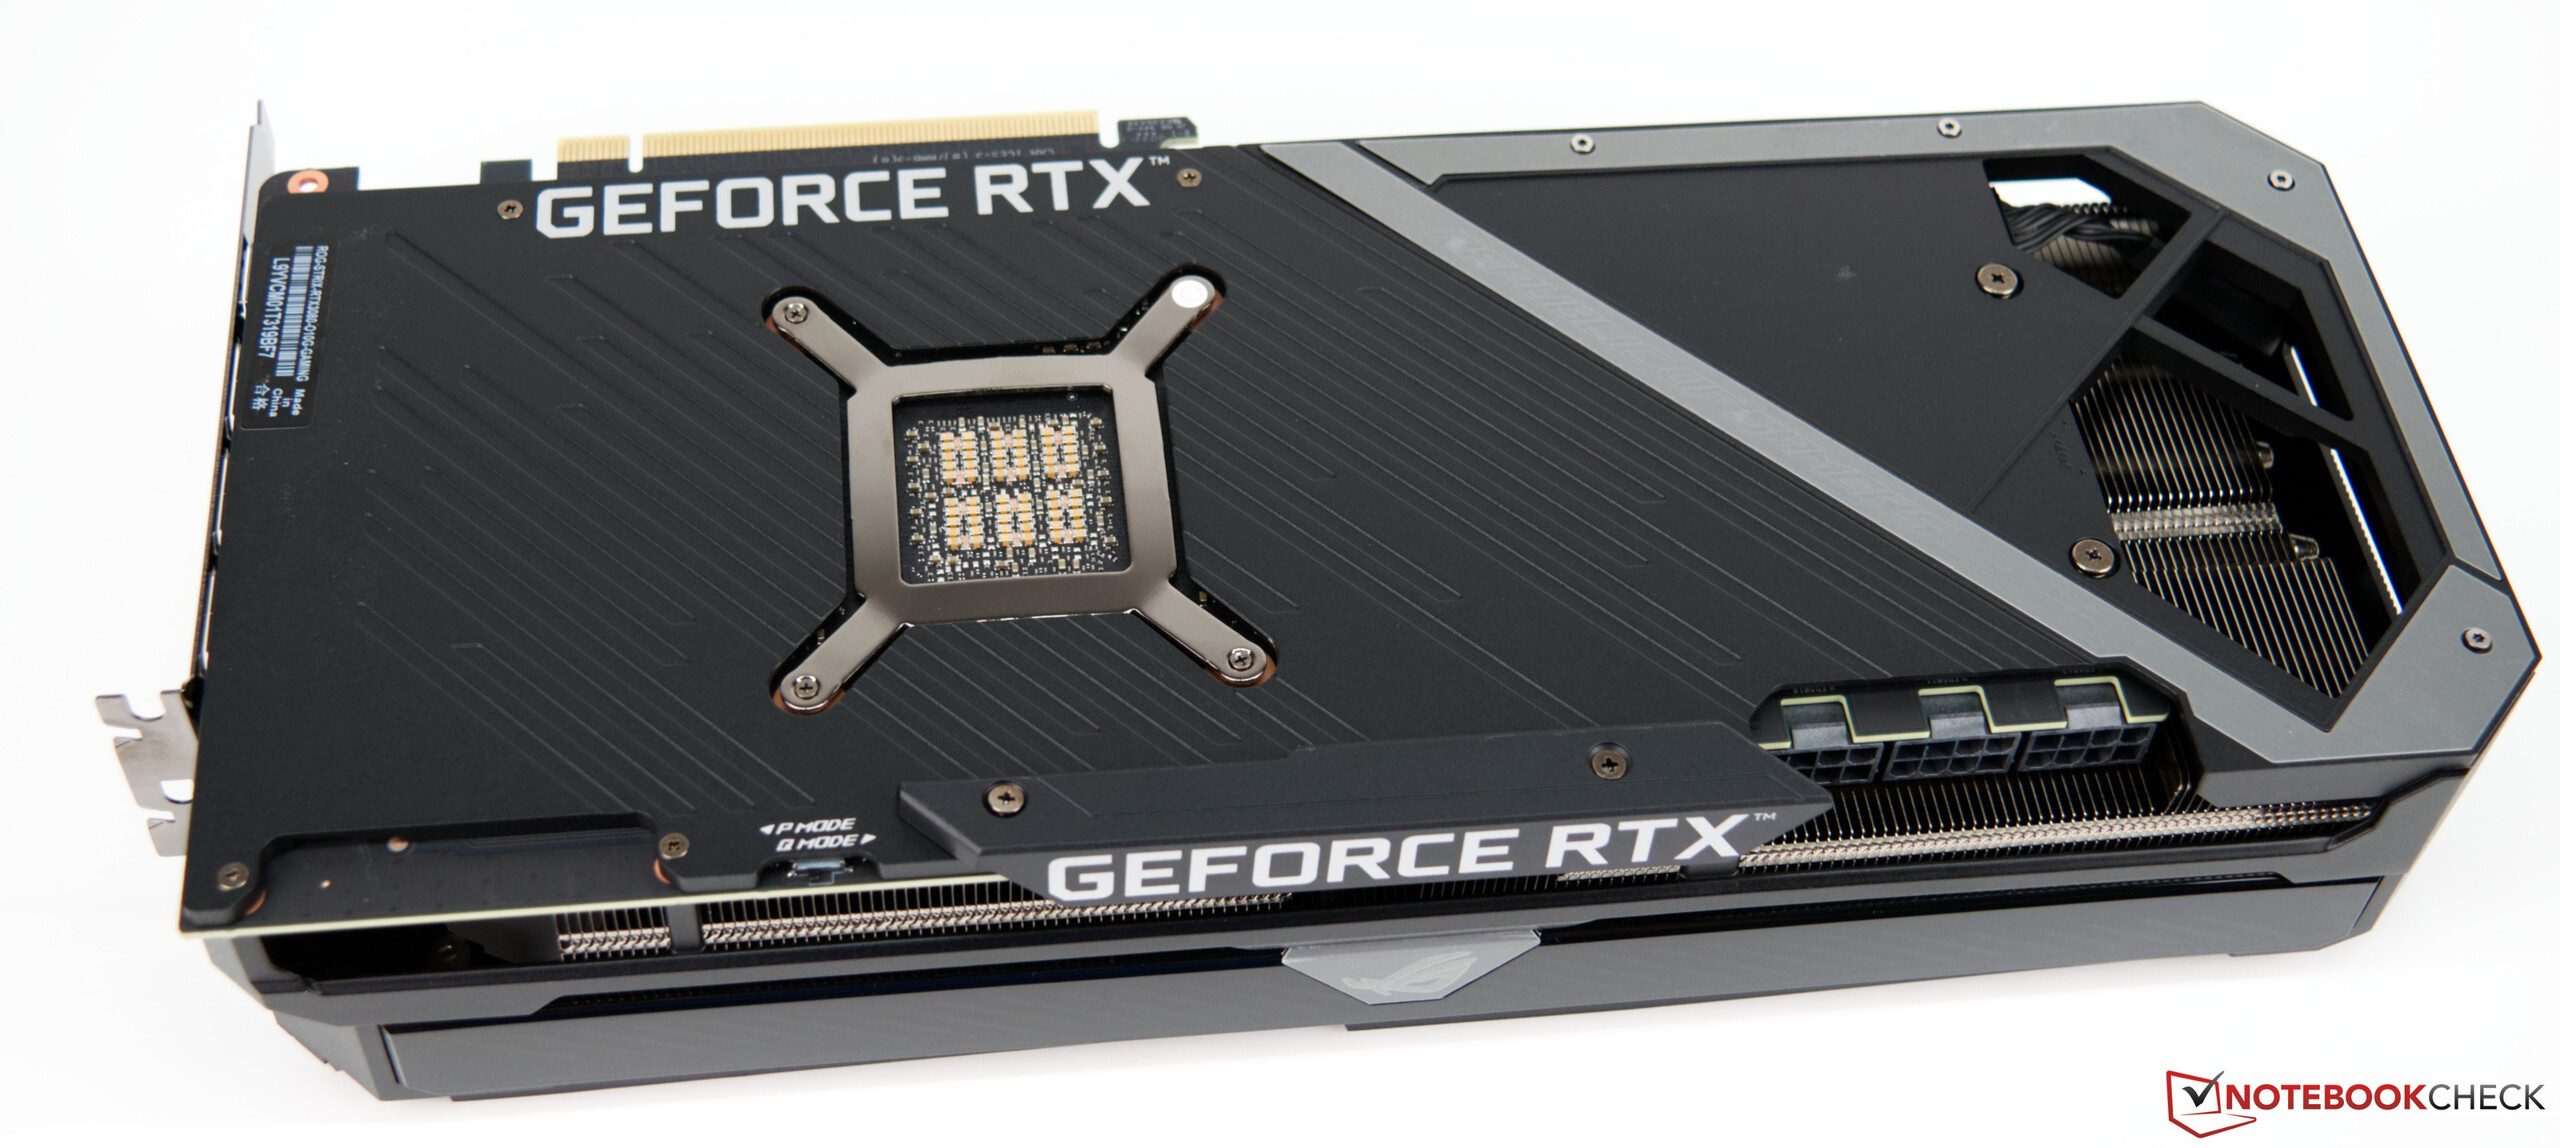
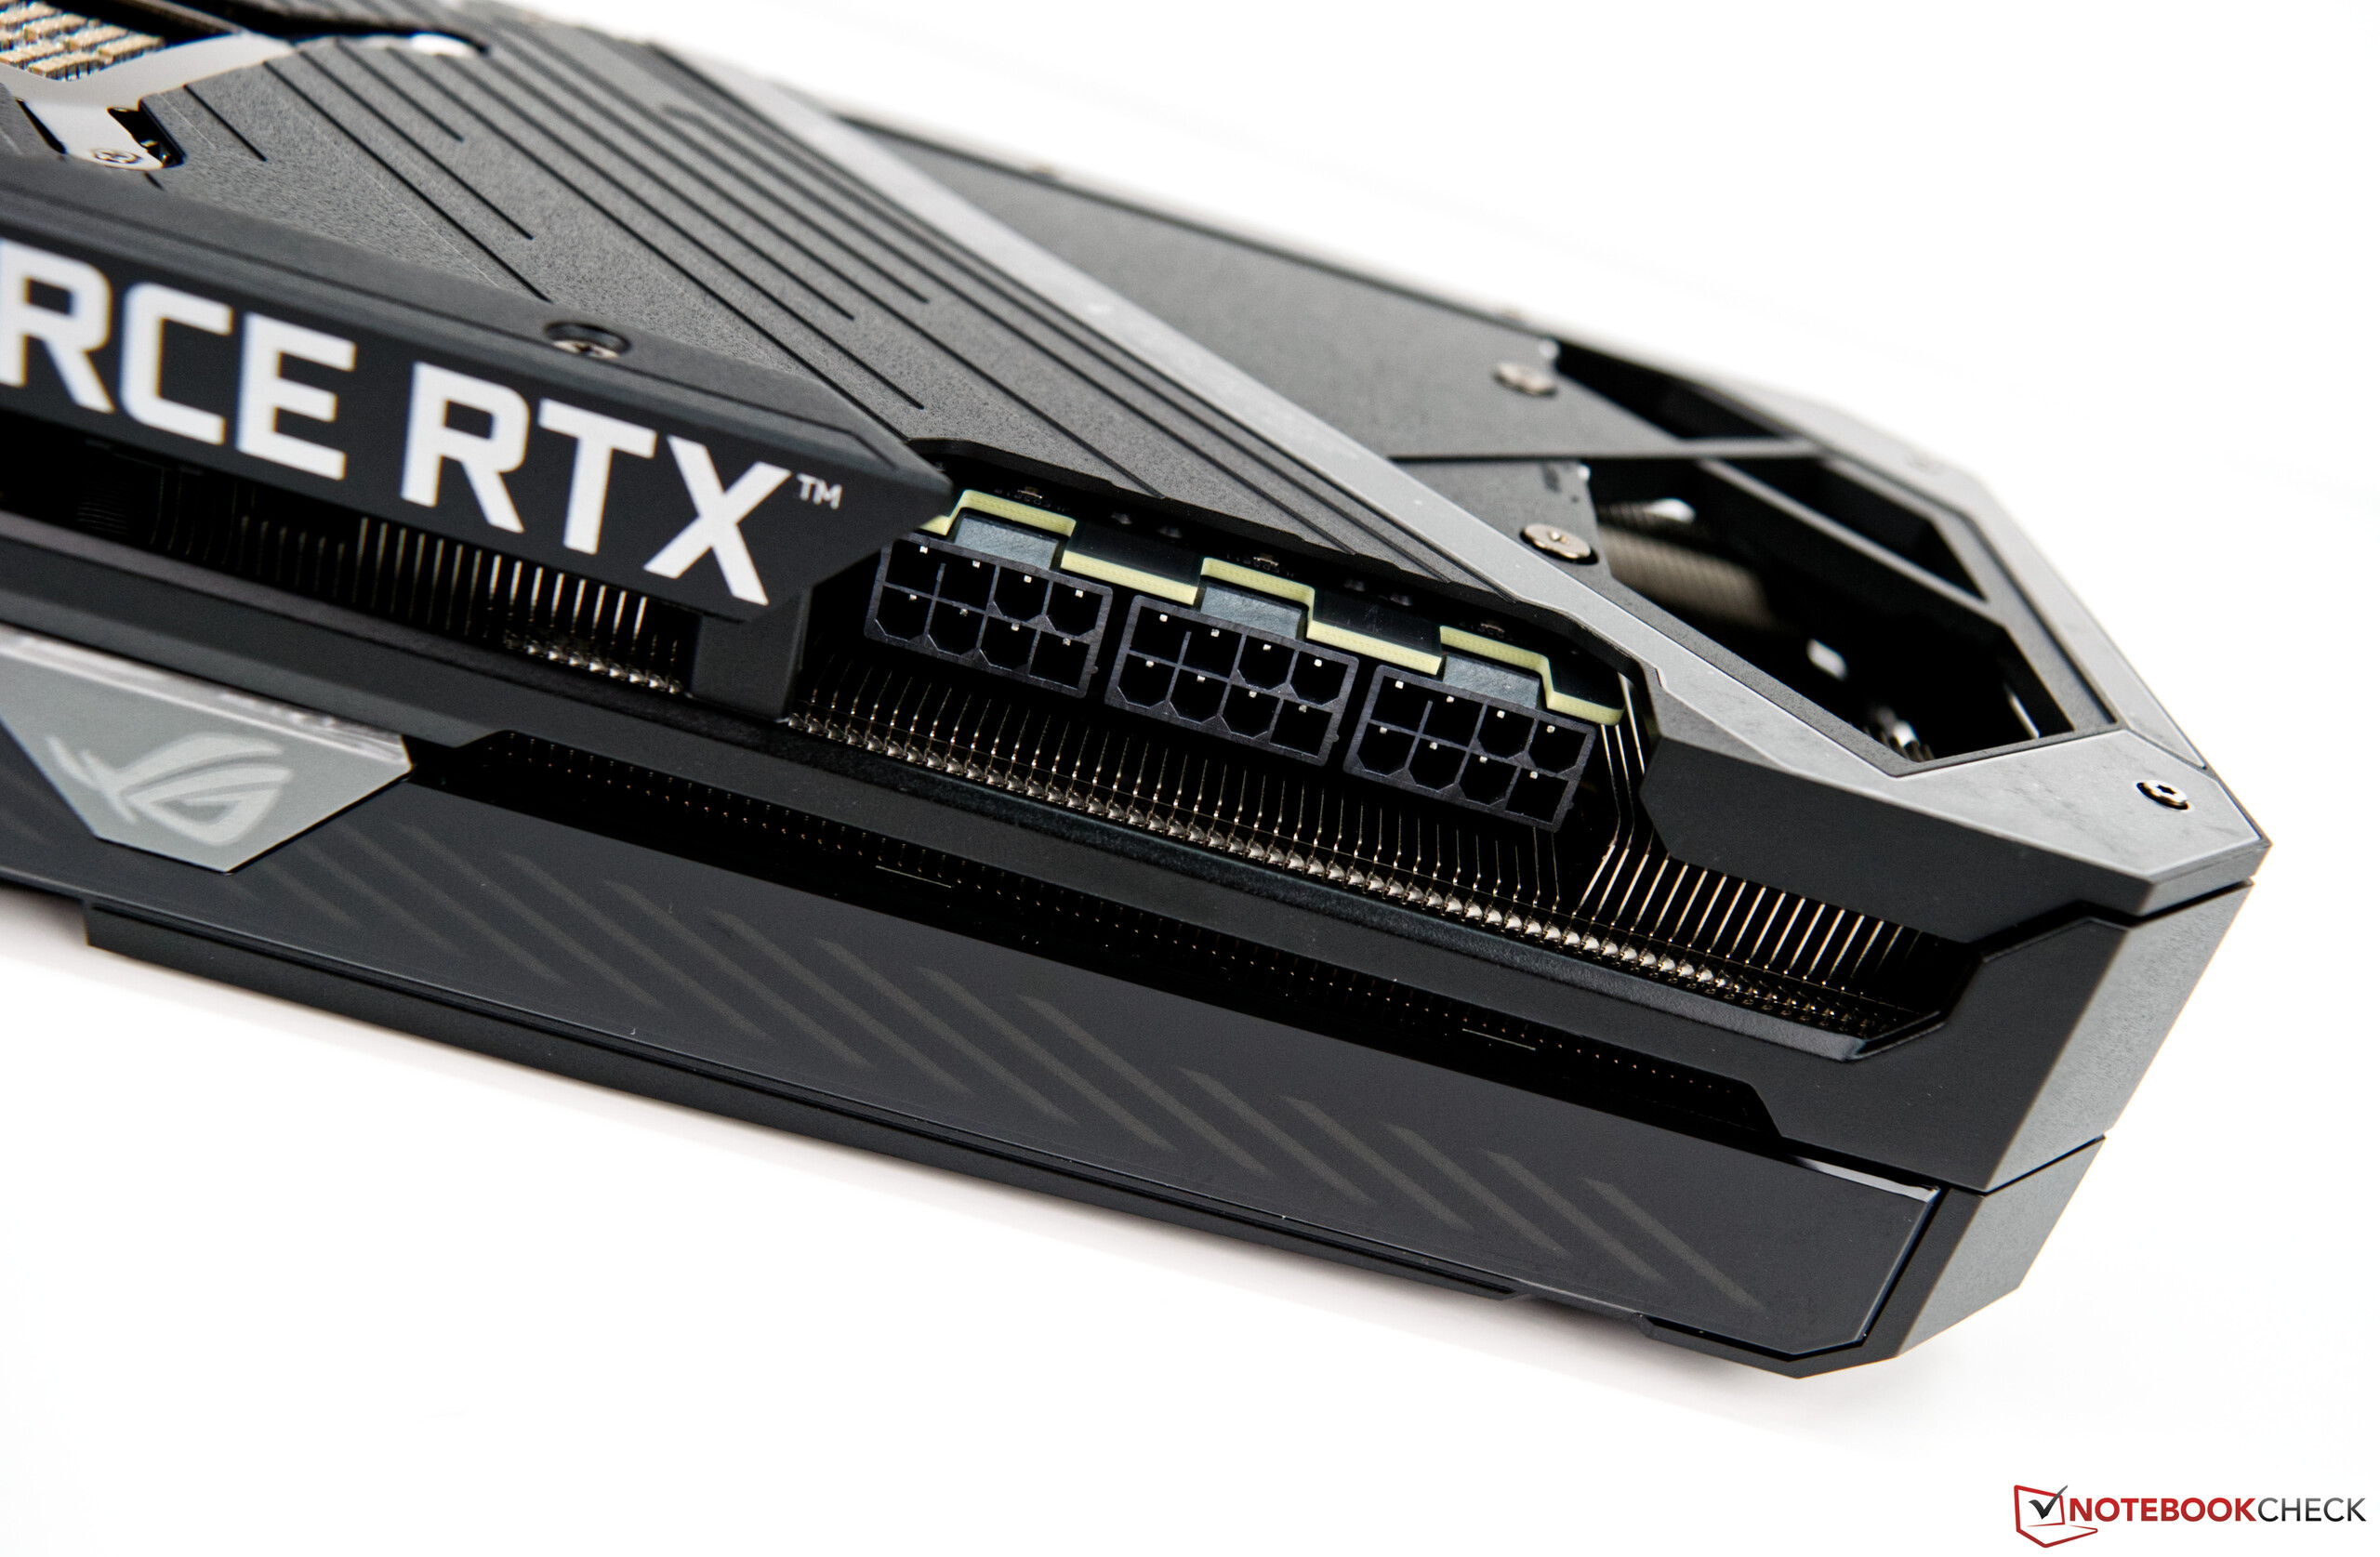
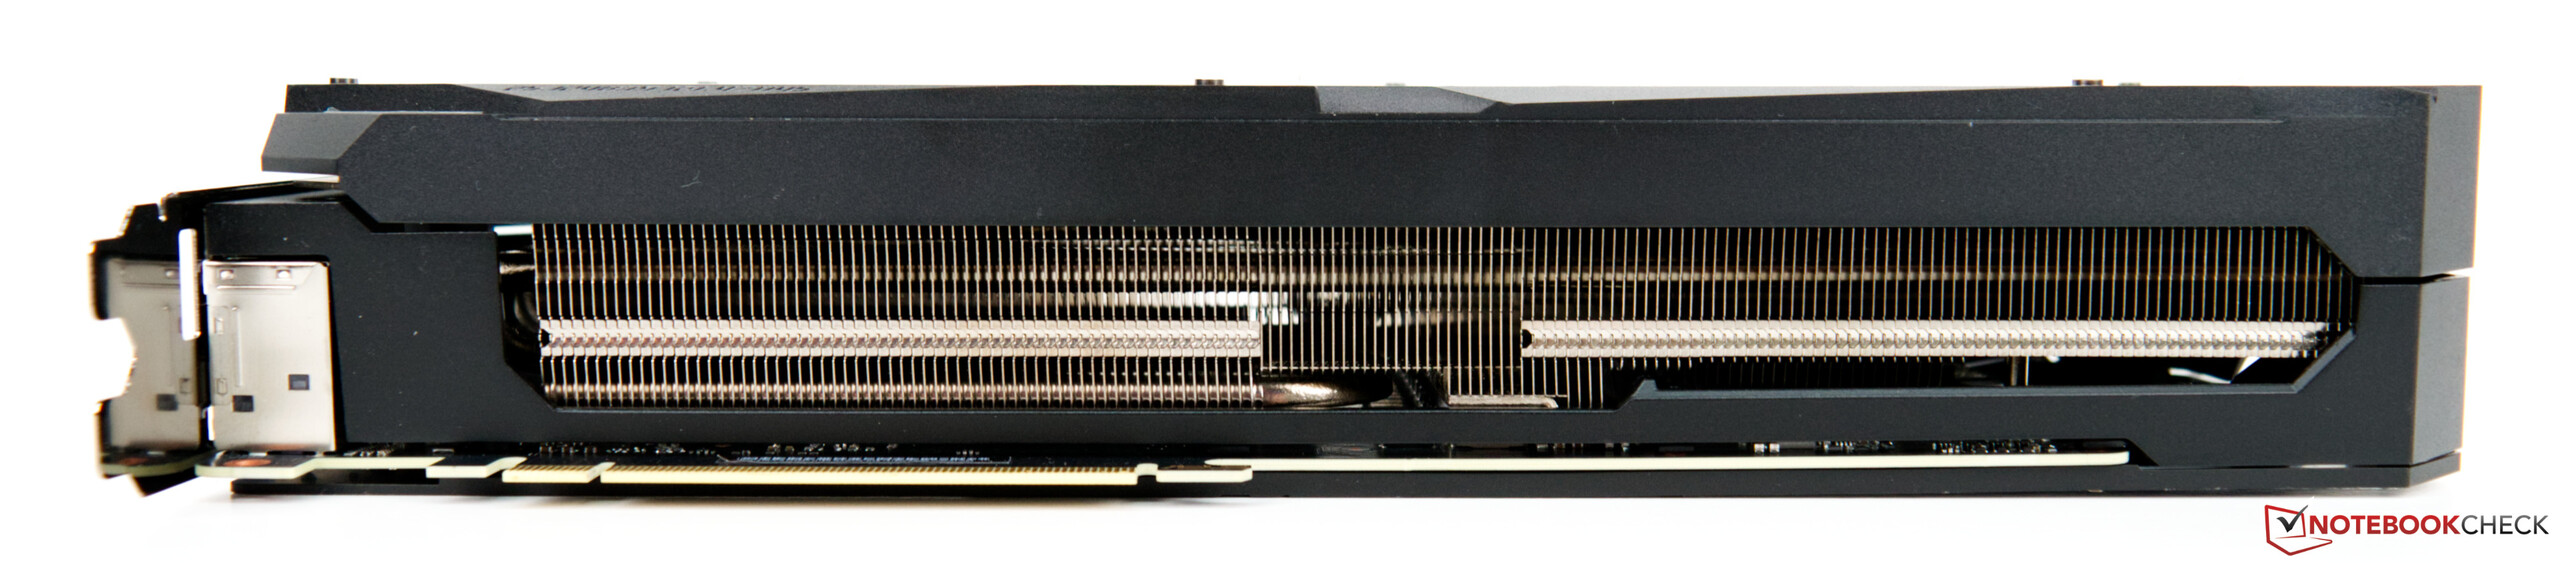
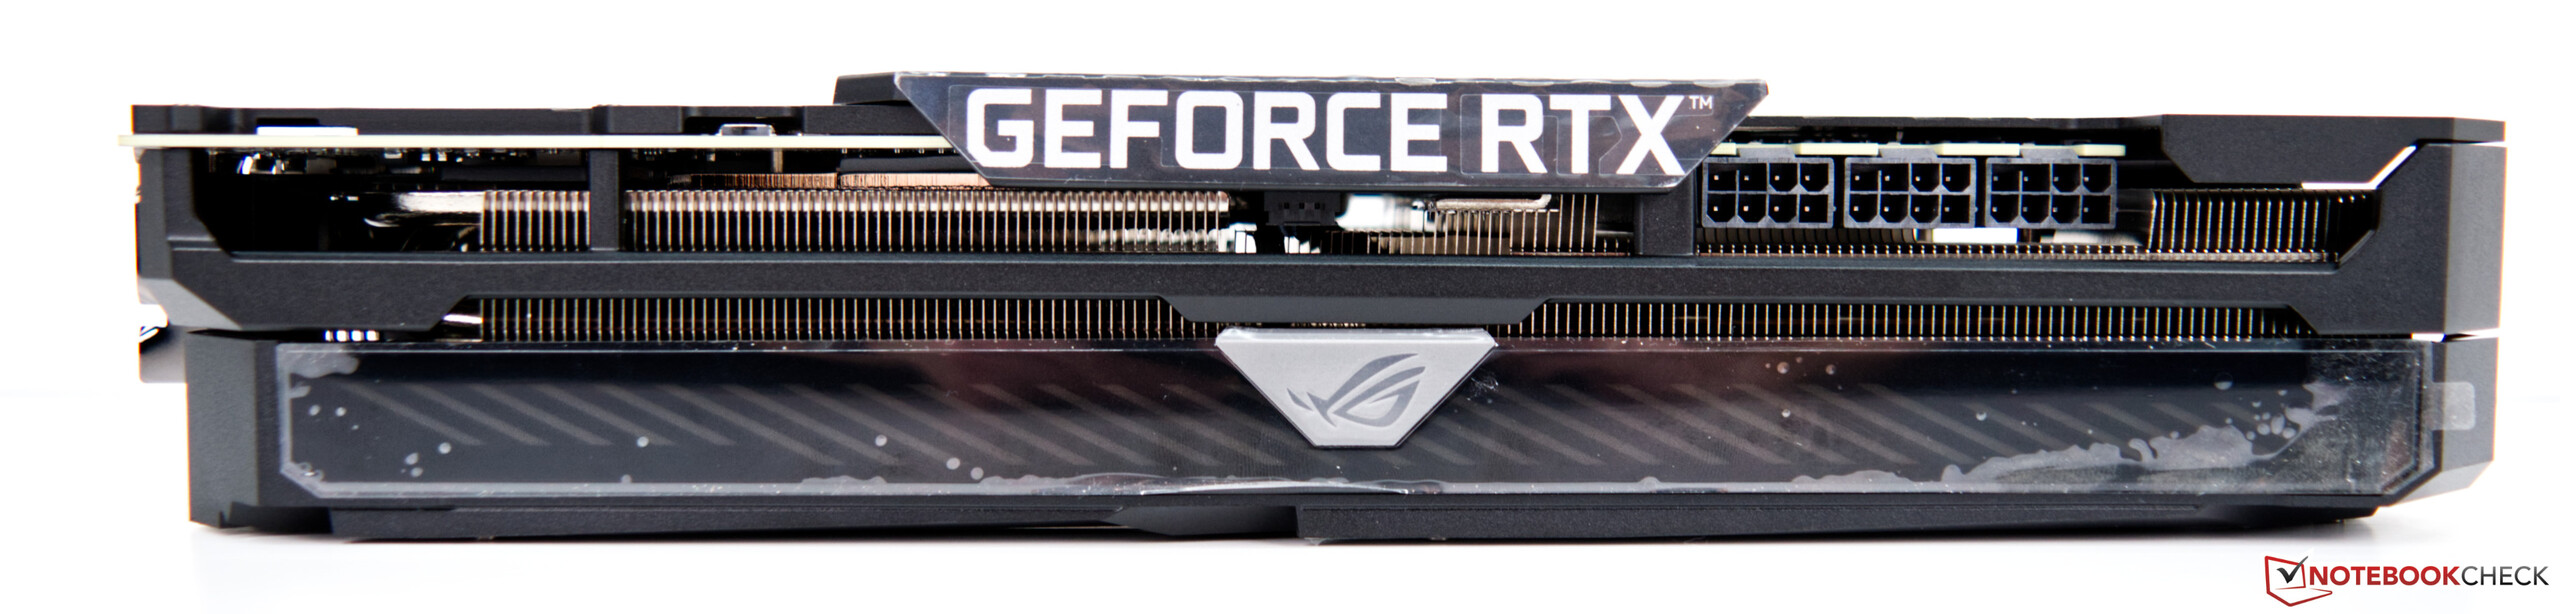
Asus suit le vieux chemin familier en matière d'alimentation électrique et n'opte pas pour le connecteur 12 broches que Nvidia utilise avec ses cartes RTX 3000. La GeForce RTX 3080 ROG Strix Gaming OC nécessite trois connecteurs à 8 broches pour son fonctionnement. Par conséquent, un adaptateur électrique puissant est inévitable, et Asus lui-même parle d'au moins 850 watts. Il est possible de connecter jusqu'à quatre moniteurs externes simultanément
. À cet effet, le GPU est équipé d'un HDMI prenant en charge la dernière norme (2.1) ainsi que des connexions DisplayPort (1.4a).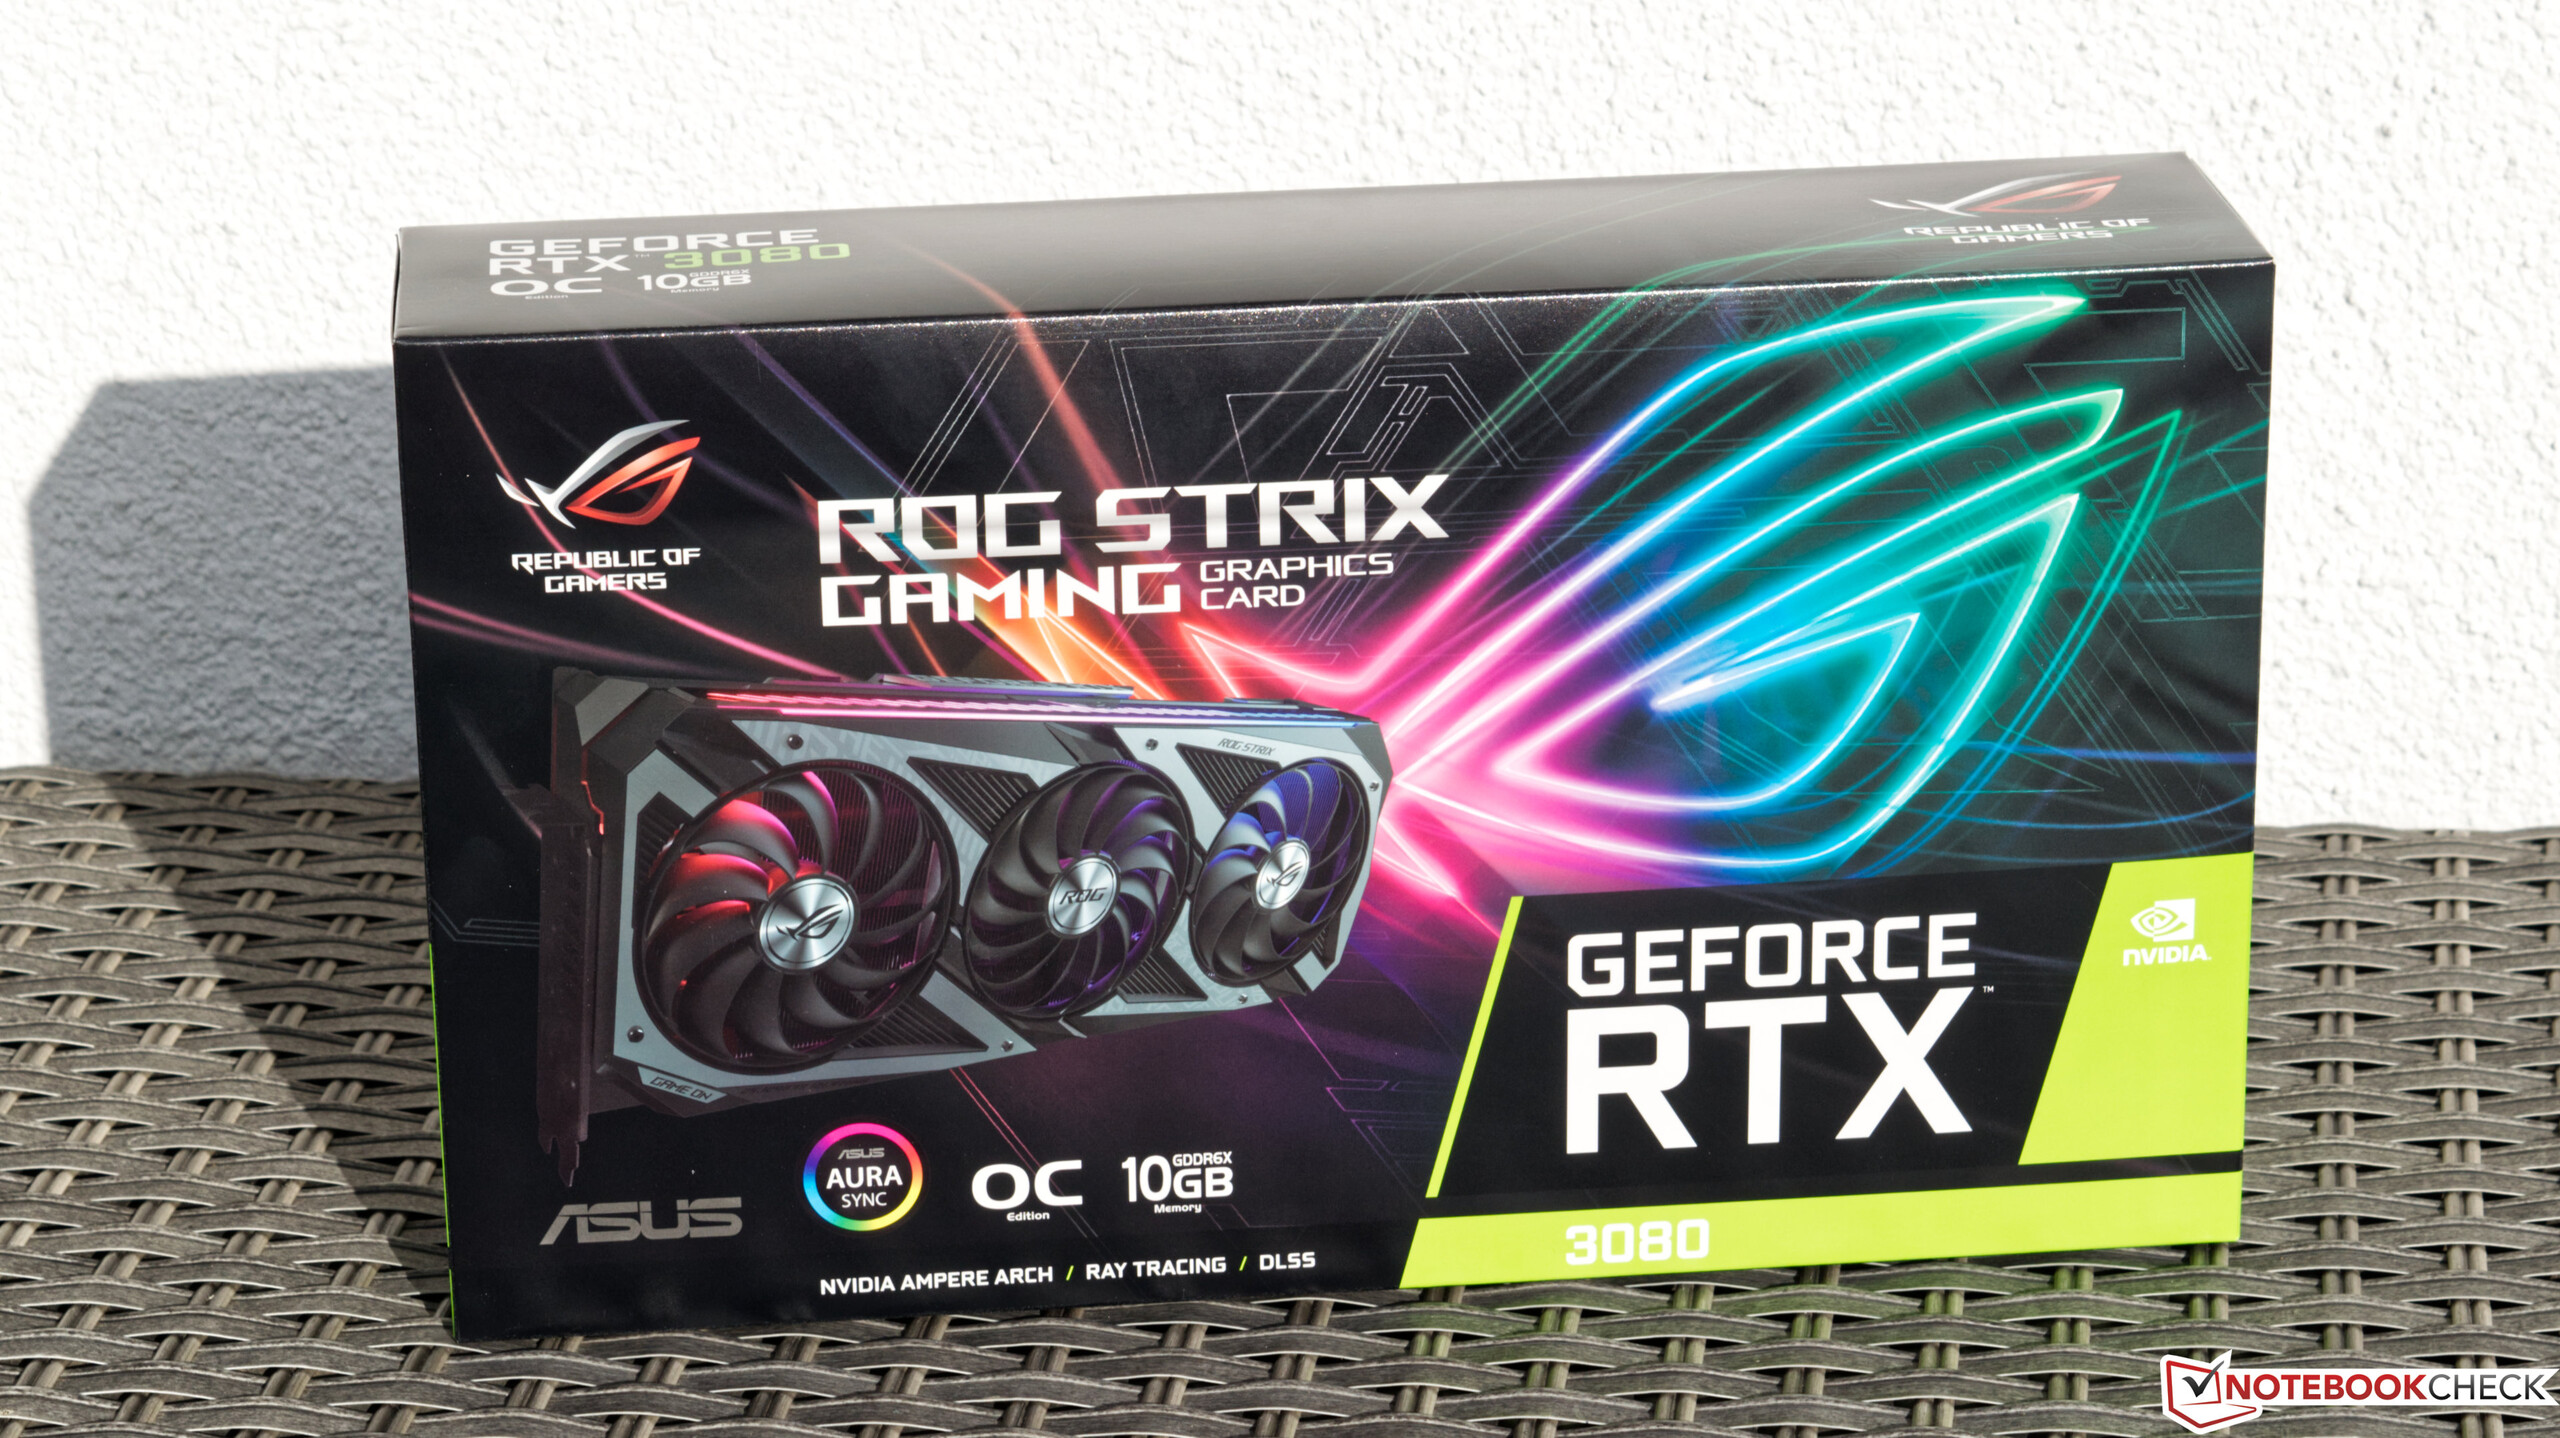


Le RTX 3080 comparé aux autres GPU NVIDIA
| Spécification | RTX 3090 | RTX3080 (Asus ROG) | RTX 3080 FE | RTX 3070 FE | Titan RTX | TITAN X Pascal | RTX 2080 Ti | RTX 2080 |
| Chip | GA102 | GA102 | GA102 | GA104 | TU102 | GP102 | TU102 | TU104 |
| Processus FinFET | 8 nm | 8nm | 8 nm | 8 nm | 8 nm | 12 nm | 16 nm | 12 nm |
| CUDA cores | 10,496 | 8,704 | 8,704 | 5,888 | 4,608 | 3,584 | 4,352 | 2,944 |
| Textureunits | 328 | 272 | 272 | 184 | 288 | 224 | 272 | 184 |
| Noyaux tenseurs | 328 3ème génération | 2723ème génération | 272 3ème génération | 184 3ème génération | 576 2ème génération | - | 544 2ème génération | 368 2ème génération |
| RTCores | 82 | 68 | 68 | 46 | 72 | - | 68 | 46 |
| Horloge de base GPU | 1,395 MHz | 1,440 MHz | 1,440 MHz | 1,500 MHz | 1,350 MHz | 1,417 MHz | 1,350 MHz | 1,515 MHz |
| Horloge de boost GPU | 1,695 MHz | 1,905 MHz | 1,710 MHz | 1,725 MHz | 1,770 MHz | 1,531 MHz | 1,545 MHz | 1,710 MHz |
| Memorybus | 384-bit | 320-bit | 320-bit | 256-bit | 384-bit | 384-bit | 352-bit | 256-bit |
| Bande passante mémoire | 936 GB/s | 760GB/s | 760 GB/s | 448 GB/s | 672 GB/s | 480.4 GB/s | 616 GB/s | 448 GB/s |
| Mémoire vidéo | 24 GB GDDR6X | 10 GBGDDR6X | 10 GB GDDR6X | 8 GB GDDR6 | 24 GB GDDR6 | 12 GB GDDR5X | 11 GB GDDR6 | 8 GB GDDR6 |
| Consommation d'énergie | 350 W | 320W | 320 W | 220 W | 280 W | 250 W | 250 W | 215 W |
Notre système de test avec l'AMD Ryzen 9 3900X comme base
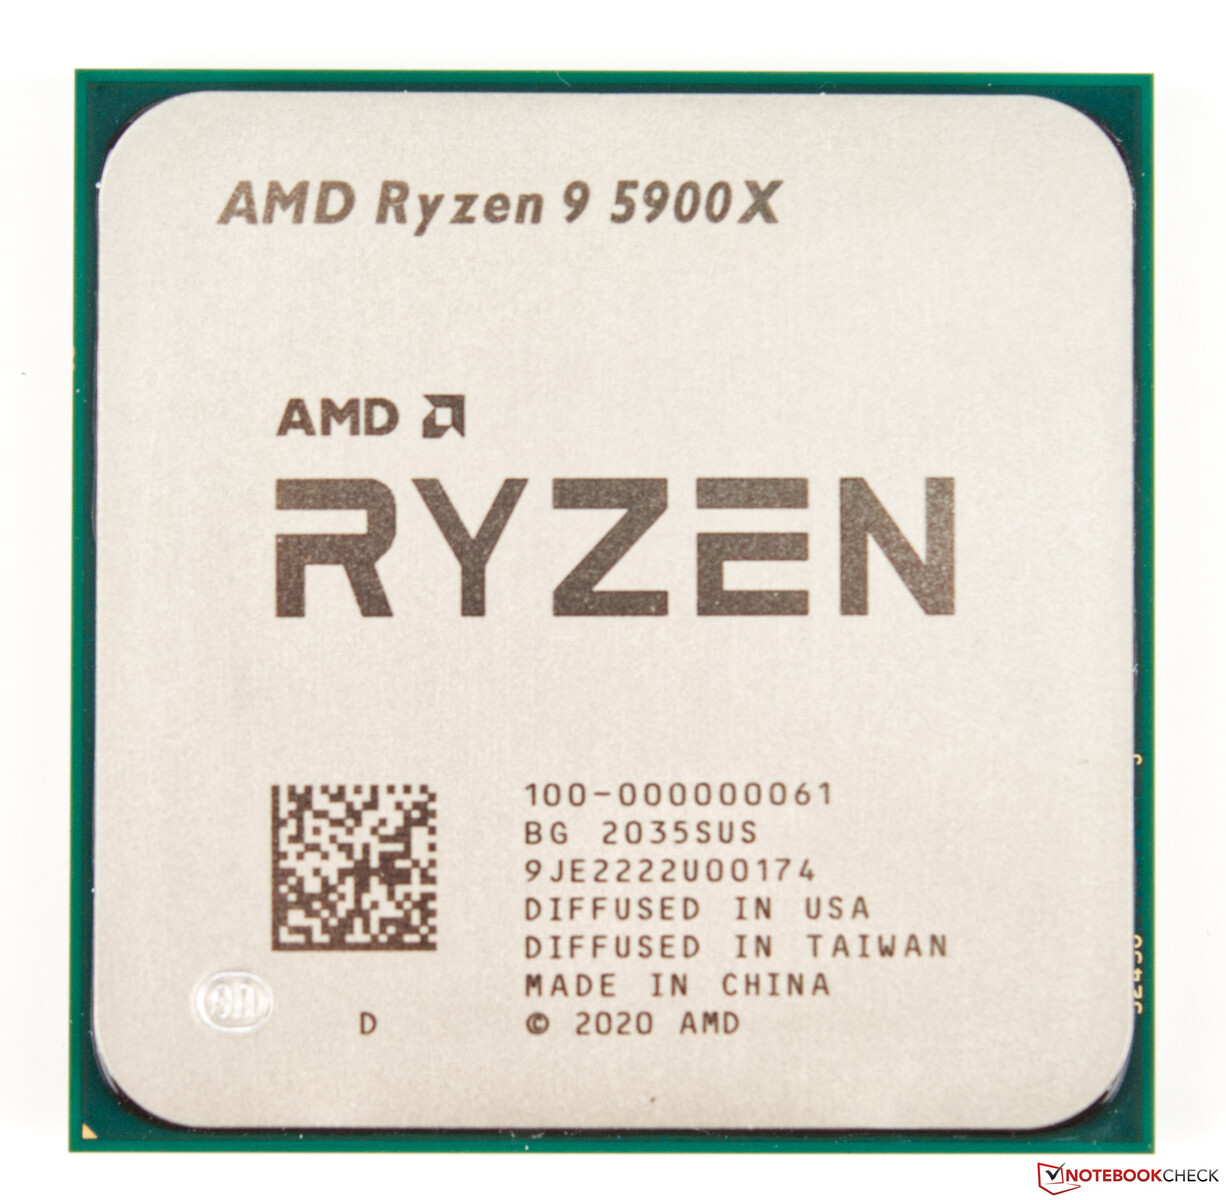
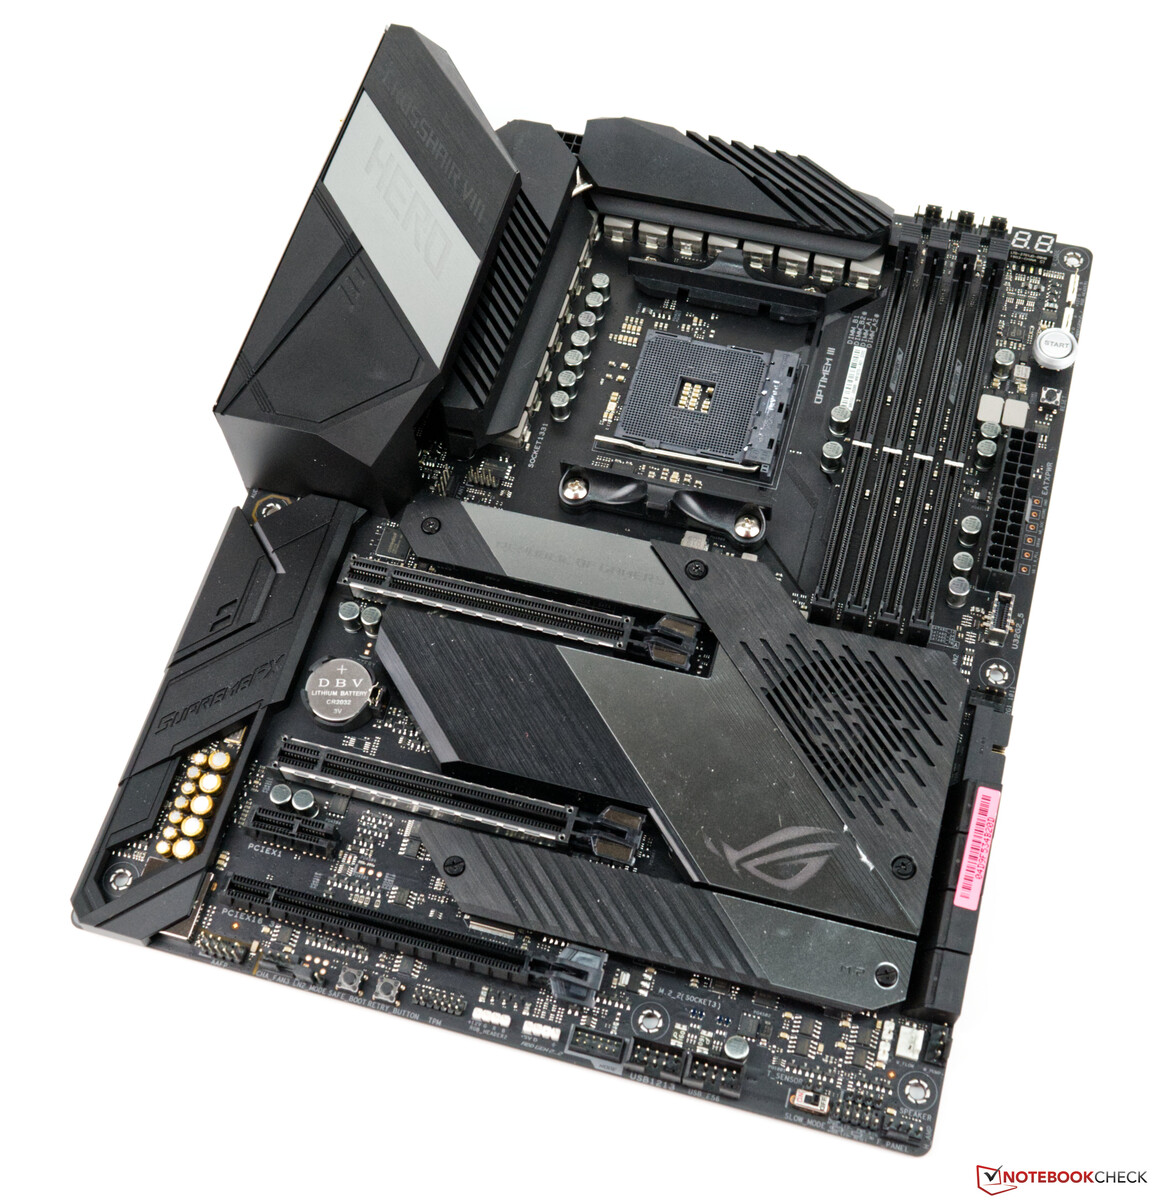
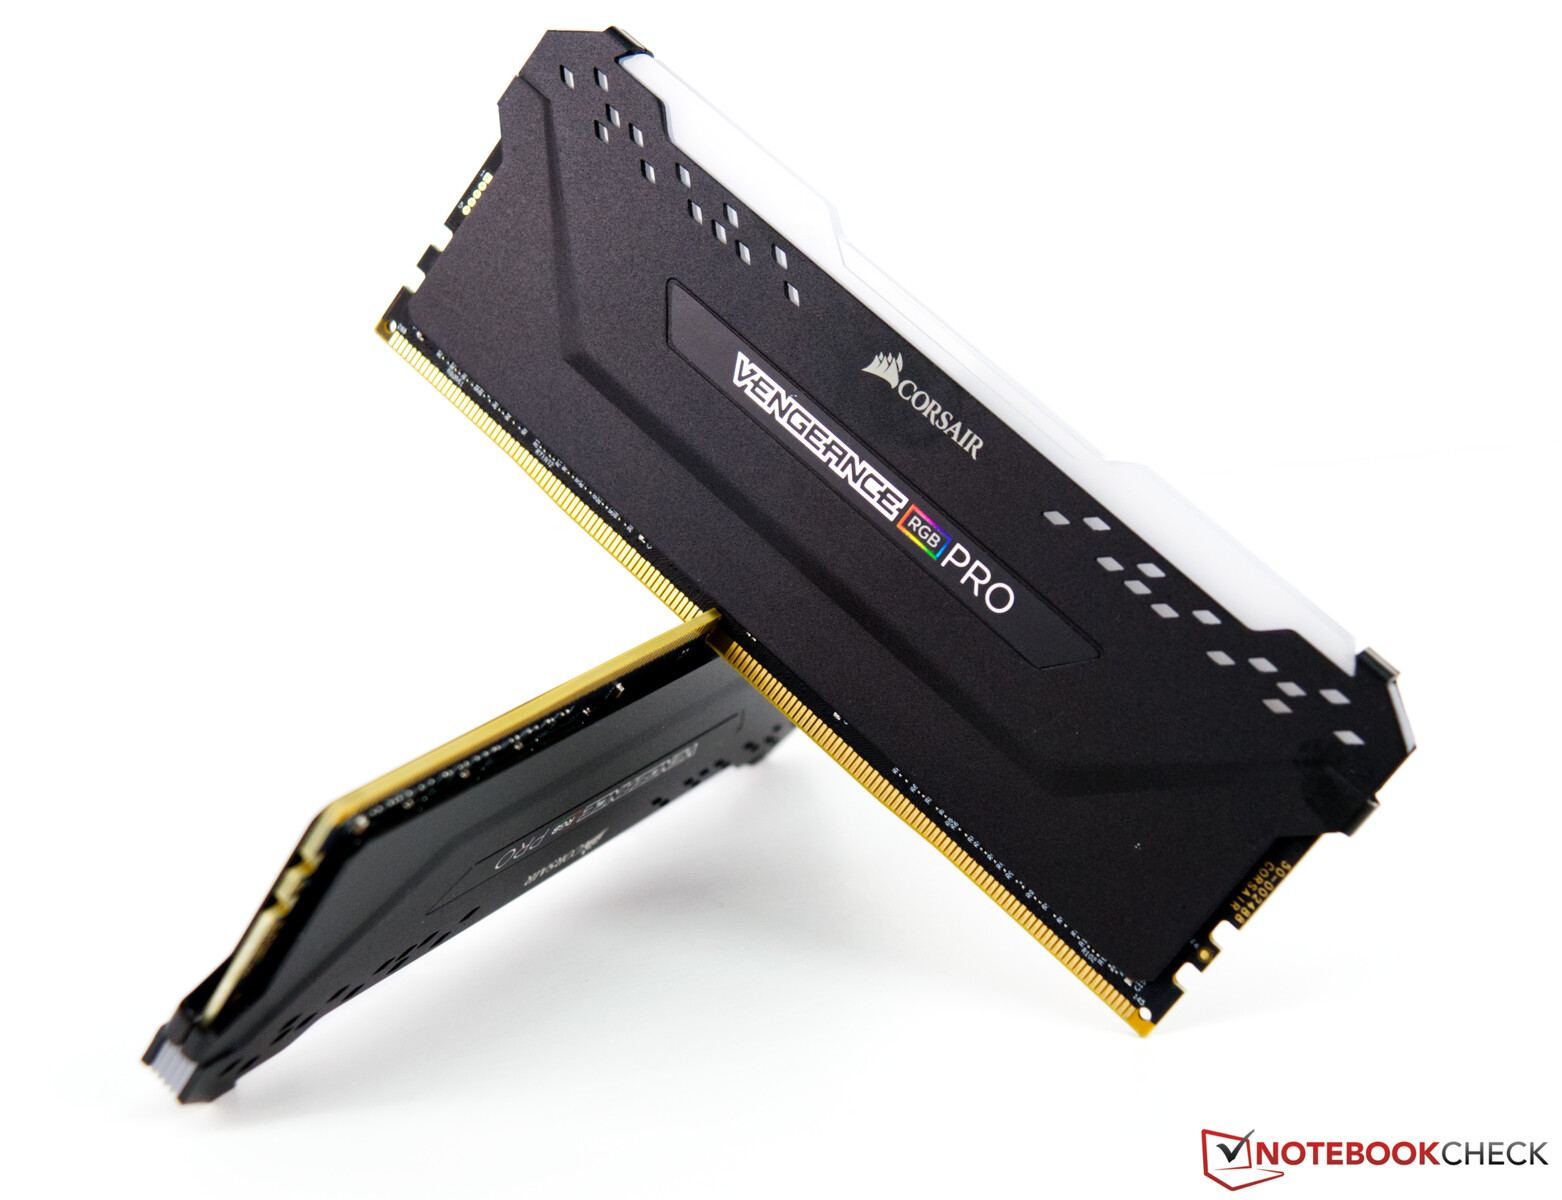
Une plateforme AMD actuelle basée sur le Crosshair VIII de l'Asus X570 ROG sert de système de test. Le processeur(AMD Ryzen 9 5900X) offre de bonnes performances, et nous avons utilisé un AIO(Alphacool Eisbaer 280cmm) pour le refroidissement. Les 32 Go de RAM proviennent de la société Corsair et s'affichent à 4 000 MHz. Comme moniteur, nous utilisons l'Acer Predator XB321HK. Il ne nous limite pas grâce à sa capacité UHD. A ce stade, nous voudrions remercier AMD pour avoir fourni la plate-forme de test ainsi que Corsair pour le kit de RAM
Pour les prochaines évaluations et tests, nous utilisons le système suivant
- Corsair Carbide Air 540 ATX Cube
- AMD Ryzen 9 5900X
- Asus GeForce RTX 3080 ROG Strix Gaming OC (piloteNvidia457.09)
- Asus X570 ROG Crosshair VIII (BIOS 2402, paramètres par défaut, XMP 1 pour DDR4 4000)
- Bloc d'alimentation Corsair RM1000X de 1000 watts
- Corsair Vengeance RGB Pro DDR4 4000 2x 16 GB RAMkit
- Corsair MP600 2 TB M.2 PCIe 4.0 SSD
- Crucial MX500 2 TB (pour les jeux)
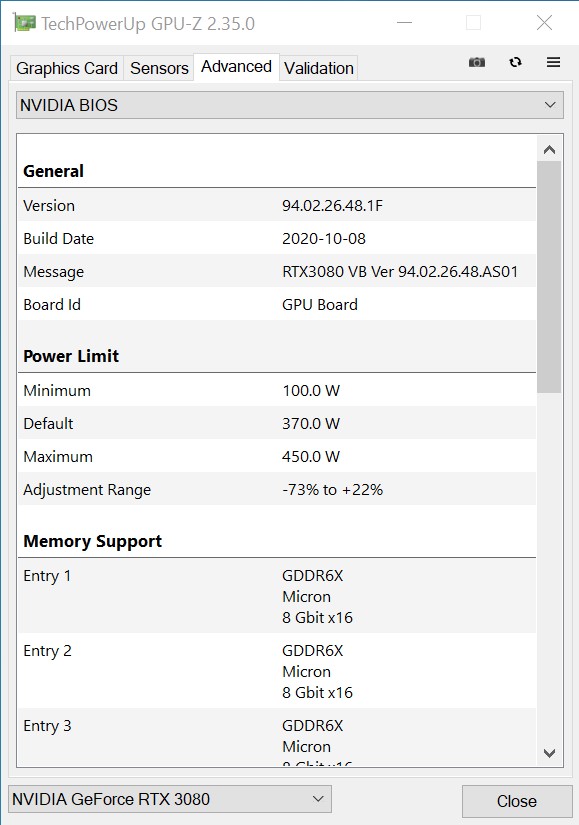
Les vitesses d'horloge de l'Asus GeForce RTX 3080 ROG Strix Gaming OC
À 1440 MHz, la vitesse de base de l'horloge de l'Asus GeForce RTX 3080 ROG Strix Gaming OC est restée inchangée par rapport au modèle de référence. Cependant, Asus prend un chemin différent en ce qui concerne la fréquence d'horloge de base et permet à son modèle d'atteindre une vitesse considérablement plus élevée jusqu'à 1 905 MHz. Cette fréquence d'horloge peut également être maintenue sans problème sous charge et est généralement même dépassée. En outre, Asus permet également d'atteindre une puissance plus élevée, jusqu'à 21 %. Ainsi, la GeForce RTX 3080 ROG Strix Gaming OC peut même fonctionner de manière stable à plus de 2 GHz. En termes de VRAM, il y a maintenant la GDDR6X au lieu de la GDDR6, qui était utilisée auparavant, bien que 10 Go devraient suffire maintenant par rapport à la RTX 2080 Ti. Pour l'instant, seul leGeForce RTX 3090 de la série Ampère actuelle offre plus de mémoire graphique.
Repères synthétiques
Dans les benchmarks synthétiques, l'Asus GeForce RTX 3080 ROG Strix Gaming OC commence déjà à montrer son potentiel assez clairement. Seul leGeForce RTX 3090 offre plus de performances ; nous l'avons déjà examiné dans la configuration de notre partenaire Zotac. Par rapport à la GeForce RTX 2080 Ti, notre échantillon de test peut se distinguer avec une avance d'environ 30%. Le systèmeNvidia Titan RTX n'arrive qu'en troisième position dans notre comparaison et n'arrive pas à suivre le GeForce RTX 3080.
Contrairement à l'édition Founders, Asus dispose d'une meilleure structure de refroidissement dans la GeForce RTX 3080 ROG Strix Gaming OC, ce qui se traduit par un léger avantage de performance par rapport au modèle de référence.
| Unigine Superposition | |
| 1280x720 720p Low | |
| Titan RTX | |
| Asus GeForce RTX 3080 ROG Strix Gaming OC | |
| 1920x1080 1080p High | |
| GeForce RTX 3090 | |
| Asus GeForce RTX 3080 ROG Strix Gaming OC | |
| Titan RTX | |
| 1920x1080 1080p Extreme | |
| GeForce RTX 3090 | |
| Asus GeForce RTX 3080 ROG Strix Gaming OC | |
| Titan RTX | |
| 3840x2160 4k Optimized | |
| GeForce RTX 3090 | |
| Asus GeForce RTX 3080 ROG Strix Gaming OC | |
| Titan RTX | |
| 7680x4320 8k Optimized | |
| GeForce RTX 3090 | |
| Asus GeForce RTX 3080 ROG Strix Gaming OC | |
| Titan RTX | |
| 3DMark 05 Standard | 46192 points | |
| 3DMark 06 Standard Score | 44255 points | |
| 3DMark Vantage P Result | 93066 points | |
| 3DMark 11 Performance | 32211 points | |
| 3DMark Ice Storm Standard Score | 238949 points | |
| 3DMark Cloud Gate Standard Score | 75364 points | |
| 3DMark Fire Strike Score | 33440 points | |
| 3DMark Fire Strike Extreme Score | 20455 points | |
| 3DMark Time Spy Score | 15712 points | |
Aide | ||
Repères de jeu
Les tests effectués sur les jeux révèlent que la GeForce RTX 3080 est plus adaptée aux hautes résolutions. Presque tous les jeux que nous avons testés pouvaient être joués à 2160p sans problème. Néanmoins, il y a des jeux spécifiques, comme Flight Simulator 2020, où même le GeForce RTX 3080 atteint ses limites. La nouvelle carte graphique présente le plus grand avantage lorsqu'elle va au-delà de 1080p. Si vous ne jouez pas en haute résolution, l'achat d'un RTX 3080 ne vaut pas la peine actuellement.
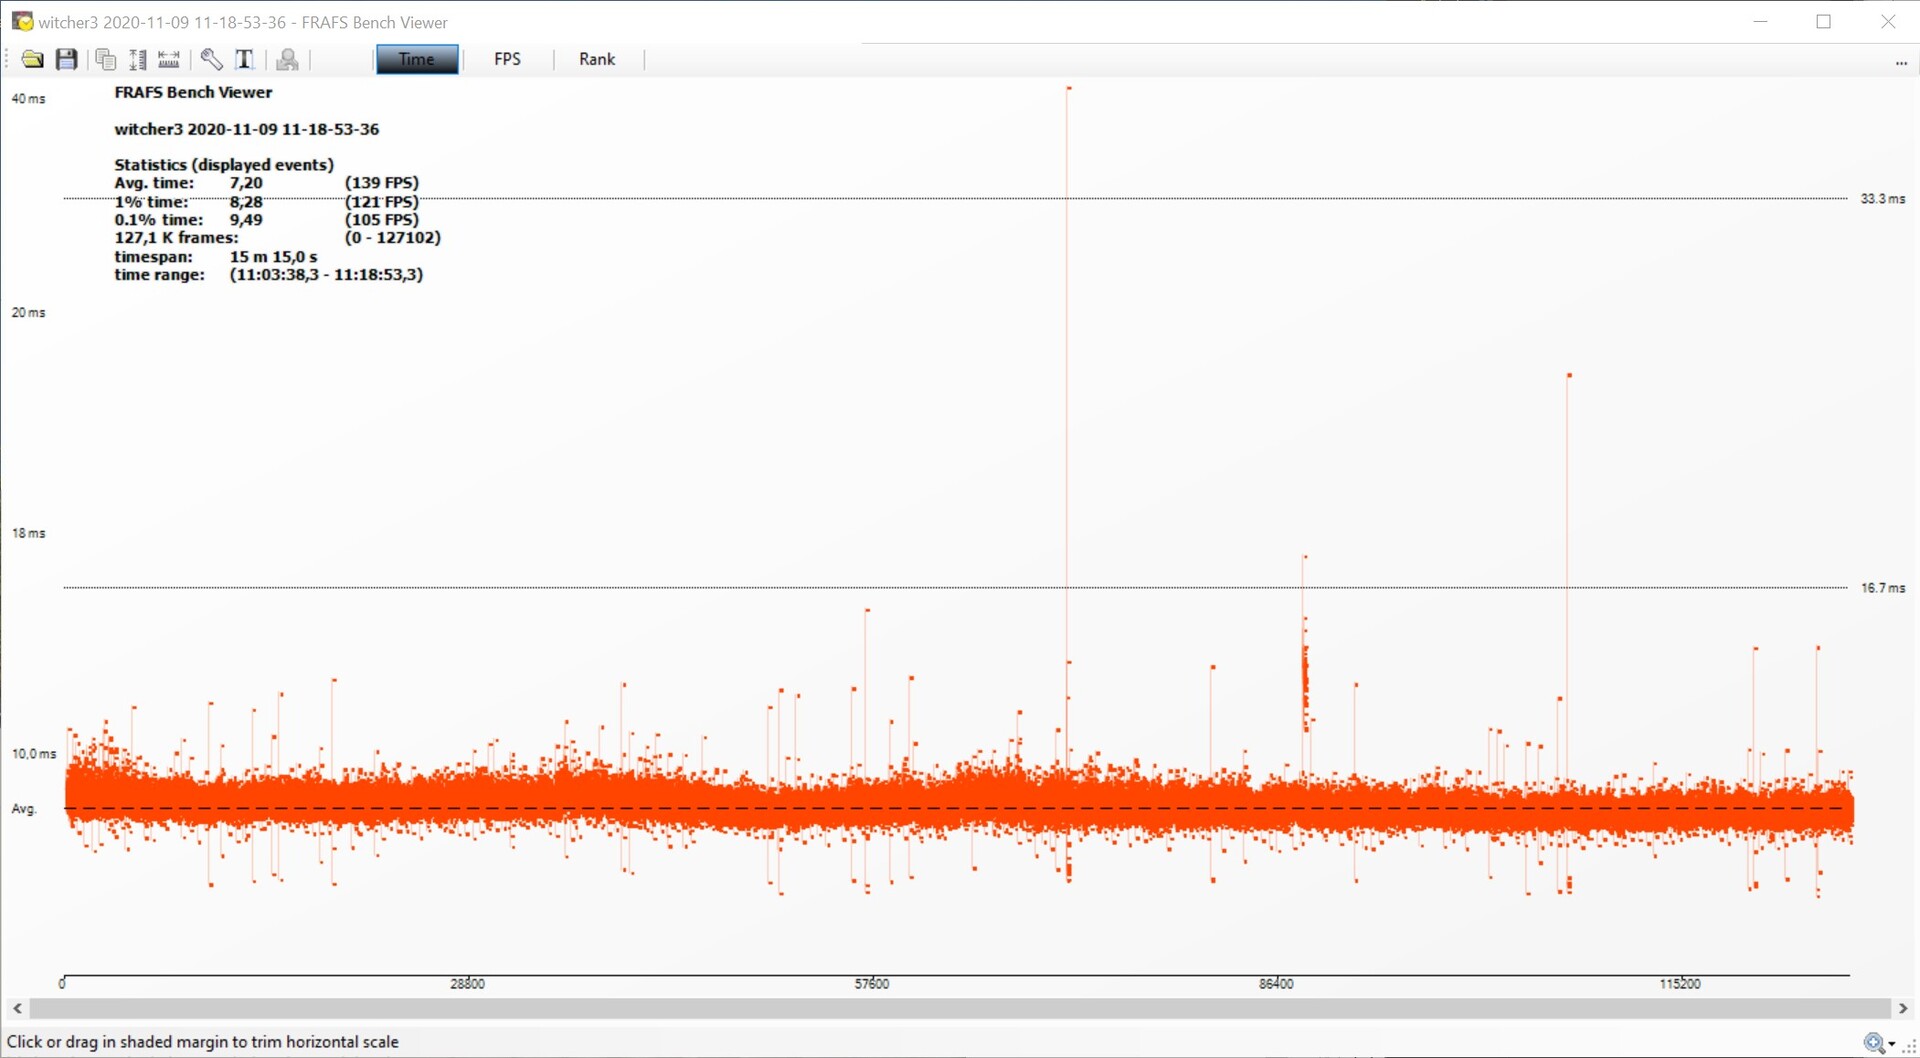
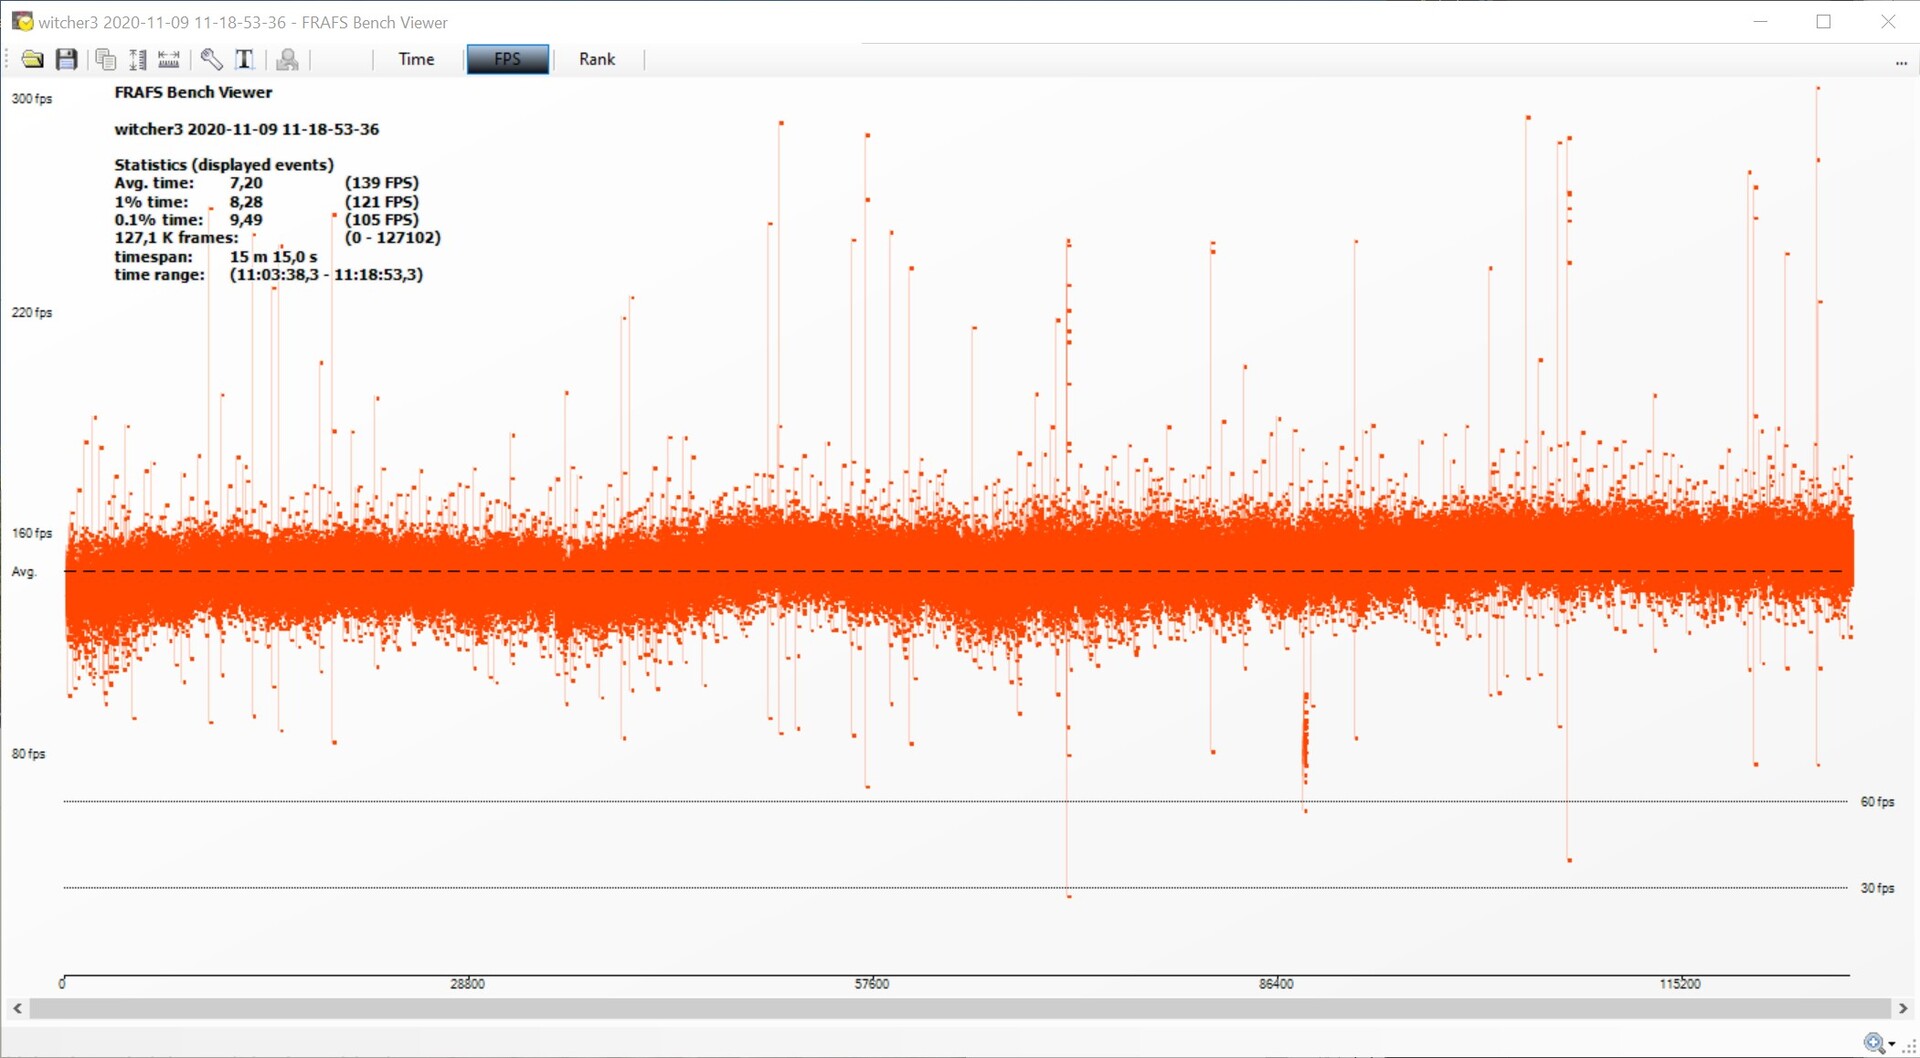
Mais la fluidité du jeu est garantie avec la carte graphique Asus GeForce RTX 3080 ROG Strix Gaming OC. Nous avons examiné la progression des images et aussi les temps de trame dans le jeu The Witcher 3 (Ultra preset) et n'avons pas trouvé d'irrégularités notables. Nous avons documenté les aberrations individuelles. Cependant, à 139 FPS, le jeu est sans aucun doute fluide.
The Witcher 3 frame progression - Ultra preset
| F1 2020 - 3840x2160 Ultra High Preset AA:T AF:16x | |
| GeForce RTX 3090 | |
| Asus GeForce RTX 3080 ROG Strix Gaming OC | |
| Titan RTX | |
| Borderlands 3 - 3840x2160 Badass Overall Quality (DX11) | |
| GeForce RTX 3090 | |
| Asus GeForce RTX 3080 ROG Strix Gaming OC | |
| Titan RTX | |
| Titan RTX | |
| GeForce RTX 2080 Ti (Desktop) | |
| Red Dead Redemption 2 - 3840x2160 Maximum Settings | |
| GeForce RTX 3090 | |
| Asus GeForce RTX 3080 ROG Strix Gaming OC | |
| Titan RTX | |
| Rise of the Tomb Raider - 3840x2160 High Preset AA:FX AF:4x | |
| Asus GeForce RTX 3080 ROG Strix Gaming OC | |
| GeForce RTX 2080 Ti (Desktop) | |
| GeForce RTX 2080 Super (Desktop) | |
| GeForce RTX 2080 (Desktop) | |
| GeForce RTX 2070 Super (Desktop) | |
| GeForce RTX 2070 (Desktop) | |
| Radeon VII | |
| GeForce RTX 2060 Super (Desktop) | |
| RX Vega 64 | |
| GeForce RTX 2060 (Desktop) | |
| Shadow of the Tomb Raider - 3840x2160 Highest Preset AA:T | |
| GeForce RTX 3090 | |
| Asus GeForce RTX 3080 ROG Strix Gaming OC | |
| Titan RTX | |
| Titan RTX | |
| GeForce RTX 2080 Ti (Desktop) | |
| GeForce RTX 2080 Super (Desktop) | |
| GeForce RTX 2080 (Desktop) | |
| Radeon VII | |
| GeForce RTX 2070 Super (Desktop) | |
| GeForce RTX 2070 (Desktop) | |
| Radeon RX 5700 XT (Desktop) | |
| GeForce RTX 2060 Super (Desktop) | |
| Radeon RX 5700 (Desktop) | |
| GeForce RTX 2060 (Desktop) | |
| RX Vega 64 | |
| Bas | Moyen | Élevé | Ultra | QHD | 4K | |
|---|---|---|---|---|---|---|
| GTA V (2015) | 187 | 187 | 184 | 130 | 122 | 136 |
| The Witcher 3 (2015) | 427 | 375 | 286 | 152 | 115 | |
| Dota 2 Reborn (2015) | 216.6 | 197.1 | 184.4 | 168.7 | 159.1 | |
| Rise of the Tomb Raider (2016) | 327 | 231 | 217 | 217 | 107 | |
| Final Fantasy XV Benchmark (2018) | 228 | 205 | 156 | 124 | 76.1 | |
| X-Plane 11.11 (2018) | 165 | 153 | 123 | 105 | ||
| Far Cry 5 (2018) | 184 | 162 | 155 | 145 | 137 | 95 |
| Strange Brigade (2018) | 567 | 416 | 336 | 289 | 220 | 135 |
| Shadow of the Tomb Raider (2018) | 227 | 206 | 198 | 185 | 147 | 83.9 |
| Battlefield V (2018) | 192 | 178 | 163 | 152 | 132 | 94.2 |
| Apex Legends (2019) | 144 | 144 | 144 | 144 | 144 | 143 |
| Far Cry New Dawn (2019) | 150 | 132 | 127 | 115 | 110 | 89 |
| Metro Exodus (2019) | 212 | 155 | 143 | 111 | 92.2 | 64.1 |
| The Division 2 (2019) | 240 | 197 | 168 | 140 | 107 | 65 |
| Anno 1800 (2019) | 142 | 139 | 99.3 | 54.1 | 52.5 | 46.3 |
| Rage 2 (2019) | 294 | 209 | 182 | 180 | 134 | 72.1 |
| Control (2019) | 240 | 196 | 155 | 106 | 56.2 | |
| Borderlands 3 (2019) | 165 | 143 | 129 | 128 | 103 | 61.5 |
| Star Wars Jedi Fallen Order (2019) | 134 | 132 | 133 | 132 | 92.9 | |
| Red Dead Redemption 2 (2019) | 167 | 154 | 135 | 96 | 81 | 56 |
| Hunt Showdown (2020) | 236 | 173 | 172 | 155 | 95.8 | |
| Doom Eternal (2020) | 283 | 277 | 270 | 268 | 248 | 153 |
| F1 2020 (2020) | 367 | 255 | 239 | 185 | 155 | 118 |
| Horizon Zero Dawn (2020) | 164 | 151 | 147 | 141 | 133 | 95 |
| Flight Simulator 2020 (2020) | 115 | 97.4 | 79.9 | 62.8 | 55.6 | 37.3 |
| Serious Sam 4 (2020) | 182.5 | 148.6 | 138.1 | 135.2 | 124.8 | 117 |
| Mafia Definitive Edition (2020) | 199 | 184 | 169 | 137 | 78.2 | |
| Star Wars Squadrons (2020) | 586 | 433 | 379 | 358 | 266 | 169 |
| FIFA 21 (2020) | 306 | 312 | 293 | 295 | 295 | 284 |
| Watch Dogs Legion (2020) | 147 | 146 | 125 | 103 | 81.6 | 54.1 |
| Dirt 5 (2020) | 176 | 121 | 111 | 111 | 69.1 | 55.3 |
Calcul des performances
Dans LuxMark et ComputeMark, l'Asus GeForce RTX 3080 ROG Strix Gaming OC obtient des résultats nettement meilleurs que les anciens modèles de comparaison. Les tests SPECviewperf sont principalement destinés aux stations de travail. Ici, les modèles Quadro et FirePro offrent souvent plus de performances grâce à l'optimisation des pilotes. Le Nvidia Titan RTX a une position particulière ici, puisqu'il est identique dans sa construction au RTX 6000 de la série Quadro. Dans l'ensemble, elle offre les meilleures performances, bien que les nouvelles cartes graphiques Ampere offrent de meilleures valeurs dans les différentes disciplines.
Émissions de l'Asus GeForce RTX 3080 ROG Strix Gaming OC
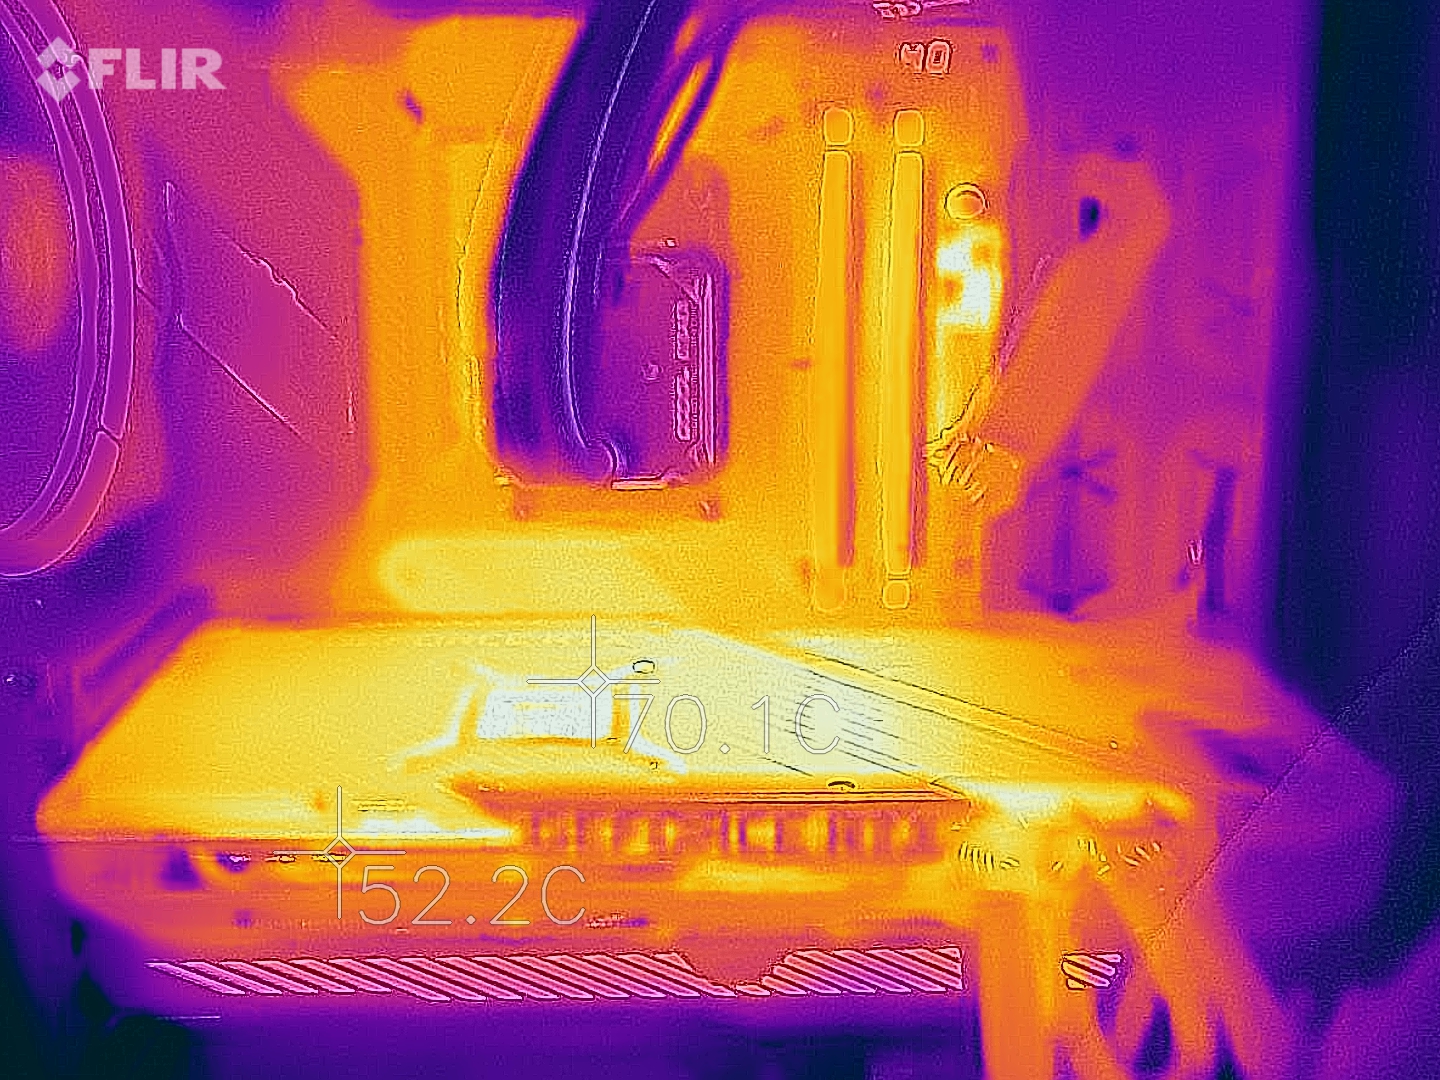

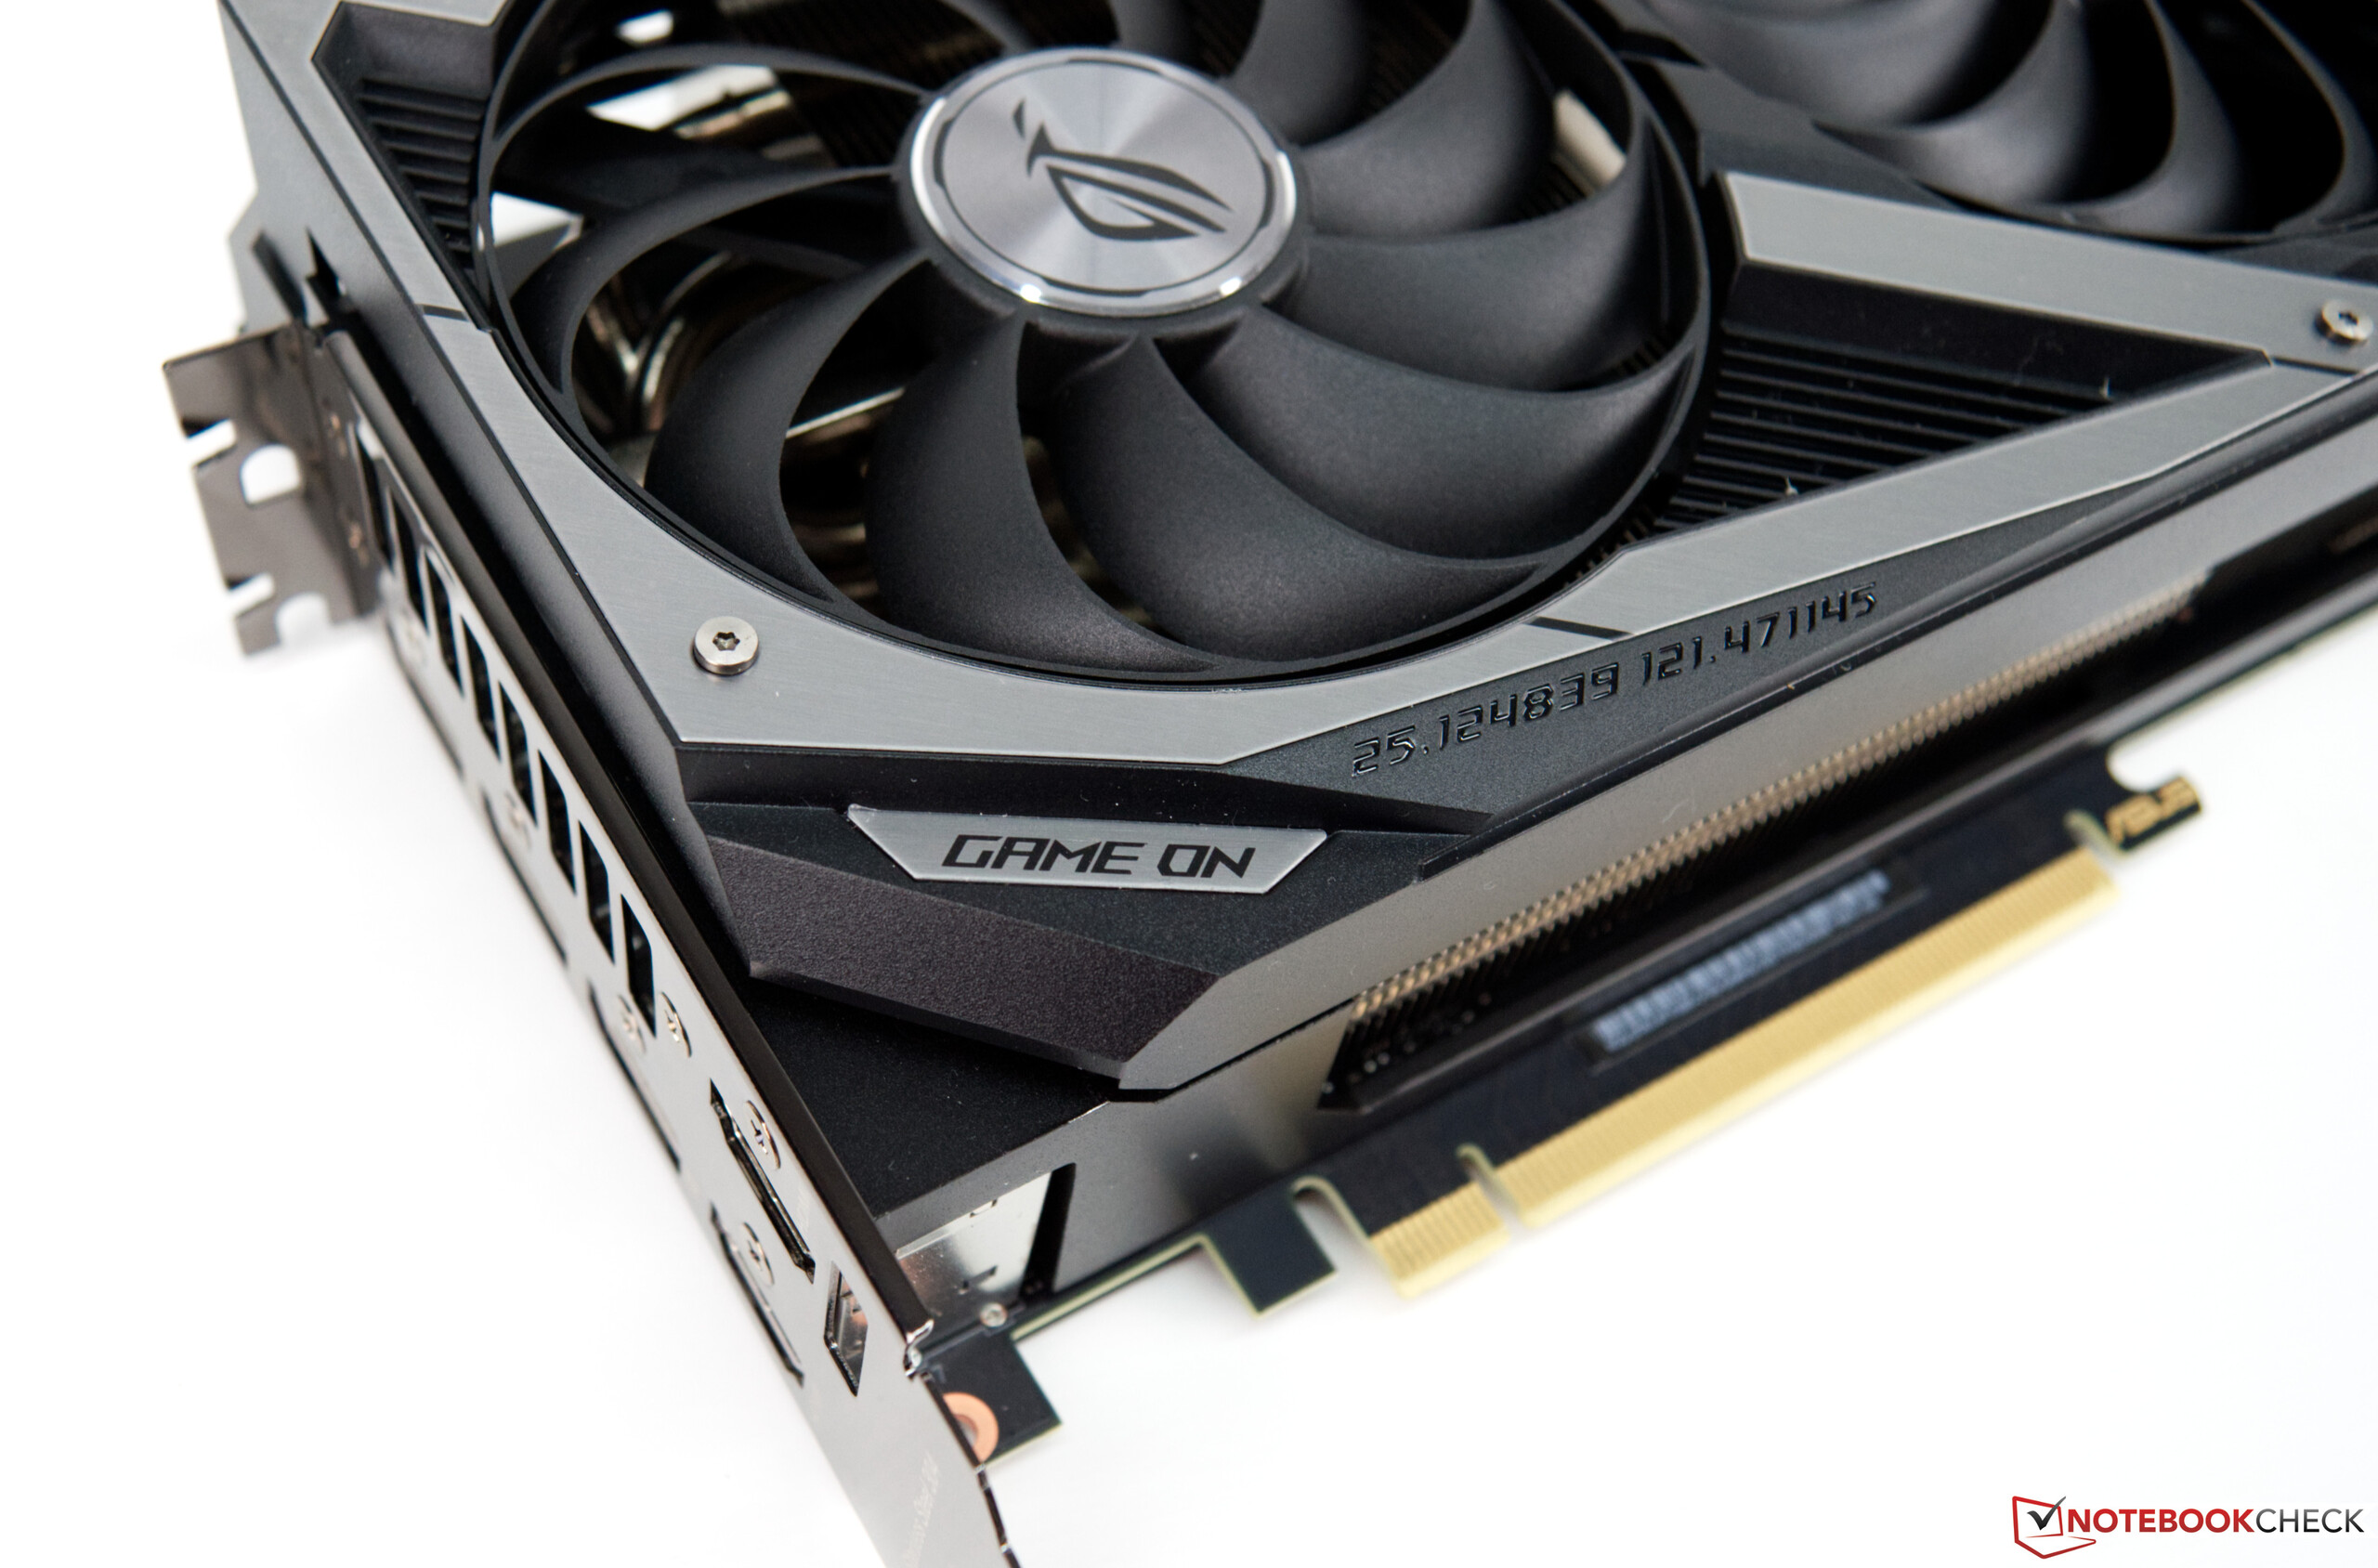
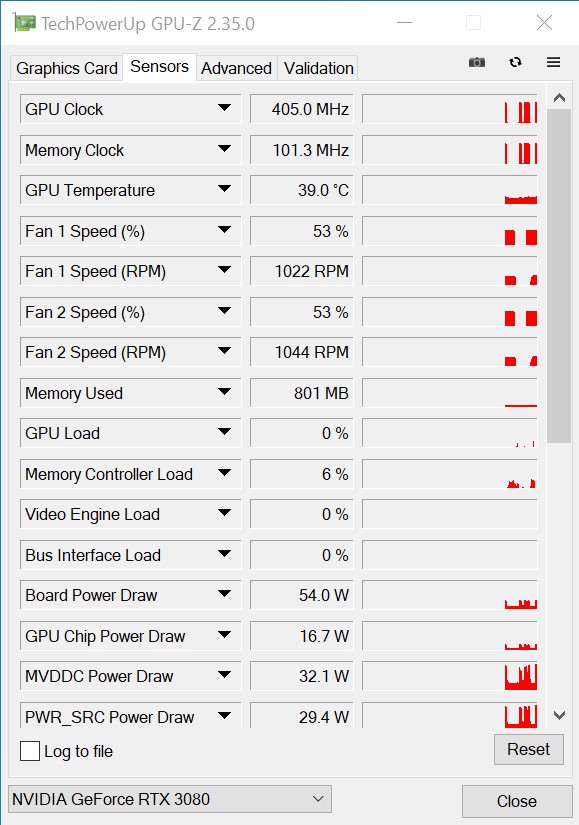
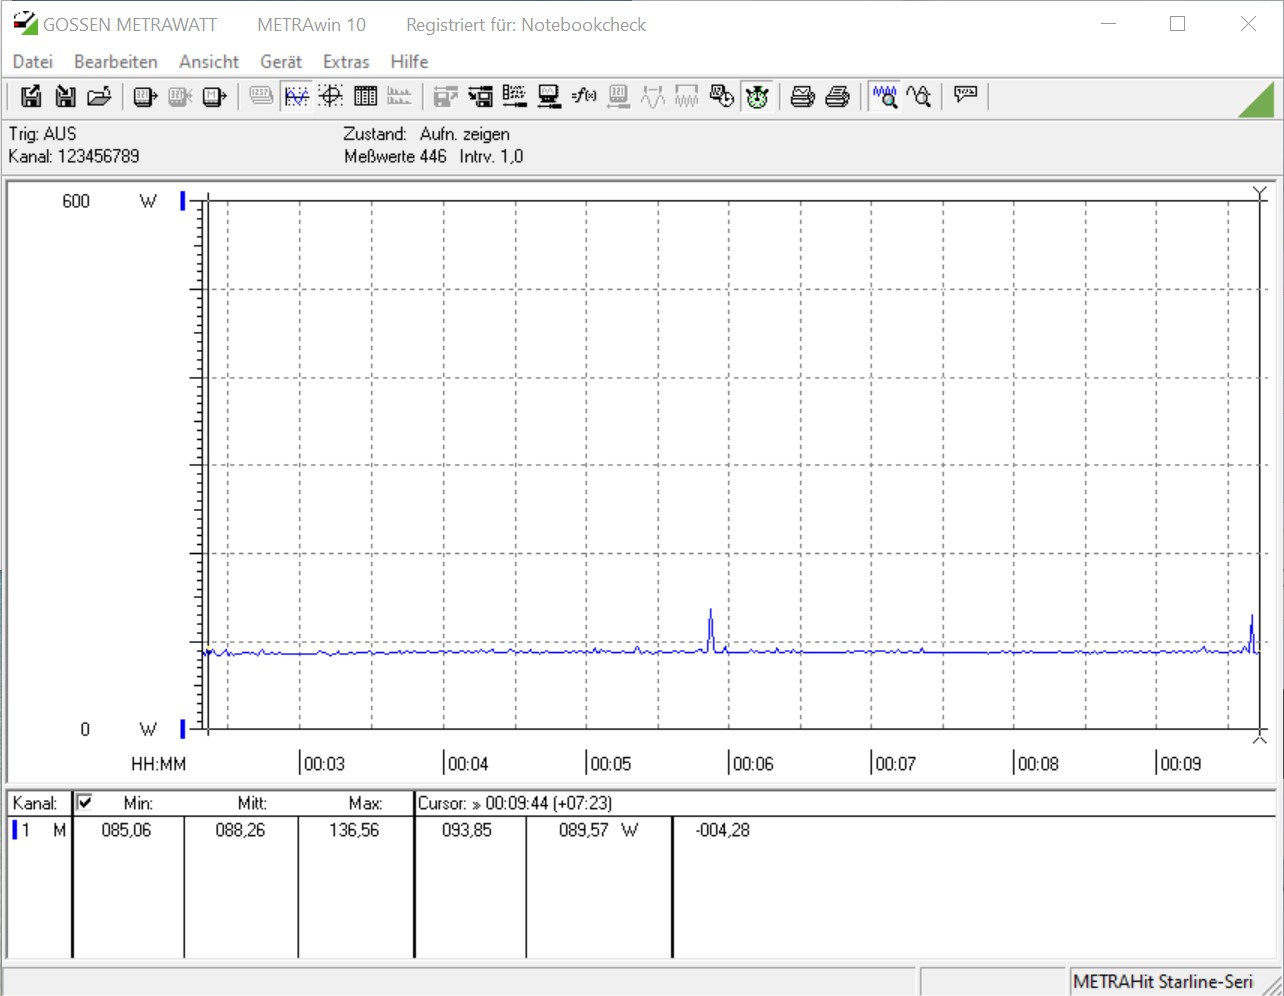
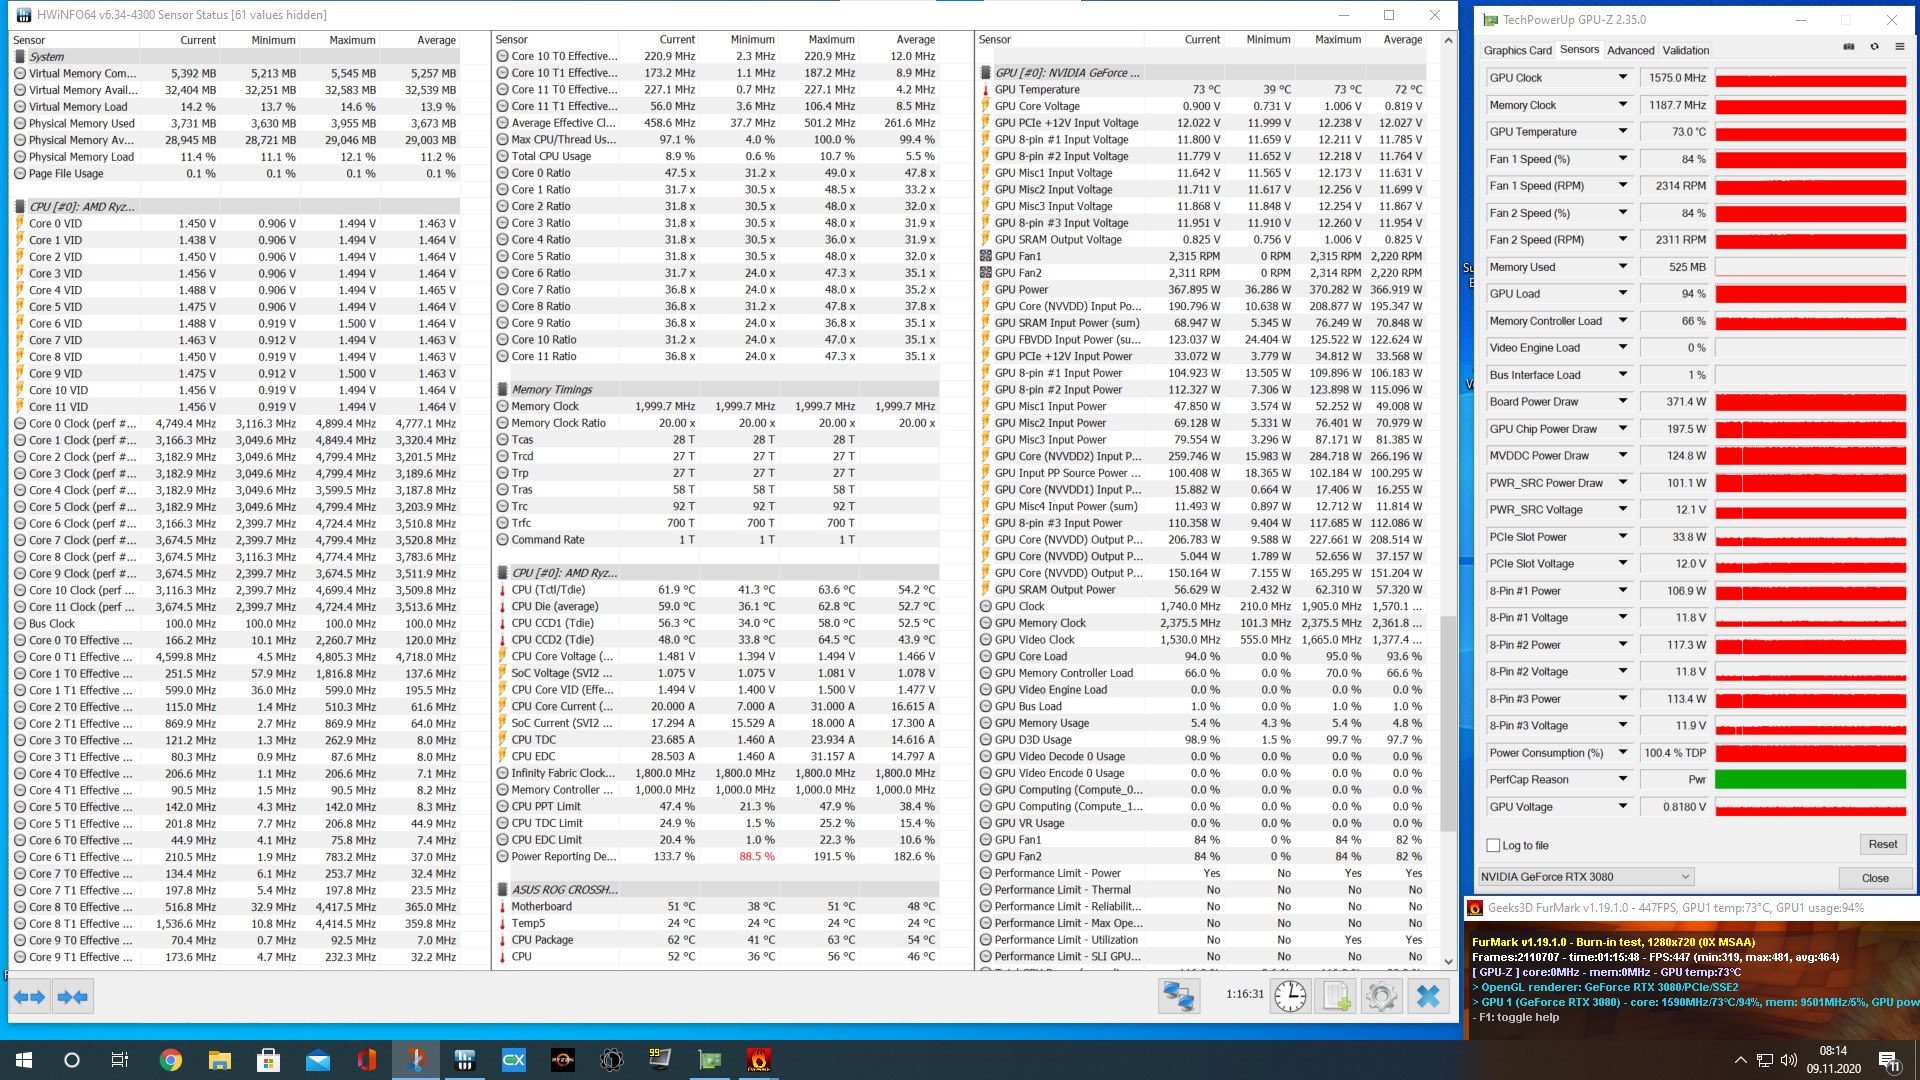
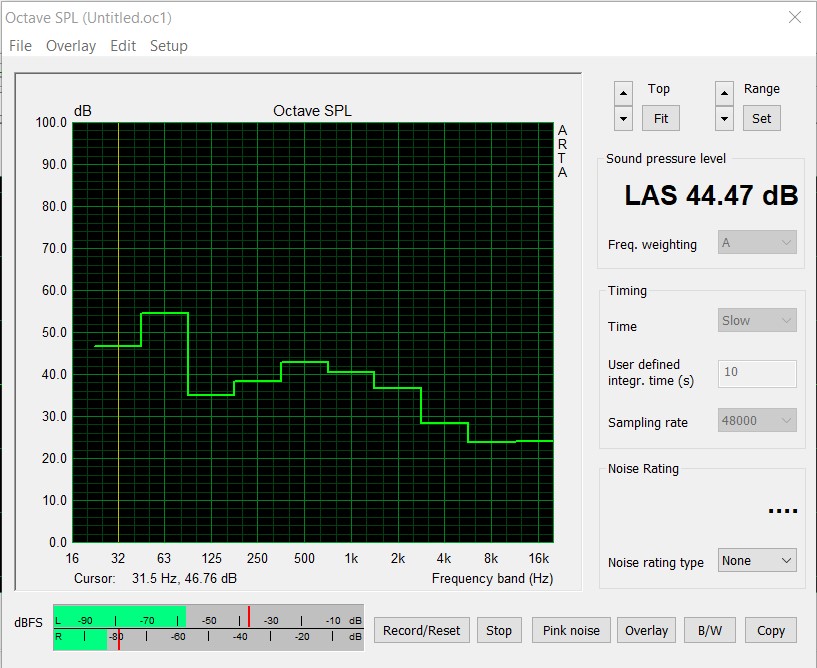
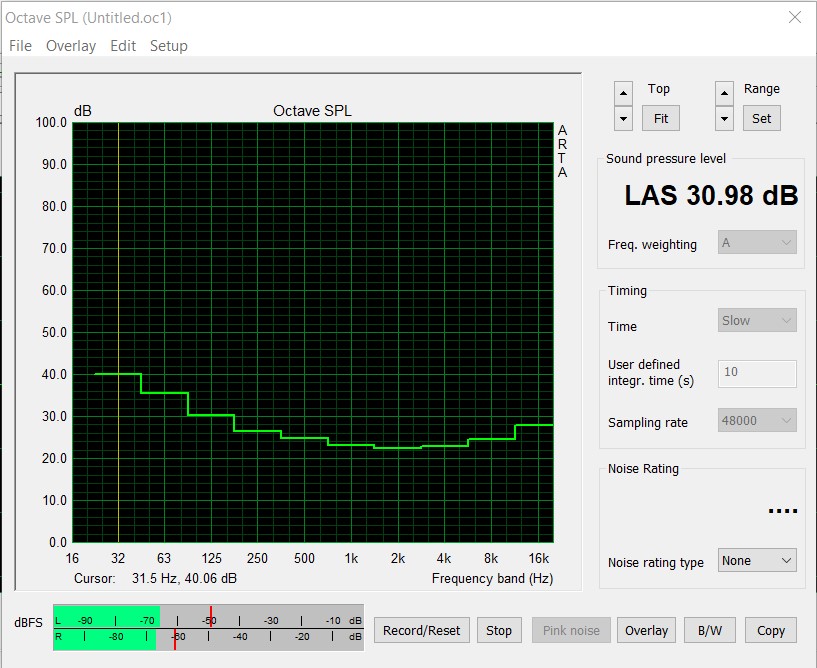
L'Asus GeForce RTX 3080 ROG Strix Gaming OC n'est en aucun cas une carte graphique économe en énergie. Mais avec un TDP de 320 watts, elle est à égalité avec l'édition Founders. Le refroidisseur extrêmement saillant est ventilé par trois ventilateurs axiaux, ce qui a été compensé par de bonnes températures lors du test. Il convient de mentionner que le ventilateur central tourne dans le sens opposé aux deux ventilateurs latéraux. Dans le test de résistance avec le boîtier fermé, la carte graphique a chauffé jusqu'à 73 °C, ce qui peut être considéré comme un très bon résultat. En outre, le niveau de bruit n'est pas trop élevé, même lorsque les ventilateurs tournent à un bon 2 300 tours par minute. Avec notre système de mesure, nous avons pu détecter environ 44 dB(A). Au repos, la carte graphique est complètement silencieuse grâce au mode d'arrêt des ventilateurs. Un faible bruit de bobine se produit de temps en temps dès que la fréquence d'images dans les menus dépasse 1 000. En général, le problème n'est pas aussi présent sur l'Asus GeForce RTX 3080 ROG Strix Gaming OC que sur les autres cartes graphiques que nous avons déjà testées.
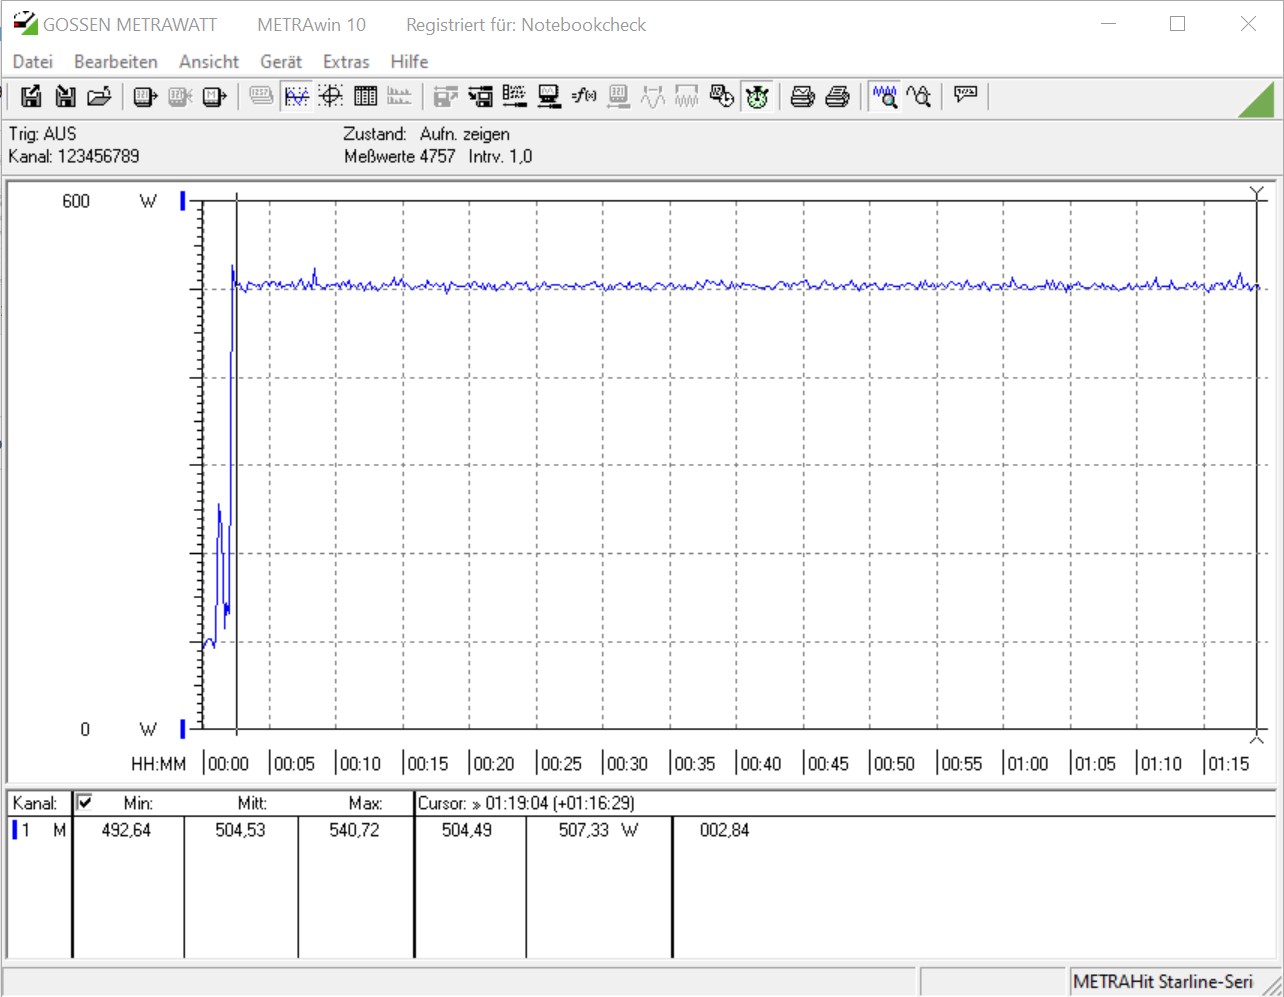
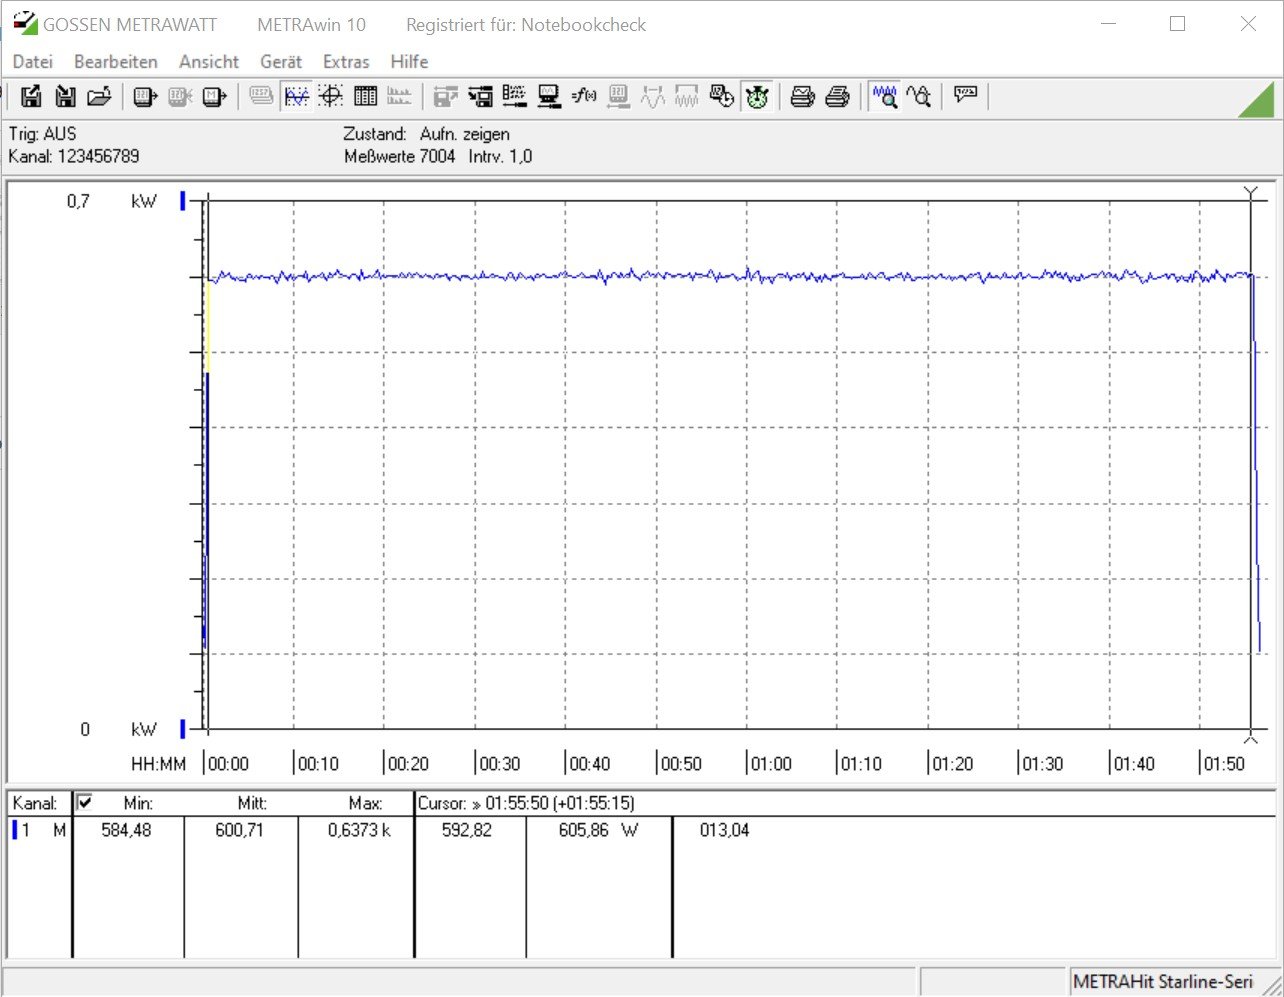
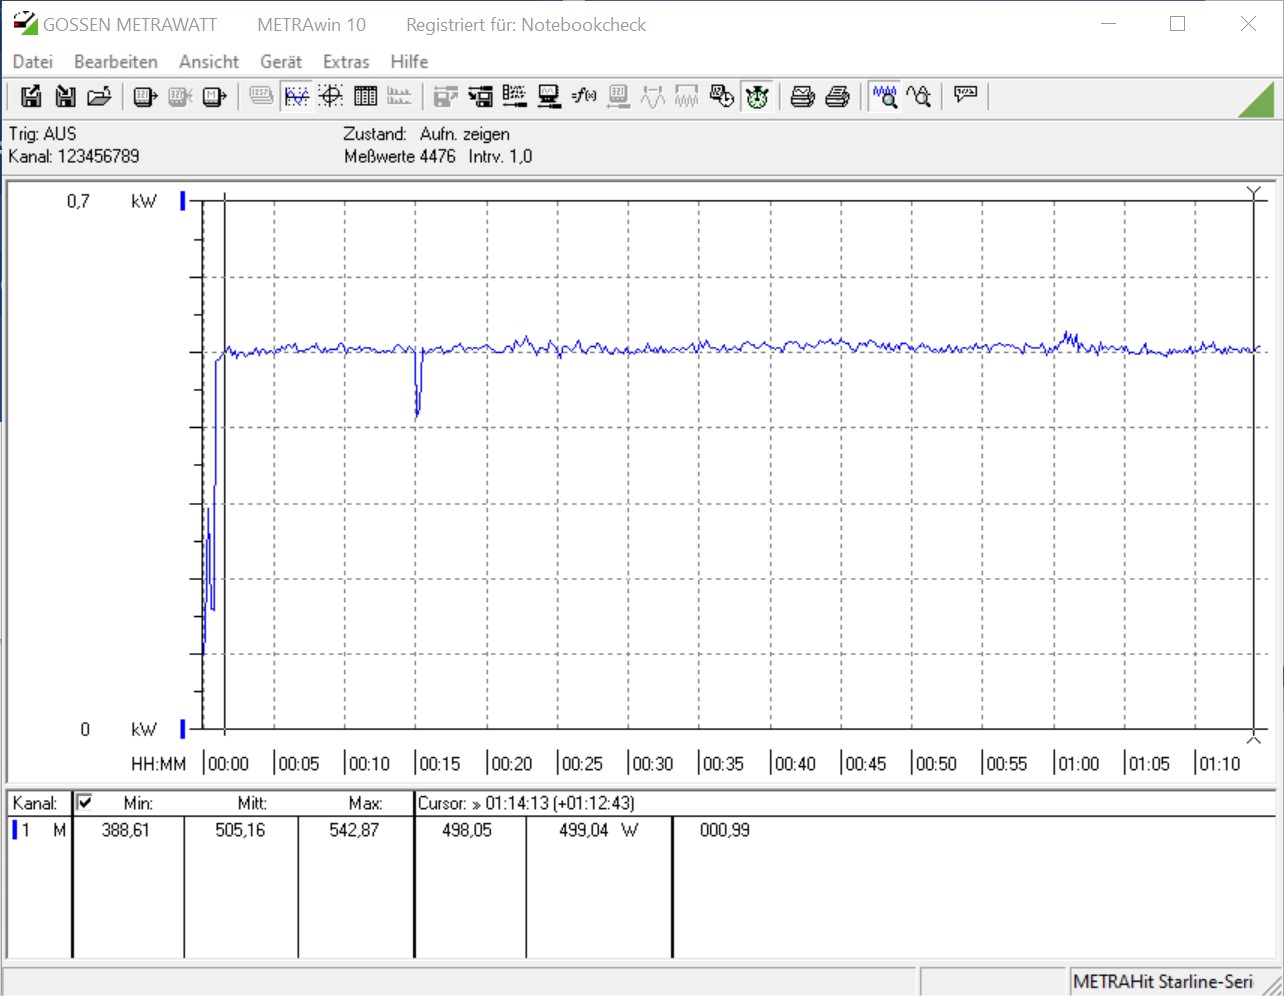
La GeForce RTX 3080 est assez gourmande en énergie. Il suffit de regarder la carte graphique pour se rendre compte qu'une alimentation électrique puissante est nécessaire, car l'Asus GeForce RTX 3080 ROG Strix Gaming OC nécessite trois connexions électriques à 8 broches. Avec environ 505 watts, nous avons mesuré des valeurs presque identiques pour l'ensemble du système sous charge, aussi bien dans le test de stress que dans le test de jeu. Si nous augmentons maintenant la puissance cible à 121 %, notre appareil de mesure affiche un peu plus de 600 watts dans le test de stress. Par conséquent, il n'est pas surprenant que l'Asus recommande une alimentation électrique d'au moins 850 watts.
| Power Consumption | |
| 1920x1080 The Witcher 3 ultra (external Monitor) | |
| ASUS GeForce RTX 3080 ROG STRIX OC GAMING (Idle: 88.3 W) | |
| KFA2 GeForce RTX 2080 Ti EX (Idle: 100.5 W) | |
| AMD Radeon RX Vega 64 (Idle: 74.3 W) | |
| MSI RTX 2080 Gaming X Trio (Idle: 87.78 W) | |
| Nvidia GeForce RTX 2080 Super (Idle: 78.87 W) | |
| AMD Radeon RX 5700 XT (Idle: 69.8 W) | |
| Nvidia GeForce RTX 2070 Super (96.8 ips, Idle: 80.5 W) | |
| MSI RTX 2070 Gaming Z 8G (Idle: 73.3 W) | |
| AMD Radeon VII (Idle: 81.39 W) | |
| Nvidia GeForce RTX 2060 Super (82.7 ips, Idle: 77.12 W) | |
| AMD Radeon RX 5700 (84.2 ips, Idle: 64.5 W) | |
| MSI RTX 2060 Gaming Z 6G (Idle: 74.66 W) | |
| 1280x720 FurMark 1.19 GPU Stress Test (external Monitor) | |
| ASUS GeForce RTX 3080 ROG STRIX OC GAMING (Idle: 88.3 W) | |
| AMD Radeon VII (Idle: 81.39 W) | |
| MSI RTX 2080 Gaming X Trio | |
| KFA2 GeForce RTX 2080 Ti EX (Idle: 100.5 W) | |
| Nvidia GeForce RTX 2080 Super (Idle: 78.87 W) | |
| MSI RTX 2070 Gaming Z 8G (Idle: 73.3 W) | |
| AMD Radeon RX 5700 XT (239 ips, Idle: 69.8 W) | |
| Nvidia GeForce RTX 2070 Super (283 ips, Idle: 80.5 W) | |
| MSI RTX 2060 Gaming Z 6G (Idle: 74.66 W) | |
| Nvidia GeForce RTX 2060 Super (237 ips, Idle: 77.12 W) | |
| AMD Radeon RX 5700 (207 ips, Idle: 64.5 W) | |
* ... Moindre est la valeur, meilleures sont les performances
Points positifs
Points négatifs
Verdict - Rapide et silencieux sous charge

Avec la GeForce RTX 3080 ROG Strix Gaming OC, Asus dispose sans aucun doute d'une carte graphique très rapide sur le marché. Elle permet de jouer sans problème à tous les derniers jeux. Mais cette carte graphique ne commence à faire du bien que lorsqu'elle dépasse une résolution native de 1080p. La génération actuelle d'Ampère peut ici se distinguer nettement de celle de Turing. Si vous ajoutez le DLSS ou le Ray Tracing par-dessus, l'avantage de la nouvelle architecture devient encore plus grand. Cependant, les utilisateurs doivent vivre avec des inconvénients par rapport à un RTX 2080 Ti en termes de VRAM, car à 10 Go sur le RTX 3080, celui-ci est plus petit que sur le 2080 Ti (11 Go). À long terme, cependant, cela pourrait entraîner la chute du RTX 3080, car AMD a déjà annoncé ses trois meilleurs modèles de la série 6000 et utilise systématiquement 16 Go de VRAM ici. Les rumeurs de Nvidia se propagent et un RTX3080 Ti avec plus de shaders et 20 Go de VRAM est déjà censé être en préparation.
Mais à quoi sert une carte graphique rapide si elle n'est pas disponible à l'achat ? Nvidia, et donc aussi ses partenaires de carte, ont déjà gaspillé beaucoup de potentiel dans ce domaine, car la demande ne peut toujours pas être satisfaite. Selon des rapports internes, cette situation devrait perdurer jusqu'en 2021.
L'Asus GeForce RTX 3080 ROG Strix Gaming OC est l'une des cartes graphiques RTX 3080 les plus rapides, qui est également dotée d'un bon système de refroidissement. Le système de refroidissement bien pensé est convaincant, et avec l'éclairage RGB discret, il y a aussi de quoi régaler les yeux.
Ceux qui ont déjà réussi à mettre la main sur un modèle RTX 3080 seront récompensés par une bonne dose de puissance graphique. Mais cela entraîne également une consommation d'énergie élevée, dont il faut tenir compte lors de l'achat. Il est important de choisir le bon bloc d'alimentation afin de ne pas souffrir d'un horrible crash du système sous charge. Asus recommande une alimentation électrique d'au moins 850 watts pour notre échantillon d'essai.
Le prix de l'Asus GeForce RTX 3080 ROG Strix Gaming OC est actuellement de 999 euros (~1 185 $). C'est 300 euros (~356 $) de plus que le prix de vente conseillé de l'édition Founders ; mais les petites quantités font monter les prix extrêmement haut, de sorte que même l'édition Founders est partiellement proposée à plus de 1 000 euros (~1 186 $). Nous vous conseillons donc d'attendre de voir ce que fait la concurrence, afin de ne pas regretter votre décision d'achat plus tard.
Tous les repères et valeurs de test pour le RTX 3080 sont disponibles sur lesite de la carte graphique pour le GeForce RTX 3080 (régulièrement mis à jour).

