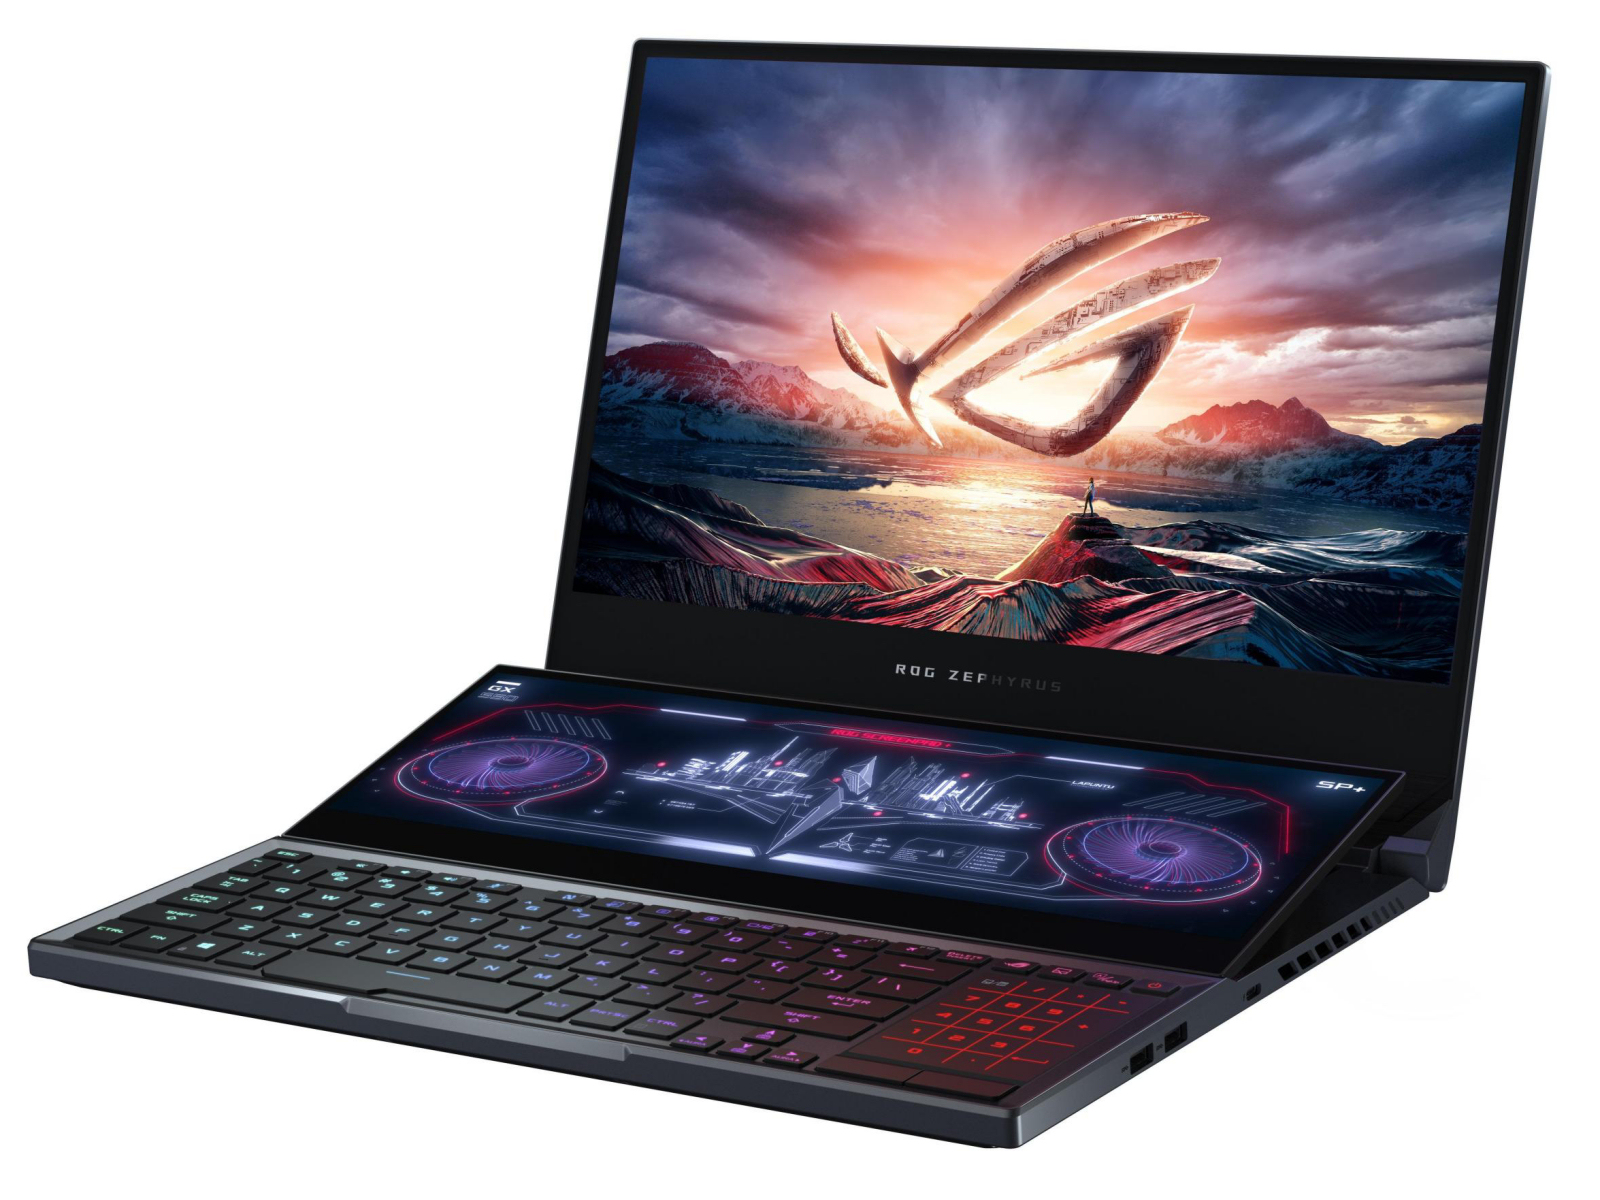
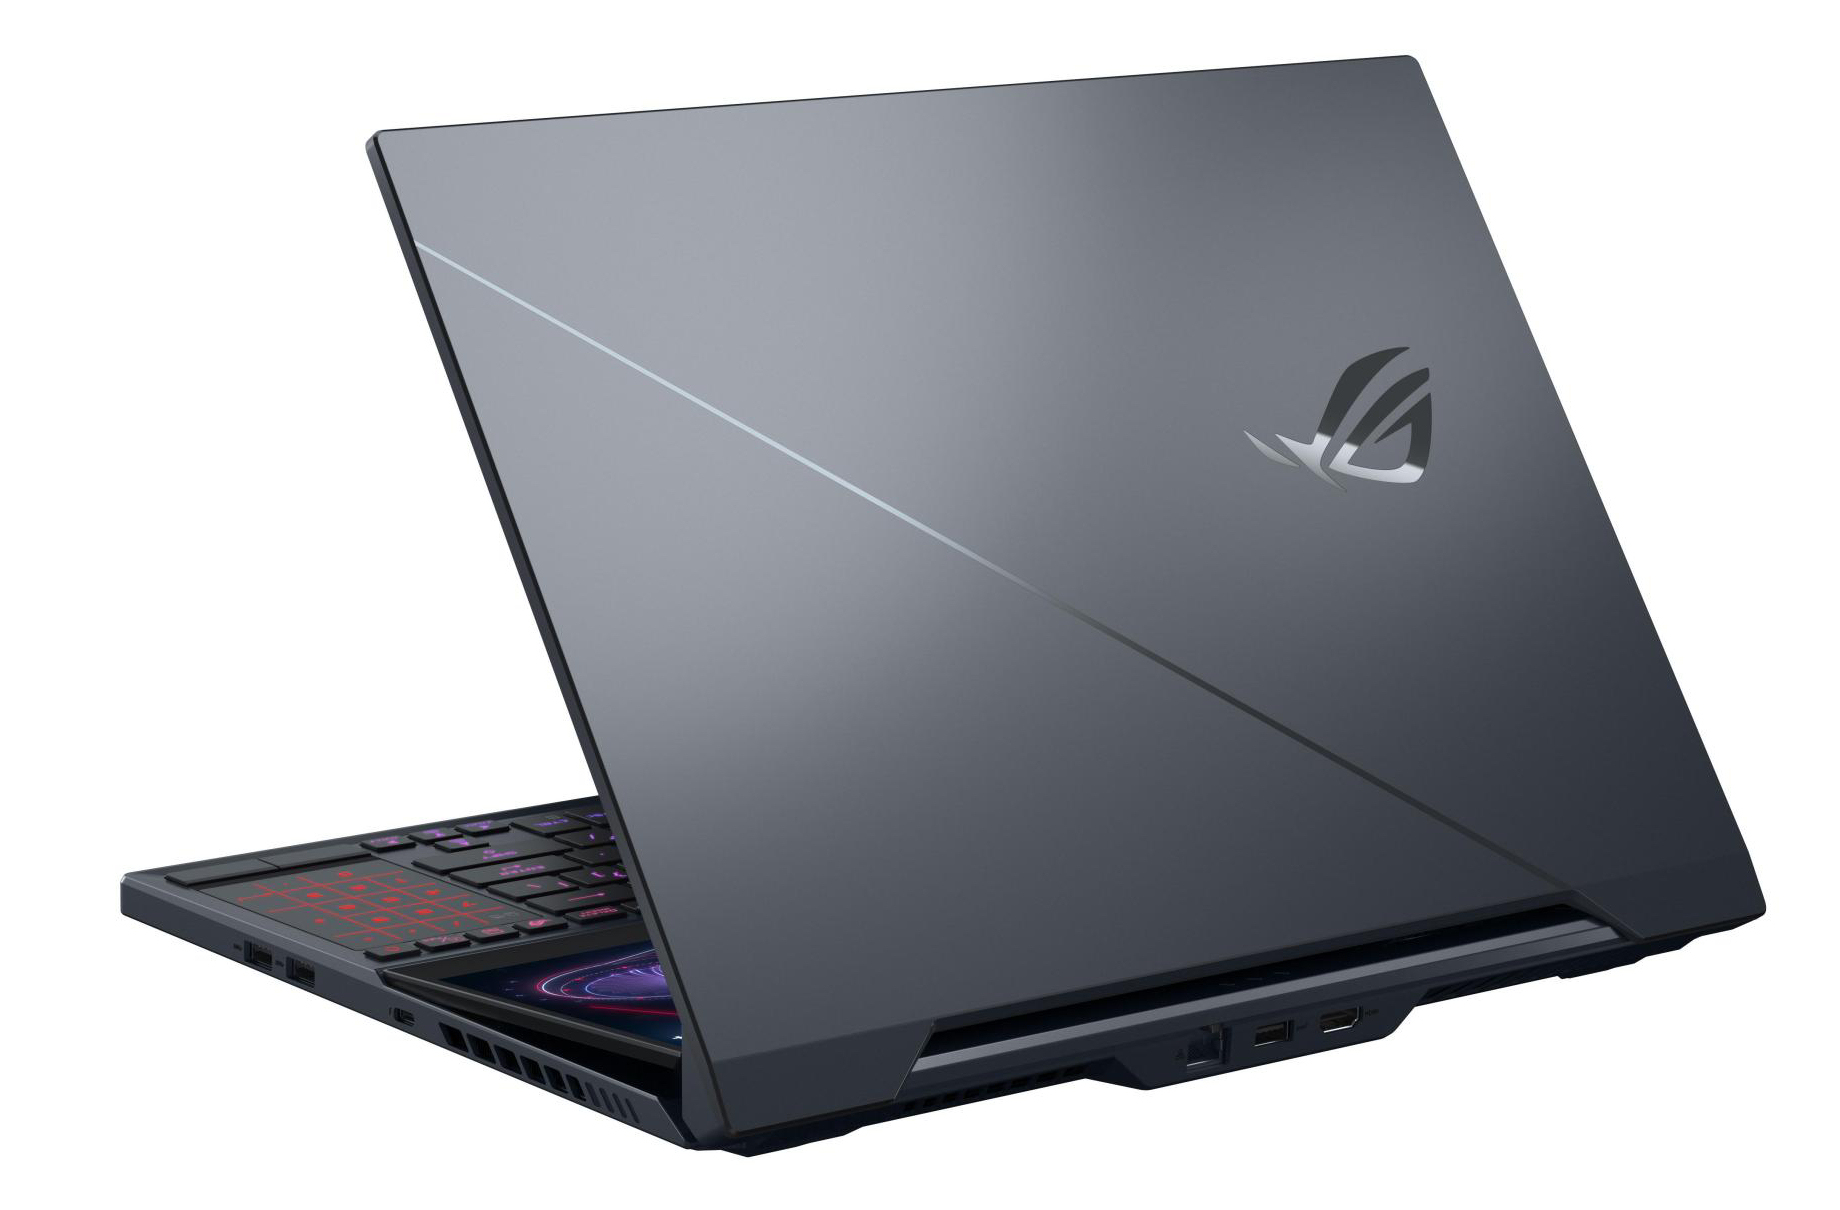
Test de l'Asus ROG Zephyrus Duo 15 GX550LXS (i9-10980HK, RTX 2080 Super Max-Q, 4K UHD) : PC portable de jeu unique qui en a sous le capot
Note | Date | Modèle | Poids | Épaisseur | Taille | Résolution | Prix |
|---|---|---|---|---|---|---|---|
| 84.5 % v7 (old) | 08/20 | Asus ROG Zephyrus Duo 15 GX550LXS i9-10980HK, GeForce RTX 2080 Super Max-Q | 2.5 kg | 20 mm | 15.60" | 3840x2160 | |
v (old) | 05/20 | Acer Predator Triton 500 PT515-52-70N3 i7-10750H, GeForce RTX 2080 Super Max-Q | 2.1 kg | 18 mm | 15.60" | 1920x1080 | |
| 82.8 % v7 (old) | 05/20 | MSI GS66 Stealth 10SFS i9-10980HK, GeForce RTX 2070 Super Max-Q | 2.2 kg | 20 mm | 15.60" | 1920x1080 | |
| 85.8 % v7 (old) | 06/20 | Gigabyte Aero 15 OLED XB-8DE51B0SP i7-10875H, GeForce RTX 2070 Super Max-Q | 2.2 kg | 20 mm | 15.60" | 3840x2160 |
| |||||||||||||||||||||||||
Homogénéité de la luminosité: 90 %
Valeur mesurée au centre, sur batterie: 398 cd/m²
Contraste: 1421:1 (Valeurs des noirs: 0.28 cd/m²)
ΔE ColorChecker Calman: 1.53 | ∀{0.5-29.43 Ø4.72}
calibrated: 0.77
ΔE Greyscale Calman: 2.4 | ∀{0.09-98 Ø4.97}
100% sRGB (Argyll 1.6.3 3D)
100% AdobeRGB 1998 (Argyll 1.6.3 3D)
99.9% AdobeRGB 1998 (Argyll 3D)
100% sRGB (Argyll 3D)
87% Display P3 (Argyll 3D)
Gamma: 2.19
CCT: 6996 K
| Asus ROG Zephyrus Duo 15 GX550LXS AU Optronics B156ZAN03.1, IPS, 3840x2160, 15.6" | Acer Predator Triton 500 PT515-52-70N3 AUO B156HAN12.0 (AUO7A8C), IPS, 1920x1080, 15.6" | MSI GS66 Stealth 10SFS AUO B156HAN12.0 (AUO328E), IPS, 1920x1080, 15.6" | Gigabyte Aero 15 OLED XB-8DE51B0SP Samsung SDCA029, OLED, 3840x2160, 15.6" | |
|---|---|---|---|---|
| Display | -16% | -16% | 4% | |
| Display P3 Coverage (%) | 87 | 70.3 -19% | 69.5 -20% | 99.9 15% |
| sRGB Coverage (%) | 100 | 99.5 0% | 99.6 0% | 100 0% |
| AdobeRGB 1998 Coverage (%) | 99.9 | 72.2 -28% | 70.8 -29% | 98.2 -2% |
| Response Times | 66% | 68% | 95% | |
| Response Time Grey 50% / Grey 80% * (ms) | 56.4 ? | 14.4 ? 74% | 14 ? 75% | 2.2 ? 96% |
| Response Time Black / White * (ms) | 24.4 ? | 10.4 ? 57% | 9.6 ? 61% | 1.8 ? 93% |
| PWM Frequency (Hz) | 60 ? | |||
| Screen | -48% | -31% | -30% | |
| Brightness middle (cd/m²) | 398 | 320 -20% | 316 -21% | 385 -3% |
| Brightness (cd/m²) | 385 | 318 -17% | 311 -19% | 390 1% |
| Brightness Distribution (%) | 90 | 88 -2% | 92 2% | 93 3% |
| Black Level * (cd/m²) | 0.28 | 0.24 14% | 0.21 25% | |
| Contrast (:1) | 1421 | 1333 -6% | 1505 6% | |
| Colorchecker dE 2000 * | 1.53 | 4.03 -163% | 3.03 -98% | 2.46 -61% |
| Colorchecker dE 2000 max. * | 3.69 | 8.43 -128% | 7.32 -98% | 4.01 -9% |
| Colorchecker dE 2000 calibrated * | 0.77 | 0.98 -27% | 1.1 -43% | 2.6 -238% |
| Greyscale dE 2000 * | 2.4 | 5.94 -148% | 3.9 -63% | 1.39 42% |
| Gamma | 2.19 100% | 2.42 91% | 2.42 91% | 2.31 95% |
| CCT | 6996 93% | 6751 96% | 7439 87% | 6395 102% |
| Color Space (Percent of AdobeRGB 1998) (%) | 100 | 66 -34% | 65 -35% | 98 -2% |
| Color Space (Percent of sRGB) (%) | 100 | 99 -1% | 100 0% | 100 0% |
| Moyenne finale (programmes/paramètres) | 1% /
-28% | 7% /
-16% | 23% /
-5% |
* ... Moindre est la valeur, meilleures sont les performances
Temps de réponse de l'écran
| ↔ Temps de réponse noir à blanc | ||
|---|---|---|
| 24.4 ms ... hausse ↗ et chute ↘ combinées | ↗ 10 ms hausse | 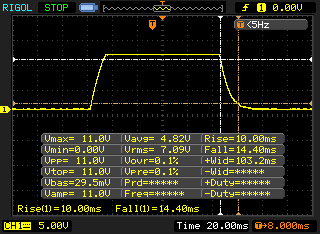 |
| ↘ 14.4 ms chute | ||
| L'écran montre de bons temps de réponse, mais insuffisant pour du jeu compétitif. En comparaison, tous les appareils testés affichent entre 0.1 (minimum) et 240 (maximum) ms. » 57 % des appareils testés affichent de meilleures performances. Cela signifie que les latences relevées sont moins bonnes que la moyenne (19.8 ms) de tous les appareils testés. | ||
| ↔ Temps de réponse gris 50% à gris 80% | ||
| 56.4 ms ... hausse ↗ et chute ↘ combinées | ↗ 26.4 ms hausse | 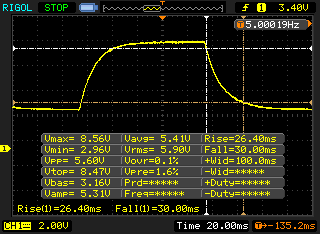 |
| ↘ 30 ms chute | ||
| L'écran souffre de latences très élevées, à éviter pour le jeu. En comparaison, tous les appareils testés affichent entre 0.165 (minimum) et 636 (maximum) ms. » 93 % des appareils testés affichent de meilleures performances. Cela signifie que les latences relevées sont moins bonnes que la moyenne (31 ms) de tous les appareils testés. | ||
Scintillement / MLI (Modulation de largeur d'impulsion)
| Scintillement / MLI (Modulation de largeur d'impulsion) non décelé | 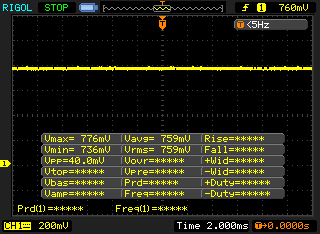 | ||
En comparaison, 52 % des appareils testés n'emploient pas MDI pour assombrir leur écran. Nous avons relevé une moyenne à 7769 (minimum : 5 - maximum : 343500) Hz dans le cas où une MDI était active. | |||
| Cinebench R15 | |
| CPU Single 64Bit | |
| Moyenne de la classe Gaming (188.8 - 343, n=109, 2 dernières années) | |
| Asus ROG Zephyrus Duo 15 GX550LXS (Turbo) | |
| Gigabyte Aero 15 OLED XB-8DE51B0SP | |
| Moyenne Intel Core i9-10980HK (198 - 219, n=15) | |
| Asus ROG Zephyrus Duo 15 GX550LXS | |
| MSI GS66 Stealth 10SFS | |
| Acer Predator Triton 500 PT515-52-70N3 | |
| CPU Multi 64Bit | |
| Moyenne de la classe Gaming (1578 - 6271, n=108, 2 dernières années) | |
| Asus ROG Zephyrus Duo 15 GX550LXS (Turbo) | |
| Gigabyte Aero 15 OLED XB-8DE51B0SP | |
| Asus ROG Zephyrus Duo 15 GX550LXS | |
| Moyenne Intel Core i9-10980HK (1606 - 1862, n=15) | |
| MSI GS66 Stealth 10SFS | |
| Acer Predator Triton 500 PT515-52-70N3 | |
| Blender - v2.79 BMW27 CPU | |
| Acer Predator Triton 500 PT515-52-70N3 | |
| MSI GS66 Stealth 10SFS | |
| Asus ROG Zephyrus Duo 15 GX550LXS (Turbo) | |
| Asus ROG Zephyrus Duo 15 GX550LXS | |
| Gigabyte Aero 15 OLED XB-8DE51B0SP | |
| Moyenne Intel Core i9-10980HK (239 - 299, n=13) | |
| Moyenne de la classe Gaming (80 - 330, n=107, 2 dernières années) | |
| 7-Zip 18.03 | |
| 7z b 4 -mmt1 | |
| Moyenne de la classe Gaming (4199 - 7436, n=108, 2 dernières années) | |
| Gigabyte Aero 15 OLED XB-8DE51B0SP | |
| Moyenne Intel Core i9-10980HK (5081 - 5542, n=13) | |
| Asus ROG Zephyrus Duo 15 GX550LXS | |
| MSI GS66 Stealth 10SFS | |
| Asus ROG Zephyrus Duo 15 GX550LXS (Turbo) | |
| Acer Predator Triton 500 PT515-52-70N3 | |
| 7z b 4 | |
| Moyenne de la classe Gaming (33491 - 148086, n=108, 2 dernières années) | |
| Asus ROG Zephyrus Duo 15 GX550LXS | |
| Gigabyte Aero 15 OLED XB-8DE51B0SP | |
| Moyenne Intel Core i9-10980HK (43786 - 49275, n=13) | |
| Asus ROG Zephyrus Duo 15 GX550LXS (Turbo) | |
| MSI GS66 Stealth 10SFS | |
| Acer Predator Triton 500 PT515-52-70N3 | |
| HWBOT x265 Benchmark v2.2 - 4k Preset | |
| Moyenne de la classe Gaming (11.5 - 44.3, n=108, 2 dernières années) | |
| Gigabyte Aero 15 OLED XB-8DE51B0SP | |
| Moyenne Intel Core i9-10980HK (12 - 14.6, n=13) | |
| Asus ROG Zephyrus Duo 15 GX550LXS | |
| Asus ROG Zephyrus Duo 15 GX550LXS (Turbo) | |
| MSI GS66 Stealth 10SFS | |
| Acer Predator Triton 500 PT515-52-70N3 | |
| LibreOffice - 20 Documents To PDF | |
| Asus ROG Zephyrus Duo 15 GX550LXS | |
| Moyenne Intel Core i9-10980HK (44 - 89, n=13) | |
| MSI GS66 Stealth 10SFS | |
| Gigabyte Aero 15 OLED XB-8DE51B0SP | |
| Acer Predator Triton 500 PT515-52-70N3 | |
| Moyenne de la classe Gaming (19 - 88.8, n=108, 2 dernières années) | |
| Asus ROG Zephyrus Duo 15 GX550LXS (Turbo) | |
| R Benchmark 2.5 - Overall mean | |
| Acer Predator Triton 500 PT515-52-70N3 | |
| Asus ROG Zephyrus Duo 15 GX550LXS (Turbo) | |
| MSI GS66 Stealth 10SFS | |
| Asus ROG Zephyrus Duo 15 GX550LXS | |
| Moyenne Intel Core i9-10980HK (0.561 - 0.596, n=13) | |
| Gigabyte Aero 15 OLED XB-8DE51B0SP | |
| Moyenne de la classe Gaming (0.3439 - 0.759, n=109, 2 dernières années) | |
* ... Moindre est la valeur, meilleures sont les performances
| PCMark 8 Home Score Accelerated v2 | 3821 points | |
| PCMark 8 Creative Score Accelerated v2 | 4210 points | |
| PCMark 8 Work Score Accelerated v2 | 4762 points | |
| PCMark 10 Score | 5277 points | |
Aide | ||
| DPC Latencies / LatencyMon - interrupt to process latency (max), Web, Youtube, Prime95 | |
| Acer Predator Triton 500 PT515-52-70N3 | |
| Asus ROG Zephyrus Duo 15 GX550LXS | |
| MSI GS66 Stealth 10SFS | |
| Gigabyte Aero 15 OLED XB-8DE51B0SP | |
* ... Moindre est la valeur, meilleures sont les performances

| Asus ROG Zephyrus Duo 15 GX550LXS 2x Samsung PM981a MZVLB1T0HBLR (RAID 0) | Acer Predator Triton 500 PT515-52-70N3 Samsung SSD PM981a MZVLB512HBJQ | MSI GS66 Stealth 10SFS Samsung SSD PM981 MZVLB1T0HALR | Gigabyte Aero 15 OLED XB-8DE51B0SP Intel Optane Memory H10 with Solid State Storage 32GB + 512GB HBRPEKNX0202A(L/H) | Moyenne 2x Samsung PM981a MZVLB1T0HBLR (RAID 0) | |
|---|---|---|---|---|---|
| CrystalDiskMark 5.2 / 6 | -8% | -13% | -4% | 23% | |
| Write 4K (MB/s) | 127.6 | 131.7 3% | 131.3 3% | 127.4 0% | 175.9 ? 38% |
| Read 4K (MB/s) | 48.4 | 47.34 -2% | 45.84 -5% | 147.5 205% | 49.7 ? 3% |
| Write Seq (MB/s) | 2958 | 2884 -3% | 2370 -20% | 485.9 -84% | 4078 ? 38% |
| Read Seq (MB/s) | 2984 | 2303 -23% | 1509 -49% | 1352 -55% | 3653 ? 22% |
| Write 4K Q32T1 (MB/s) | 472.7 | 423.9 -10% | 481.5 2% | 476.5 1% | 540 ? 14% |
| Read 4K Q32T1 (MB/s) | 529 | 487.7 -8% | 560 6% | 531 0% | 456 ? -14% |
| Write Seq Q32T1 (MB/s) | 3431 | 2822 -18% | 2392 -30% | 1061 -69% | 4457 ? 30% |
| Read Seq Q32T1 (MB/s) | 3536 | 3478 -2% | 3232 -9% | 2552 -28% | 5307 ? 50% |
| AS SSD | 2% | -1% | -36% | 9% | |
| Seq Read (MB/s) | 2981 | 2767 -7% | 1065 -64% | 1200 -60% | 3515 ? 18% |
| Seq Write (MB/s) | 2783 | 2613 -6% | 2360 -15% | 836 -70% | 2878 ? 3% |
| 4K Read (MB/s) | 43.98 | 47.55 8% | 48.09 9% | 65.8 50% | 48.4 ? 10% |
| 4K Write (MB/s) | 113.9 | 98.9 -13% | 110.7 -3% | 103.8 -9% | 165.6 ? 45% |
| 4K-64 Read (MB/s) | 1519 | 1205 -21% | 1635 8% | 789 -48% | 1419 ? -7% |
| 4K-64 Write (MB/s) | 1296 | 2007 55% | 1829 41% | 929 -28% | 1348 ? 4% |
| Access Time Read * (ms) | 0.062 | 0.065 -5% | 0.071 -15% | 0.103 -66% | 0.0455 ? 27% |
| Access Time Write * (ms) | 0.033 | 0.038 -15% | 0.034 -3% | 0.045 -36% | 0.04375 ? -33% |
| Score Read (Points) | 1861 | 1529 -18% | 1790 -4% | 975 -48% | 1818 ? -2% |
| Score Write (Points) | 1688 | 2367 40% | 2176 29% | 1117 -34% | 1801 ? 7% |
| Score Total (Points) | 4492 | 4677 4% | 4950 10% | 2594 -42% | 4521 ? 1% |
| Copy ISO MB/s (MB/s) | 2438 | 2919 ? 20% | |||
| Copy Program MB/s (MB/s) | 604 | 706 ? 17% | |||
| Copy Game MB/s (MB/s) | 1404 | 1560 ? 11% | |||
| Moyenne finale (programmes/paramètres) | -3% /
-2% | -7% /
-6% | -20% /
-22% | 16% /
14% |
* ... Moindre est la valeur, meilleures sont les performances
Continuous read performance: DiskSpd Read Loop, Queue Depth 8
| 3DMark 11 Performance | 23526 points | |
| 3DMark Cloud Gate Standard Score | 44534 points | |
| 3DMark Fire Strike Score | 17714 points | |
| 3DMark Time Spy Score | 7780 points | |
Aide | ||
| 3DMark 11 - 1280x720 Performance GPU | |
| Moyenne de la classe Gaming (21841 - 80022, n=106, 2 dernières années) | |
| Asus ROG Zephyrus Duo 15 GX550LXS (Turbo) | |
| Acer Predator Triton 500 PT515-52-70N3 | |
| Moyenne NVIDIA GeForce RTX 2080 Super Max-Q (26292 - 32995, n=10) | |
| Gigabyte Aero 15 OLED XB-8DE51B0SP | |
| Asus ROG Zephyrus Duo 15 GX550LXS | |
| MSI GS66 Stealth 10SFS | |
| 3DMark | |
| 1920x1080 Fire Strike Graphics | |
| Moyenne de la classe Gaming (12242 - 62849, n=118, 2 dernières années) | |
| Asus ROG Zephyrus Duo 15 GX550LXS (Turbo) | |
| Acer Predator Triton 500 PT515-52-70N3 | |
| Moyenne NVIDIA GeForce RTX 2080 Super Max-Q (19655 - 23649, n=10) | |
| Gigabyte Aero 15 OLED XB-8DE51B0SP | |
| Asus ROG Zephyrus Duo 15 GX550LXS | |
| MSI GS66 Stealth 10SFS | |
| 2560x1440 Time Spy Graphics | |
| Moyenne de la classe Gaming (5012 - 26212, n=117, 2 dernières années) | |
| Asus ROG Zephyrus Duo 15 GX550LXS (Turbo) | |
| Acer Predator Triton 500 PT515-52-70N3 | |
| Moyenne NVIDIA GeForce RTX 2080 Super Max-Q (7372 - 8979, n=11) | |
| Gigabyte Aero 15 OLED XB-8DE51B0SP | |
| Asus ROG Zephyrus Duo 15 GX550LXS | |
| MSI GS66 Stealth 10SFS | |
| The Witcher 3 - 1920x1080 Ultra Graphics & Postprocessing (HBAO+) | |
| Moyenne de la classe Gaming (95 - 240, n=8, 2 dernières années) | |
| Asus ROG Zephyrus Duo 15 GX550LXS (Turbo) | |
| Moyenne NVIDIA GeForce RTX 2080 Super Max-Q (74.3 - 96, n=11) | |
| Acer Predator Triton 500 PT515-52-70N3 | |
| Gigabyte Aero 15 OLED XB-8DE51B0SP | |
| Asus ROG Zephyrus Duo 15 GX550LXS | |
| MSI GS66 Stealth 10SFS | |
| BioShock Infinite - 1920x1080 Ultra Preset, DX11 (DDOF) | |
| Asus ROG Zephyrus Duo 15 GX550LXS (Turbo) | |
| Moyenne NVIDIA GeForce RTX 2080 Super Max-Q (170.2 - 181.1, n=4) | |
| Asus ROG Zephyrus Duo 15 GX550LXS | |
| Doom Eternal - 1920x1080 Ultra Preset | |
| Asus ROG Zephyrus Duo 15 GX550LXS (Turbo) | |
| Moyenne NVIDIA GeForce RTX 2080 Super Max-Q (140 - 177.7, n=8) | |
| Asus ROG Zephyrus Duo 15 GX550LXS | |
| Acer Predator Triton 500 PT515-52-70N3 | |
| MSI GS66 Stealth 10SFS | |
| Red Dead Redemption 2 - 1920x1080 Maximum Settings | |
| Asus ROG Zephyrus Duo 15 GX550LXS | |
| Acer Predator Triton 500 PT515-52-70N3 | |
| Moyenne NVIDIA GeForce RTX 2080 Super Max-Q (40.6 - 45, n=5) | |
| Gigabyte Aero 15 OLED XB-8DE51B0SP | |
| Call of Duty Modern Warfare 2019 - 1920x1080 Maximum Settings AA:T2X Filmic SM | |
| Acer Predator Triton 500 PT515-52-70N3 | |
| Moyenne NVIDIA GeForce RTX 2080 Super Max-Q (91.2 - 107, n=4) | |
| Asus ROG Zephyrus Duo 15 GX550LXS | |
| Far Cry 5 - 1920x1080 Ultra Preset AA:T | |
| Moyenne de la classe Gaming (70 - 151, n=9, 2 dernières années) | |
| Asus ROG Zephyrus Duo 15 GX550LXS | |
| Moyenne NVIDIA GeForce RTX 2080 Super Max-Q (91 - 110, n=4) | |
| Shadow of the Tomb Raider - 1920x1080 Highest Preset AA:T | |
| Moyenne de la classe Gaming (96 - 116, n=2, 2 dernières années) | |
| Gigabyte Aero 15 OLED XB-8DE51B0SP | |
| Acer Predator Triton 500 PT515-52-70N3 | |
| Moyenne NVIDIA GeForce RTX 2080 Super Max-Q (89 - 106, n=10) | |
| MSI GS66 Stealth 10SFS | |
| Asus ROG Zephyrus Duo 15 GX550LXS (Turbo) | |
| Asus ROG Zephyrus Duo 15 GX550LXS | |
| Bas | Moyen | Élevé | Ultra | QHD | 4K | |
|---|---|---|---|---|---|---|
| BioShock Infinite (2013) | 425.1 | 349.2 | 324.2 | 173.1 | ||
| The Witcher 3 (2015) | 330.5 | 237 | 143.4 | 75.8 | 53.5 | |
| Far Cry 5 (2018) | 143 | 115 | 108 | 102 | 77 | 42 |
| Shadow of the Tomb Raider (2018) | 103 | 95 | 93 | 89 | 67 | 36 |
| Total War: Three Kingdoms (2019) | 245.5 | 136.4 | 86.5 | 62.5 | 39.9 | 19.6 |
| Ghost Recon Breakpoint (2019) | 128 | 93 | 87 | 65 | 49 | 29 |
| Call of Duty Modern Warfare 2019 (2019) | 172.3 | 123.6 | 104.3 | 91.2 | 64.7 | 36.3 |
| Red Dead Redemption 2 (2019) | 131.4 | 99.7 | 68.3 | 44.9 | 36.2 | 23.5 |
| Doom Eternal (2020) | 205 | 168.3 | 154 | 152.1 | 116.7 | 64 |
| Gears Tactics (2020) | 210.4 | 161.2 | 110.6 | 89.7 | 57.9 | 30.3 |
| F1 2020 (2020) | 253 | 167 | 149 | 118 | 89 | 51 |
Degré de la nuisance sonore
| Au repos |
| 33 / 34 / 35 dB(A) |
| Fortement sollicité |
| 48 / 49 dB(A) |
 | ||
30 dB silencieux 40 dB(A) audible 50 dB(A) bruyant |
||
min: | ||
| Asus ROG Zephyrus Duo 15 GX550LXS i9-10980HK, GeForce RTX 2080 Super Max-Q | Acer Predator Triton 500 PT515-52-70N3 i7-10750H, GeForce RTX 2080 Super Max-Q | MSI GS66 Stealth 10SFS i9-10980HK, GeForce RTX 2070 Super Max-Q | Gigabyte Aero 15 OLED XB-8DE51B0SP i7-10875H, GeForce RTX 2070 Super Max-Q | Moyenne NVIDIA GeForce RTX 2080 Super Max-Q | Moyenne de la classe Gaming | |
|---|---|---|---|---|---|---|
| Noise | 0% | -4% | -5% | 4% | 13% | |
| arrêt / environnement * (dB) | 30 | 30 -0% | 30 -0% | 30 -0% | 27.9 ? 7% | 24.1 ? 20% |
| Idle Minimum * (dB) | 33 | 30 9% | 32 3% | 34 -3% | 29.7 ? 10% | 25.9 ? 22% |
| Idle Average * (dB) | 34 | 33 3% | 34 -0% | 36 -6% | 30.8 ? 9% | 27.4 ? 19% |
| Idle Maximum * (dB) | 35 | 36 -3% | 39 -11% | 41 -17% | 35.4 ? -1% | 29.9 ? 15% |
| Load Average * (dB) | 48 | 50 -4% | 53 -10% | 48 -0% | 47.2 ? 2% | 43 ? 10% |
| Witcher 3 ultra * (dB) | 48 | 48 -0% | 48 -0% | 48 -0% | ||
| Load Maximum * (dB) | 49 | 50 -2% | 53 -8% | 54 -10% | 49.6 ? -1% | 54.1 ? -10% |
* ... Moindre est la valeur, meilleures sont les performances
(±) La température maximale du côté supérieur est de 43 °C / 109 F, par rapport à la moyenne de 40.4 °C / 105 F, allant de 21.2 à 68.8 °C pour la classe Gaming.
(-) Le fond chauffe jusqu'à un maximum de 53 °C / 127 F, contre une moyenne de 43.2 °C / 110 F
(+) En utilisation inactive, la température moyenne du côté supérieur est de 29.4 °C / 85 F, par rapport à la moyenne du dispositif de 33.9 °C / 93 F.
(-) En jouant à The Witcher 3, la température moyenne du côté supérieur est de 40.1 °C / 104 F, alors que la moyenne de l'appareil est de 33.9 °C / 93 F.
(-) Les repose-poignets et le pavé tactile peuvent devenir très chauds au toucher, avec un maximum de 44 °C / 111.2# F.
(-) La température moyenne de la zone de l'appui-paume de dispositifs similaires était de 28.8 °C / 83.8 F (-15.2 °C / #-27.4 F).
| Asus ROG Zephyrus Duo 15 GX550LXS i9-10980HK, GeForce RTX 2080 Super Max-Q | Acer Predator Triton 500 PT515-52-70N3 i7-10750H, GeForce RTX 2080 Super Max-Q | MSI GS66 Stealth 10SFS i9-10980HK, GeForce RTX 2070 Super Max-Q | Gigabyte Aero 15 OLED XB-8DE51B0SP i7-10875H, GeForce RTX 2070 Super Max-Q | Moyenne NVIDIA GeForce RTX 2080 Super Max-Q | Moyenne de la classe Gaming | |
|---|---|---|---|---|---|---|
| Heat | 3% | -2% | -2% | -1% | -1% | |
| Maximum Upper Side * (°C) | 43 | 44 -2% | 53 -23% | 49 -14% | 47.9 ? -11% | 45.2 ? -5% |
| Maximum Bottom * (°C) | 53 | 50 6% | 55 -4% | 61 -15% | 51.9 ? 2% | 48.1 ? 9% |
| Idle Upper Side * (°C) | 32 | 29 9% | 28 12% | 27 16% | 30 ? 6% | 31.1 ? 3% |
| Idle Bottom * (°C) | 31 | 31 -0% | 29 6% | 29 6% | 31 ? -0% | 34.3 ? -11% |
* ... Moindre est la valeur, meilleures sont les performances
Asus ROG Zephyrus Duo 15 GX550LXS analyse audio
(+) | les haut-parleurs peuvent jouer relativement fort (87# dB)
Basses 100 - 315 Hz
(-) | presque aucune basse - en moyenne 15.2% plus bas que la médiane
(+) | les basses sont linéaires (6.2% delta à la fréquence précédente)
Médiums 400 - 2000 Hz
(+) | médiane équilibrée - seulement 3.8% de la médiane
(+) | les médiums sont linéaires (5.2% delta à la fréquence précédente)
Aiguës 2 - 16 kHz
(±) | sommets plus élevés - en moyenne 5.6% plus élevés que la médiane
(+) | les aigus sont linéaires (4.5% delta à la fréquence précédente)
Globalement 100 - 16 000 Hz
(+) | le son global est linéaire (14.5% différence à la médiane)
Par rapport à la même classe
» 27% de tous les appareils testés de cette catégorie étaient meilleurs, 7% similaires, 66% pires
» Le meilleur avait un delta de 6%, la moyenne était de 18%, le pire était de 132%.
Par rapport à tous les appareils testés
» 18% de tous les appareils testés étaient meilleurs, 4% similaires, 78% pires
» Le meilleur avait un delta de 4%, la moyenne était de 24%, le pire était de 134%.
| Éteint/en veille | |
| Au repos | |
| Fortement sollicité |
|
Légende:
min: | |
| Asus ROG Zephyrus Duo 15 GX550LXS i9-10980HK, GeForce RTX 2080 Super Max-Q | Acer Predator Triton 500 PT515-52-70N3 i7-10750H, GeForce RTX 2080 Super Max-Q | MSI GS66 Stealth 10SFS i9-10980HK, GeForce RTX 2070 Super Max-Q | Gigabyte Aero 15 OLED XB-8DE51B0SP i7-10875H, GeForce RTX 2070 Super Max-Q | Moyenne NVIDIA GeForce RTX 2080 Super Max-Q | Moyenne de la classe Gaming | |
|---|---|---|---|---|---|---|
| Power Consumption | 31% | 23% | 10% | 28% | 25% | |
| Idle Minimum * (Watt) | 23 | 11 52% | 13 43% | 18 22% | 12.9 ? 44% | 13.2 ? 43% |
| Idle Average * (Watt) | 30 | 15 50% | 16 47% | 21 30% | 17.3 ? 42% | 18.9 ? 37% |
| Idle Maximum * (Watt) | 39 | 25 36% | 27 31% | 38 3% | 26.9 ? 31% | 24.5 ? 37% |
| Load Average * (Watt) | 156 | 95 39% | 109 30% | 113 28% | 123.9 ? 21% | 108.8 ? 30% |
| Witcher 3 ultra * (Watt) | 152 | 140 8% | 155 -2% | 149 2% | ||
| Load Maximum * (Watt) | 208 | 211 -1% | 236 -13% | 256 -23% | 205 ? 1% | 254 ? -22% |
* ... Moindre est la valeur, meilleures sont les performances
| Asus ROG Zephyrus Duo 15 GX550LXS i9-10980HK, GeForce RTX 2080 Super Max-Q, 90 Wh | Acer Predator Triton 500 PT515-52-70N3 i7-10750H, GeForce RTX 2080 Super Max-Q, 84 Wh | MSI GS66 Stealth 10SFS i9-10980HK, GeForce RTX 2070 Super Max-Q, 99.99 Wh | Gigabyte Aero 15 OLED XB-8DE51B0SP i7-10875H, GeForce RTX 2070 Super Max-Q, 94.2 Wh | Moyenne de la classe Gaming | |
|---|---|---|---|---|---|
| Autonomie de la batterie | 38% | 48% | 79% | 53% | |
| Reader / Idle (h) | 8 | 8.3 4% | 8.4 5% | 8.6 8% | 8.71 ? 9% |
| H.264 (h) | 5.4 | 8.28 ? 53% | |||
| WiFi v1.3 (h) | 3.1 | 6.3 103% | 6.1 97% | 6.1 97% | 6.96 ? 125% |
| Load (h) | 1.2 | 1.3 8% | 1.7 42% | 2.8 133% | 1.47 ? 23% |
Points positifs
Points négatifs
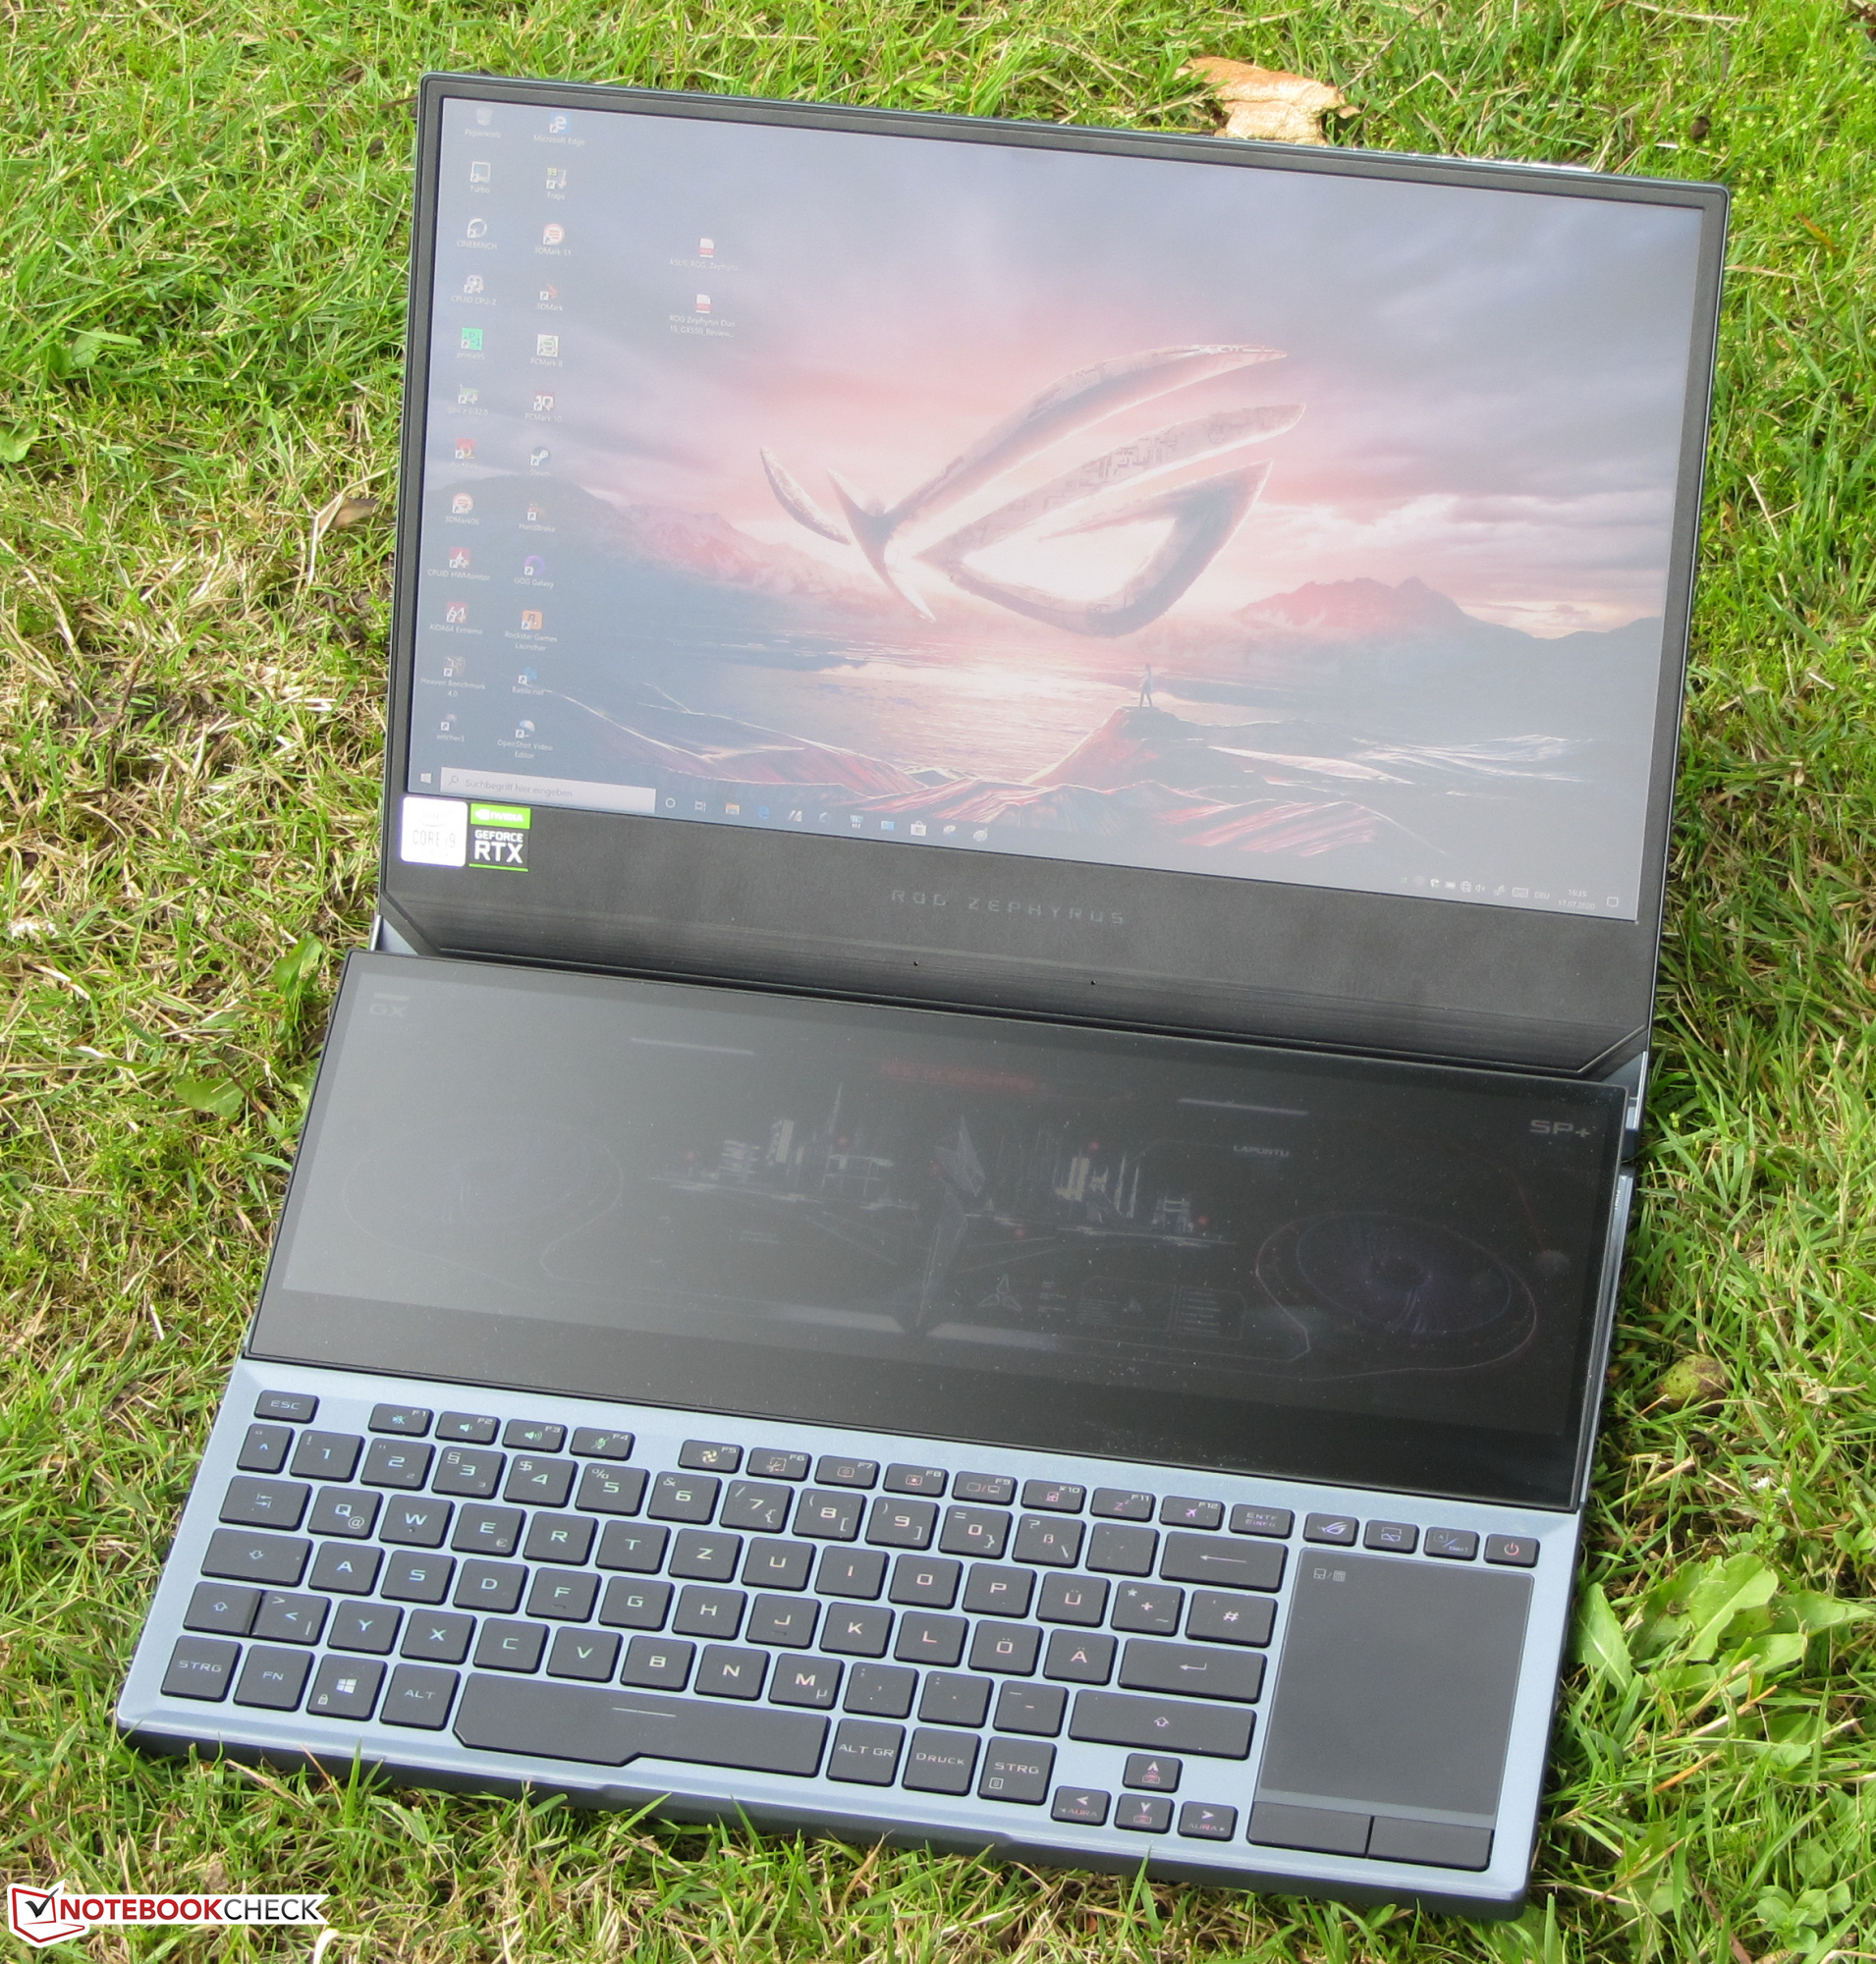
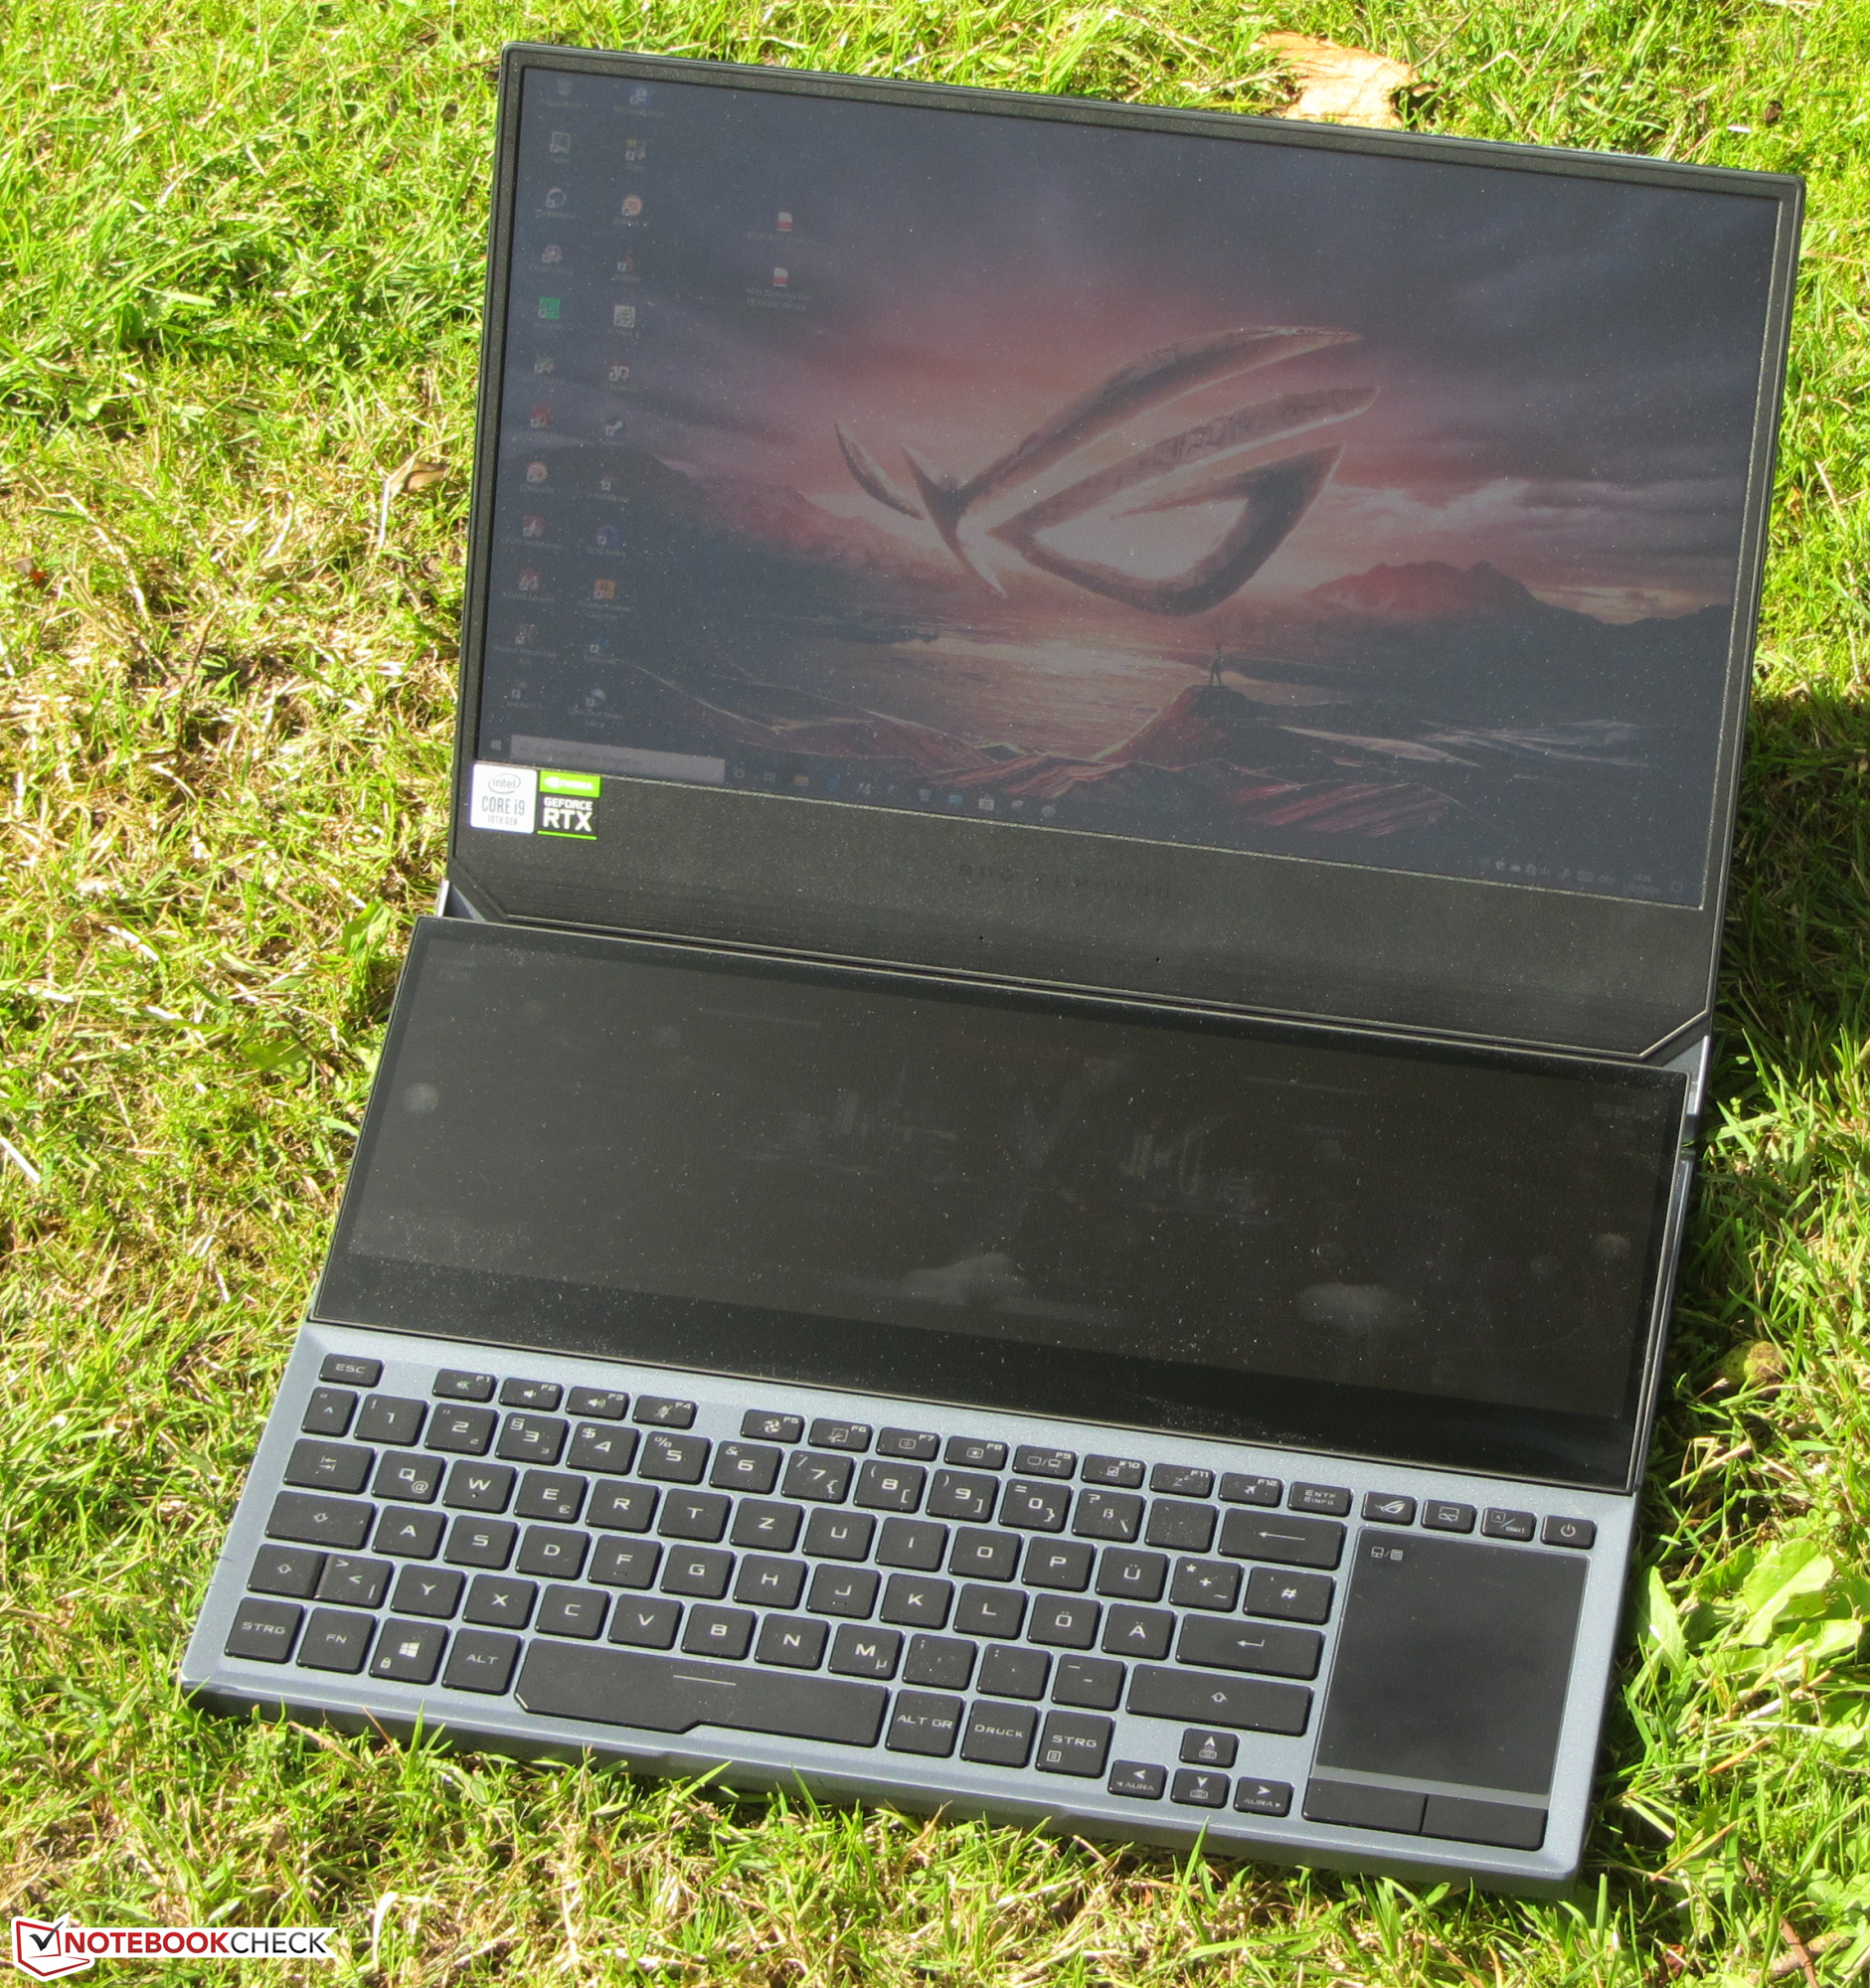
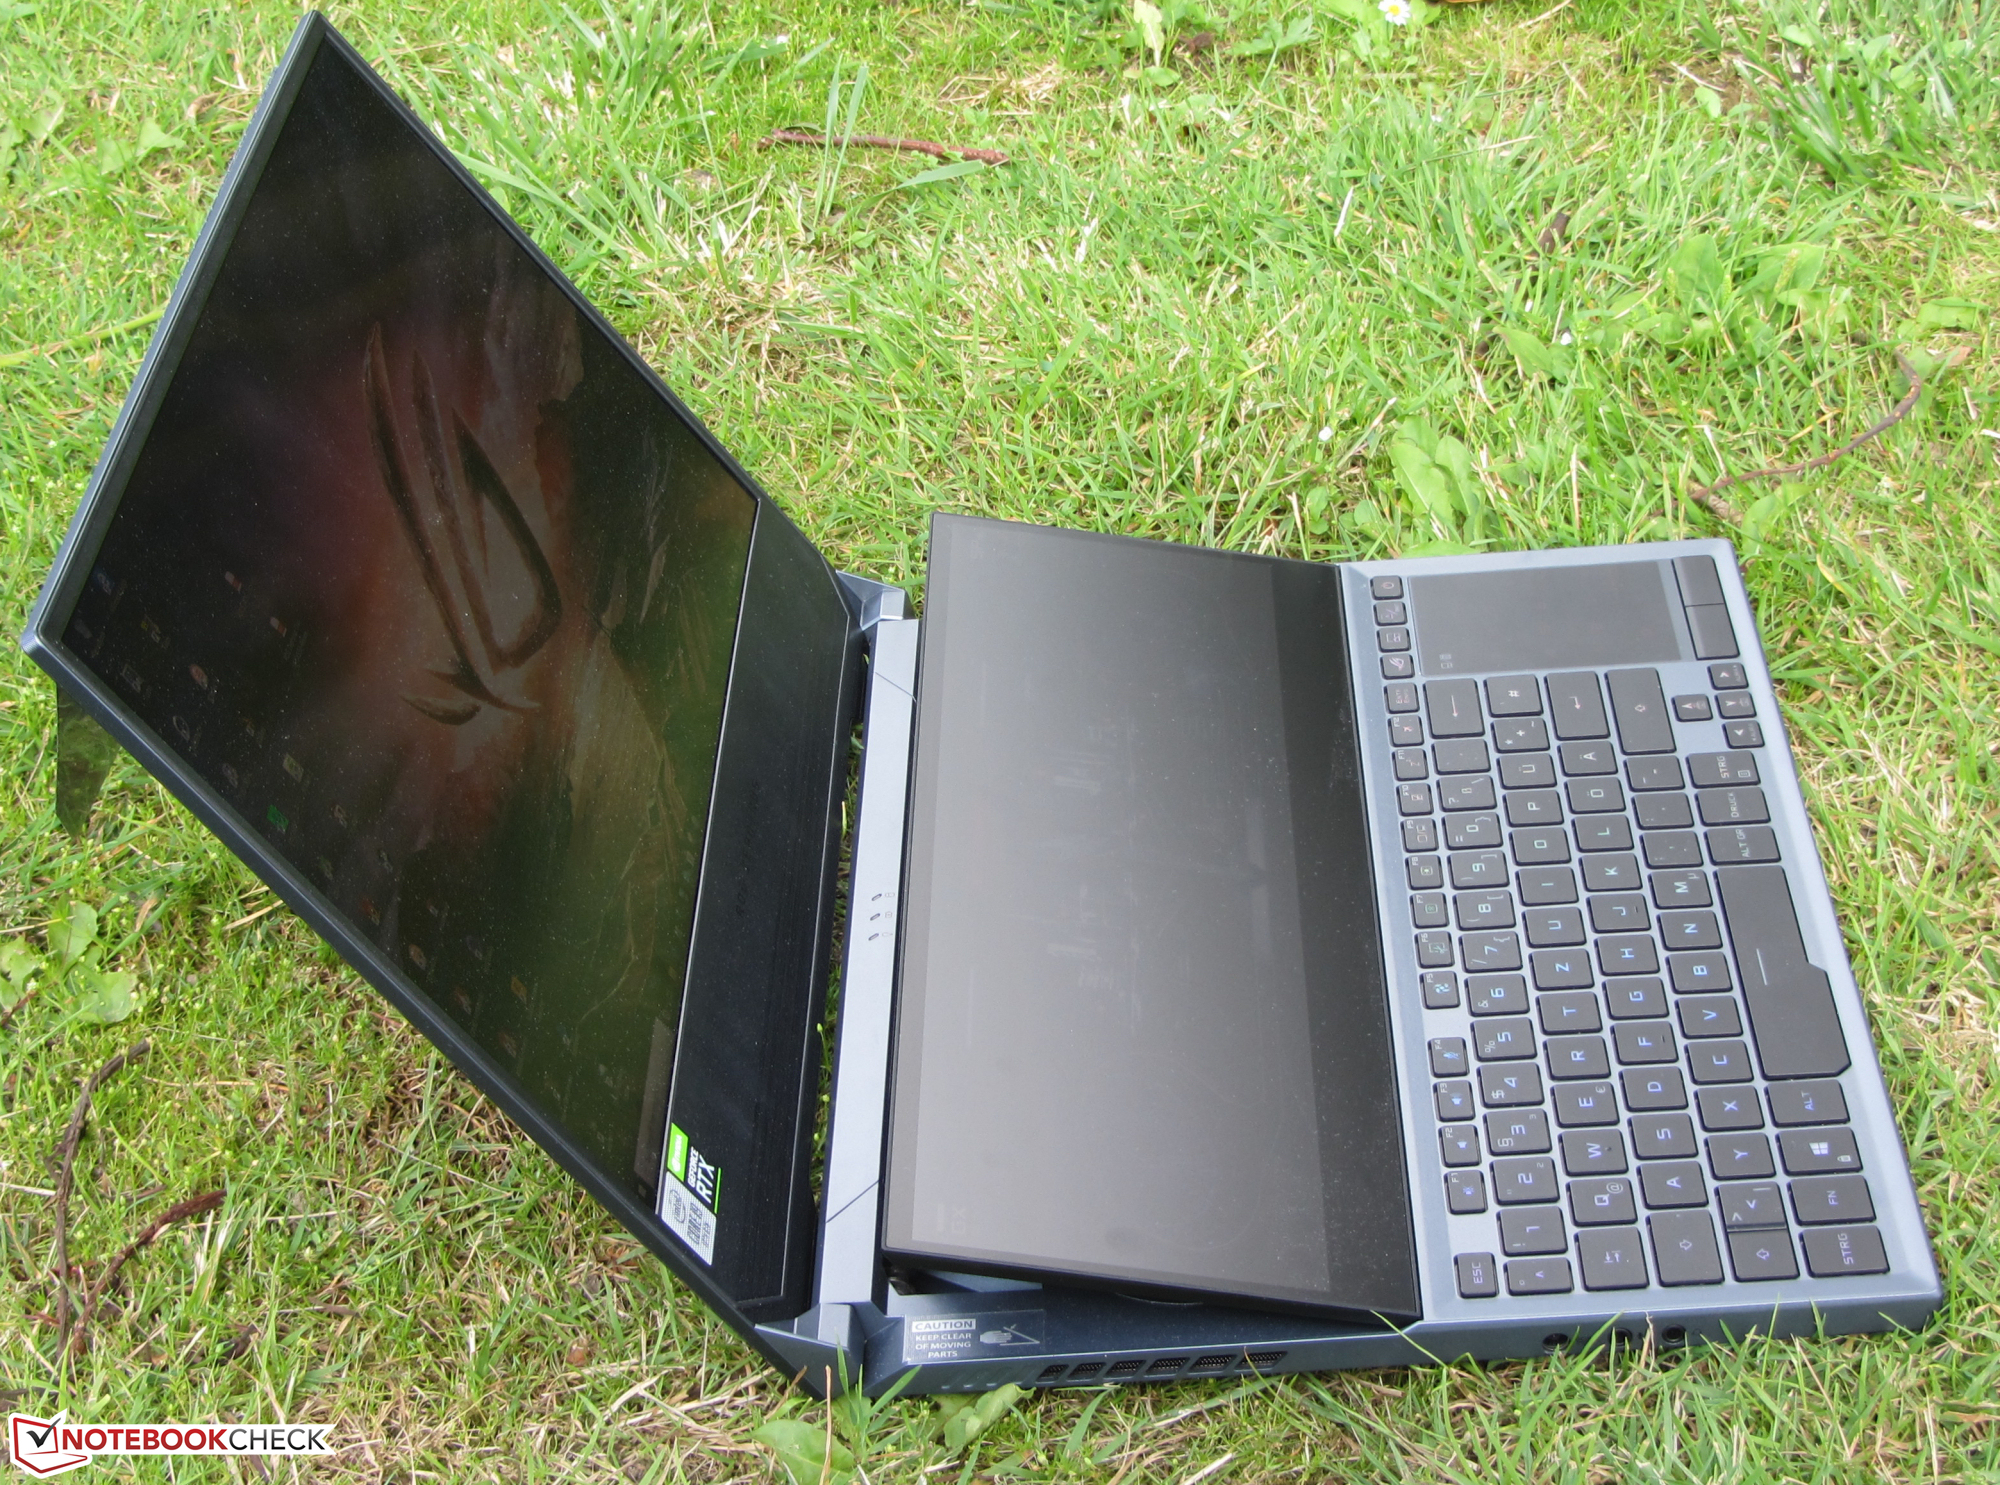
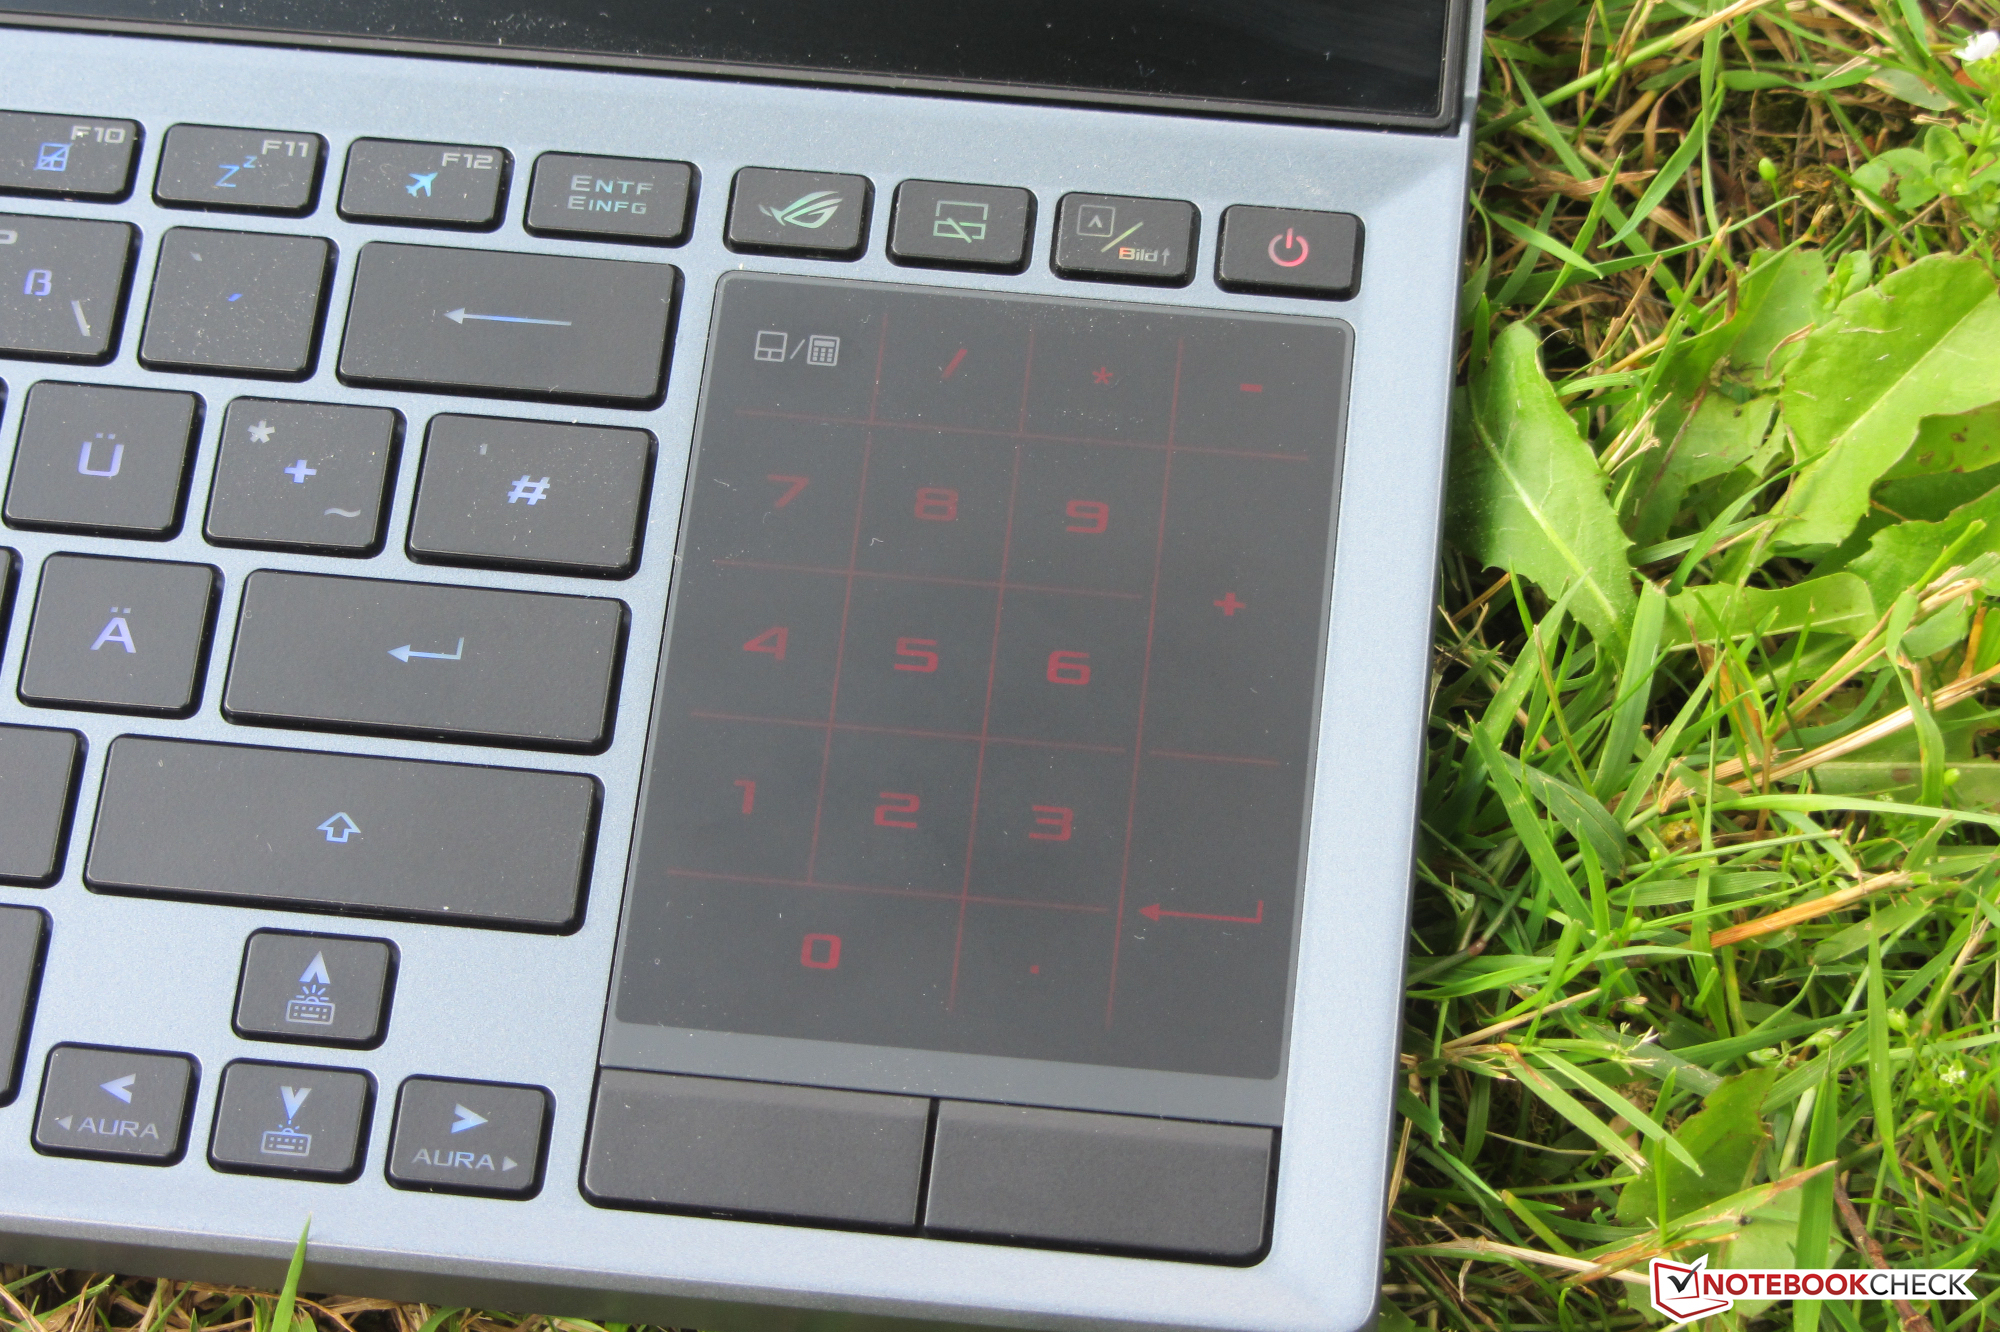
Avec ce Zephyrus et son Screenpad Plus, Asus cherche à séduire encore un peu plus les joueurs, les streamers et les créateurs de contenus. En général, le Screenpad parvient d'une façon ou d'une autre à être utile. Mais il a un prix : par rapport aux autres PC portables de jeu sans écran secondaire, le Zephyrus est plus lourd et plus grand.
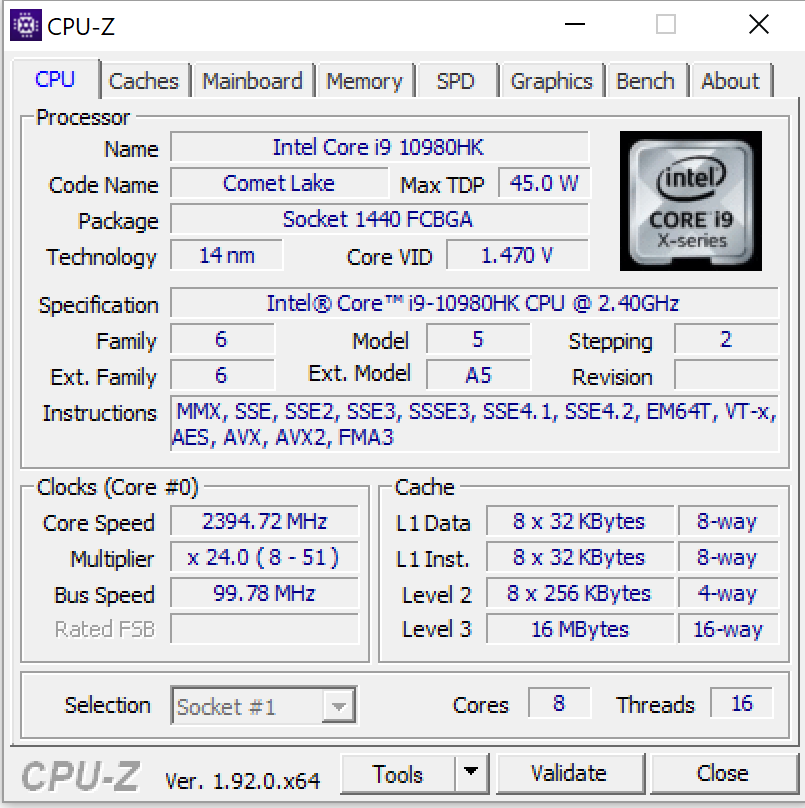
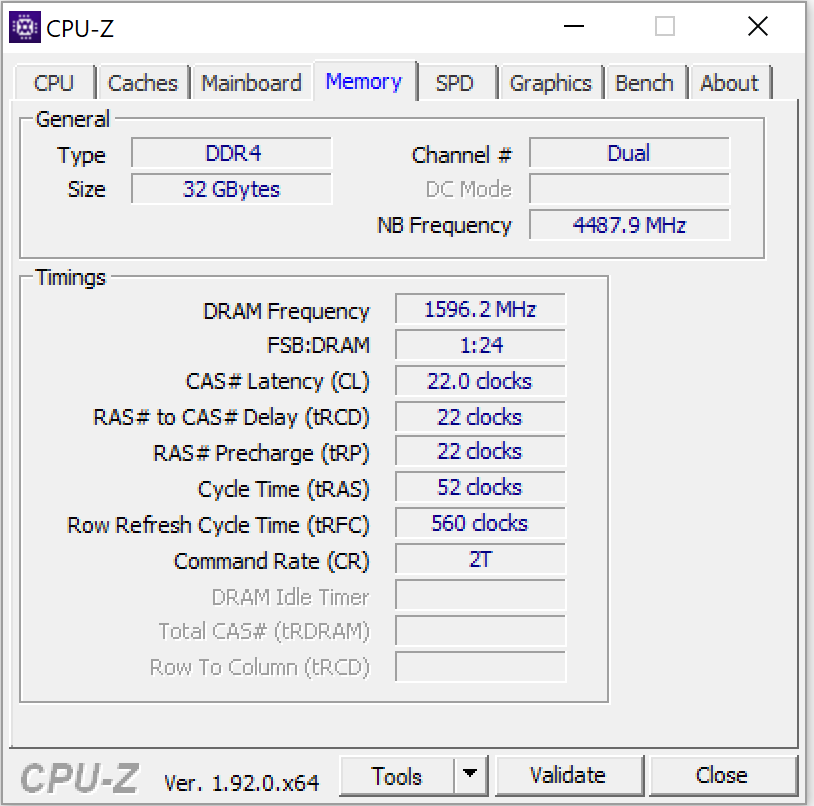
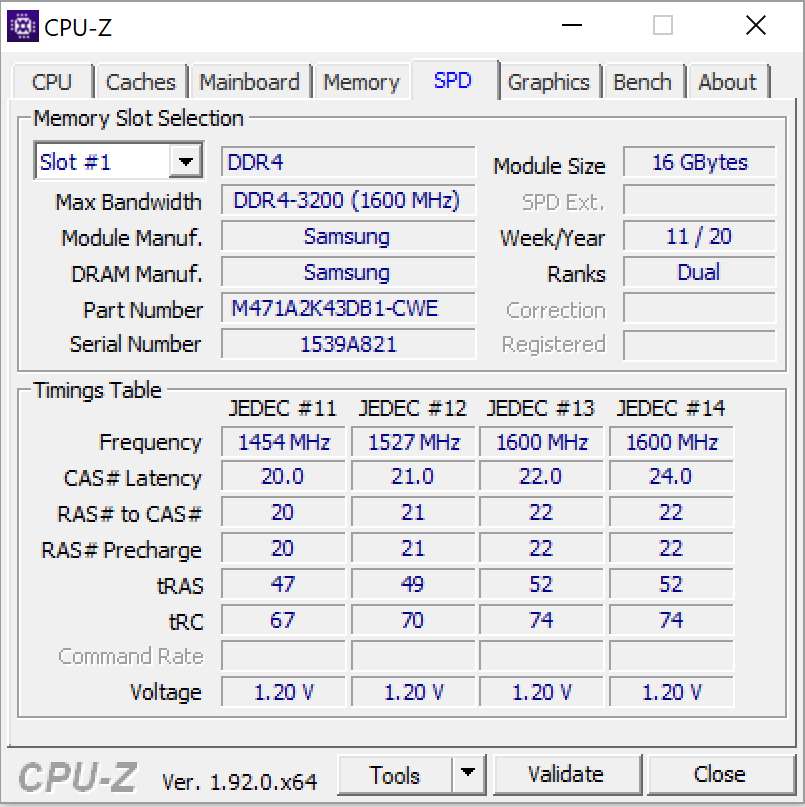
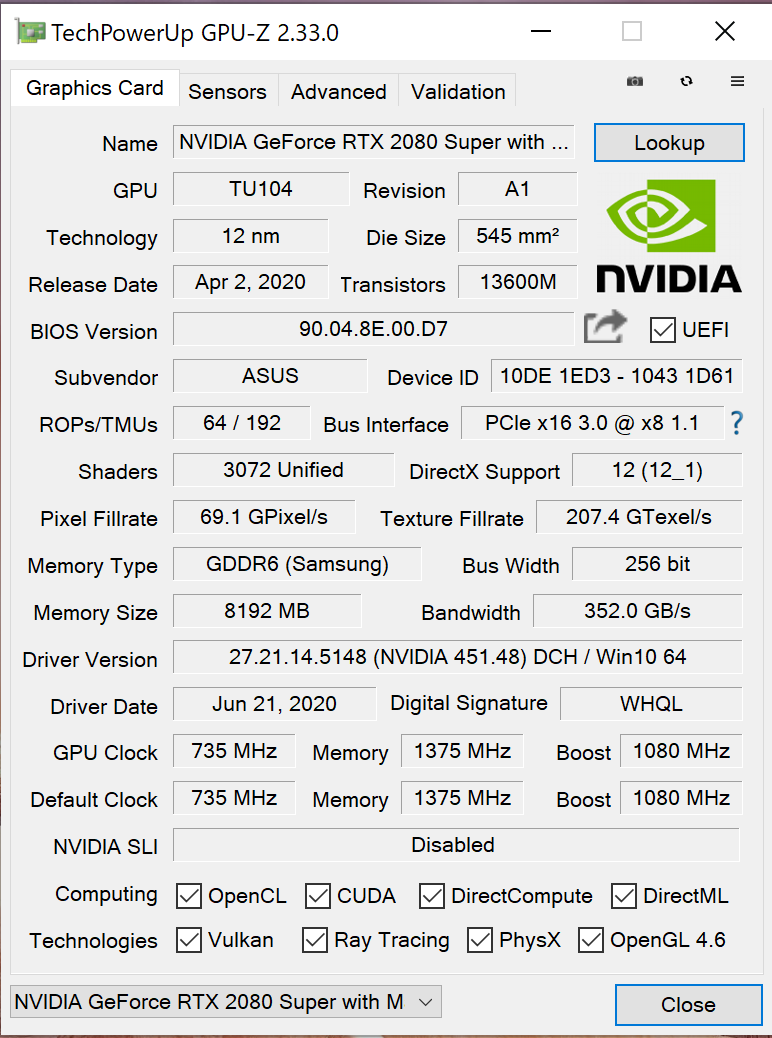
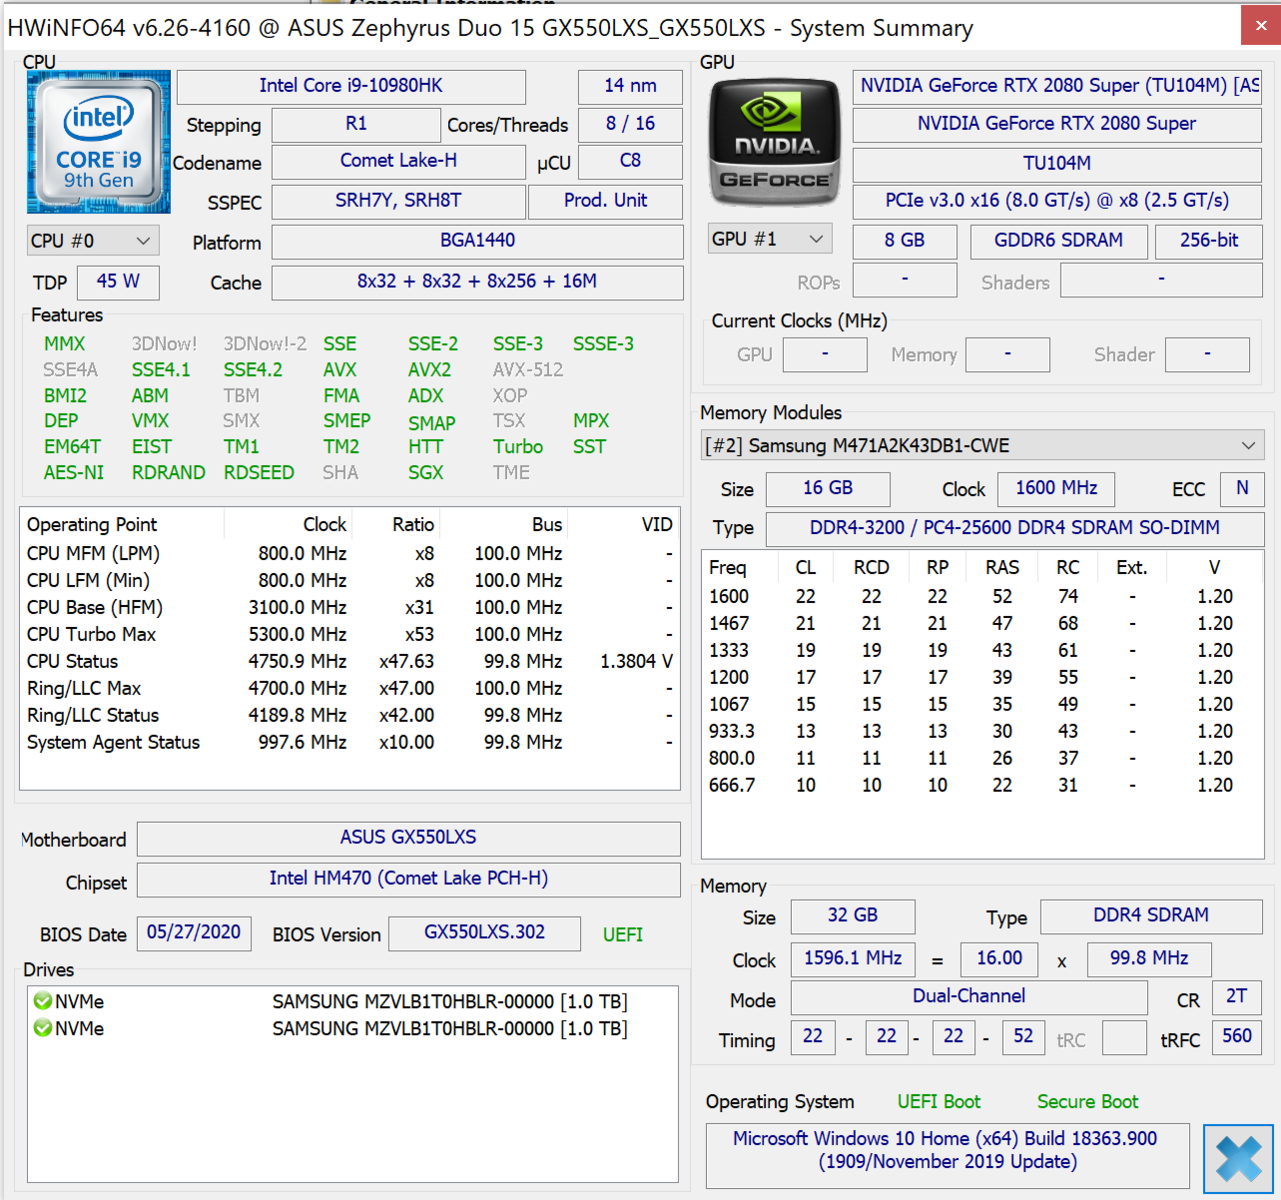
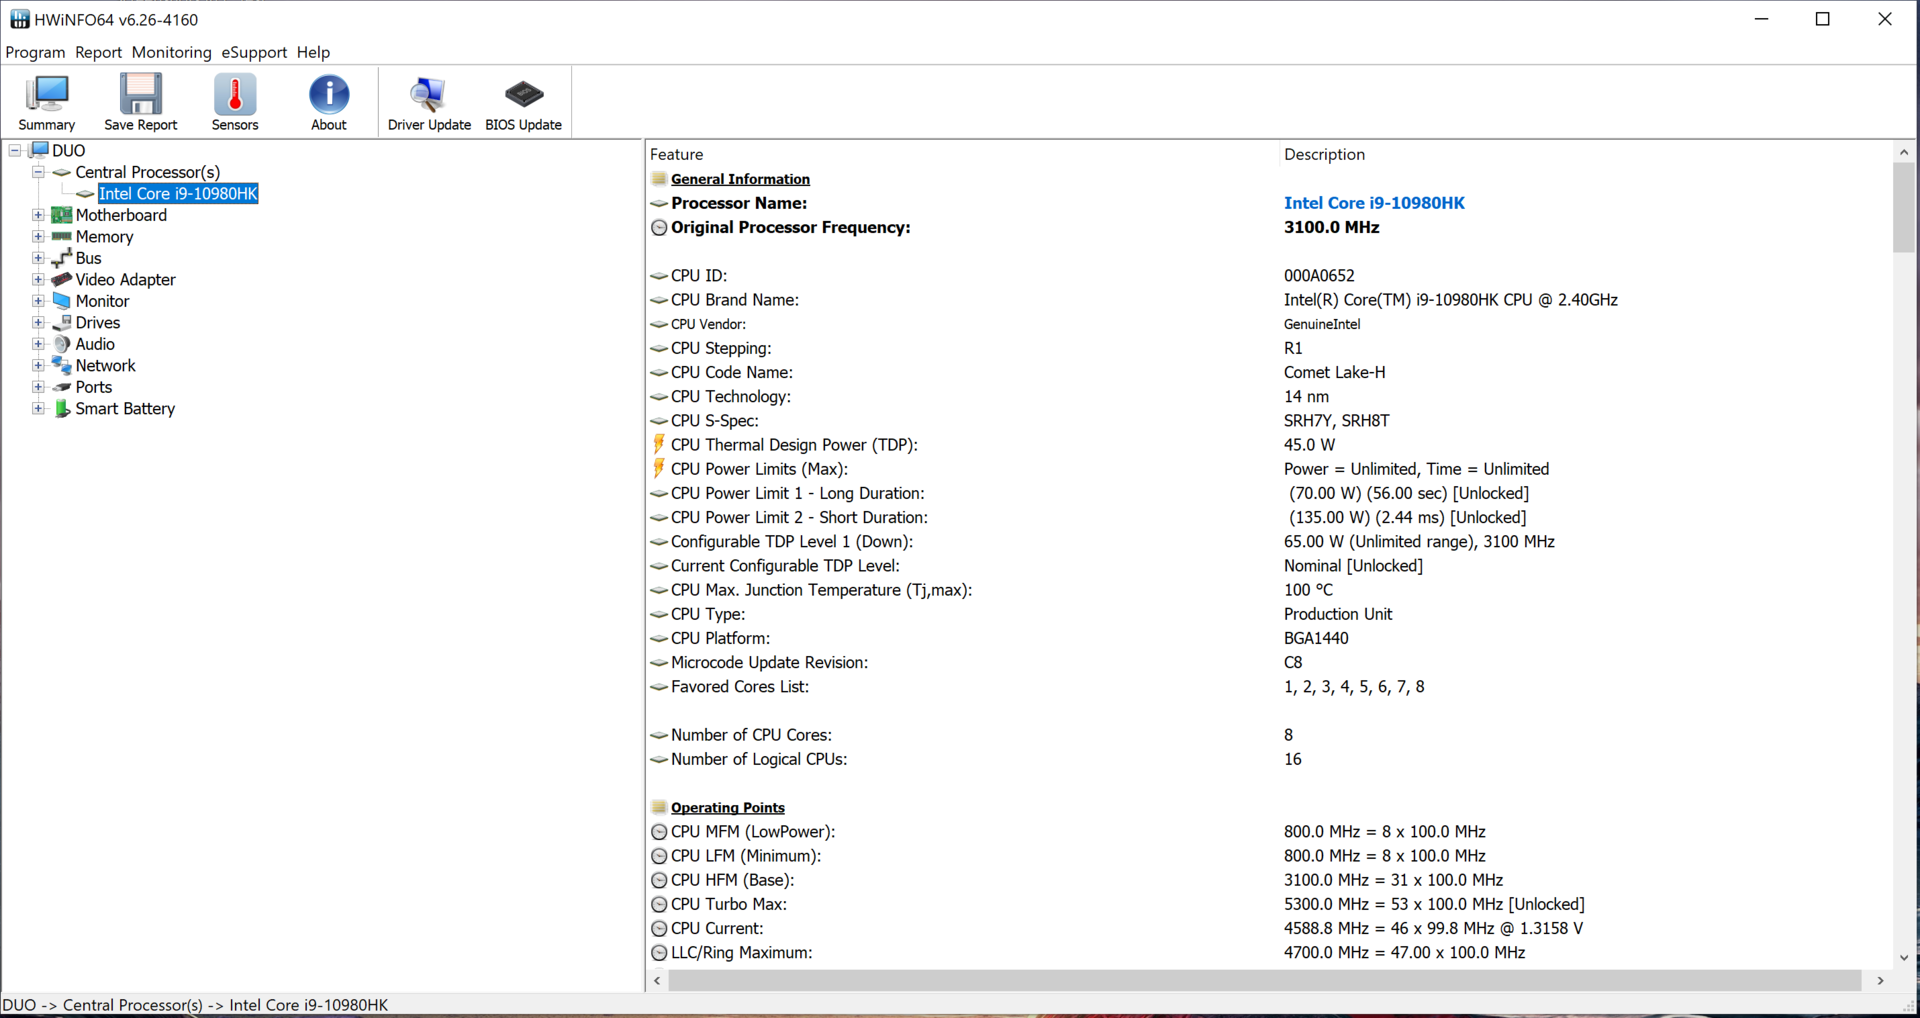
Grâce au processeur Core i9-10980HK octocœur et à la carte graphique GeForce RTX 2080 Super max-Q, le PC portable ne manque pas de ressources. Le tout est accompagné de 32 Go de RAM (en mode double canal), avec un module amovible de 16 Go et 16 Go soudés. Le passage à 48 Go est possible. Les deux SSD NVMe en RAID 0 garantissent des vitesses élevées et un stockage abondant (2 To).
Les tout derniers jeux tournent fluidement sur l'Asus Zephyrus 15 Duo GX550LXS.
L'écran IPS 4K compatible G-Sync marque des points avec sa luminosité, son contraste, ses angles de vision, et grâce à sa certification Pantone, ses couleurs. Il couvre en outre totalement l'espace AdobeRVB. Les temps de réponse sont moyens - une version 300 Hz Full HD est également disponible.
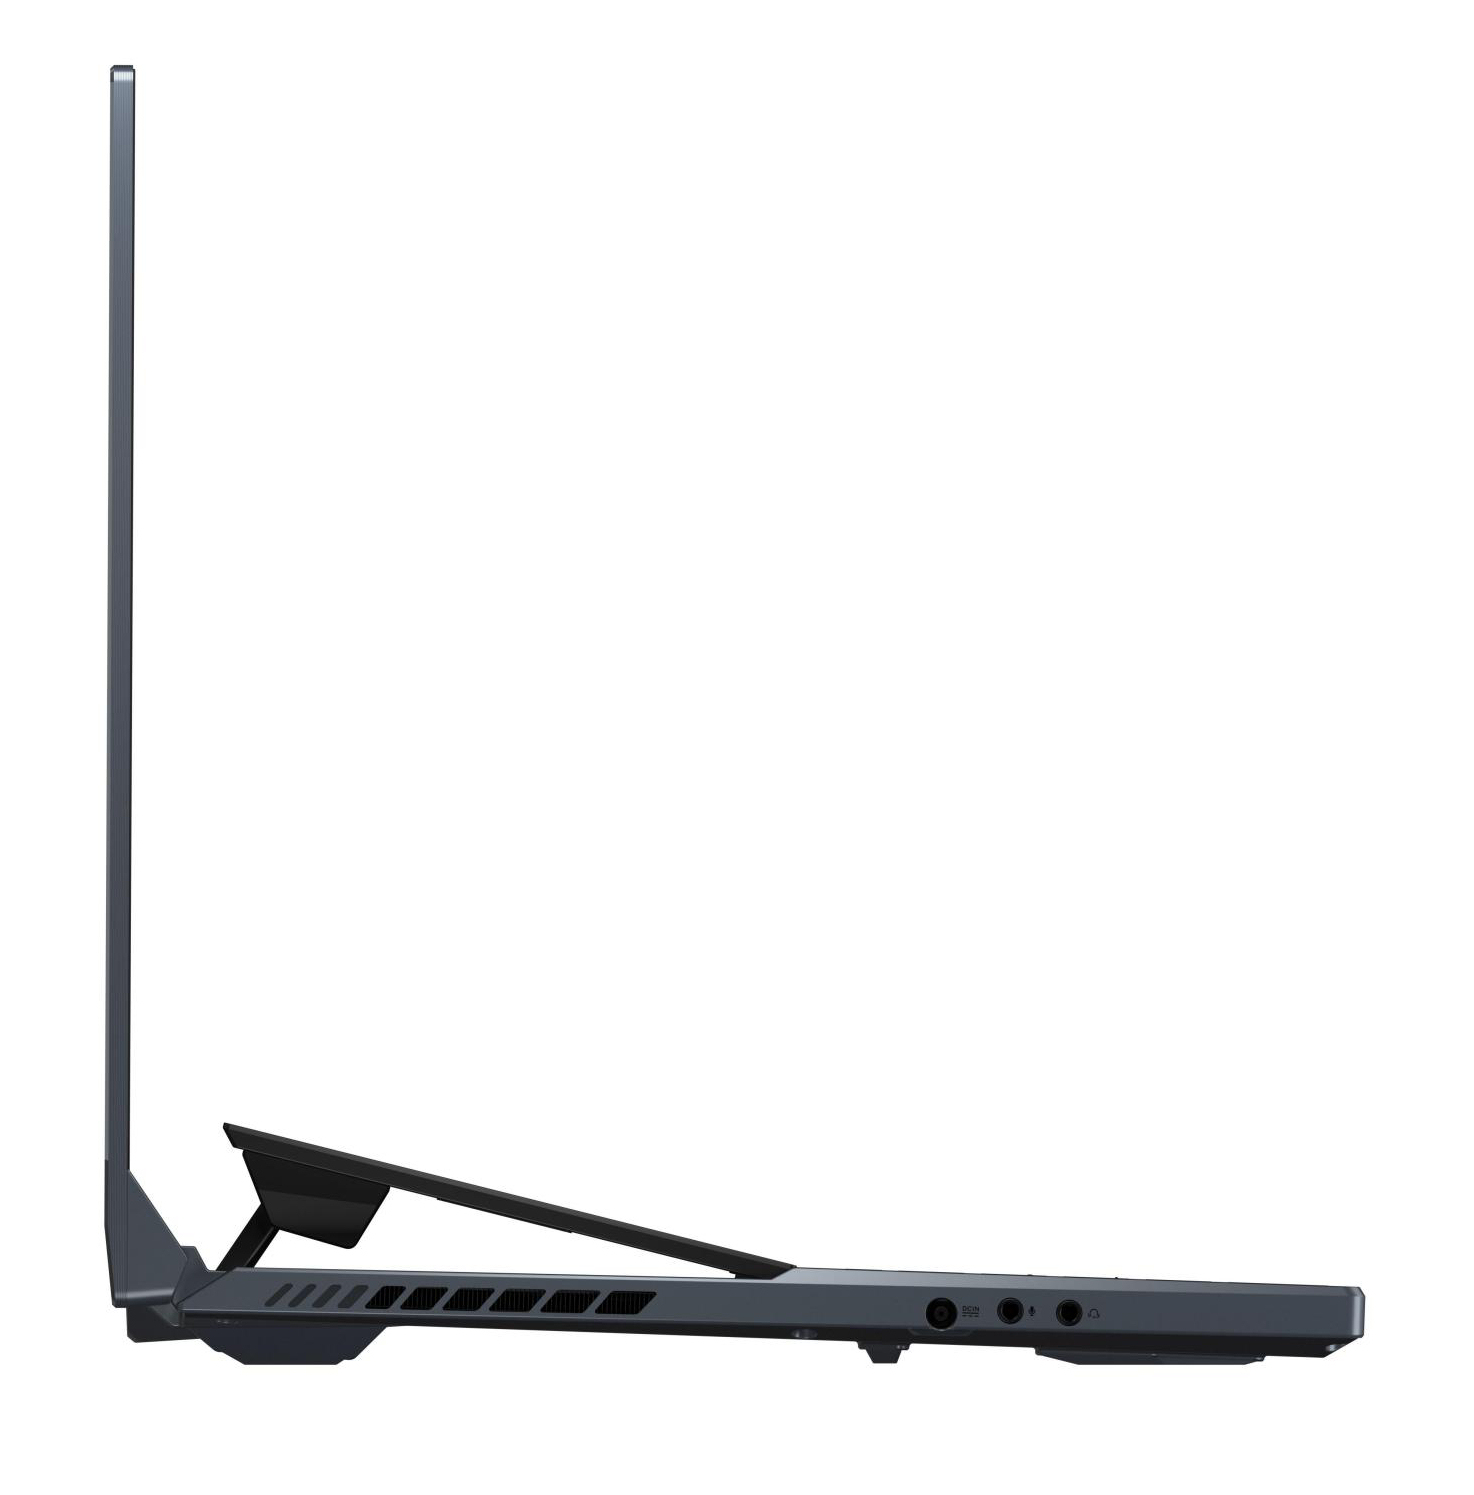
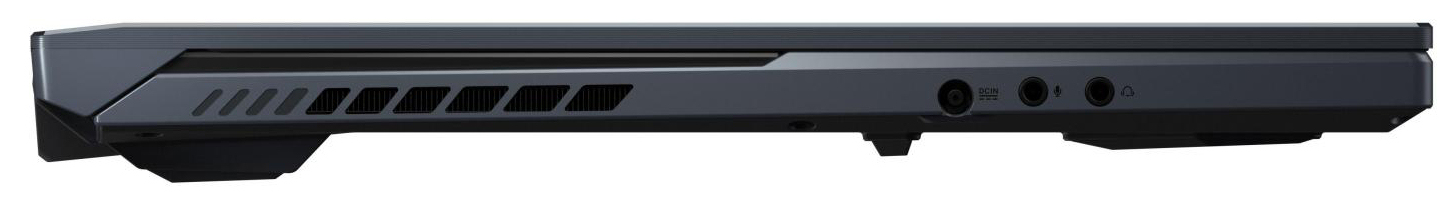
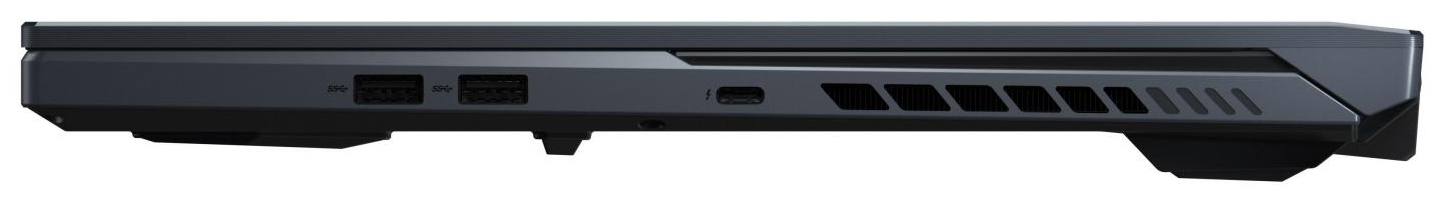
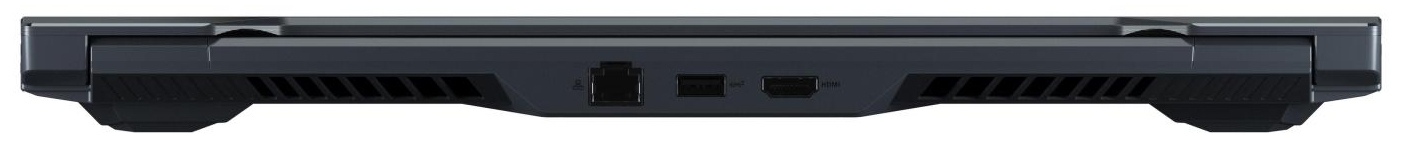
La large sélection de ports intègre un port Thunderbolt 3. Il peut être utilisé pour connecter des docks complets ou un GPU externe. Il peut également être utilisé pour charger l'appareil, avec des performances réduites, par exemple en déplacements, avec le deuxième adaptateur secteur inclus (65 W).
L’intégralité de cette critique est disponible en anglais en suivant ce lien.
Asus ROG Zephyrus Duo 15 GX550LXS
- 07/22/2020 v7 (old)
Sascha Mölck
Price comparison
