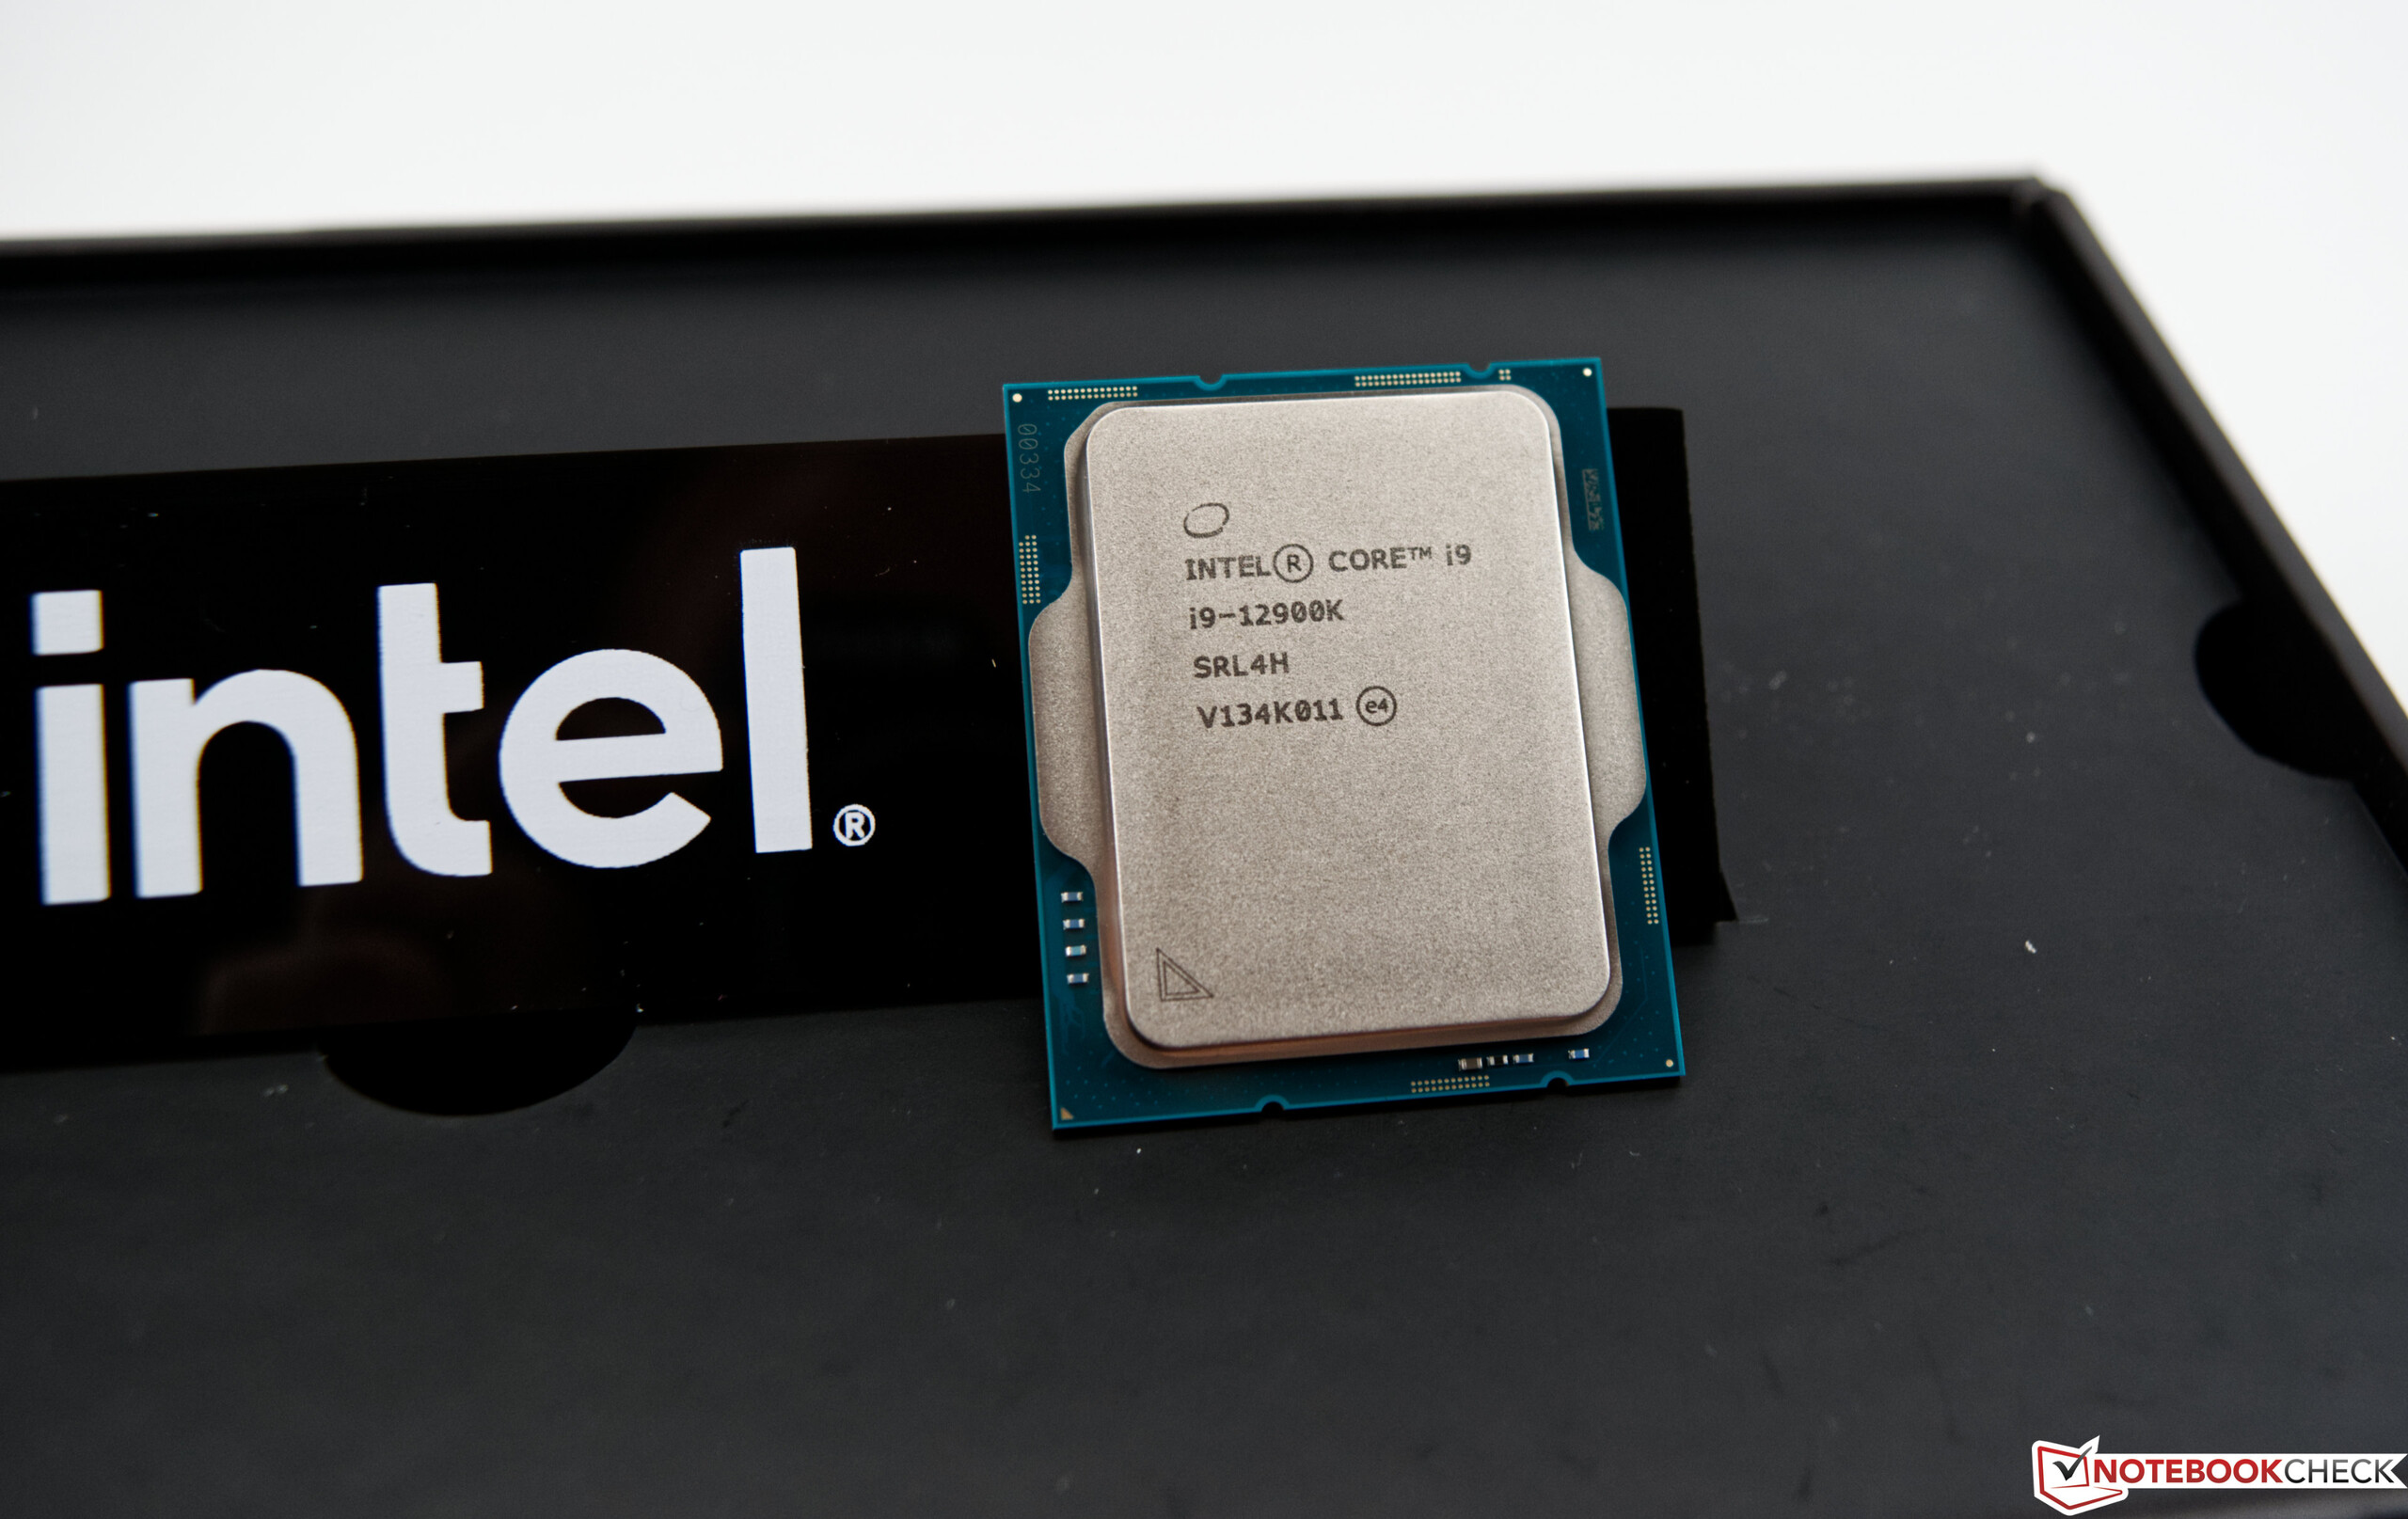
Test de l'Intel Alder Lake-S : le CPU de jeu le plus puissant est-il à nouveau Intel ?
Intel a beaucoup de projets avecAlder Lake-S. Pendant des années, Intel a été la norme de référence pour le processeur de jeu le plus rapide, jusqu'à ce qu'AMD accélère les choses avec son Ryzen 5000 et prenne la couronne. Pour l'utilisateur final, ce jeu du chat et de la souris présente de nombreux avantages, car il permet d'apporter des améliorations plus rapidement aux masses.
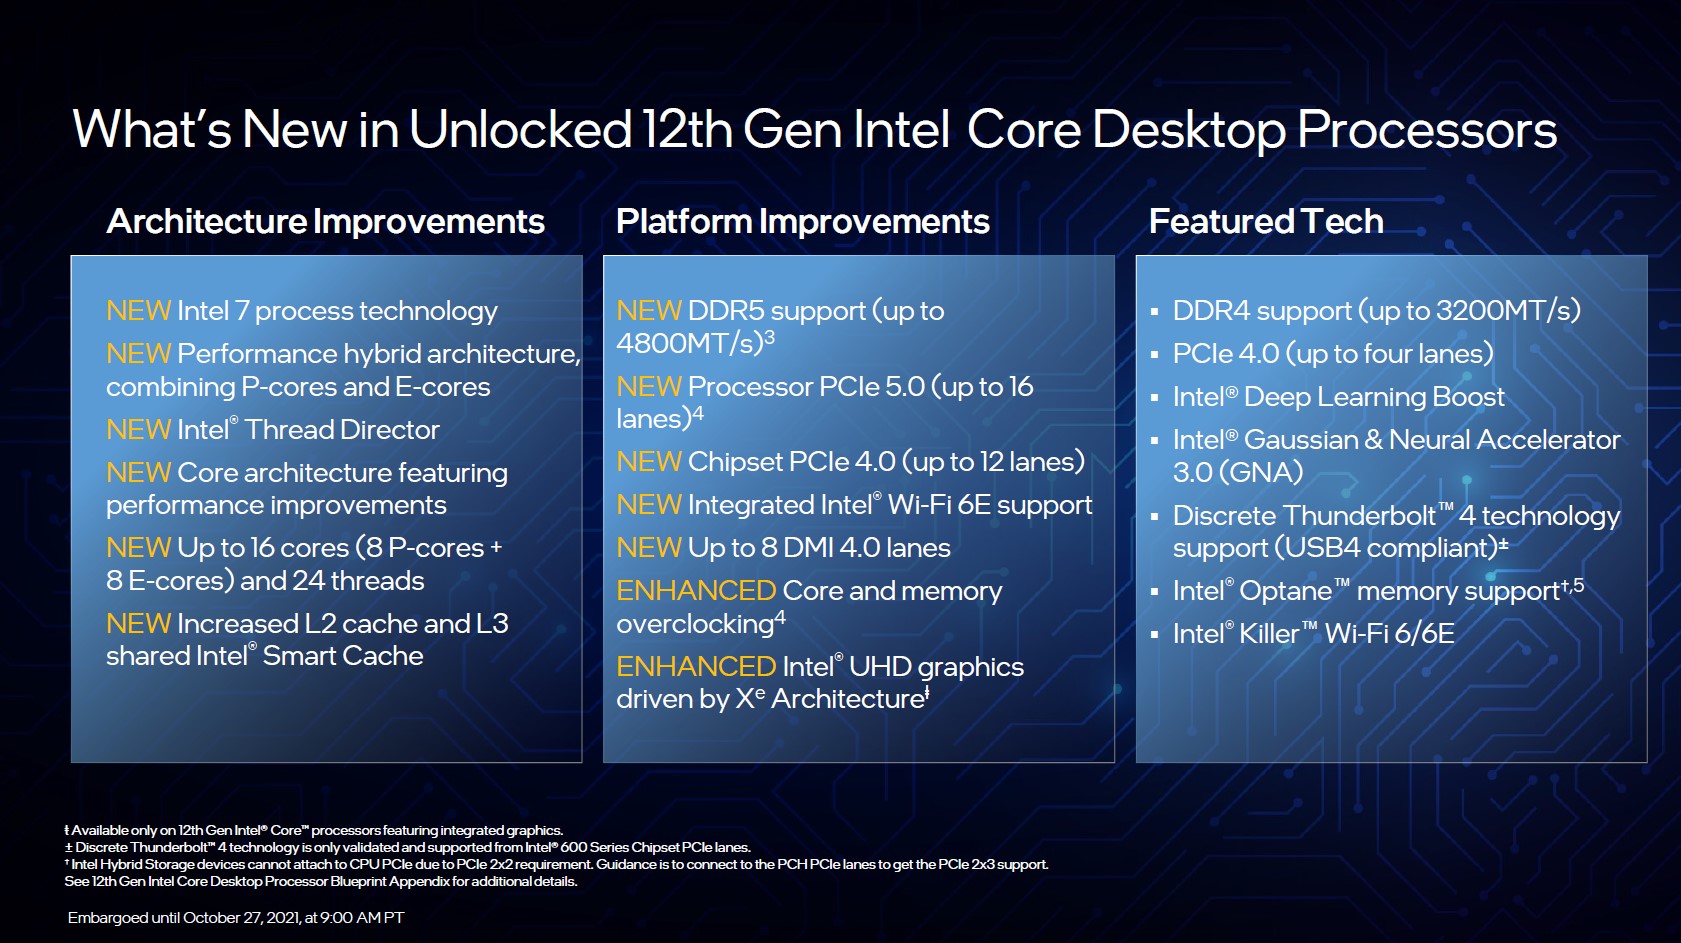
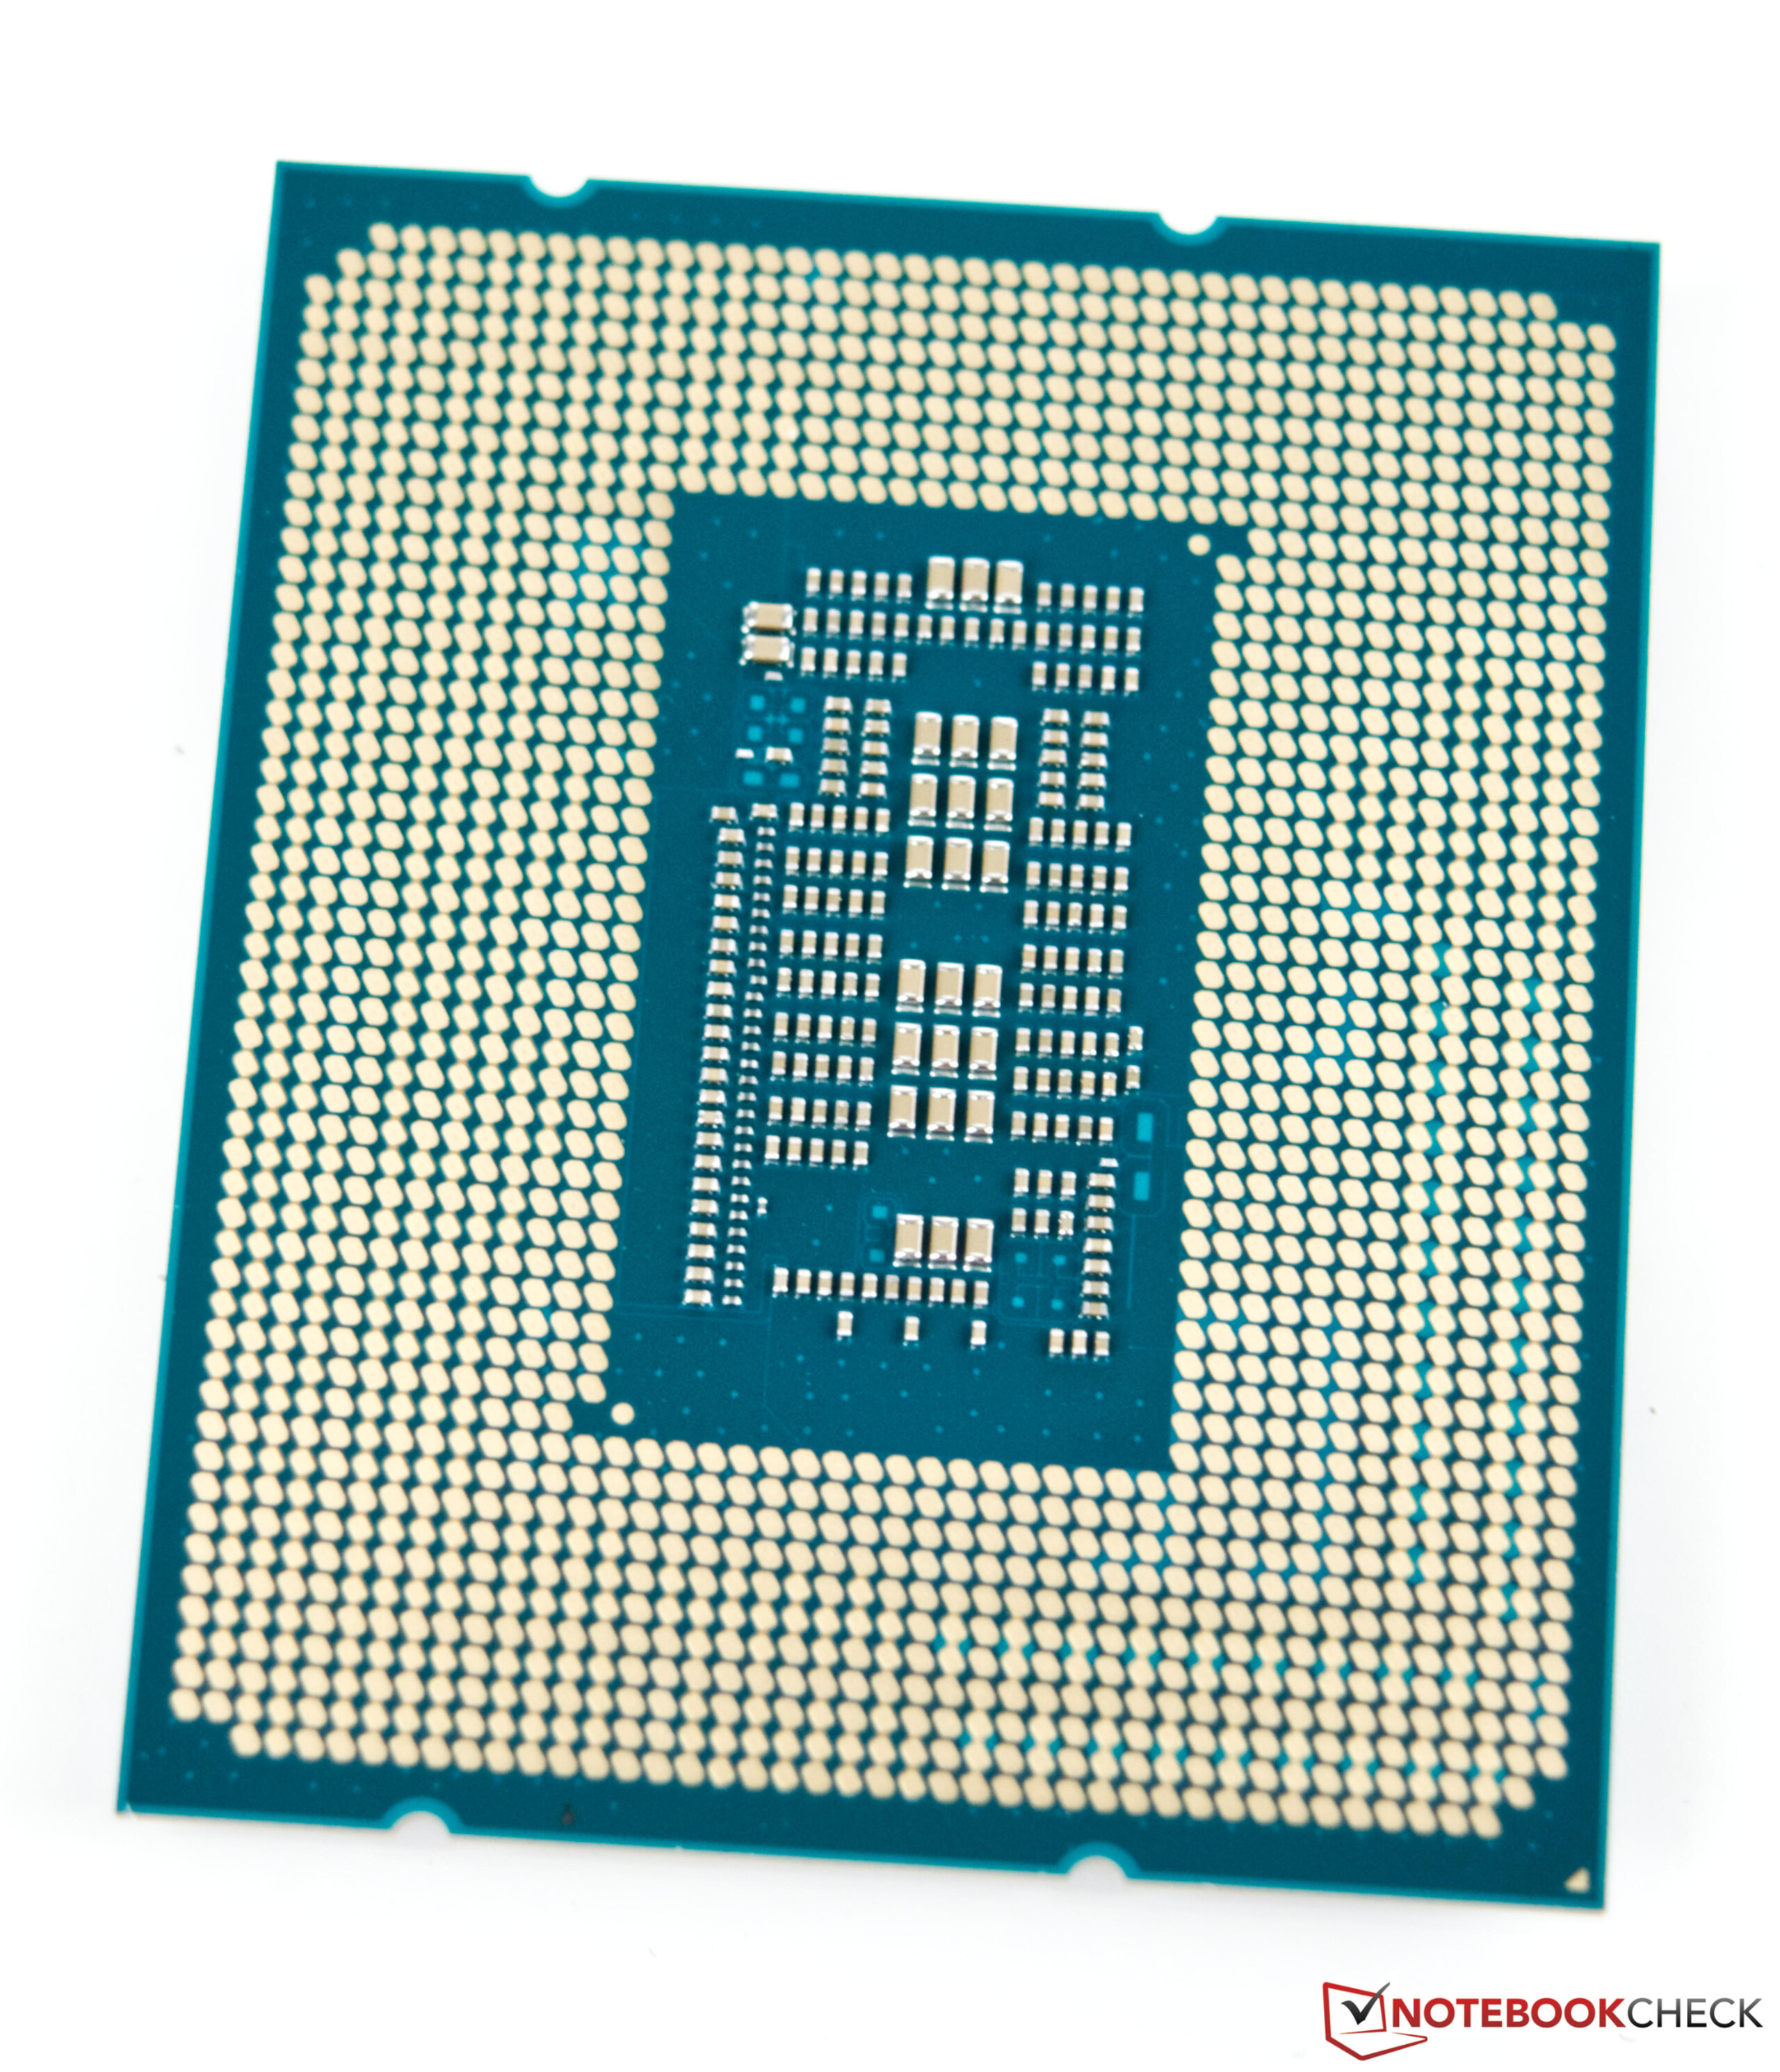
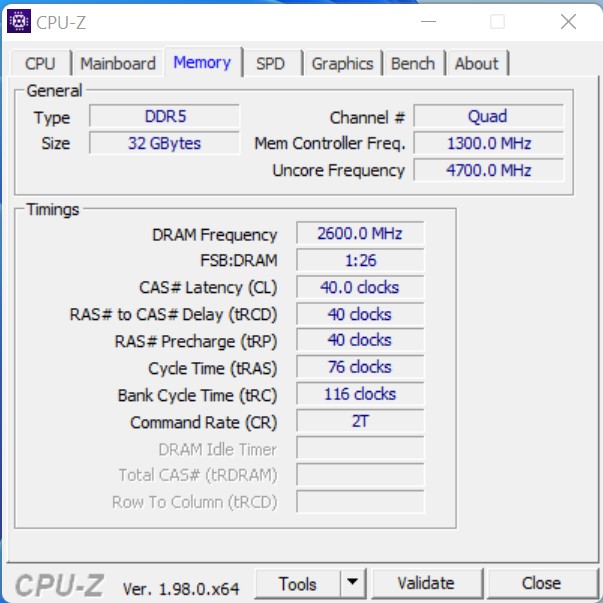
Avec les derniers processeurs pour le segment des ordinateurs de bureau et la 12e génération de la série Core, Intel introduit à nouveau un changement de plate-forme. Après Comet Lake-S et Rocket Lack-S, le LGA1200 est déjà de l'histoire ancienne et le socket LGA 1700, plus grand, prend le relais. Les améliorations les plus connues sont le support DDR5 et PCIe 5.0. Cependant, à l'heure actuelle, il n'y a toujours pas de produits disponibles qui peuvent utiliser cette bande passante complète. L'investissement dans cette plate-forme ne pourra donc être utilisé qu'à l'avenir. Les choses semblent un peu mieux en ce qui concerne la mémoire de travail. Ceux qui veulent rejoindre la dernière tendance et obtenir les meilleures performances ne pourront pas contourner la nouvelle mémoire de travail DDR5. Mais les processeurs Intel Alder Lake-S supportent également la mémoire vive DDR4. Vous pouvez trouver les cartes correspondantes en vente également avec le nouveau chipset haut de gamme Z690.
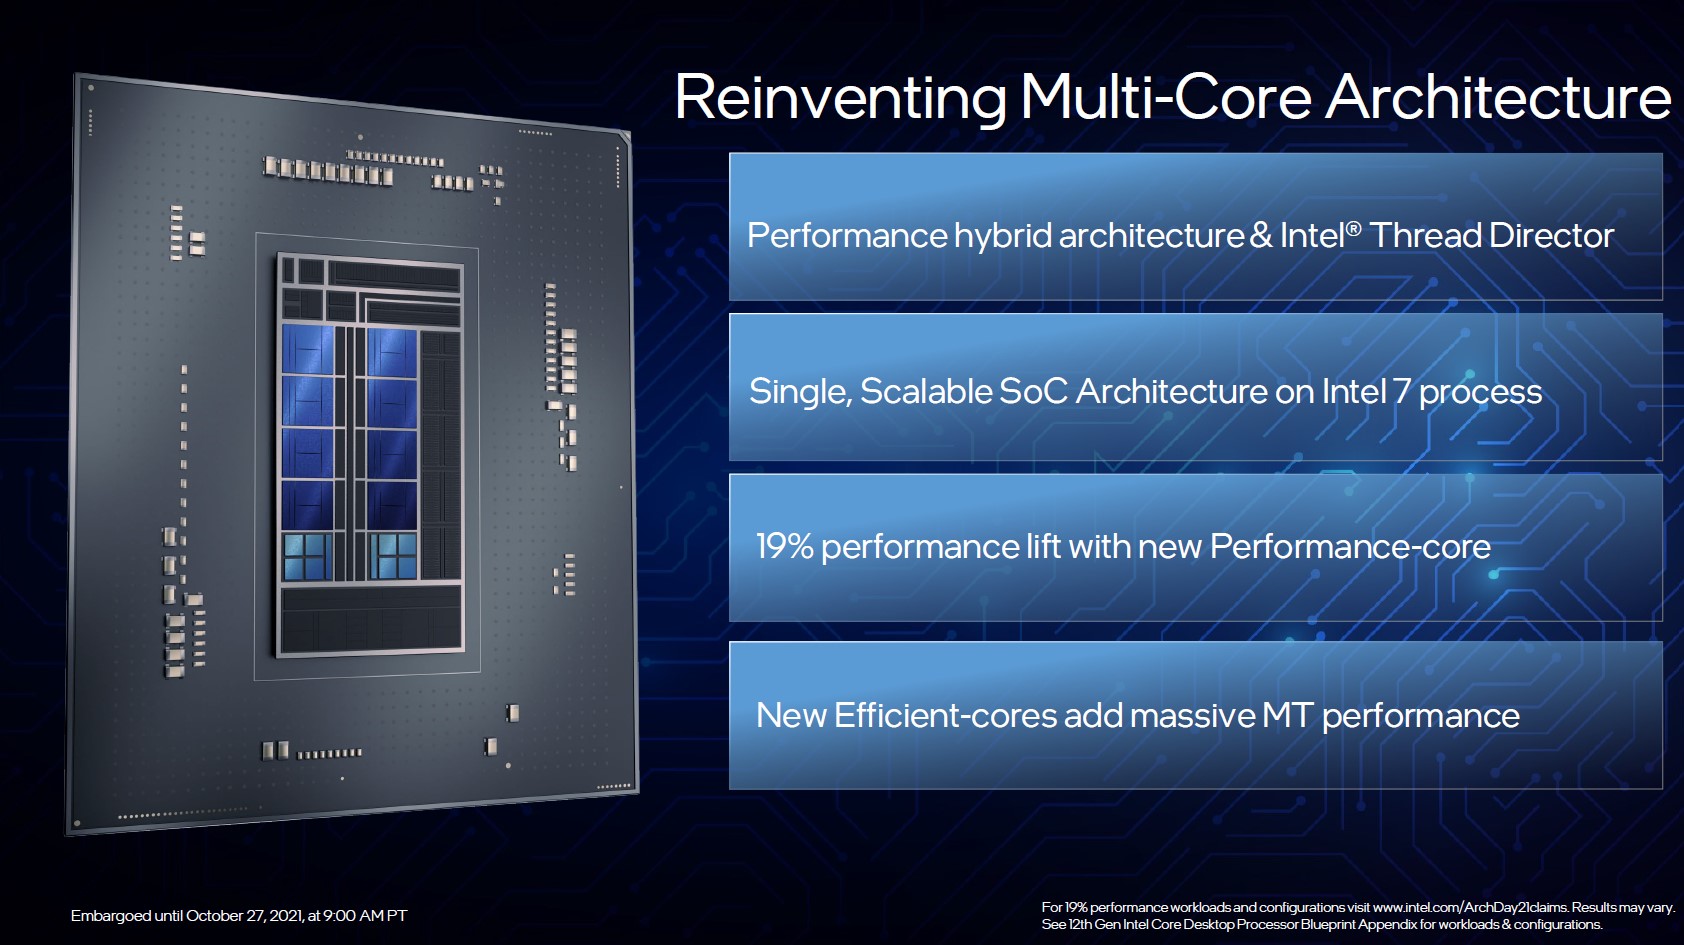
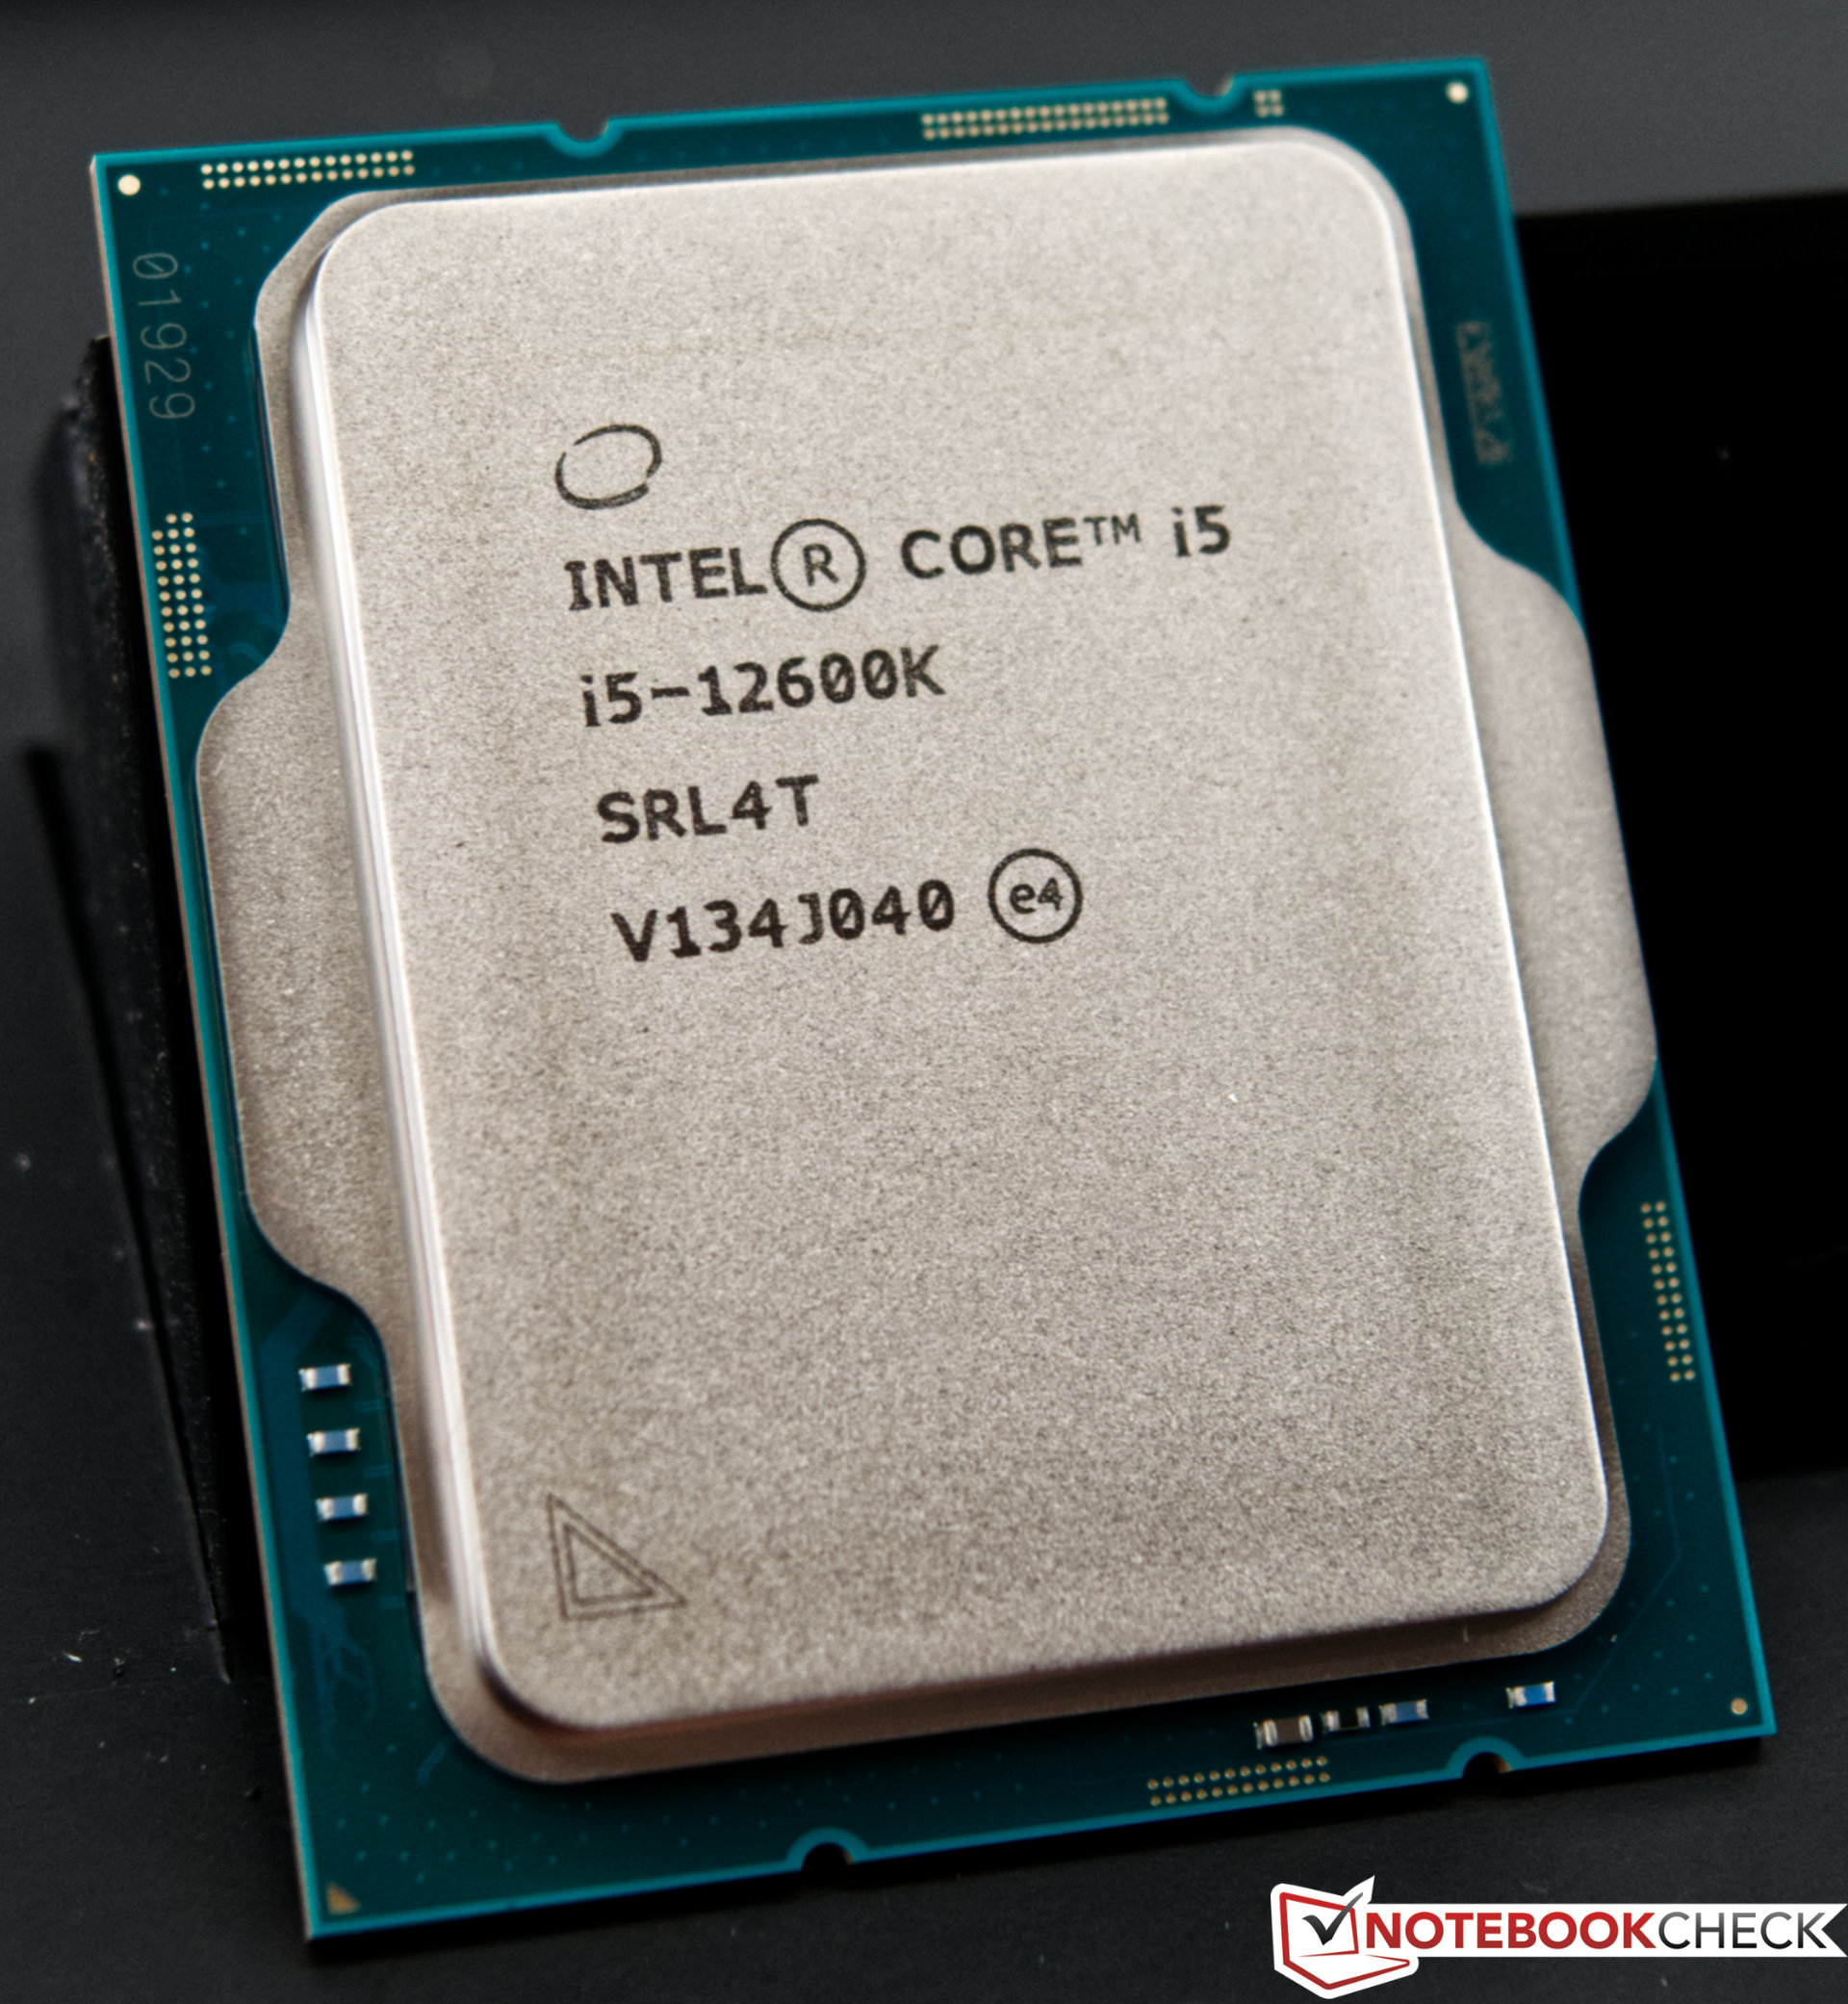
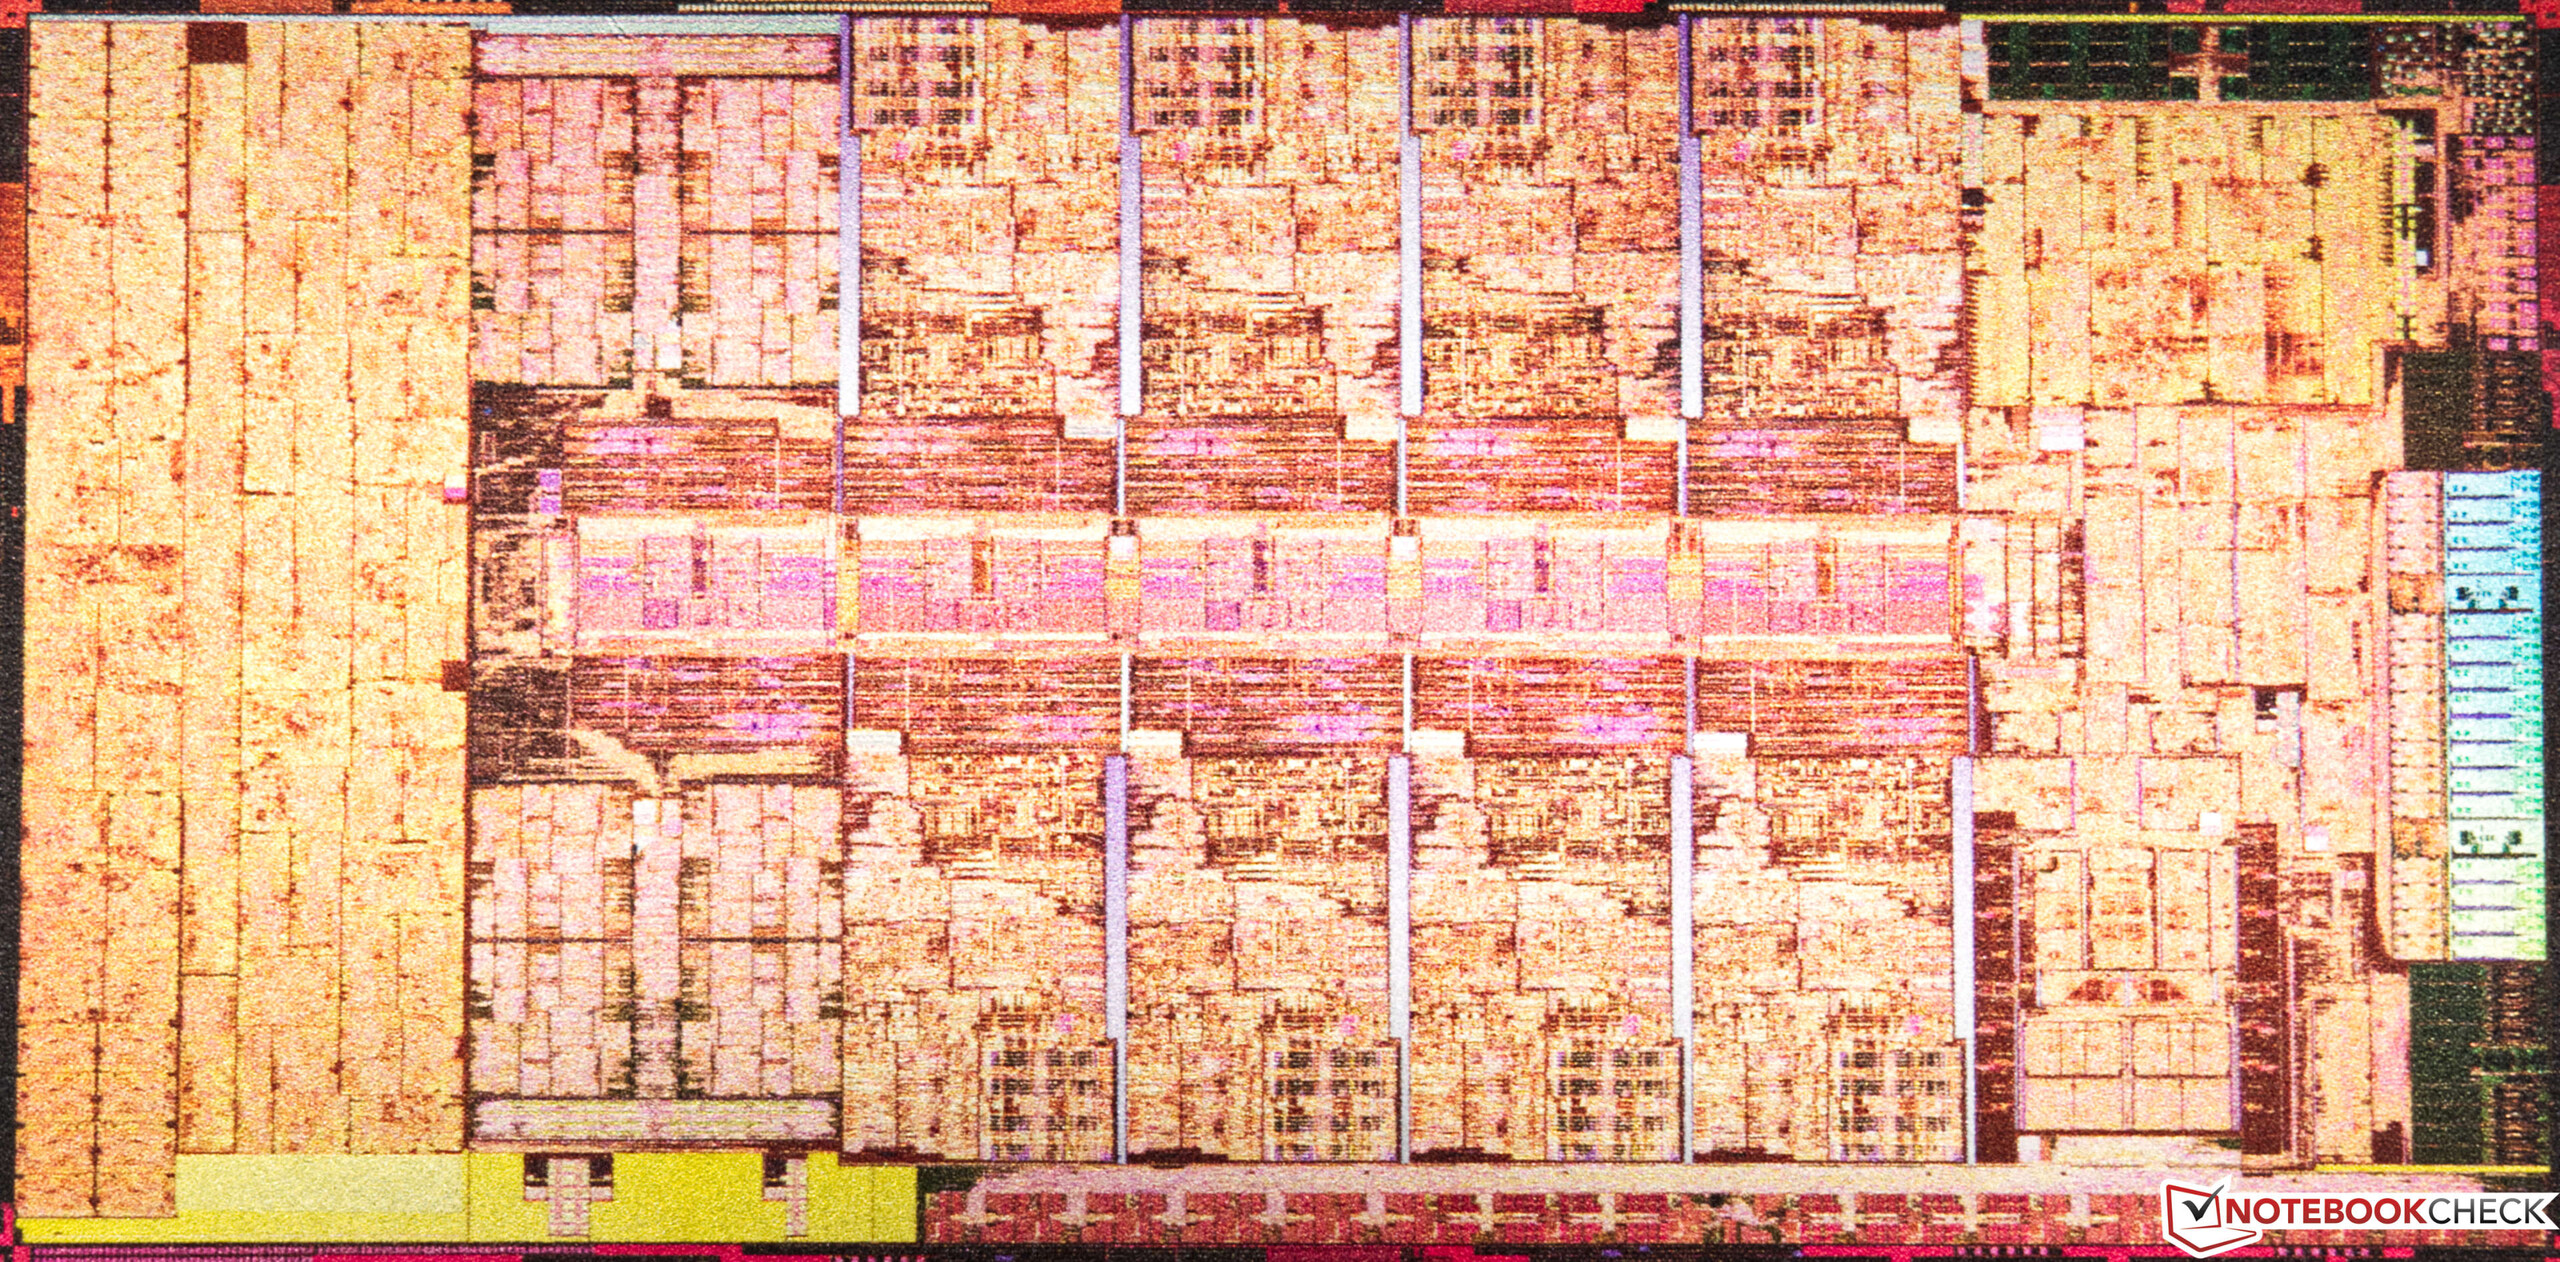
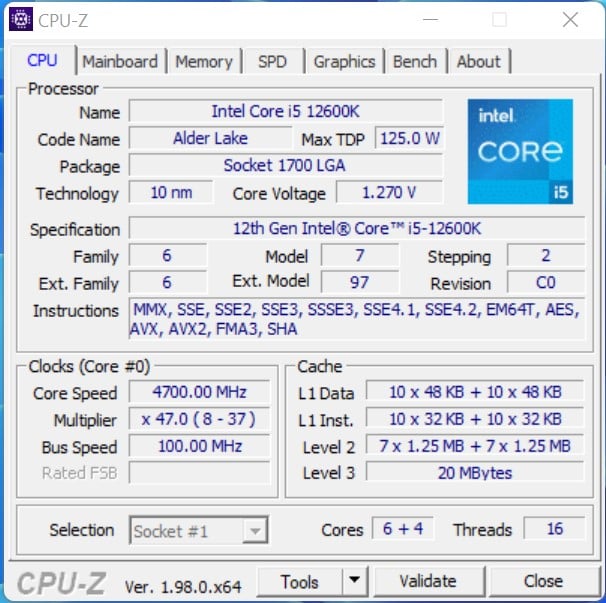
Avec Alder Lake-S, Intel fait un grand pas en avant qui n'est pas seulement un petit rafraîchissement de Rocket Lake-S. La nouvelle conception est divisée en cœurs de performance, les fameux P-cores, et en cœurs économes en énergie, les E-cores. Cela permet au modèle supérieur de gérer 24 threads, résultant de 8 P-cores incluant l'hyperthreading (HT) et 8 E-cores sans HT. Dans le plus petit Intel Core i5-12600K, que nous examinons également dans cette revue, il y a 6 P-cores et 4 E-cores, ce qui donne 16 threads. Les nouveaux E-cores sont censés soulager les P-cores, leur permettant d'offrir des performances de calcul suffisantes pour les applications exigeantes, tandis que les E-cores gèrent les processus de fond. Mais les E-cores ne sont en aucun cas des unités de calcul lentes, et leurs performances sont au niveau de celles de Skylake. La gestion optimale des cœurs est assurée par l'Intel Thread Director. Windows 11 comme système d'exploitation est une condition indispensable pour une utilisation optimale.
Nous avons rassemblé pour vous les représentants les plus importants de la nouvelle famille Alder Lake-S dans la liste ci-dessous
Les processeurs Core de la série Alder Lake-S en un coup d'œil
| Modèle | Cores / Threads |
Vitesse d'horloge P-Core / Turbo | Turbo 3.0 | Vitesse d'horloge E-Core / Turbo | Cache L2 + L3 | Graphics | PBP | MTB | Prix (SRP) |
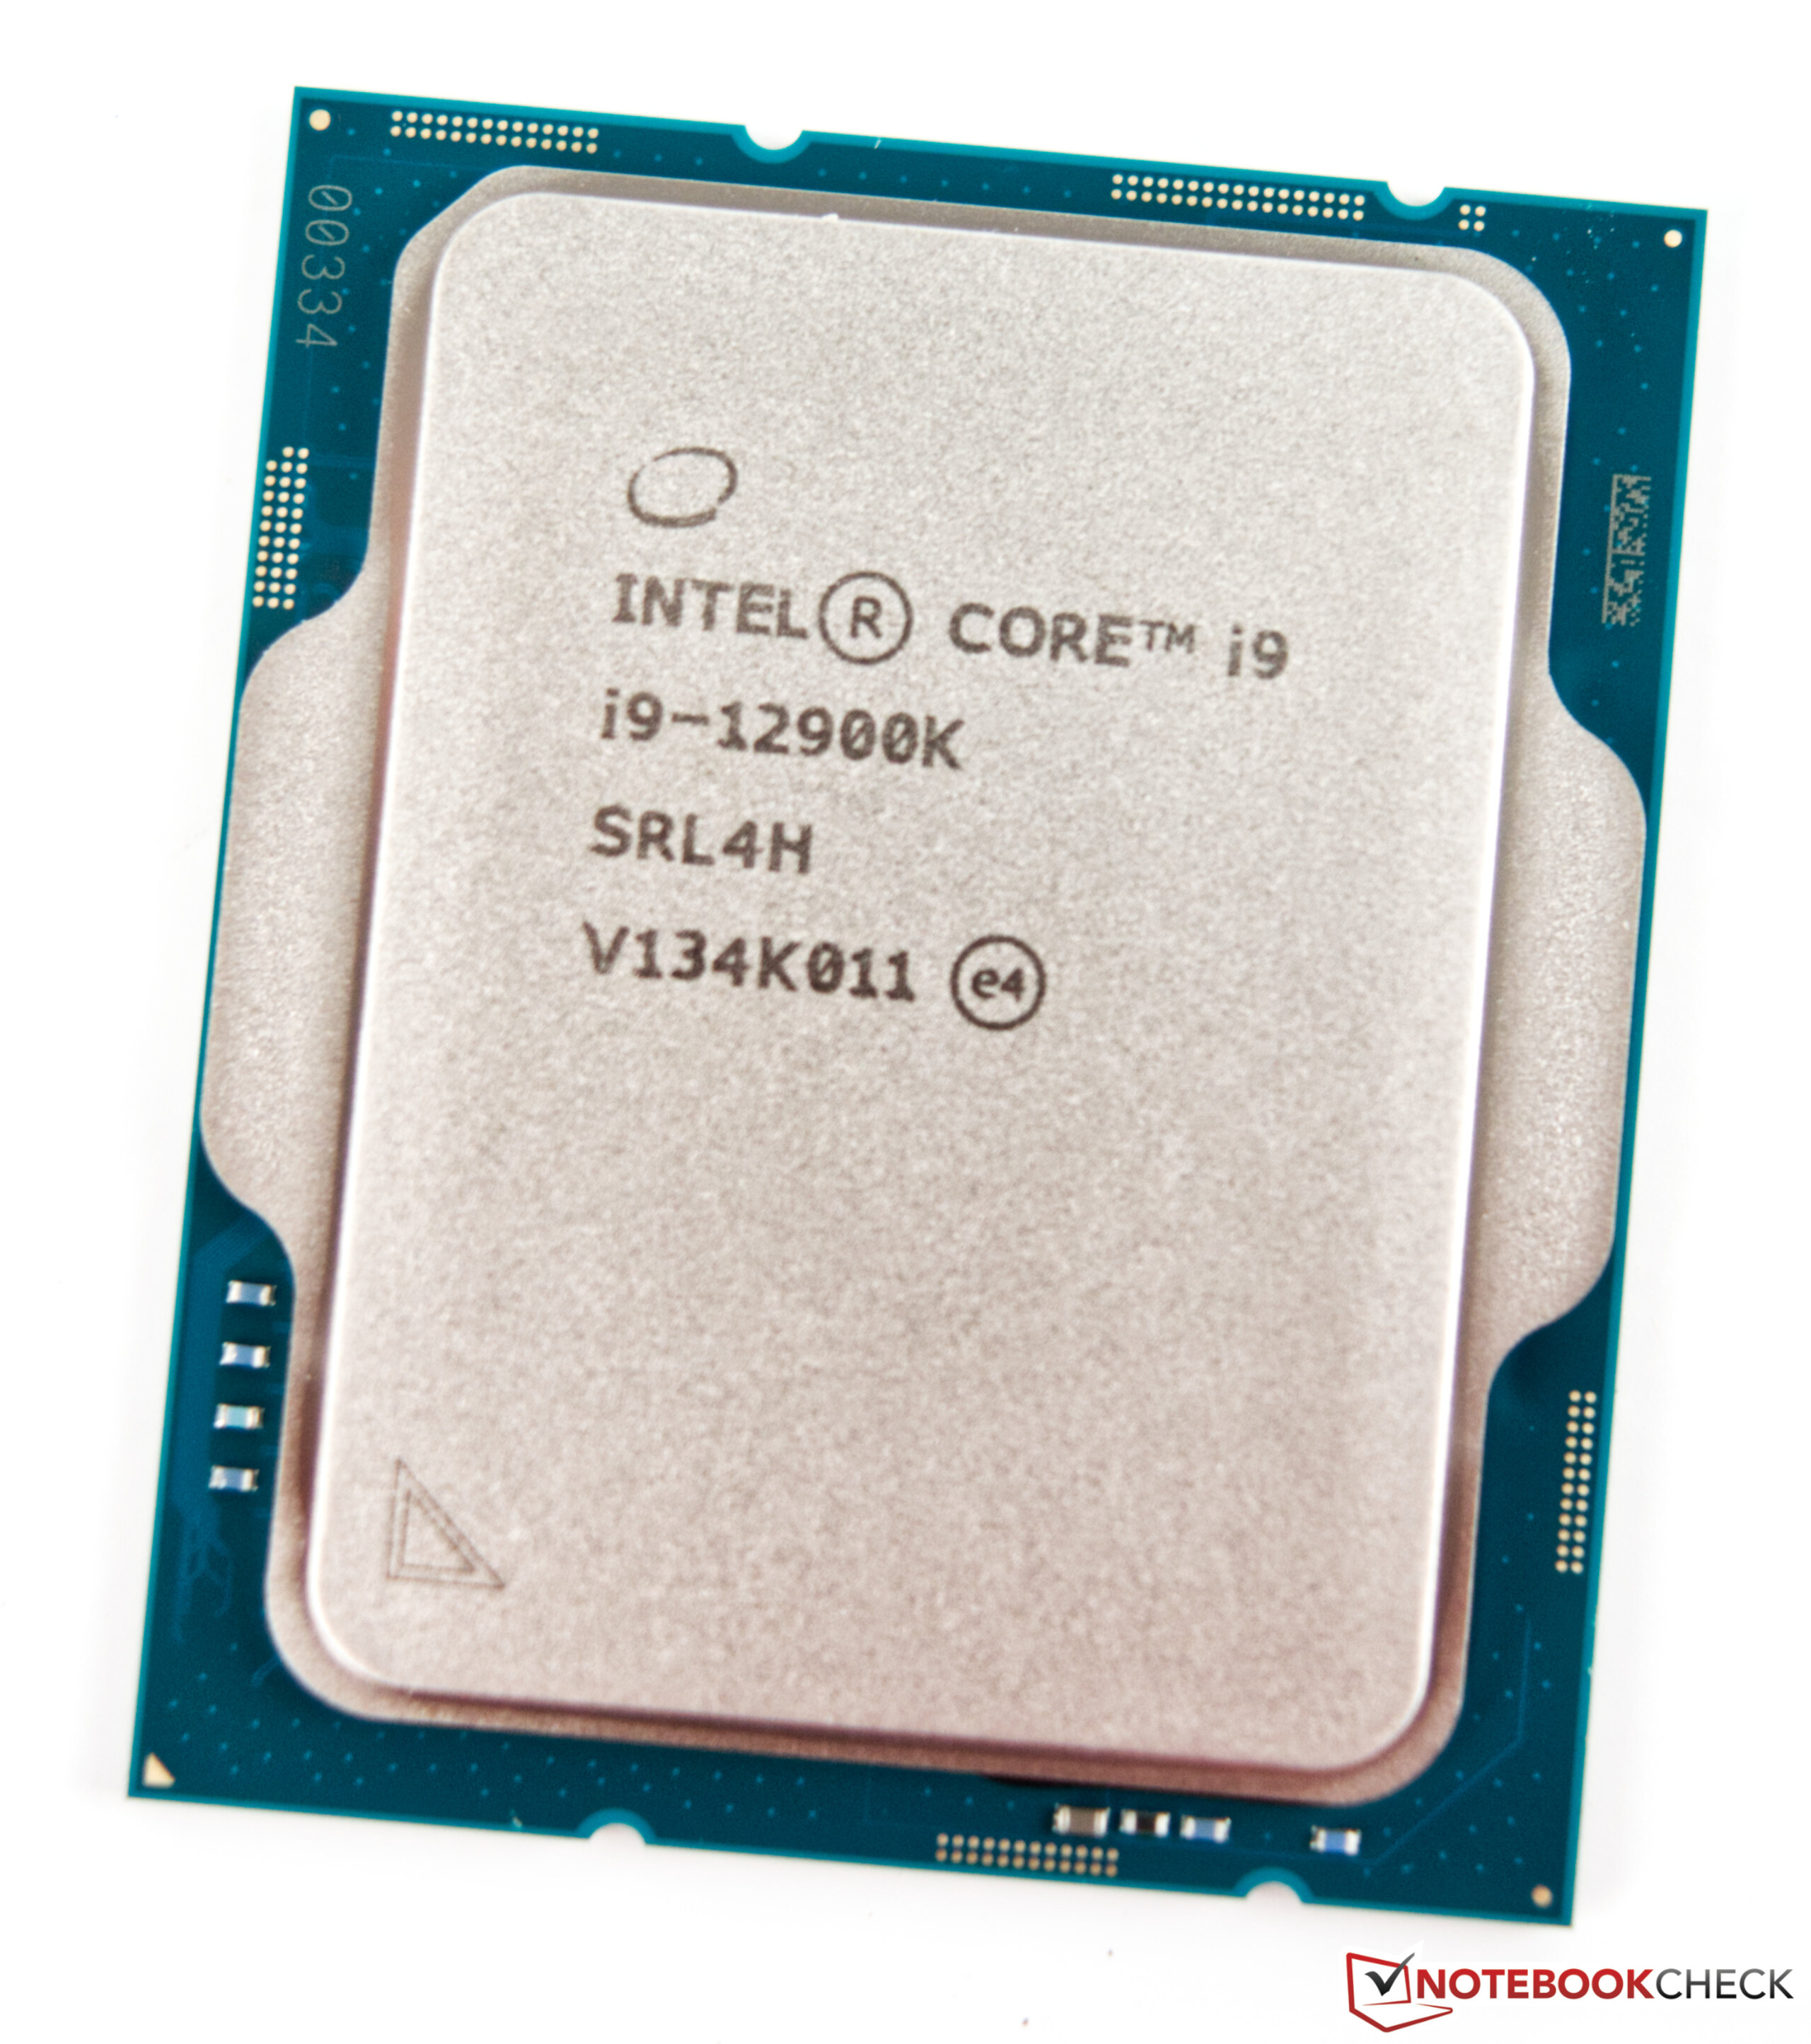
| Core i9-12900K | 16(8P + 8E) /24 | 3,2 GHz / 5,1 GHz | 5,2 GHz | 2,4 GHz / 3,9 GHz | 14+ 30 Mo | UHD770 | 125Watt | 241Watt | $ 589 |
| Core i9-12900KF | 16 (8P + 8E) /24 | 3,2 GHz / 5,1 GHz | 5,2 GHz | 2,4 GHz / 3,9 GHz | 14 + 30 Mo | - | 125 Watt | 241 Watt | $ 564 |
| Core i7-12700K | 12 (8P + 4E) /20 | 3,6 GHz / 4,9 GHz | 5,0 GHz | 2,7 GHz / 3,8 GHz | 12 + 25 Mo | UHD 770 | 125 Watt | 190 Watt | $ 409 |
| Core i7-12700KF | 12 (8P + 4E) /20 | 3,6 GHz / 4,9 GHz | 5,0 GHz | 2,7 GHz / 3,8 GHz | 12 + 25 Mo | - | 125 Watt | 190 Watt | $ 384 |
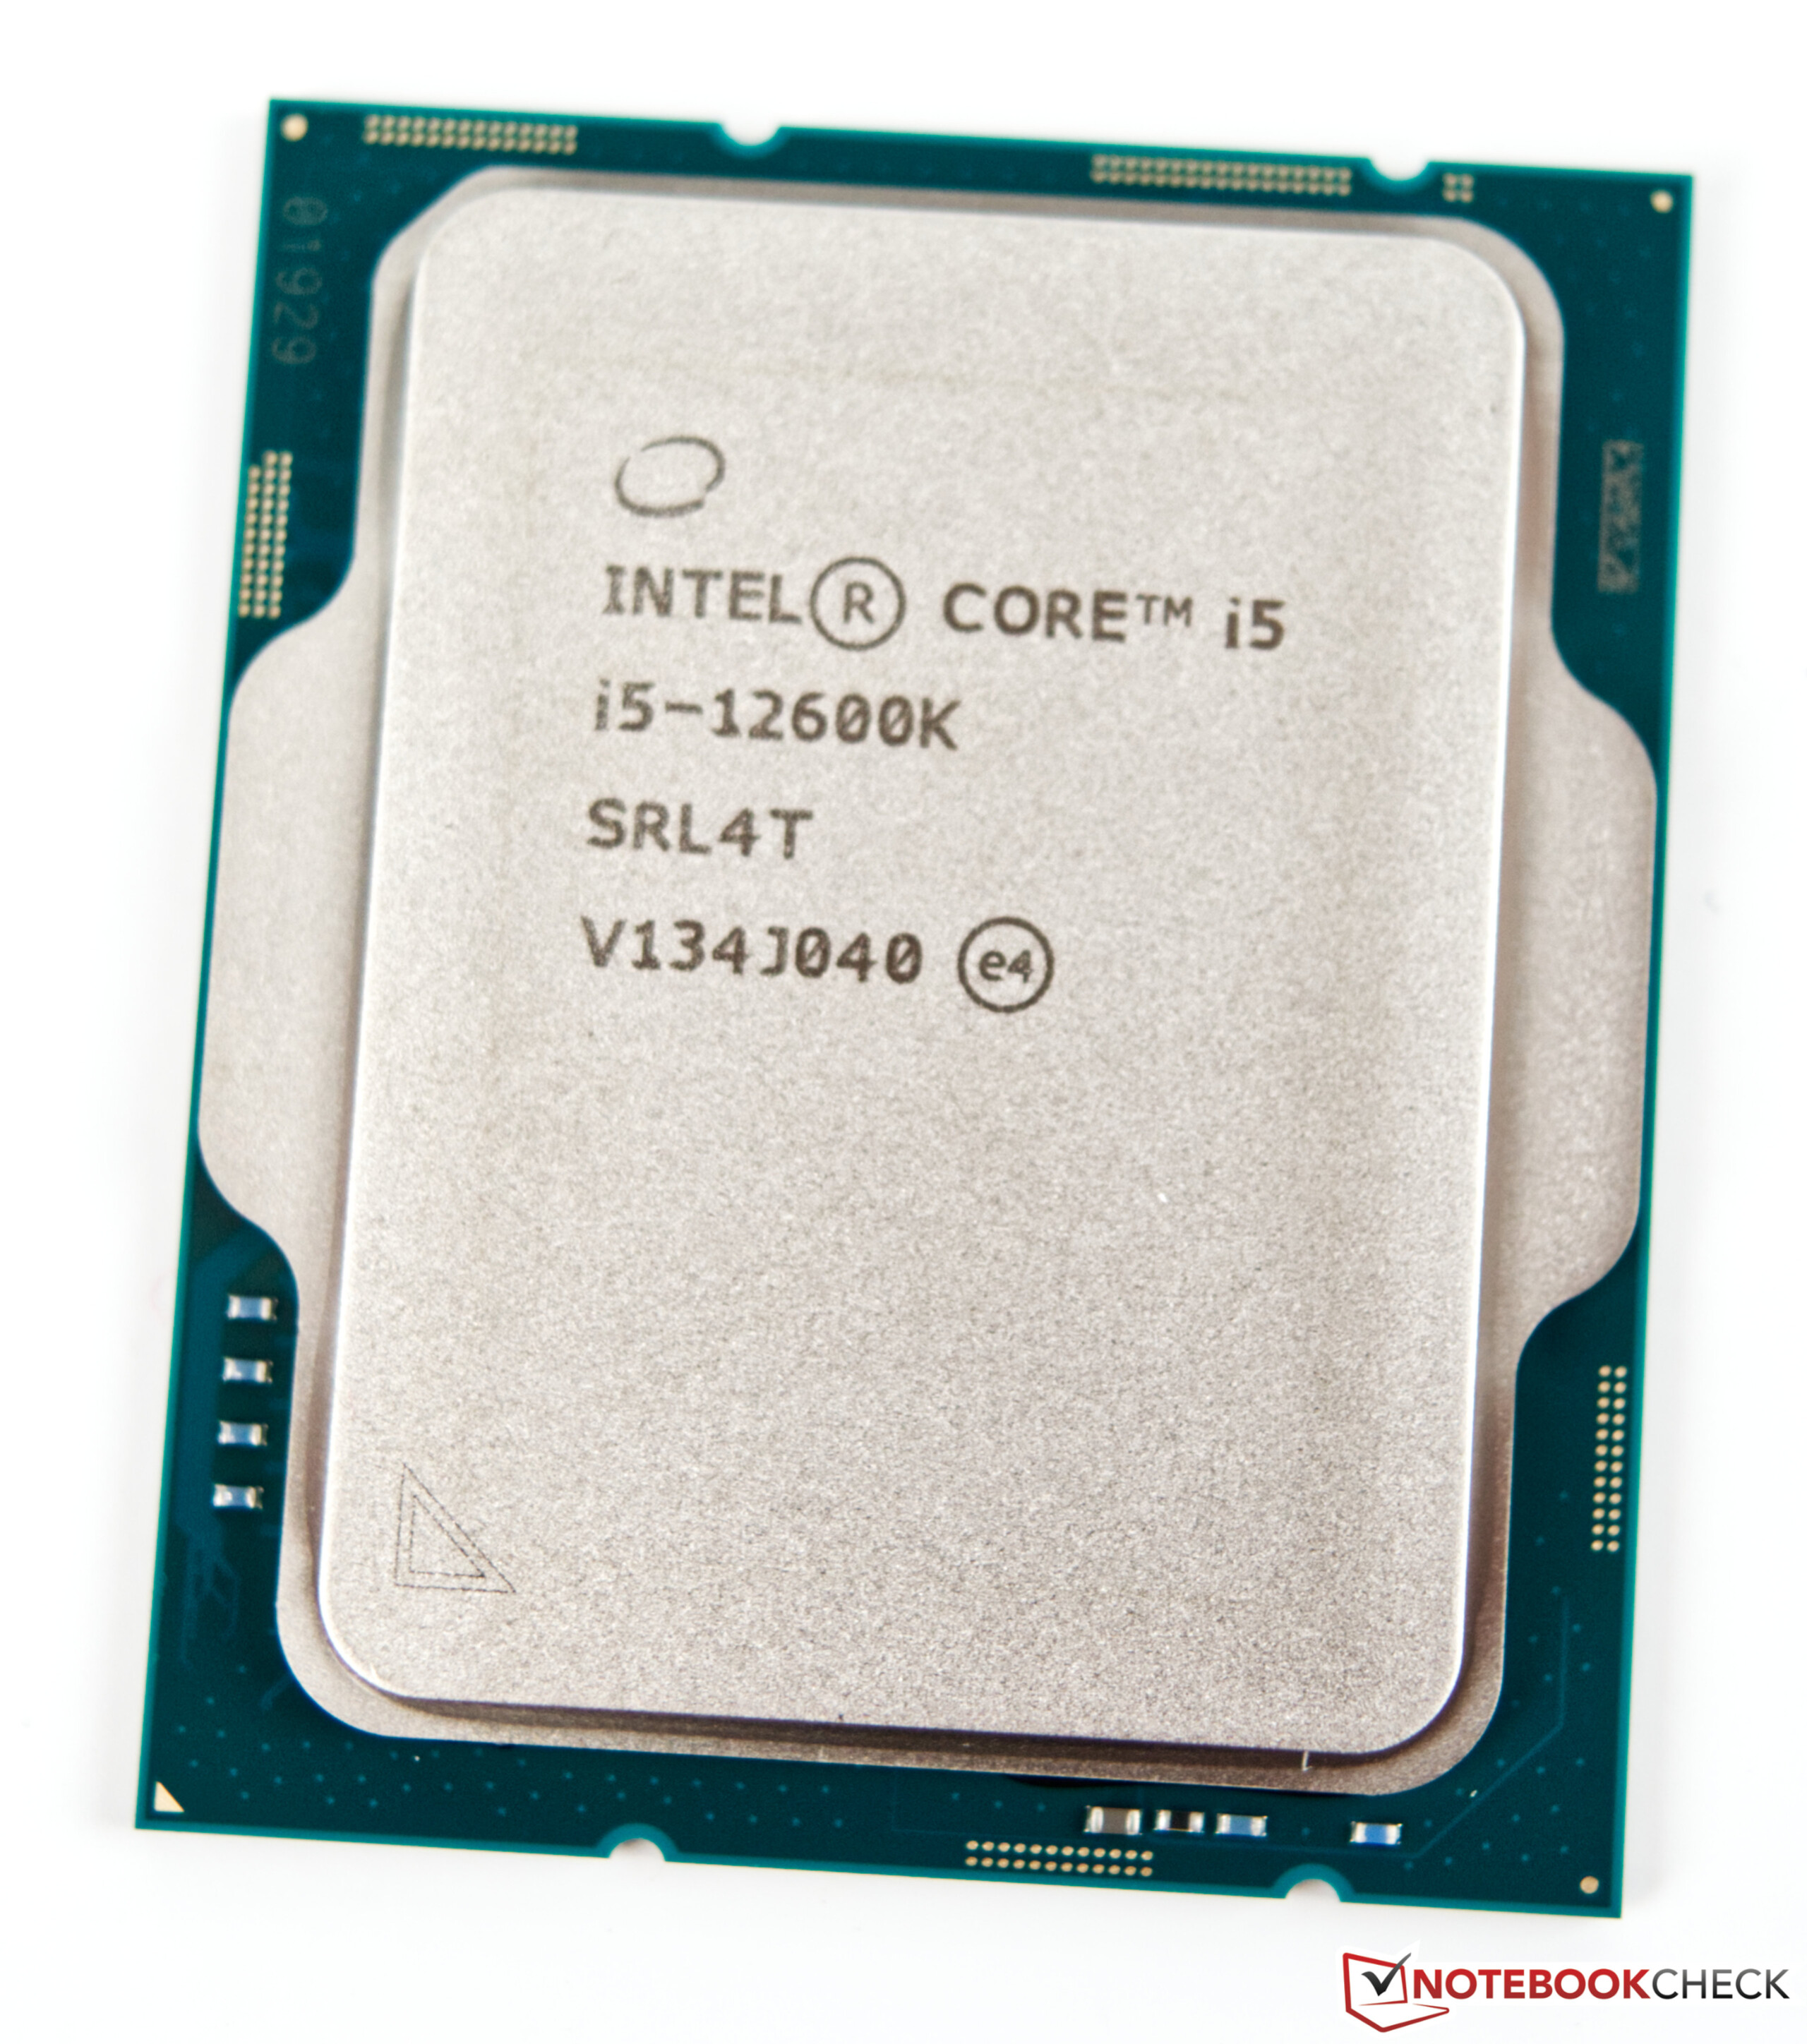
| Core i5-12600K | 10(6P + 4E) /16 | 3,7 GHz / 4,9 GHz | - | 2,8 GHz / 3,6 GHz | 9,5 + 20 Mo | UHD770 | 125Watt | 150Watt | $ 289 |
| Core i5-12600KF | 10 (6P + 4E) /16 | 3,7 GHz / 4,9 GHz | - | 2,8 GHz / 3,6 GHz | 9,5 + 20 Mo | - | 125 Watt | 150 Watt | $ 264 |
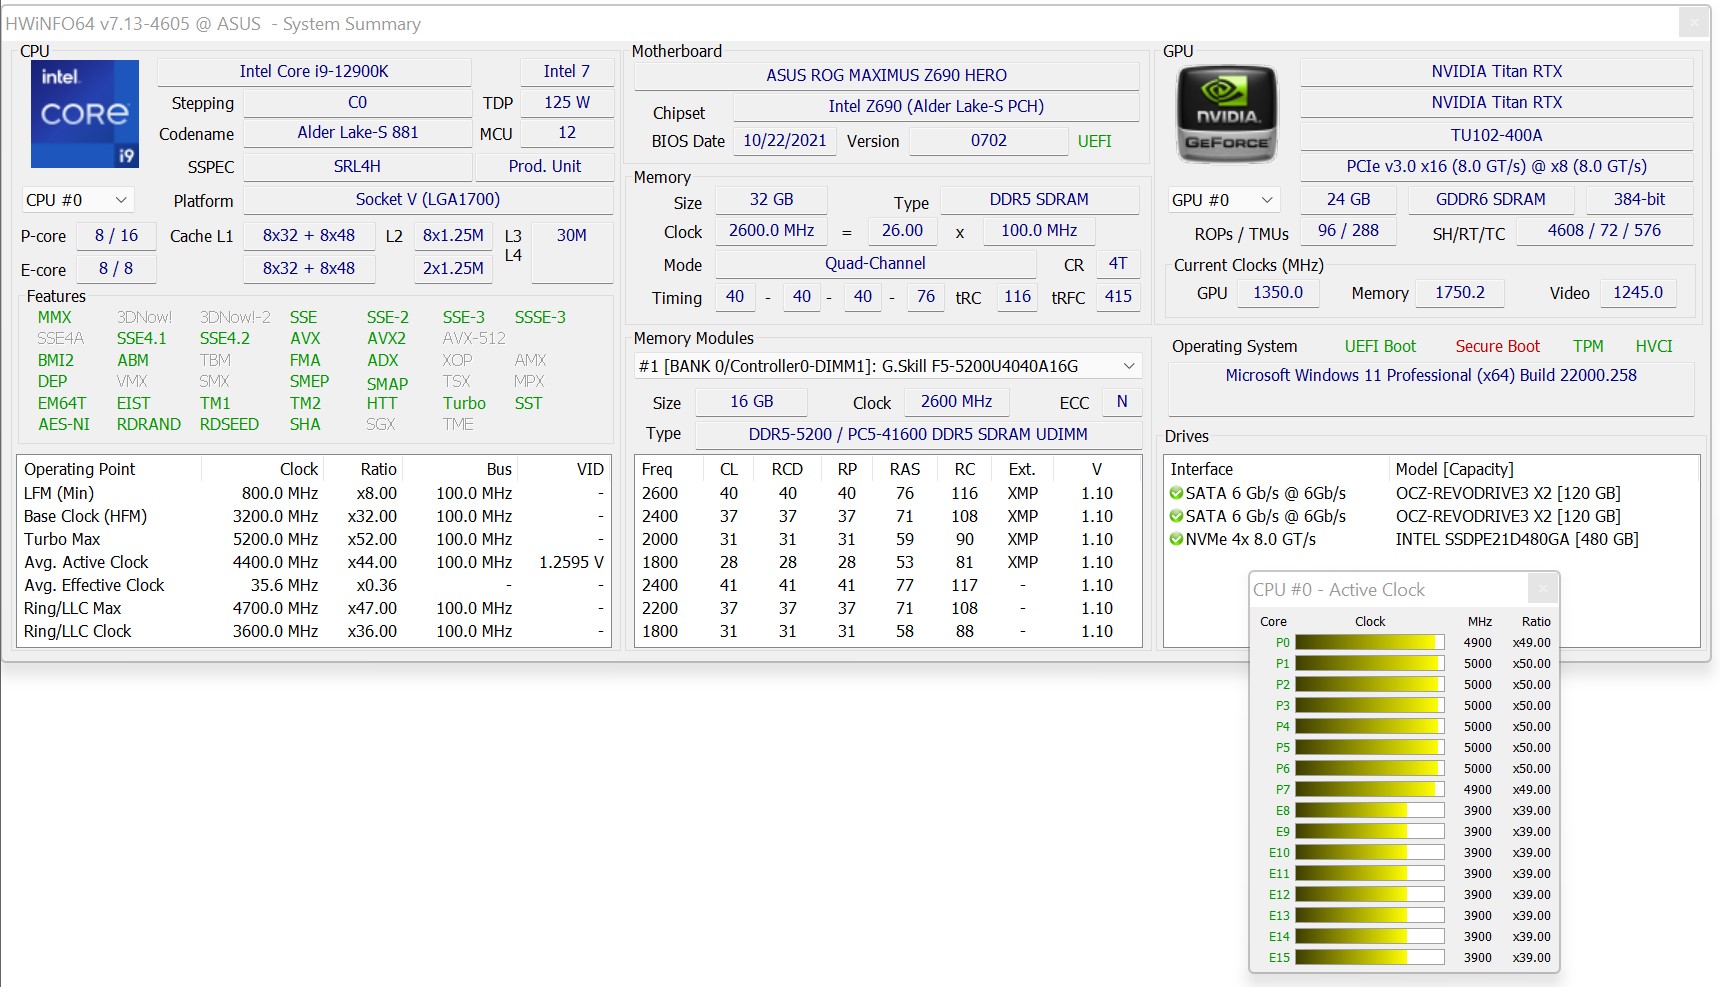
Détails de notre système d'essai
Nous utilisons le système suivant pour nos benchmarks et tests ci-dessous :
- Tableau d'évaluation du Pean de Raijintek
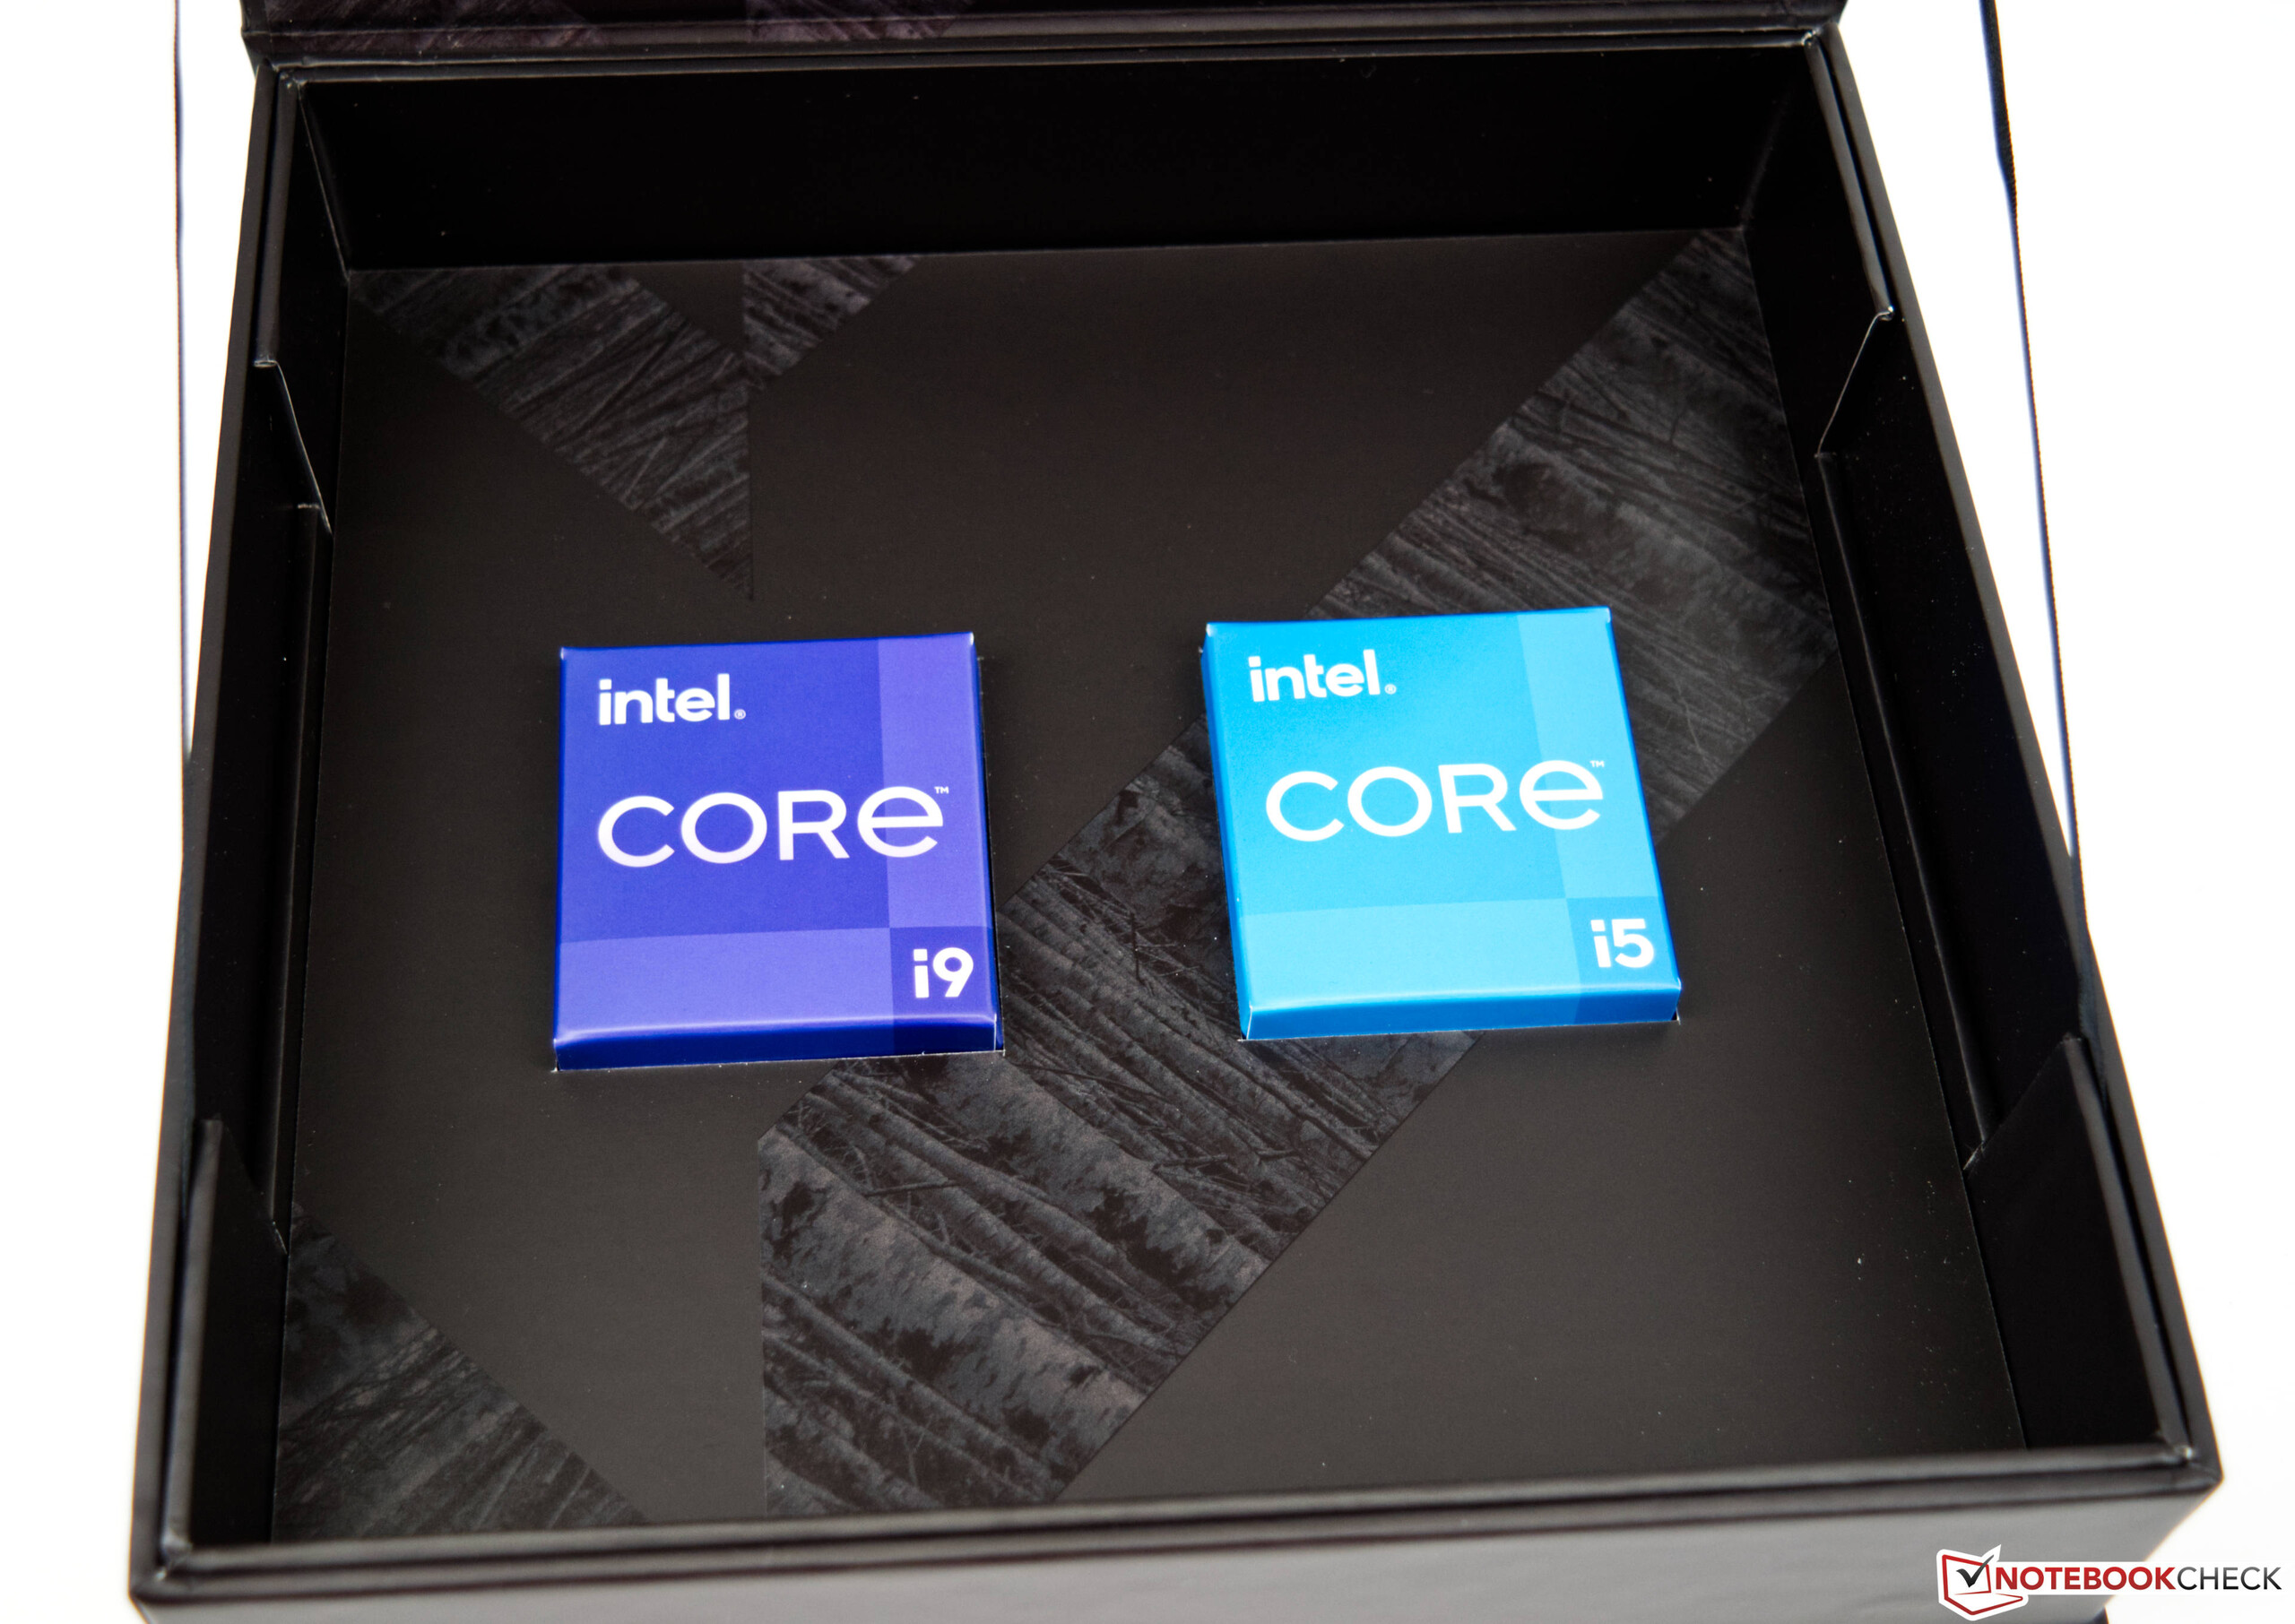
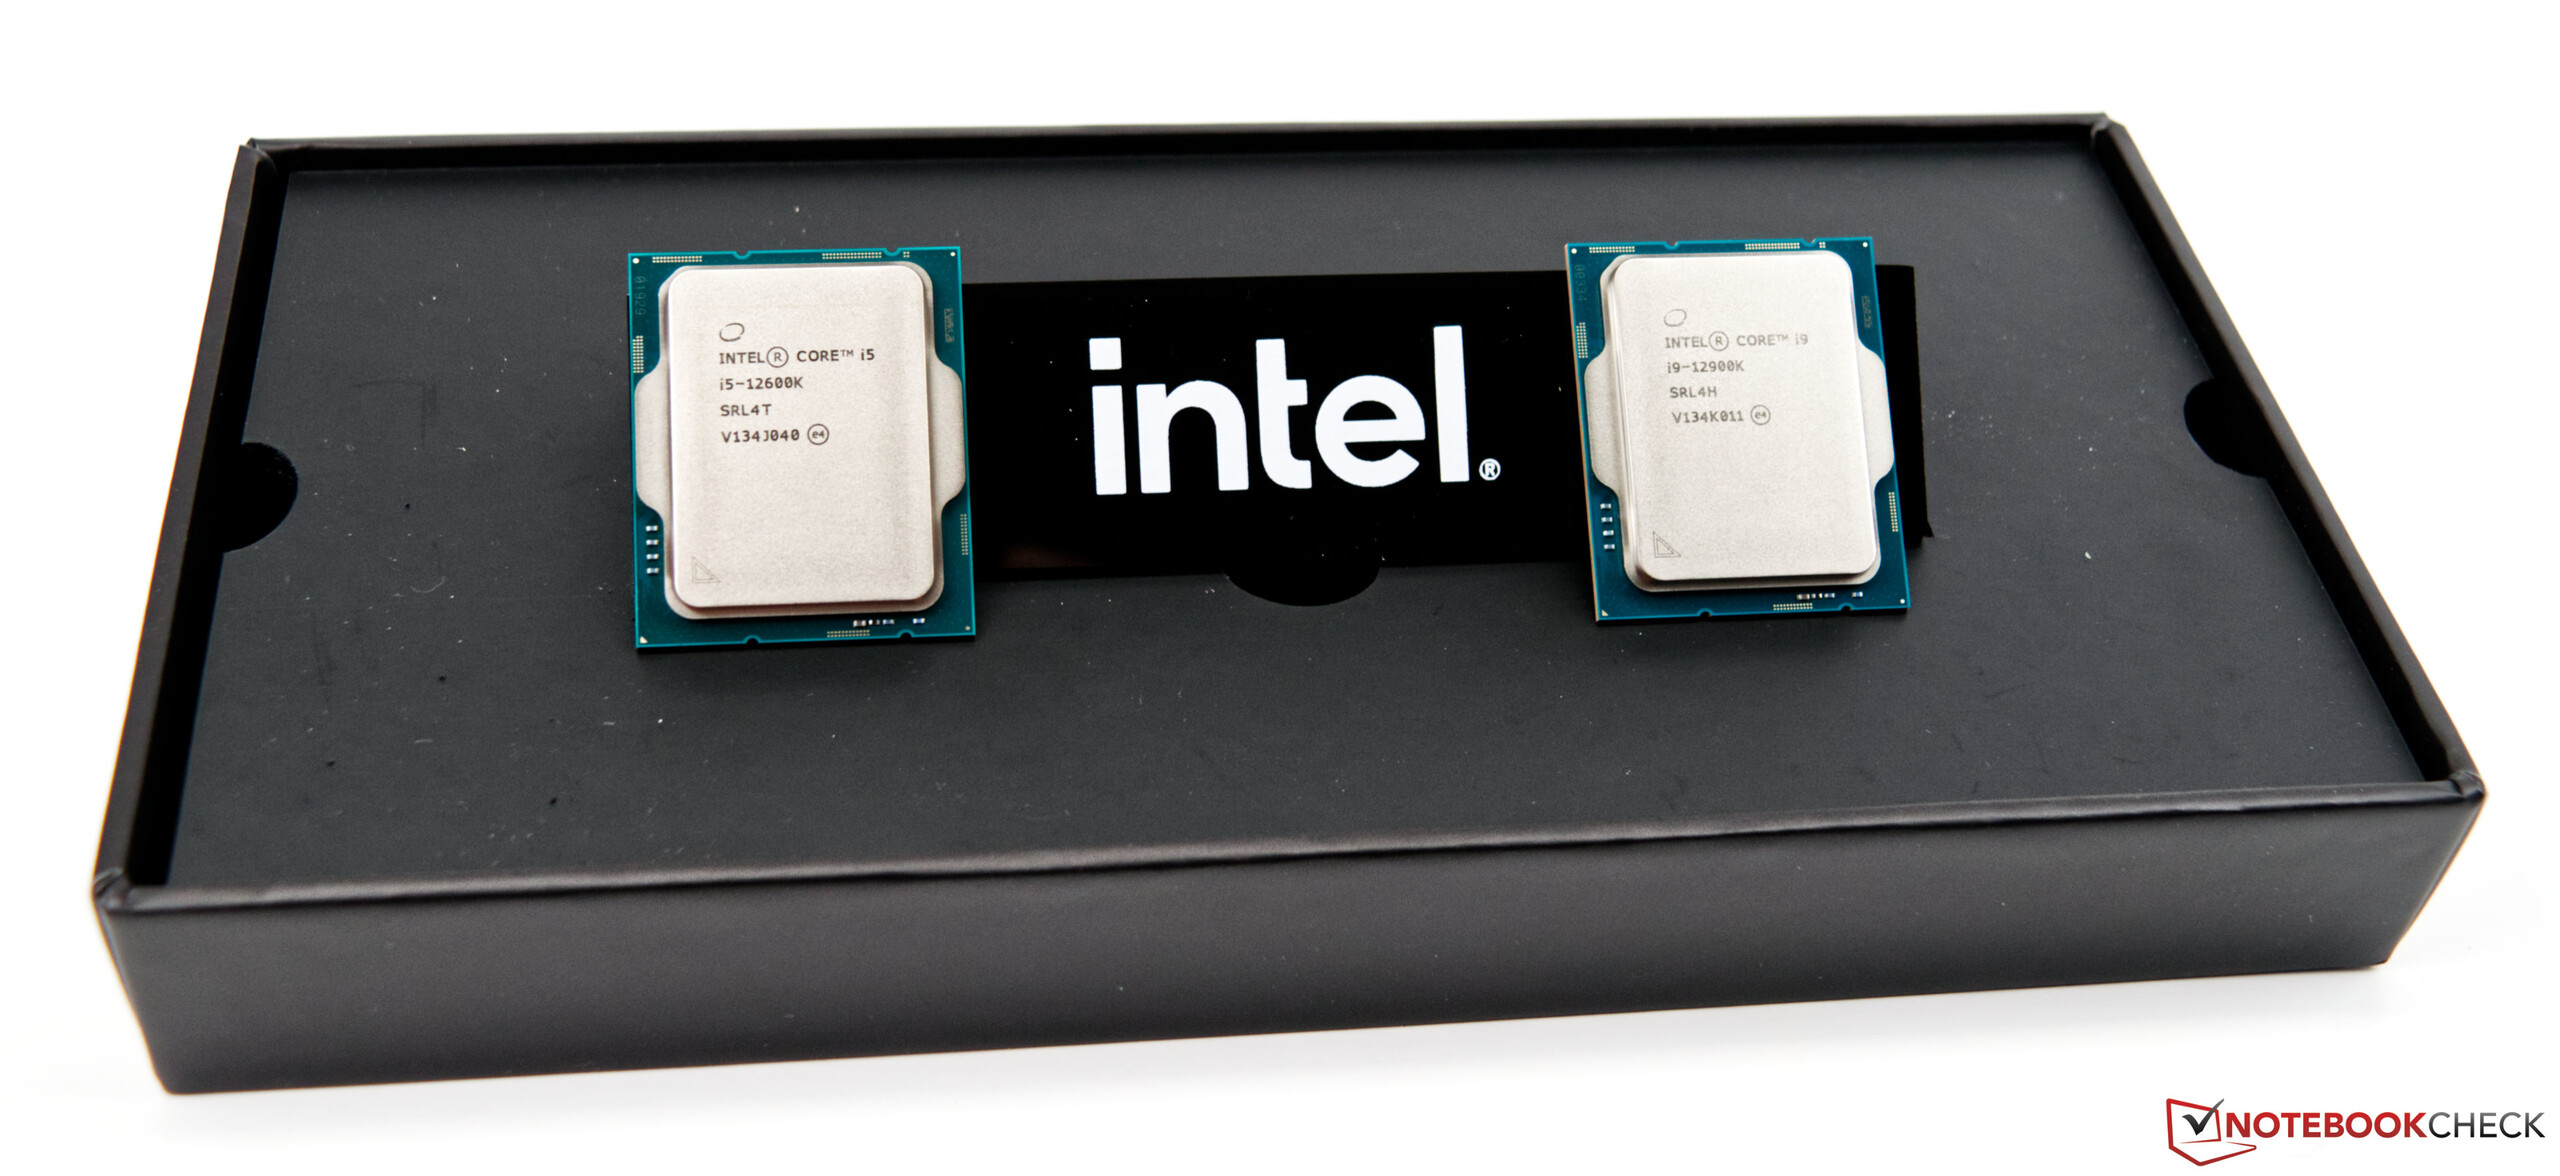
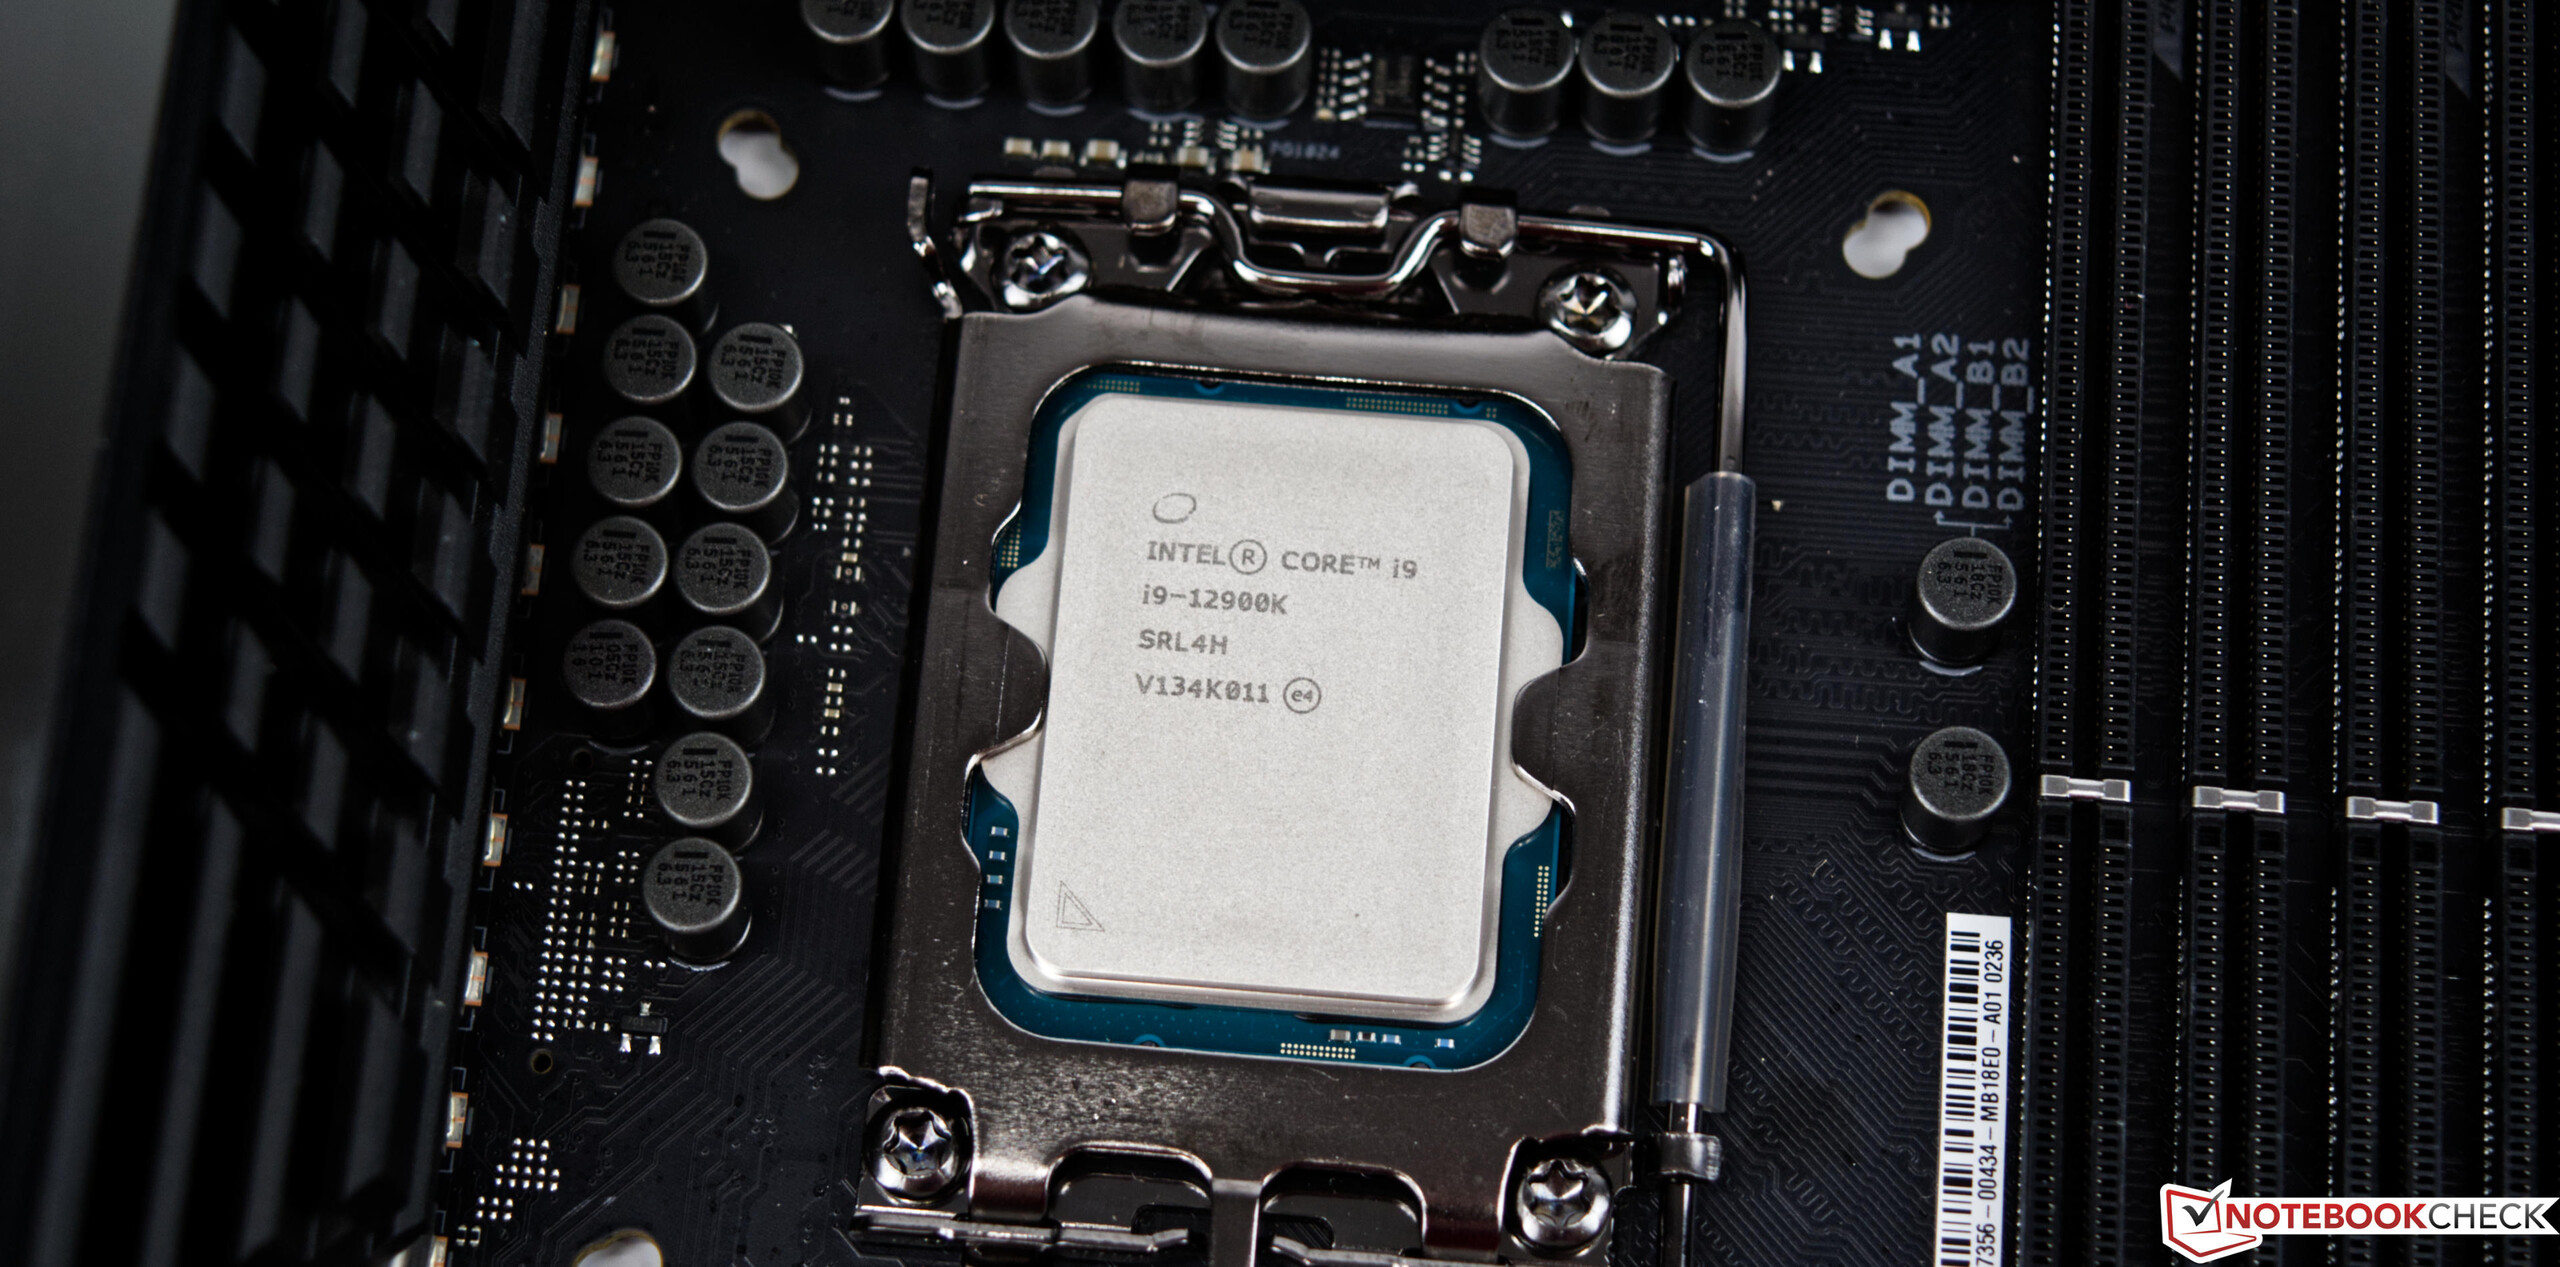
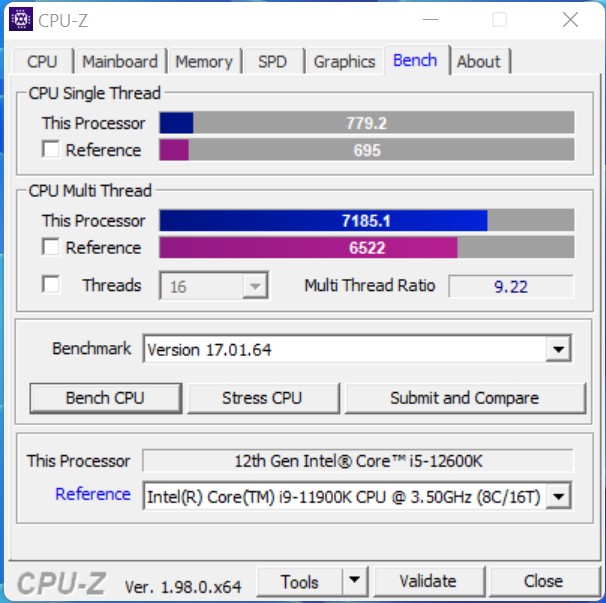
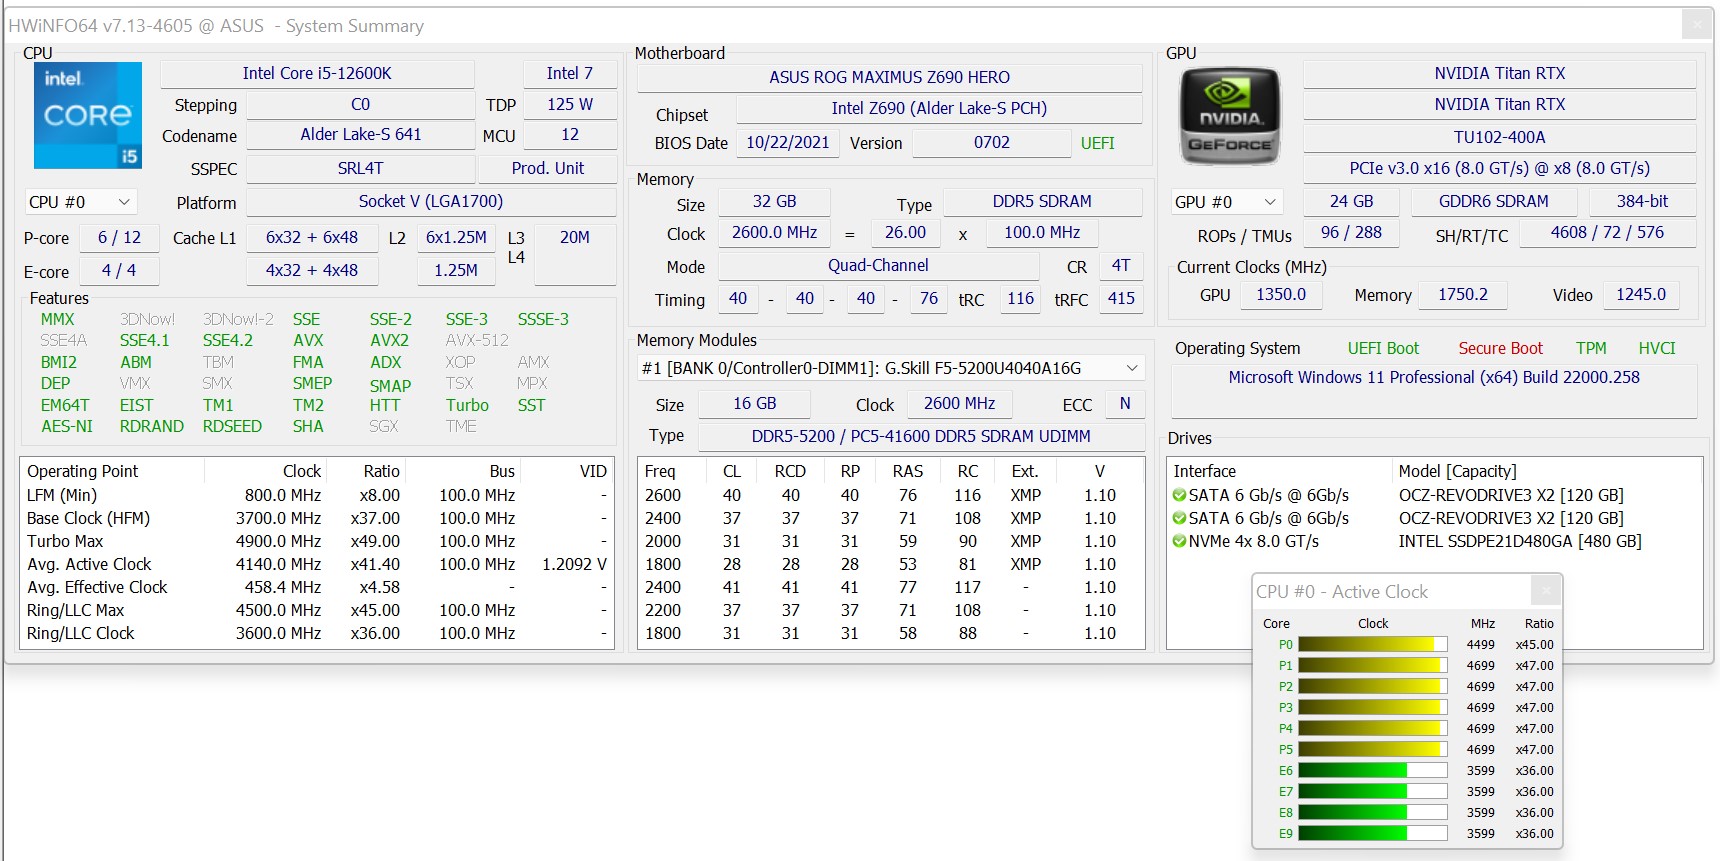
- Intel Core i9-12900K, Intel Core i5-12600K
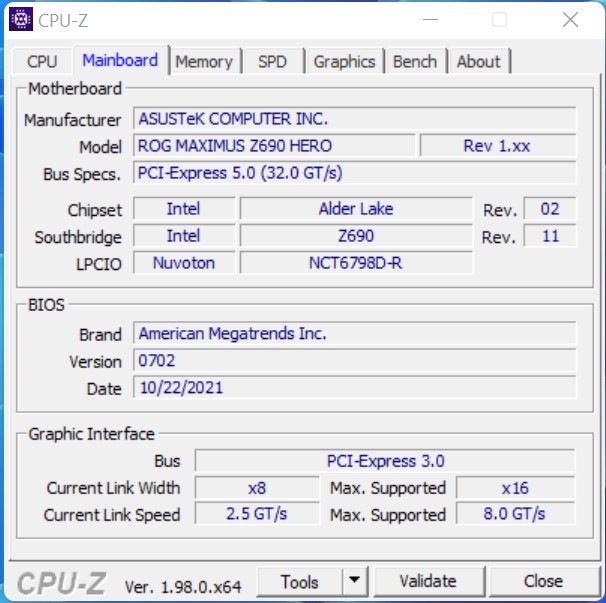
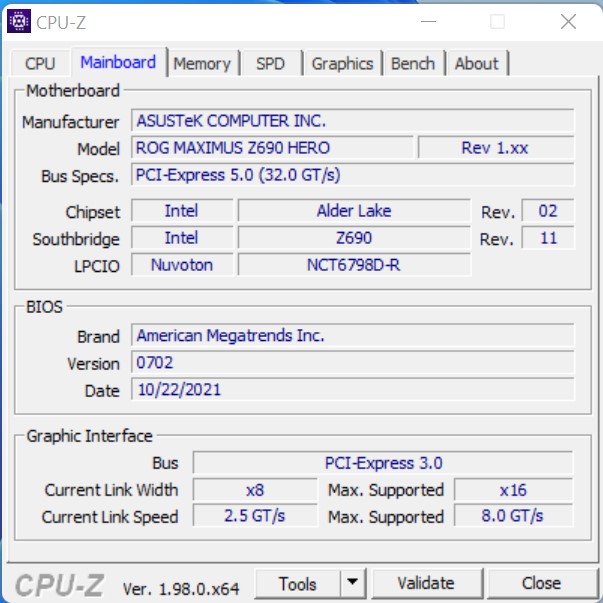
- Asus ROG Maximus Z690 Hero
- Alphacool Eisbear Aurora 280 AiO
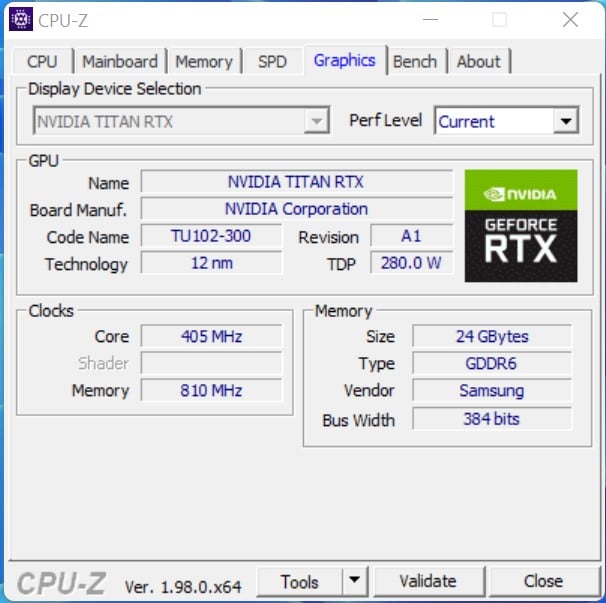
- Nvidia Titan RTX
- Alimentation Corsair HX 1200X
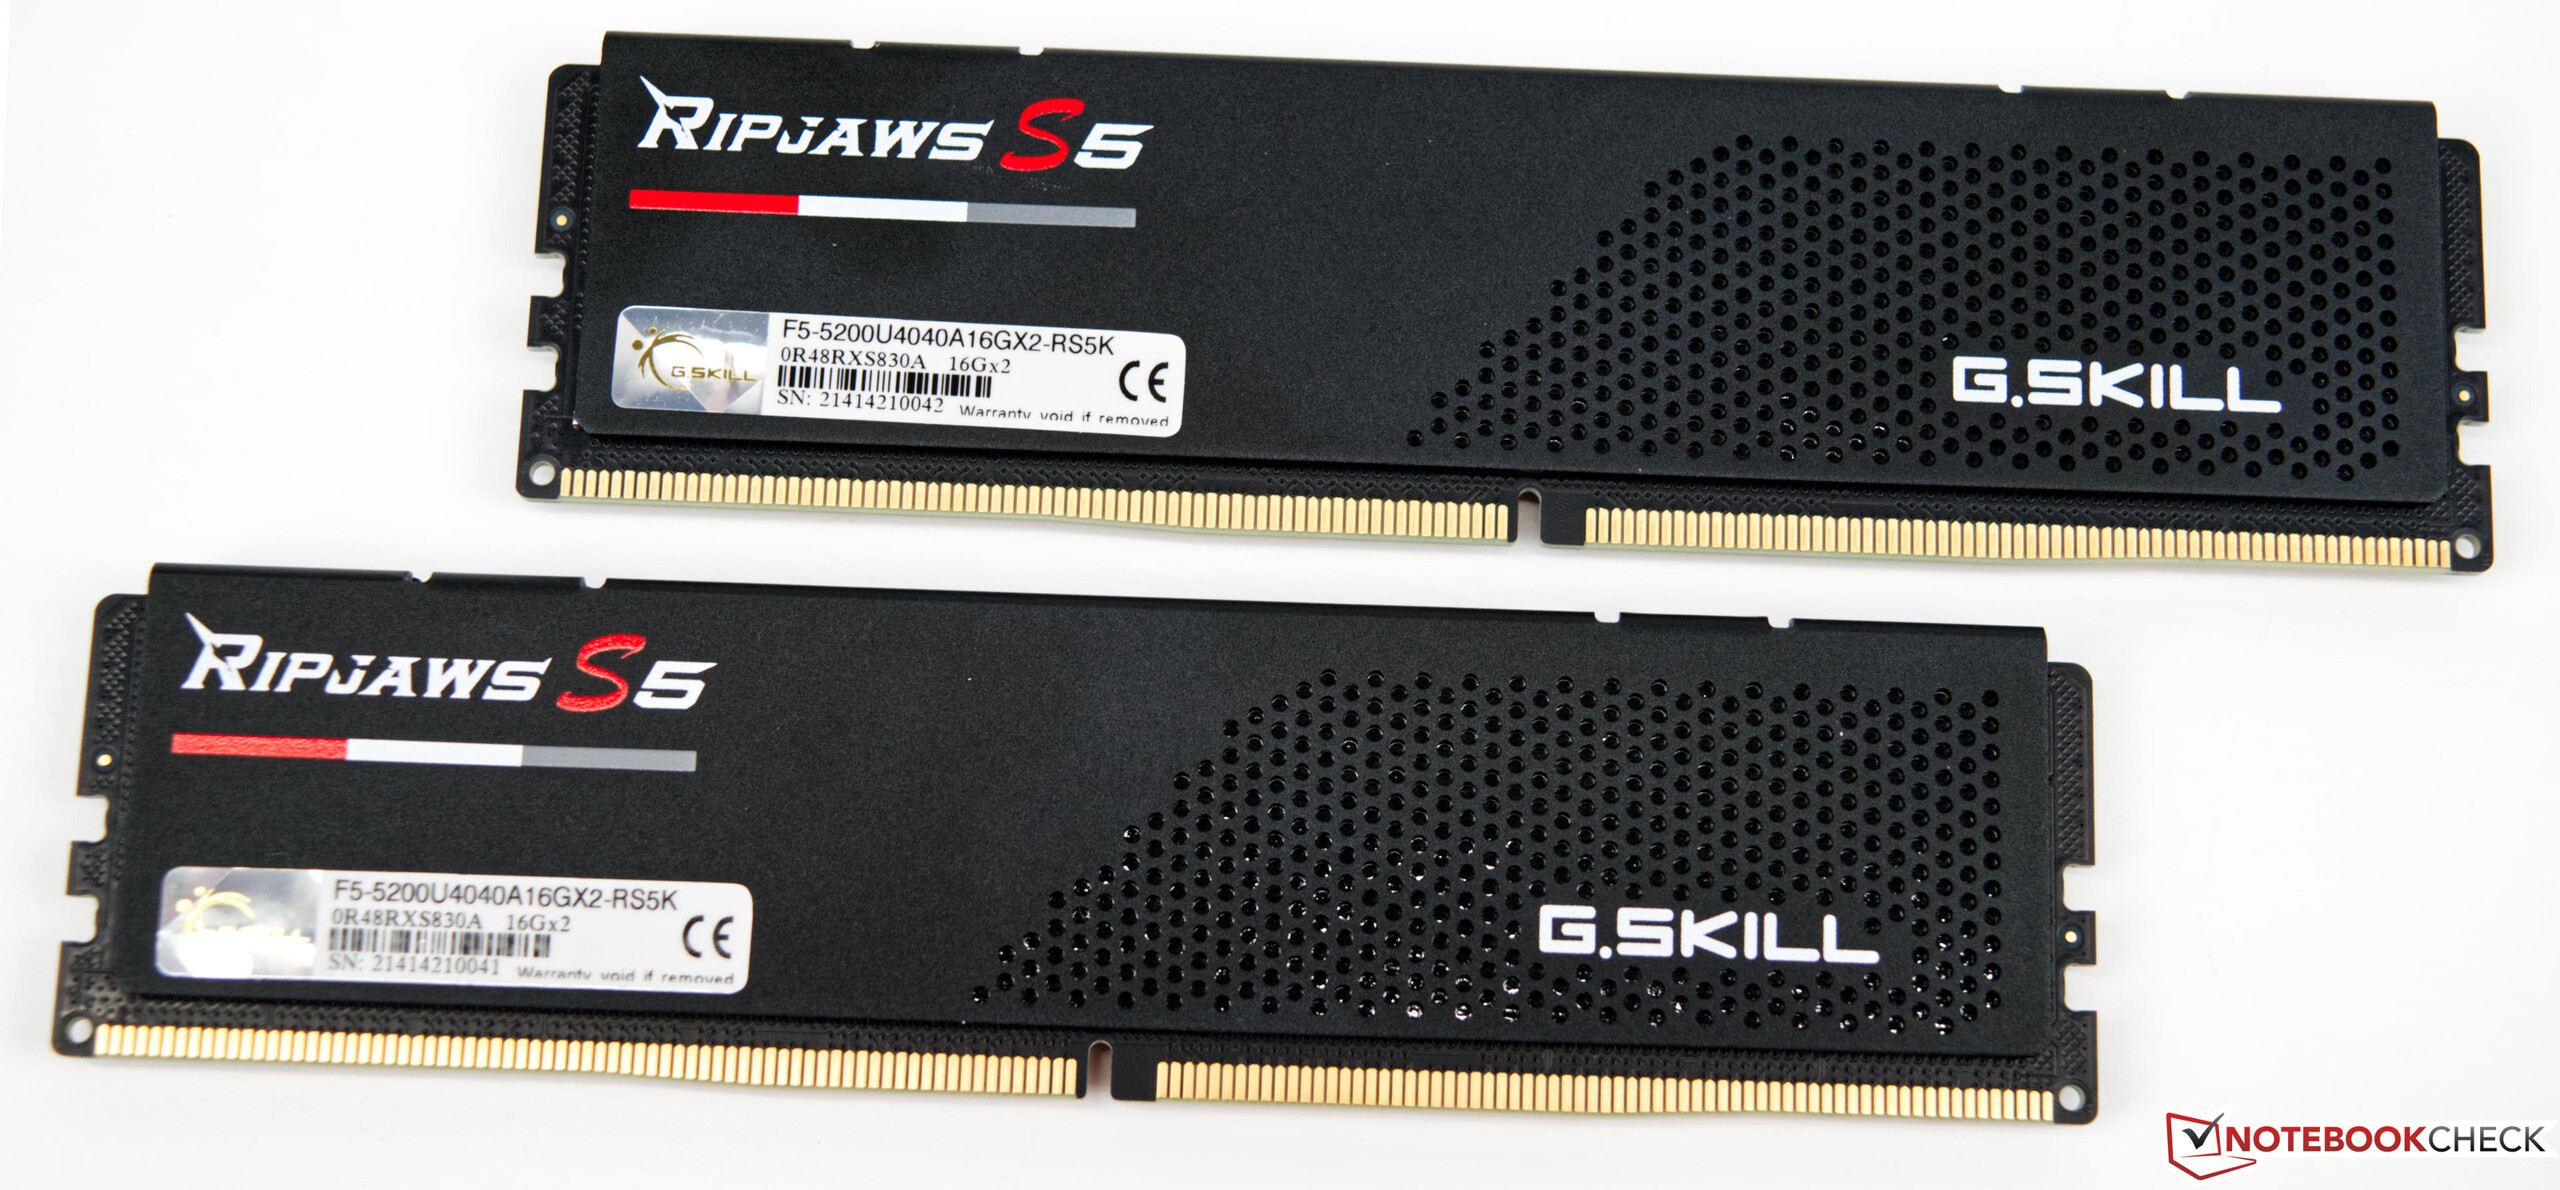
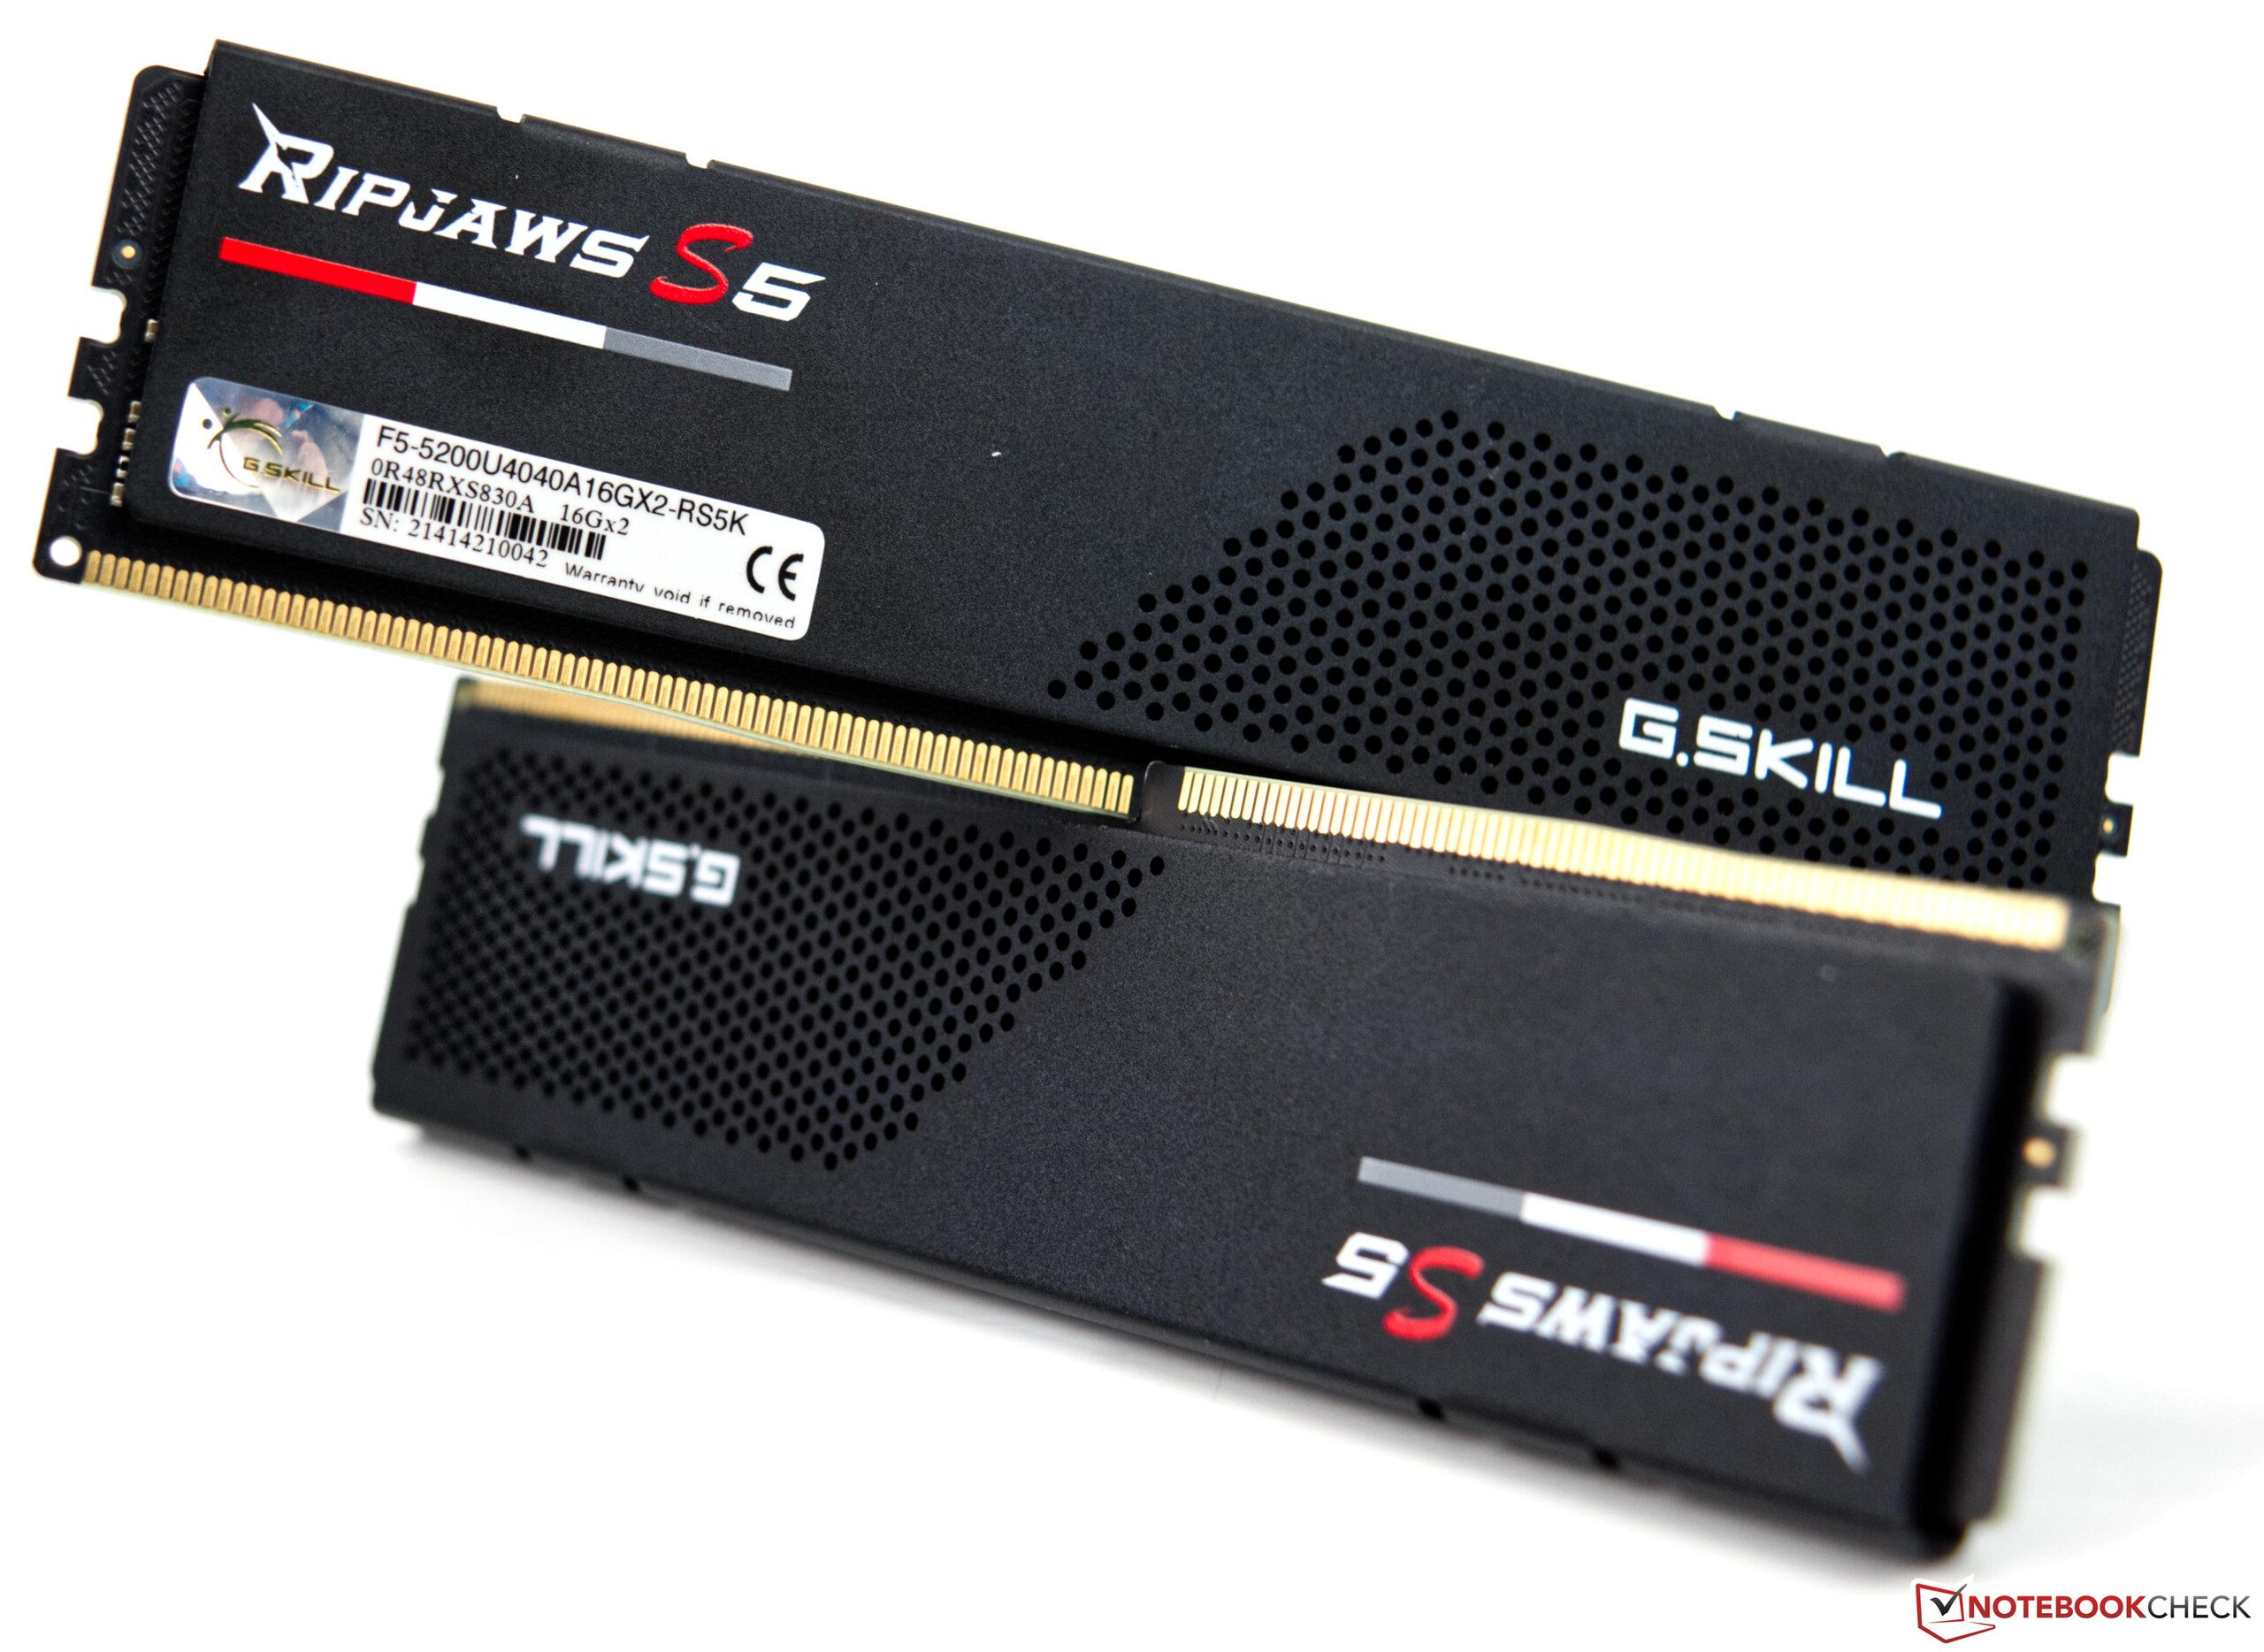
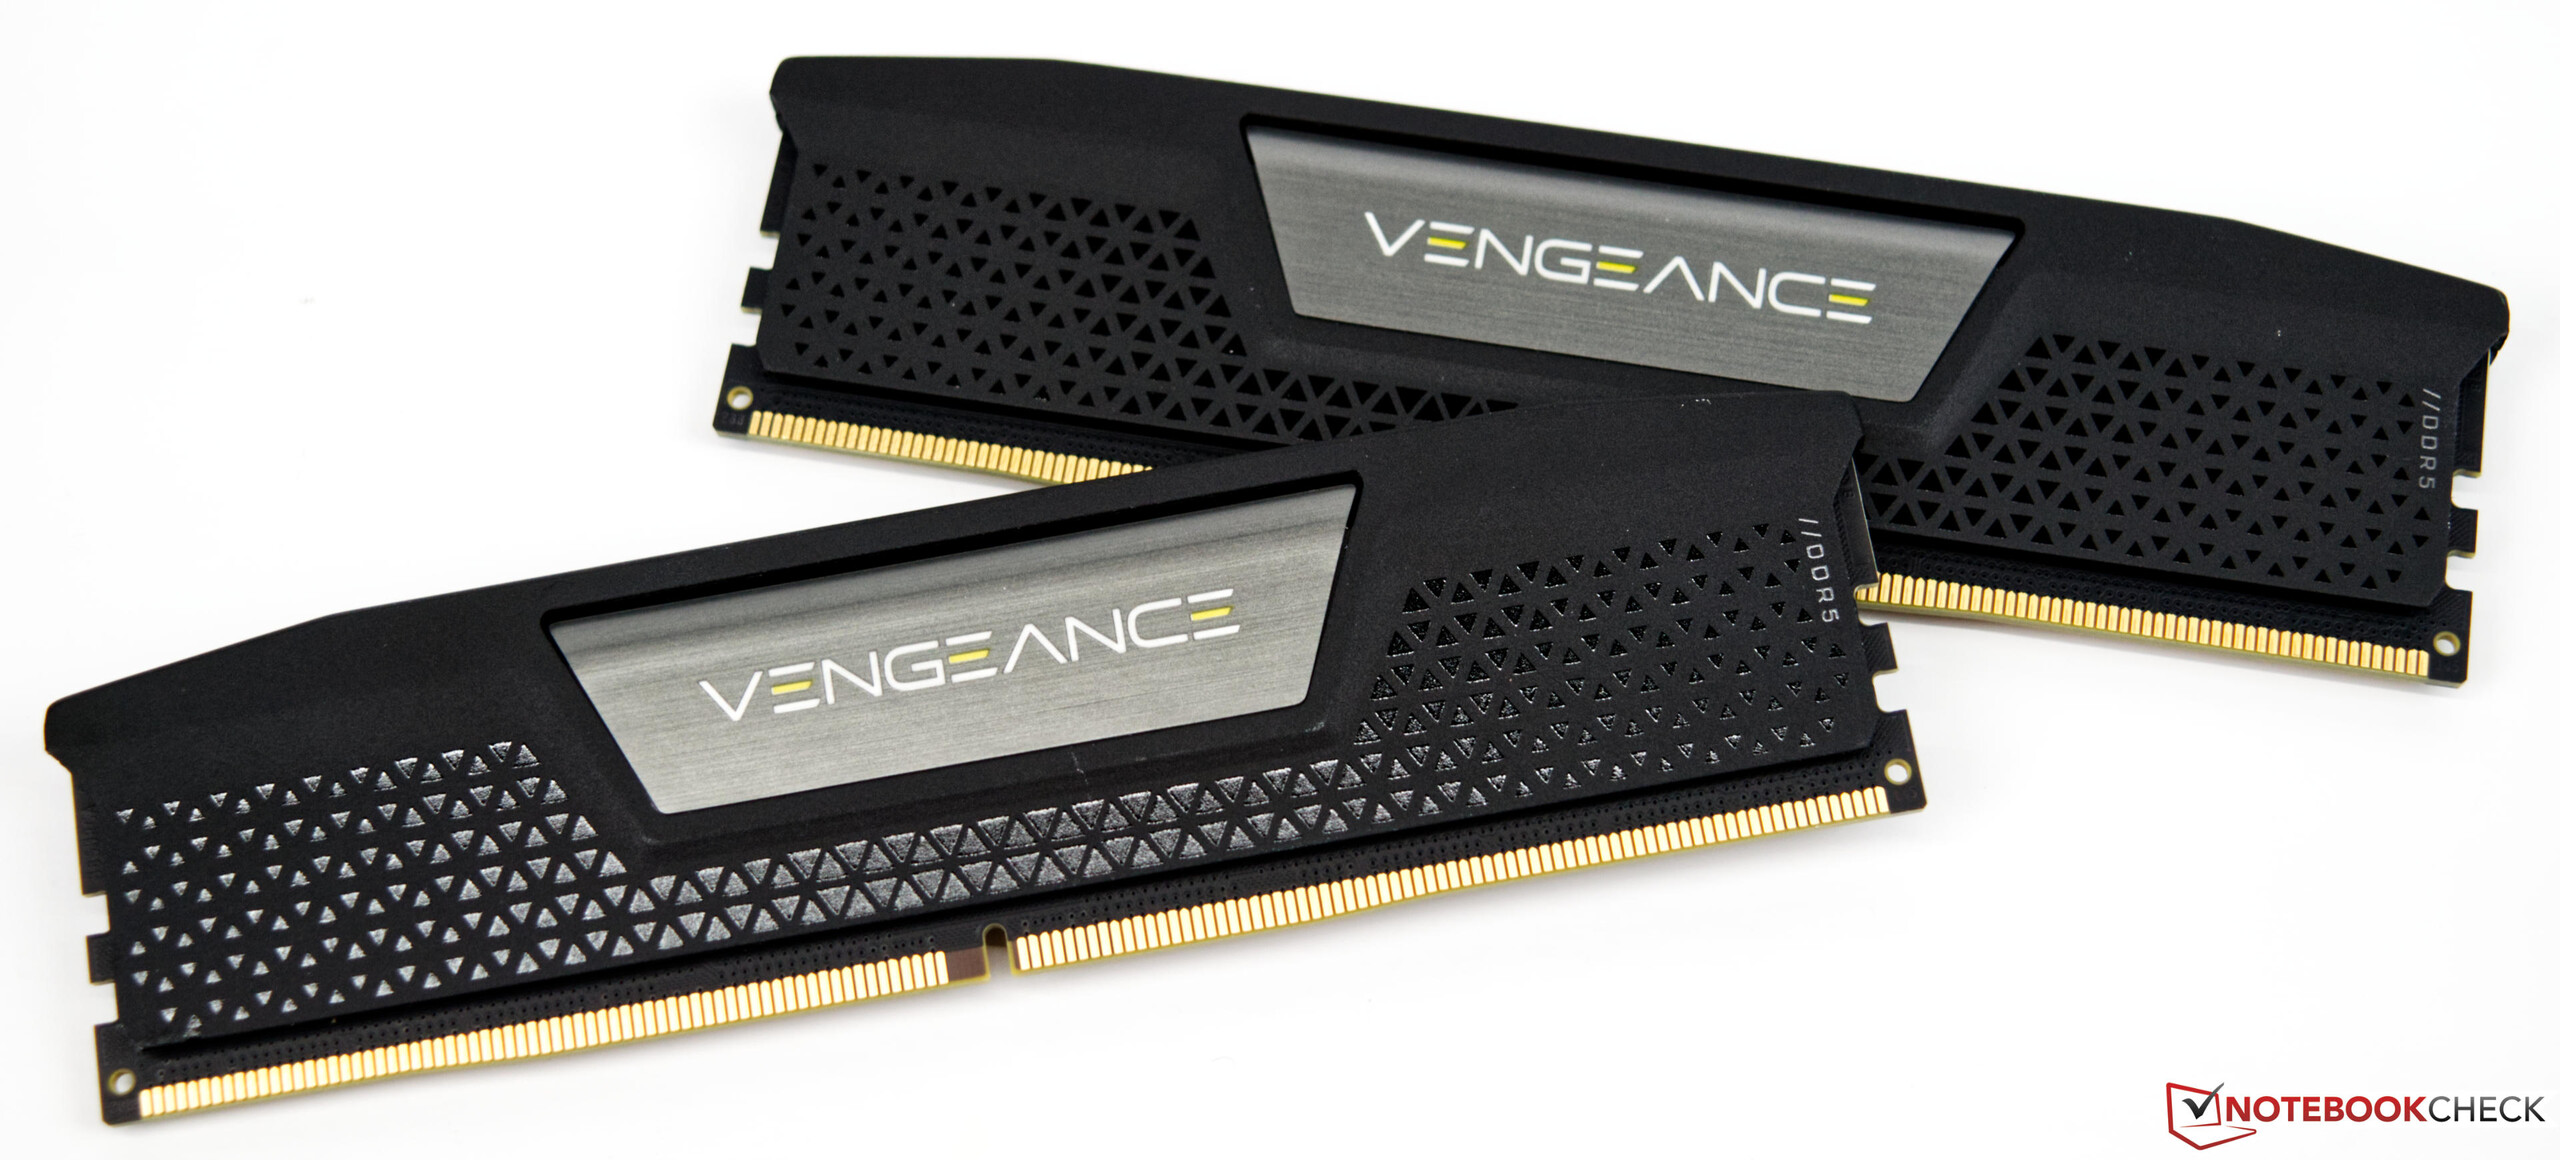
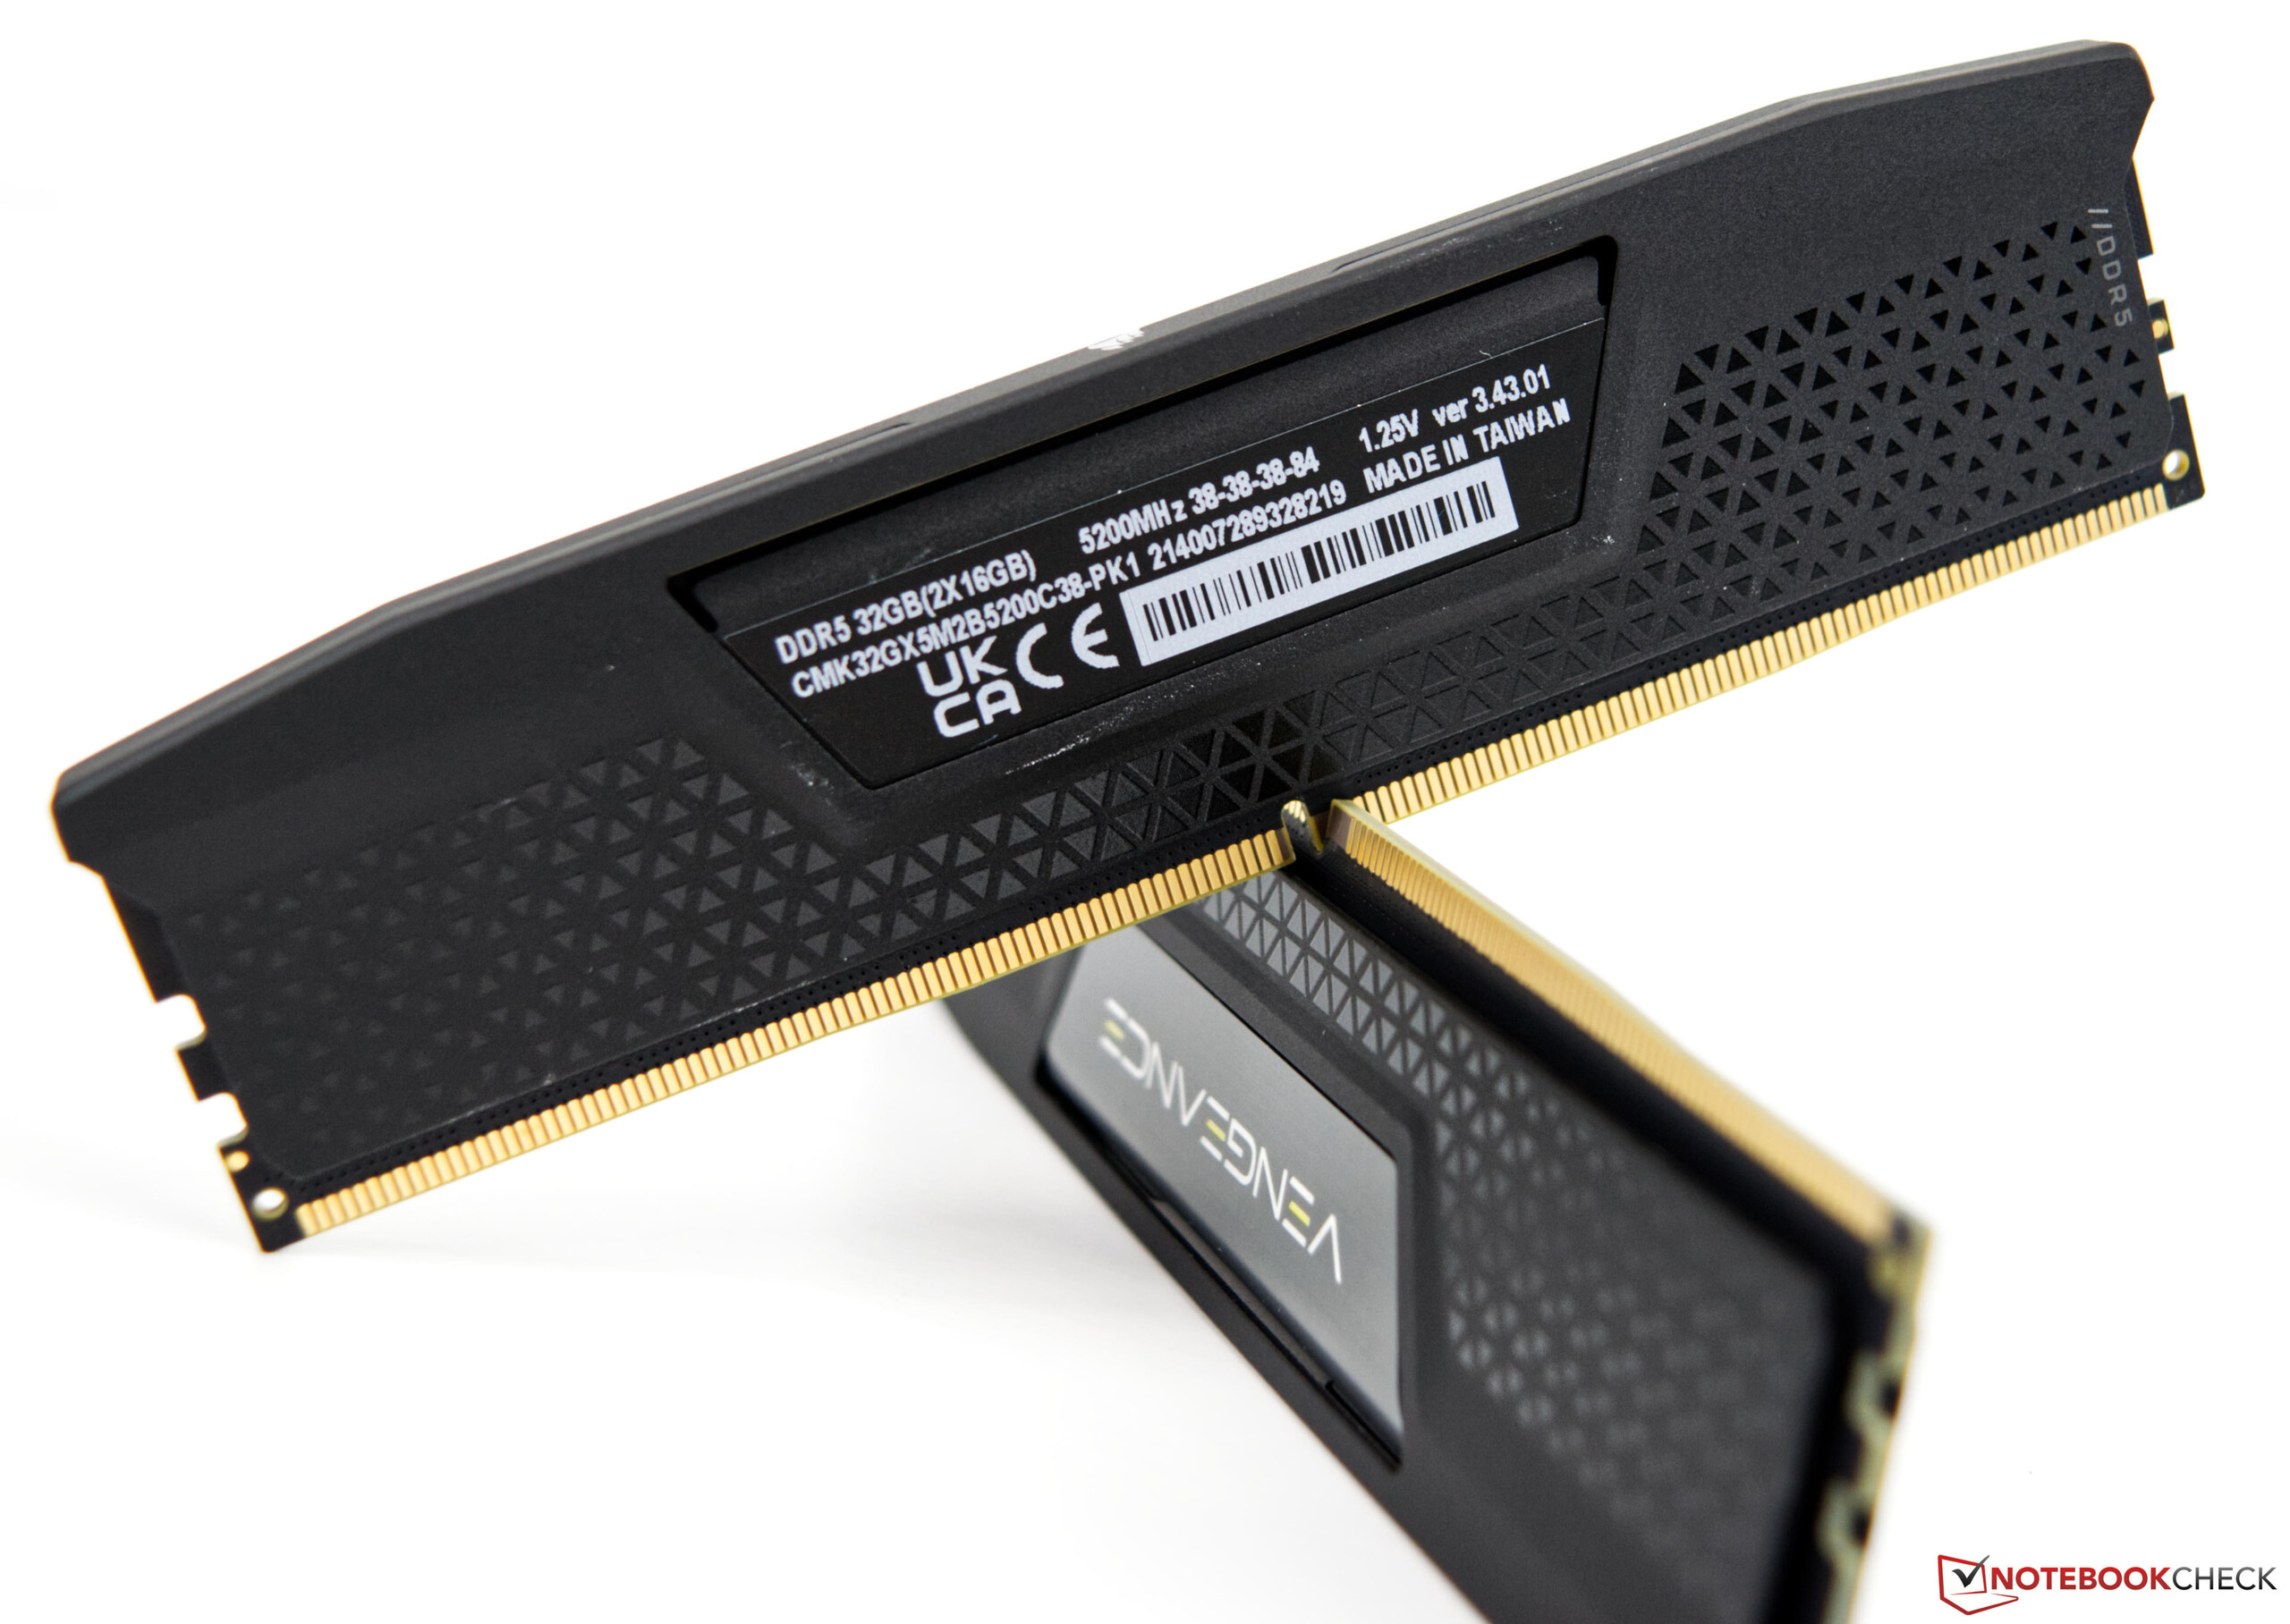
- G.Skill Ripjaws S5 (2x 16GB - DDR5-5200) / Corsair Vengeance (2x 16GB - DDR5-5200)
- Intel Optane 905p (480 GB système + benchmarks)
- OCZ Revodrive (480 Go pour les jeux)
- Microsoft Windows 11 Professional 64-Bit (version 21H2)
Les deux processeurs proviennent directement d'Intel. G.Skill et Corsair ont fourni la toute nouvelle mémoire de travail DDR5 pour nous, et la nouvelle carte mère Z690vient directement d'Asus. Caseking nous soutient avec le Raijintek Pean Showcase, et comme refroidissement nous utilisons le Alphacool Eisbear Aurora 280 AiOqui a été mis à notre disposition par Alphacool.
Note importante
Tous les benchmarks ont été effectués sur un système Windows 11 fraîchement installé. La version la plus récente du Bios nous a été fournie par Asus. Ce qu'il est important de savoir, c'est qu'avec les réglages standards, PL1 et PL2 sont égaux, ce qui signifie que le CPU peut toujours atteindre la performance maximale sans aucune limitation. Nous avons utilisé les paramètres standards pour cette revue.

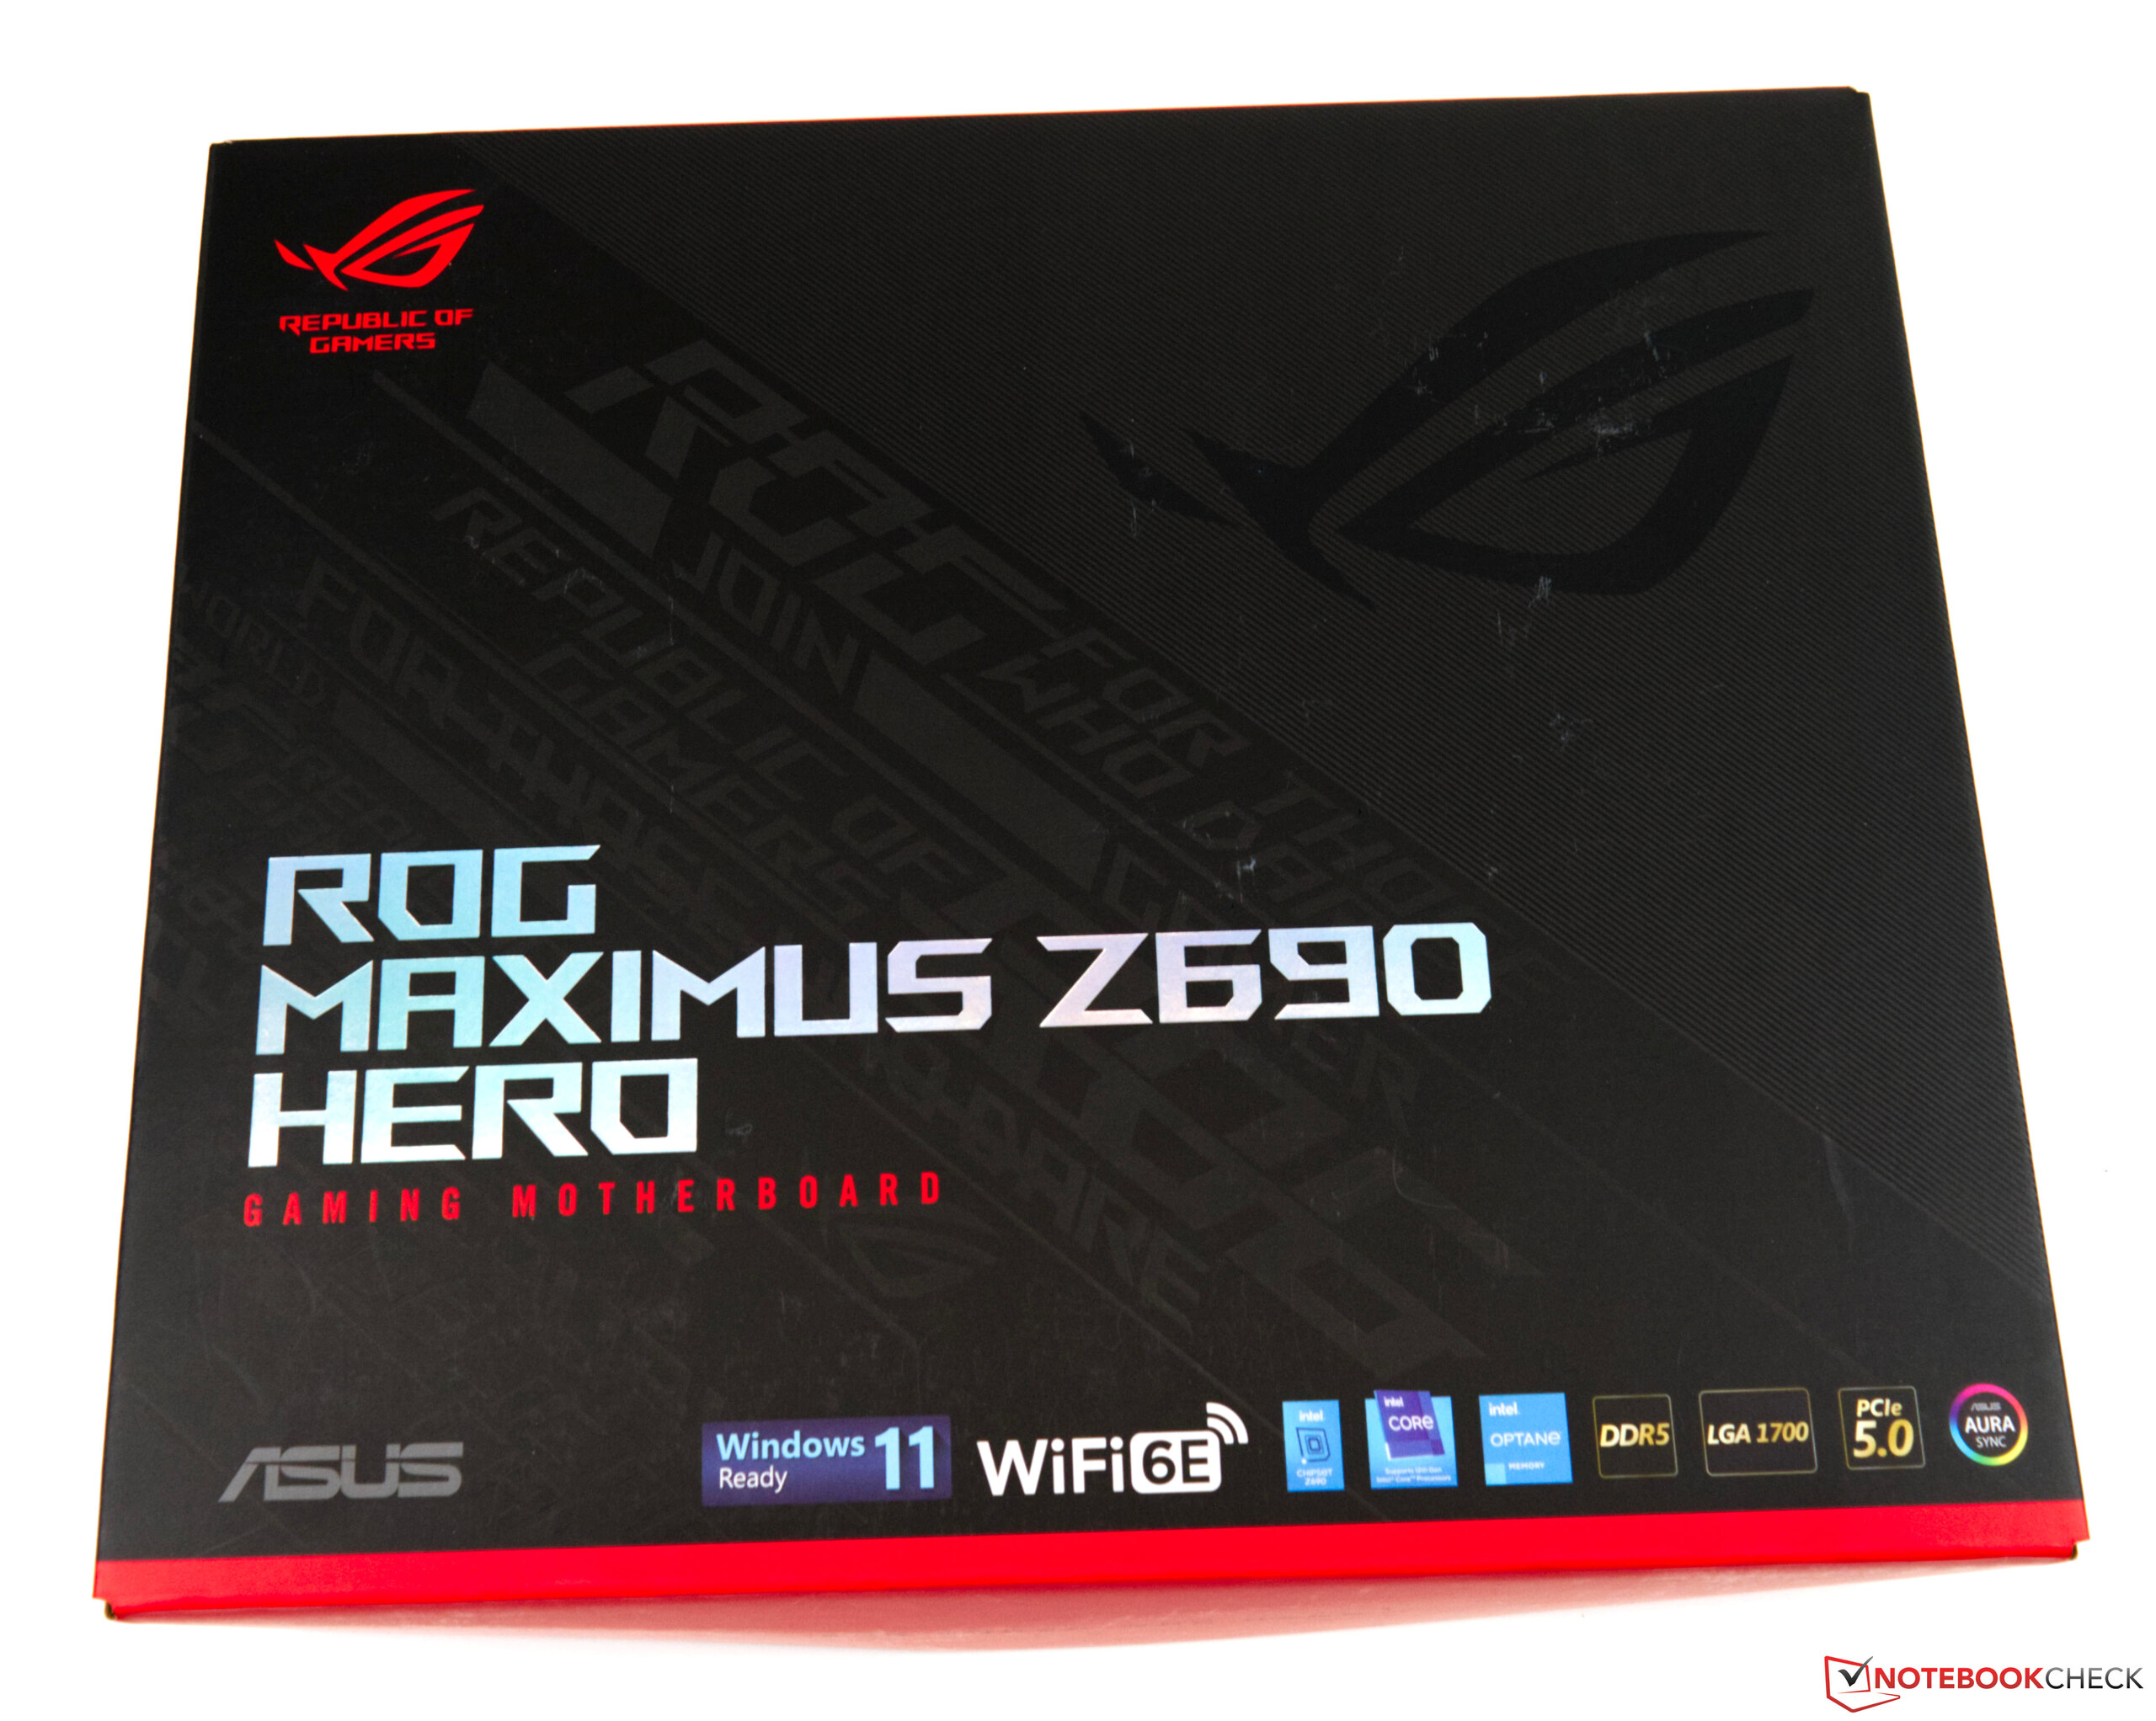
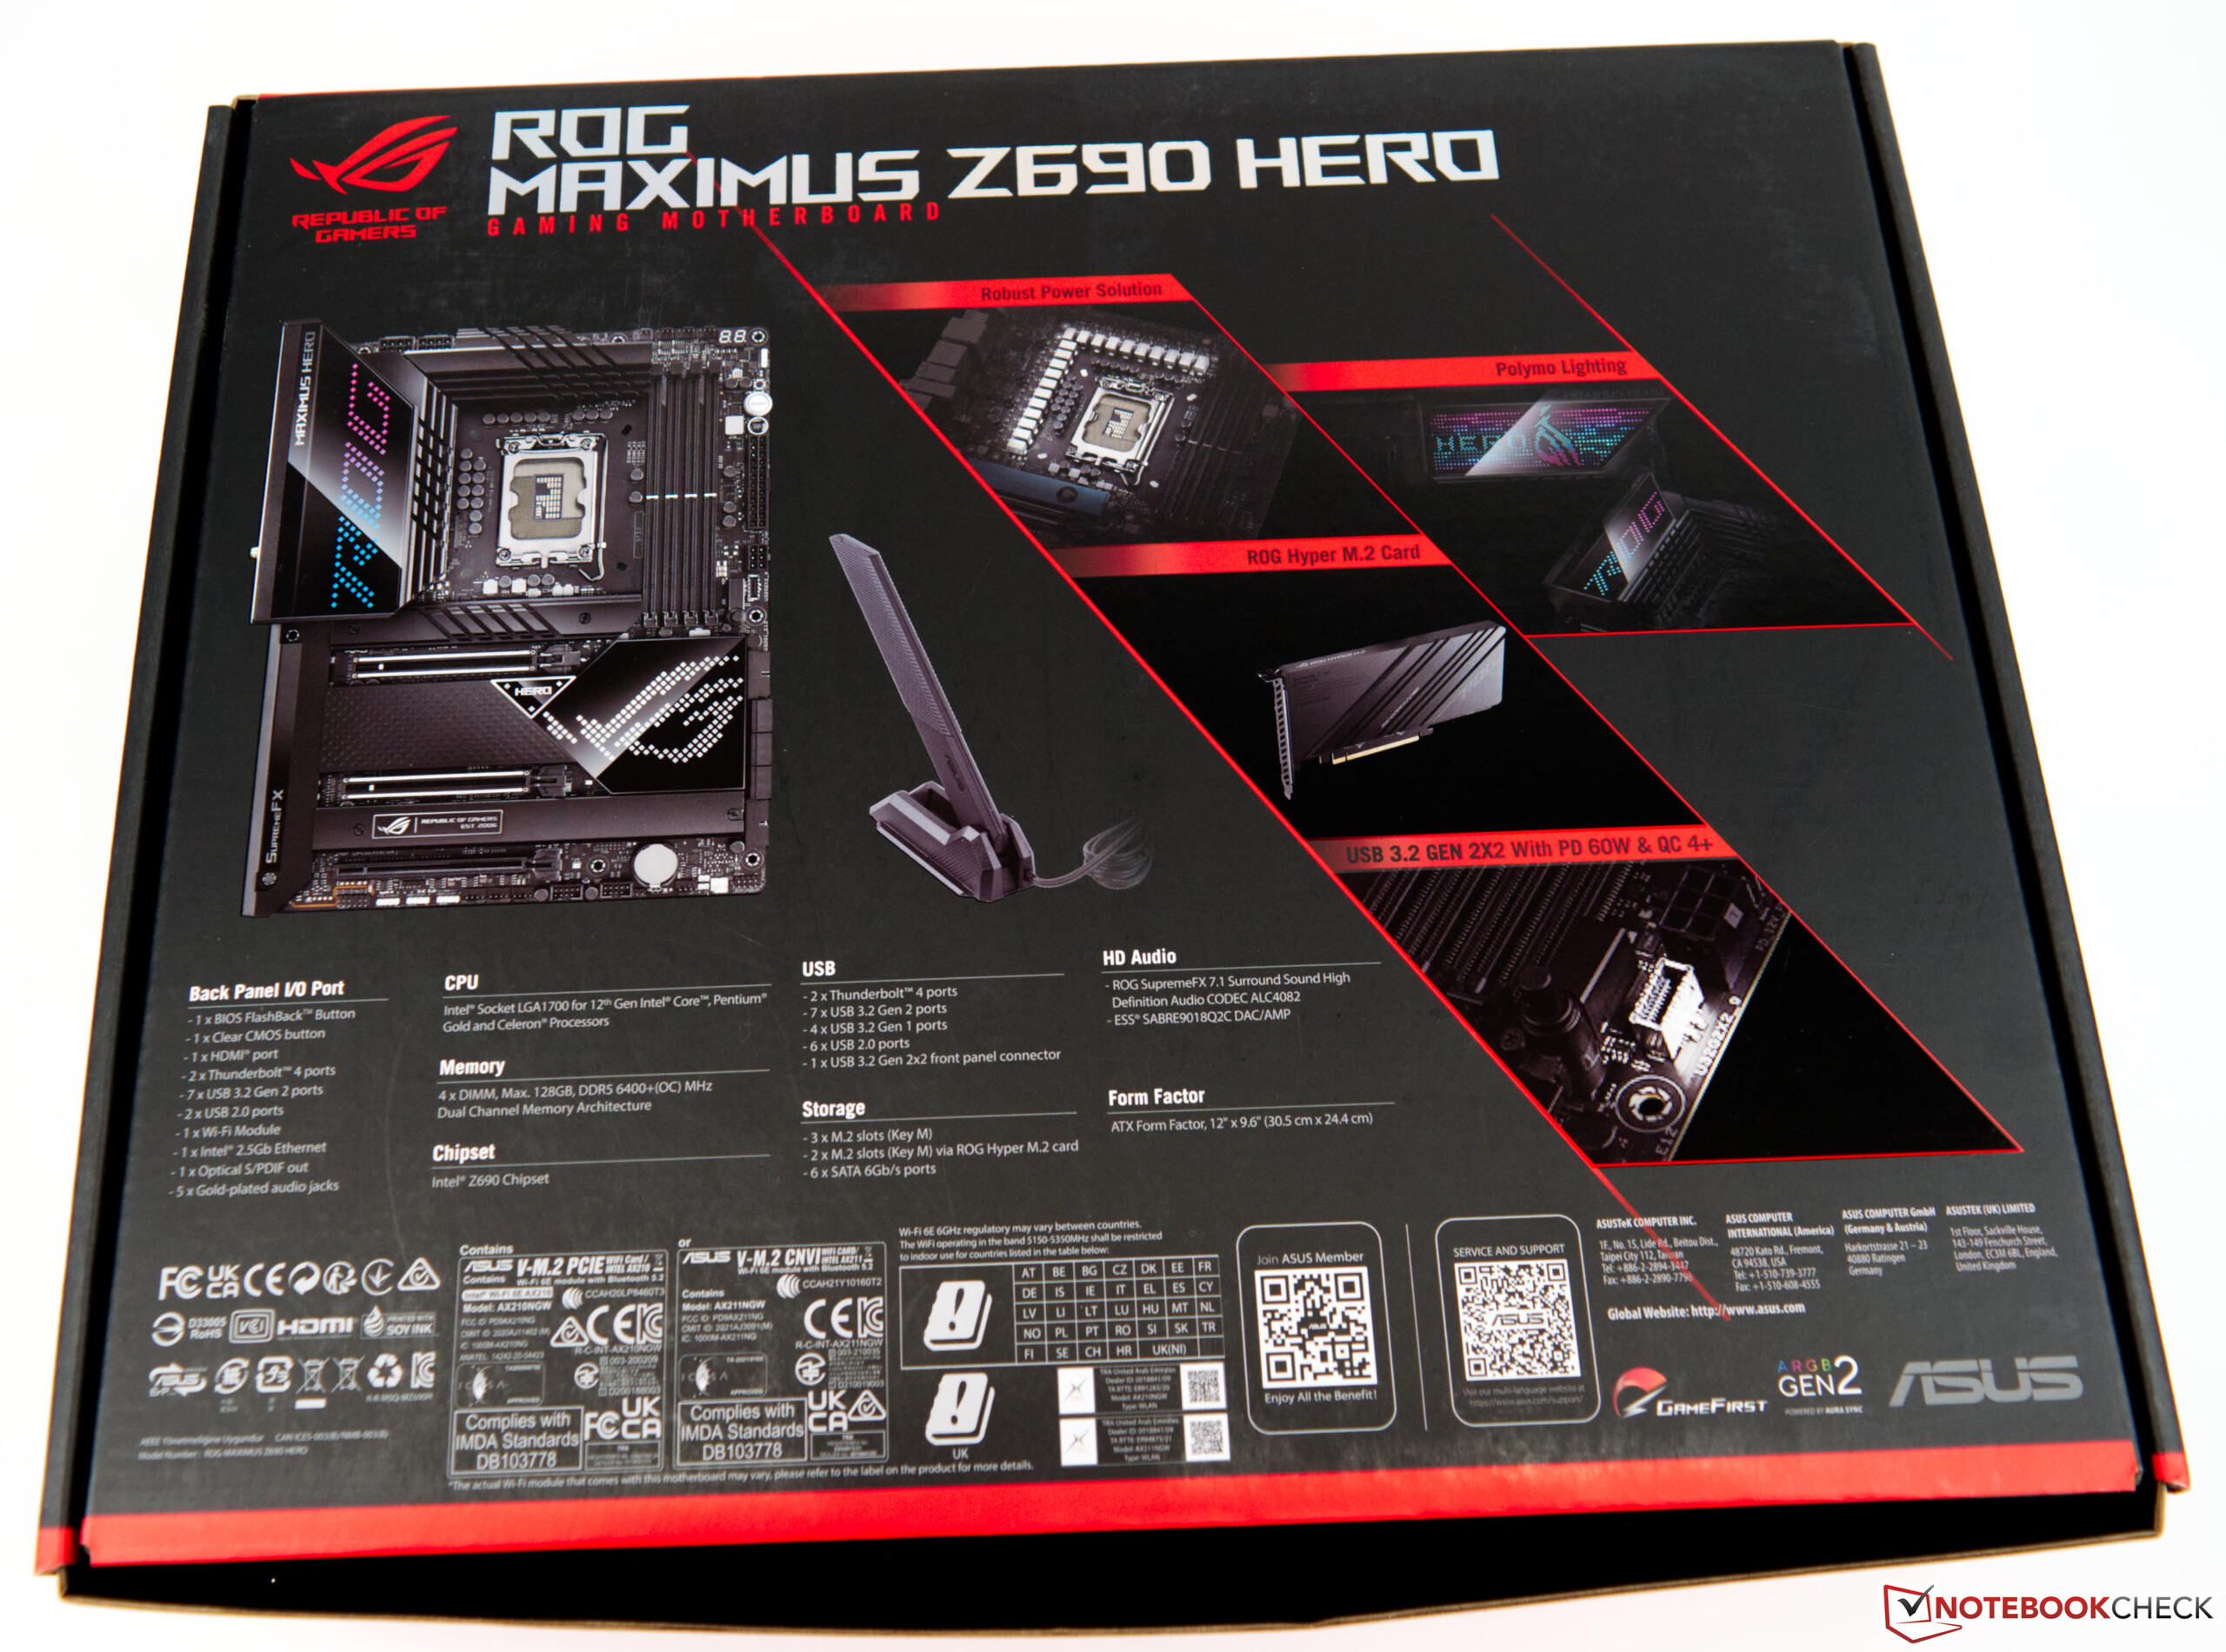
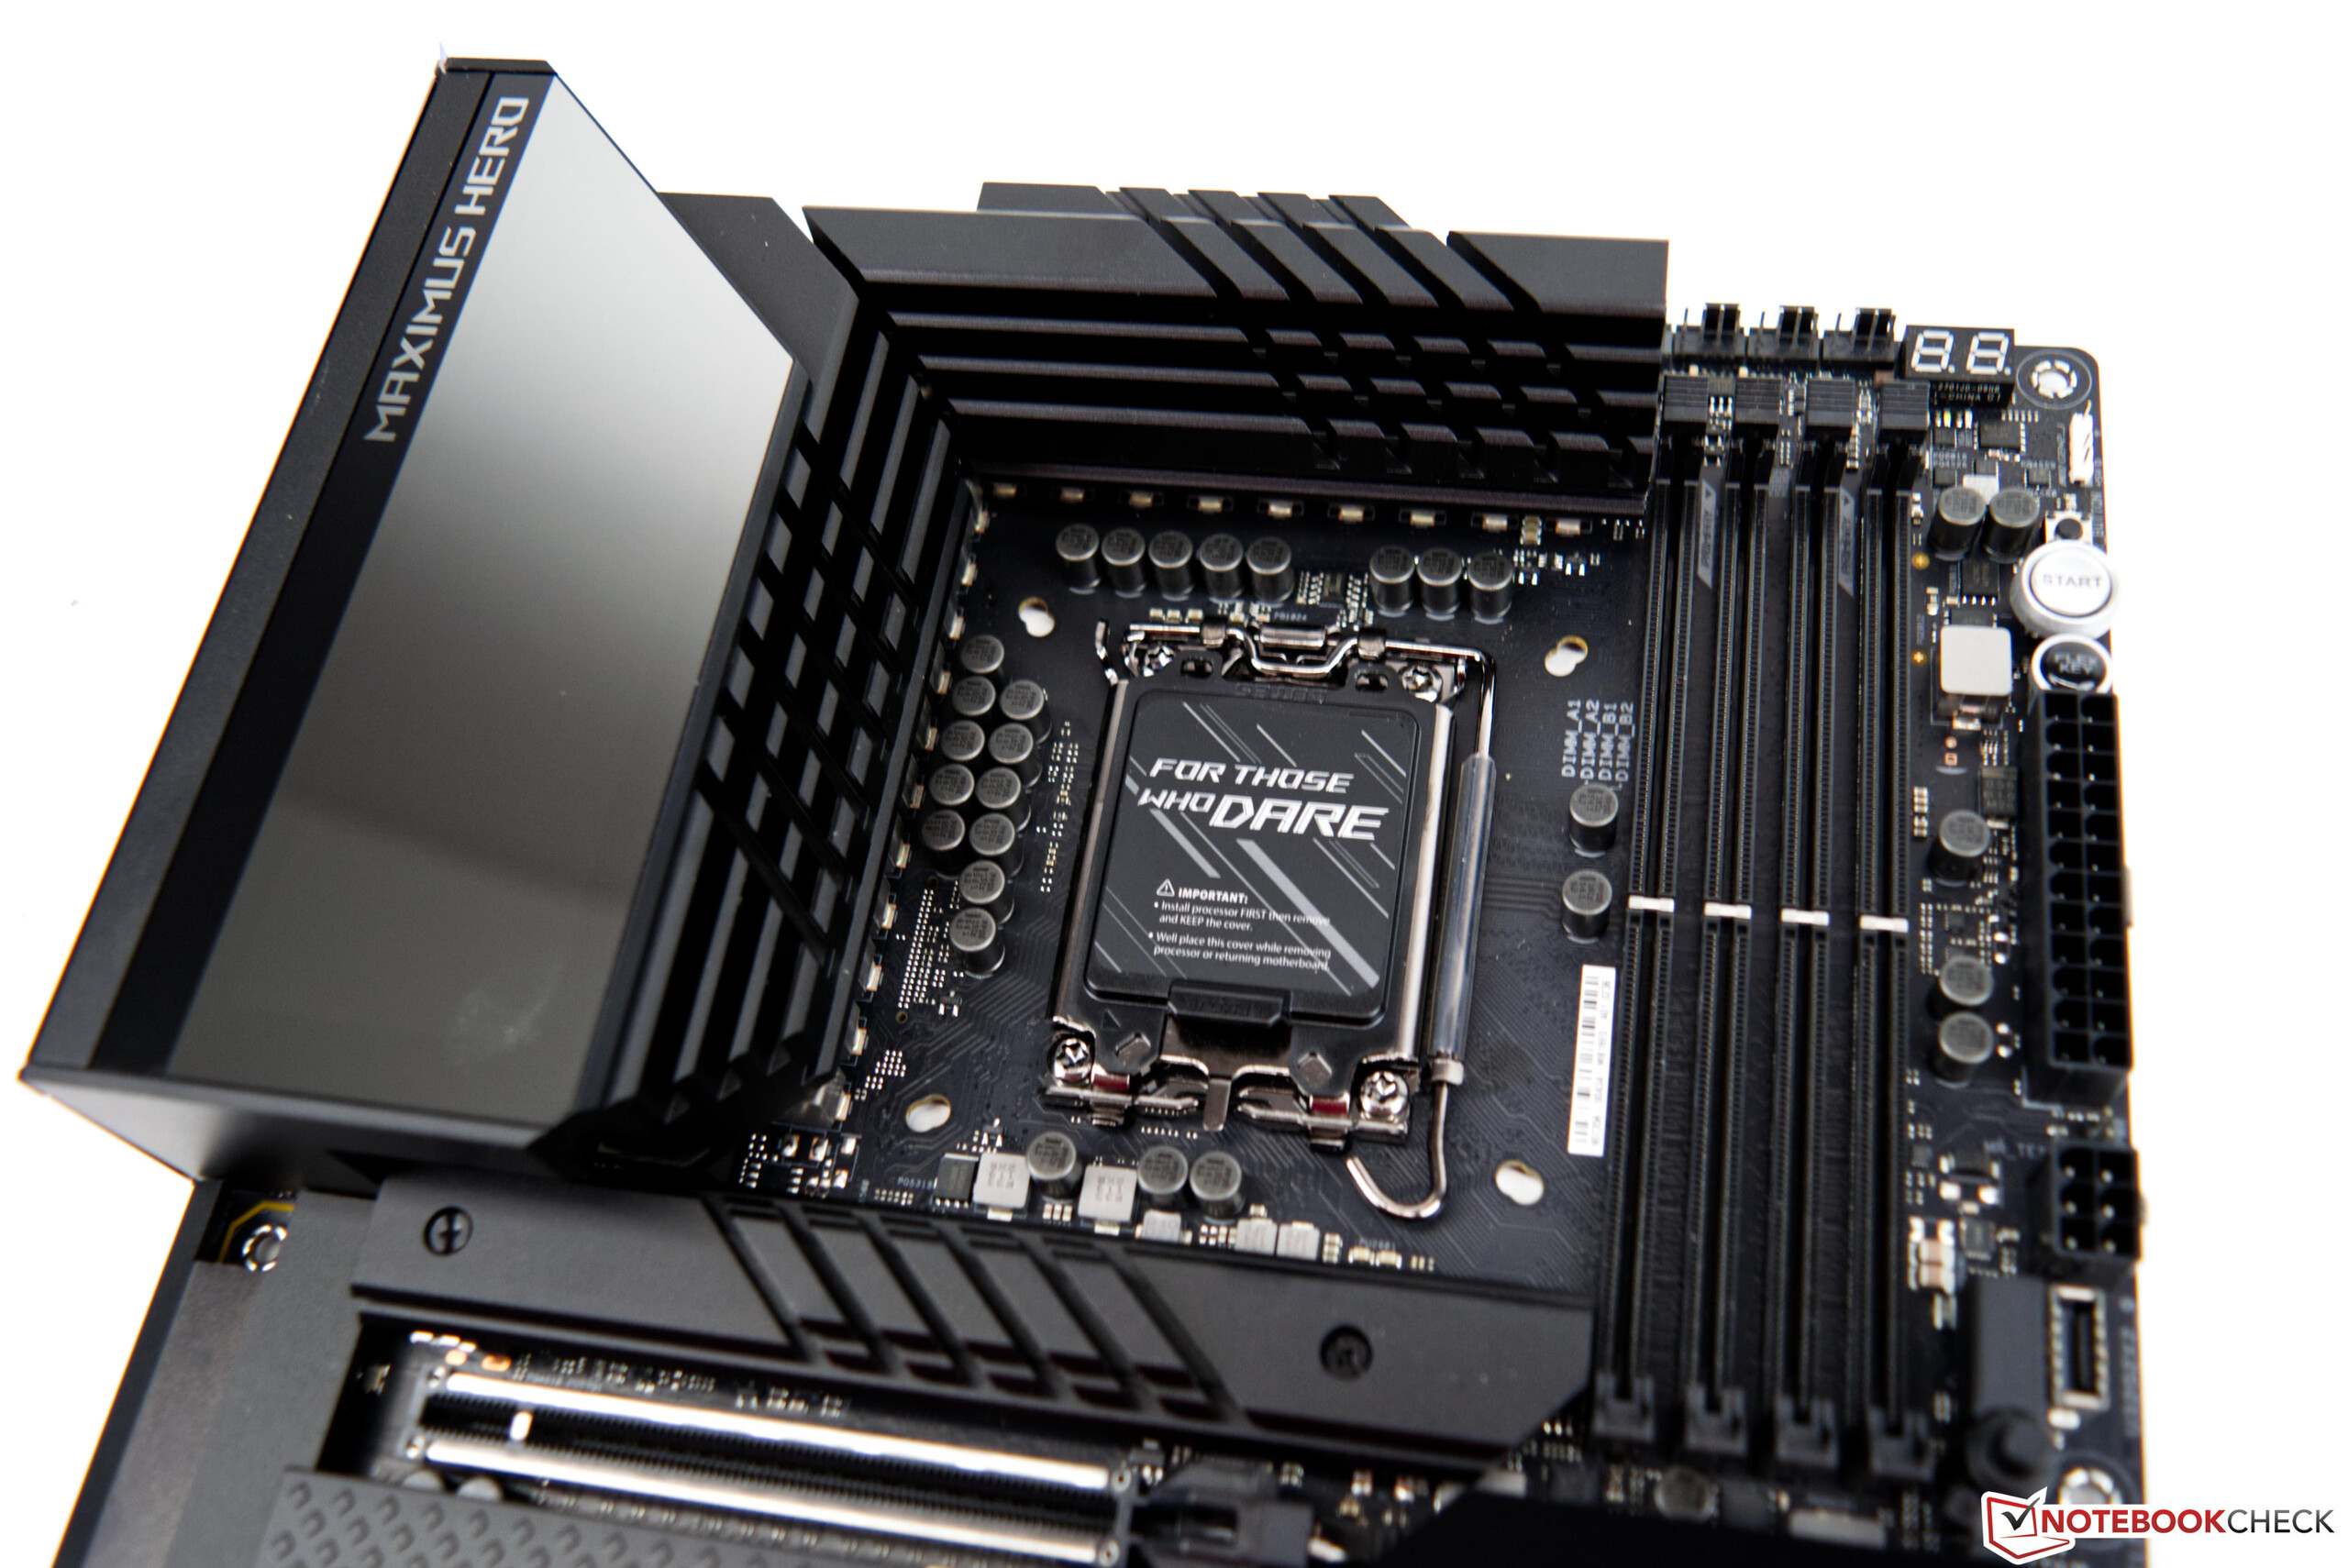
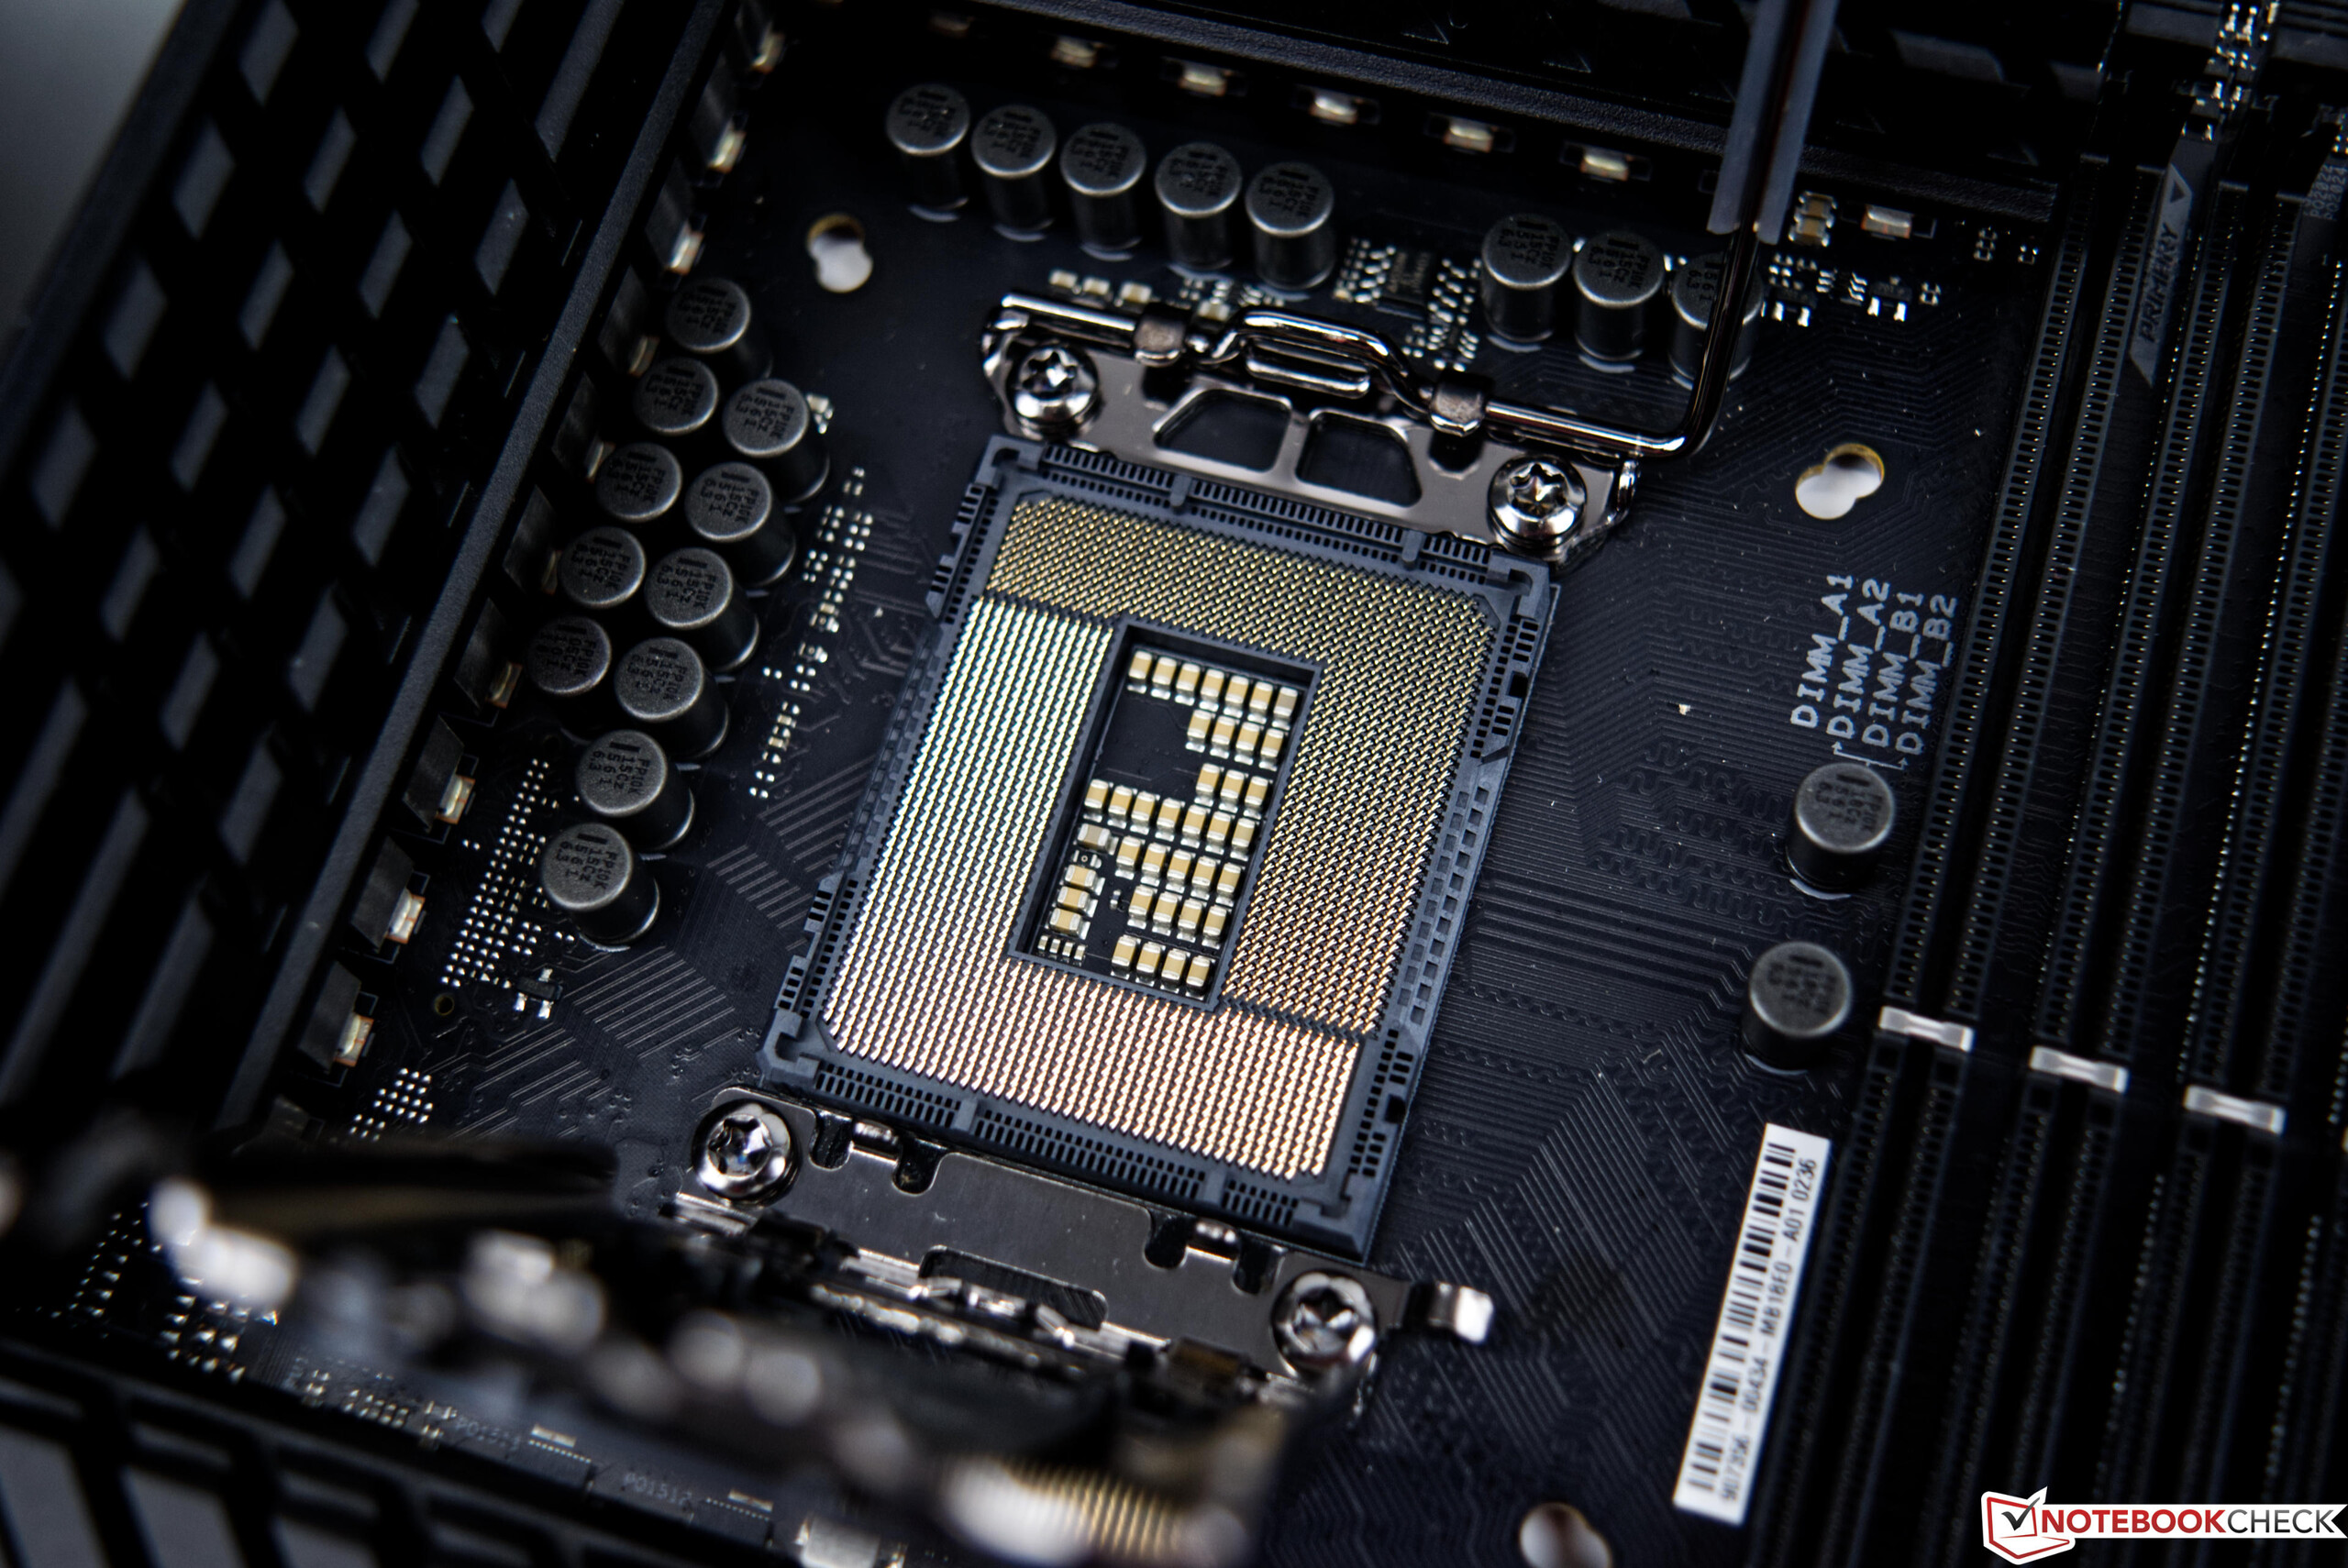
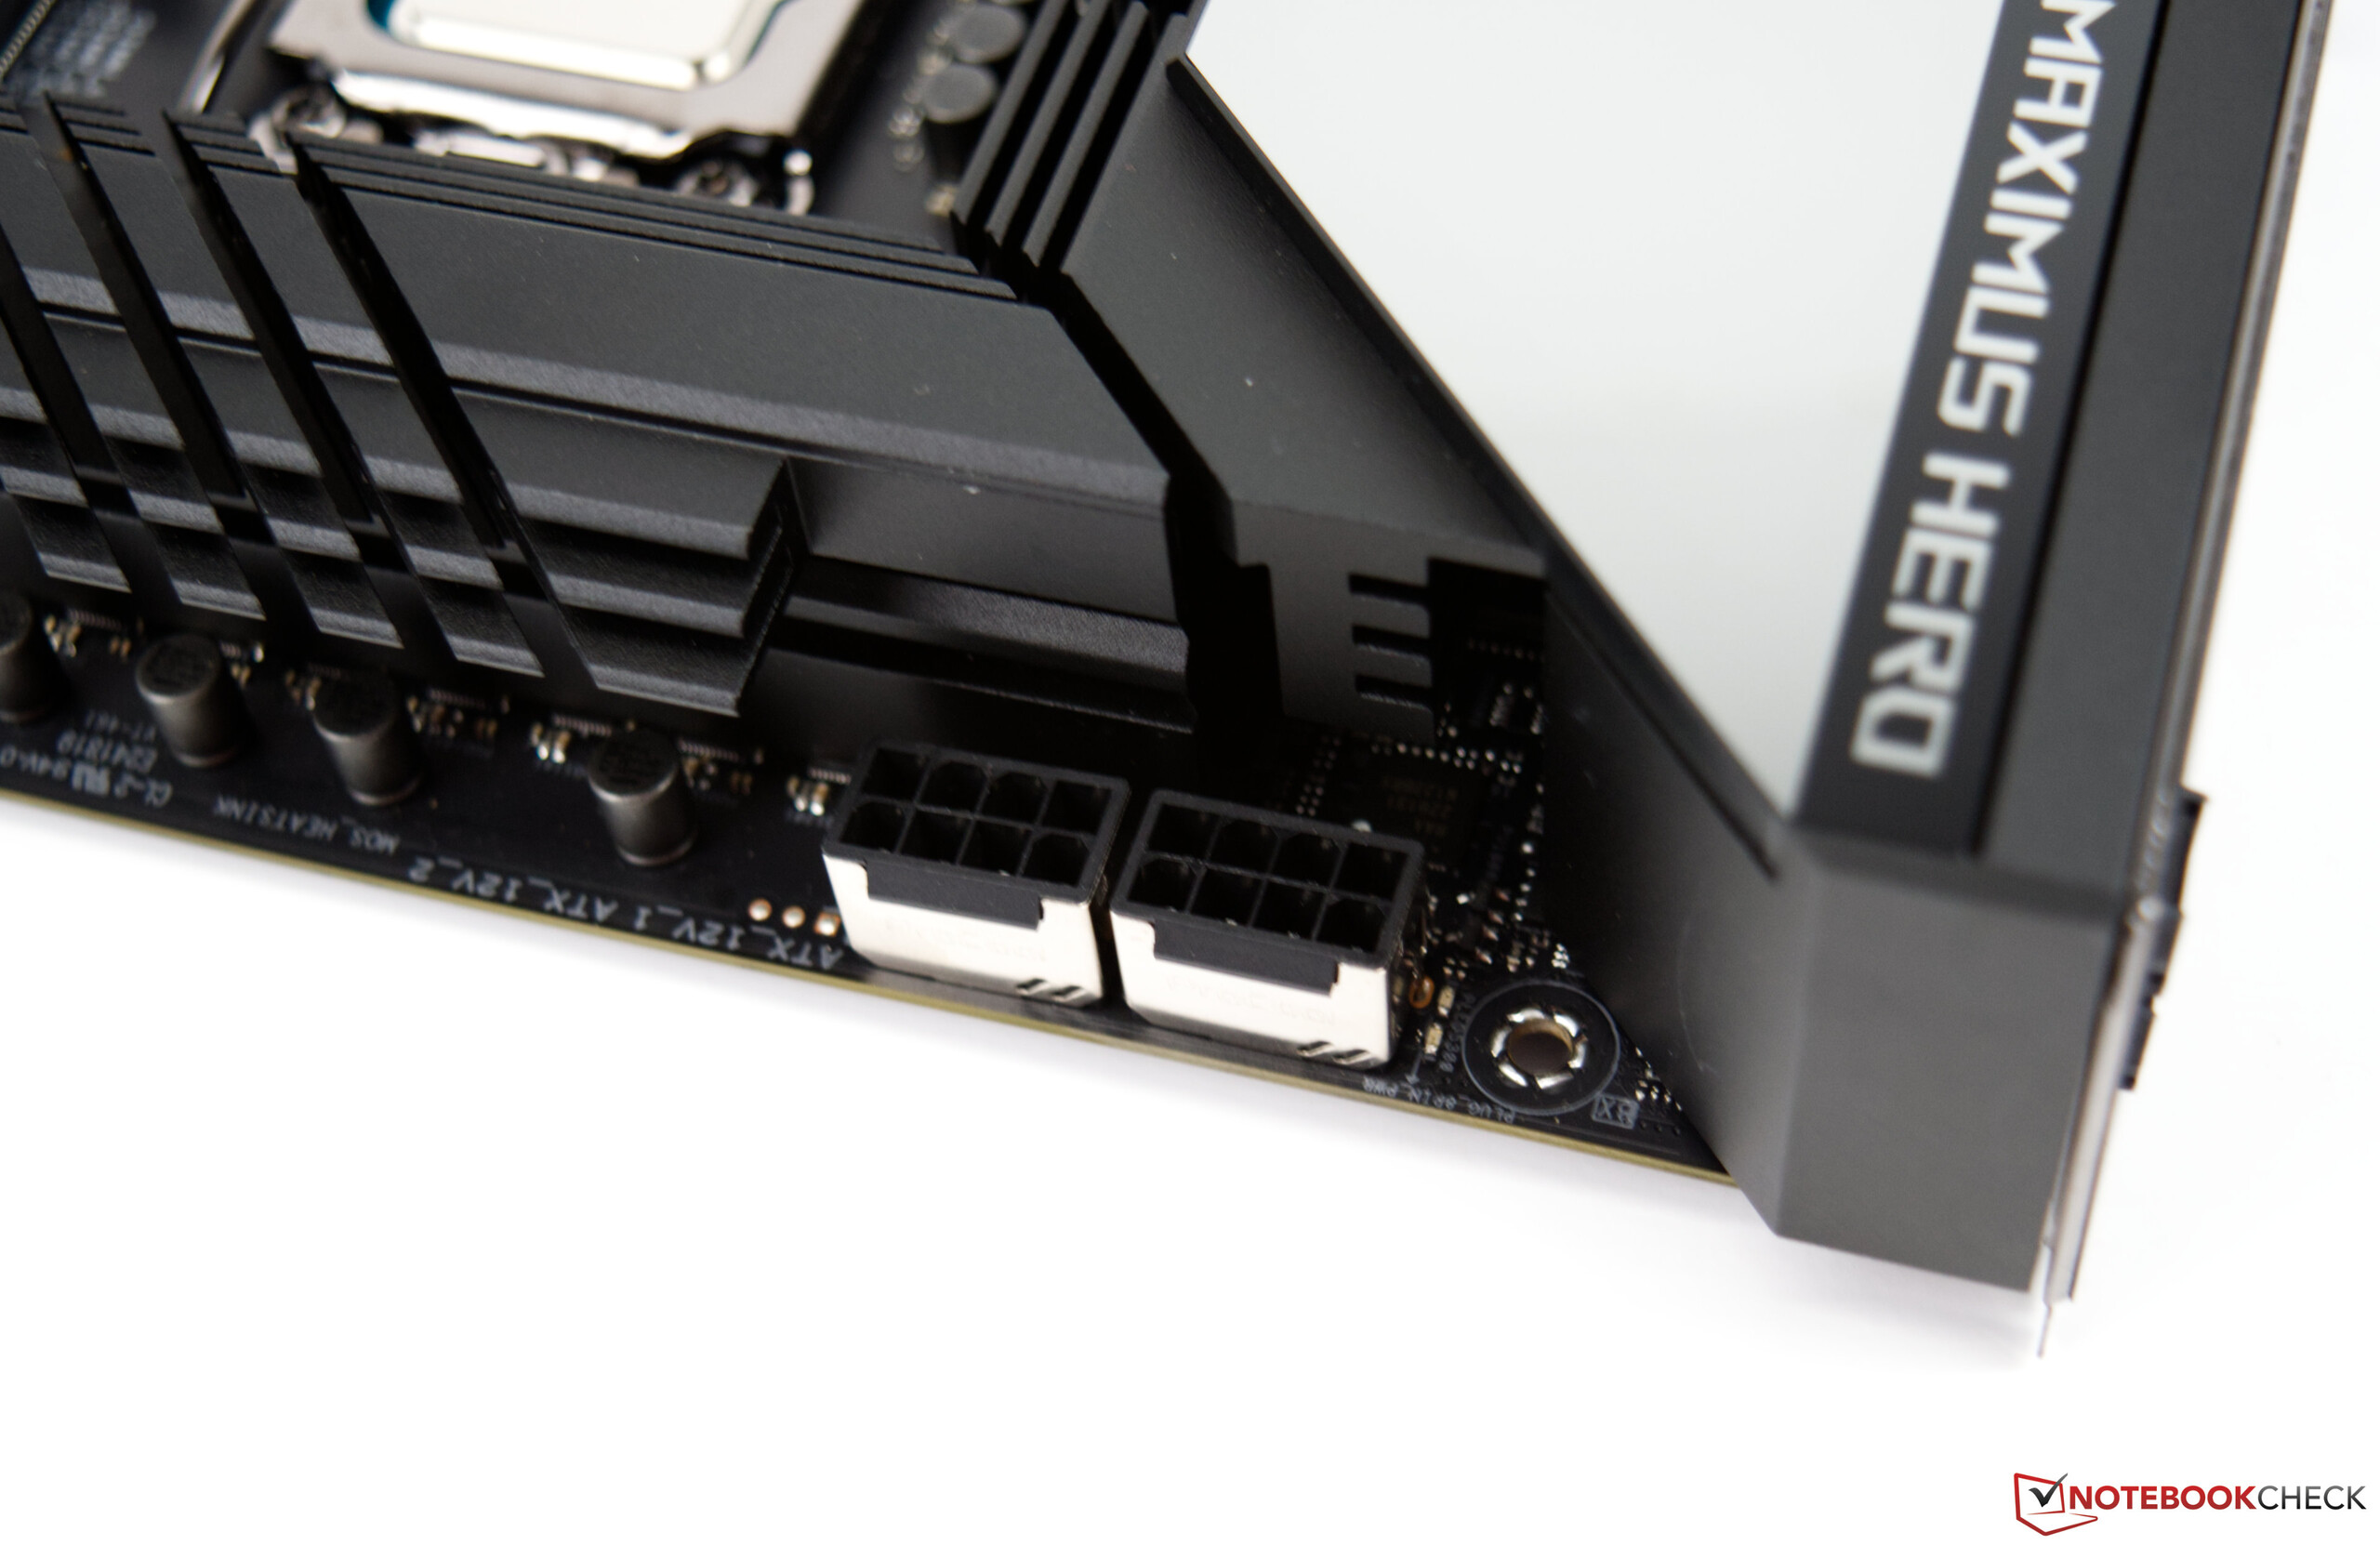
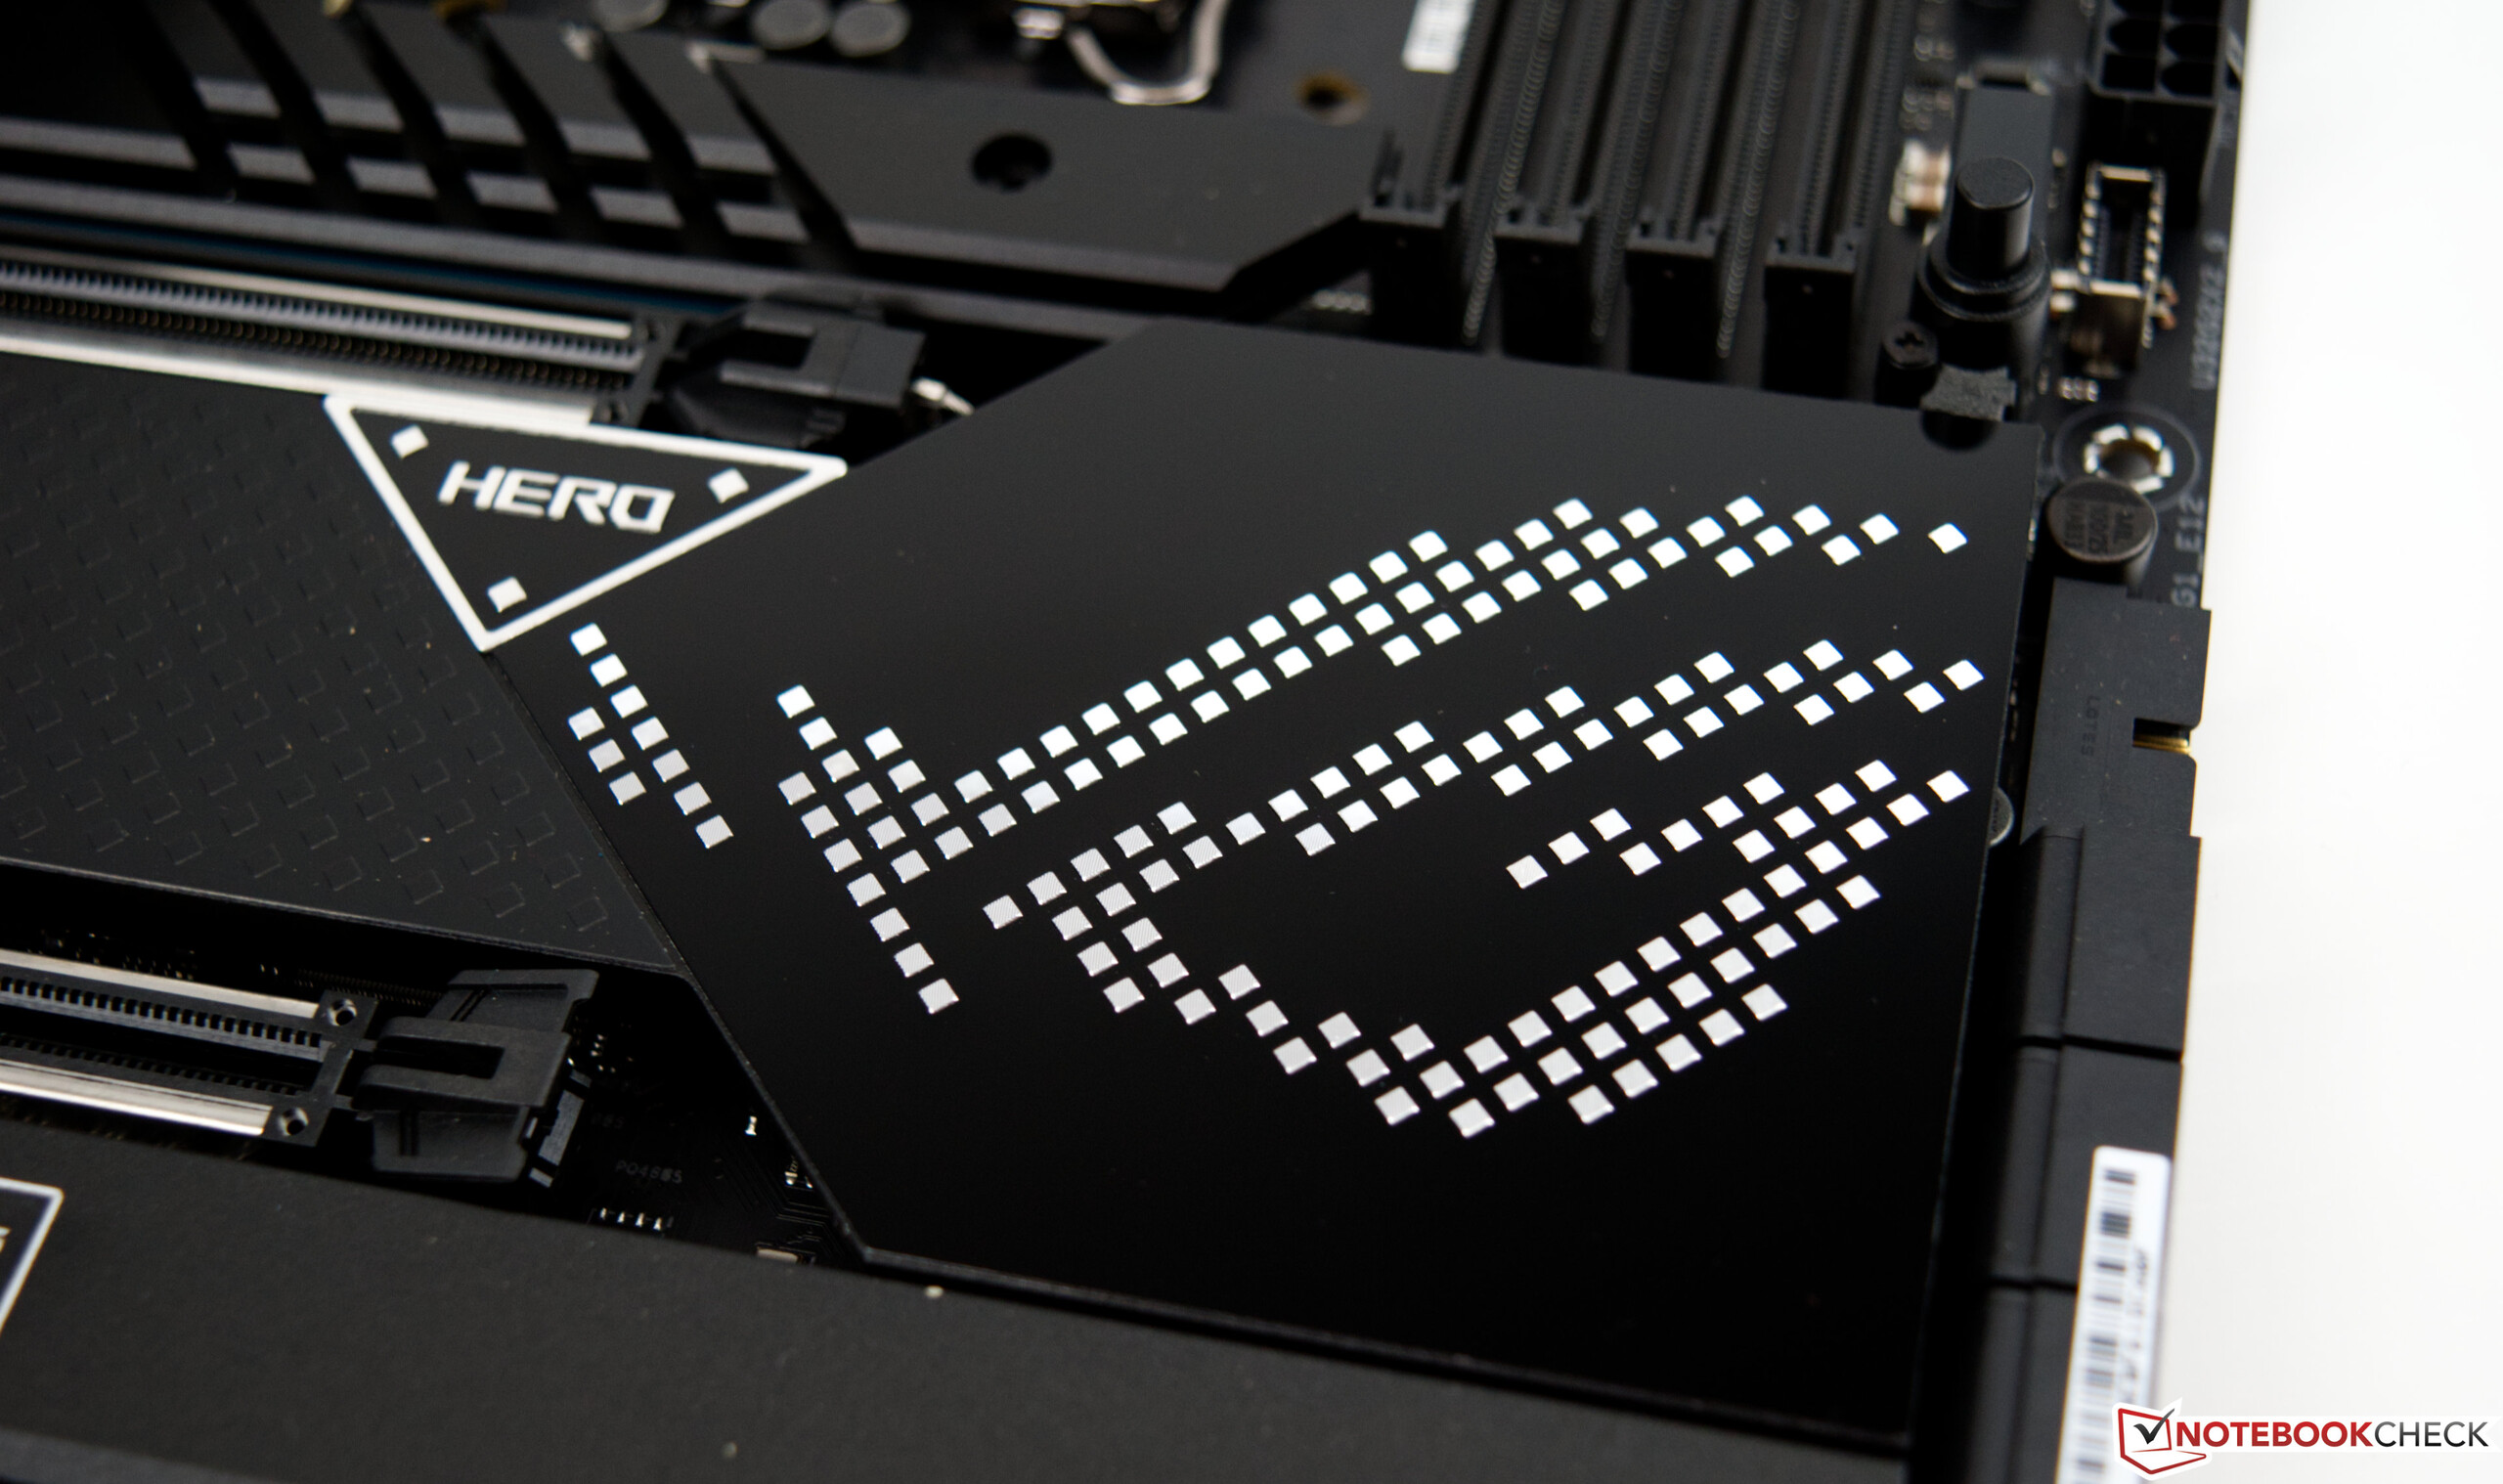
Le Asus ROG Maximus Z690 Hero en détail
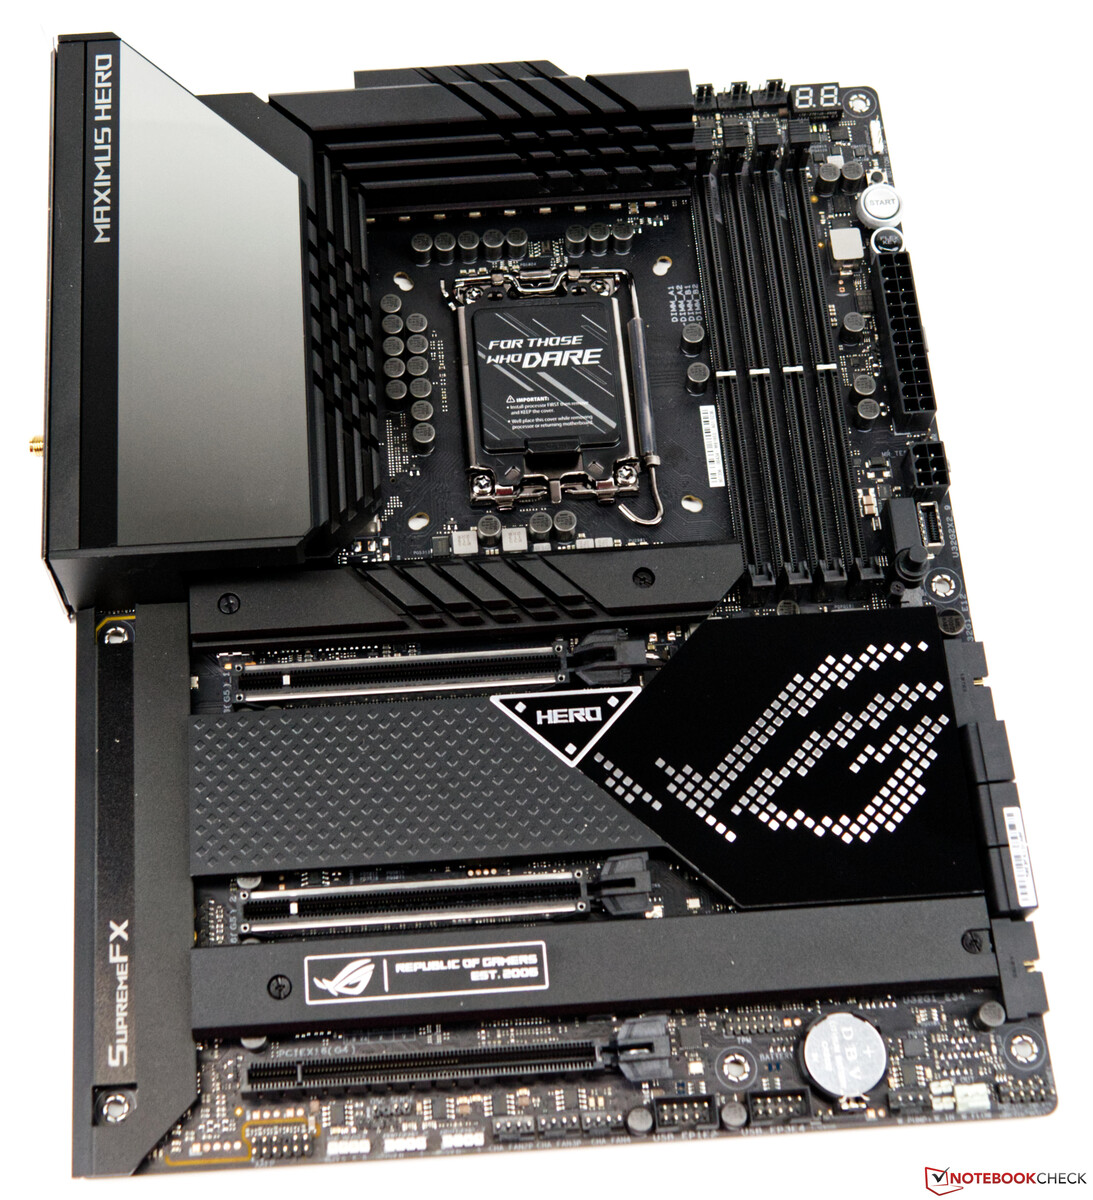
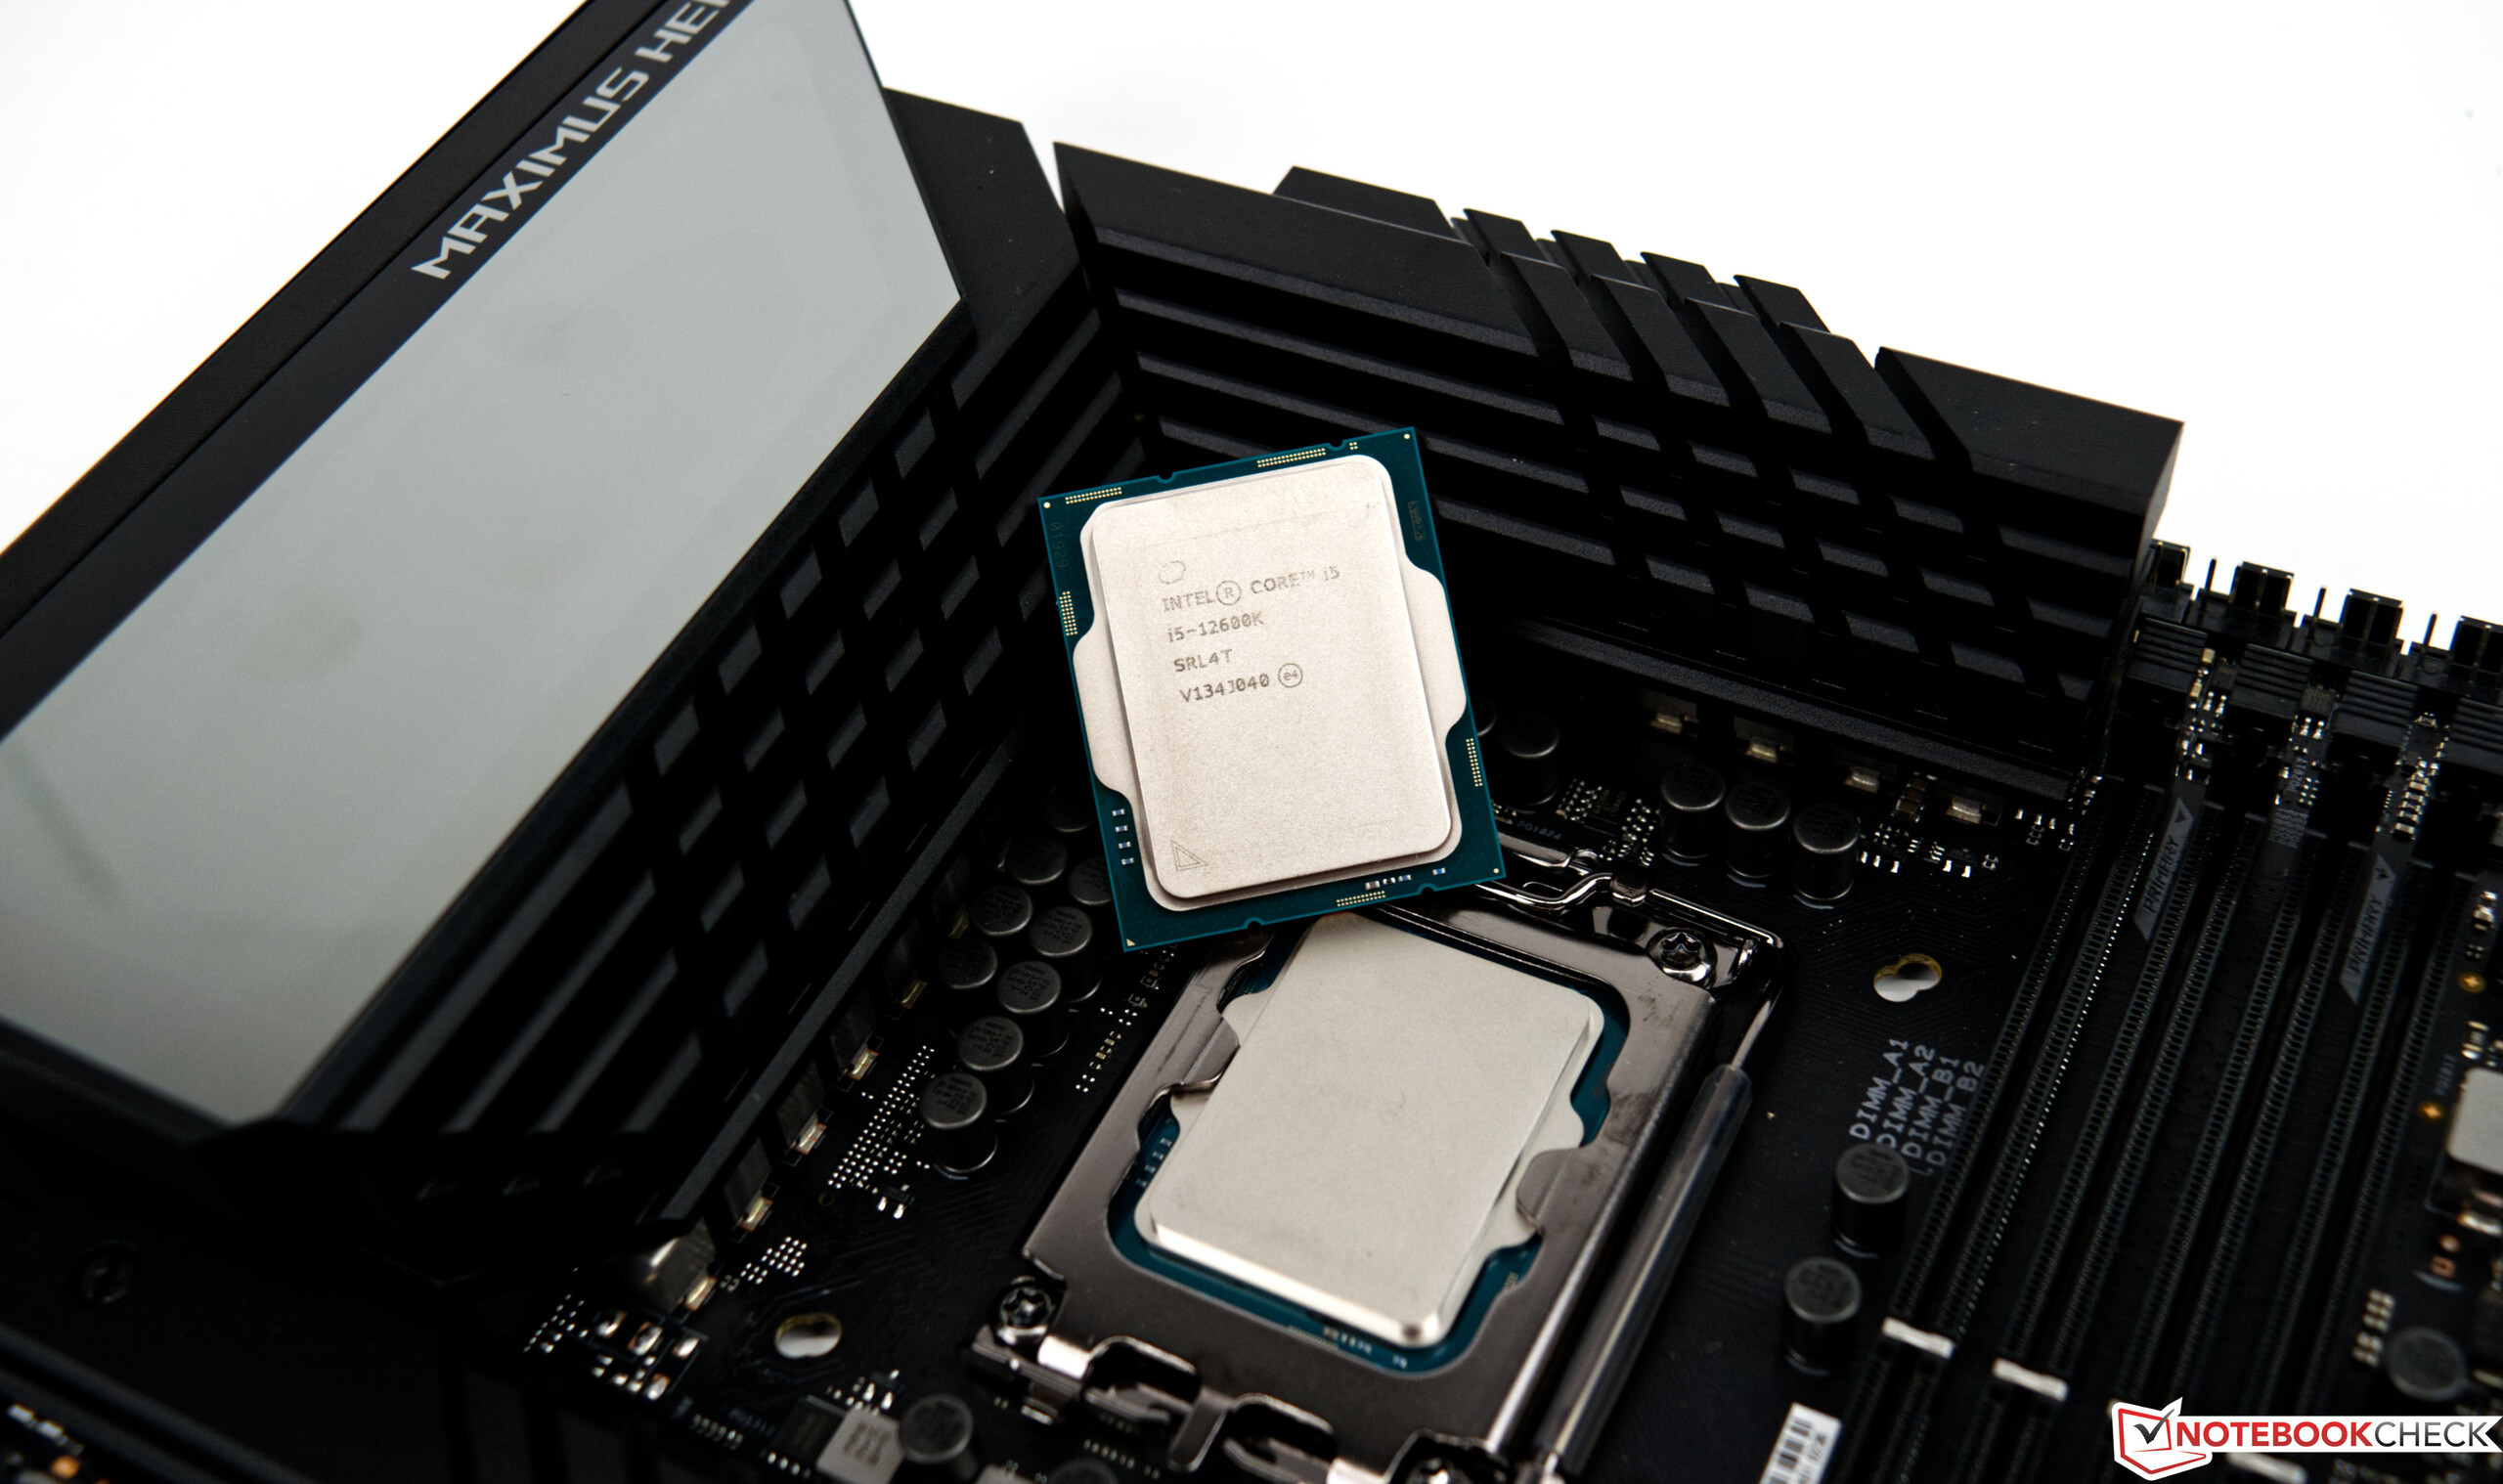
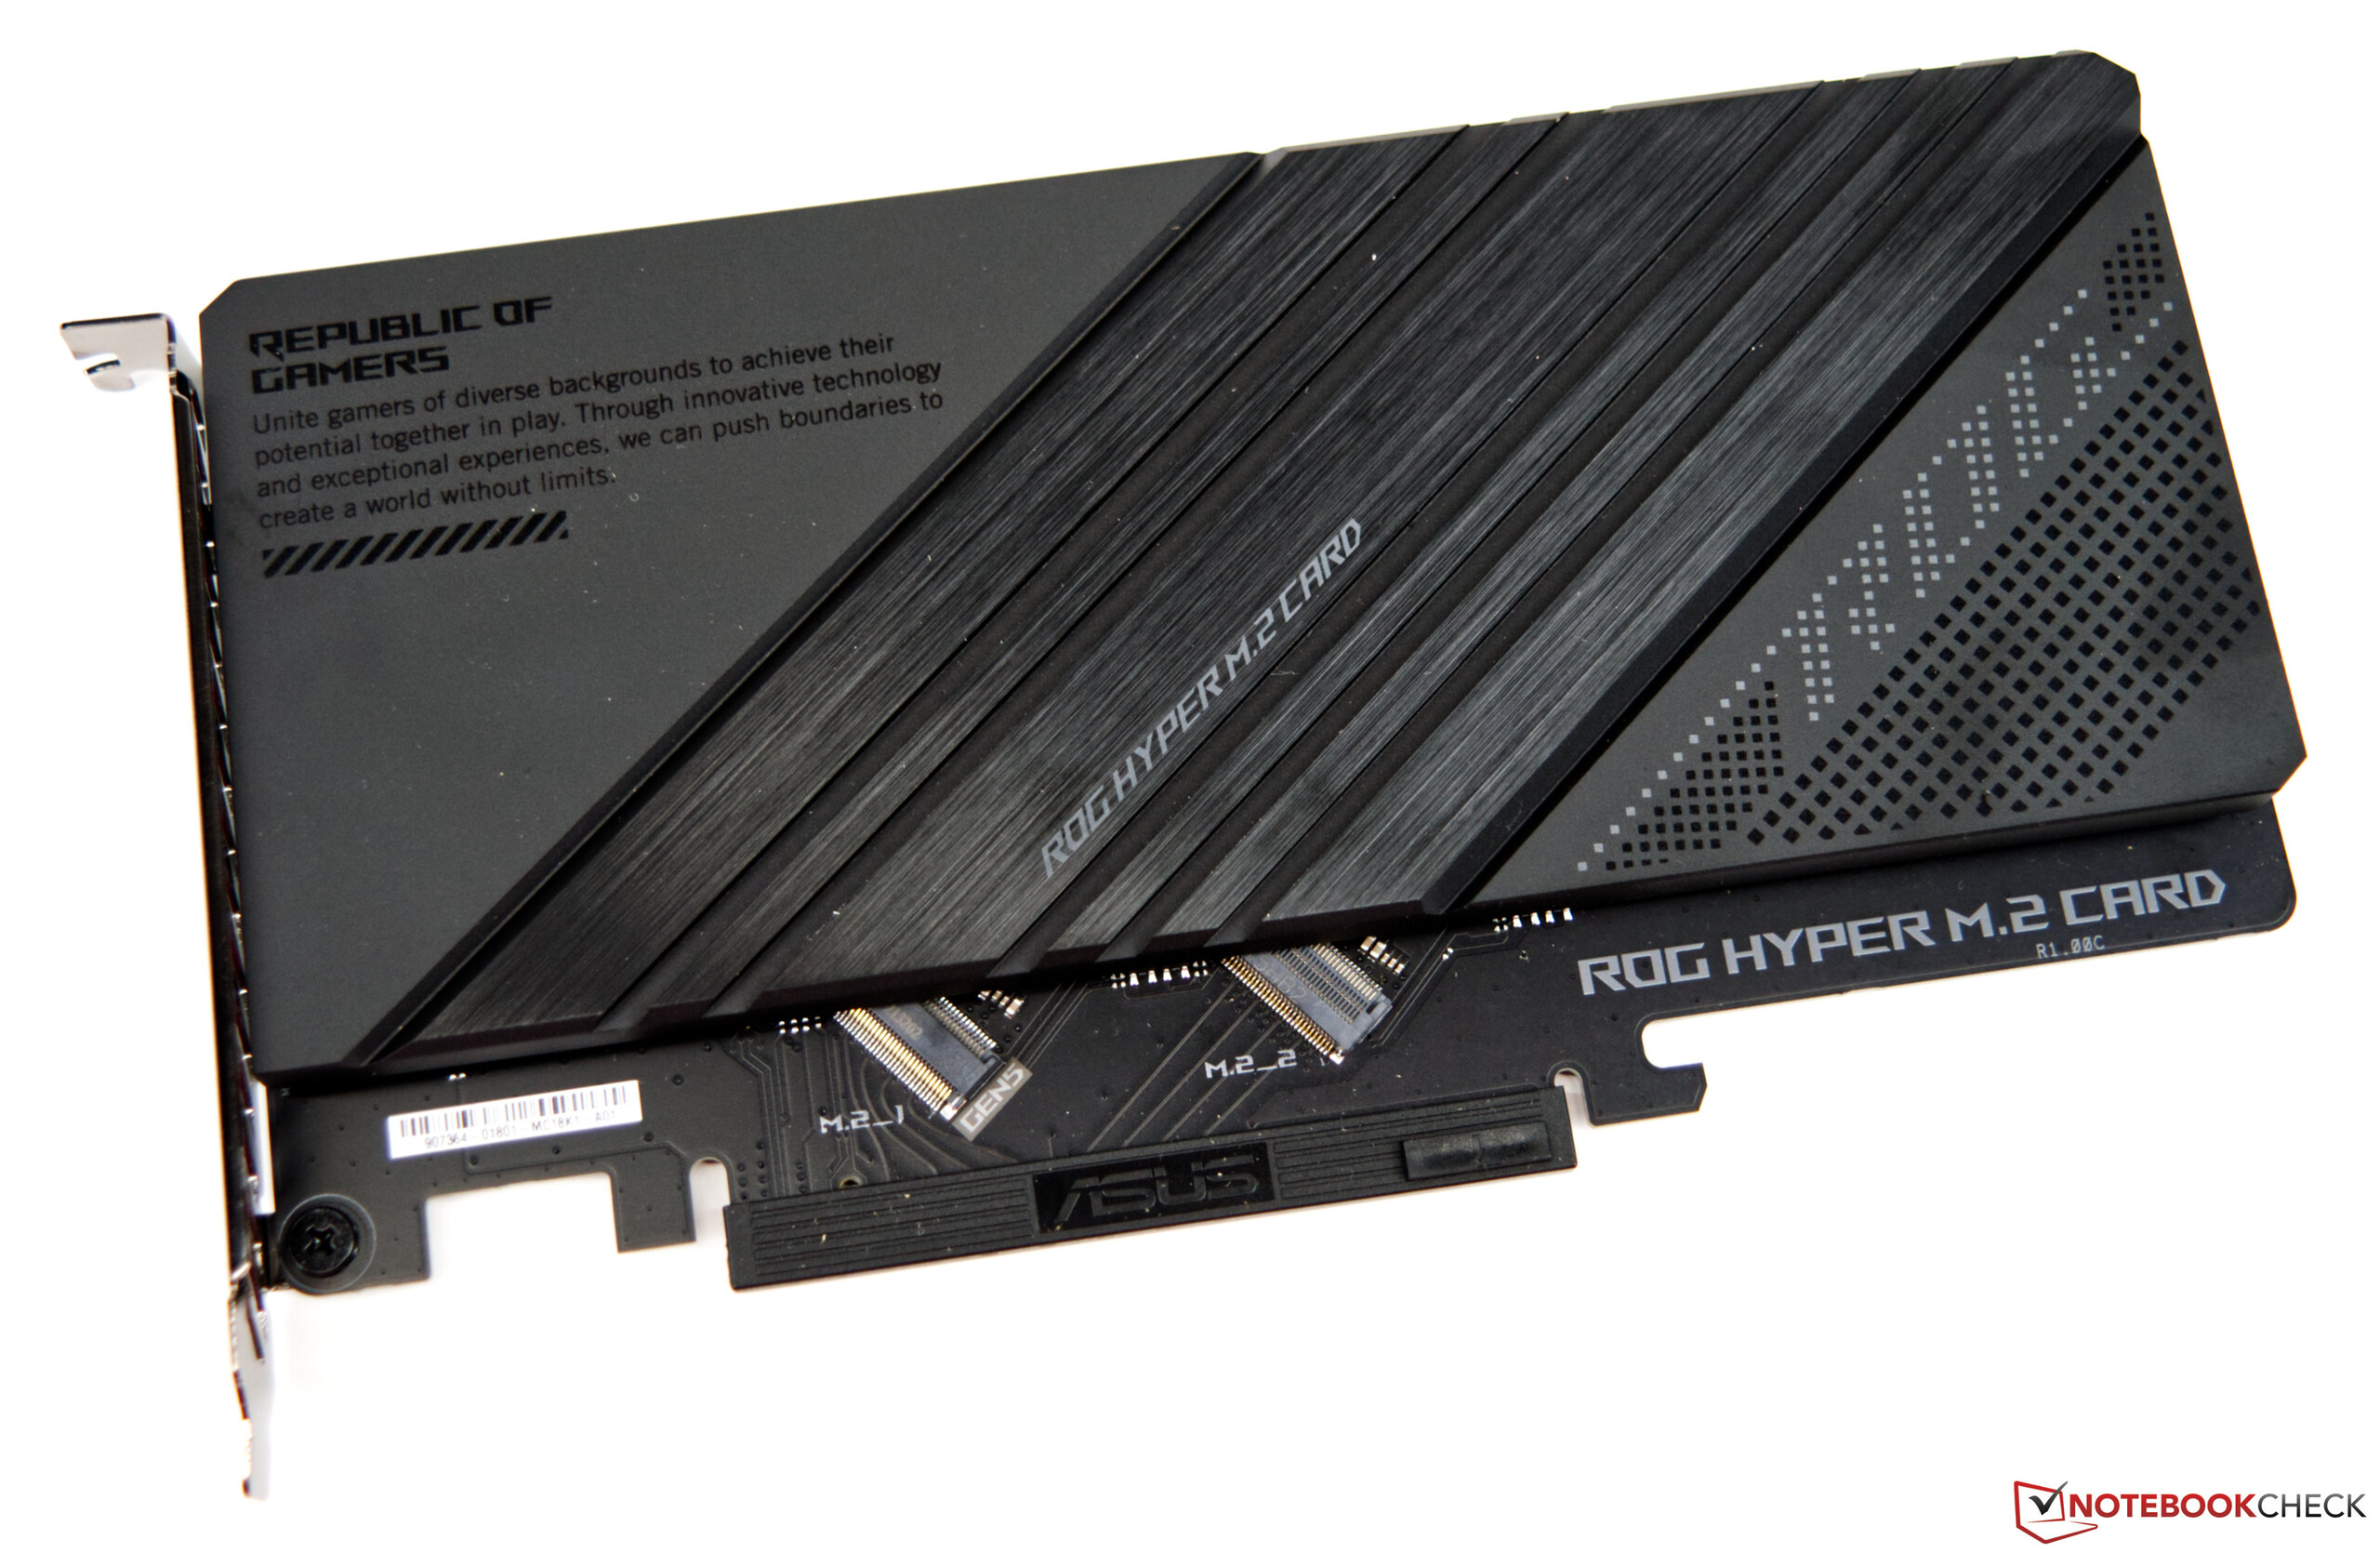
Asus nous a fourni à temps le ROG Maximus Z690 Hero , qui sert de base à cet articleNous remercions Asus Allemagne pour ce prêt. L'Asus ROG Maximus Z690 Hero a l'air très massif, ce qui peut être attribué au grand système de refroidissement. Au total, vous pouvez installer jusqu'à cinq SSD M.2 sur la carte mère, mais vous devez ensuite installer deux des cinq SSD sur une carte Hyper M.2 séparée. Celle-ci pourra utiliser toute la bande passante du support Gen 5 et est incluse comme accessoire dans la boîte. Le nouveau socket LGA 1700 se distingue par son design légèrement allongé. De nombreux systèmes de refroidissement LGA 1200 sont également compatibles avec le nouveau socket LGA 1700, mais vous devez vous renseigner directement auprès du fabricant. Parfois, d'autres supports de montage sont proposés pour le LGA 1700 afin d'assurer une pression de contact optimale sur le CPU.
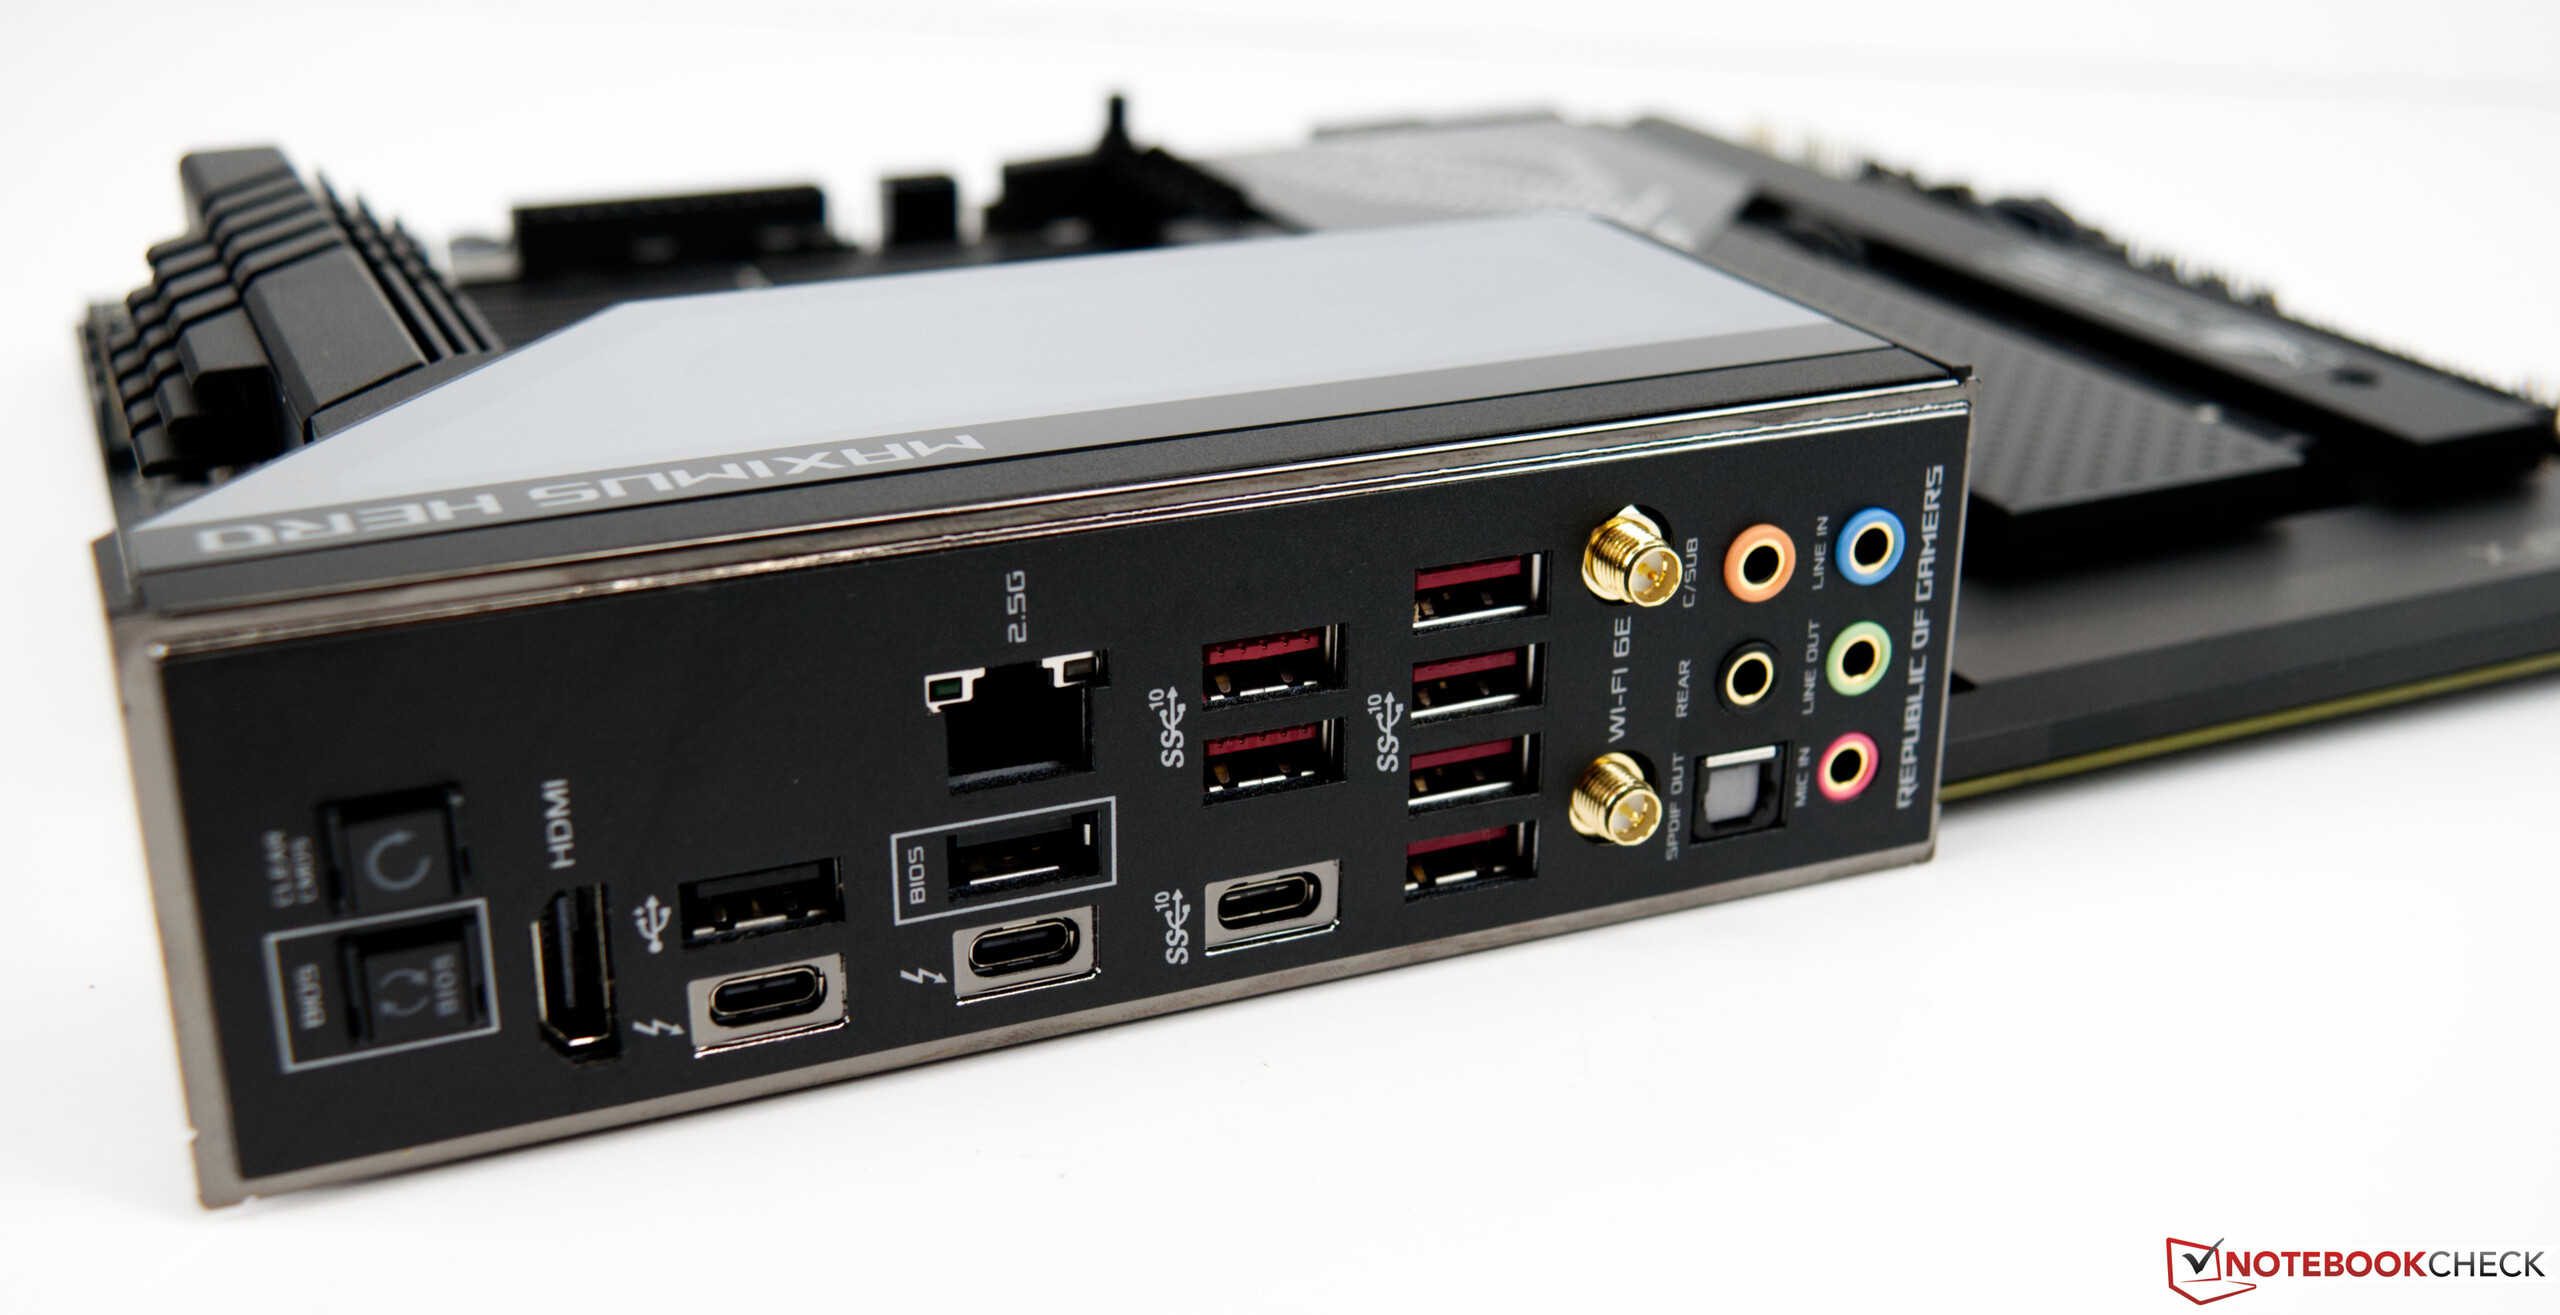
Vous pouvez installer jusqu'à 128 Go de la nouvelle mémoire de travail DDR5. Le WiFi, le LAN 2,5 Gbit et un total de 20 ports USB vous assurent une connectivité suffisante.
Deux connecteurs d'alimentation à 8 broches situés non loin de la prise permettent d'alimenter le processeur. Les transformateurs de tension sont recouverts d'un bloc de refroidissement très massif comprenant un caloduc. En outre, un panneau d'éclairage Polymo au-dessus du bouclier E/S est très attrayant.
Bancs d'essai des processeurs
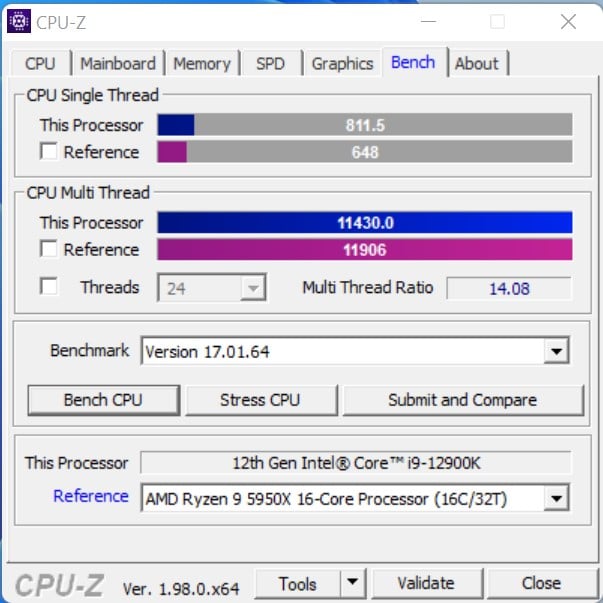
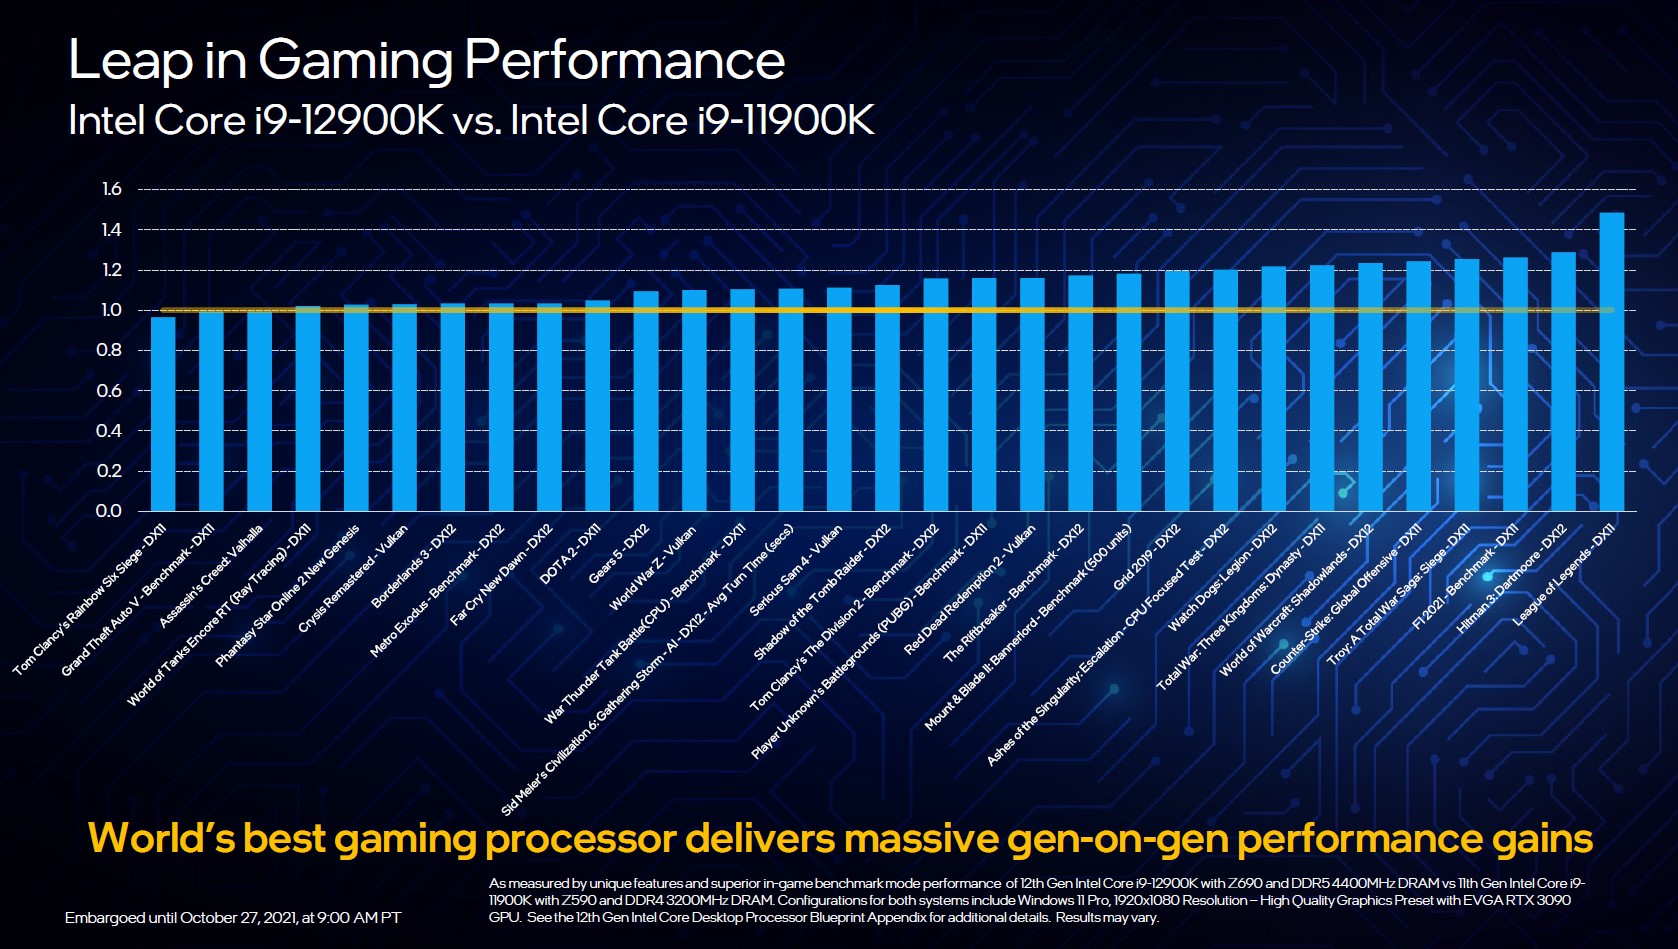
Intel est capable de tenir la promesse d'une augmentation significative des performancespar rapport aux processeurs Rocket Lake-S. Dans le classement des performances, qui reflète la différence de performances sur l'ensemble des benchmarks listés, l'Intel Core i9-12900K est capable de se placer clairement en tête. Par rapport auAMD Ryzen 9 5900Xqui offre également 24 threads au total, le nouveau vaisseau amiral d'Intel a une avance de 13 points de pourcentage. Si l'on prend leIntel Core i9-11900K comme référence, le Core i9-12900K est 23 % plus rapide. Si les différences varient légèrement dans les différents benchmarks, cela est dû à l'architecture correspondante du processeur.
Nous observons un tableau similaire avec le plus petit Intel Core i5-12600K. Si nous utilisons le AMD Ryzen 7 5800X comme concurrent puisqu'il possède le même nombre de threads, les deux concurrents ont des performances équivalentes dans les résultats cumulés des benchmarks. En revanche, le processeur Zen3 a du mal à rivaliser avec les puissantes performances monocœurs d'Intel. Mais il ne faut pas encore faire une croix sur AMD, car les processeurs Zen3 sont déjà sur le marché depuis un an et, selon certaines rumeurs, le successeur est déjà dans les starting-blocks. Lorsque celui-ci sera disponible, les dés seront jetés à nouveau et Rocket Lake-S devra à nouveau faire ses preuves.
En raison de la discussion PL1 = PL2, nous avons pris Cinebench R23 et effectué un autre passage avec une valeur PL1 limitée à 125 watts. Il n'y a pas eu de changement dans le résultat qui mérite d'être mentionné. Les différences étaient minimes et peuvent être considérées comme étant dans les tolérances de mesure.
Il était clair qu'Intel allait faire un saut significatif avec la nouvelle conception des noyaux P et E. Grâce à cela, Intel est également en mesure de combler l'écart avec les processeurs à 12 et 16 cœurs d'AMD, ce qui n'était pas possible avec le Core i9-11900K.
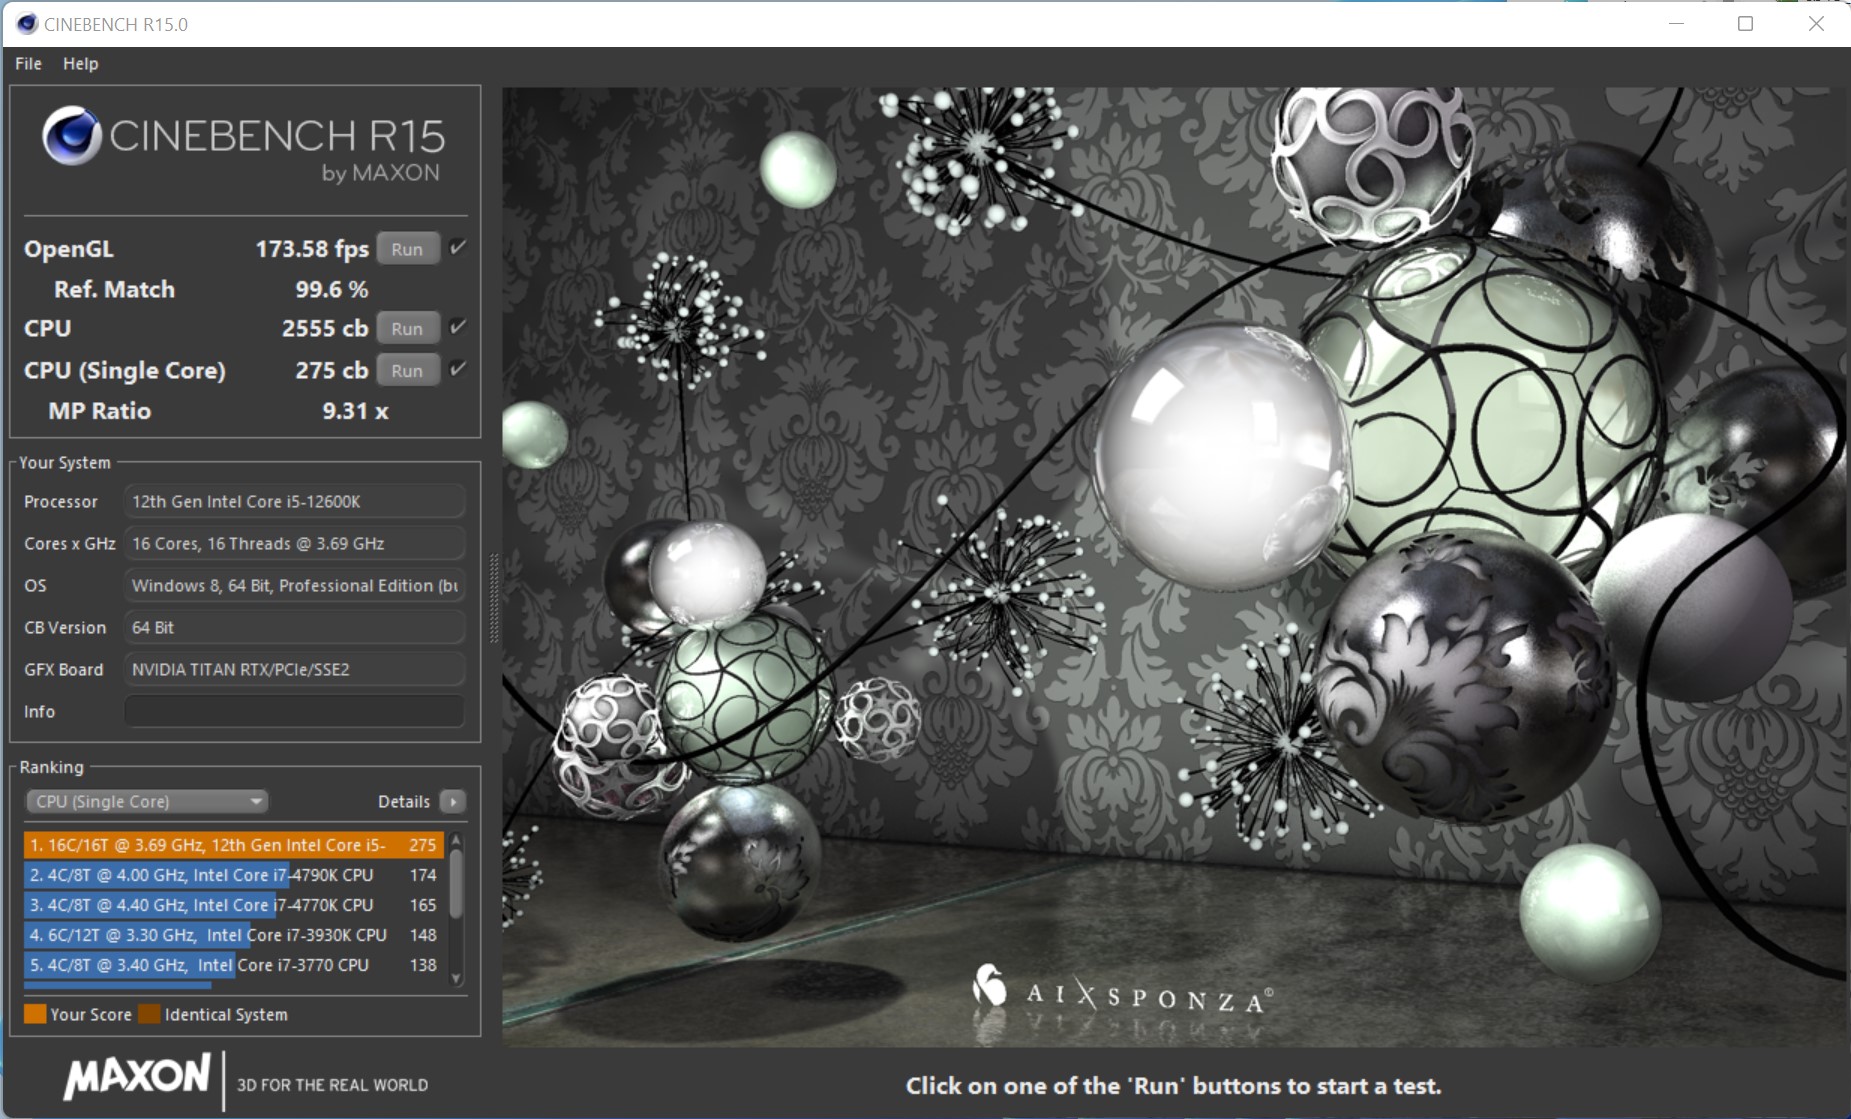
Intel Core i5-12600K


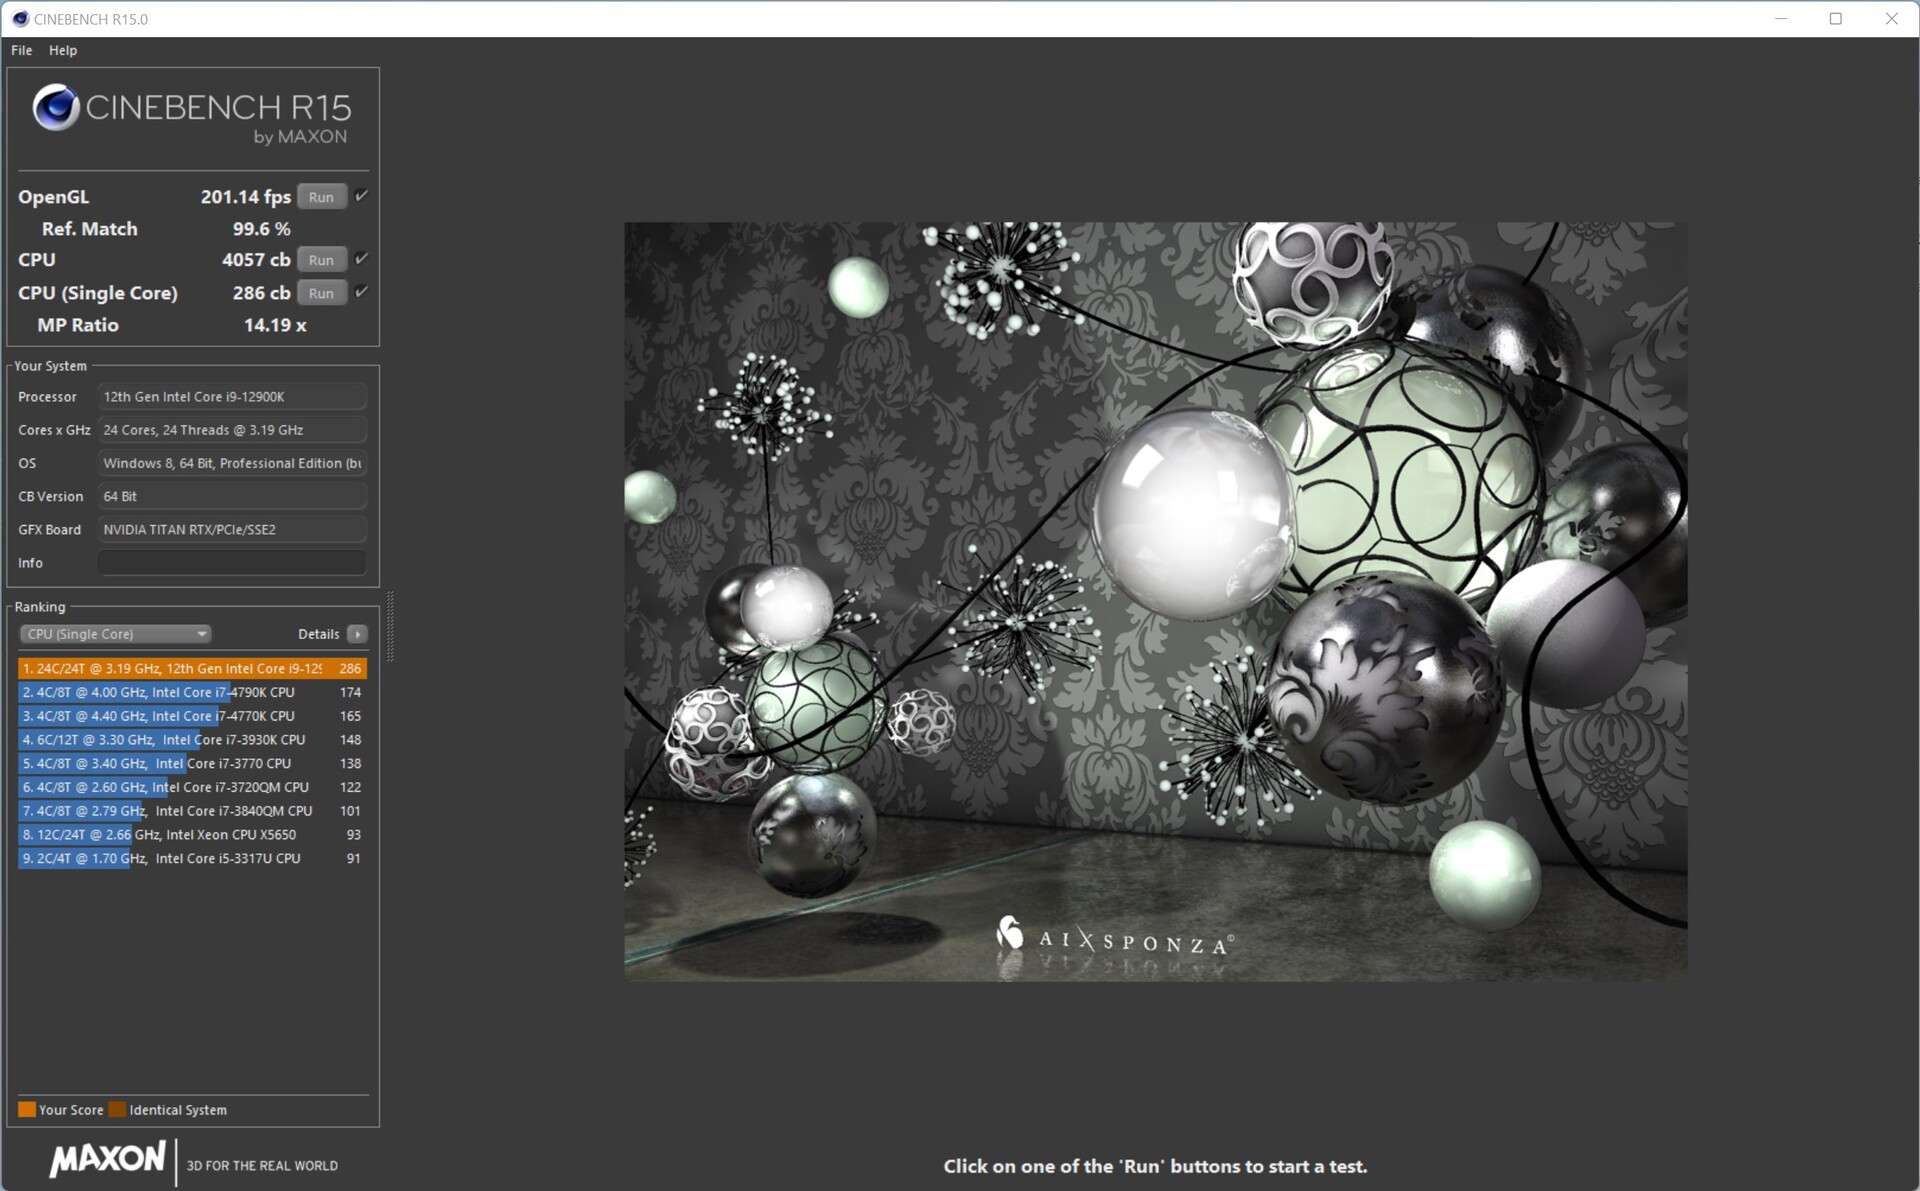
Intel Core i9-12900K


| Performance rating - Percent | |
| Intel Core i9-12900K | |
| AMD Ryzen 9 5950X | |
| Intel Core i5-12600K | |
| AMD Ryzen 9 5900X -2! | |
| AMD Ryzen 7 5800X | |
| Intel Core i9-11900K | |
| Intel Core i9-10900K | |
| AMD Ryzen 5 5600X | |
| Intel Core i5-11600K | |
| Intel Core i5-10600K | |
| Cinebench R15 | |
| CPU Single 64Bit | |
| Intel Core i9-12900K | |
| Intel Core i5-12600K | |
| AMD Ryzen 9 5950X | |
| AMD Ryzen 9 5900X | |
| AMD Ryzen 7 5800X | |
| Intel Core i9-11900K | |
| AMD Ryzen 5 5600X | |
| Intel Core i5-11600K | |
| Intel Core i9-10900K | |
| Intel Core i5-10600K | |
| CPU Multi 64Bit | |
| AMD Ryzen 9 5950X | |
| Intel Core i9-12900K | |
| AMD Ryzen 9 5900X | |
| Intel Core i9-10900K | |
| AMD Ryzen 7 5800X | |
| Intel Core i5-12600K | |
| Intel Core i9-11900K | |
| AMD Ryzen 5 5600X | |
| Intel Core i5-11600K | |
| Intel Core i5-10600K | |
| Cinebench R20 | |
| CPU (Single Core) | |
| Intel Core i9-12900K | |
| Intel Core i5-12600K | |
| Intel Core i9-11900K | |
| AMD Ryzen 9 5950X | |
| AMD Ryzen 9 5900X | |
| AMD Ryzen 7 5800X | |
| AMD Ryzen 5 5600X | |
| Intel Core i5-11600K | |
| Intel Core i9-10900K | |
| Intel Core i5-10600K | |
| CPU (Multi Core) | |
| AMD Ryzen 9 5950X | |
| Intel Core i9-12900K | |
| AMD Ryzen 9 5900X | |
| Intel Core i5-12600K | |
| Intel Core i9-10900K | |
| AMD Ryzen 7 5800X | |
| Intel Core i9-11900K | |
| AMD Ryzen 5 5600X | |
| Intel Core i5-11600K | |
| Intel Core i5-10600K | |
| Cinebench R23 | |
| Single Core | |
| Intel Core i9-12900K | |
| Intel Core i5-12600K | |
| Intel Core i9-11900K | |
| AMD Ryzen 9 5950X | |
| AMD Ryzen 9 5900X | |
| Intel Core i5-11600K | |
| AMD Ryzen 7 5800X | |
| AMD Ryzen 5 5600X | |
| Intel Core i5-10600K | |
| Intel Core i9-10900K | |
| Multi Core | |
| AMD Ryzen 9 5950X | |
| Intel Core i9-12900K | |
| AMD Ryzen 9 5900X | |
| Intel Core i5-12600K | |
| Intel Core i9-10900K | |
| Intel Core i9-11900K | |
| AMD Ryzen 7 5800X | |
| AMD Ryzen 5 5600X | |
| Intel Core i5-11600K | |
| Intel Core i5-10600K | |
| Cinebench R11.5 | |
| CPU Single 64Bit | |
| Intel Core i9-12900K | |
| Intel Core i5-12600K | |
| AMD Ryzen 9 5900X | |
| AMD Ryzen 9 5950X | |
| Intel Core i9-11900K | |
| AMD Ryzen 7 5800X | |
| AMD Ryzen 5 5600X | |
| Intel Core i5-11600K | |
| Intel Core i9-10900K | |
| Intel Core i5-10600K | |
| CPU Multi 64Bit | |
| AMD Ryzen 9 5950X | |
| Intel Core i9-12900K | |
| AMD Ryzen 9 5900X | |
| Intel Core i5-12600K | |
| AMD Ryzen 7 5800X | |
| Intel Core i9-10900K | |
| Intel Core i9-11900K | |
| AMD Ryzen 5 5600X | |
| Intel Core i5-11600K | |
| Intel Core i5-10600K | |
| Cinebench R10 | |
| Rendering Single CPUs 64Bit | |
| Intel Core i9-12900K | |
| Intel Core i5-12600K | |
| Intel Core i9-11900K | |
| AMD Ryzen 9 5950X | |
| AMD Ryzen 7 5800X | |
| Intel Core i5-11600K | |
| AMD Ryzen 9 5900X | |
| AMD Ryzen 5 5600X | |
| Intel Core i9-10900K | |
| Intel Core i5-10600K | |
| Rendering Multiple CPUs 64Bit | |
| Intel Core i9-12900K | |
| AMD Ryzen 9 5950X | |
| AMD Ryzen 9 5900X | |
| Intel Core i5-12600K | |
| AMD Ryzen 7 5800X | |
| Intel Core i9-11900K | |
| Intel Core i9-10900K | |
| AMD Ryzen 5 5600X | |
| Intel Core i5-11600K | |
| Intel Core i5-10600K | |
| Blender - v2.79 BMW27 CPU | |
| Intel Core i5-10600K | |
| Intel Core i5-11600K | |
| AMD Ryzen 5 5600X | |
| AMD Ryzen 7 5800X | |
| Intel Core i9-11900K | |
| Intel Core i5-12600K | |
| Intel Core i9-10900K | |
| AMD Ryzen 9 5900X | |
| Intel Core i9-12900K | |
| AMD Ryzen 9 5950X | |
| wPrime 2.10 | |
| 32m | |
| Intel Core i9-12900K | |
| Intel Core i5-11600K | |
| Intel Core i5-12600K | |
| Intel Core i5-10600K | |
| Intel Core i9-11900K | |
| AMD Ryzen 5 5600X | |
| Intel Core i9-10900K | |
| AMD Ryzen 7 5800X | |
| AMD Ryzen 9 5950X | |
| 1024m | |
| Intel Core i5-12600K | |
| Intel Core i9-12900K | |
| AMD Ryzen 5 5600X | |
| Intel Core i5-10600K | |
| Intel Core i5-11600K | |
| AMD Ryzen 7 5800X | |
| Intel Core i9-11900K | |
| Intel Core i9-10900K | |
| AMD Ryzen 9 5950X | |
| X264 HD Benchmark 4.0 | |
| Pass 1 | |
| Intel Core i9-12900K | |
| AMD Ryzen 7 5800X | |
| AMD Ryzen 9 5950X | |
| AMD Ryzen 9 5900X | |
| Intel Core i5-12600K | |
| AMD Ryzen 5 5600X | |
| Intel Core i9-11900K | |
| Intel Core i5-11600K | |
| Intel Core i9-10900K | |
| Intel Core i5-10600K | |
| Pass 2 | |
| AMD Ryzen 9 5950X | |
| Intel Core i9-12900K | |
| AMD Ryzen 9 5900X | |
| AMD Ryzen 7 5800X | |
| Intel Core i9-10900K | |
| Intel Core i5-12600K | |
| Intel Core i9-11900K | |
| AMD Ryzen 5 5600X | |
| Intel Core i5-11600K | |
| Intel Core i5-10600K | |
| WinRAR - Result | |
| AMD Ryzen 7 5800X | |
| AMD Ryzen 9 5900X | |
| AMD Ryzen 5 5600X | |
| AMD Ryzen 9 5950X | |
| Intel Core i9-12900K | |
| Intel Core i9-10900K | |
| Intel Core i9-11900K | |
| Intel Core i5-11600K | |
| Intel Core i5-10600K | |
| Intel Core i5-12600K | |
| TrueCrypt | |
| AES Mean 100MB | |
| AMD Ryzen 9 5950X | |
| AMD Ryzen 9 5900X | |
| Intel Core i9-12900K | |
| AMD Ryzen 7 5800X | |
| Intel Core i9-10900K | |
| Intel Core i9-11900K | |
| Intel Core i5-12600K | |
| AMD Ryzen 5 5600X | |
| Intel Core i5-11600K | |
| Intel Core i5-10600K | |
| Twofish Mean 100MB | |
| AMD Ryzen 9 5950X | |
| Intel Core i9-12900K | |
| AMD Ryzen 9 5900X | |
| Intel Core i9-10900K | |
| Intel Core i5-12600K | |
| AMD Ryzen 7 5800X | |
| Intel Core i9-11900K | |
| AMD Ryzen 5 5600X | |
| Intel Core i5-11600K | |
| Intel Core i5-10600K | |
| Serpent Mean 100MB | |
| AMD Ryzen 9 5950X | |
| Intel Core i9-12900K | |
| AMD Ryzen 9 5900X | |
| Intel Core i9-10900K | |
| AMD Ryzen 7 5800X | |
| Intel Core i5-12600K | |
| Intel Core i9-11900K | |
| AMD Ryzen 5 5600X | |
| Intel Core i5-11600K | |
| Intel Core i5-10600K | |
| Geekbench 5.5 | |
| Multi-Core | |
| Intel Core i9-12900K | |
| AMD Ryzen 9 5950X | |
| AMD Ryzen 9 5900X | |
| Intel Core i5-12600K | |
| Intel Core i9-10900K | |
| AMD Ryzen 7 5800X | |
| Intel Core i9-11900K | |
| AMD Ryzen 5 5600X | |
| Intel Core i5-11600K | |
| Intel Core i5-10600K | |
| Single-Core | |
| Intel Core i9-12900K | |
| Intel Core i5-12600K | |
| Intel Core i9-11900K | |
| Intel Core i5-11600K | |
| AMD Ryzen 9 5950X | |
| AMD Ryzen 9 5900X | |
| AMD Ryzen 7 5800X | |
| AMD Ryzen 5 5600X | |
| Intel Core i9-10900K | |
| Intel Core i5-10600K | |
| Geekbench 5.0 | |
| 5.0 Multi-Core | |
| Intel Core i9-12900K | |
| AMD Ryzen 9 5950X | |
| AMD Ryzen 9 5900X | |
| Intel Core i5-12600K | |
| Intel Core i9-10900K | |
| AMD Ryzen 7 5800X | |
| Intel Core i9-11900K | |
| AMD Ryzen 5 5600X | |
| Intel Core i5-11600K | |
| Intel Core i5-10600K | |
| 5.0 Single-Core | |
| Intel Core i9-12900K | |
| Intel Core i9-11900K | |
| Intel Core i5-12600K | |
| Intel Core i5-11600K | |
| AMD Ryzen 9 5950X | |
| AMD Ryzen 7 5800X | |
| AMD Ryzen 9 5900X | |
| AMD Ryzen 5 5600X | |
| Intel Core i9-10900K | |
| Intel Core i5-10600K | |
| Geekbench 4.4 | |
| 64 Bit Single-Core Score | |
| Intel Core i9-12900K | |
| Intel Core i5-12600K | |
| Intel Core i9-11900K | |
| Intel Core i5-11600K | |
| AMD Ryzen 7 5800X | |
| AMD Ryzen 9 5900X | |
| AMD Ryzen 9 5950X | |
| AMD Ryzen 5 5600X | |
| Intel Core i9-10900K | |
| Intel Core i5-10600K | |
| 64 Bit Multi-Core Score | |
| Intel Core i9-12900K | |
| AMD Ryzen 9 5950X | |
| AMD Ryzen 9 5900X | |
| Intel Core i5-12600K | |
| AMD Ryzen 7 5800X | |
| Intel Core i9-10900K | |
| Intel Core i9-11900K | |
| AMD Ryzen 5 5600X | |
| Intel Core i5-11600K | |
| Intel Core i5-10600K | |
| 3DMark 11 - 1280x720 Performance Physics | |
| Intel Core i9-12900K | |
| AMD Ryzen 9 5950X | |
| Intel Core i5-12600K | |
| AMD Ryzen 9 5900X | |
| AMD Ryzen 7 5800X | |
| Intel Core i9-10900K | |
| Intel Core i9-11900K | |
| AMD Ryzen 5 5600X | |
| Intel Core i5-11600K | |
| Intel Core i5-10600K | |
| 7-Zip 18.03 | |
| 7z b 4 | |
| AMD Ryzen 9 5950X | |
| Intel Core i9-12900K | |
| AMD Ryzen 9 5900X | |
| AMD Ryzen 7 5800X | |
| Intel Core i9-10900K | |
| Intel Core i5-12600K | |
| Intel Core i9-11900K | |
| AMD Ryzen 5 5600X | |
| Intel Core i5-11600K | |
| Intel Core i5-10600K | |
| 7z b 4 -mmt1 | |
| AMD Ryzen 9 5950X | |
| AMD Ryzen 7 5800X | |
| AMD Ryzen 9 5900X | |
| Intel Core i9-11900K | |
| AMD Ryzen 5 5600X | |
| Intel Core i9-12900K | |
| Intel Core i5-11600K | |
| Intel Core i9-10900K | |
| Intel Core i5-12600K | |
| Intel Core i5-10600K | |
| HWBOT x265 Benchmark v2.2 - 4k Preset | |
| AMD Ryzen 9 5950X | |
| Intel Core i5-12600K | |
| Intel Core i9-12900K | |
| AMD Ryzen 9 5900X | |
| Intel Core i9-10900K | |
| AMD Ryzen 7 5800X | |
| Intel Core i9-11900K | |
| AMD Ryzen 5 5600X | |
| Intel Core i5-11600K | |
| Intel Core i5-10600K | |
| R Benchmark 2.5 - Overall mean | |
| Intel Core i5-10600K | |
| Intel Core i9-10900K | |
| Intel Core i5-11600K | |
| AMD Ryzen 5 5600X | |
| Intel Core i9-11900K | |
| AMD Ryzen 9 5950X | |
| AMD Ryzen 9 5900X | |
| AMD Ryzen 7 5800X | |
| Intel Core i5-12600K | |
| Intel Core i9-12900K | |
| LibreOffice - 20 Documents To PDF | |
| Intel Core i9-10900K | |
| Intel Core i9-11900K | |
| Intel Core i5-12600K | |
| AMD Ryzen 9 5900X | |
| Intel Core i5-10600K | |
| AMD Ryzen 9 5950X | |
| AMD Ryzen 5 5600X | |
| AMD Ryzen 7 5800X | |
| Intel Core i9-12900K | |
| Intel Core i5-11600K | |
| WebXPRT 3 - Overall | |
| Intel Core i9-12900K | |
| AMD Ryzen 7 5800X | |
| Intel Core i5-12600K | |
| AMD Ryzen 9 5950X | |
| AMD Ryzen 5 5600X | |
| AMD Ryzen 9 5900X | |
| Intel Core i5-11600K | |
| Intel Core i9-10900K | |
| Intel Core i5-10600K | |
| Intel Core i9-11900K | |
| Mozilla Kraken 1.1 - Total | |
| Intel Core i5-10600K | |
| Intel Core i9-10900K | |
| Intel Core i5-11600K | |
| AMD Ryzen 5 5600X | |
| AMD Ryzen 9 5900X | |
| AMD Ryzen 7 5800X | |
| AMD Ryzen 9 5950X | |
| Intel Core i9-11900K | |
| Intel Core i5-12600K | |
| Intel Core i9-12900K | |
| 3DMark | |
| 3840x2160 Fire Strike Ultra Physics | |
| Intel Core i9-12900K | |
| AMD Ryzen 9 5950X | |
| AMD Ryzen 9 5900X | |
| AMD Ryzen 7 5800X | |
| Intel Core i5-12600K | |
| Intel Core i9-10900K | |
| Intel Core i9-11900K | |
| AMD Ryzen 5 5600X | |
| Intel Core i5-11600K | |
| Intel Core i5-10600K | |
| 1920x1080 Fire Strike Physics | |
| AMD Ryzen 9 5950X | |
| Intel Core i9-12900K | |
| AMD Ryzen 9 5900X | |
| AMD Ryzen 7 5800X | |
| Intel Core i9-10900K | |
| Intel Core i5-12600K | |
| Intel Core i9-11900K | |
| AMD Ryzen 5 5600X | |
| Intel Core i5-11600K | |
| Intel Core i5-10600K | |
| 2560x1440 Time Spy CPU | |
| Intel Core i9-12900K | |
| Intel Core i9-10900K | |
| Intel Core i5-12600K | |
| AMD Ryzen 9 5950X | |
| Intel Core i9-11900K | |
| AMD Ryzen 9 5900X | |
| AMD Ryzen 7 5800X | |
| Intel Core i5-11600K | |
| AMD Ryzen 5 5600X | |
| Intel Core i5-10600K | |
* ... Moindre est la valeur, meilleures sont les performances
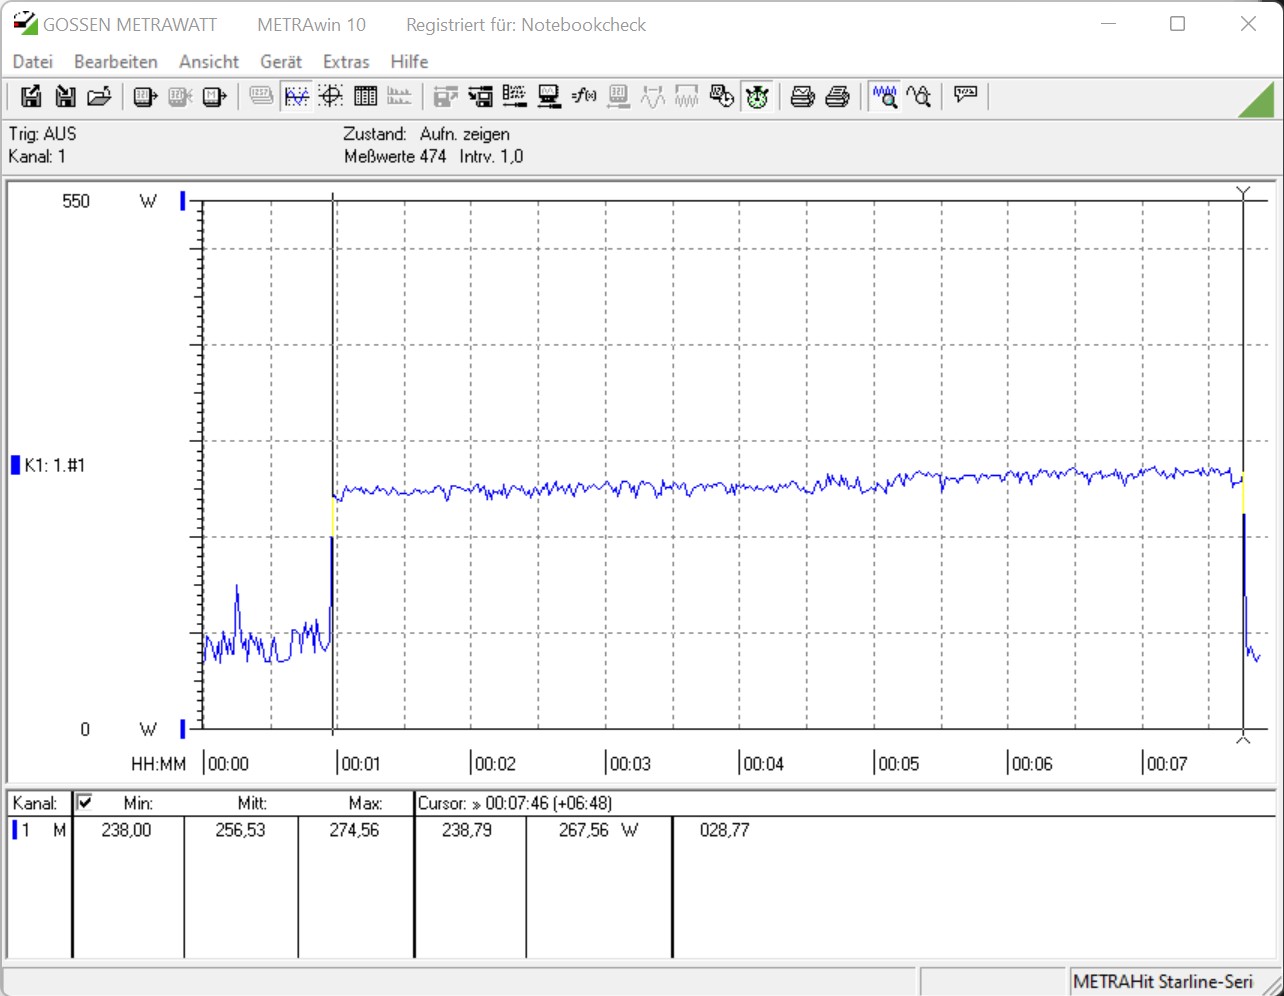
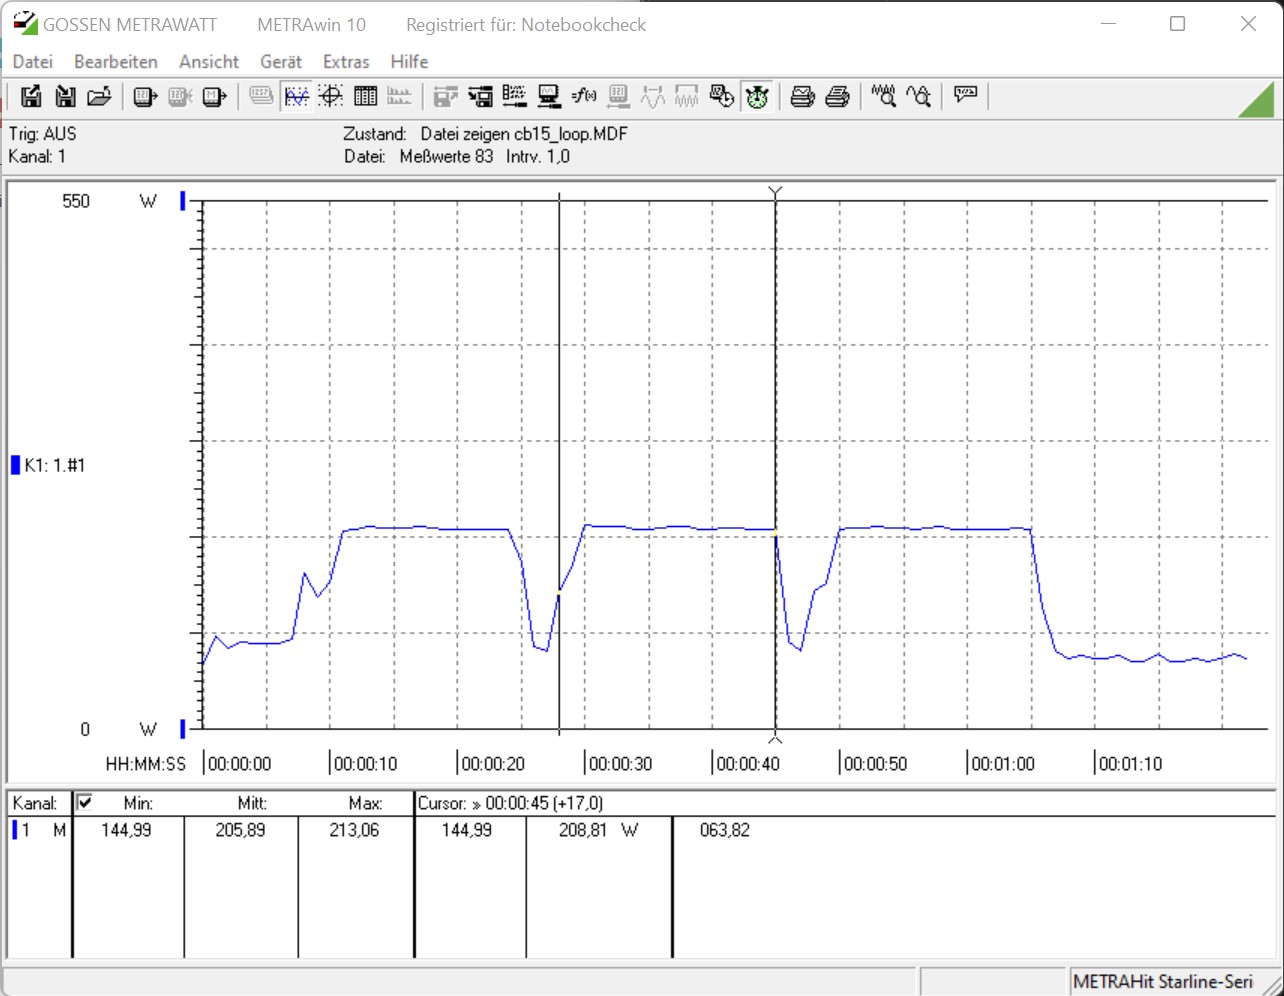
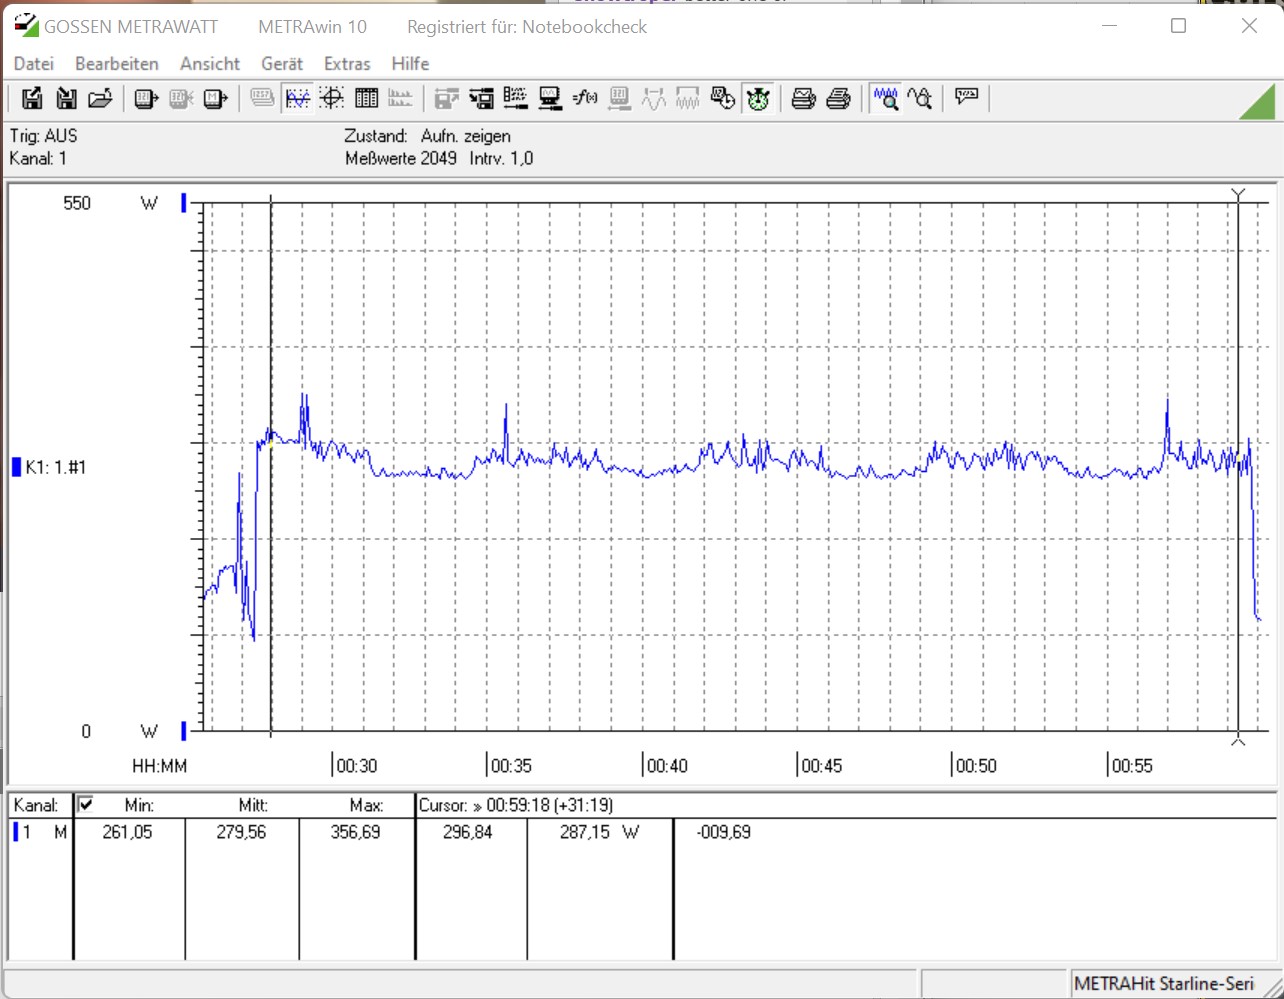
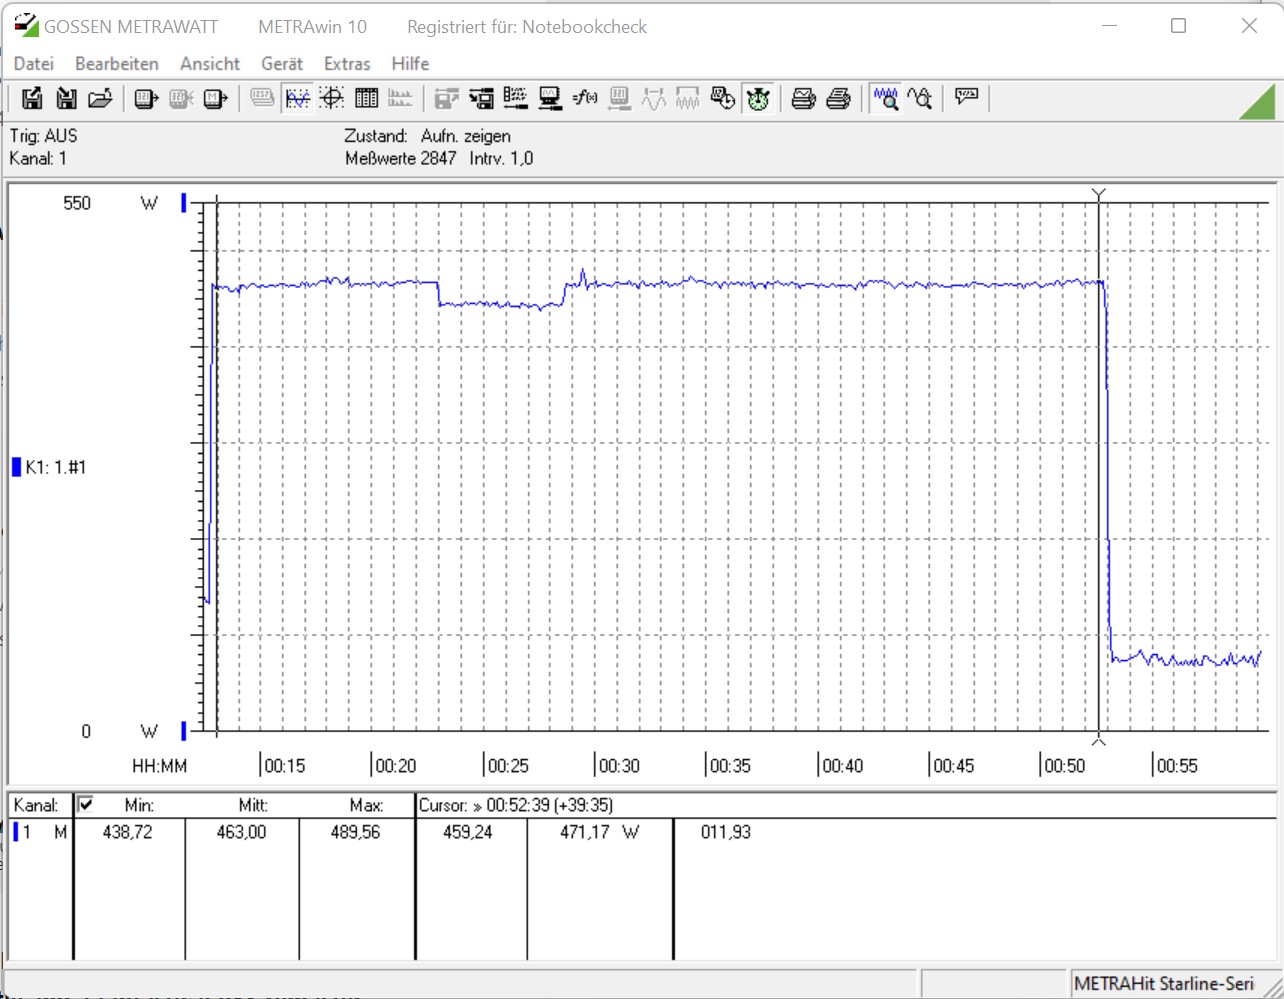
Alder Lake-S vs. Cinebench R15 Multi Loop
Nos deux unités de test montrent une performance très stable dans le test de charge. Par rapport auIntel Core i9-11900Kl'Intel Core i9-12900K est capable de se hisser à la première place de manière continue et sans aucune baisse de performance avec une moyenne de 3987 points. Le processeur Intel Core i5-12600K est également capable de se placer de manière stable devant leprédécesseurIntel Core i5-11600KRocket Lake-S avec un avantage significatif. Le nombre plus élevé de cœurs de calcul natifs assure globalement cette différence de performance
Bancs d'essai synthétiques et performances des applications
Dans les benchmarks synthétiques, les nouveaux processeurs Alder Lake-S sont en tête. À part quelques exceptions où AMD est censé offrir la meilleure plateforme, le Core i9-12900K d'Intel est capable d'obtenir un solide avantage. Il n'est donc pas étonnant que les deux processeurs Alder Lake-S se partagent les deux premières places dans les deux résultats cumulés des benchmarks. Cependant, nous avons tout de même été un peu surpris, car nous ne nous attendions pas à ce que l'Intel Core i5-12600K occupe la deuxième place du classement général.
| Performance rating - Percent | |
| Intel Core i9-12900K | |
| Intel Core i5-12600K | |
| AMD Ryzen 7 5800X | |
| AMD Ryzen 9 5950X | |
| AMD Ryzen 5 5600X | |
| AMD Ryzen 9 5900X | |
| Intel Core i9-11900K | |
| Intel Core i9-10900K | |
| Intel Core i5-11600K | |
| Intel Core i7-10700K | |
| Intel Core i5-10600K | |
| 3DMark | |
| 1920x1080 Fire Strike Physics | |
| AMD Ryzen 9 5950X | |
| Intel Core i9-12900K | |
| AMD Ryzen 9 5900X | |
| AMD Ryzen 7 5800X | |
| Intel Core i9-10900K | |
| Intel Core i5-12600K | |
| Intel Core i9-11900K | |
| AMD Ryzen 5 5600X | |
| Intel Core i7-10700K | |
| Intel Core i5-11600K | |
| Intel Core i5-10600K | |
| 1920x1080 Fire Strike Graphics | |
| Intel Core i5-12600K | |
| Intel Core i9-12900K | |
| Intel Core i7-10700K | |
| Intel Core i5-11600K | |
| AMD Ryzen 7 5800X | |
| Intel Core i9-10900K | |
| Intel Core i9-11900K | |
| AMD Ryzen 9 5950X | |
| AMD Ryzen 5 5600X | |
| Intel Core i5-10600K | |
| AMD Ryzen 9 5900X | |
| Fire Strike Extreme Graphics | |
| Intel Core i5-12600K | |
| Intel Core i9-12900K | |
| Intel Core i5-11600K | |
| AMD Ryzen 5 5600X | |
| Intel Core i7-10700K | |
| Intel Core i9-11900K | |
| AMD Ryzen 9 5950X | |
| AMD Ryzen 7 5800X | |
| Intel Core i9-10900K | |
| AMD Ryzen 9 5900X | |
| Intel Core i5-10600K | |
| 3840x2160 Fire Strike Ultra Graphics | |
| Intel Core i5-12600K | |
| Intel Core i9-12900K | |
| Intel Core i5-11600K | |
| Intel Core i9-11900K | |
| AMD Ryzen 7 5800X | |
| AMD Ryzen 5 5600X | |
| Intel Core i7-10700K | |
| AMD Ryzen 9 5950X | |
| Intel Core i9-10900K | |
| AMD Ryzen 9 5900X | |
| Intel Core i5-10600K | |
| 3DMark 11 | |
| 1280x720 Performance GPU | |
| Intel Core i7-10700K | |
| Intel Core i5-12600K | |
| Intel Core i9-10900K | |
| AMD Ryzen 9 5950X | |
| AMD Ryzen 7 5800X | |
| Intel Core i9-12900K | |
| AMD Ryzen 5 5600X | |
| Intel Core i9-11900K | |
| Intel Core i5-10600K | |
| Intel Core i5-11600K | |
| AMD Ryzen 9 5900X | |
| 1280x720 Performance Physics | |
| Intel Core i9-12900K | |
| AMD Ryzen 9 5950X | |
| Intel Core i5-12600K | |
| AMD Ryzen 9 5900X | |
| AMD Ryzen 7 5800X | |
| Intel Core i9-10900K | |
| Intel Core i9-11900K | |
| AMD Ryzen 5 5600X | |
| Intel Core i7-10700K | |
| Intel Core i5-11600K | |
| Intel Core i5-10600K | |
| PCMark 10 - Score | |
| AMD Ryzen 9 5950X | |
| Intel Core i9-12900K | |
| AMD Ryzen 9 5900X | |
| AMD Ryzen 5 5600X | |
| Intel Core i5-12600K | |
| AMD Ryzen 7 5800X | |
| Intel Core i9-11900K | |
| Intel Core i5-11600K | |
| Intel Core i9-10900K | |
| Intel Core i7-10700K | |
| Intel Core i5-10600K | |
Bancs d'essai pour les jeux
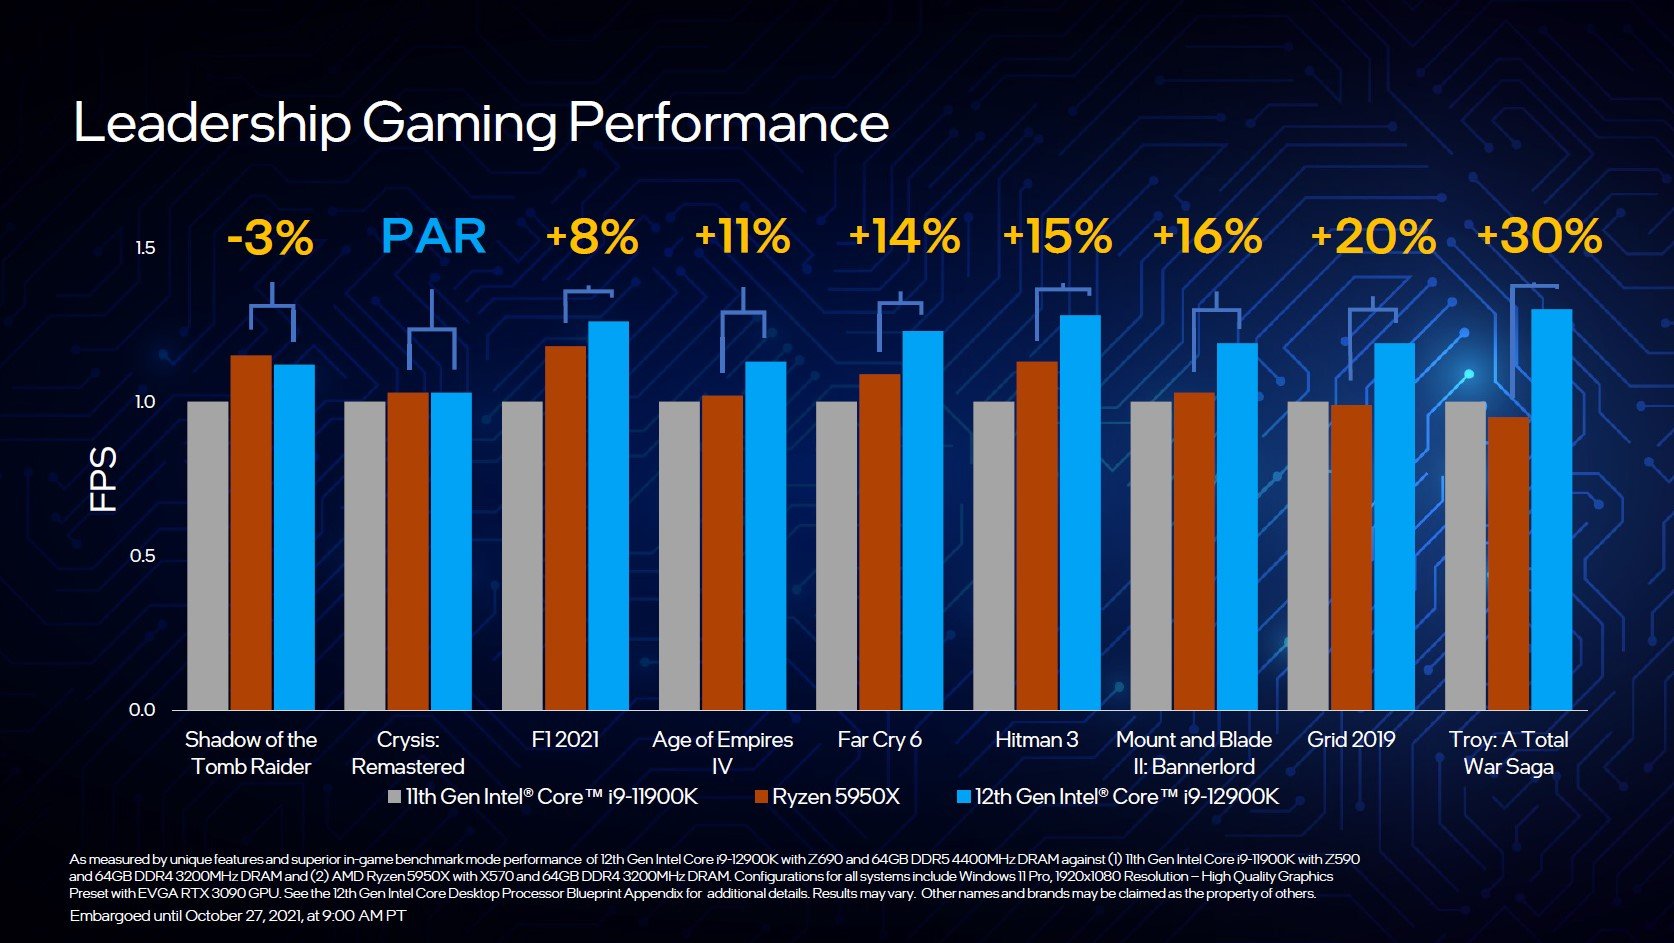
Nous arrivons maintenant aux benchmarks les plus intéressants et à la discipline où les nouveaux processeurs Intel Alder Lake-S peuvent vraiment montrer leurs capacités. Par rapport à Rocket Lake-S, les nouveaux processeurs sont capables d'augmenter leurs performances de manière significative, comme vous pouvez le constater dans les benchmarks de jeux. Dans la comparaison cumulative des neuf jeux, l'Intel Core i9-12900K est capable de devancer de peu l AMD Ryzen 9 5900X. Il faut également savoir que certains jeux s'harmonisent mieux avec les processeurs Intel et d'autres offrent de meilleures performances avec les processeurs AMD. Dans la compétition interne des deux processeurs Alder Lake-S, l'Intel Core i5-12600K perd 8 points de pourcentage par rapport au vaisseau amiral, pour finir à peine devant le Intel Core i5-11600Kavec cela.
Néanmoins, les deux processeurs offrent une très bonne performance de jeu. En raison des nombreuses modifications apportées à la plate-forme et au système d'exploitation, nous pourrions également nous attendre à d'autres améliorations des performances sous forme de mises à jour à l'avenir. La performance dans la limite de l'unité centrale pure est très élevée et, selon le jeu, elle est aussi nettement supérieure à celle des concurrents. Cependant, il faut noter que bien qu'Intel ait le processeur de jeu le plus rapide dans son portefeuille, la distance avec le processeur Zen3 ne peut pas être qualifiée d'exceptionnelle. En outre, tous les concurrents se rapprochent avec l'augmentation de la résolution, de sorte que le CPU ne joue que le second rôle derrière le GPU comme facteur déterminant pour l'augmentation des FPS. Ceux qui diffusent du contenu en streaming en plus des jeux proprement dits profiteront du nombre plus élevé de threads, ce qui rendra également les nouveaux modèles très intéressants pour les créateurs de contenu.
| Performance rating - Percent | |
| Intel Core i9-12900K | |
| AMD Ryzen 9 5900X -2! | |
| AMD Ryzen 7 5800X -2! | |
| AMD Ryzen 9 5950X -2! | |
| AMD Ryzen 5 5600X -2! | |
| Intel Core i9-11900K | |
| Intel Core i5-12600K | |
| Intel Core i5-11600K | |
| Intel Core i9-10900K | |
| Intel Core i7-10700K -4! | |
| Intel Core i5-10600K | |
| Borderlands 3 | |
| 1280x720 Very Low Overall Quality (DX11) | |
| AMD Ryzen 9 5900X | |
| AMD Ryzen 7 5800X | |
| AMD Ryzen 9 5950X | |
| AMD Ryzen 5 5600X | |
| Intel Core i9-12900K | |
| Intel Core i9-11900K | |
| Intel Core i9-10900K | |
| Intel Core i5-11600K | |
| Intel Core i7-10700K | |
| Intel Core i5-12600K | |
| Intel Core i5-10600K | |
| 1920x1080 Badass Overall Quality (DX11) | |
| Intel Core i9-12900K | |
| Intel Core i5-12600K | |
| AMD Ryzen 9 5900X | |
| Intel Core i9-11900K | |
| Intel Core i9-10900K | |
| Intel Core i7-10700K | |
| AMD Ryzen 9 5950X | |
| Intel Core i5-11600K | |
| AMD Ryzen 7 5800X | |
| AMD Ryzen 5 5600X | |
| Intel Core i5-10600K | |
| Far Cry New Dawn | |
| 1280x720 Low Preset | |
| Intel Core i9-12900K | |
| Intel Core i9-11900K | |
| AMD Ryzen 9 5900X | |
| Intel Core i5-12600K | |
| Intel Core i5-11600K | |
| AMD Ryzen 7 5800X | |
| AMD Ryzen 9 5950X | |
| Intel Core i7-10700K | |
| AMD Ryzen 5 5600X | |
| Intel Core i9-10900K | |
| Intel Core i5-10600K | |
| 1920x1080 Ultra Preset | |
| Intel Core i9-12900K | |
| Intel Core i9-11900K | |
| AMD Ryzen 9 5900X | |
| Intel Core i5-11600K | |
| Intel Core i7-10700K | |
| Intel Core i5-12600K | |
| AMD Ryzen 7 5800X | |
| AMD Ryzen 9 5950X | |
| AMD Ryzen 5 5600X | |
| Intel Core i5-10600K | |
| Intel Core i9-10900K | |
| Forza Horizon 4 | |
| 1280x720 Very Low Preset | |
| Intel Core i9-12900K | |
| Intel Core i5-12600K | |
| Intel Core i9-11900K | |
| Intel Core i9-10900K | |
| Intel Core i5-11600K | |
| Intel Core i5-10600K | |
| 1920x1080 Ultra Preset AA:2xMS | |
| Intel Core i9-10900K | |
| Intel Core i9-11900K | |
| Intel Core i5-11600K | |
| Intel Core i5-10600K | |
| Intel Core i9-12900K | |
| Intel Core i5-12600K | |
| Far Cry 5 | |
| 1280x720 Low Preset AA:T | |
| Intel Core i9-12900K | |
| AMD Ryzen 9 5900X | |
| Intel Core i9-11900K | |
| AMD Ryzen 7 5800X | |
| AMD Ryzen 9 5950X | |
| AMD Ryzen 5 5600X | |
| Intel Core i5-12600K | |
| Intel Core i5-11600K | |
| Intel Core i9-10900K | |
| Intel Core i7-10700K | |
| Intel Core i5-10600K | |
| 1920x1080 Ultra Preset AA:T | |
| Intel Core i9-12900K | |
| Intel Core i9-11900K | |
| AMD Ryzen 9 5900X | |
| AMD Ryzen 7 5800X | |
| Intel Core i5-11600K | |
| AMD Ryzen 9 5950X | |
| Intel Core i5-12600K | |
| AMD Ryzen 5 5600X | |
| Intel Core i7-10700K | |
| Intel Core i9-10900K | |
| Intel Core i5-10600K | |
| X-Plane 11.11 | |
| 1280x720 low (fps_test=1) | |
| Intel Core i9-12900K | |
| AMD Ryzen 7 5800X | |
| AMD Ryzen 9 5900X | |
| AMD Ryzen 5 5600X | |
| Intel Core i5-12600K | |
| Intel Core i9-11900K | |
| AMD Ryzen 9 5950X | |
| Intel Core i5-11600K | |
| Intel Core i9-10900K | |
| Intel Core i7-10700K | |
| Intel Core i5-10600K | |
| 1920x1080 high (fps_test=3) | |
| Intel Core i9-12900K | |
| AMD Ryzen 9 5900X | |
| AMD Ryzen 7 5800X | |
| Intel Core i9-11900K | |
| AMD Ryzen 5 5600X | |
| Intel Core i5-12600K | |
| AMD Ryzen 9 5950X | |
| Intel Core i5-11600K | |
| Intel Core i9-10900K | |
| Intel Core i7-10700K | |
| Intel Core i5-10600K | |
| Final Fantasy XV Benchmark | |
| 1280x720 Lite Quality | |
| Intel Core i9-12900K | |
| AMD Ryzen 9 5900X | |
| AMD Ryzen 7 5800X | |
| AMD Ryzen 9 5950X | |
| AMD Ryzen 5 5600X | |
| Intel Core i9-10900K | |
| Intel Core i9-11900K | |
| Intel Core i5-12600K | |
| Intel Core i5-11600K | |
| Intel Core i5-10600K | |
| Intel Core i7-10700K | |
| 1920x1080 High Quality | |
| Intel Core i9-12900K | |
| Intel Core i9-11900K | |
| Intel Core i9-10900K | |
| AMD Ryzen 9 5950X | |
| Intel Core i5-11600K | |
| Intel Core i5-12600K | |
| Intel Core i5-10600K | |
| AMD Ryzen 7 5800X | |
| AMD Ryzen 9 5900X | |
| AMD Ryzen 5 5600X | |
| Intel Core i7-10700K | |
| Dota 2 Reborn | |
| 1280x720 min (0/3) fastest | |
| AMD Ryzen 7 5800X | |
| AMD Ryzen 9 5900X | |
| AMD Ryzen 5 5600X | |
| AMD Ryzen 9 5950X | |
| Intel Core i9-12900K | |
| Intel Core i9-10900K | |
| Intel Core i9-11900K | |
| Intel Core i7-10700K | |
| Intel Core i5-11600K | |
| Intel Core i5-12600K | |
| Intel Core i5-10600K | |
| 1920x1080 ultra (3/3) best looking | |
| Intel Core i9-12900K | |
| AMD Ryzen 7 5800X | |
| AMD Ryzen 9 5900X | |
| AMD Ryzen 5 5600X | |
| AMD Ryzen 9 5950X | |
| Intel Core i5-12600K | |
| Intel Core i9-10900K | |
| Intel Core i9-11900K | |
| Intel Core i5-11600K | |
| Intel Core i7-10700K | |
| Intel Core i5-10600K | |
| The Witcher 3 | |
| 1024x768 Low Graphics & Postprocessing | |
| AMD Ryzen 9 5900X | |
| AMD Ryzen 7 5800X | |
| AMD Ryzen 9 5950X | |
| Intel Core i9-12900K | |
| AMD Ryzen 5 5600X | |
| Intel Core i9-10900K | |
| Intel Core i9-11900K | |
| Intel Core i5-12600K | |
| Intel Core i7-10700K | |
| Intel Core i5-11600K | |
| Intel Core i5-10600K | |
| 1920x1080 Ultra Graphics & Postprocessing (HBAO+) | |
| Intel Core i5-11600K | |
| Intel Core i5-12600K | |
| Intel Core i7-10700K | |
| AMD Ryzen 9 5900X | |
| AMD Ryzen 9 5950X | |
| Intel Core i5-10600K | |
| Intel Core i9-11900K | |
| Intel Core i9-10900K | |
| AMD Ryzen 7 5800X | |
| AMD Ryzen 5 5600X | |
| Intel Core i9-12900K | |
| Shadow of the Tomb Raider | |
| 1280x720 Lowest Preset | |
| AMD Ryzen 7 5800X | |
| AMD Ryzen 9 5950X | |
| AMD Ryzen 9 5900X | |
| Intel Core i9-12900K | |
| AMD Ryzen 5 5600X | |
| Intel Core i9-10900K | |
| Intel Core i9-11900K | |
| Intel Core i5-12600K | |
| Intel Core i5-11600K | |
| Intel Core i5-10600K | |
| 1920x1080 Highest Preset AA:T | |
| AMD Ryzen 7 5800X | |
| Intel Core i9-12900K | |
| Intel Core i9-11900K | |
| AMD Ryzen 9 5950X | |
| AMD Ryzen 9 5900X | |
| Intel Core i9-10900K | |
| AMD Ryzen 5 5600X | |
| Intel Core i5-12600K | |
| Intel Core i5-11600K | |
| Intel Core i5-10600K | |
Intel Core i9-12900K + Nvidia Titan RTX
| Bas | Moyen | Élevé | Ultra | QHD | 4K | |
|---|---|---|---|---|---|---|
| GTA V (2015) | 187 | 187 | 185 | 135 | 123 | 138 |
| The Witcher 3 (2015) | 589 | 422 | 271 | 139 | 103 | |
| Dota 2 Reborn (2015) | 203.5 | 208.7 | 201.7 | 189.7 | 178.9 | |
| Final Fantasy XV Benchmark (2018) | 227 | 195 | 144 | 108 | 64.1 | |
| X-Plane 11.11 (2018) | 200 | 176 | 137 | 117 | ||
| Far Cry 5 (2018) | 220 | 191 | 178 | 167 | 145 | 83 |
| Strange Brigade (2018) | 593 | 371 | 308 | 266 | 197 | 115 |
| Shadow of the Tomb Raider (2018) | 221 | 192 | 183 | 169 | 124 | 69.3 |
| Forza Horizon 4 (2018) | 293 | 227 | 216 | 178 | 153 | 111 |
| Far Cry New Dawn (2019) | 188 | 162 | 154 | 140 | 129 | 84 |
| Borderlands 3 (2019) | 202 | 172 | 147 | 124 | 89.9 | 49.2 |
| F1 2020 (2020) | 432 | 343 | 303 | 213 | 167 | 101 |
| F1 2021 (2021) | 491 | 383 | 307 | 160 | 121 | 71.9 |
| Far Cry 6 (2021) | 185 | 157 | 142 | 134 | 109 | 64 |
Intel Core i5-12600K + Nvidia Titan RTX
| Bas | Moyen | Élevé | Ultra | QHD | 4K | |
|---|---|---|---|---|---|---|
| GTA V (2015) | 186 | 185 | 181 | 124 | 115 | 136 |
| The Witcher 3 (2015) | 500 | 406 | 277 | 144 | 107 | |
| Dota 2 Reborn (2015) | 183.7 | 188 | 181.1 | 174.9 | 165.8 | |
| Final Fantasy XV Benchmark (2018) | 218 | 192 | 141 | 107 | 63.6 | |
| X-Plane 11.11 (2018) | 172 | 153 | 119 | 104 | ||
| Far Cry 5 (2018) | 200 | 174 | 165 | 154 | 140 | 81 |
| Strange Brigade (2018) | 489 | 352 | 301 | 262 | 196 | 114 |
| Shadow of the Tomb Raider (2018) | 195 | 176 | 172 | 163 | 124 | 70.1 |
| Forza Horizon 4 (2018) | 263 | 218 | 212 | 178 | 154 | 112 |
| Far Cry New Dawn (2019) | 171 | 147 | 141 | 126 | 121 | 84 |
| Metro Exodus (2019) | 227 | 174 | 135 | 108 | 87.7 | 56.6 |
| Borderlands 3 (2019) | 175 | 155 | 138 | 119 | 90.4 | 49.8 |
| F1 2020 (2020) | 340 | 291 | 288 | 216 | 168 | 103 |
| F1 2021 (2021) | 407 | 367 | 302 | 160 | 122 | 72.6 |
| Far Cry 6 (2021) | 164 | 136 | 129 | 124 | 105 | 64 |
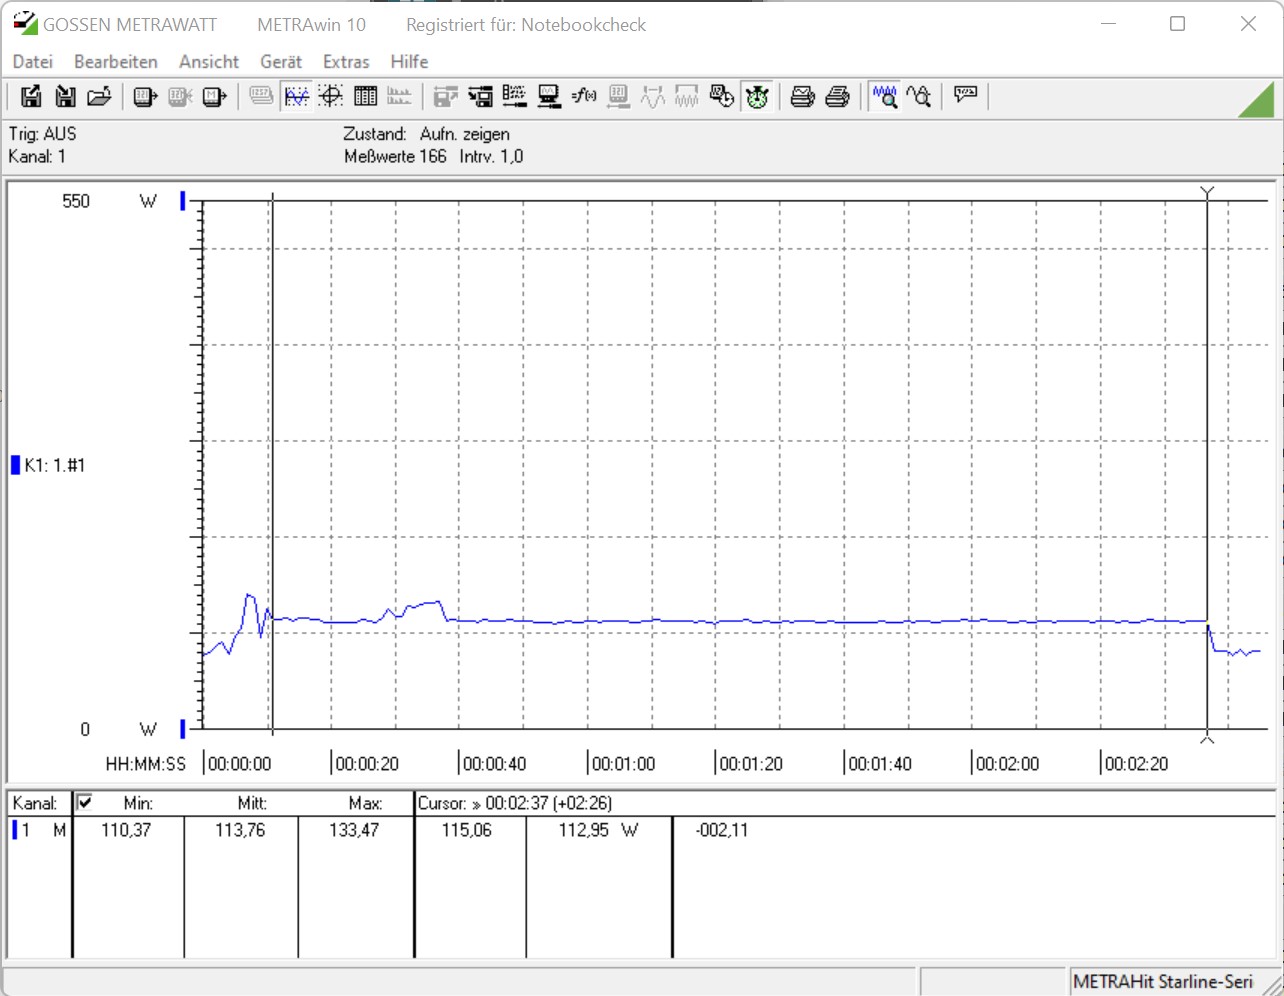
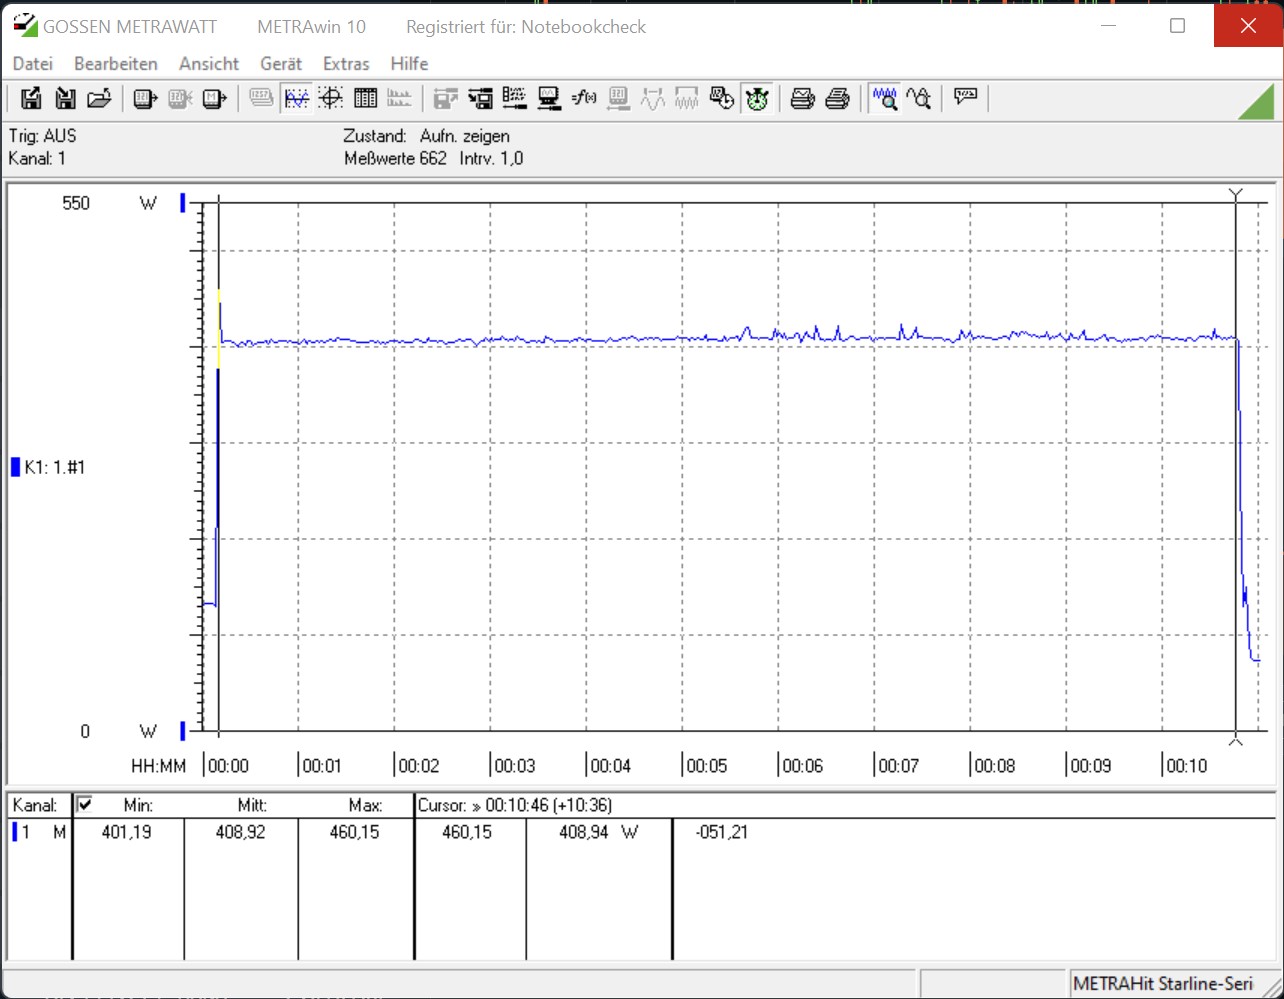
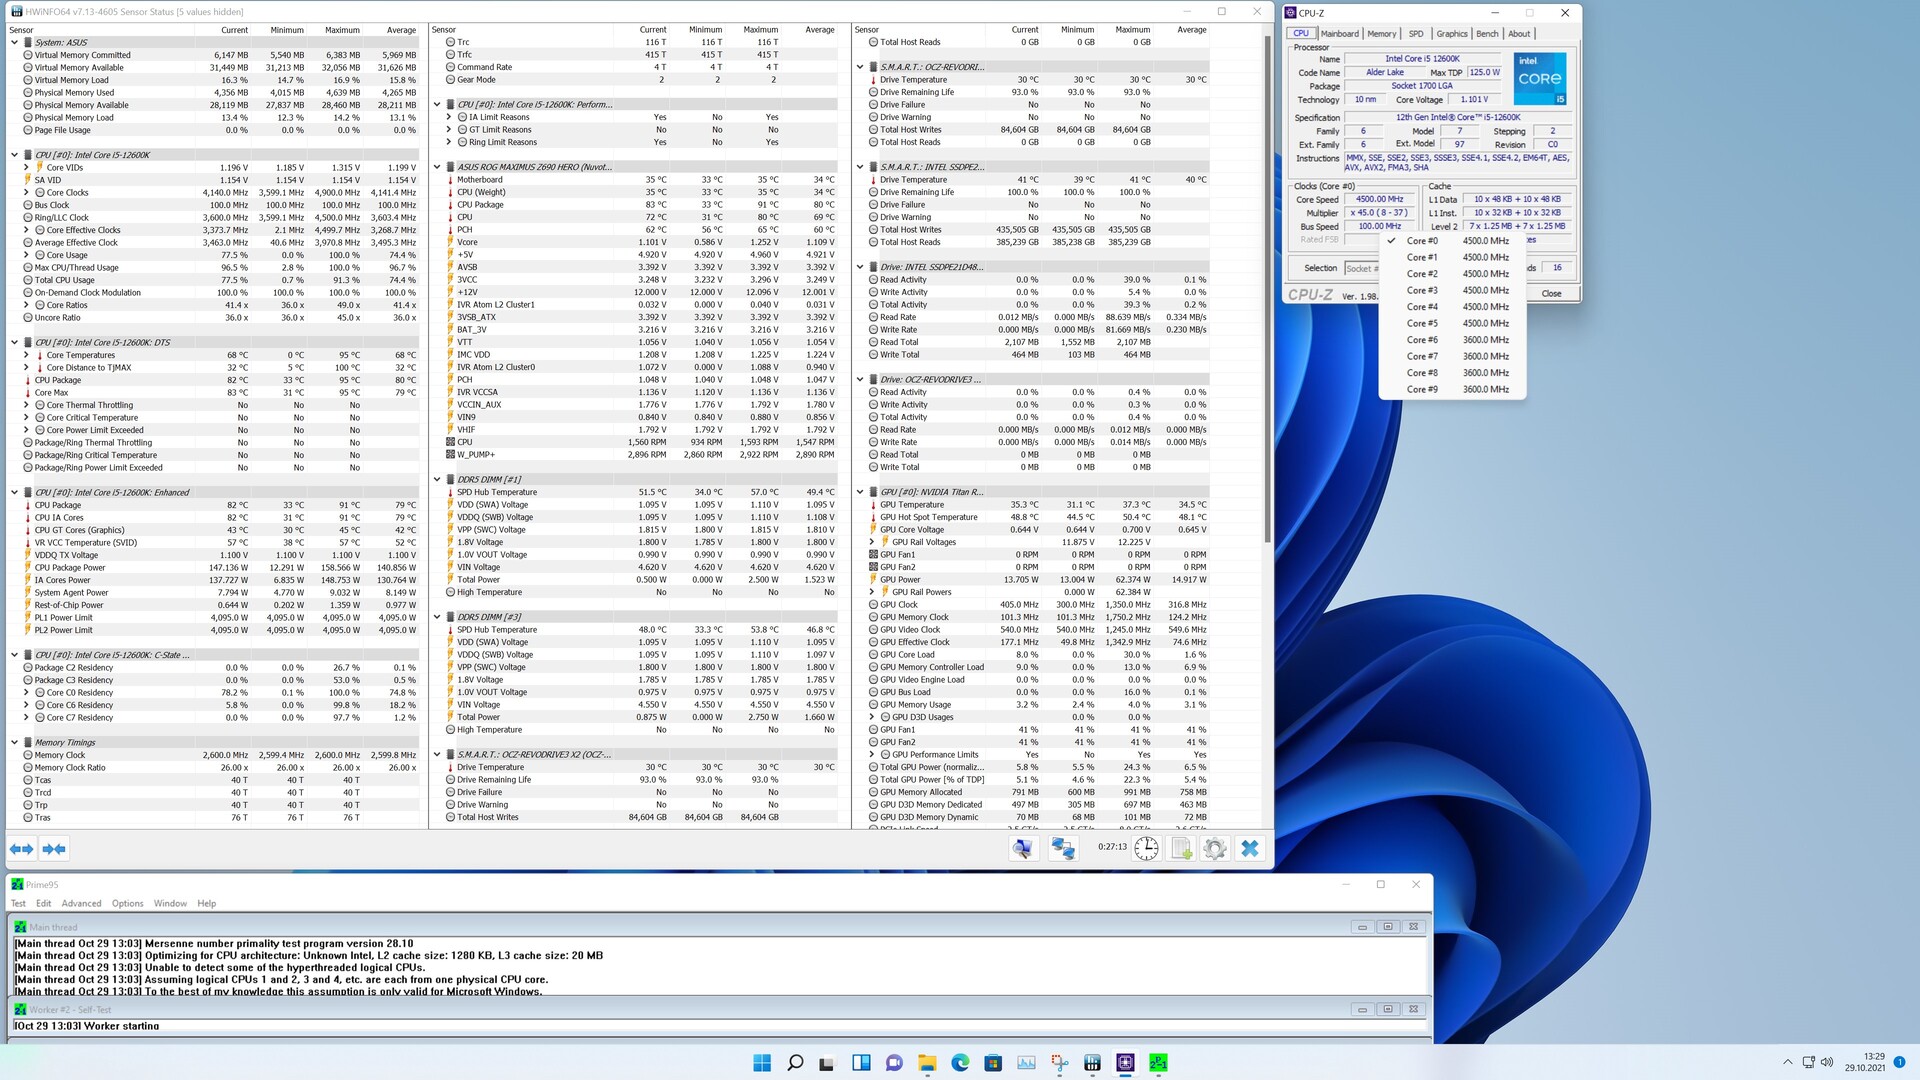
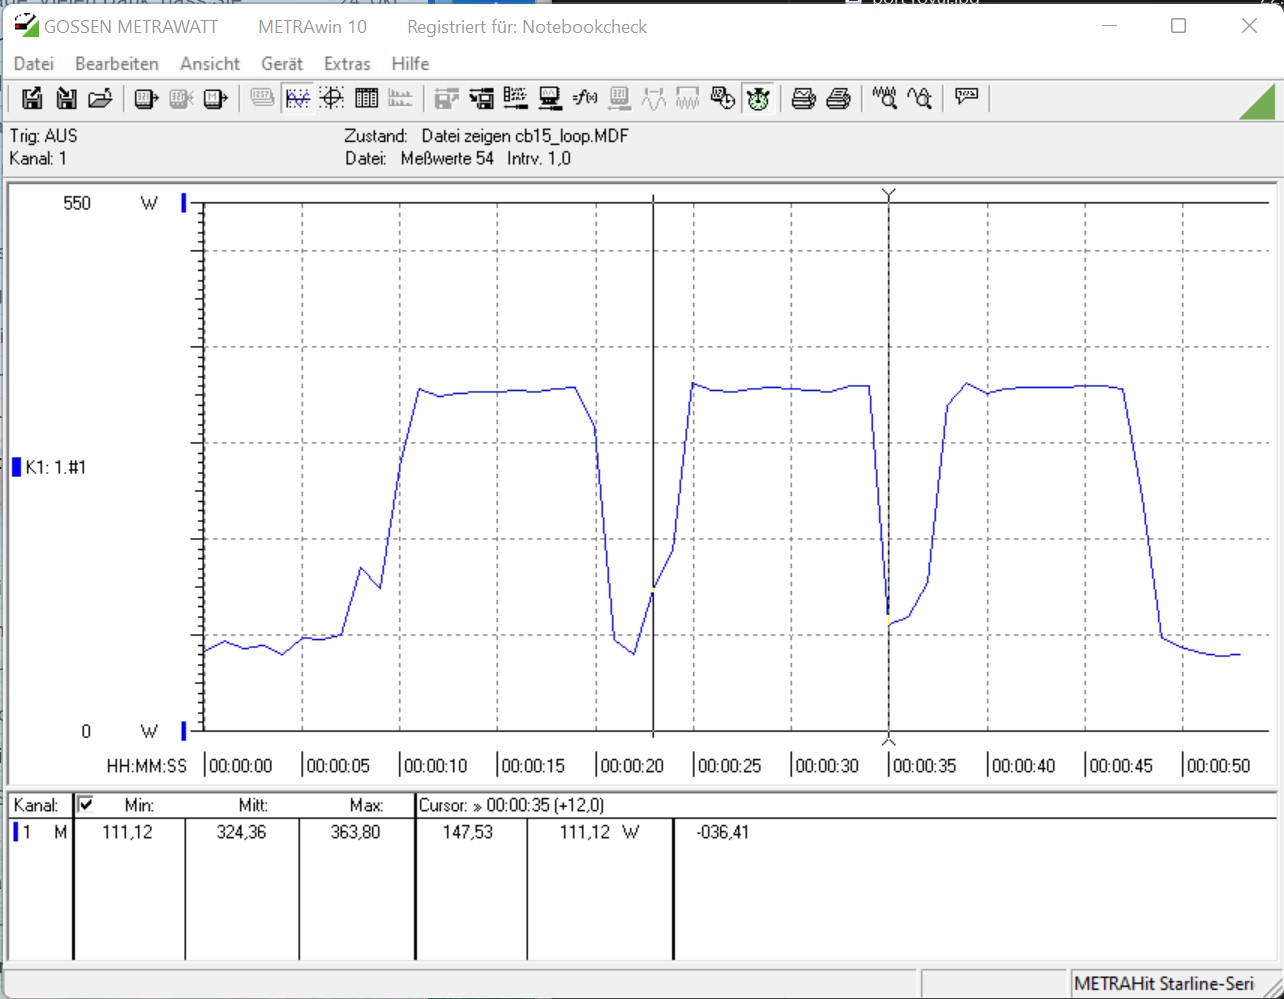
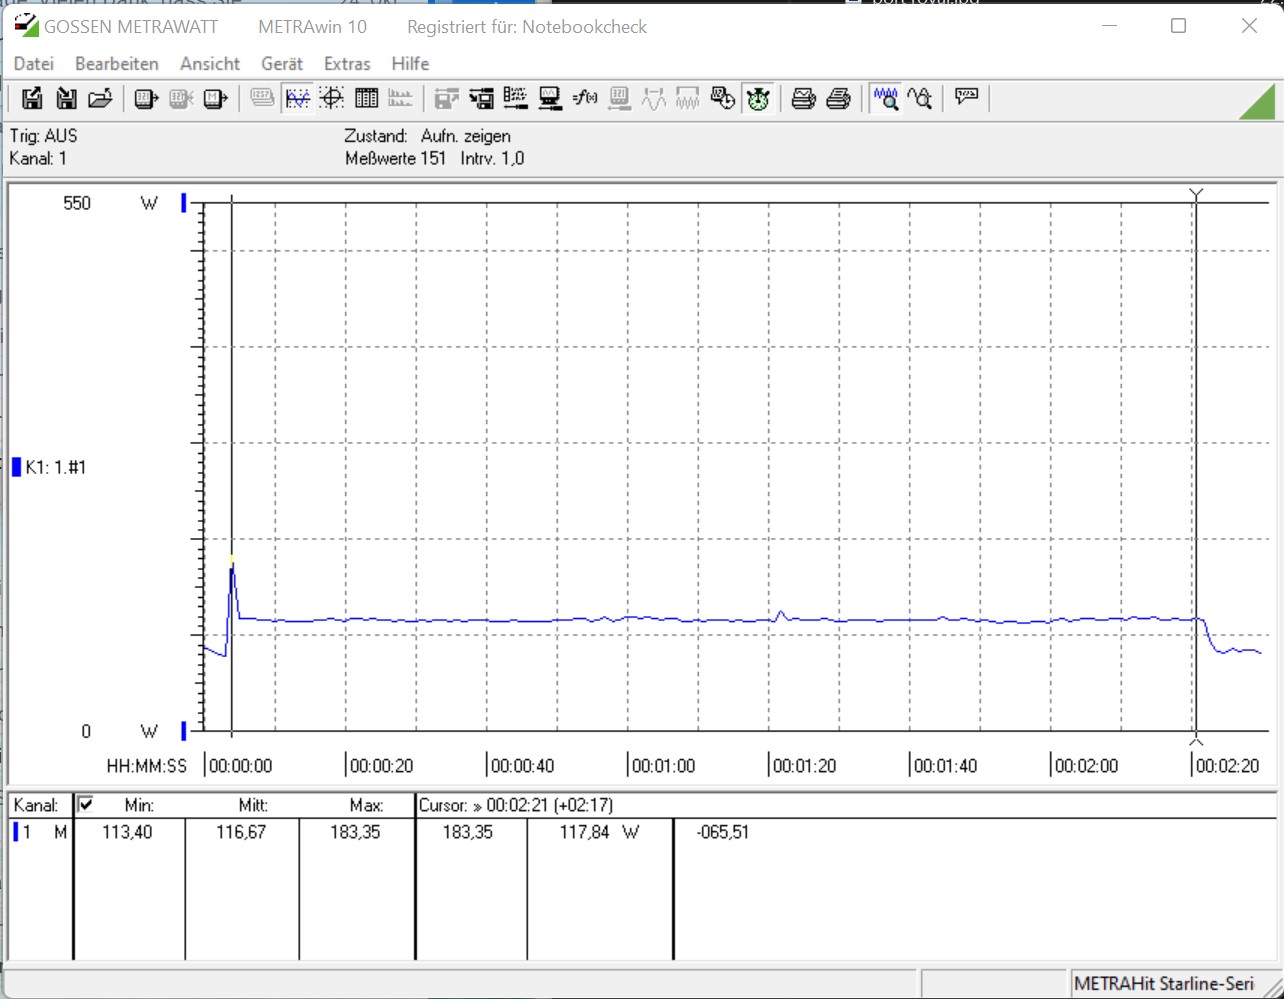
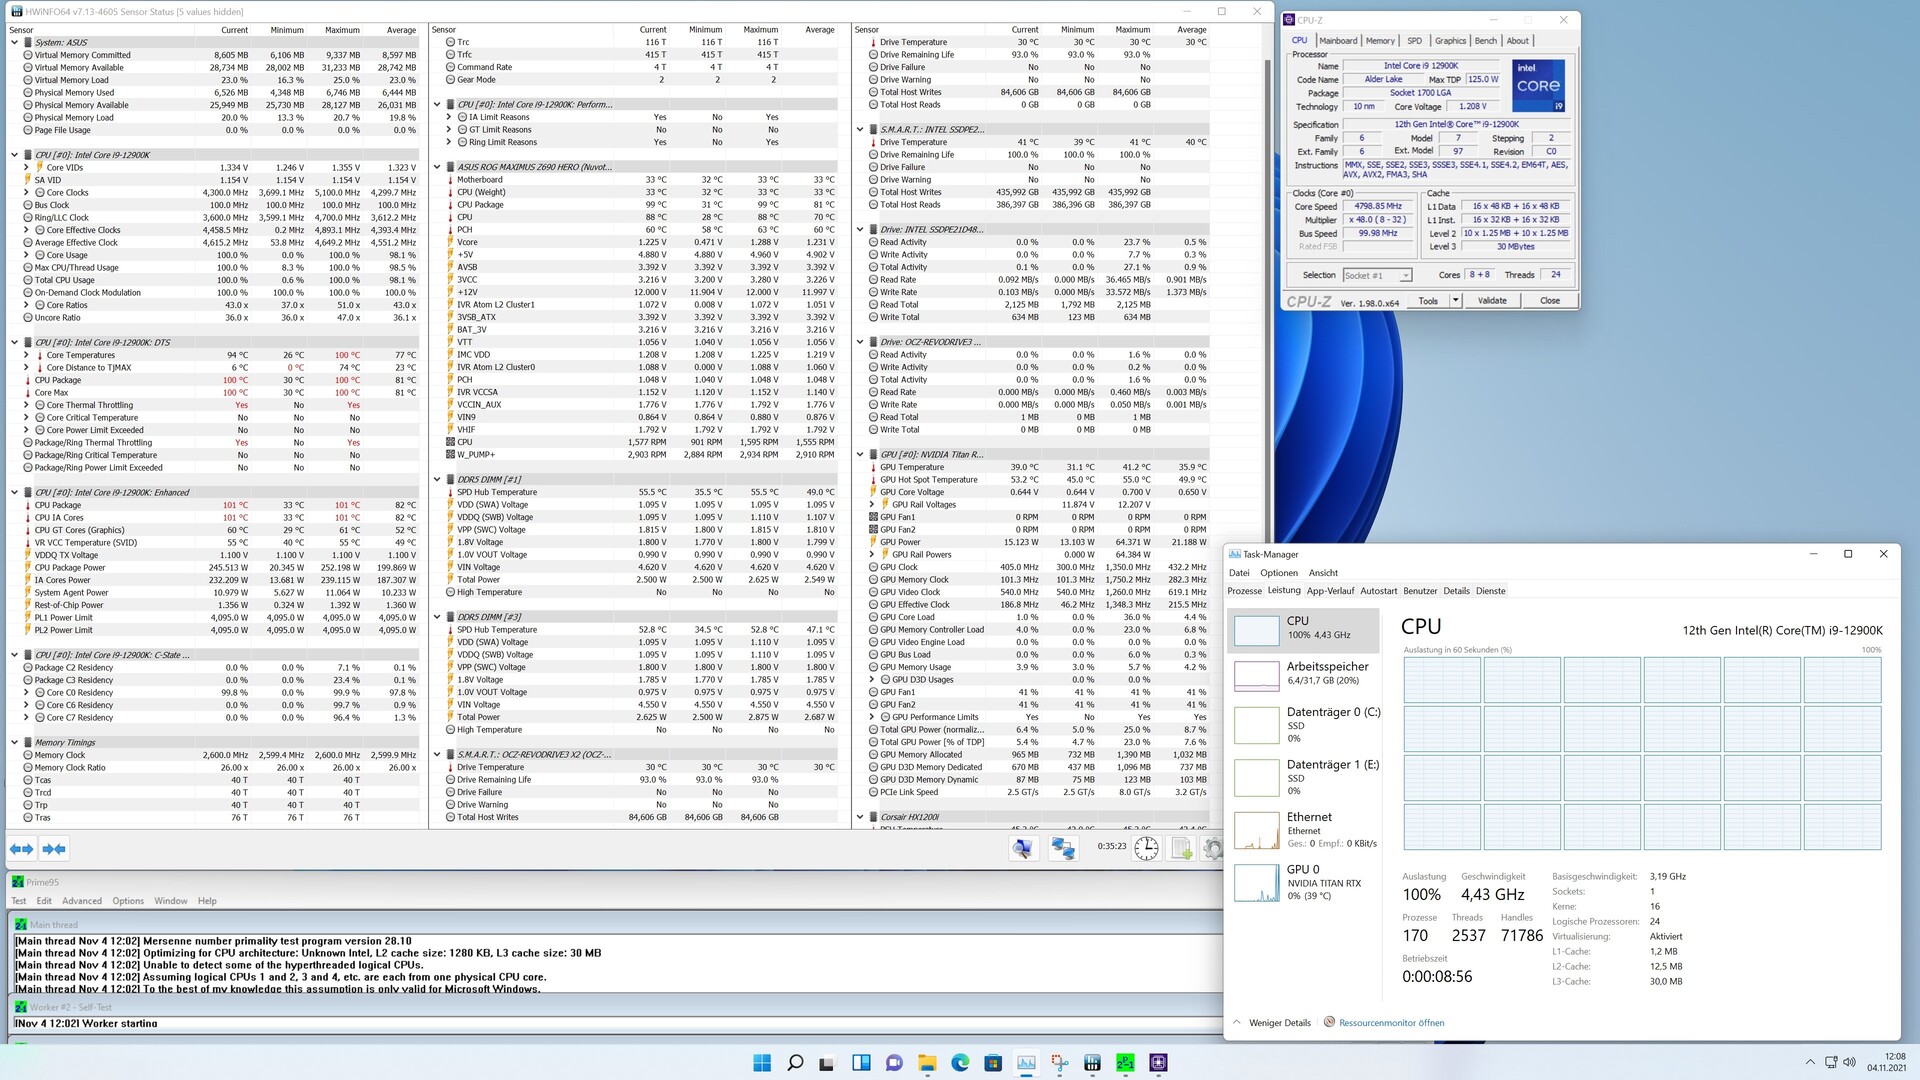
Consommation d'énergie et températures
Selon les spécifications techniques, les processeurs offrent un TDP de 125 watts. Il s'agit de la valeur PL1. La valeur PL2 indique la quantité de watts dont dispose le processeur à pleine charge si toutes les exigences sont remplies. Avec un maximum de 241 watts, l'Intel Core i9-12900K est légèrement plus efficace que le Intel Core i9-11900K. Dans notre test, le fleuron d'Alder Lake-S n'était en effet que plus efficaceque son prédécesseur dans le test de stress Prime95. Toutefois, nos mesures ont encore montré un peu moins de 280 watts pour l'ensemble du système. Dans le test Cinebench R15 Multi, notre système de test a consommé presque 25 % d'énergie en plus. Il s'agit d'une augmentation qui ne peut pas être simplement rejetée. Sur l'Intel Core i5-12600K, la valeur PL2 est limitée à 150 watts, ce qui se reflète également dans nos résultats de mesure. Par rapport à l Intel Core i5-11600Kl'Intel Core i5-12600K est 7 % plus efficace, mais l'image change lors du test de stress, et l'Intel Core i5-12600K tire 13 % plus d'énergie de la prise. Les valeurs mesurées pendant les jeux sont bien sûr augmentées par la Nvidia Titan RTX. Cependant, nous pouvons également constater ici que la plateforme Alder Lake-S n'invite pas à l'économie d'énergie.
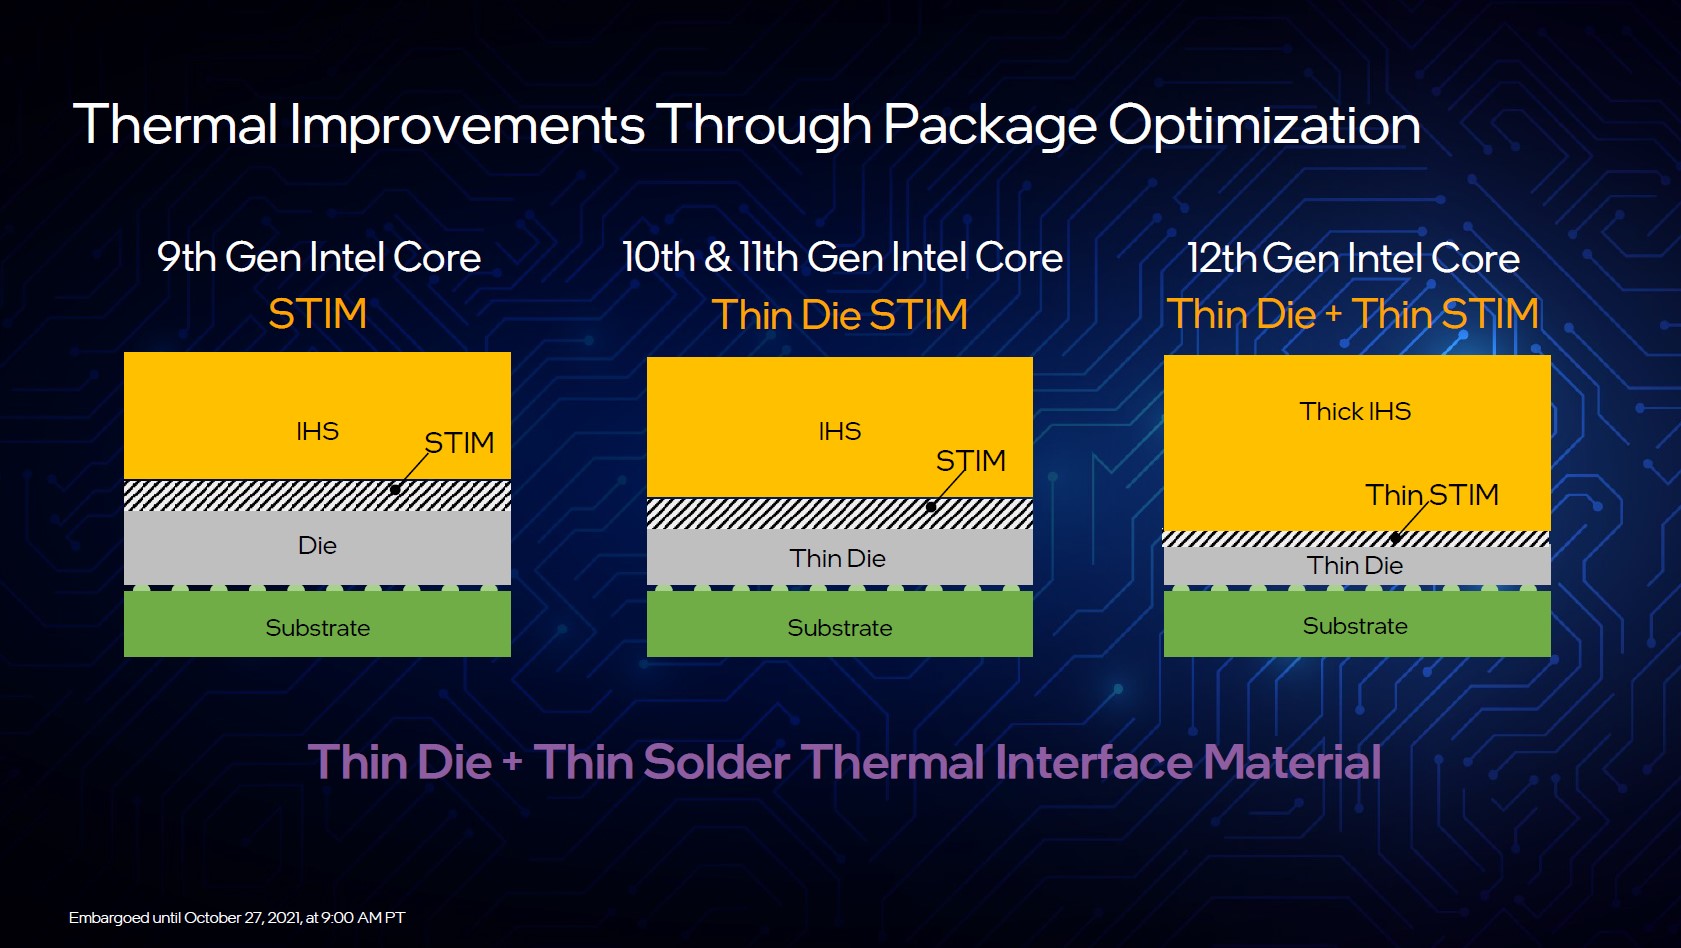
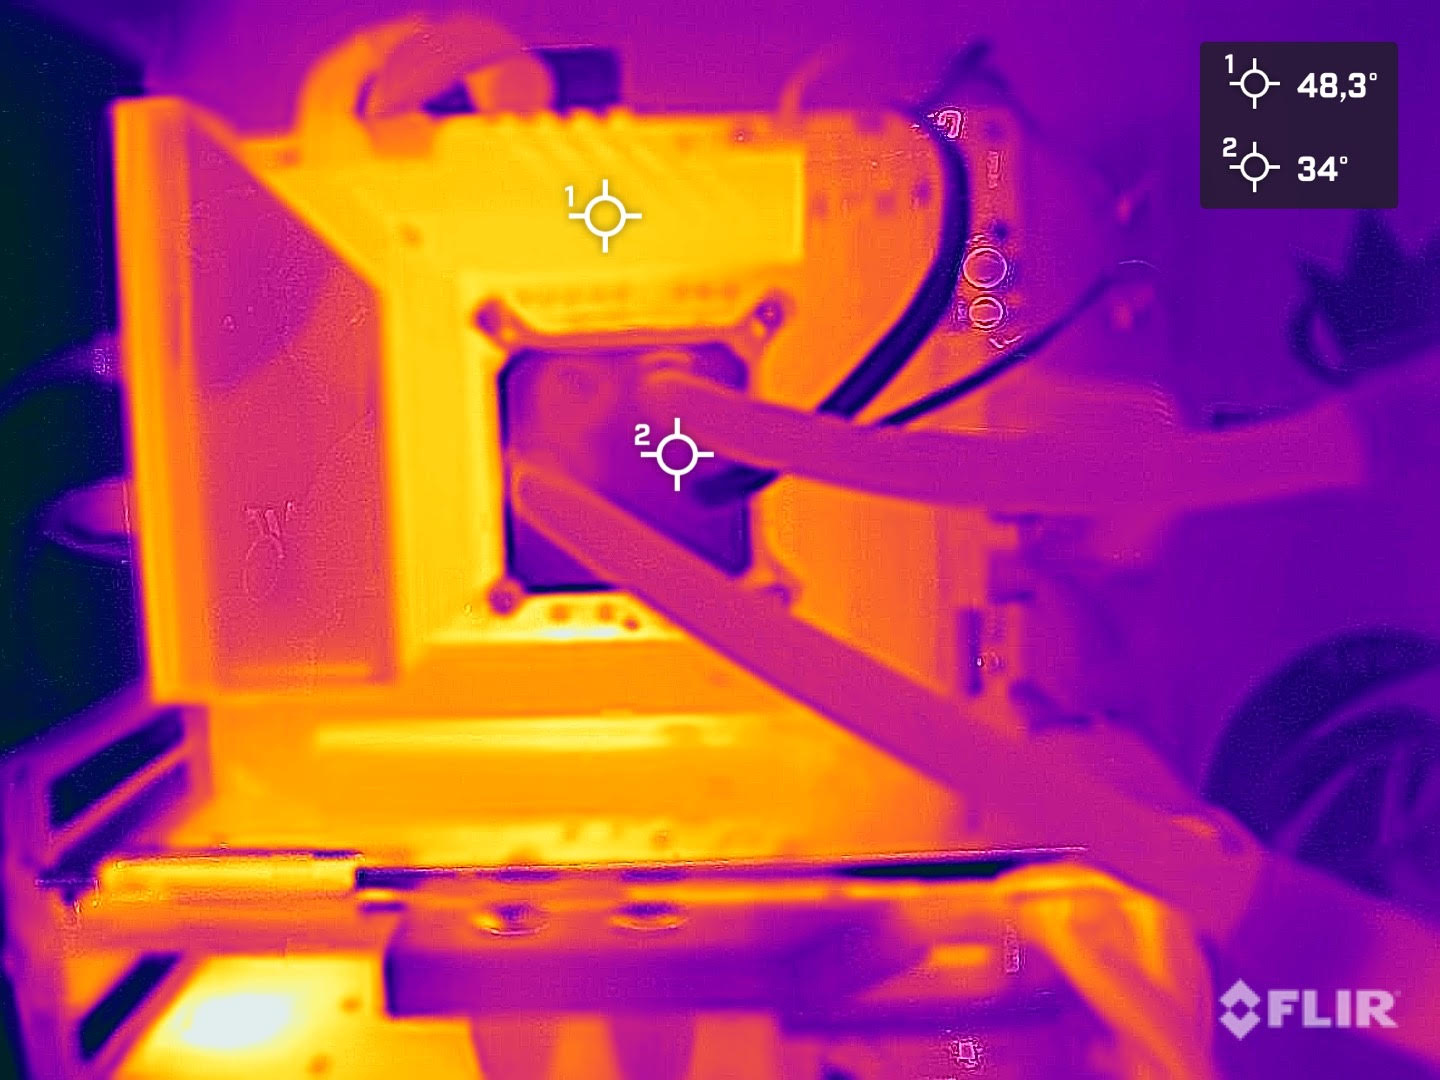
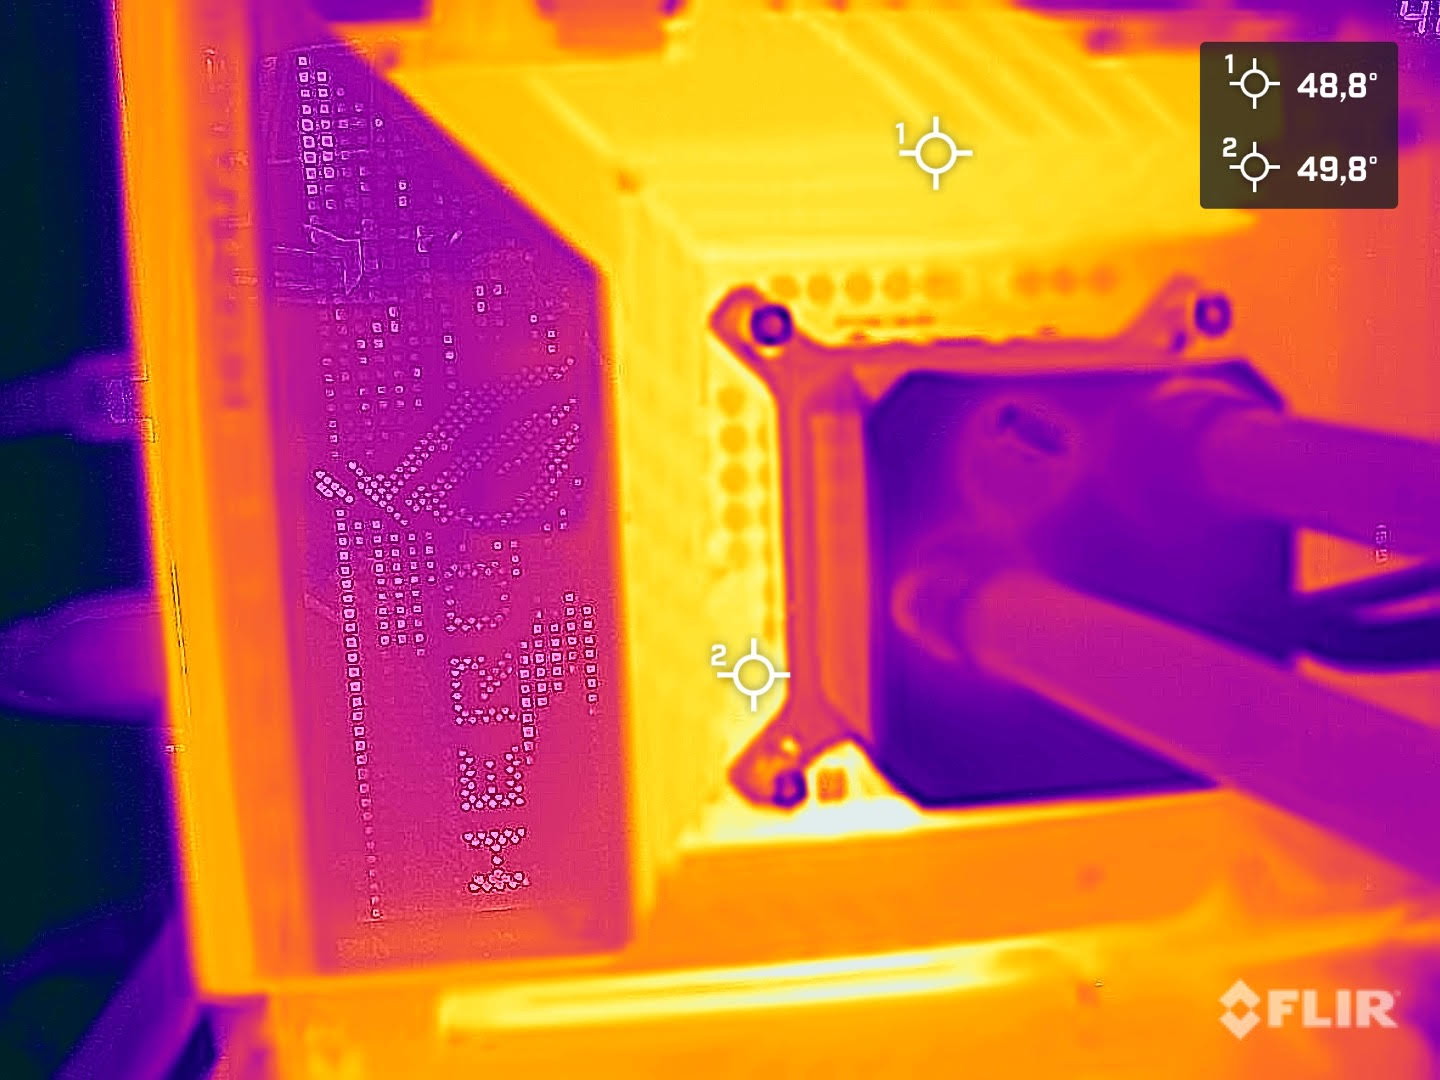
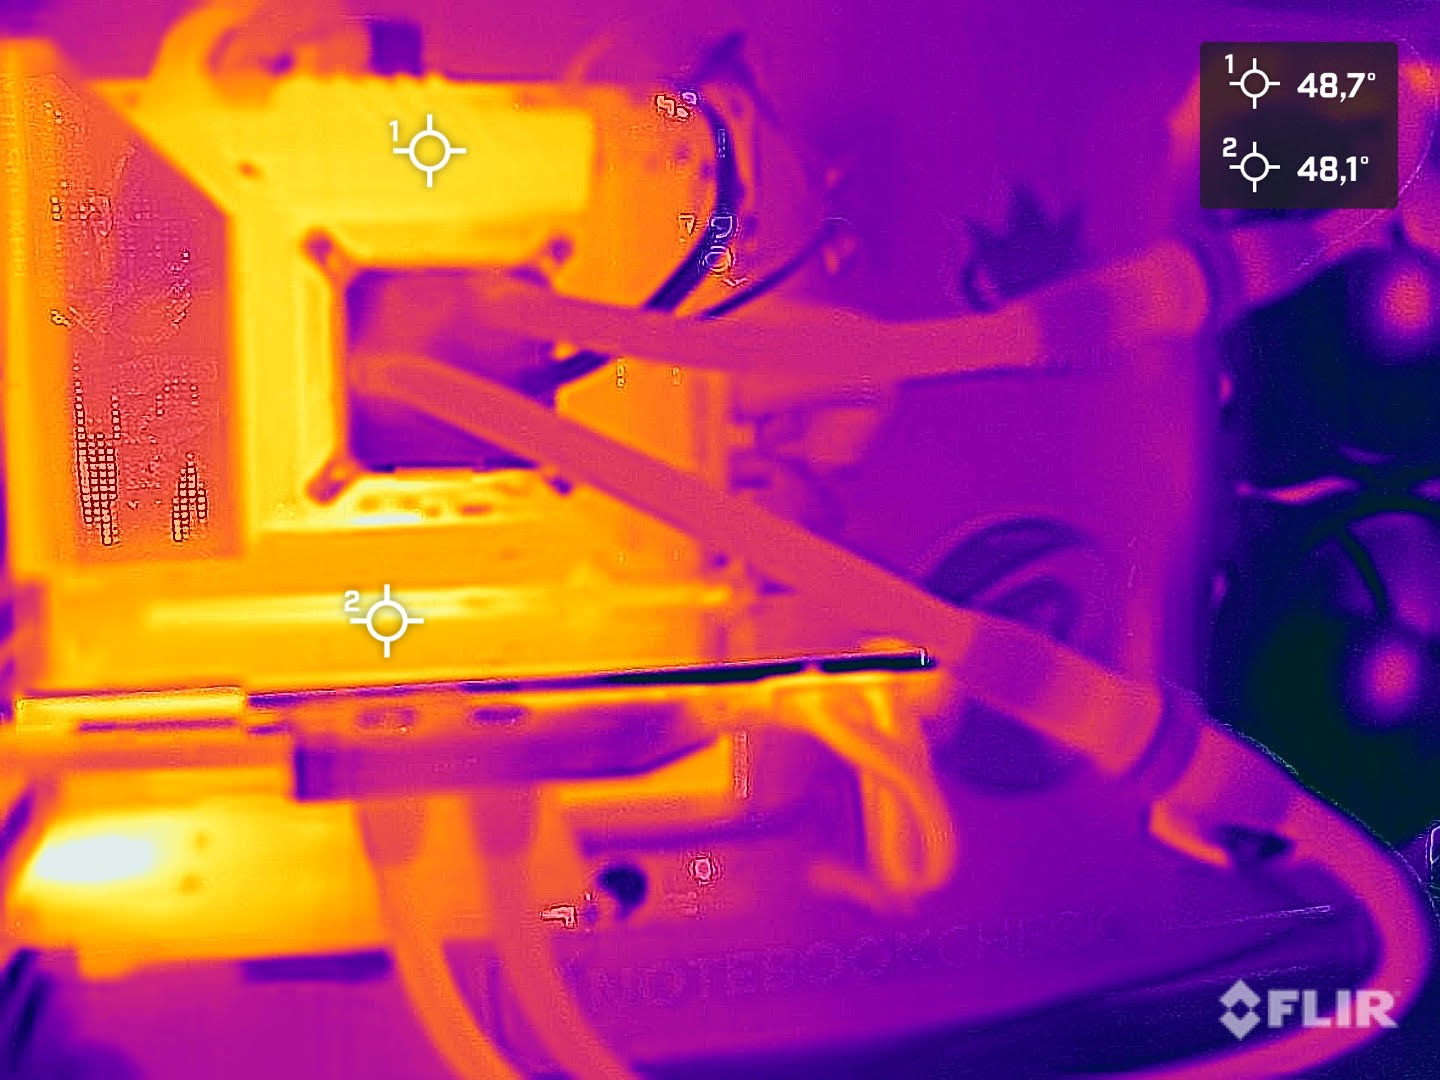
Nos températures mesurées ont montré que l'Intel Core i9-12900K atteignait déjà 100 °C plusieurs minutes après le démarrage du benchmark Prime95 . En poursuivant le test de stress, le processeur a ensuite dû être étranglé pour ne pas l'endommager. C'est l'inconvénient du réglage PL1 = PL2 dans le Bios. Cependant, nous n'avons pas remarqué d'étranglement sous charge dans la boucle Cinebench R15 Multi. Afin d'exclure une mauvaise installation du système de refroidissement, nous l'avons également retiré puis réinstallé à un moment donné, mais le résultat après coup était le même. Nous avons également contacté Alphacool pour nous assurer qu'il n'y a pas d'incompatibilité du refroidisseur que nous avons utilisé. Selon le fabricant, l'Alphacool Eisbear Aurora 280 AiO que nous avons utilisé est compatible avec le socket LGA 1700. Le Intel Core i5-12600K a été légèrement plus facile à refroidir sous charge, mais nous avons tout de même noté une température maximale de 95 °C (203°F).
Donc, ceux qui veulent utiliser un Intel Core i9-12900K devraient également se procurer un système de refroidissement très puissant pour tirer le meilleur parti du processeur.
| Power Consumption | |
| 1920x1080 The Witcher 3 ultra (external Monitor) | |
| Intel Core i9-12900K (Idle: 70.5 W) | |
| AMD Ryzen 9 5950X (Idle: 78 W) | |
| AMD Ryzen 9 5900X (Idle: 78.1 W) | |
| Intel Core i5-11600K (Idle: 69.49 W) | |
| AMD Ryzen 7 5800X (Idle: 77.5 W) | |
| AMD Ryzen 5 5600X (Idle: 79.23 W) | |
| Intel Core i5-12600K (Idle: 70.45 W) | |
| Intel Core i7-10700K (Idle: 67.7 W) | |
| Intel Core i9-10900K (Idle: 52.3 W) | |
| Intel Core i9-11900K (Idle: 57.3 W) | |
| Intel Core i5-10600K (Idle: 52.2 W) | |
| Prime95 V2810 Stress (external Monitor) | |
| Intel Core i9-11900K (Idle: 57.3 W) | |
| Intel Core i9-12900K (Idle: 70.5 W) | |
| Intel Core i9-10900K (Idle: 52.3 W) | |
| Intel Core i5-12600K (Idle: 70.45 W) | |
| AMD Ryzen 9 5950X (Idle: 78 W) | |
| AMD Ryzen 7 5800X (Idle: 77.5 W) | |
| AMD Ryzen 9 5900X (Idle: 78.1 W) | |
| Intel Core i5-11600K (Idle: 69.49 W) | |
| Intel Core i7-10700K (Idle: 67.7 W) | |
| Intel Core i5-10600K (Idle: 52.2 W) | |
| AMD Ryzen 5 5600X (Idle: 79.23 W) | |
| Cinebench R15 Multi (external Monitor) | |
| Intel Core i9-12900K (Idle: 70.5 W) | |
| Intel Core i9-10900K (Idle: 52.3 W) | |
| Intel Core i9-11900K (Idle: 57.3 W) | |
| AMD Ryzen 9 5900X (Idle: 78.1 W) | |
| AMD Ryzen 9 5950X (Idle: 78 W) | |
| AMD Ryzen 7 5800X (Idle: 77.5 W) | |
| Intel Core i5-11600K (Idle: 69.49 W) | |
| Intel Core i7-10700K (Idle: 67.7 W) | |
| Intel Core i5-12600K (Idle: 70.45 W) | |
| Intel Core i5-10600K (Idle: 52.2 W) | |
| AMD Ryzen 5 5600X (Idle: 79.23 W) | |
| Temperatures - CPU Temperature Prime95 | |
| Intel Core i9-11900K | |
| AMD Ryzen 7 5800X | |
| Intel Core i9-10900K | |
| Intel Core i5-11600K | |
| AMD Ryzen 9 5900X | |
| Intel Core i5-10600K | |
| AMD Ryzen 9 5950X | |
* ... Moindre est la valeur, meilleures sont les performances
Points positifs
Points négatifs
Verdict : retour au sommet avec un total de 24 fils
Avec Alder Lake-S, Intel réussit en effet à avoir le CPU Gaming le plus rapide, du moins pour l'instant. Mais ce n'est pas tout. Alder Lake-S n'est pas seulement un processeur de dernière génération amélioré comme nous l'avons souvent vu auparavant. Ce n'est pas le cas ici, puisque la nouvelle architecture comprend de nombreuses améliorations. Beaucoup d'entre elles sont déjà connues dans le domaine mobile, puisque les smartphones et les tablettes contiennent depuis des années des processeurs dotés de cœurs performants et économes en énergie. Intel utilise également cette conception dans sa gamme actuelle d'ordinateurs de bureau, en augmentant considérablement les performances multicœurs. Ainsi, l'Intel Core i9-12900K est capable de fonctionner sur un total de 24 threads en parallèle. En outre, l'IPC a également été amélioré de manière significative, ce qui profite énormément aux jeux vidéo
La base sous-jacente a également complètement changé et une simple mise à niveau à partir de Rocket Lake-S est impossible sans remplacer la carte mère. Vous devez absolument inclure cela dans votre calcul des coûts. À propos des coûts, le prix d'achat recommandé est de 589 $ et il est actuellement disponible à partir de 659 euros (~762 $) dans certains endroits. En fonction de la disponibilité, il pourrait y avoir quelques augmentations de prix ici, comme pour les cartes graphiques. L'Intel Core i5-12600K, un peu plus faible mais toujours très rapide, est proposé à un prix recommandé de 289 dollars selon Intel. Selon nos premières recherches, le modèle est déjà disponible à partir de 319 euros (~$369) dans certains endroits. C'est un prix attractif que même AMD ne peut actuellement pas battre. Le modèle correspondant AMD Ryzen 7 5800X correspondantcorrespondant coûte 379 euros (~438 $) à ce stade. Les choses sont un peu différentes ici avec le modèle supérieur, où le AMD Ryzen 9 5900Xest nettement plus abordable à 519 euros (~600 $).
L'Intel Core i9-12900K est un très bon processeur de jeu avec quelques réserves pour l'avenir. Avec le processeur de jeu le plus rapide du marché, Intel peut se féliciter pour l'instant.
Cependant, pour rendre l'Intel Core i9-12900K plus compétitif, le prix devrait baisser, car comme nous l'avons déjà mentionné, vous devez certainement investir dans une nouvelle carte mère et, dans certaines circonstances, dans une nouvelle mémoire de travail si elle doit être DDR5. Mais nous apprécions le fait que vous ayez également la possibilité de continuer à utiliser la DDR4. Les fabricants de cartes mères proposent pour cela des modèles spécifiques avec de la RAM DDR4. Mais on ne sait malheureusement pas encore si ces modèles supporteront Raptor Lake-S.
Nous avons été un peu déçus par la consommation d'énergie. Bien sûr, les performances ont été drastiquement améliorées et la consommation d'énergie légèrement plus élevée correspondante reste dans les limites. Mais cela aurait été génial si cette augmentation de performance avait pu être combinée avec une consommation d'énergie sensiblement plus faible. Cela aiderait également à mieux gérer les problèmes de refroidissement.
Ceux qui veulent s'en emparer dès maintenant peuvent se procurer l'Intel Core i5-12600K surAmazon pour ~$323 et l'Intel Core i9-12900K également sur Amazon pour ~$1400. Alors que Newegg le propose à 649 $, mais il est actuellement en rupture de stock.

