Test de l'Intel NUC 9 Extreme (i9-9980HK, RTX 2070)

* ... Moindre est la valeur, meilleures sont les performances
| Borderlands 3 | |
| 1280x720 Very Low Overall Quality (DX11) | |
| Intel Ghost Canyon NUC (RTX 2070) | |
| Moyenne NVIDIA GeForce RTX 2070 (Desktop) (138 - 152, n=2) | |
| Moyenne NVIDIA GeForce RTX 2070 Mobile (94 - 125, n=2) | |
| Moyenne Intel UHD Graphics 630 (n=1) | |
| 1920x1080 Badass Overall Quality (DX11) | |
| Moyenne NVIDIA GeForce RTX 2070 (Desktop) (70.9 - 74.4, n=2) | |
| Intel Ghost Canyon NUC (RTX 2070) | |
| Moyenne NVIDIA GeForce RTX 2070 Mobile (61 - 64.5, n=3) | |
| Metro Exodus | |
| 1280x720 Low Quality AF:4x | |
| Intel Ghost Canyon NUC (RTX 2070) | |
| Moyenne NVIDIA GeForce RTX 2070 (Desktop) (82.7 - 181, n=4) | |
| Moyenne NVIDIA GeForce RTX 2070 Mobile (91.1 - 98, n=2) | |
| Moyenne Intel UHD Graphics 630 (n=1) | |
| 1920x1080 Ultra Quality AF:16x | |
| Intel Ghost Canyon NUC (RTX 2070) | |
| Moyenne NVIDIA GeForce RTX 2070 (Desktop) (33.4 - 62.8, n=4) | |
| Moyenne NVIDIA GeForce RTX 2070 Mobile (53.3 - 54.6, n=5) | |
| Far Cry New Dawn | |
| 1280x720 Low Preset | |
| Intel Ghost Canyon NUC (RTX 2070) | |
| Moyenne NVIDIA GeForce RTX 2070 (Desktop) (117 - 128, n=3) | |
| Moyenne Intel UHD Graphics 630 (n=1) | |
| 1920x1080 Ultra Preset | |
| Moyenne NVIDIA GeForce RTX 2070 (Desktop) (79 - 94, n=3) | |
| Moyenne NVIDIA GeForce RTX 2070 Mobile (82 - 83, n=2) | |
| Intel Ghost Canyon NUC (RTX 2070) | |
| Forza Horizon 4 | |
| 1280x720 Very Low Preset | |
| Intel Ghost Canyon NUC (RTX 2070) | |
| Moyenne NVIDIA GeForce RTX 2070 (Desktop) (169 - 198, n=4) | |
| Moyenne NVIDIA GeForce RTX 2070 Mobile (n=1) | |
| 1920x1080 Ultra Preset AA:2xMS | |
| Moyenne NVIDIA GeForce RTX 2070 (Desktop) (106 - 118, n=4) | |
| Intel Ghost Canyon NUC (RTX 2070) | |
| Moyenne NVIDIA GeForce RTX 2070 Mobile (n=1) | |
| Final Fantasy XV Benchmark | |
| 1280x720 Lite Quality | |
| Intel Ghost Canyon NUC (RTX 2070) | |
| Moyenne NVIDIA GeForce RTX 2070 Mobile (151 - 158, n=2) | |
| Moyenne NVIDIA GeForce RTX 2070 (Desktop) (106.5 - 193, n=5) | |
| Moyenne Intel UHD Graphics 630 (9.5 - 14, n=3) | |
| 1920x1080 High Quality | |
| Intel Ghost Canyon NUC (RTX 2070) | |
| Moyenne NVIDIA GeForce RTX 2070 (Desktop) (60.8 - 90.6, n=5) | |
| Moyenne NVIDIA GeForce RTX 2070 Mobile (77 - 80.6, n=3) | |
| Dota 2 Reborn | |
| 1280x720 min (0/3) fastest | |
| Intel Ghost Canyon NUC (RTX 2070) | |
| Moyenne NVIDIA GeForce RTX 2070 (Desktop) (n=1) | |
| Moyenne NVIDIA GeForce RTX 2070 Mobile (129.7 - 153, n=9) | |
| Moyenne Intel UHD Graphics 630 (70.4 - 99.1, n=11) | |
| 1920x1080 ultra (3/3) best looking | |
| Intel Ghost Canyon NUC (RTX 2070) | |
| Moyenne NVIDIA GeForce RTX 2070 (Desktop) (n=1) | |
| Moyenne NVIDIA GeForce RTX 2070 Mobile (98.4 - 124, n=9) | |
| Moyenne Intel UHD Graphics 630 (6.8 - 21, n=11) | |
| The Witcher 3 | |
| 1024x768 Low Graphics & Postprocessing | |
| Moyenne NVIDIA GeForce RTX 2070 Mobile (193.9 - 357, n=12) | |
| Intel Ghost Canyon NUC (RTX 2070) | |
| Moyenne NVIDIA GeForce RTX 2070 (Desktop) (151.4 - 315, n=5) | |
| Moyenne Intel UHD Graphics 630 (15.2 - 17.3, n=3) | |
| 1920x1080 Ultra Graphics & Postprocessing (HBAO+) | |
| Intel Ghost Canyon NUC (RTX 2070) | |
| Moyenne NVIDIA GeForce RTX 2070 (Desktop) (40.9 - 95, n=5) | |
| Moyenne NVIDIA GeForce RTX 2070 Mobile (64 - 82.1, n=21) | |
| Bas | Moyen | Élevé | Ultra | QHD DLSS | QHD | 4K | |
|---|---|---|---|---|---|---|---|
| The Witcher 3 (2015) | 286 | 216 | 142 | 83.1 | 55.9 | ||
| Dota 2 Reborn (2015) | 155.6 | 141.8 | 137.6 | 130.3 | 116.1 | ||
| Final Fantasy XV Benchmark (2018) | 193 | 122 | 90.6 | 37.1 | |||
| X-Plane 11.11 (2018) | 127 | 115 | 92.7 | 82.2 | |||
| Far Cry 5 (2018) | 147 | 106 | 82 | 86 | 71 | 46 | |
| Strange Brigade (2018) | 431 | 233 | 184.1 | 158.6 | 114.8 | 65.1 | |
| Forza Horizon 4 (2018) | 198 | 141 | 132 | 106 | 88 | 61 | |
| Far Cry New Dawn (2019) | 128 | 92 | 87 | 79 | 63 | 49 | |
| Metro Exodus (2019) | 181 | 104 | 77 | 60.9 | 48.4 | 30.5 | |
| Borderlands 3 (2019) | 152 | 126 | 91.7 | 70.9 | 49.8 | 26.7 | |
| Baldur's Gate 3 (2023) | 80.4 | 81.6 | 52.3 | 29.8 | |||
| Cyberpunk 2077 (2023) | 109.3 | 87.5 | 75.6 | 66.5 | 40.6 | ||
| Space Marine 2 (2024) | 58 | ||||||
| Stalker 2 (2024) | 35.5 | 29.5 | |||||
| Indiana Jones and the Great Circle (2024) | 75.4 | 49.4 | |||||
| Kingdom Come Deliverance 2 (2025) | 101.4 | 78.1 | 63.4 | 45.6 | |||
| Civilization 7 (2025) | 106.2 | 71.5 | 37.3 | ||||
| The Elder Scrolls IV Oblivion Remastered (2025) | 62.1 | 42.7 | 35 | 23.9 | 11.8 | ||
| Doom: The Dark Ages (2025) | 52.7 | 44.6 | 40.5 | 38.7 | |||
| F1 25 (2025) | 175.9 | 156.8 | 120.8 | ||||
| Borderlands 4 (2025) | 33.6 | 30.1 | 22.8 | 14.8 | |||
| ARC Raiders (2025) | 138.7 | 83.4 | 68.2 | 33.3 |
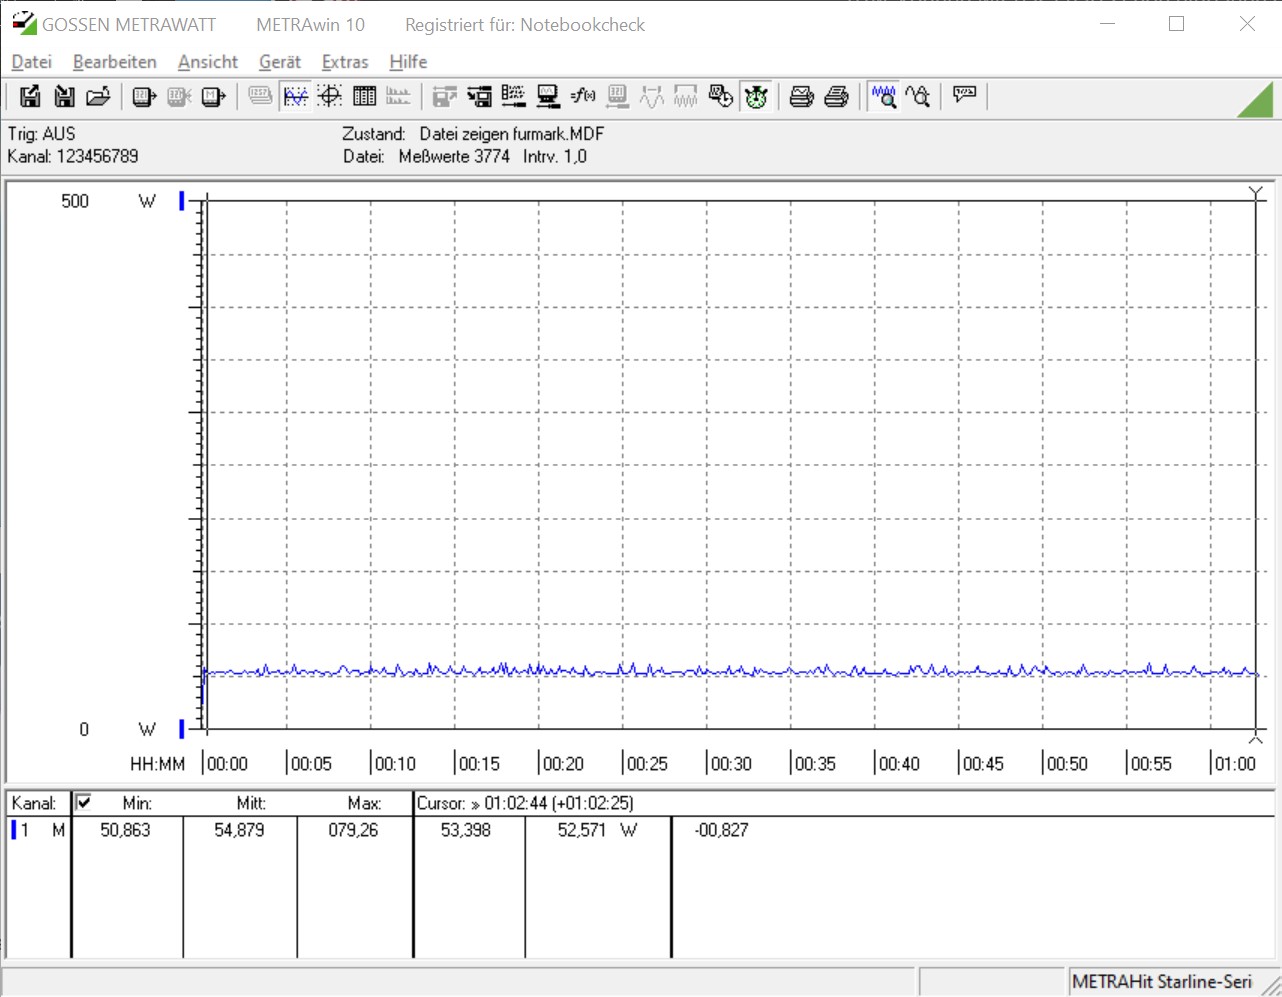
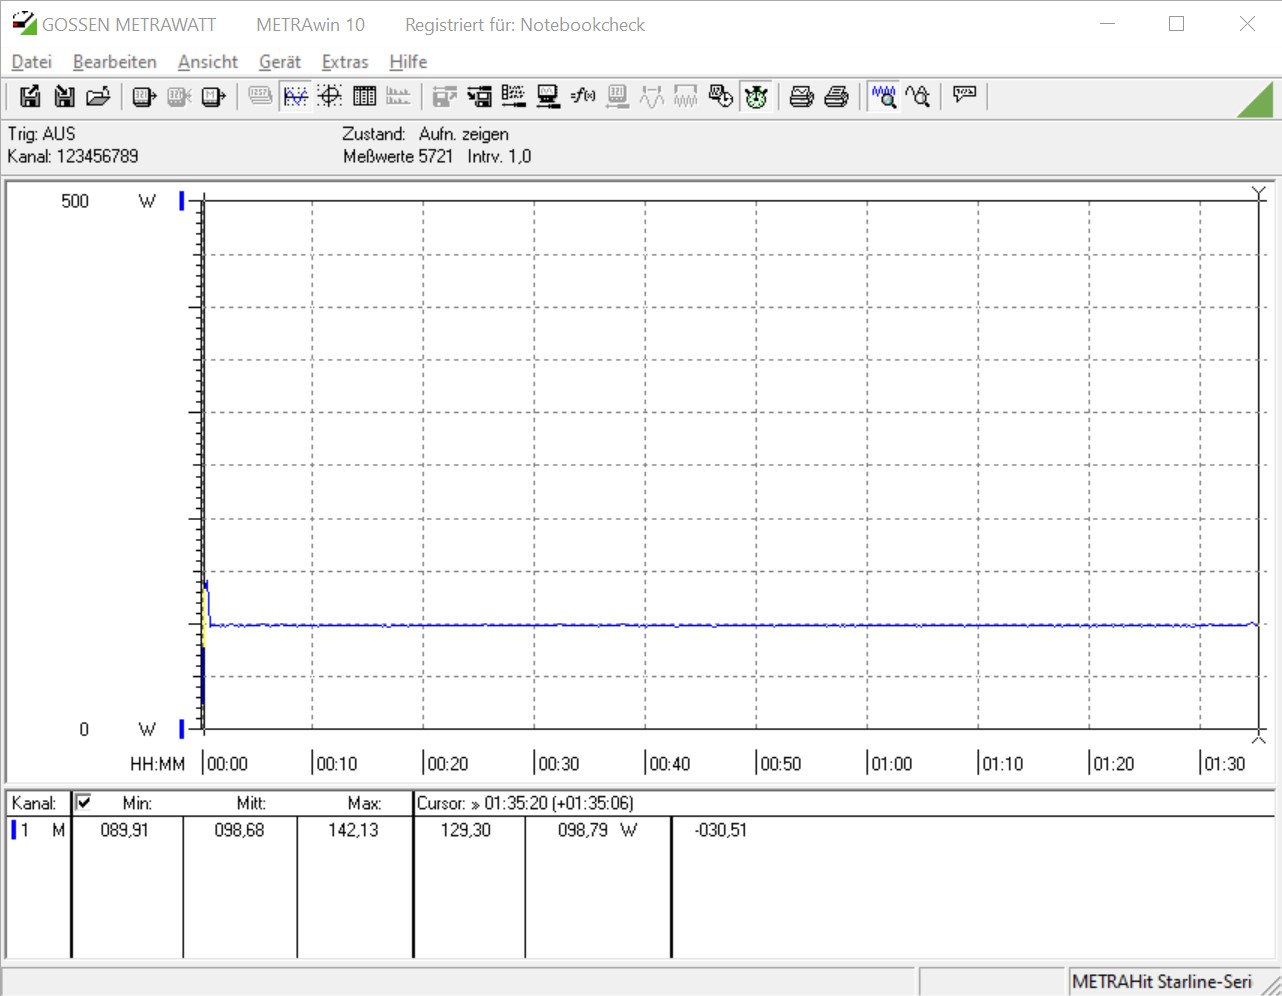
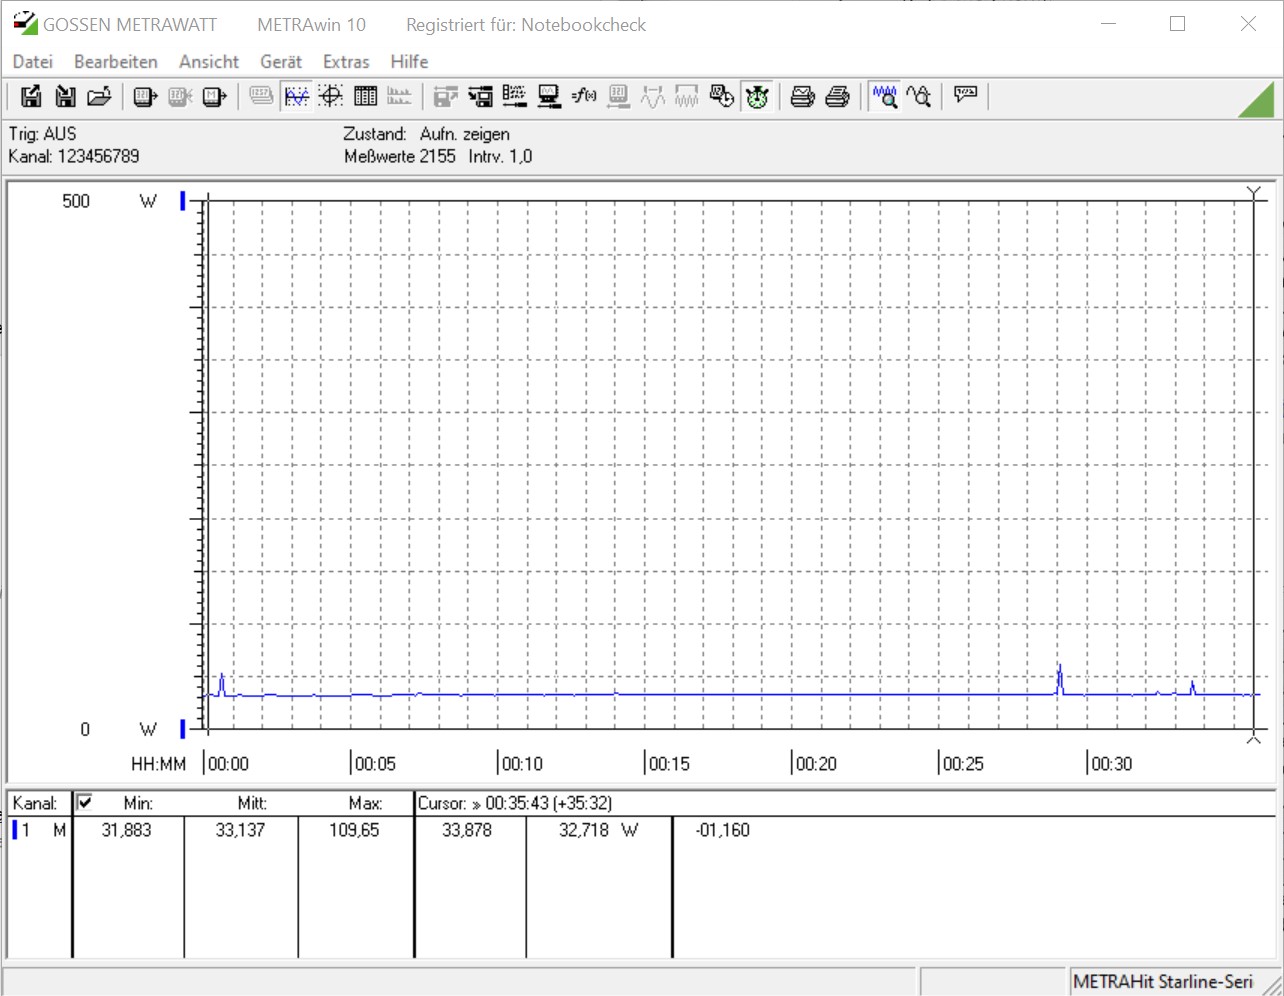
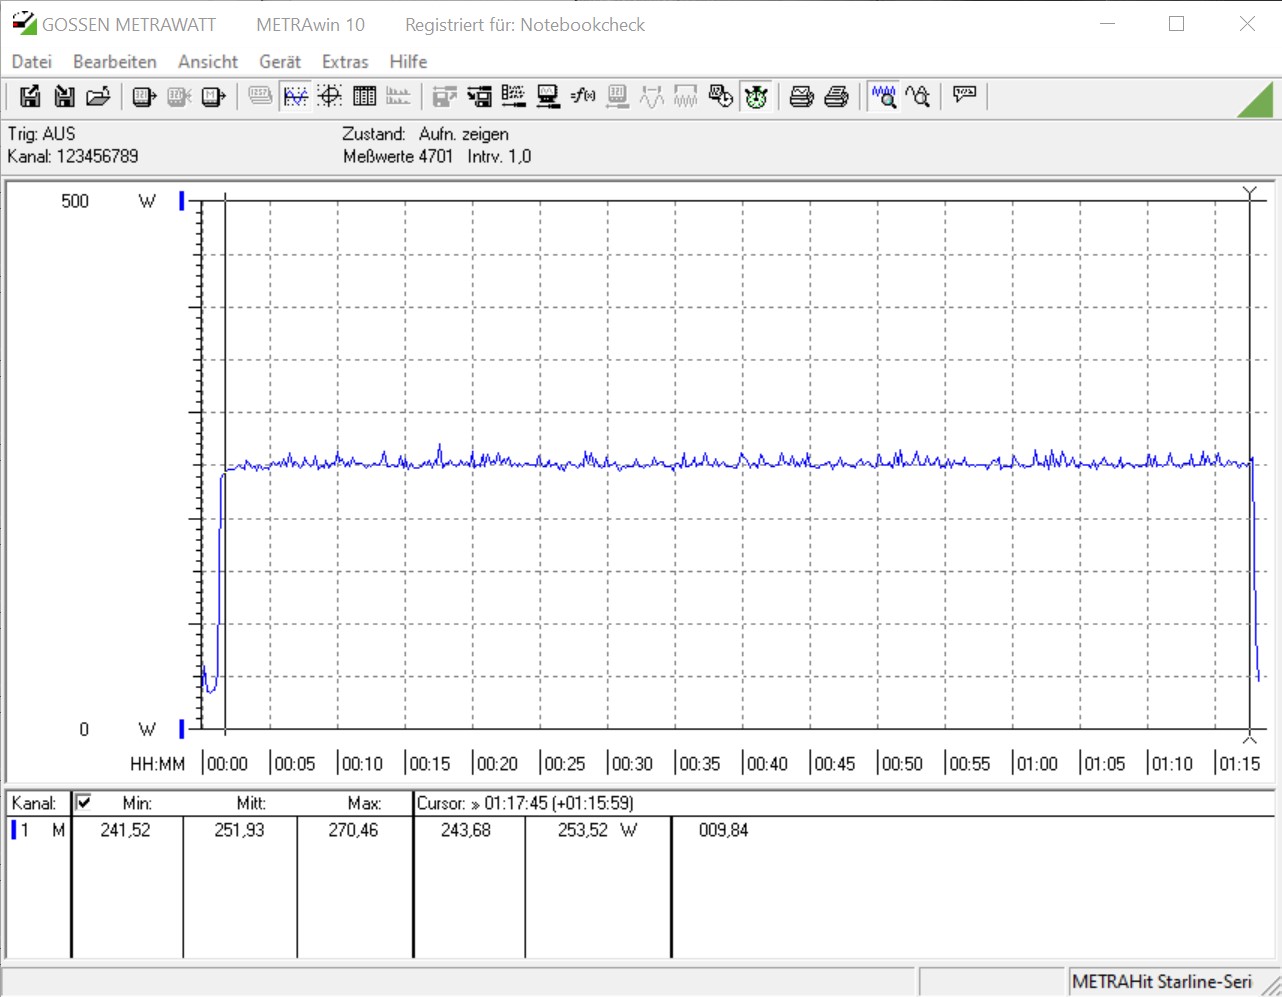
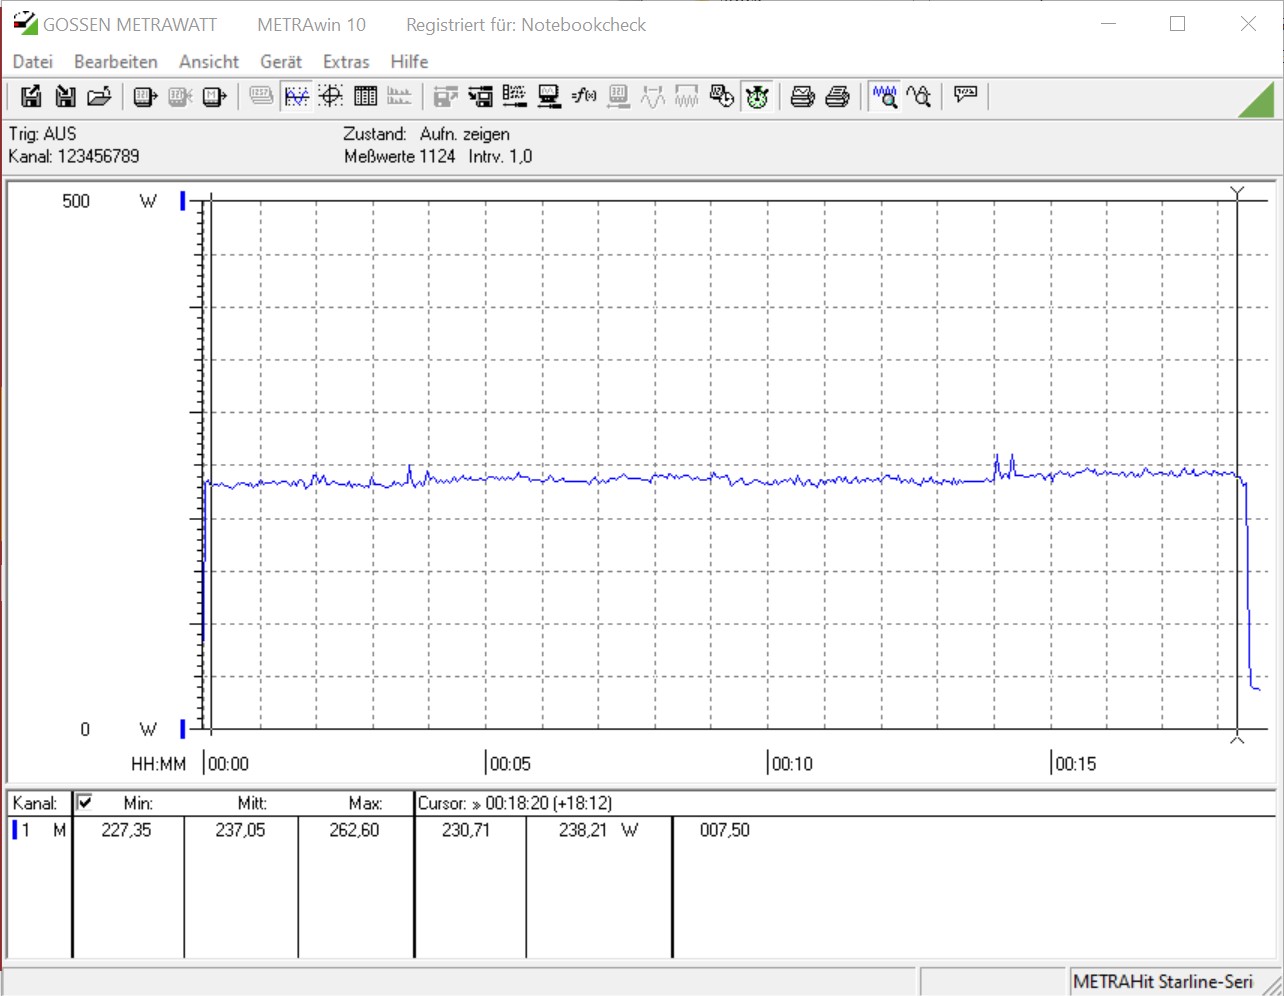
| Power Consumption | |
| 1920x1080 The Witcher 3 ultra (external Monitor) | |
| AMD Ryzen 9 3950X (Idle: 95 W) | |
| Intel Core i9-10900K (Idle: 52.3 W) | |
| Intel Core i5-10600K (Idle: 52.2 W) | |
| Intel Ghost Canyon NUC (RTX 2070) (Idle: 33.1 W) | |
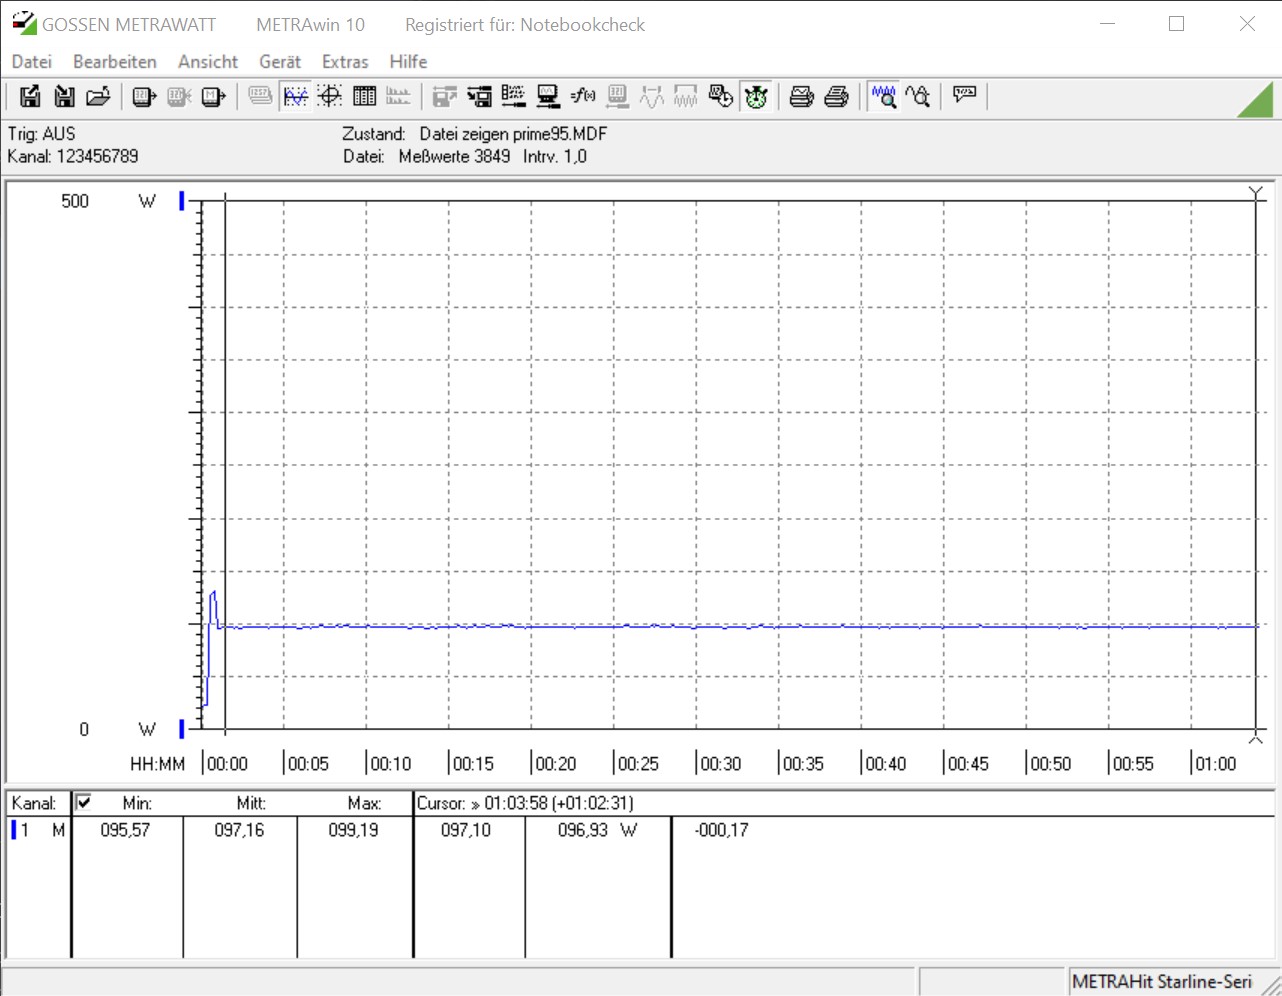
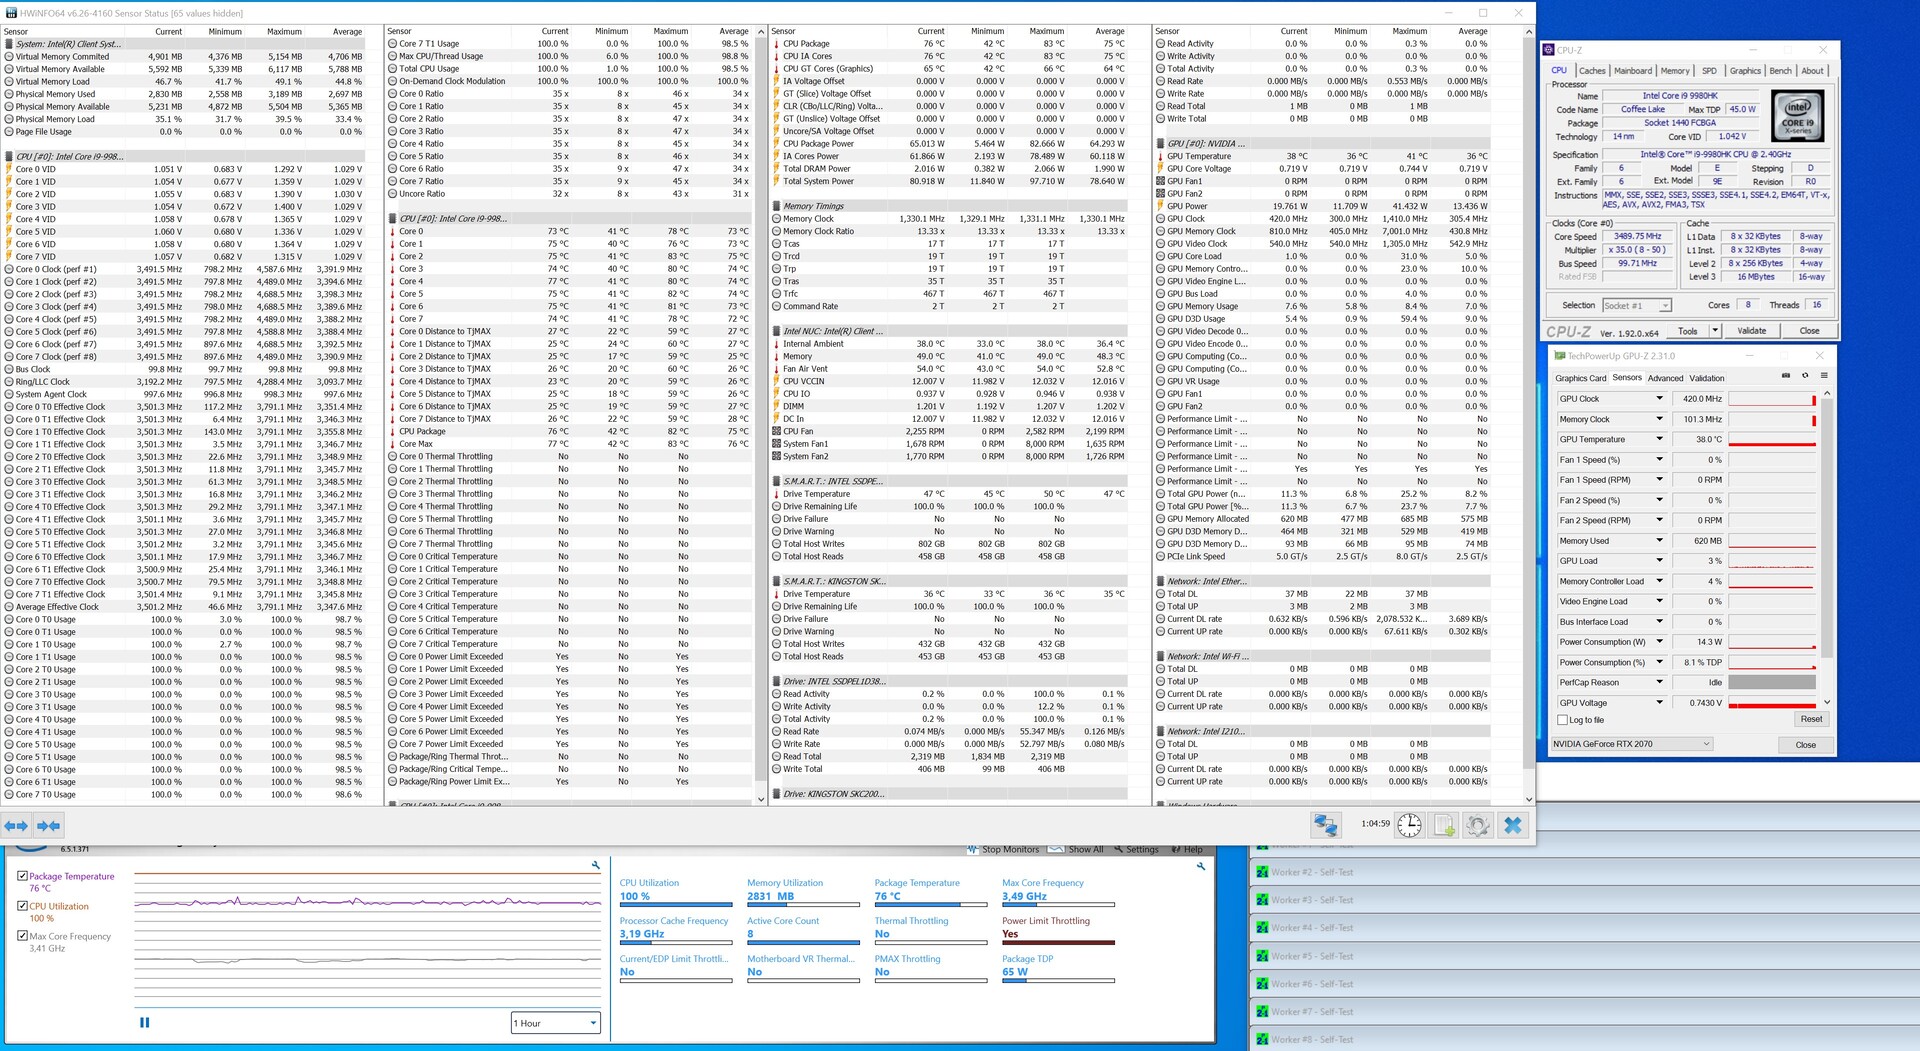
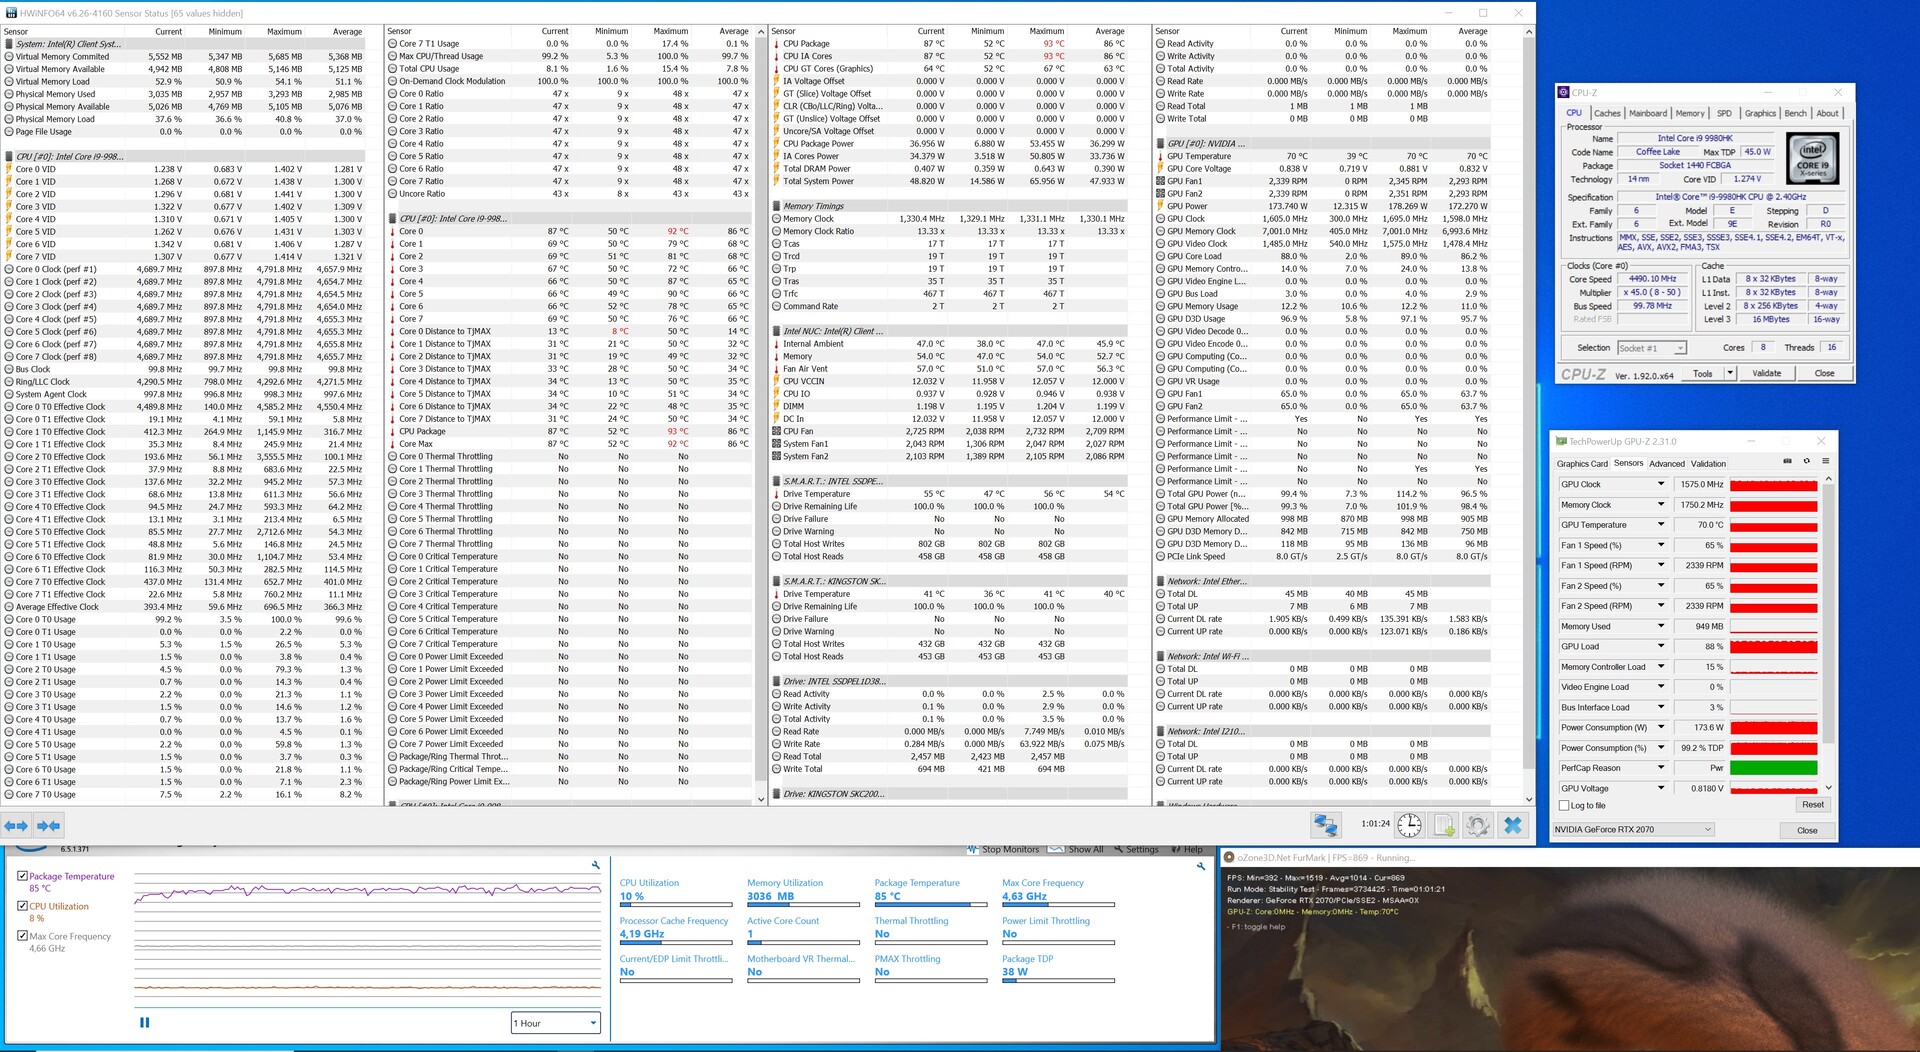
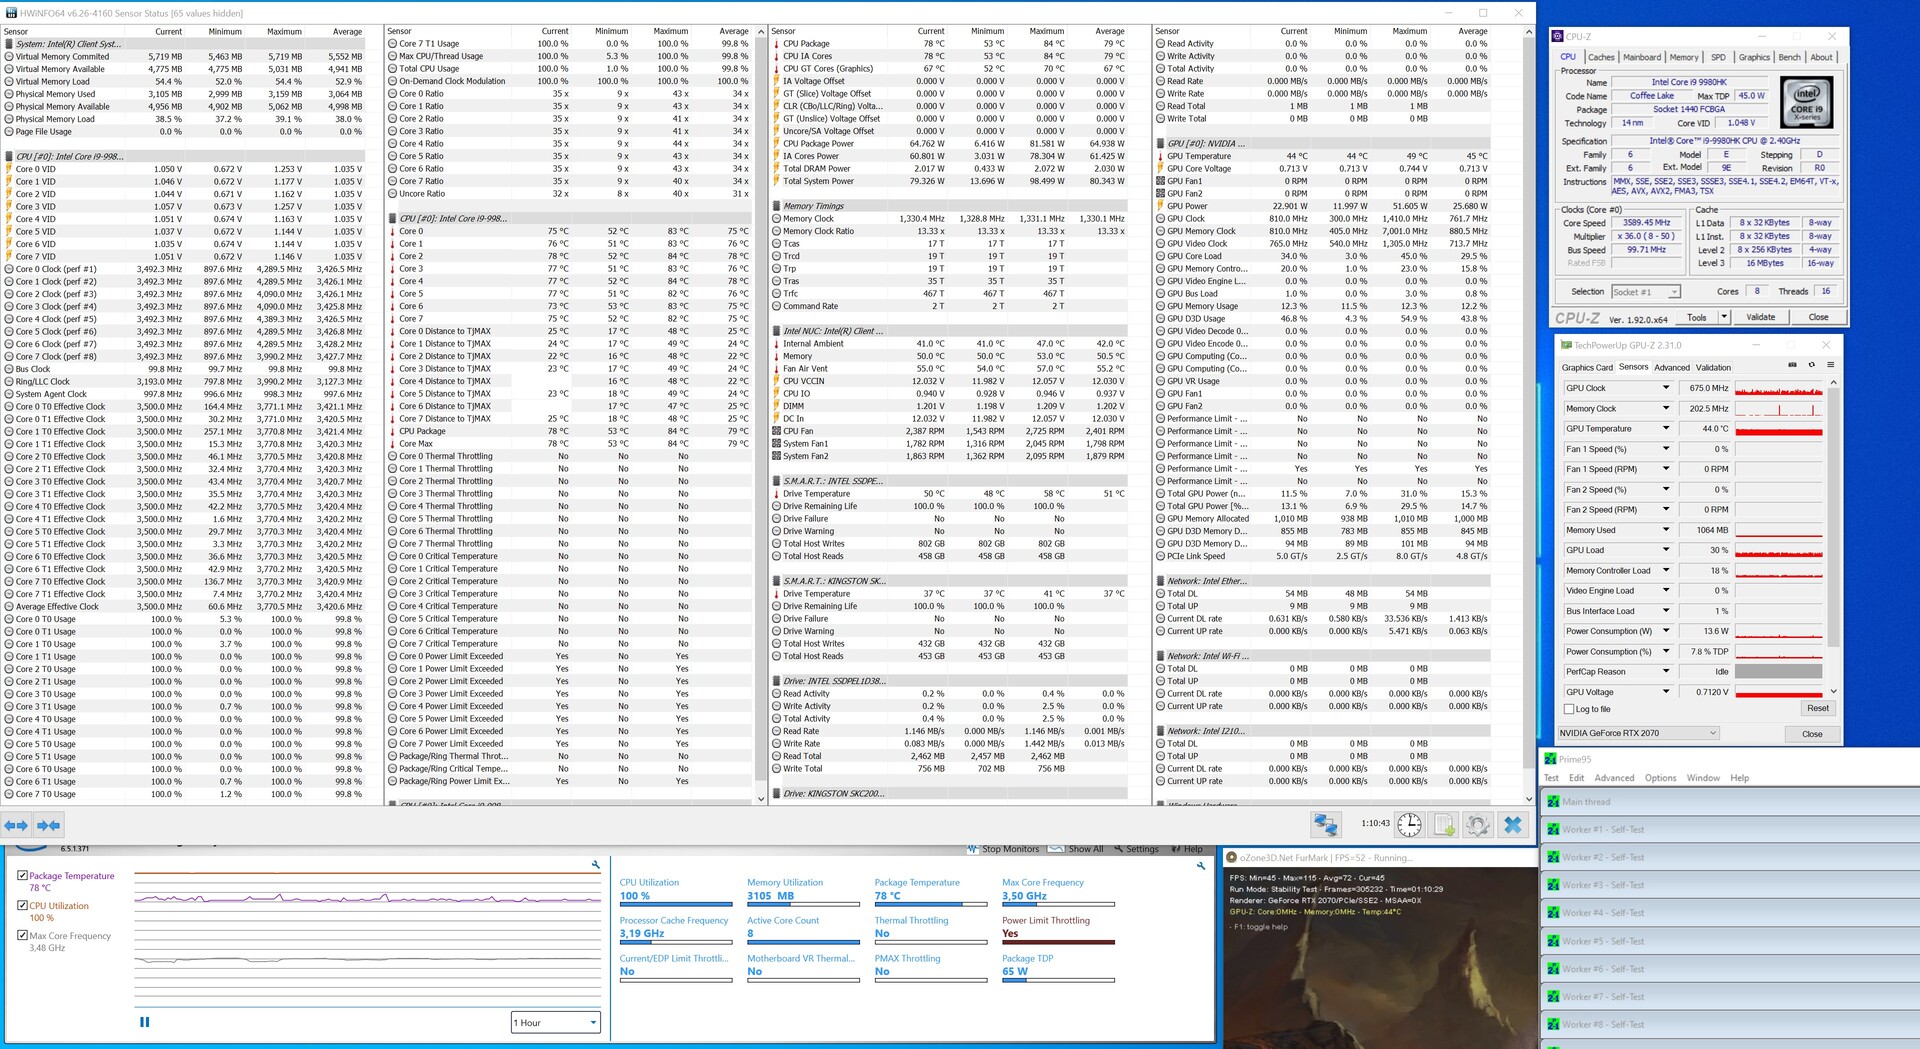
| Prime95 V2810 Stress (external Monitor) | |
| Intel Core i9-10900K (Idle: 52.3 W) | |
| Intel Core i5-10600K (Idle: 52.2 W) | |
| AMD Ryzen 9 3950X (Idle: 95 W) | |
| Intel Ghost Canyon NUC (RTX 2070) (Idle: 33.1 W) | |
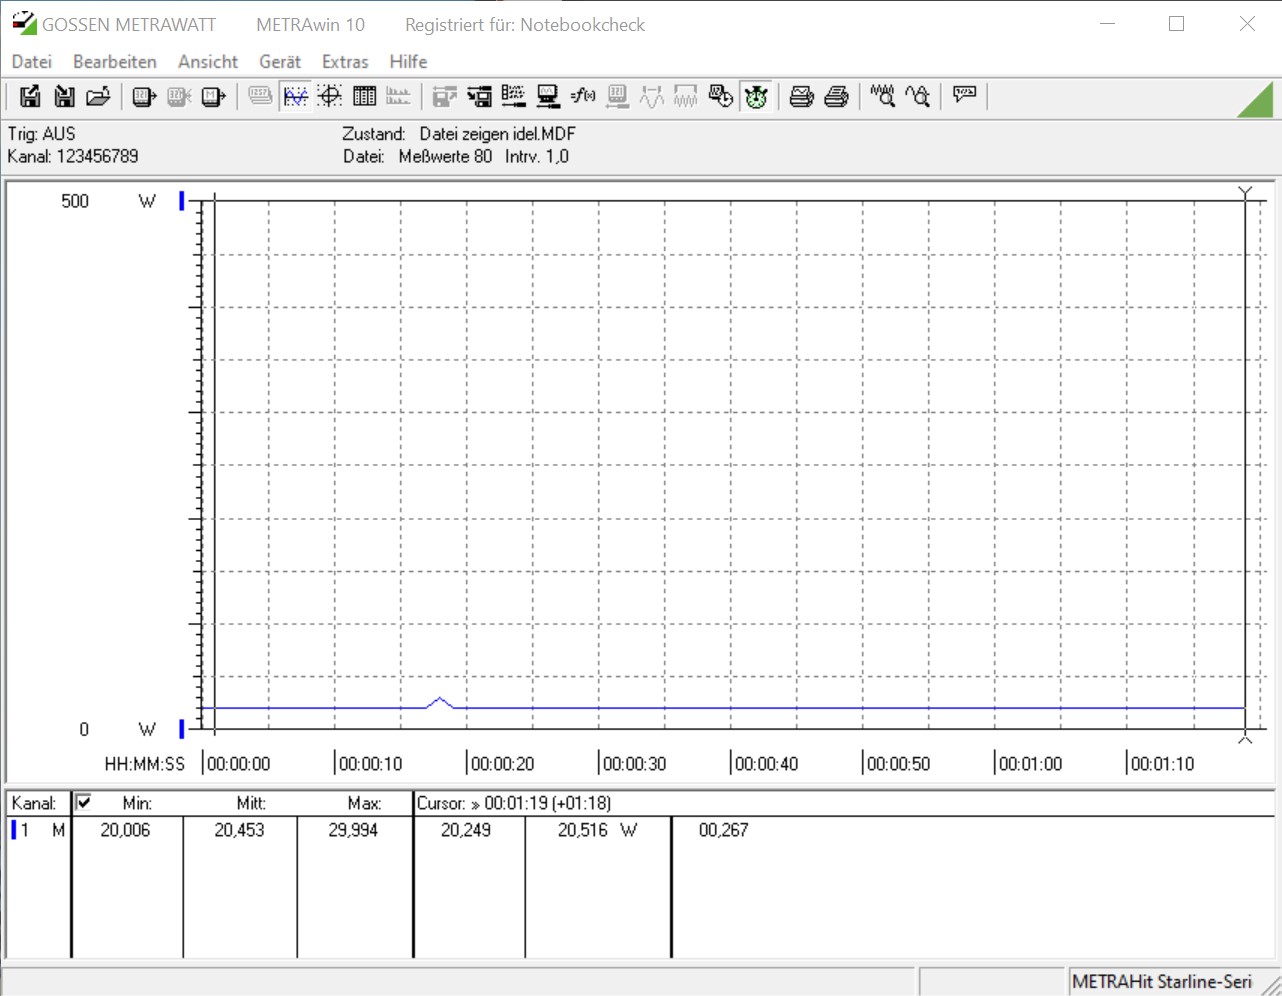
| Intel Ghost Canyon NUC (Idle: 20.45 W) | |
| Cinebench R15 Multi (external Monitor) | |
| Intel Core i9-10900K (Idle: 52.3 W) | |
| AMD Ryzen 9 3950X (Idle: 95 W) | |
| Intel Core i5-10600K (Idle: 52.2 W) | |
| Intel Ghost Canyon NUC (Idle: 20.45 W) | |
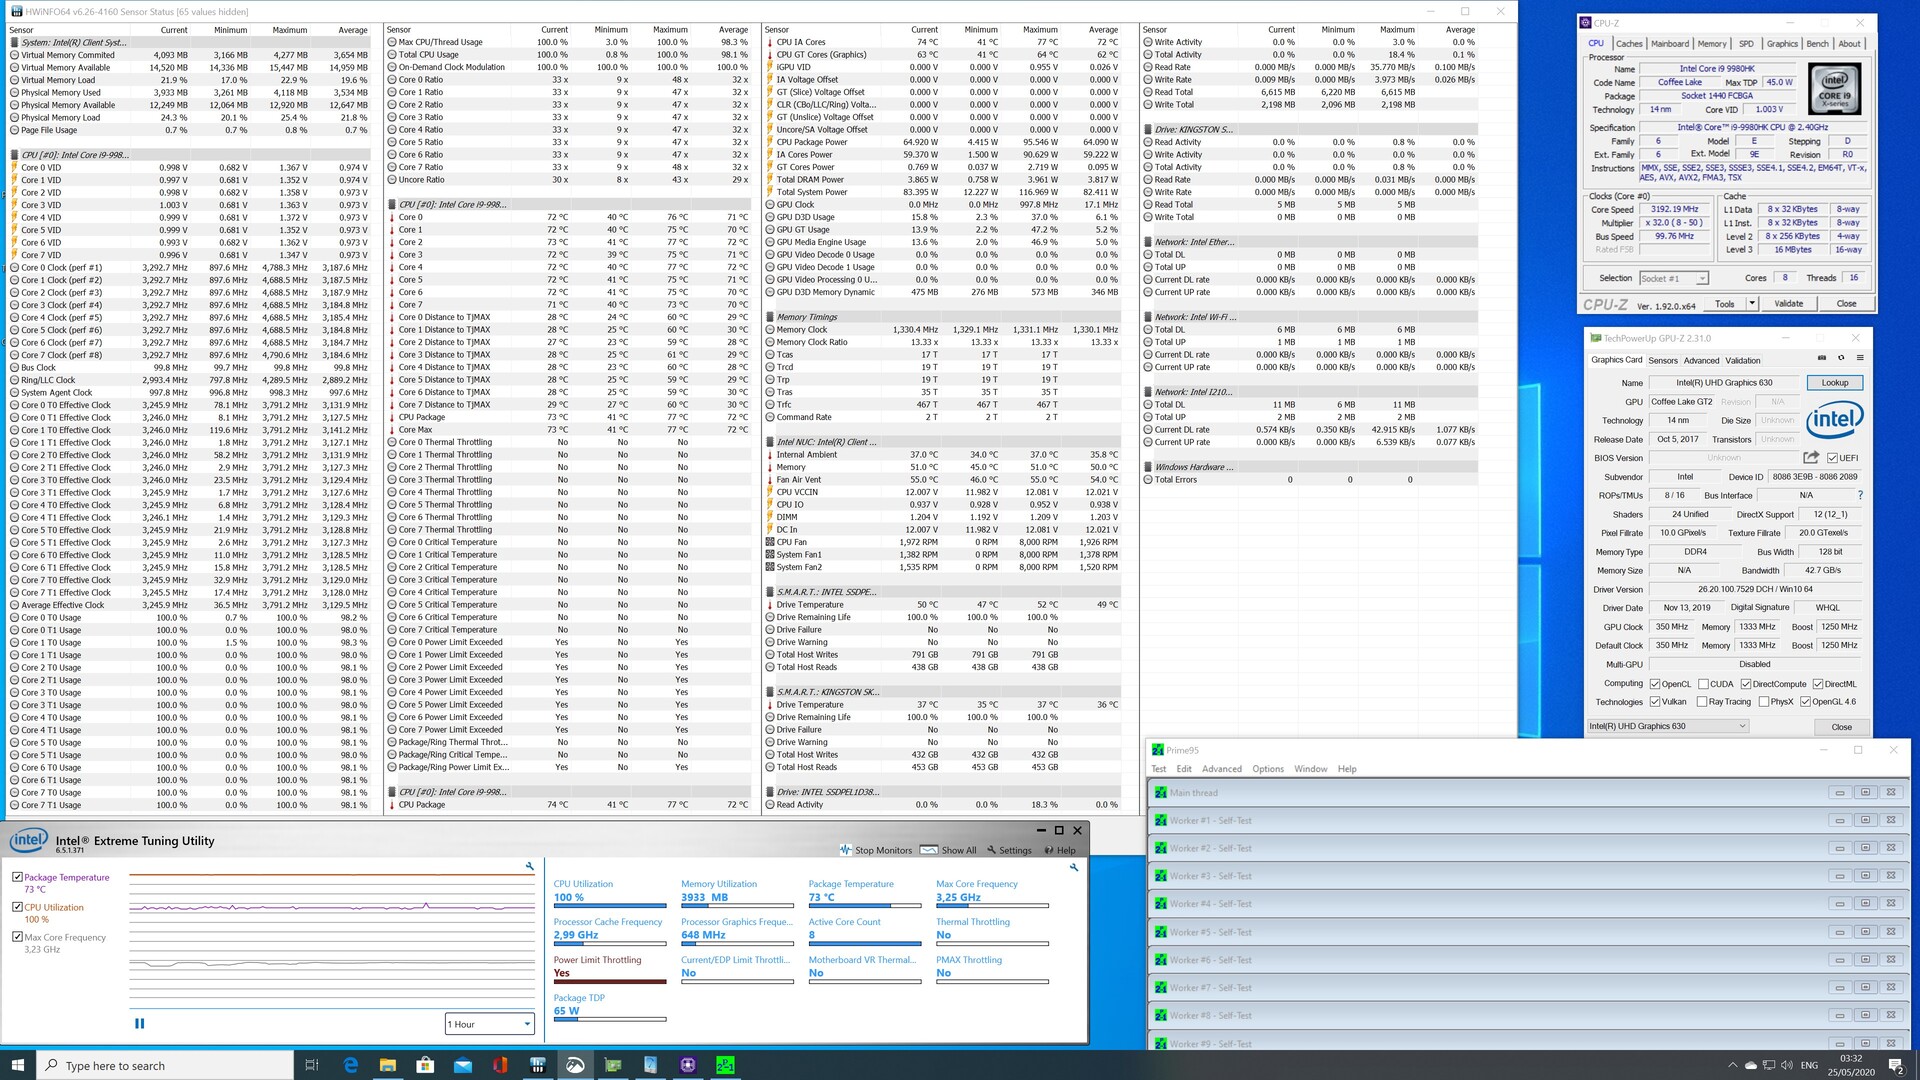
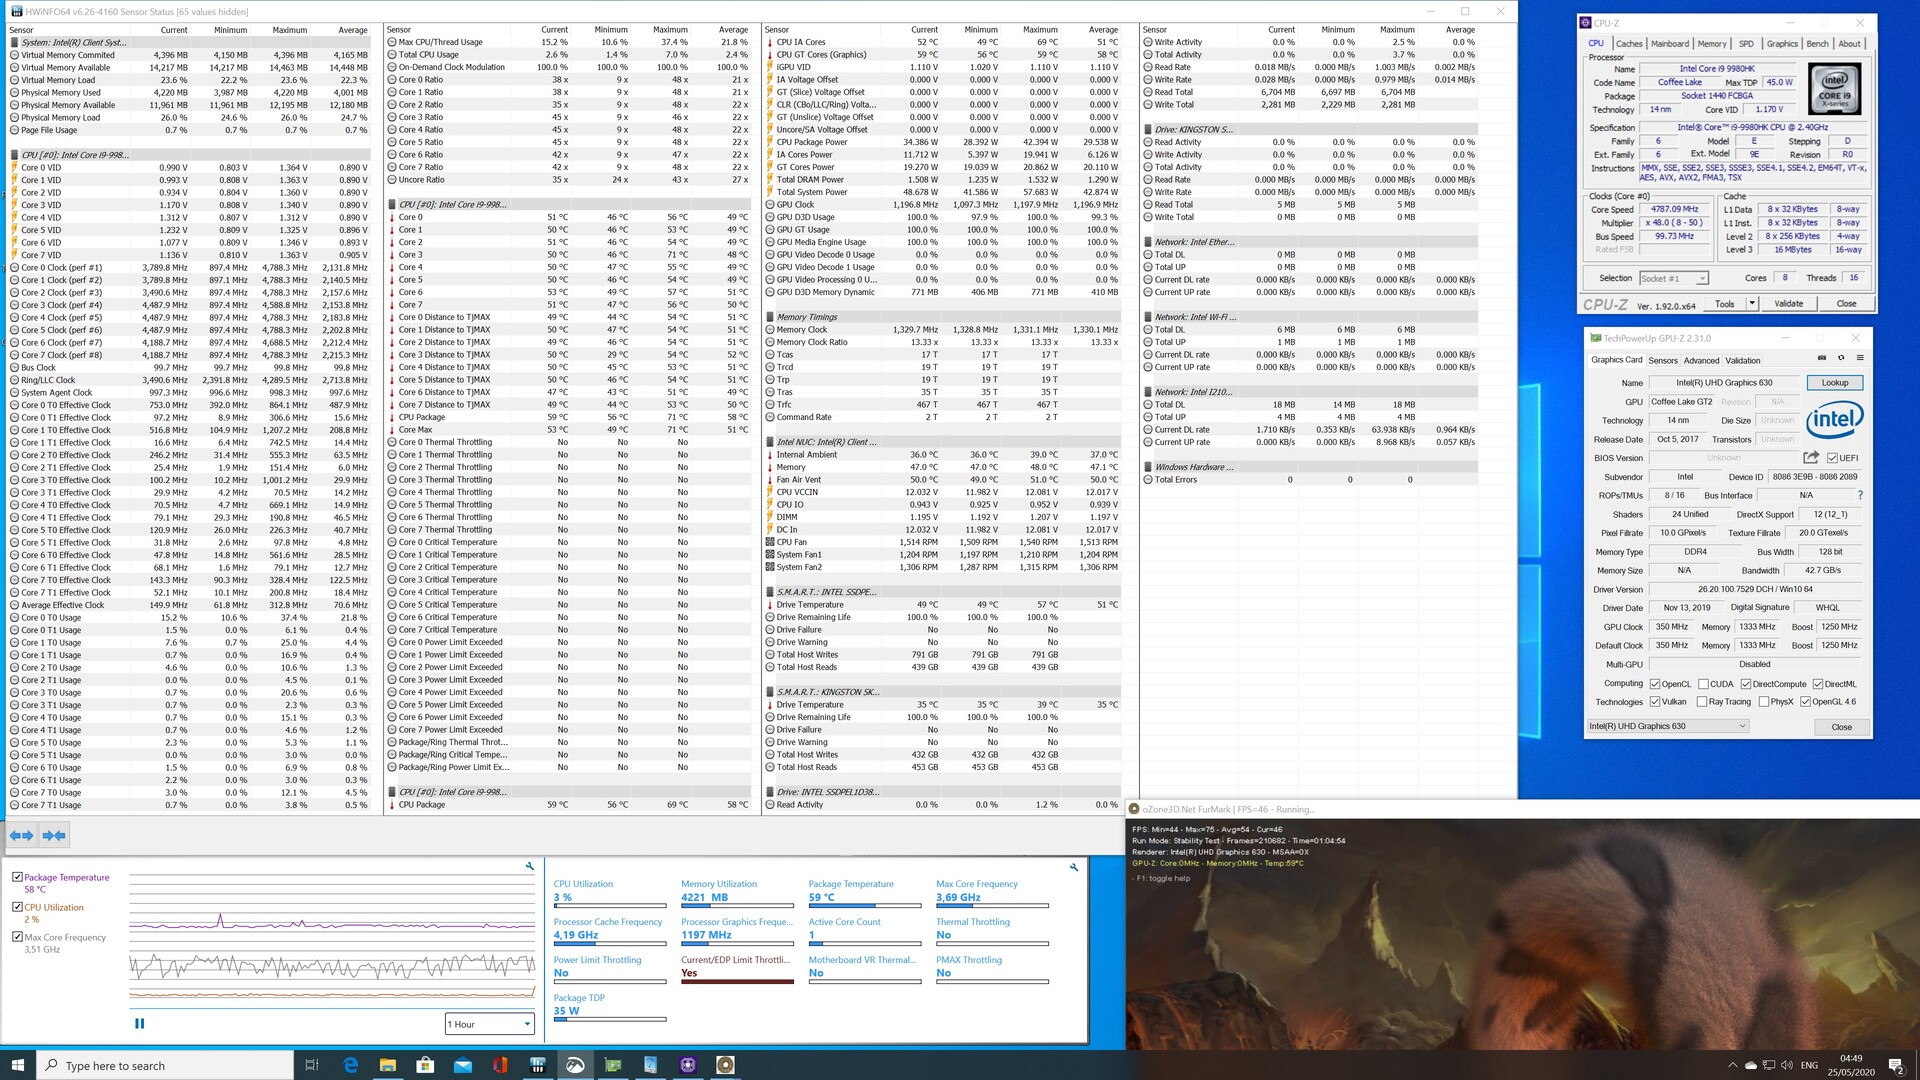
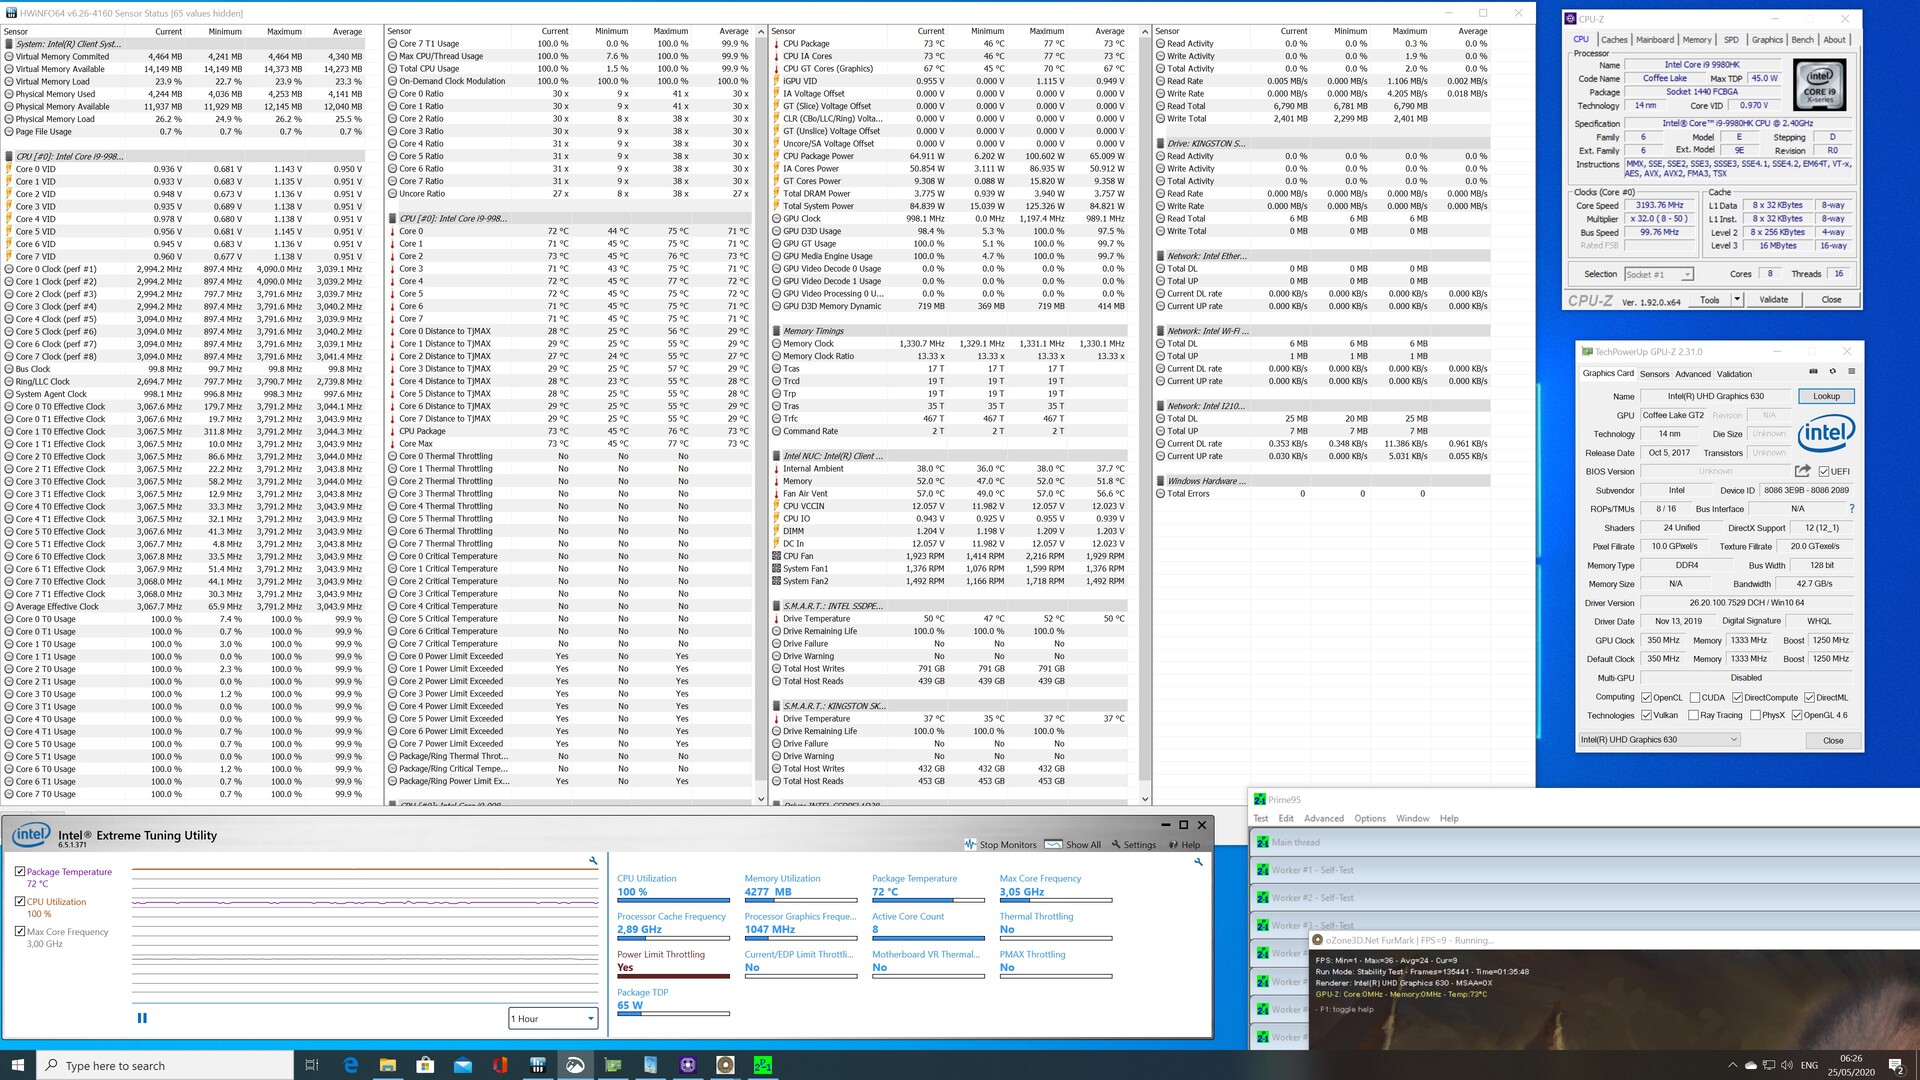
| Temperatures - CPU Temperature Prime95 | |
| Intel Core i9-10900K | |
| AMD Ryzen 9 3950X | |
| Intel Ghost Canyon NUC | |
| Intel Core i5-10600K | |
* ... Moindre est la valeur, meilleures sont les performances
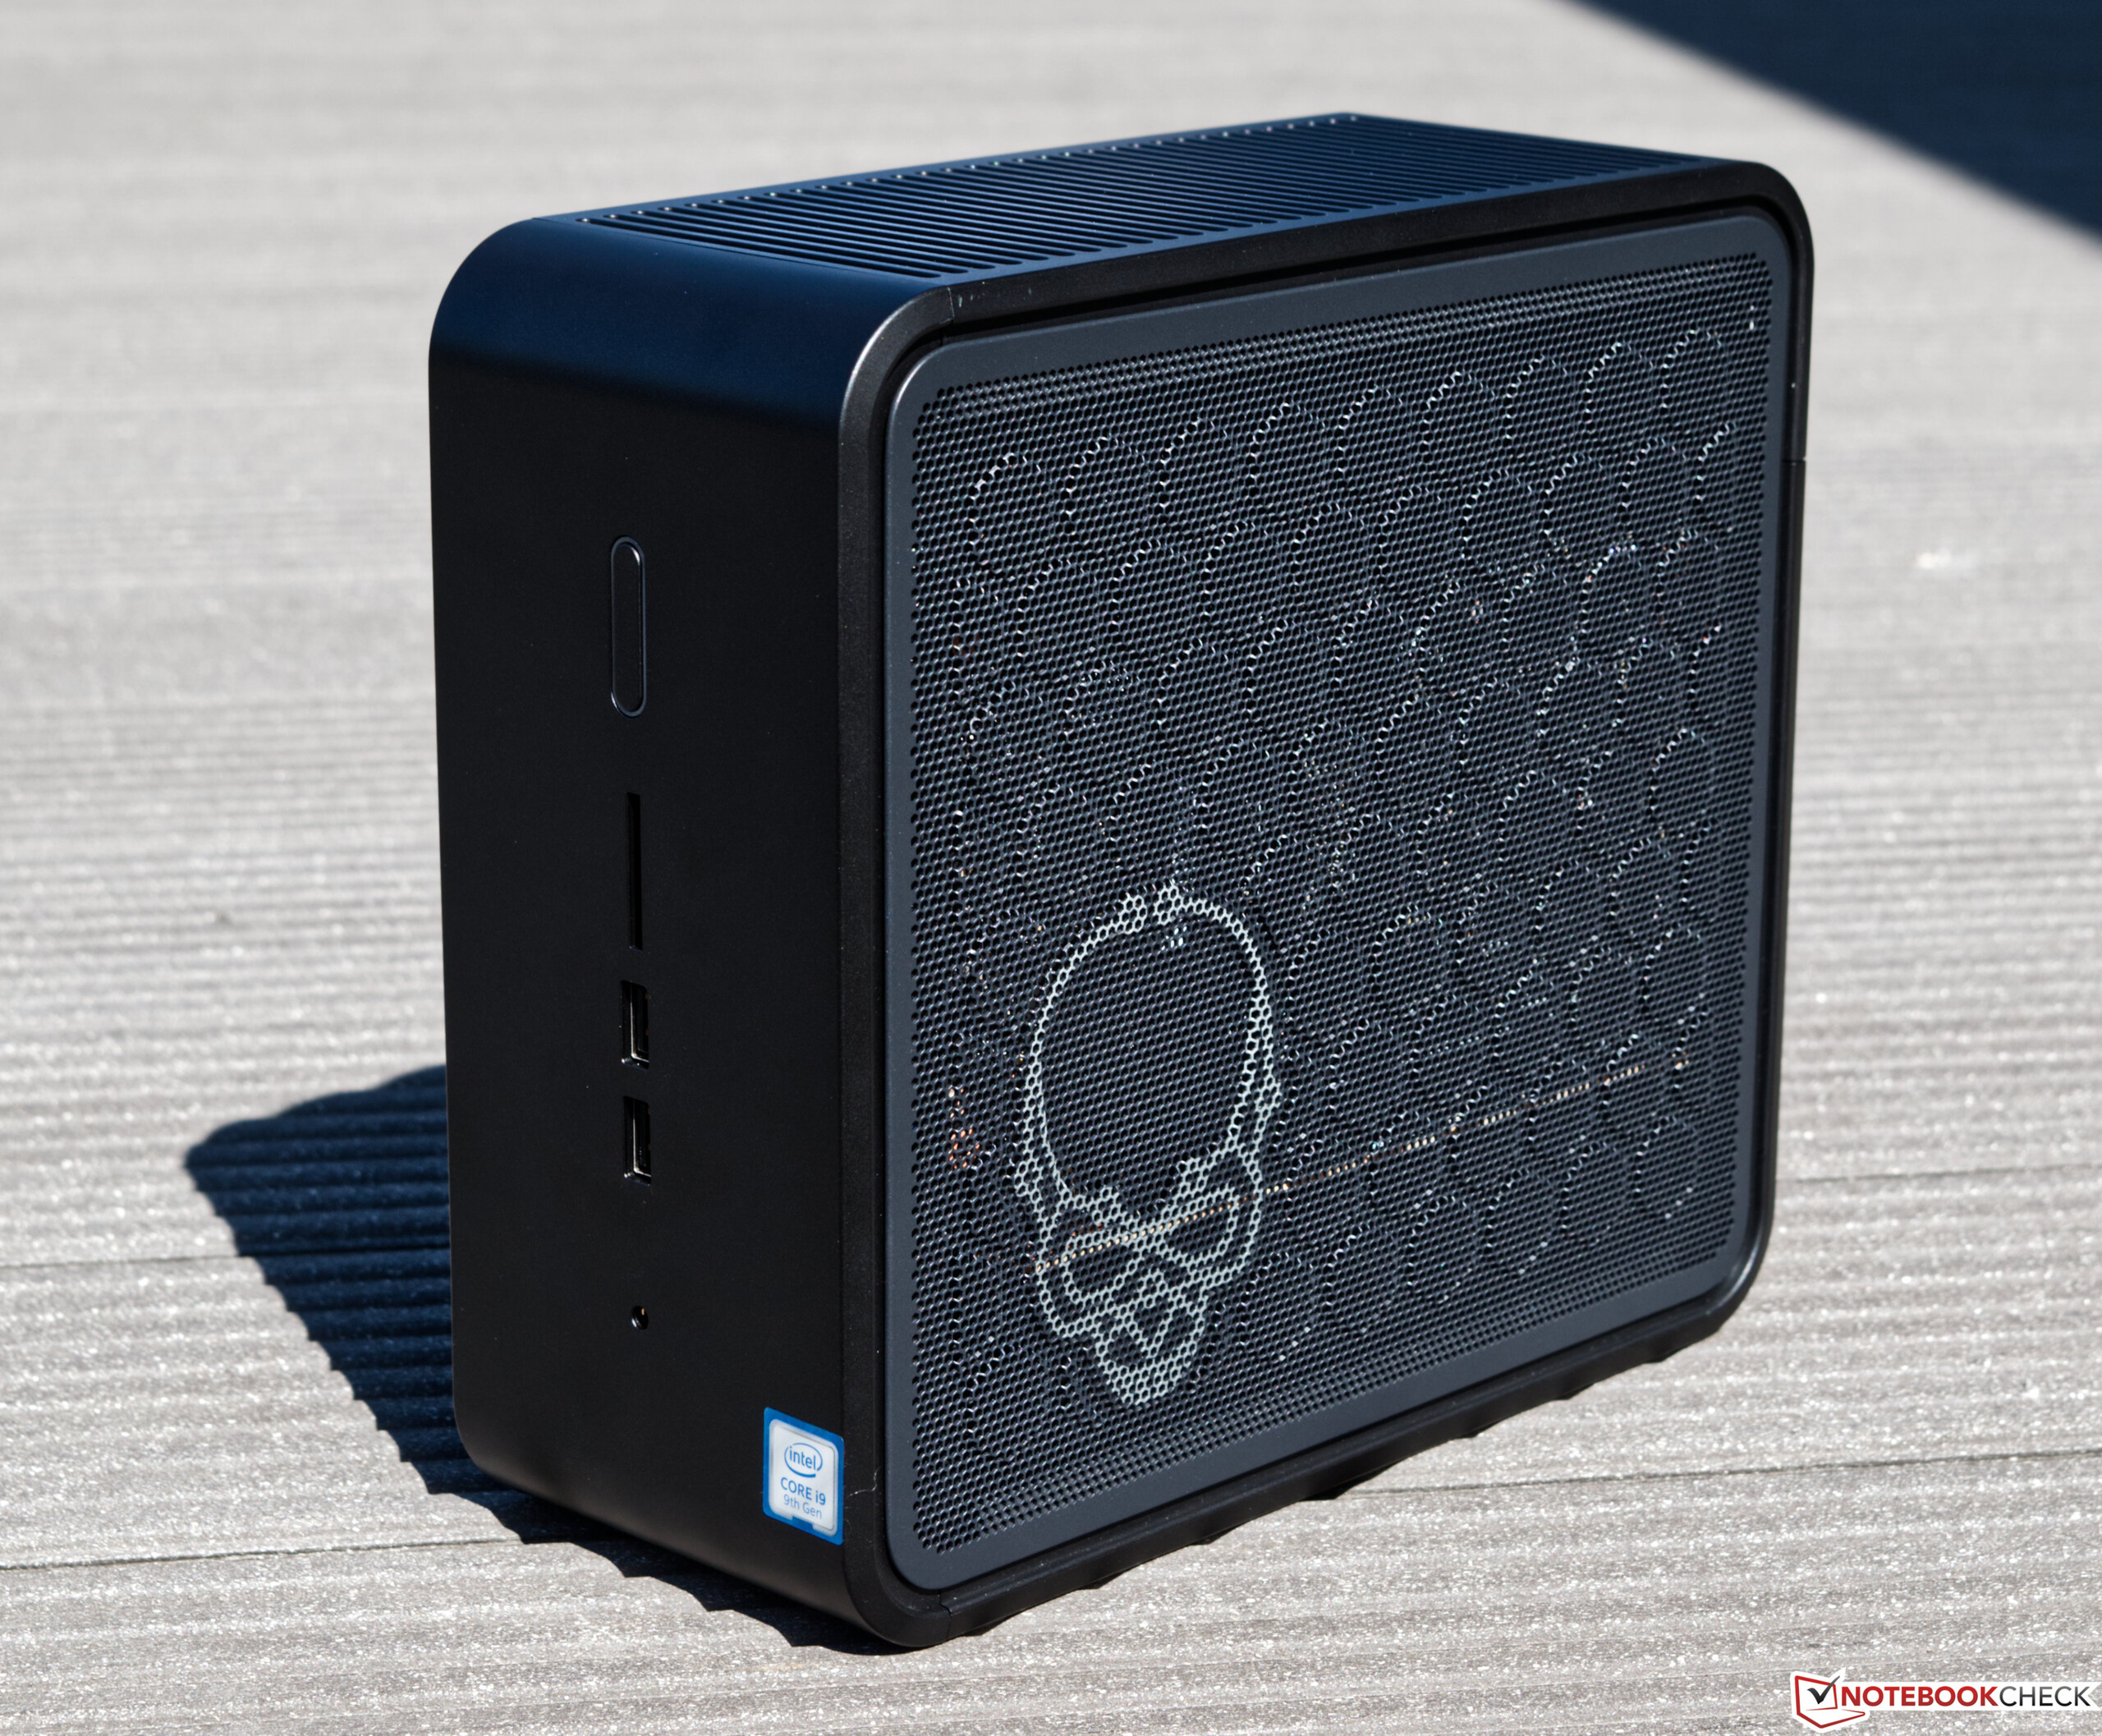
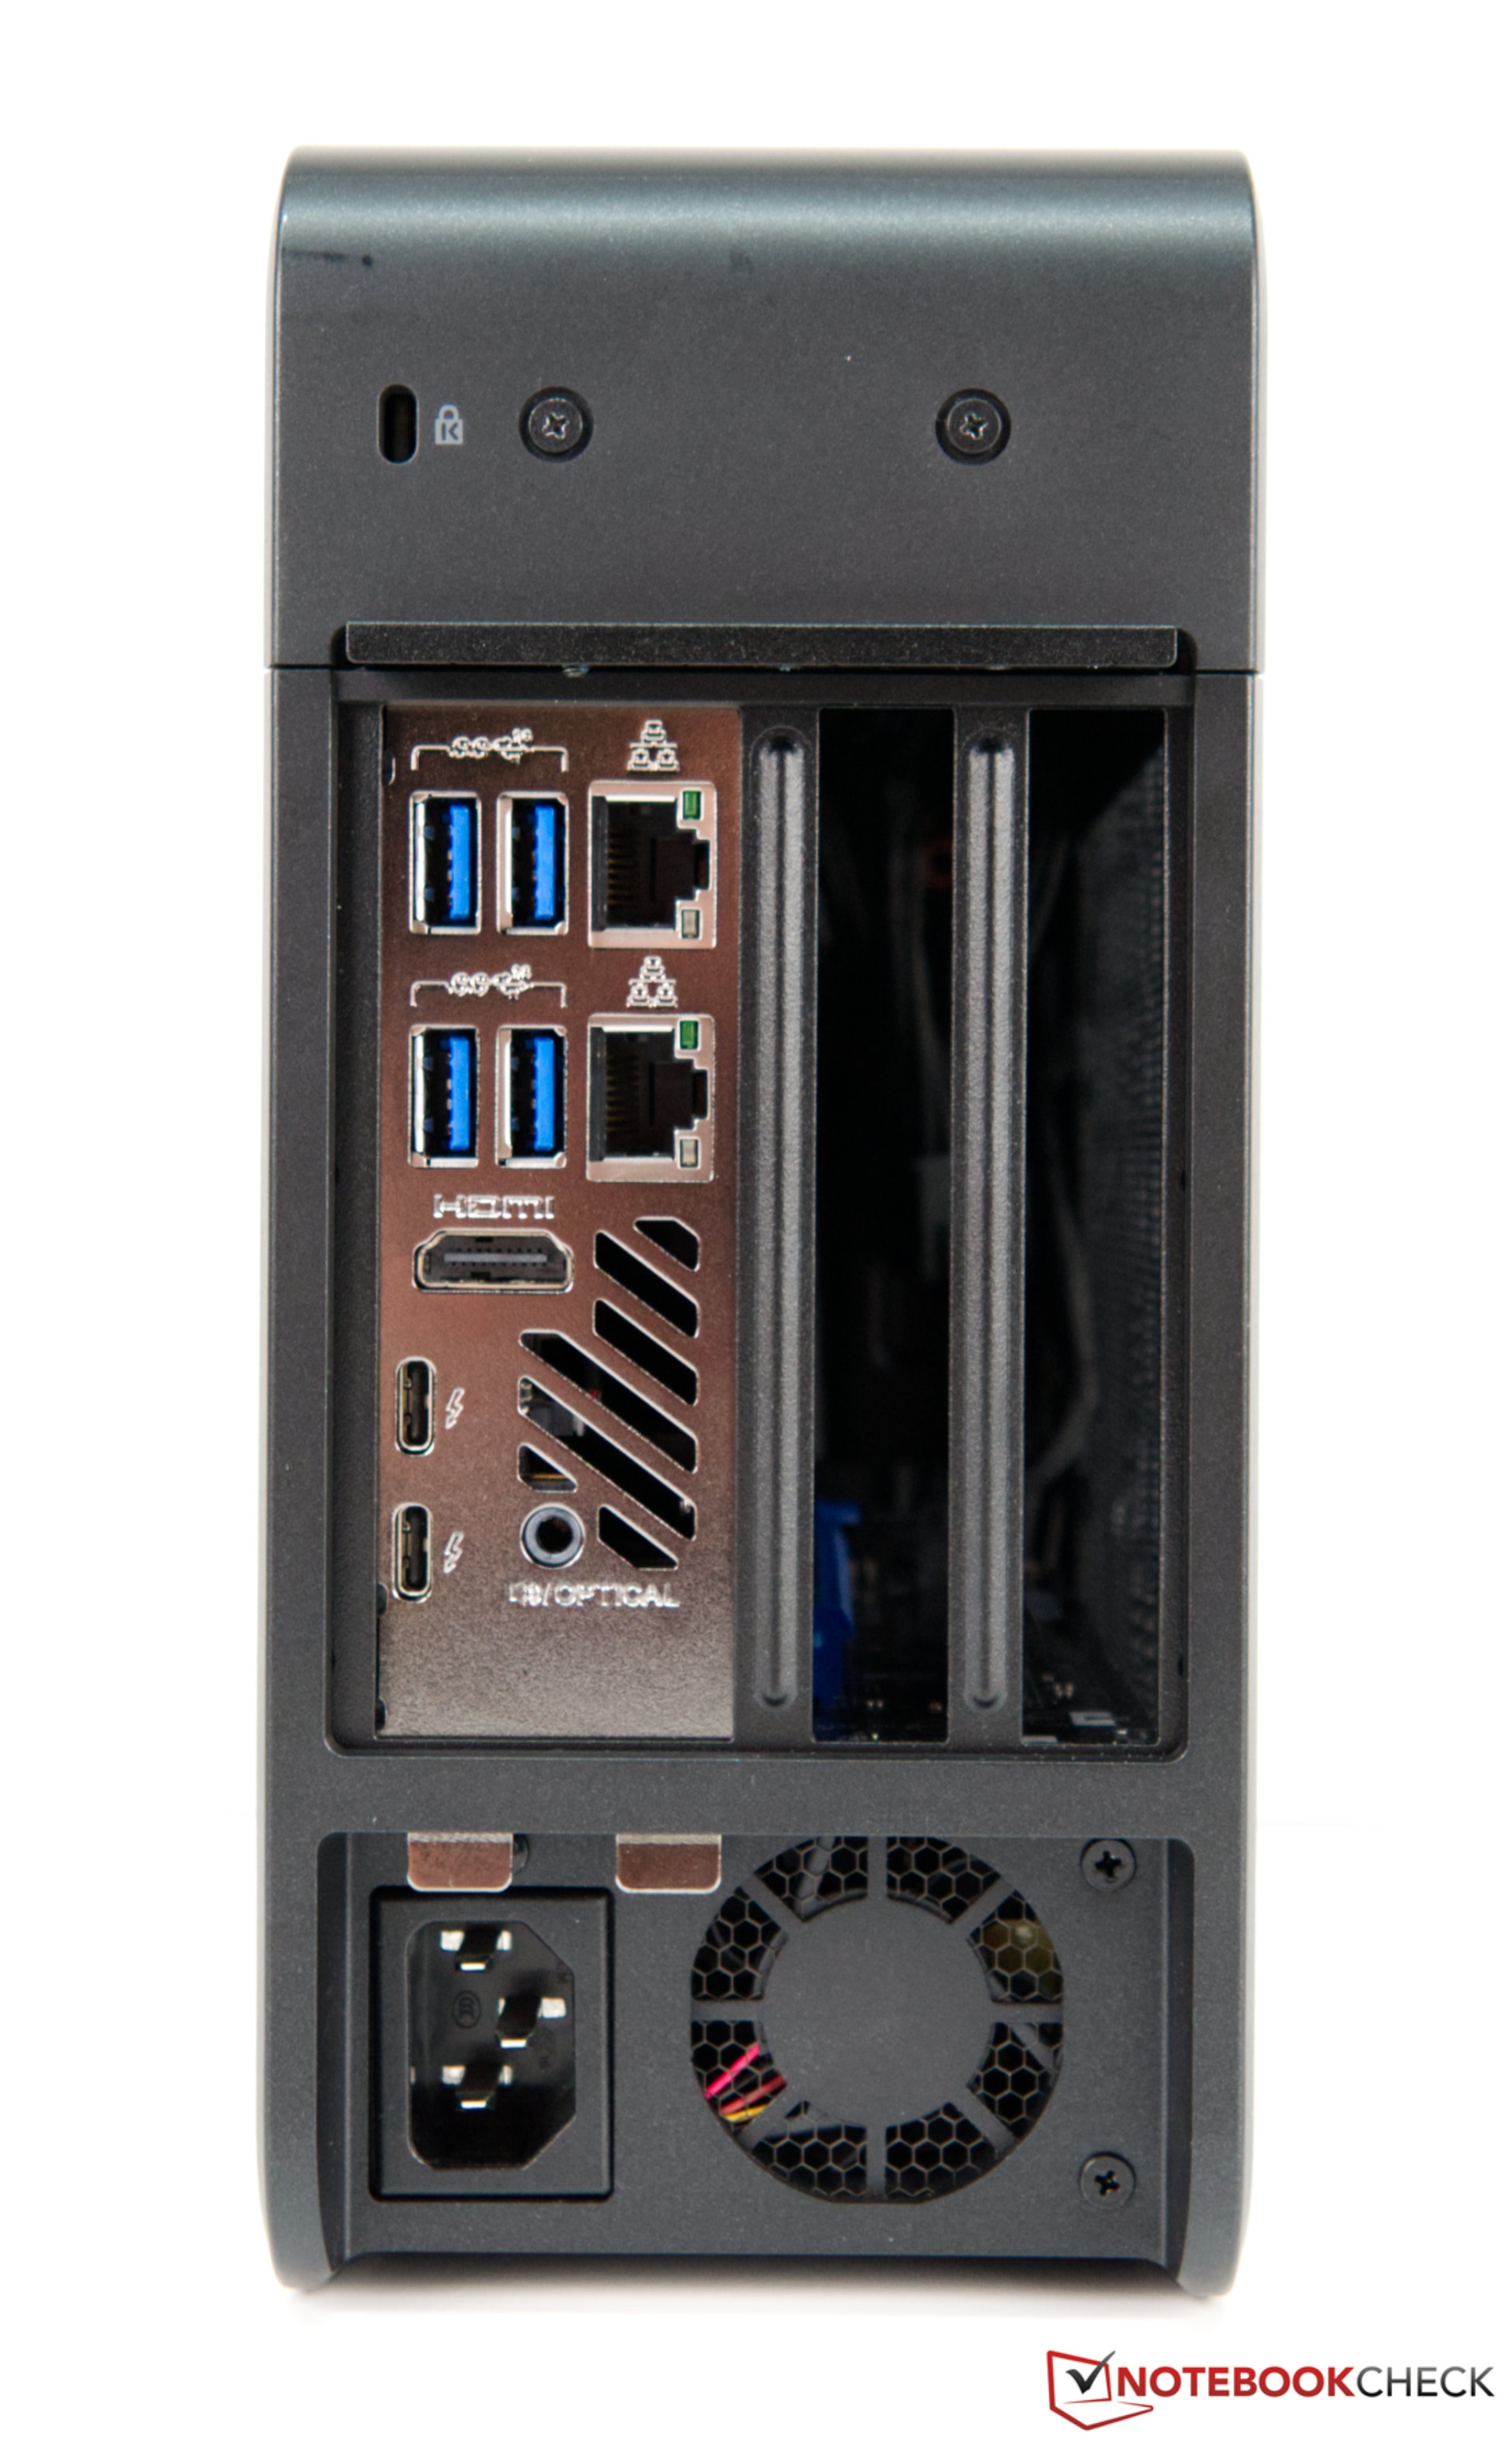
Intel NUC 9 Extreme Kit without RTX 2070

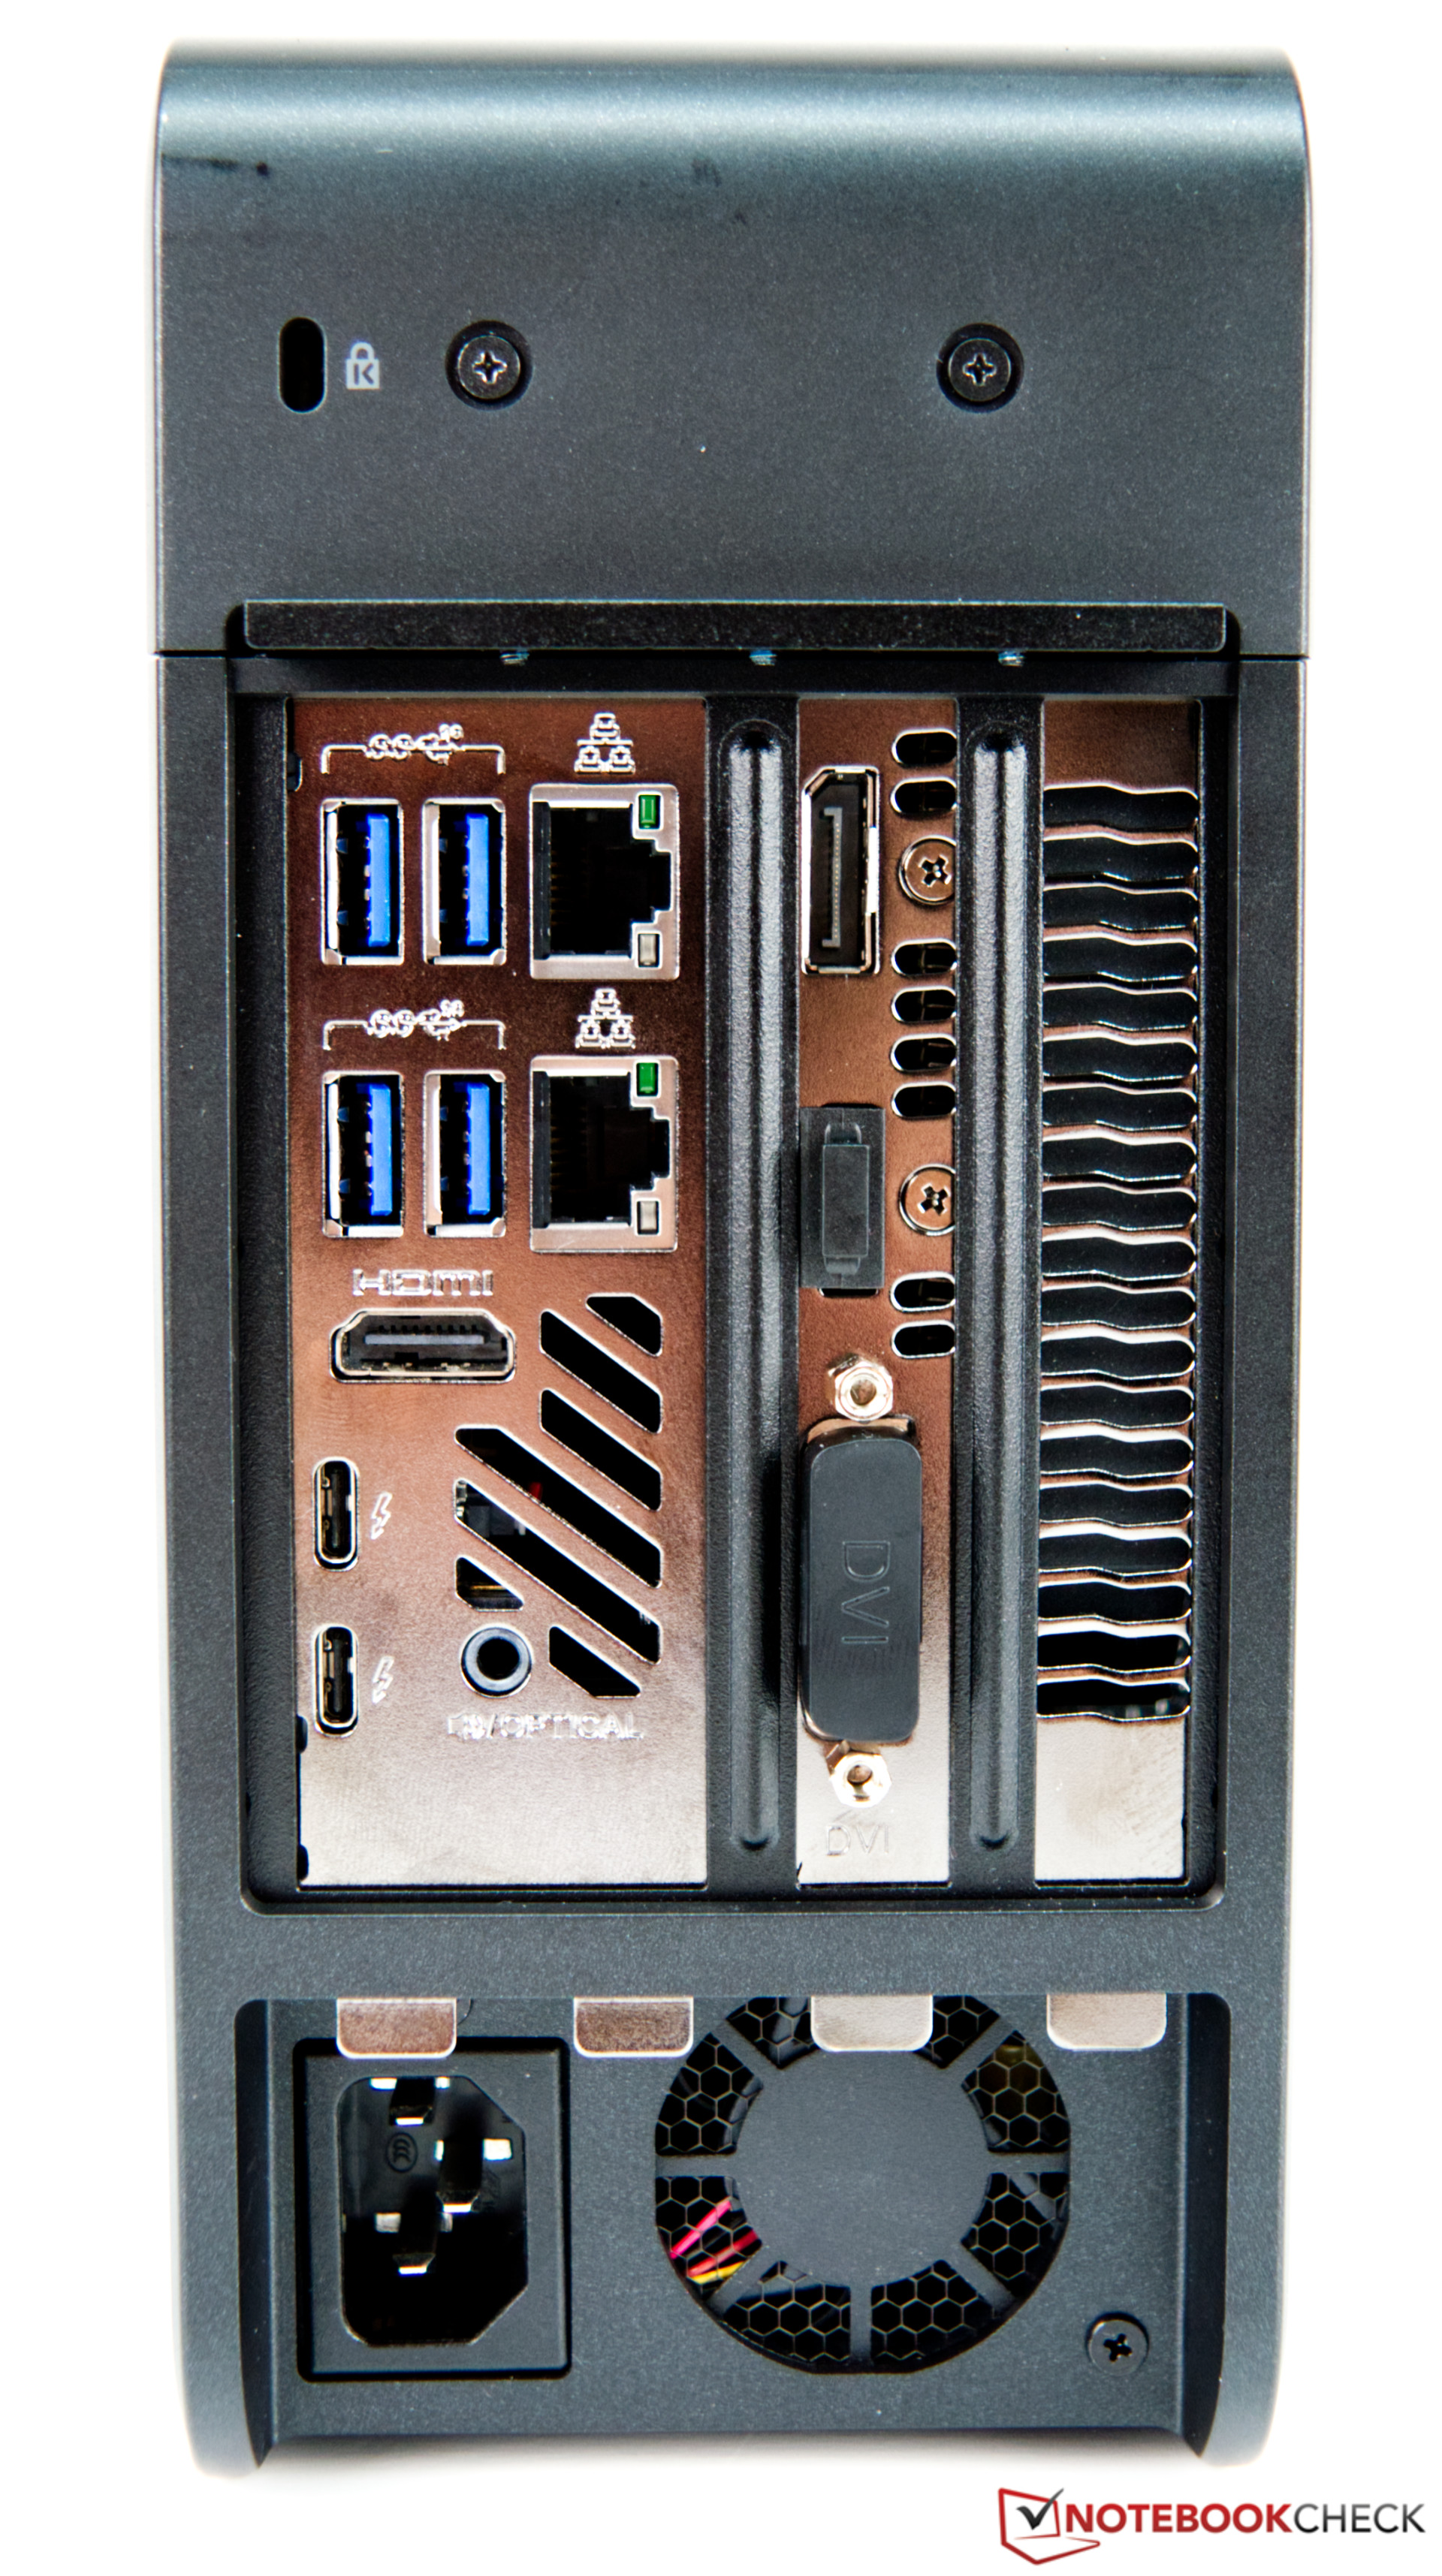
Intel NUC 9 Extreme Kit avec RTX 2070


Points positifs
Points négatifs
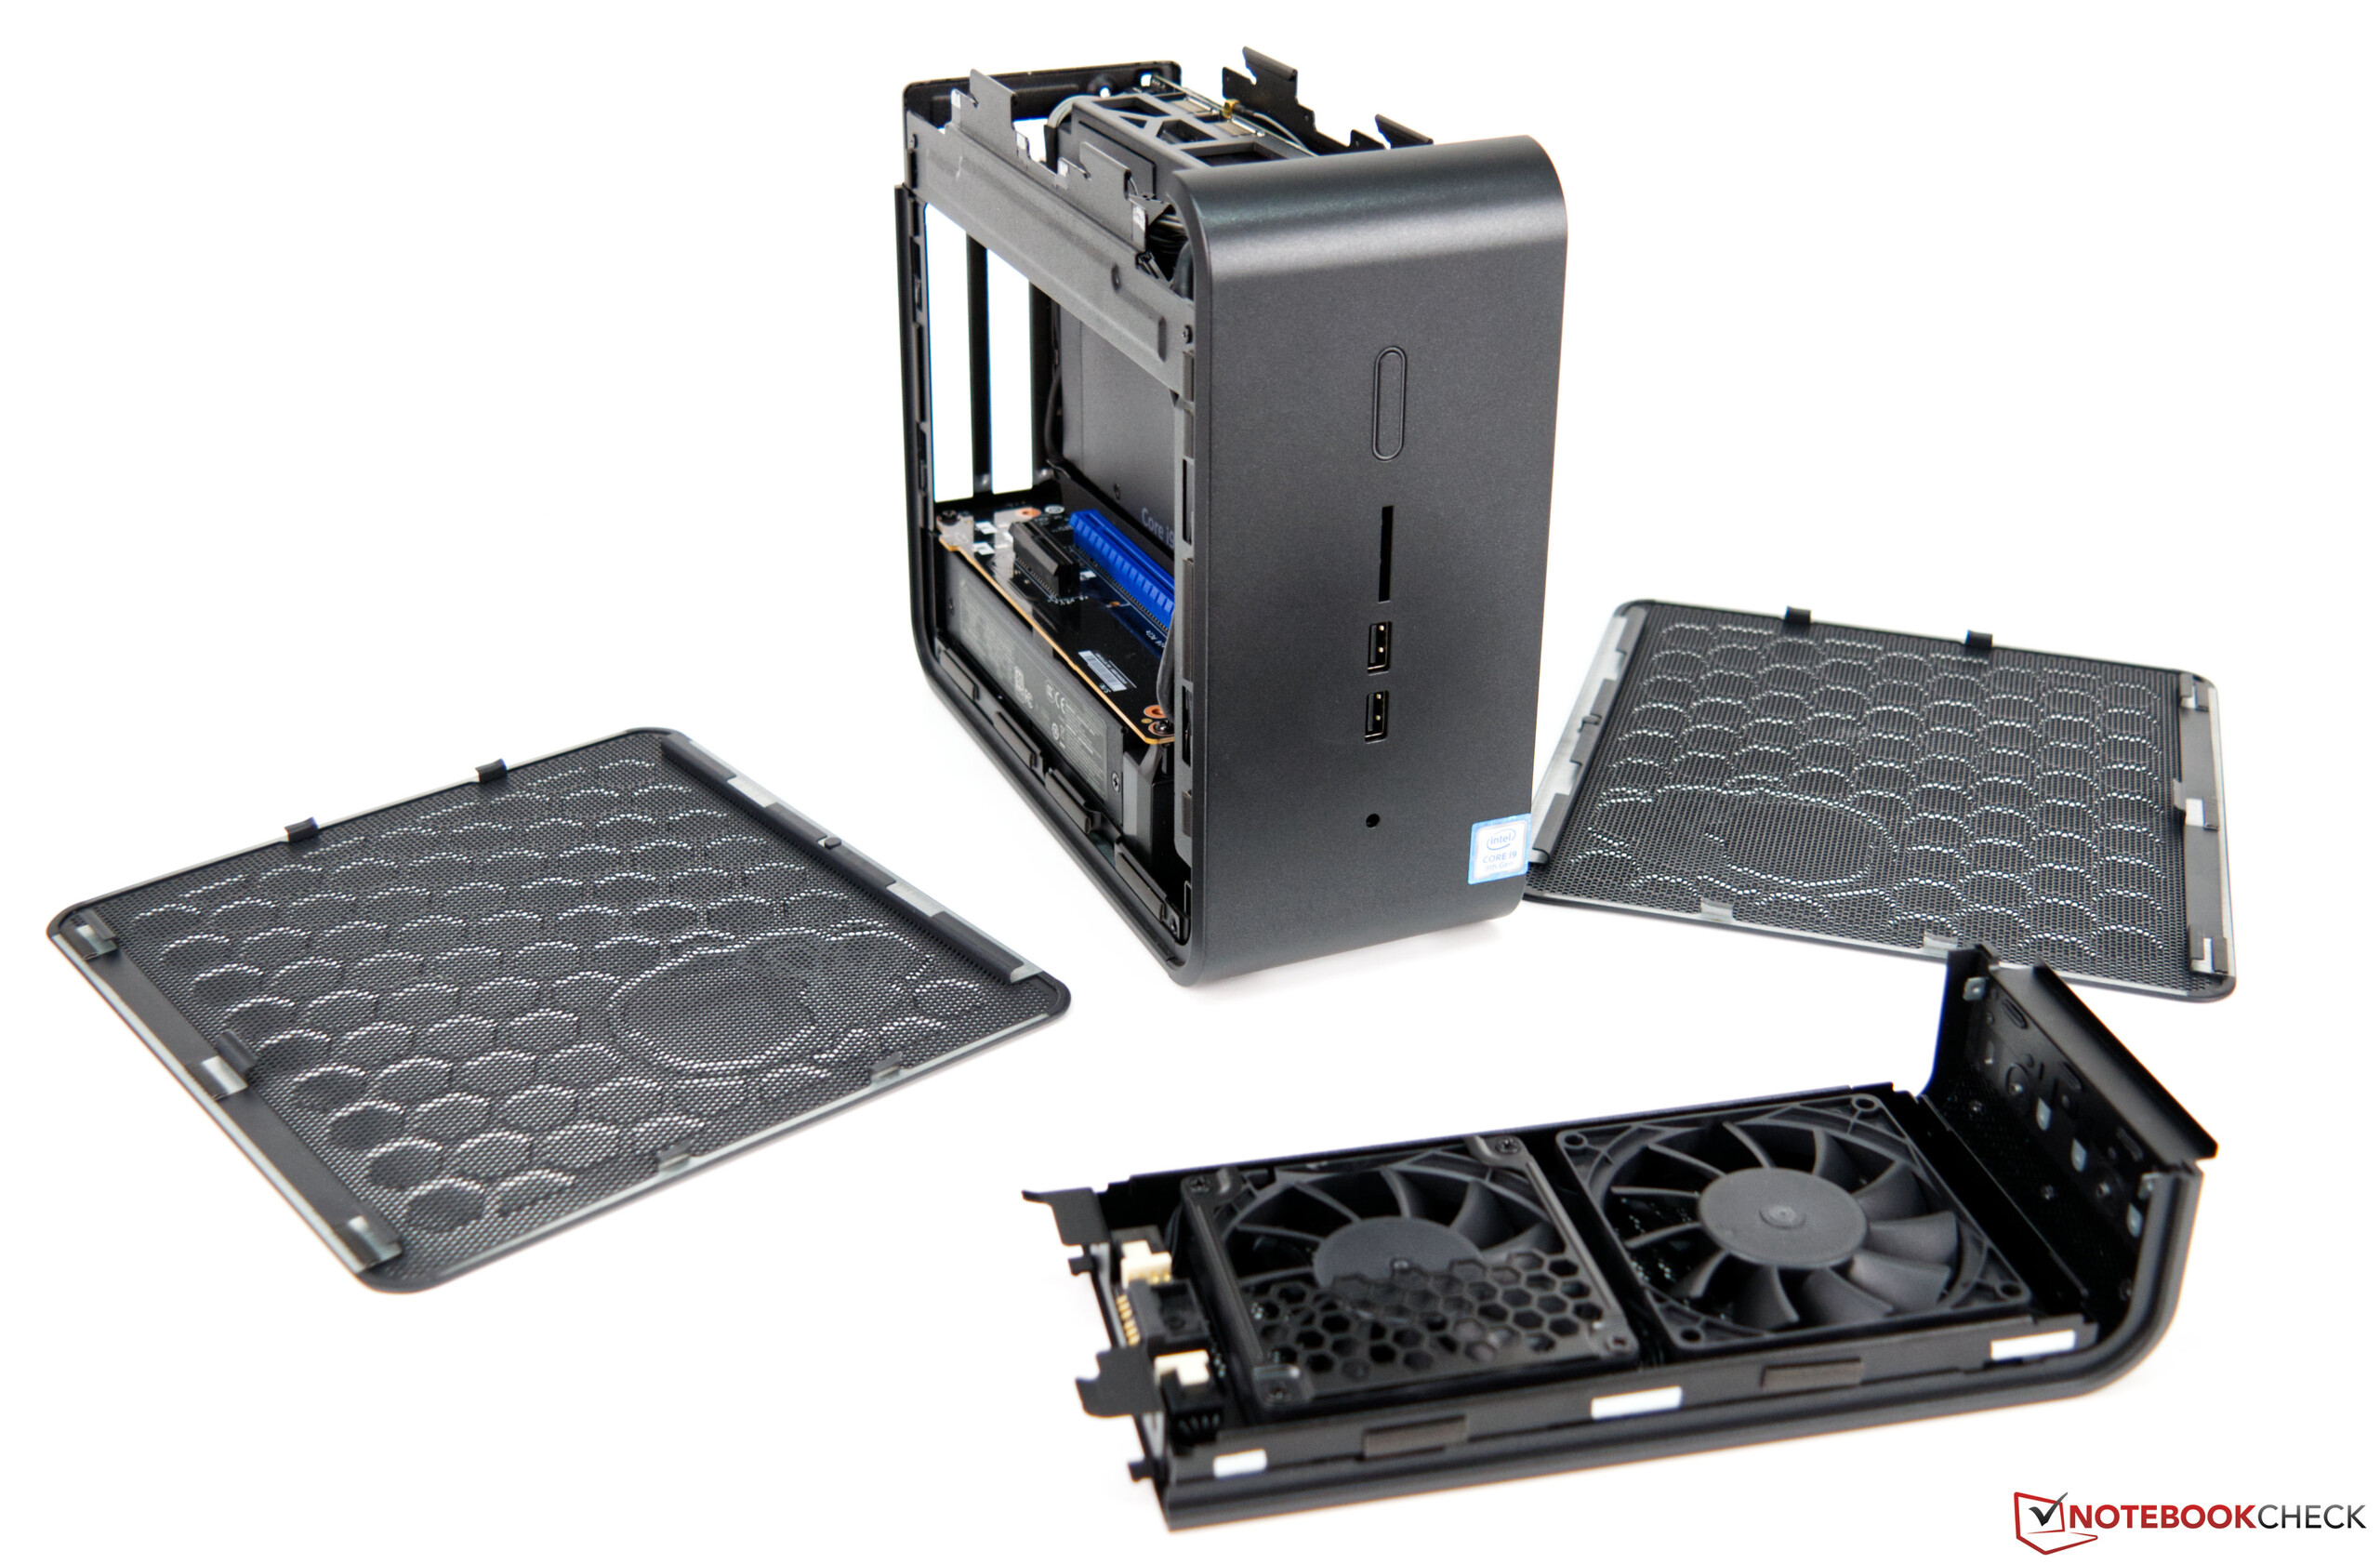
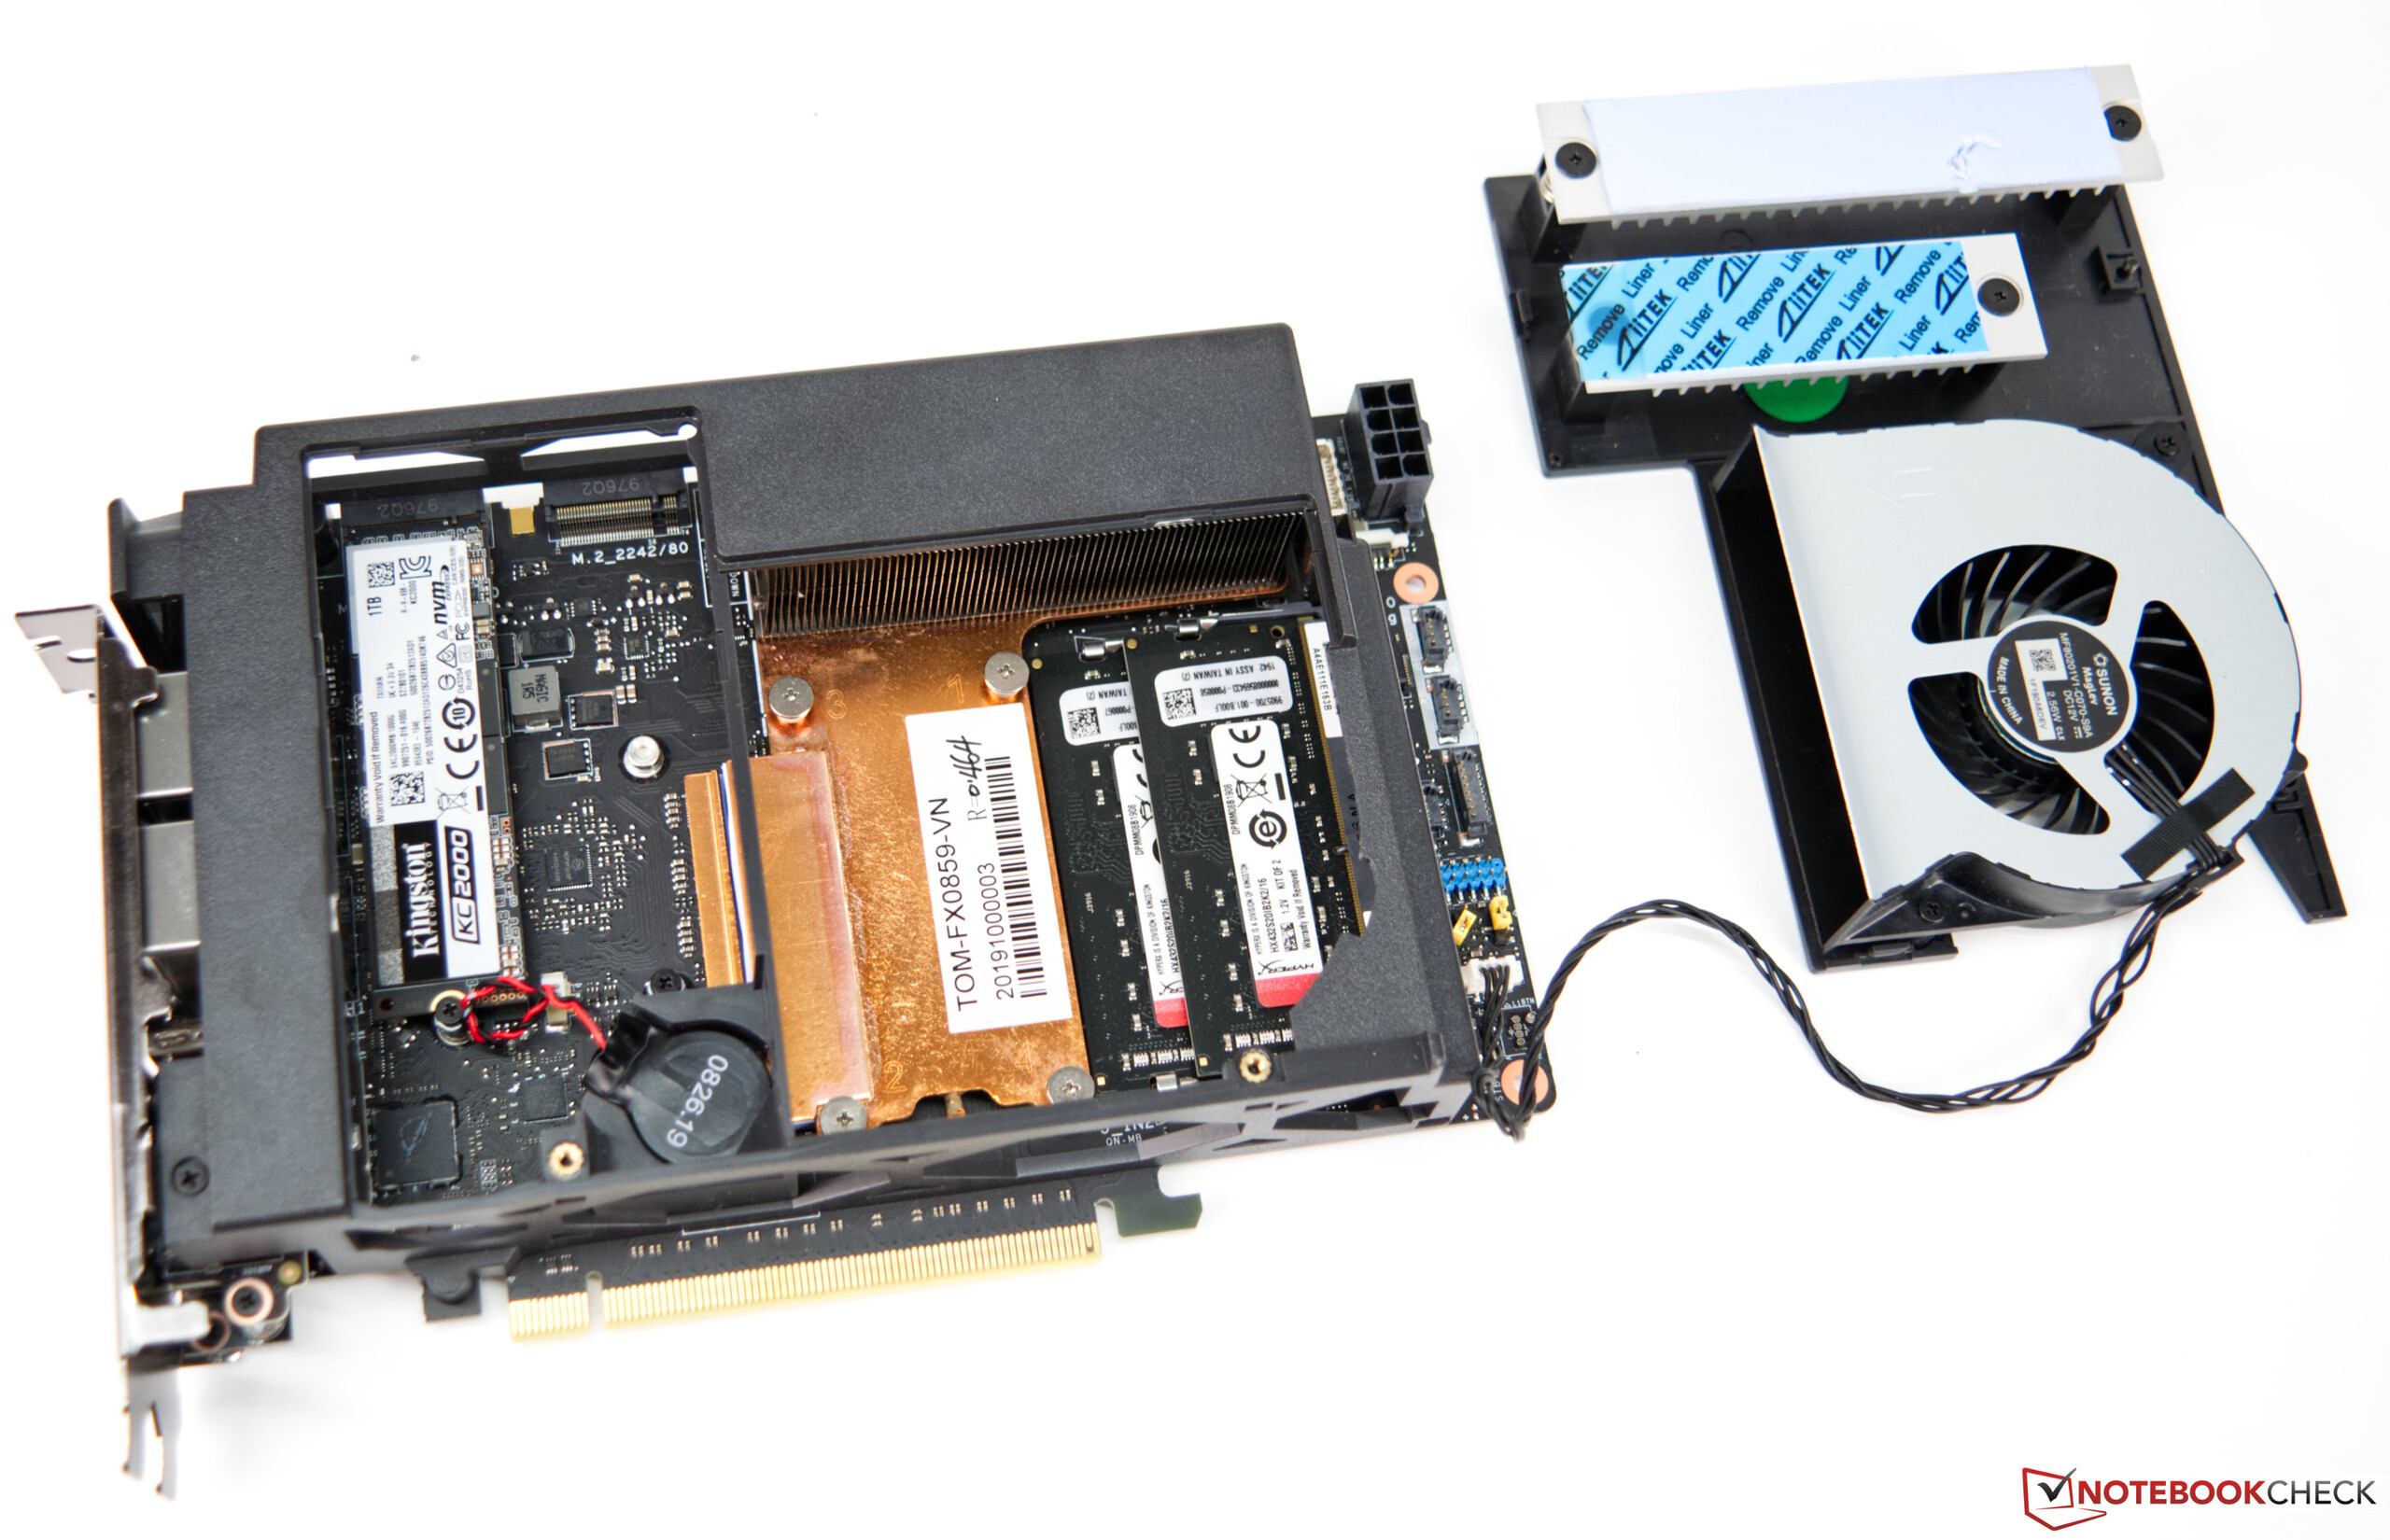
Le NUC 9 Extreme d'Intel est une petite machine, mais très puissante. Pour 1 700 €, il n'est en rien une affaire, d'autant qu'il faudra ajouter la RAM, le stockage, et le cas échéant une carte graphique. En contrepartie, la machine est bien équipée et moderne. Avec un GPU haut de gamme, le PC miniature se transforme en PC de jeu complet, capable de faire tourner fluidement même les jeux les plus récents.
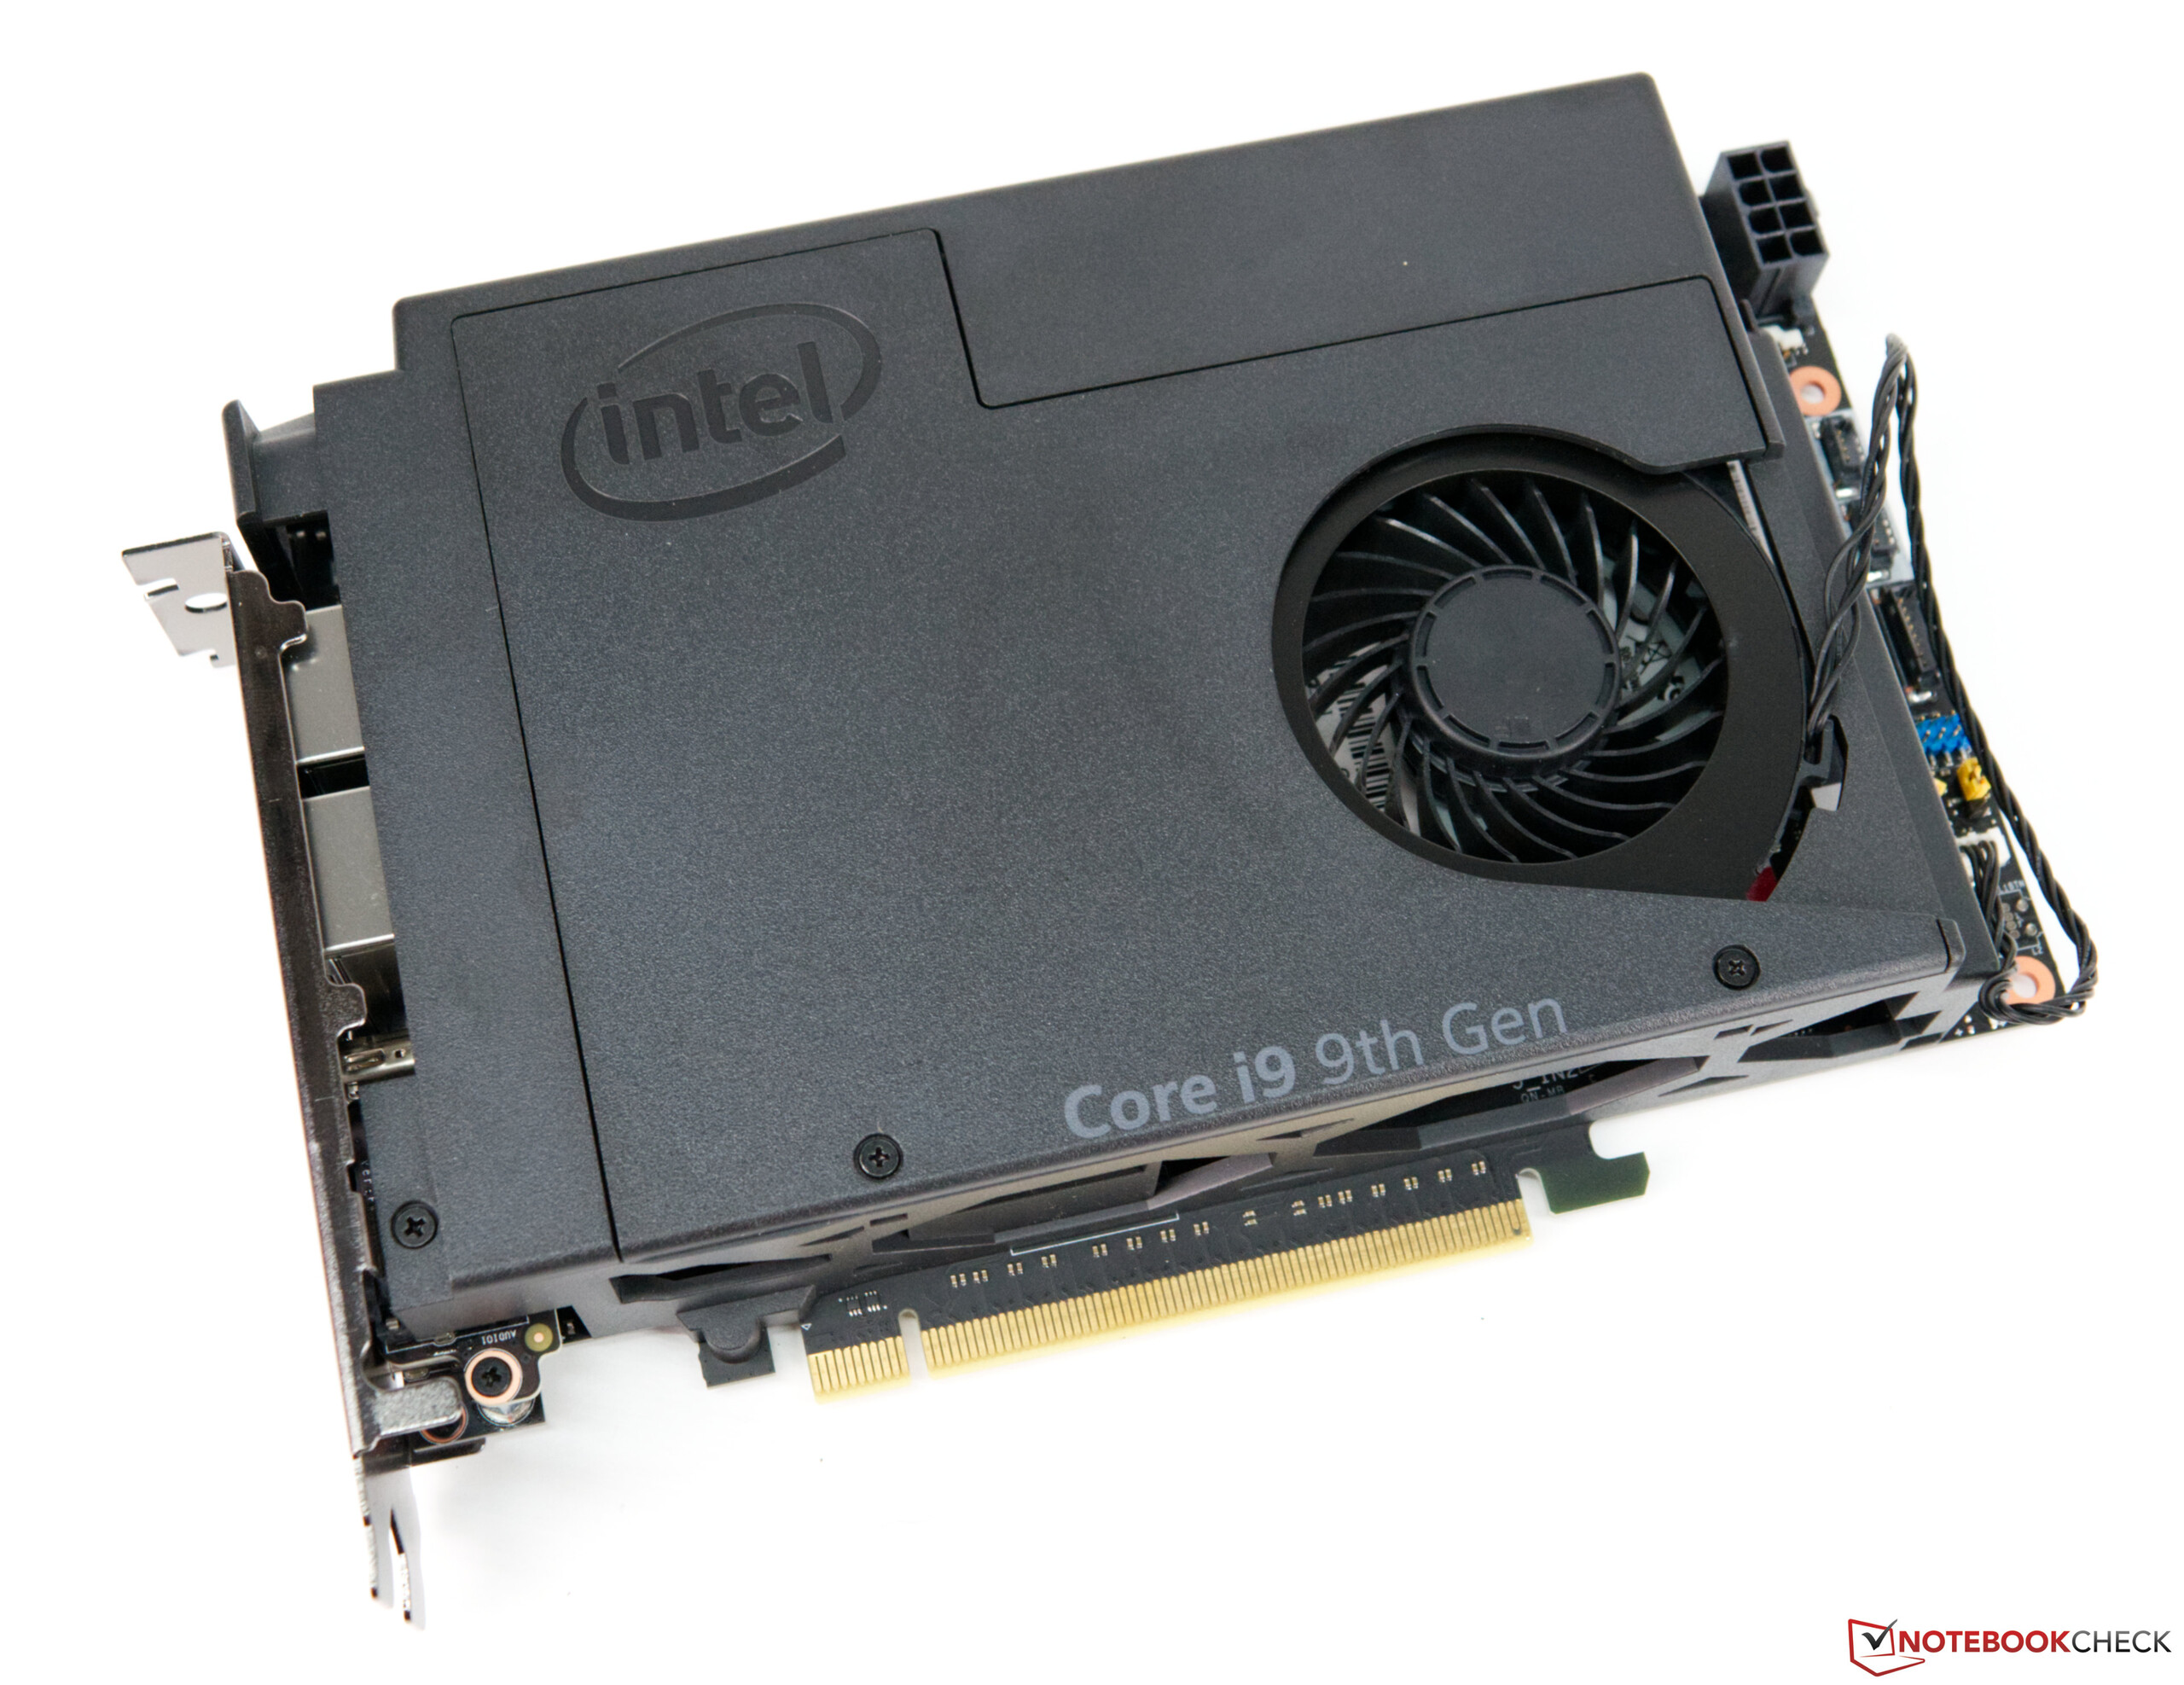
Si vous n'avez pas besoin des performances 8 cœurs de l'Intel Core i9-9980HK, il est également possible de choisir des versions avec des i7-9750H ou des i5-9300H moins puissants. Les deux sont souvent présent dans les portables de jeu, et s'avèrent puissants. Le Core i9-9980HK reste cependant le meilleur du ce NUC.
Malgré ses excellentes performances, l'ordinateur puissant compact aura du mal à faire son chemin jusque dans les maisons des joueurs, à cause de son prix.
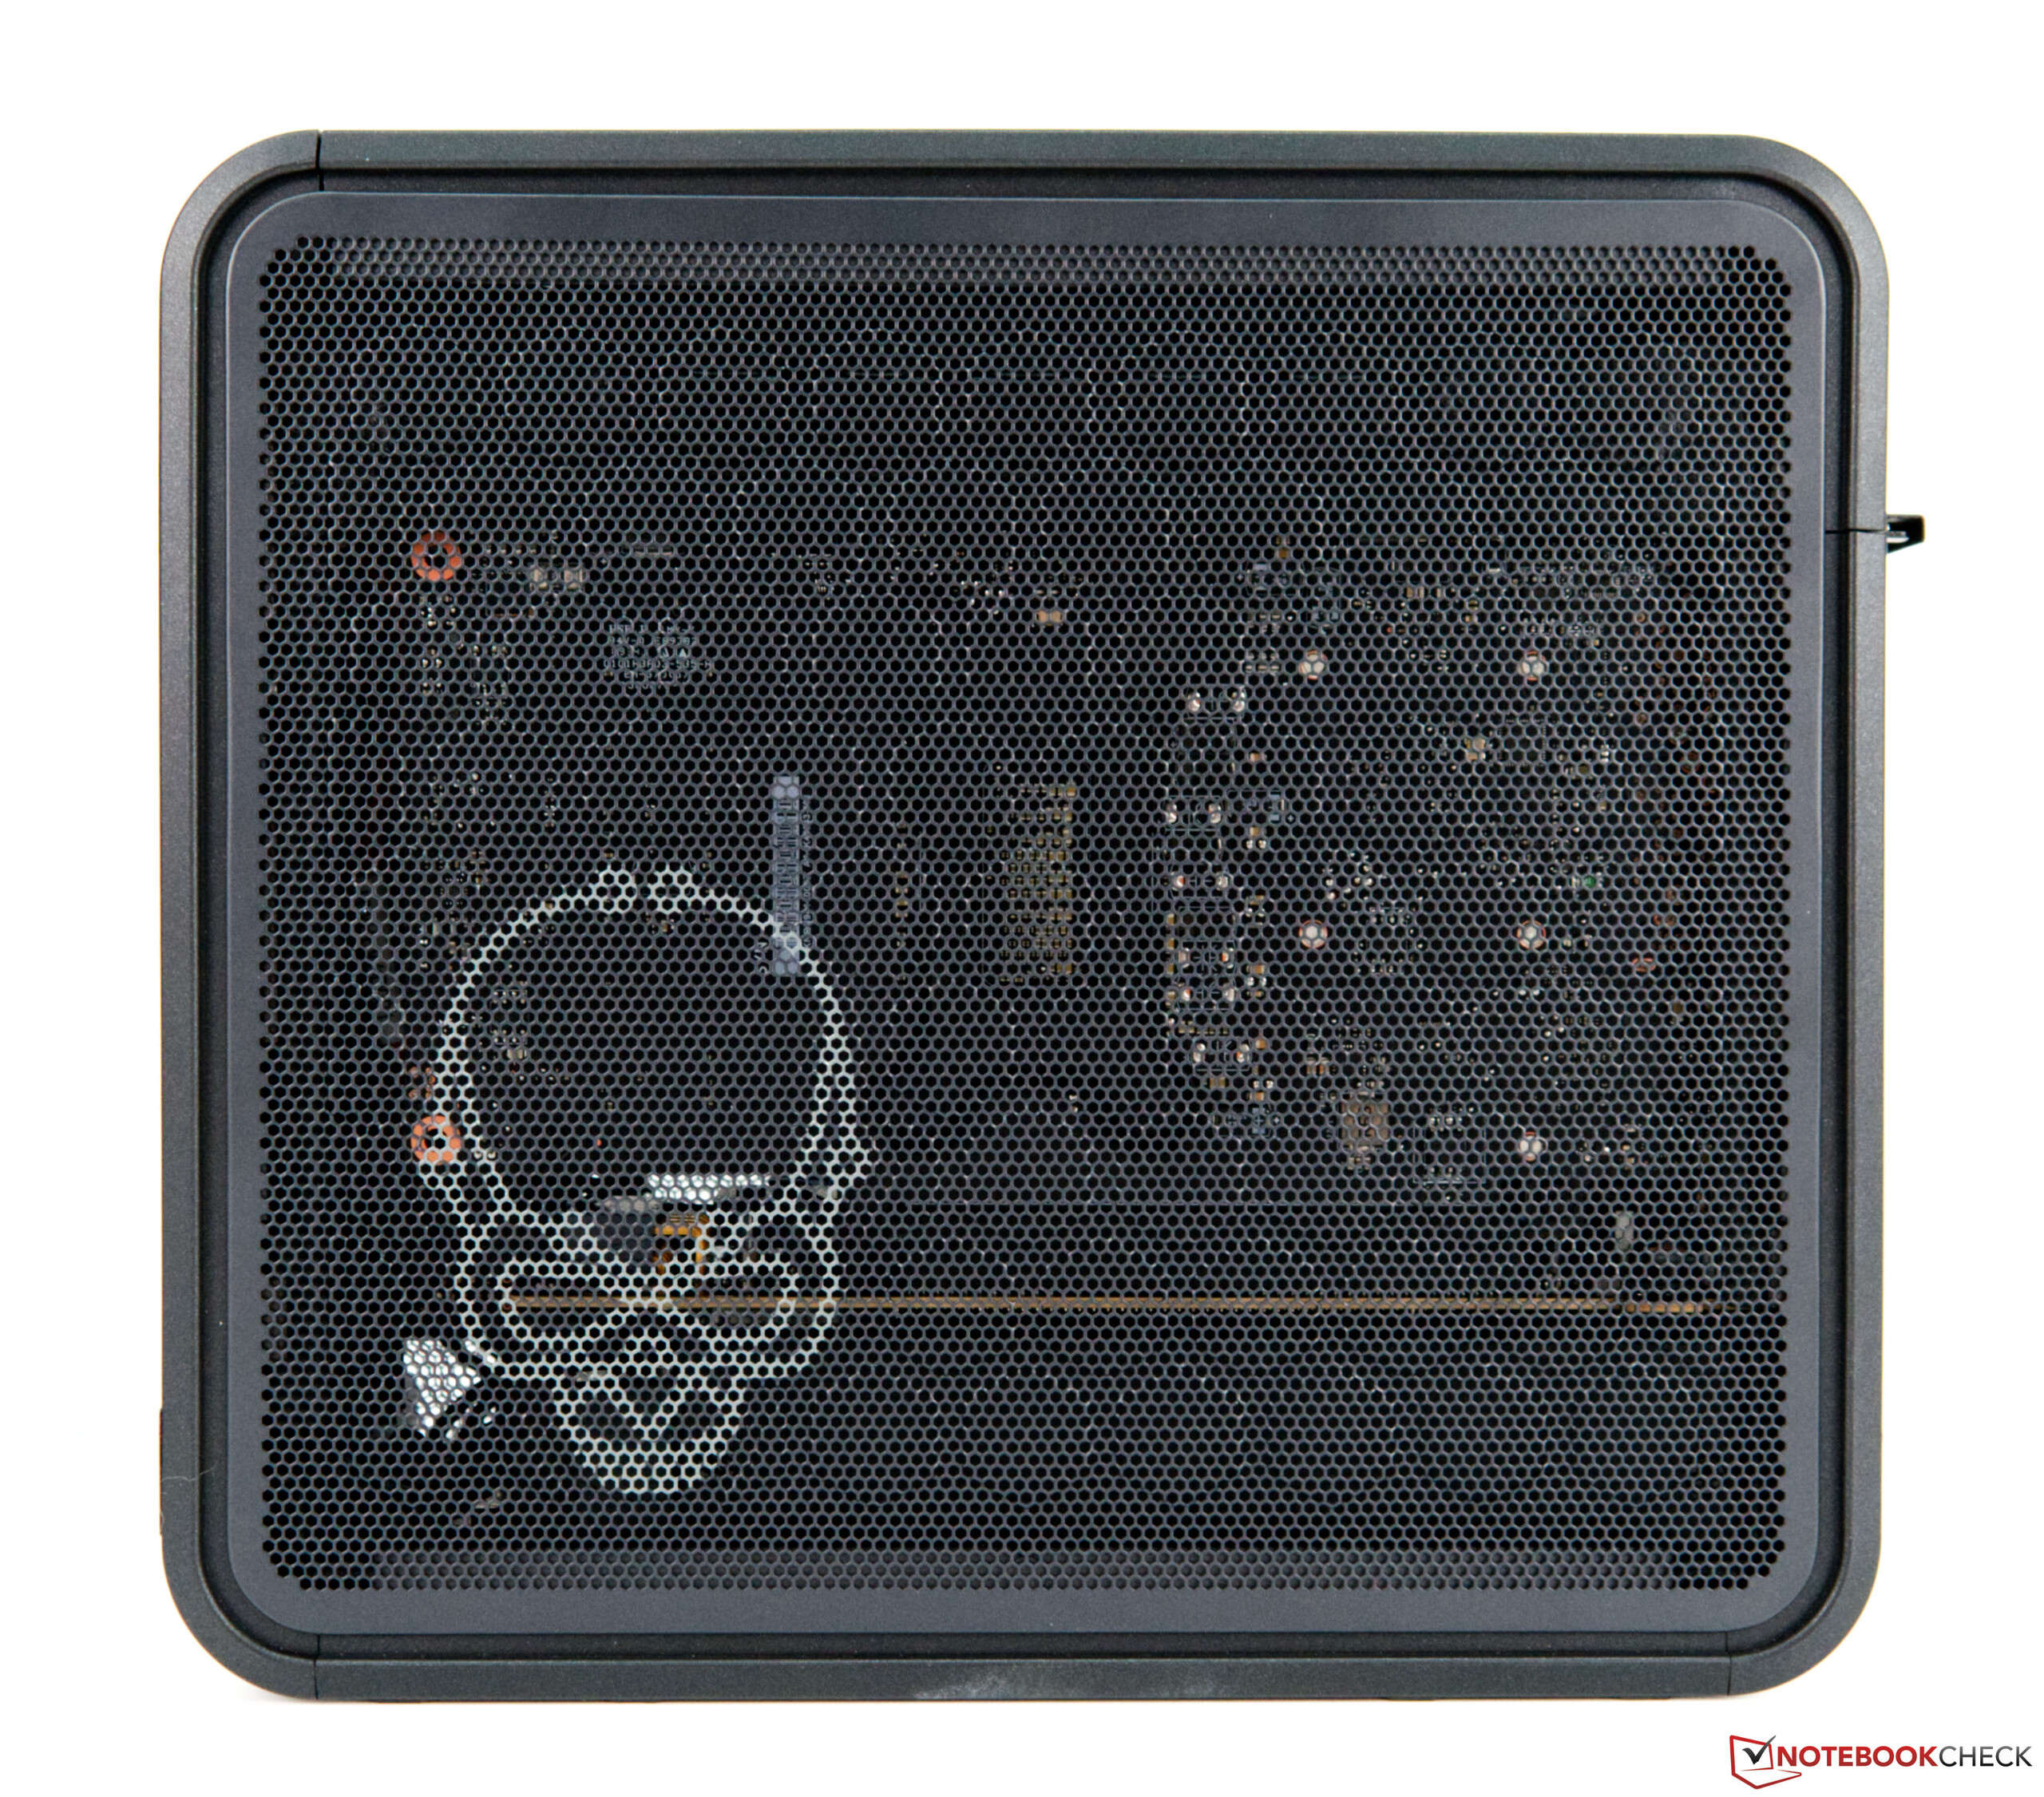
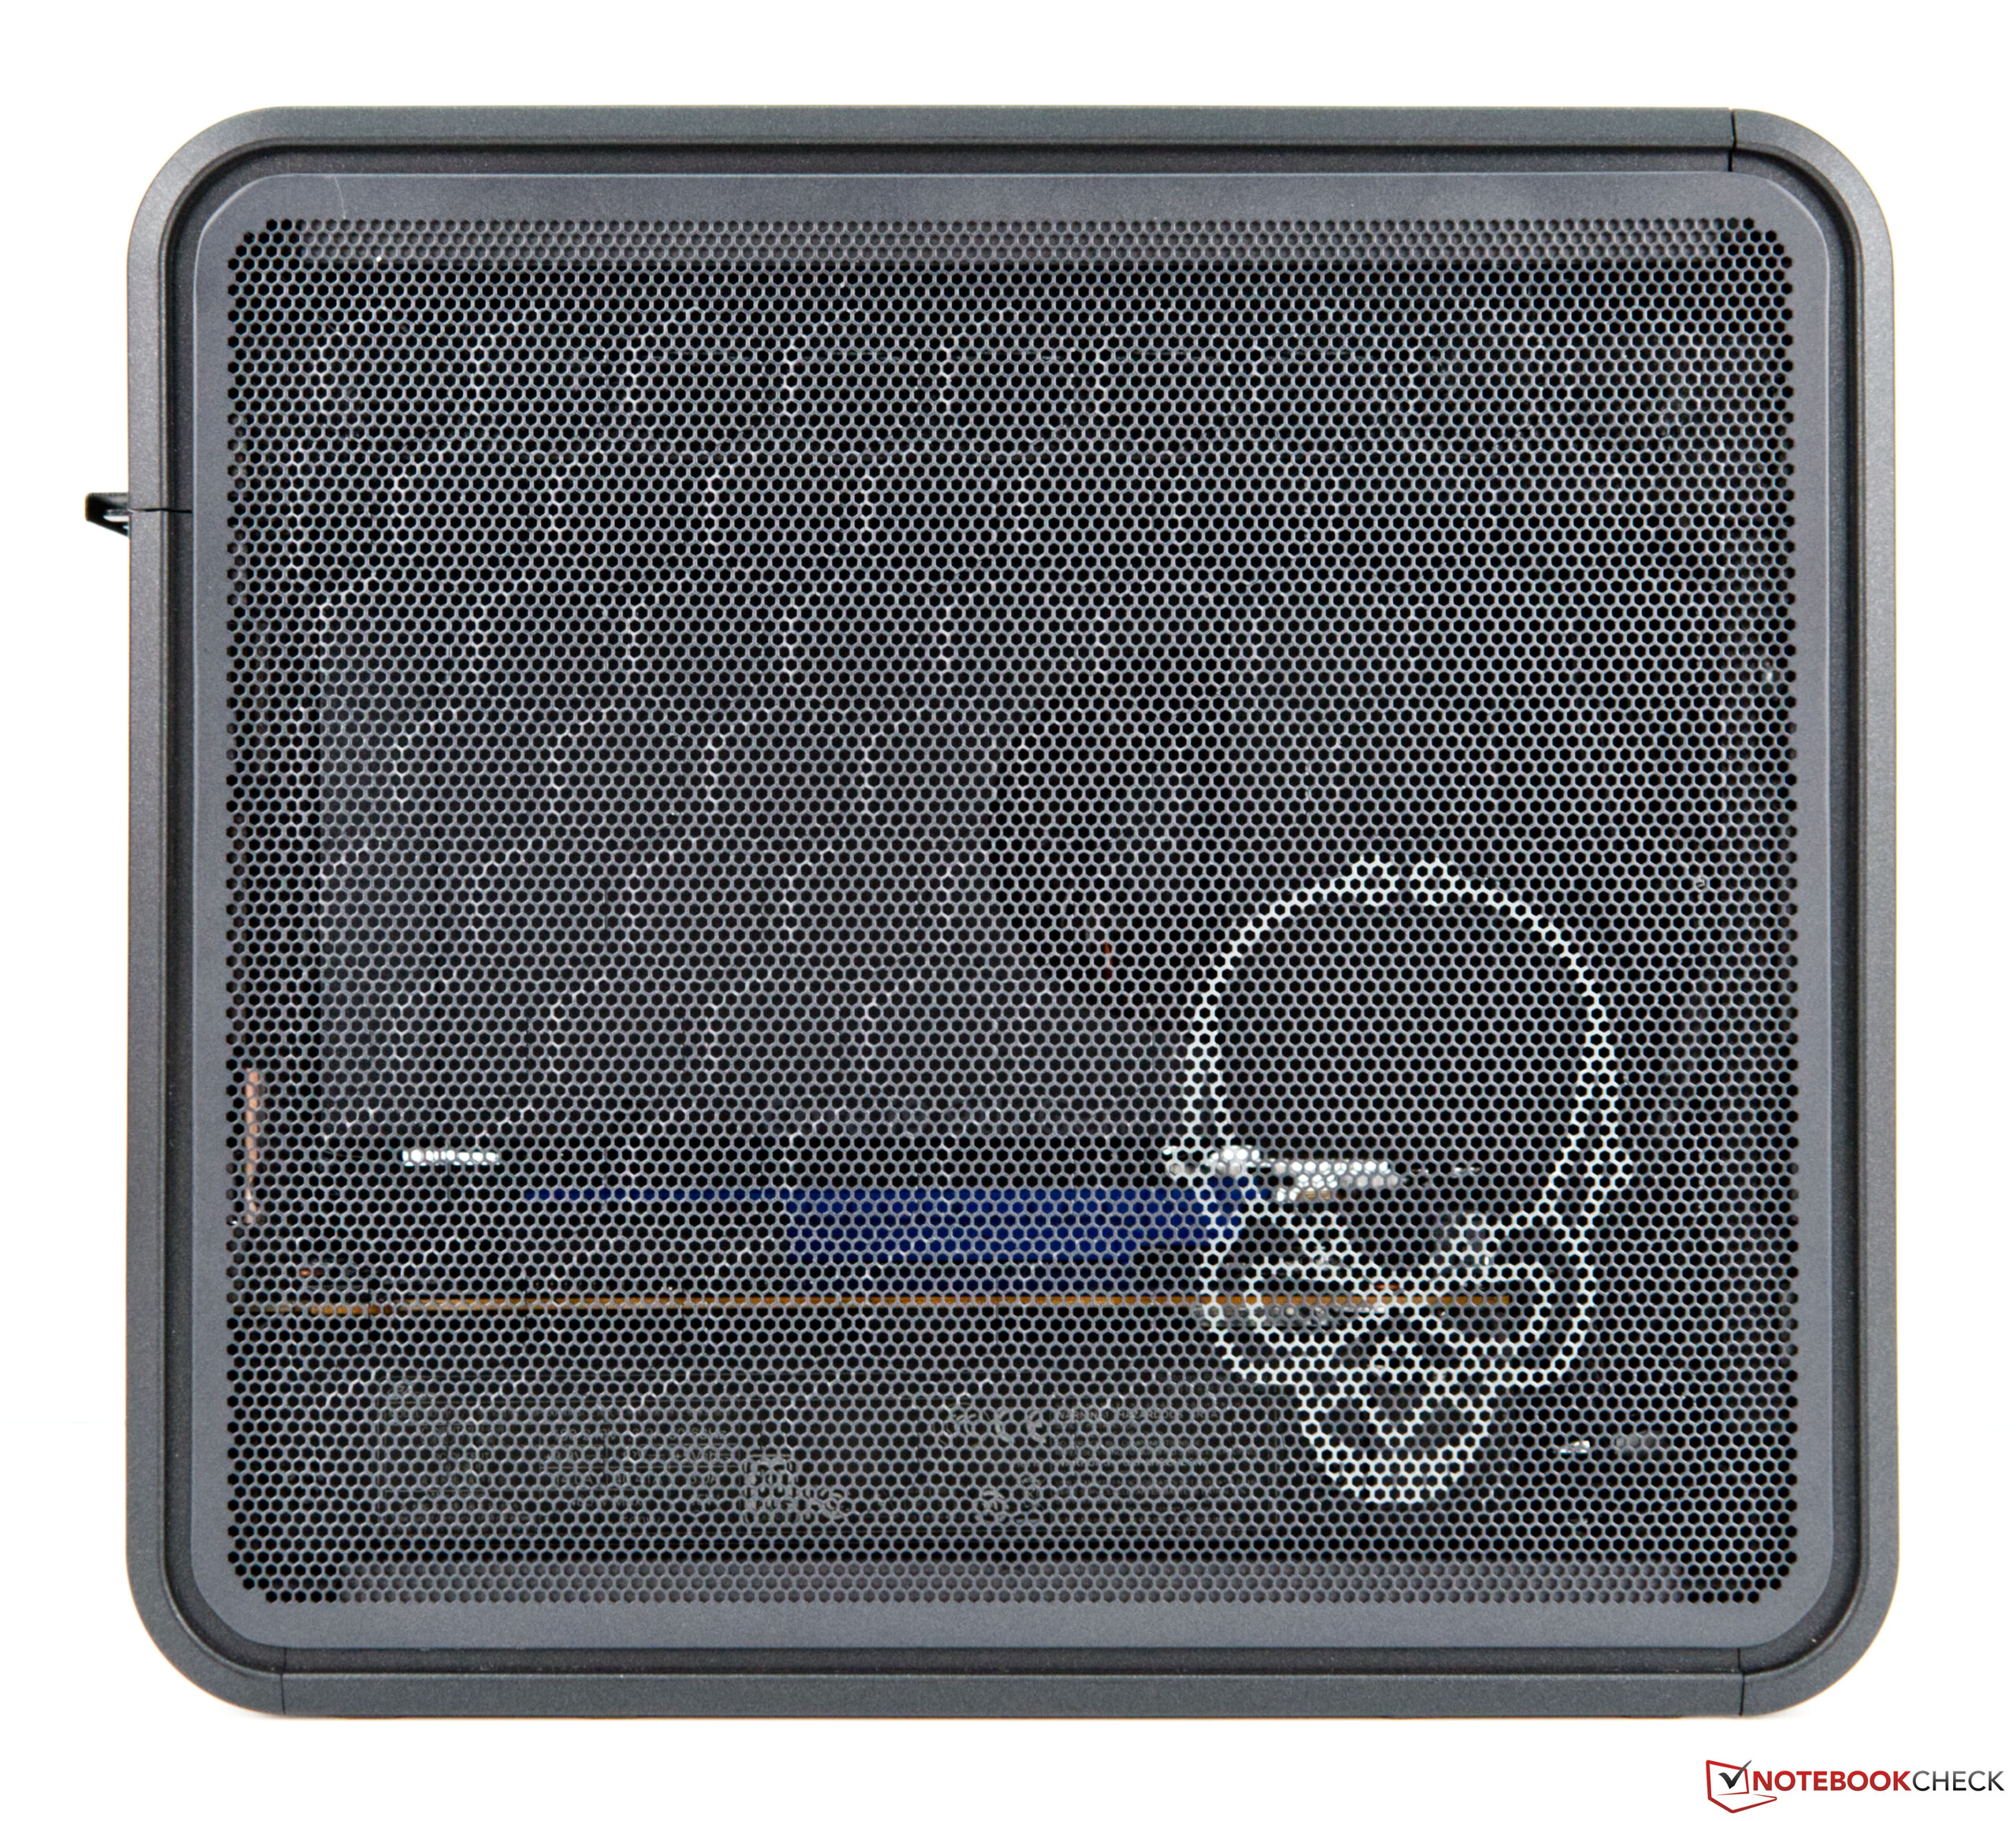
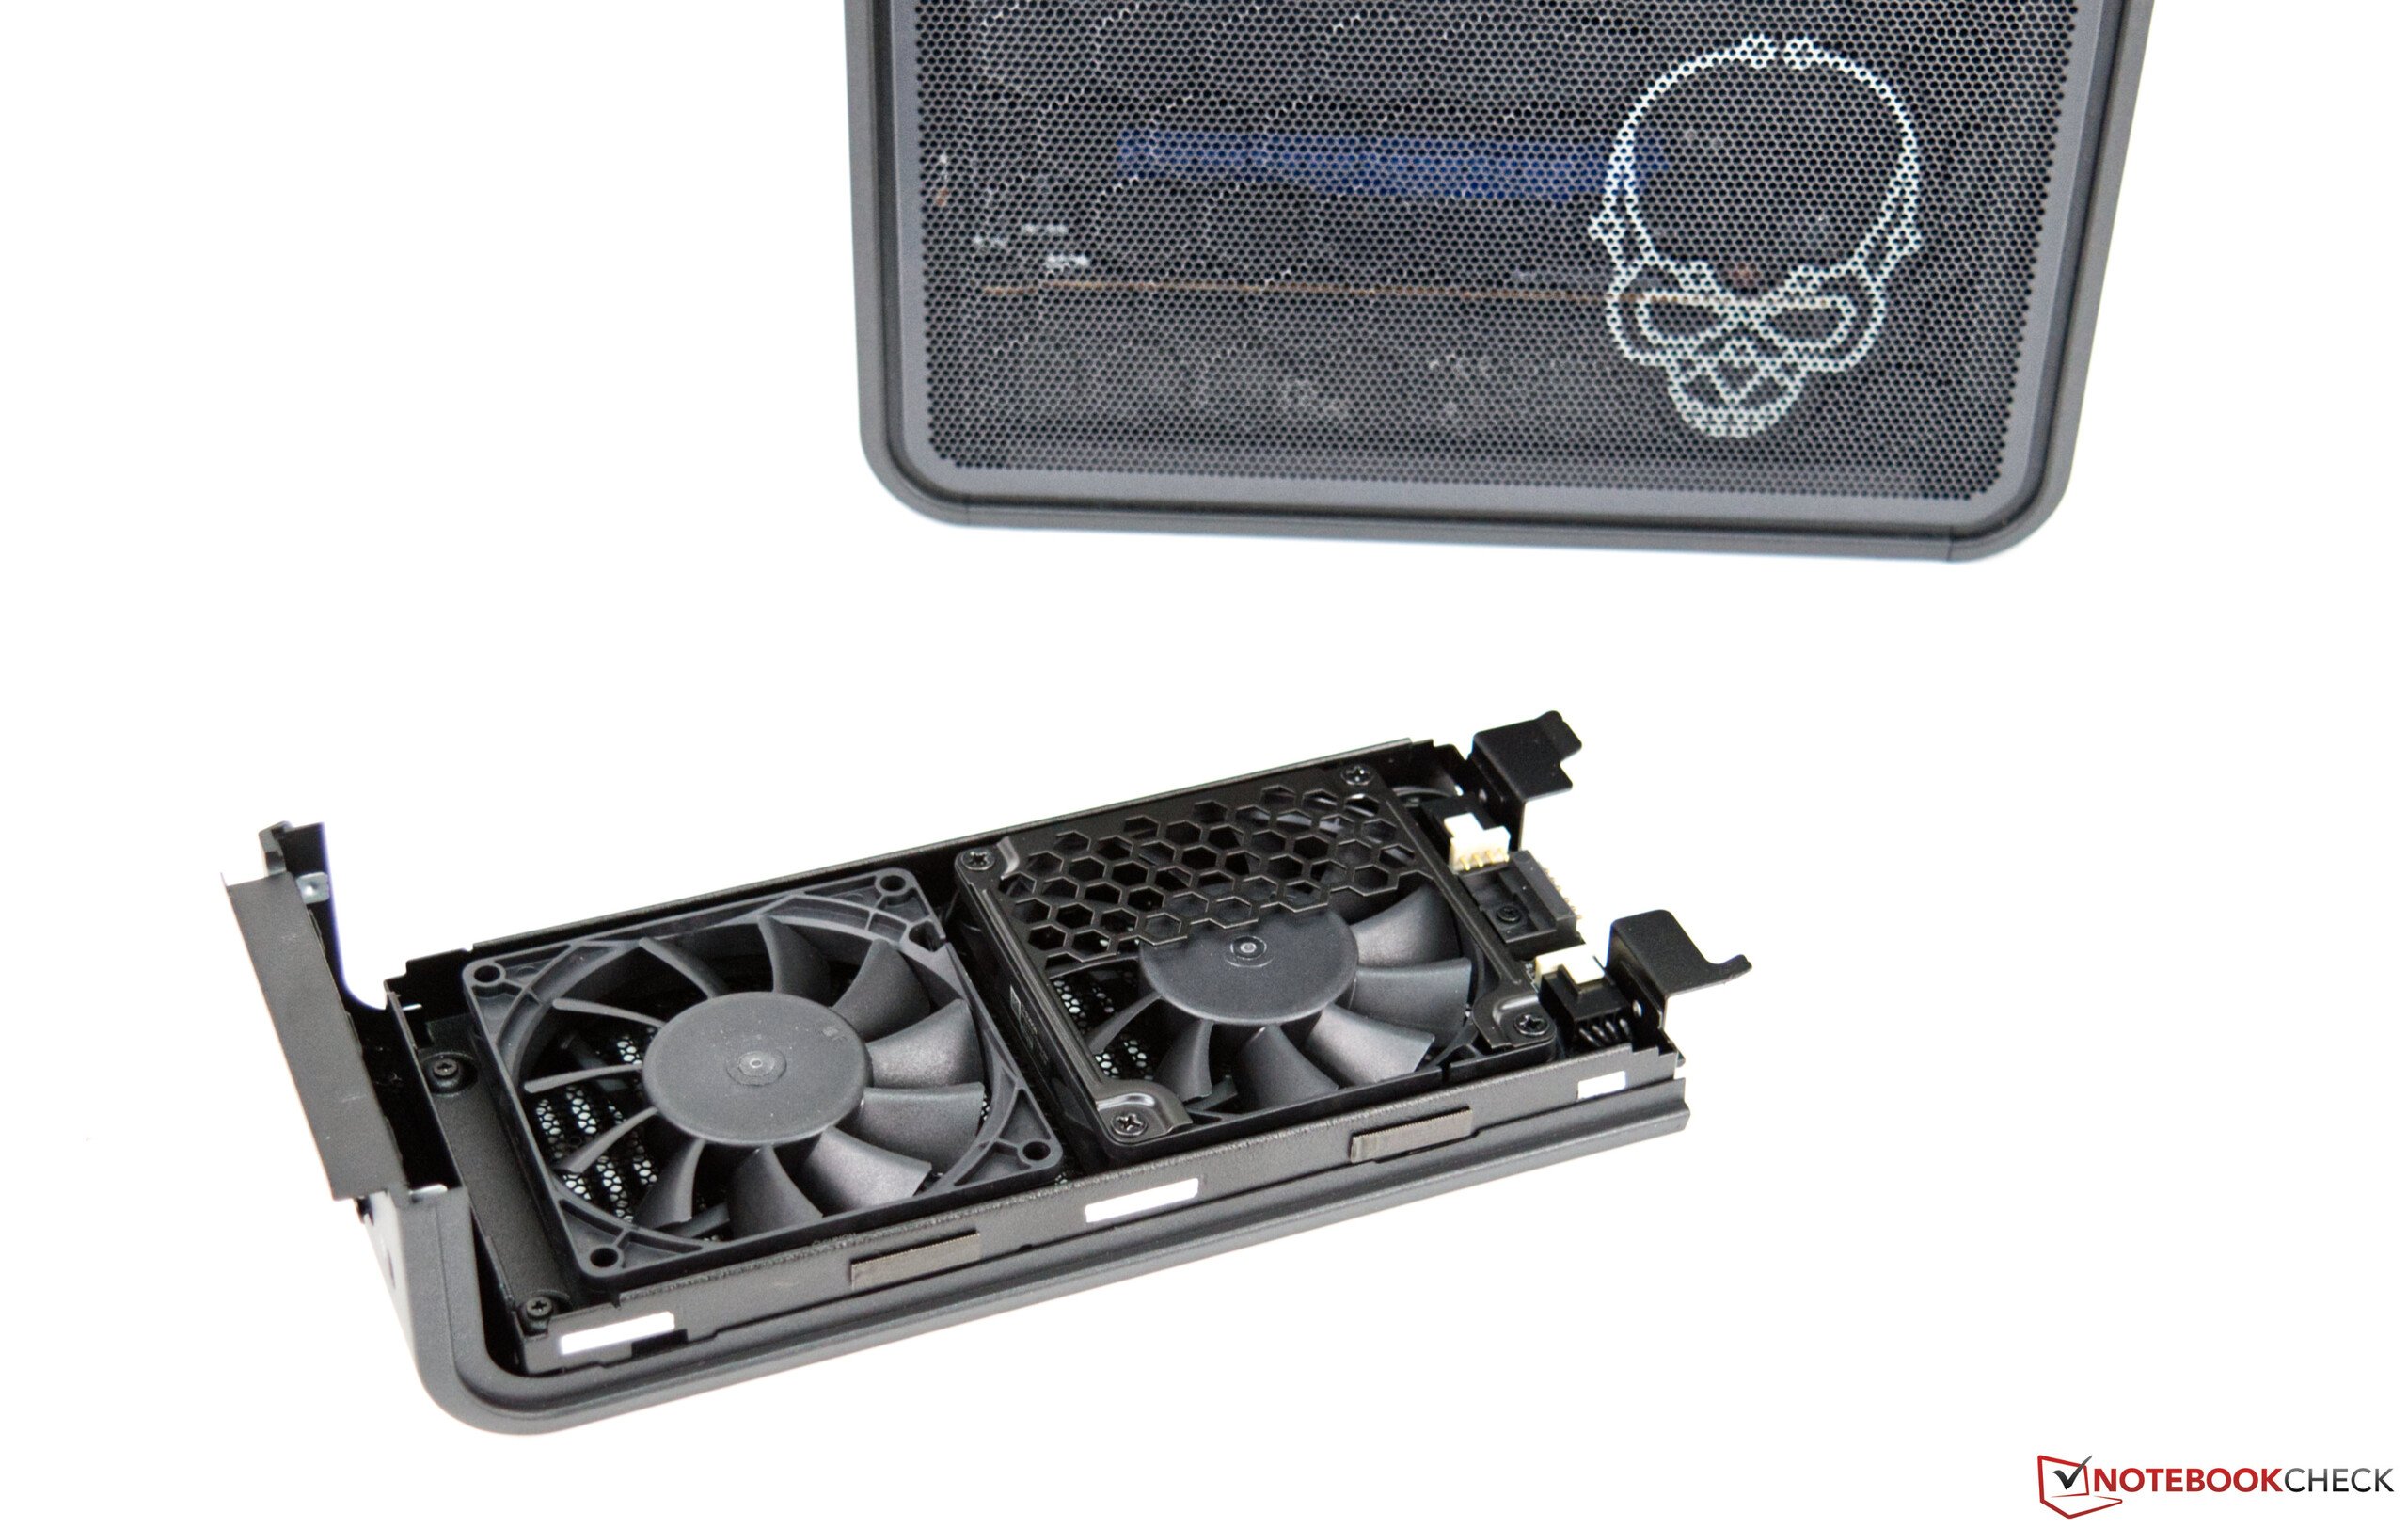
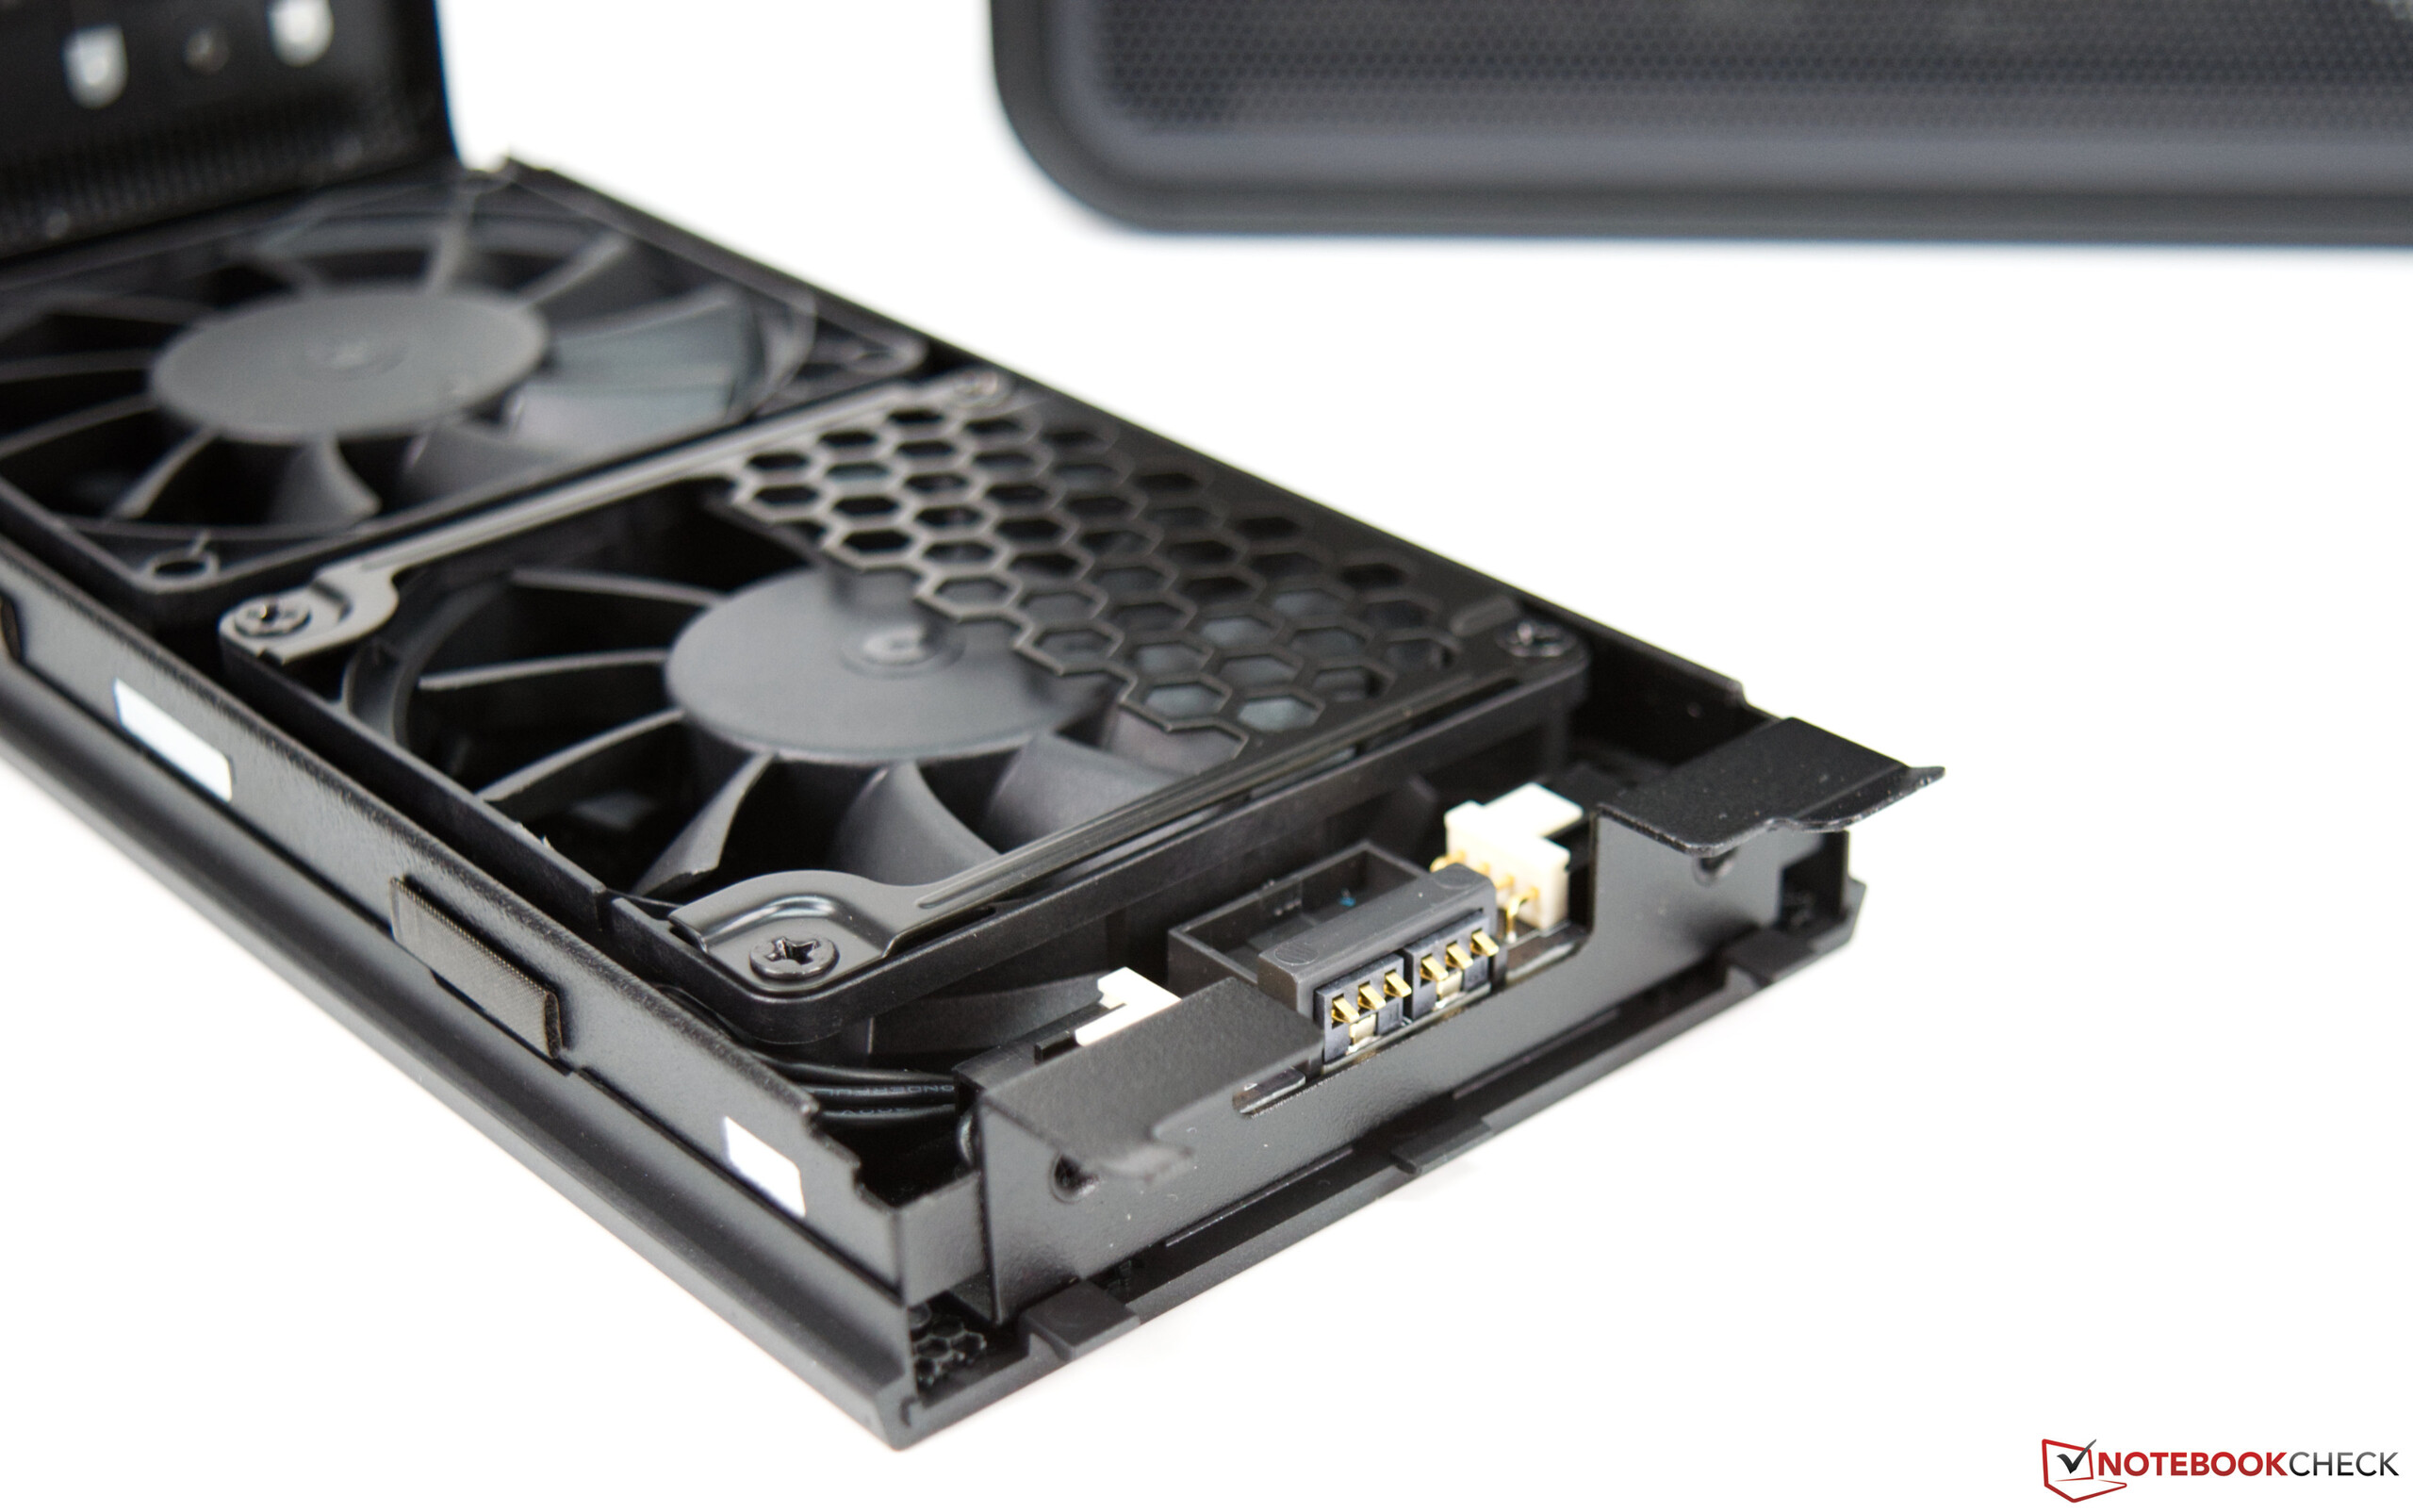
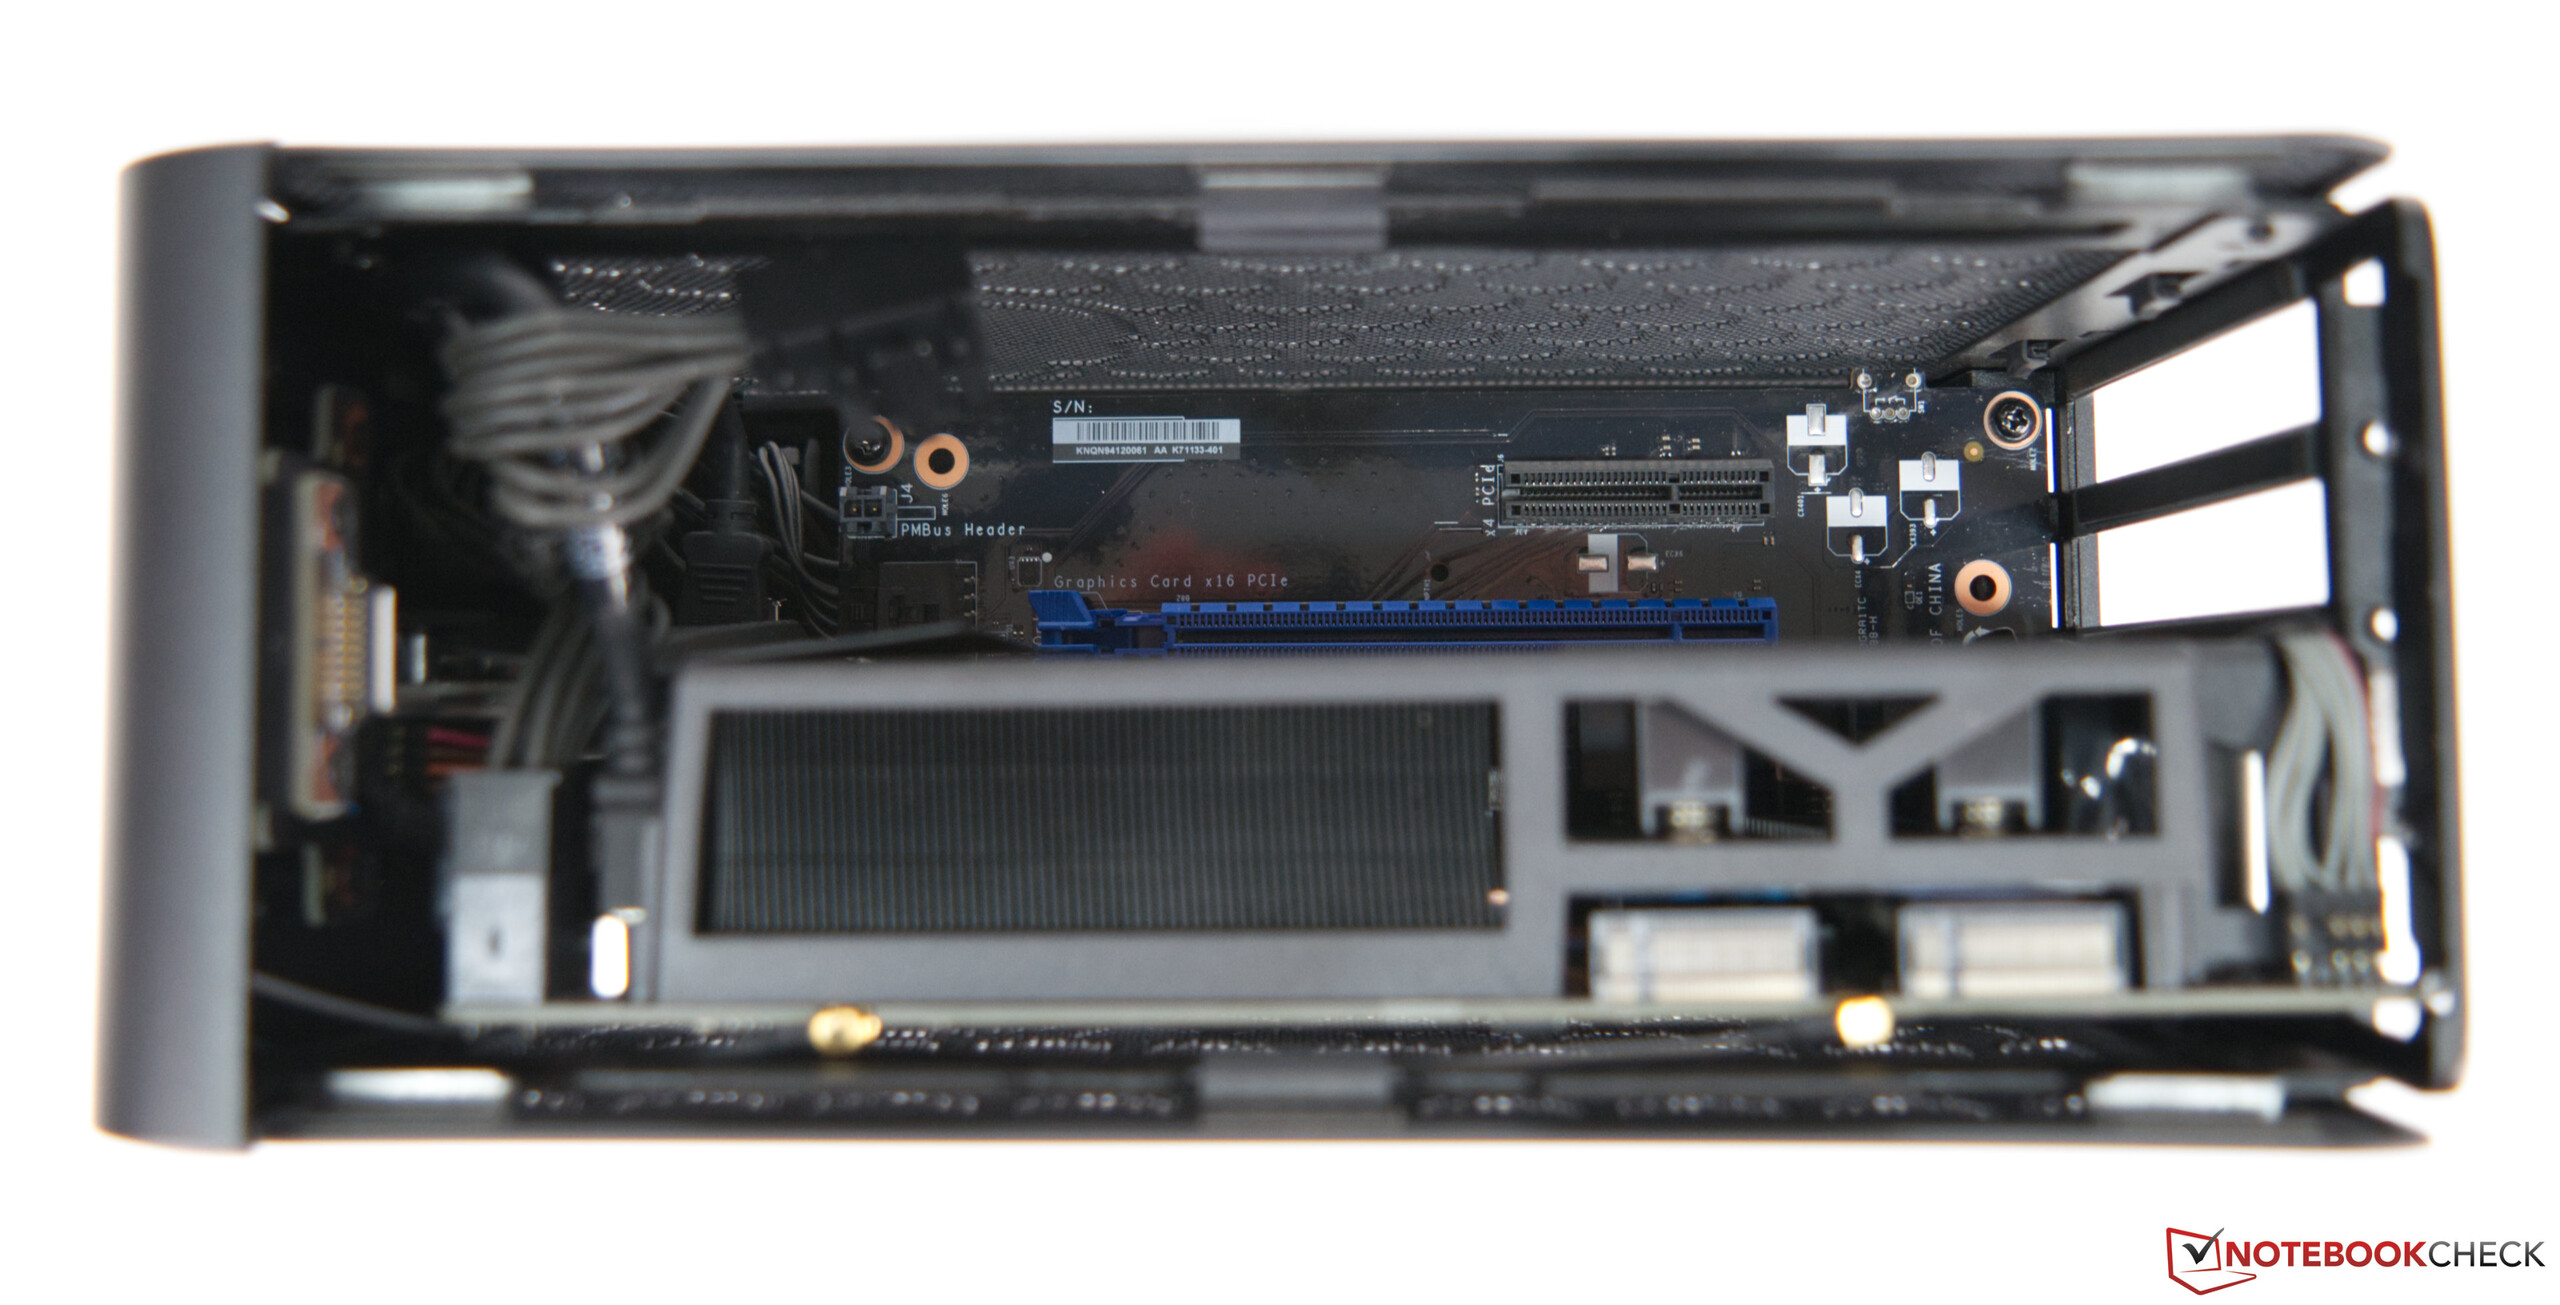
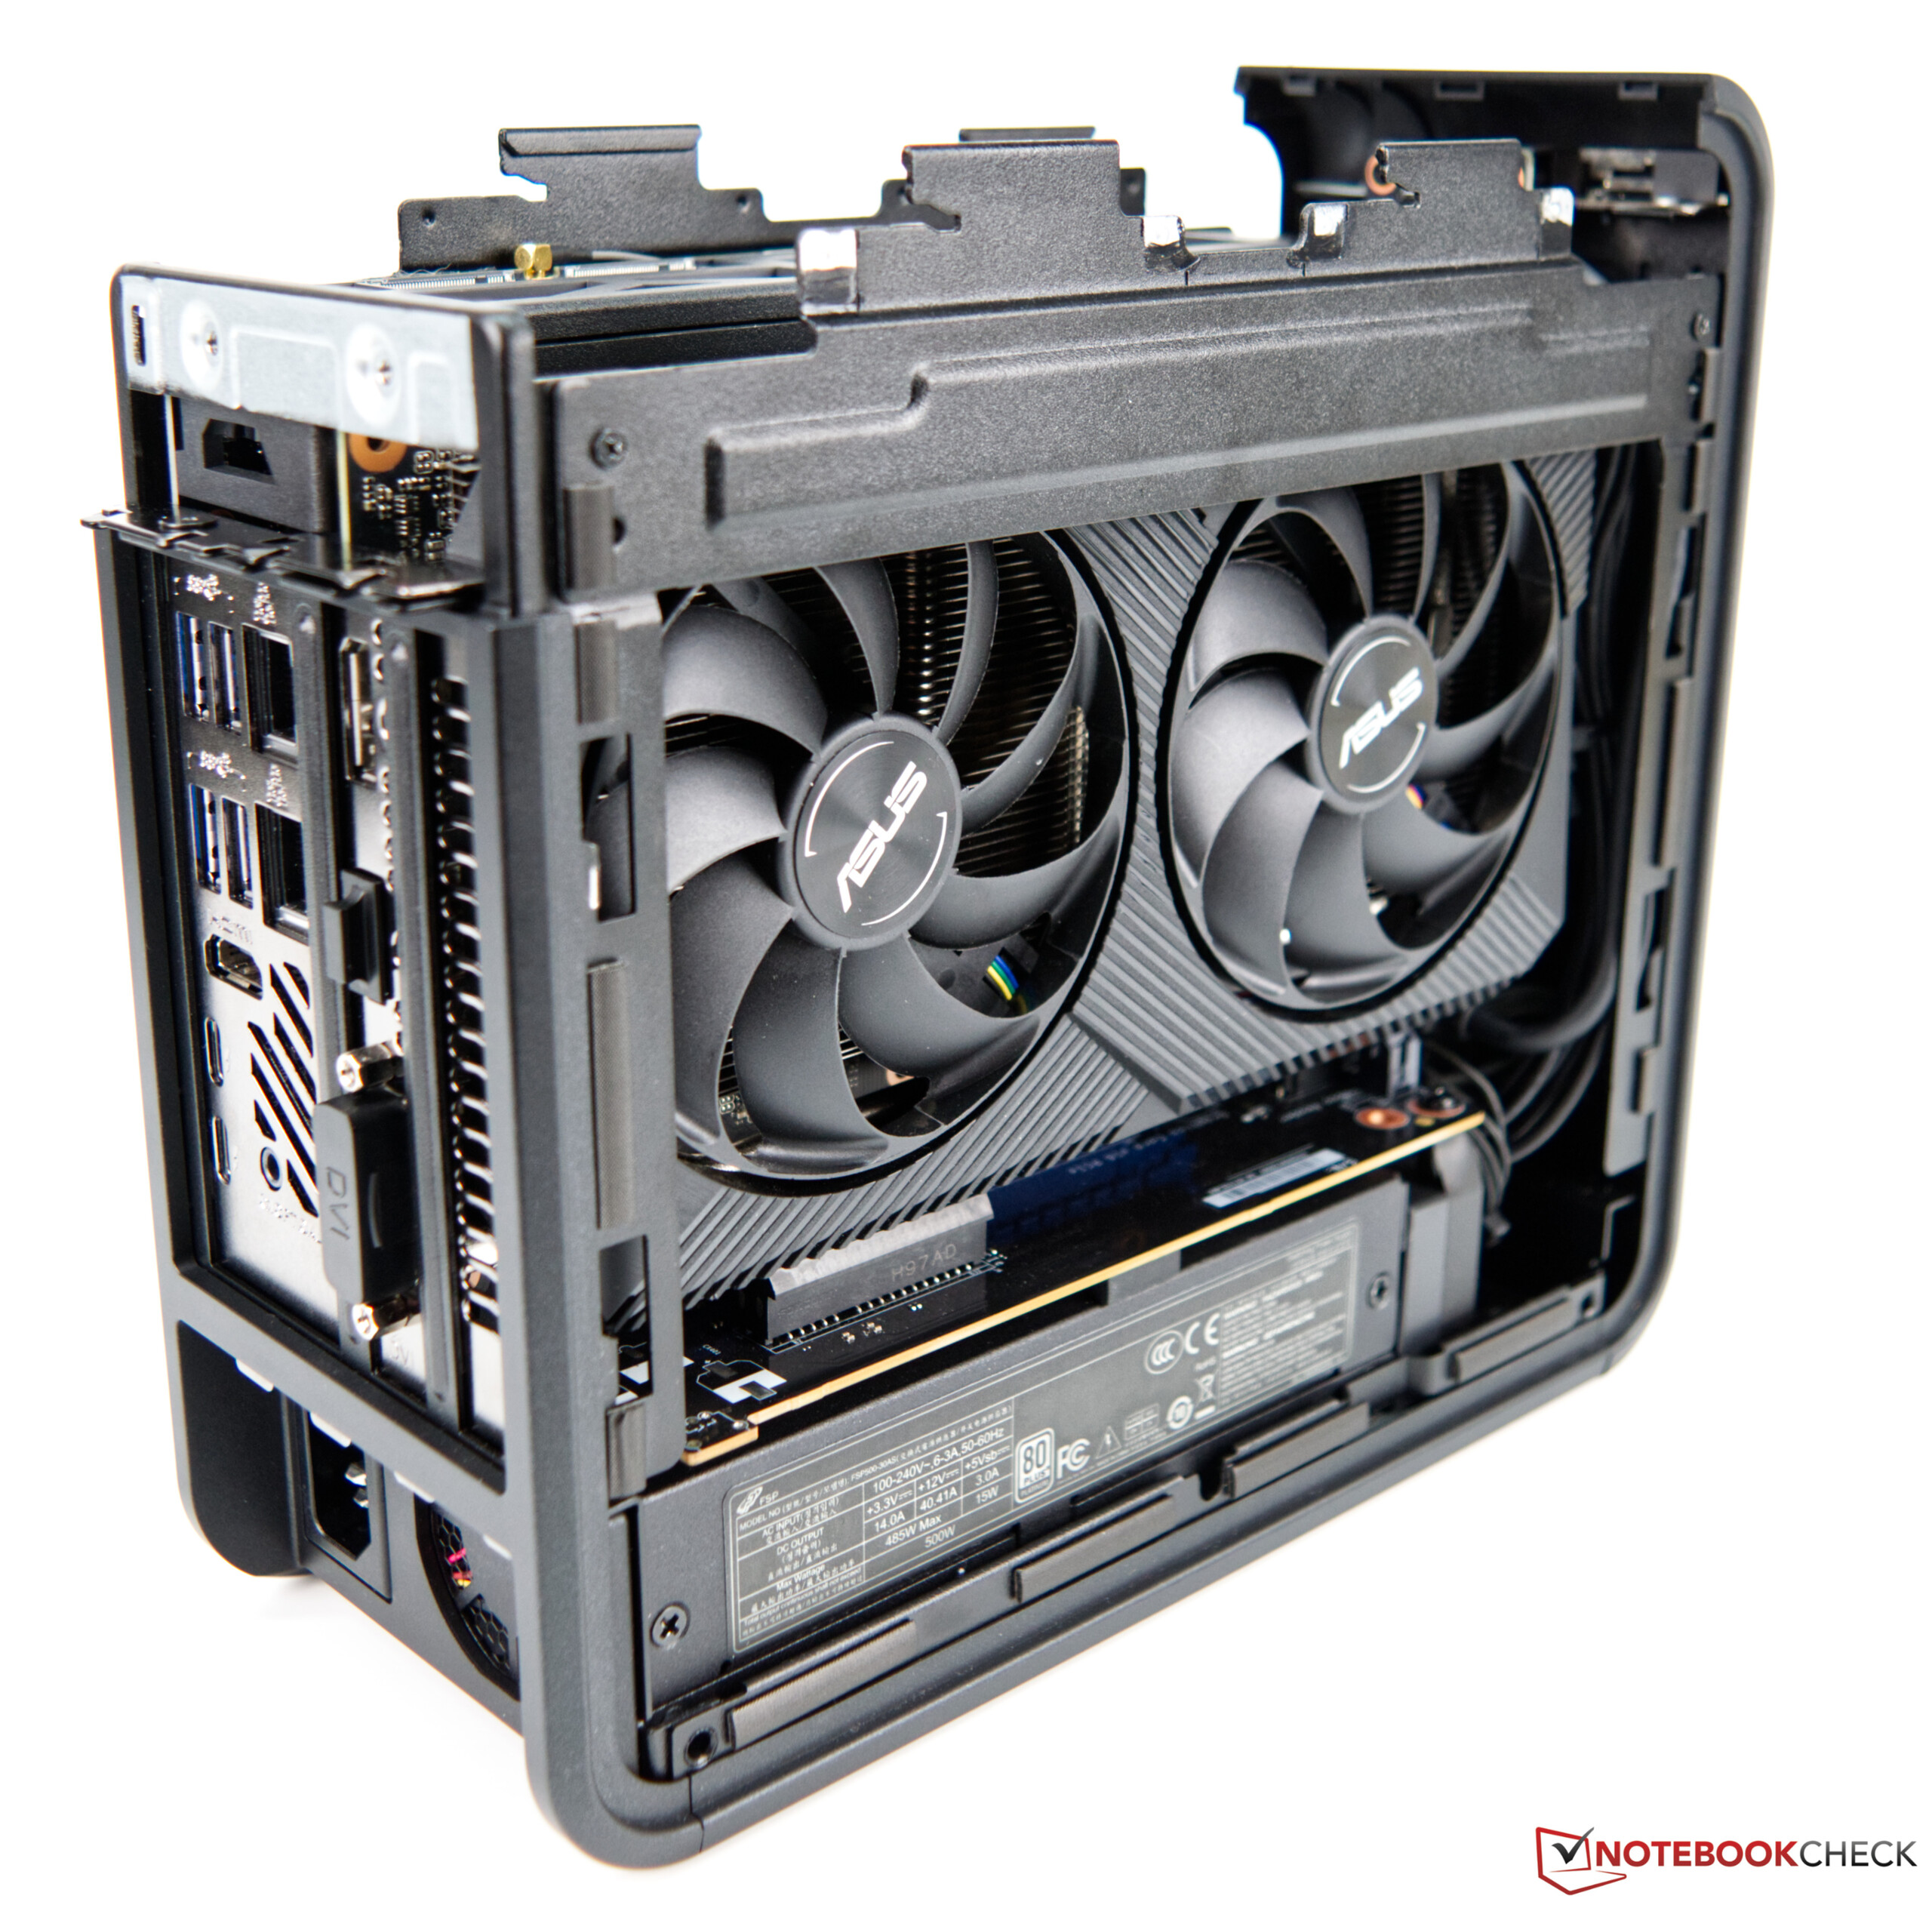
Il y a cependant quelques limites du NUC Ghost Canyon d'Intel, surtout en ce qui concerne le bruit, lorsqu'une carte graphique dédiée est présente. A cause de la taille de l'ordinateur, le ventilateur est presque complètement couvert, et l'air envoyé sur le caloduc du SoC est chaud à cause de la proximité de la carte de la carte graphique. Et cela augmente énormément le bruit. Une conception légèrement différente, avec le ventilateur plus à l'extérieur, aurait certainement été une meilleure solution.
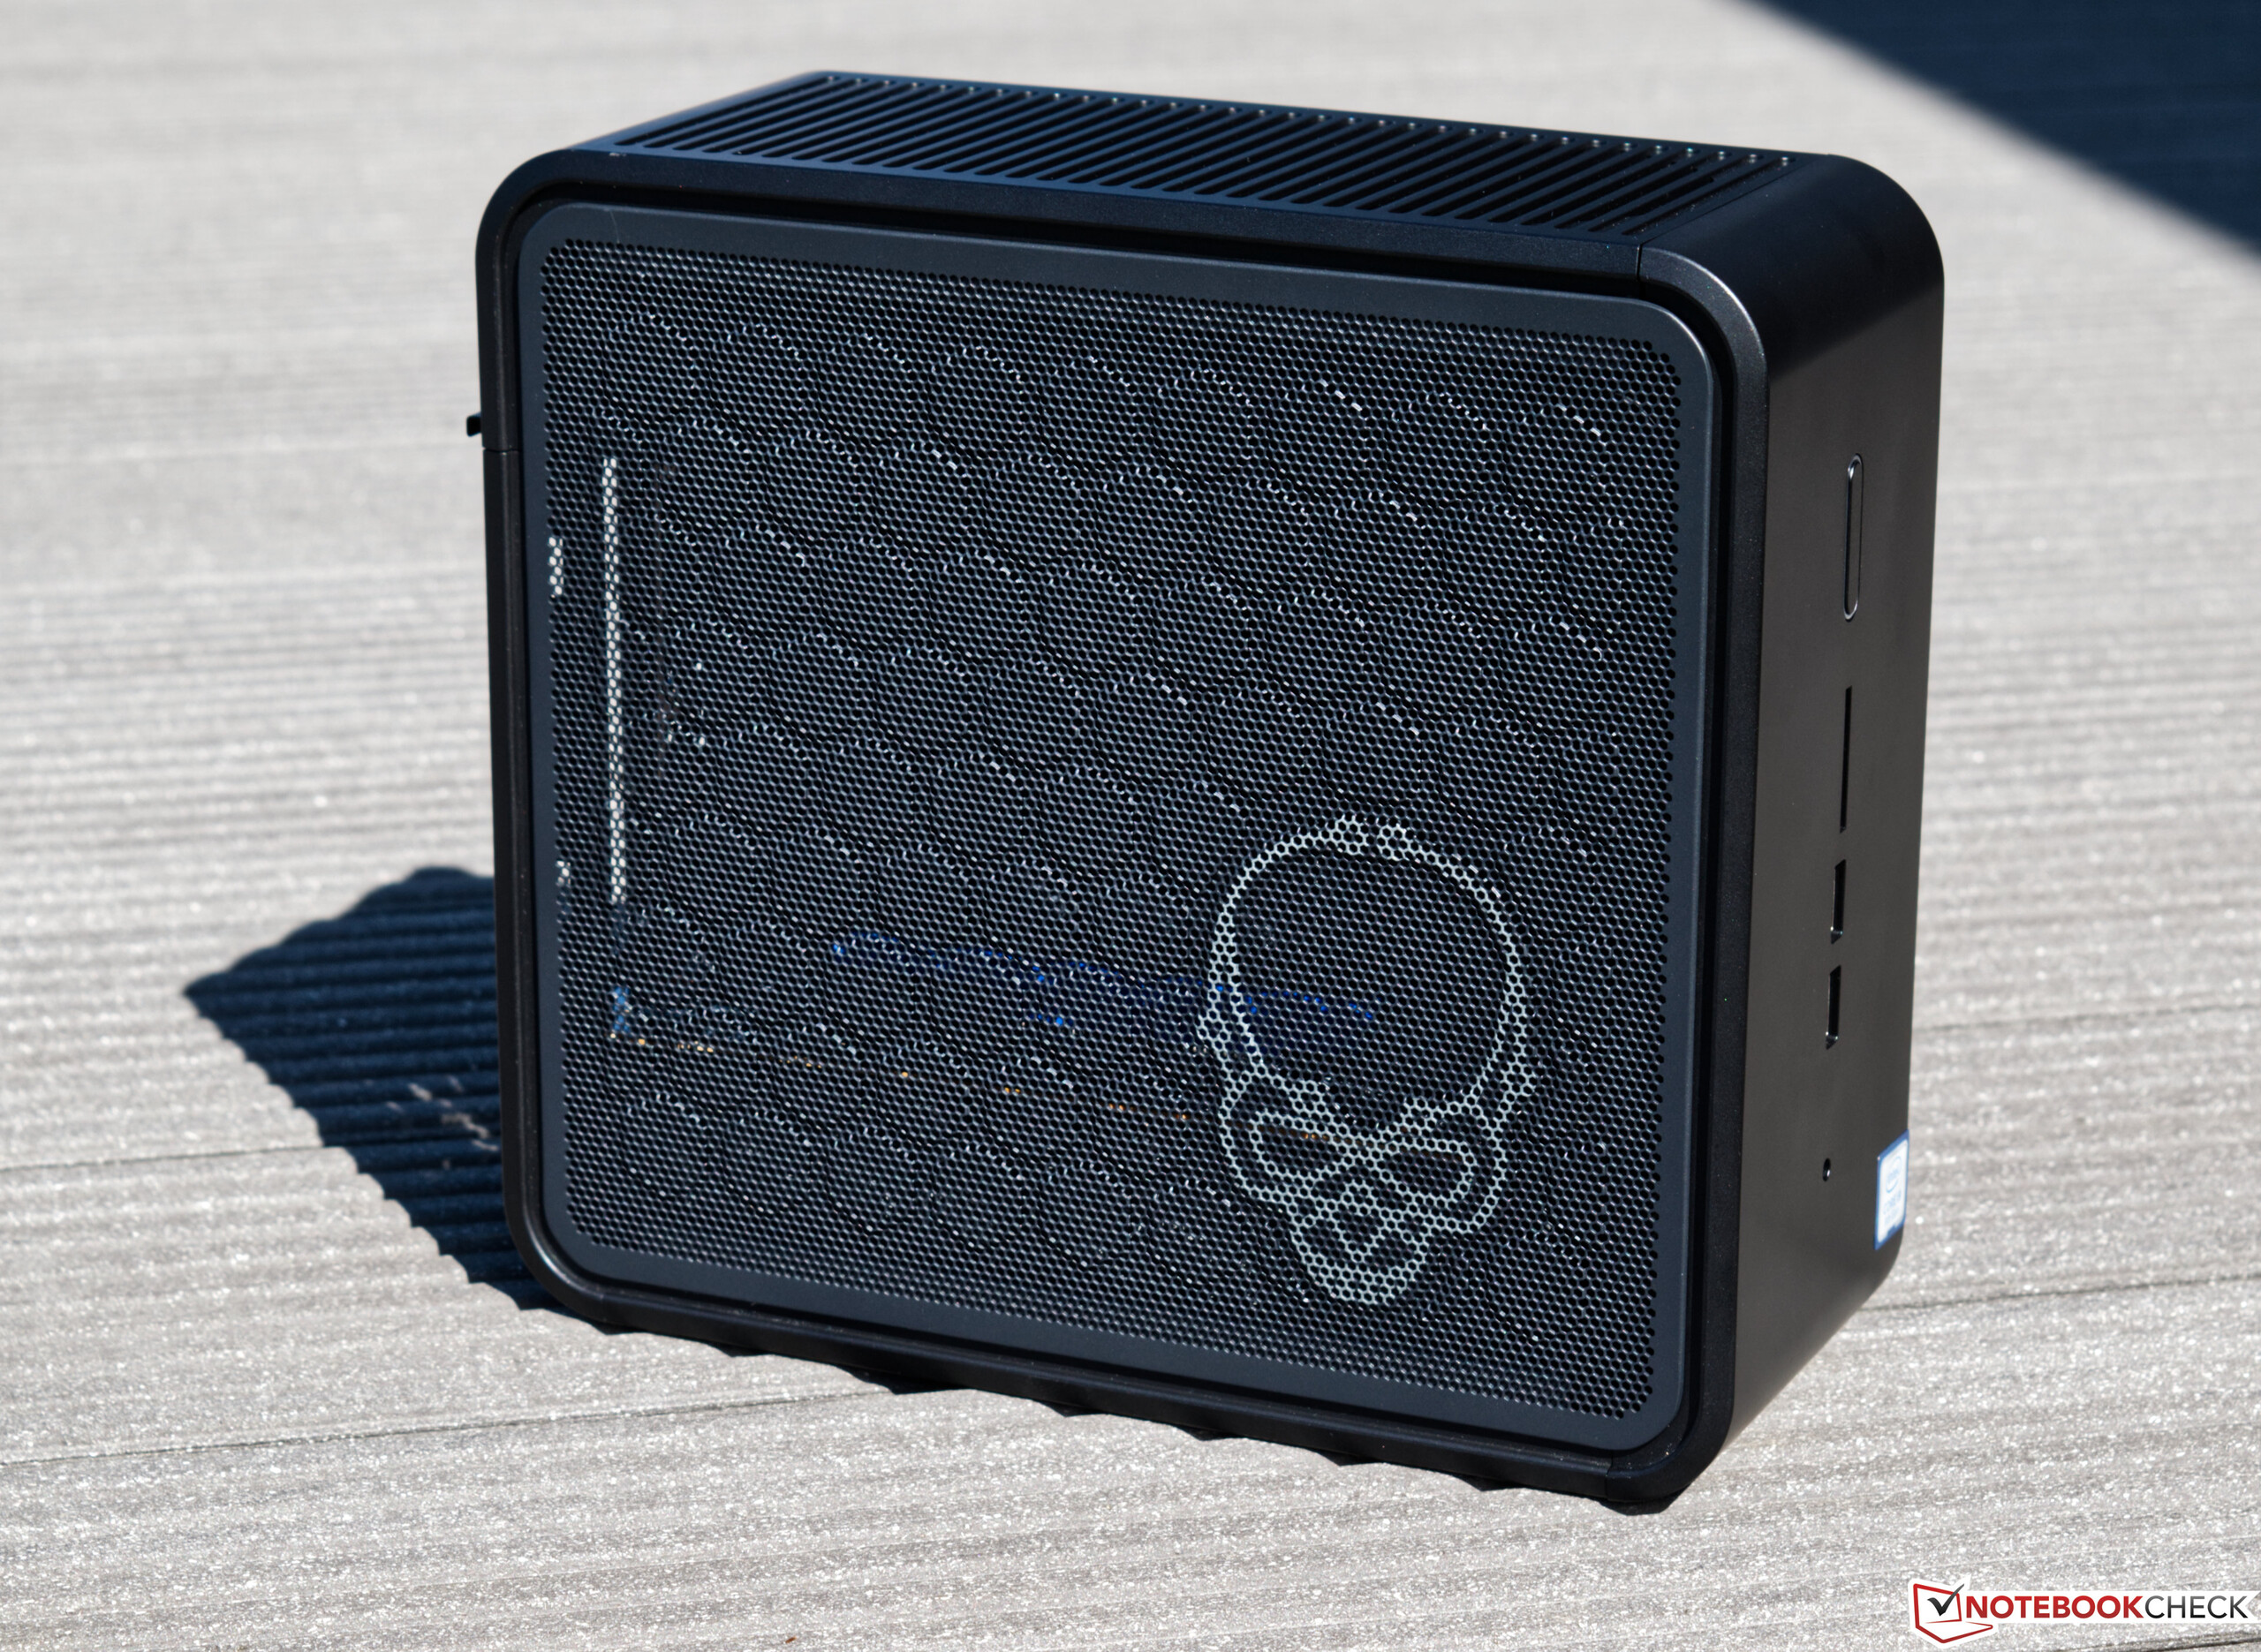
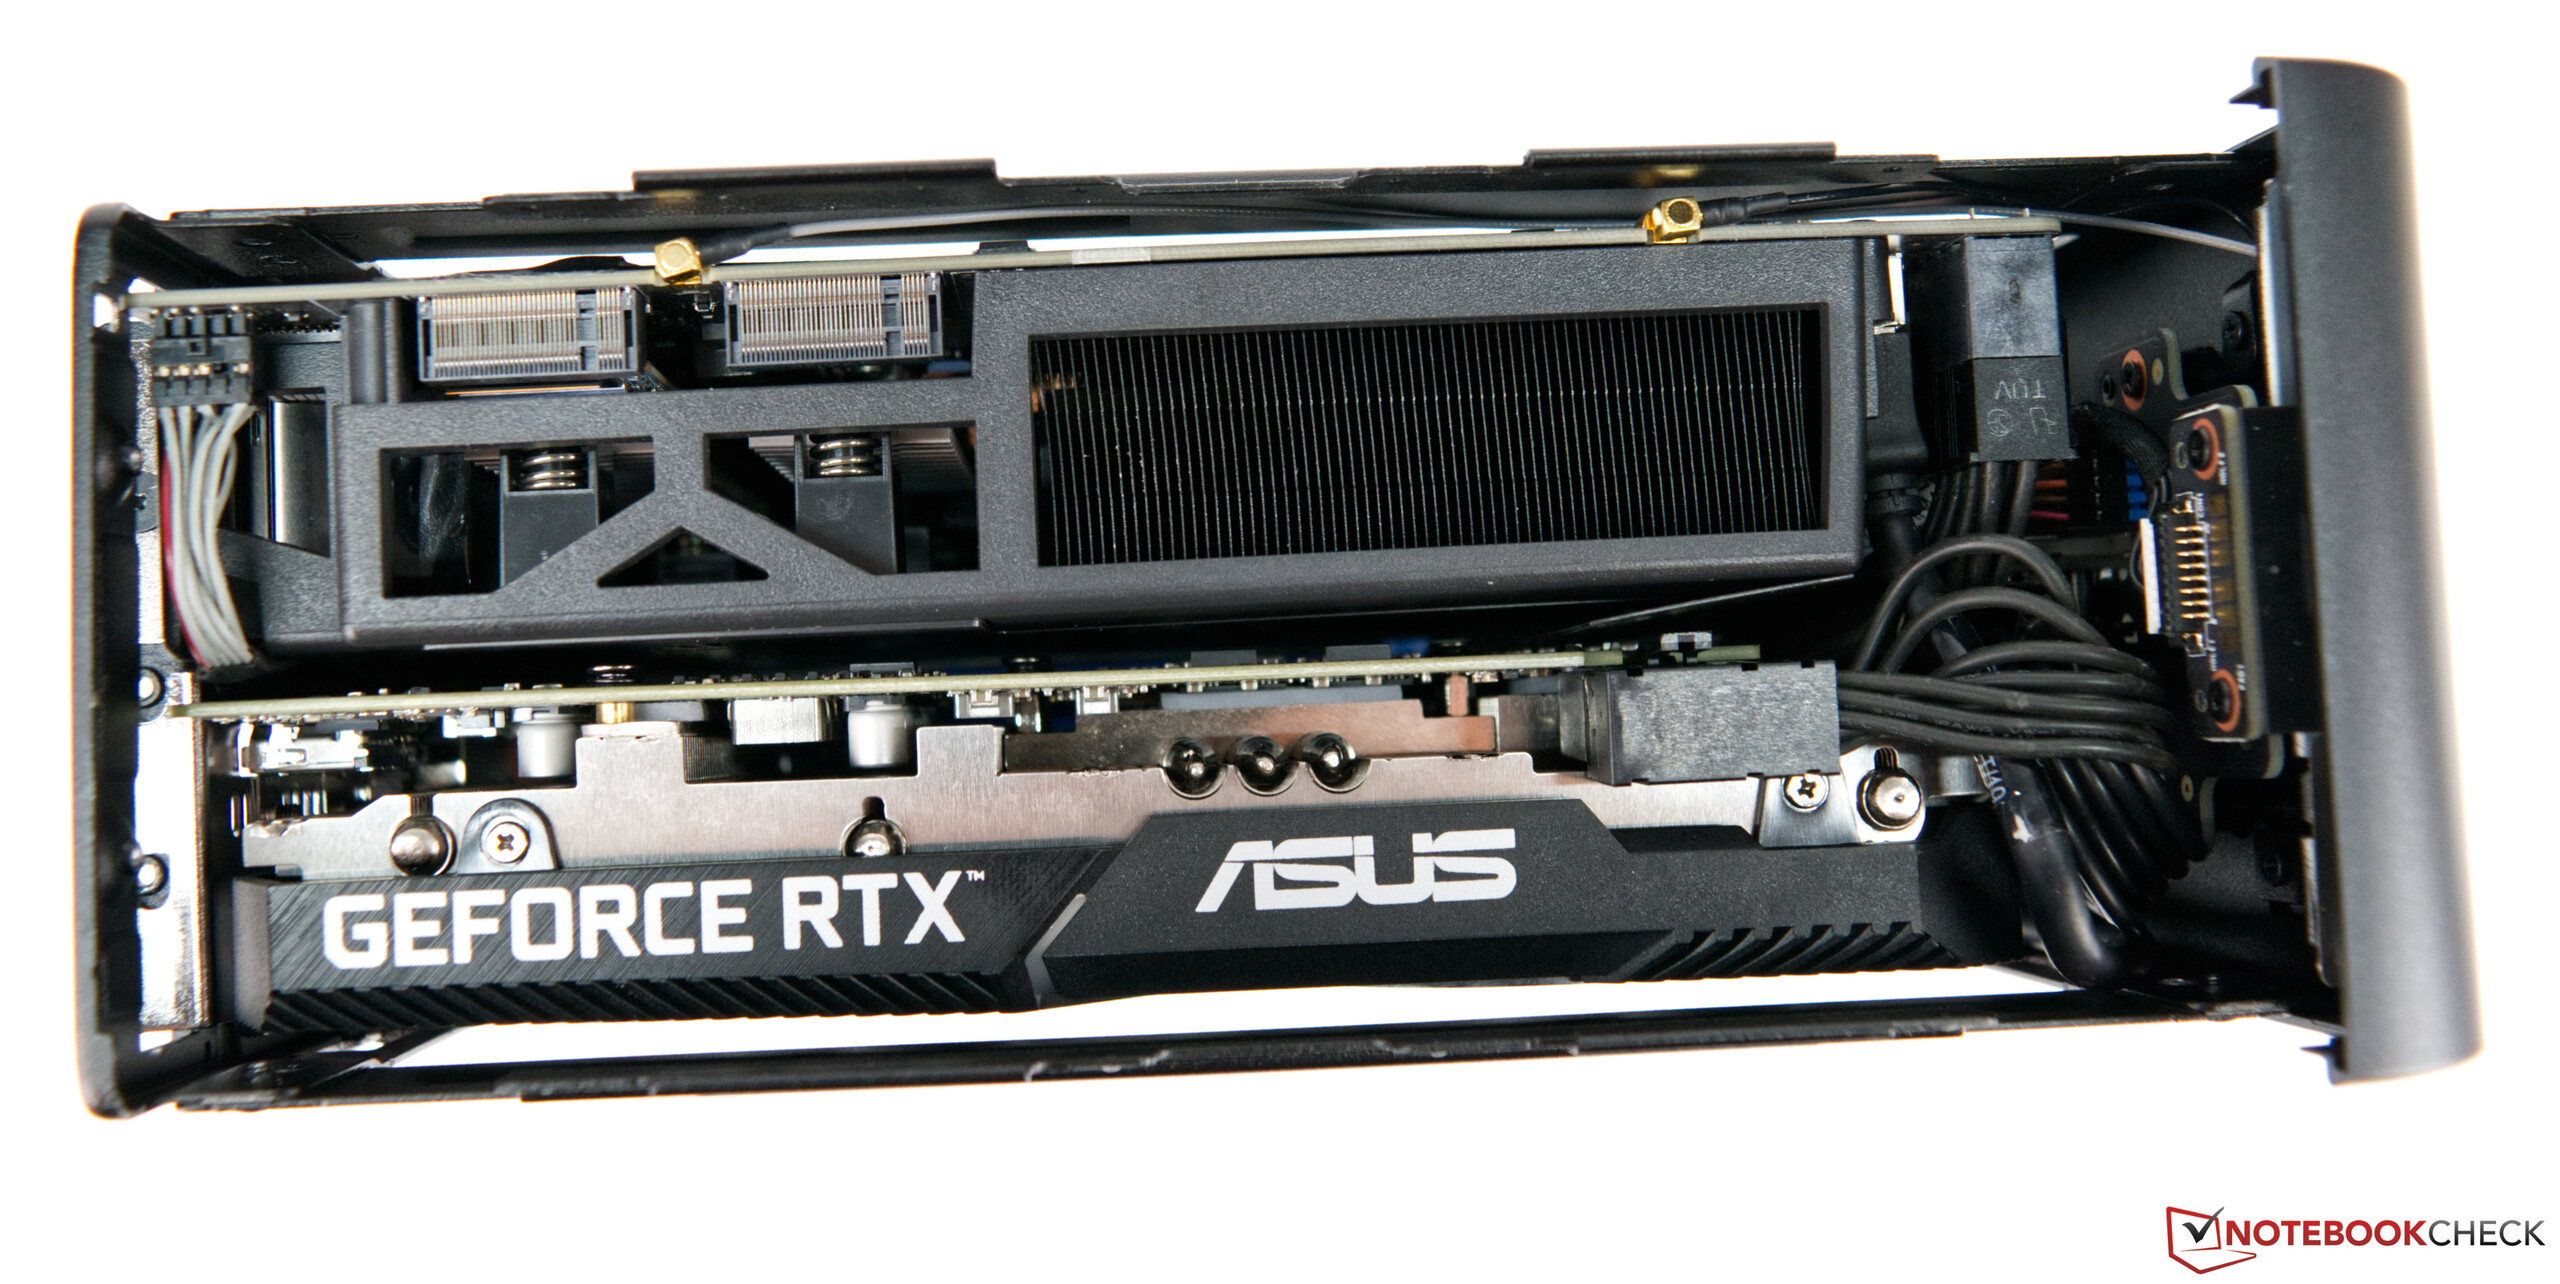
Au final, le NUC 9 Extreme d'Intel est le PC le plus compact sous les 5 L, qui peut intégrer une GeForce RTX 2070. Il combine des composants haut de gammes avec une excellente qualité de construction. Corsair prend une approche similaire avec sa série One au prix comparable (à un Intel Ghost Canyon NUC 9 Extreme complètement équipé), que nous avons déjà testé (One i160). Le MEK Mini de Zotac est un autre mini PC qui peut être équipé d'une RTX 2070.
L’intégralité de cette critique est disponible en anglais en suivant ce lien.
