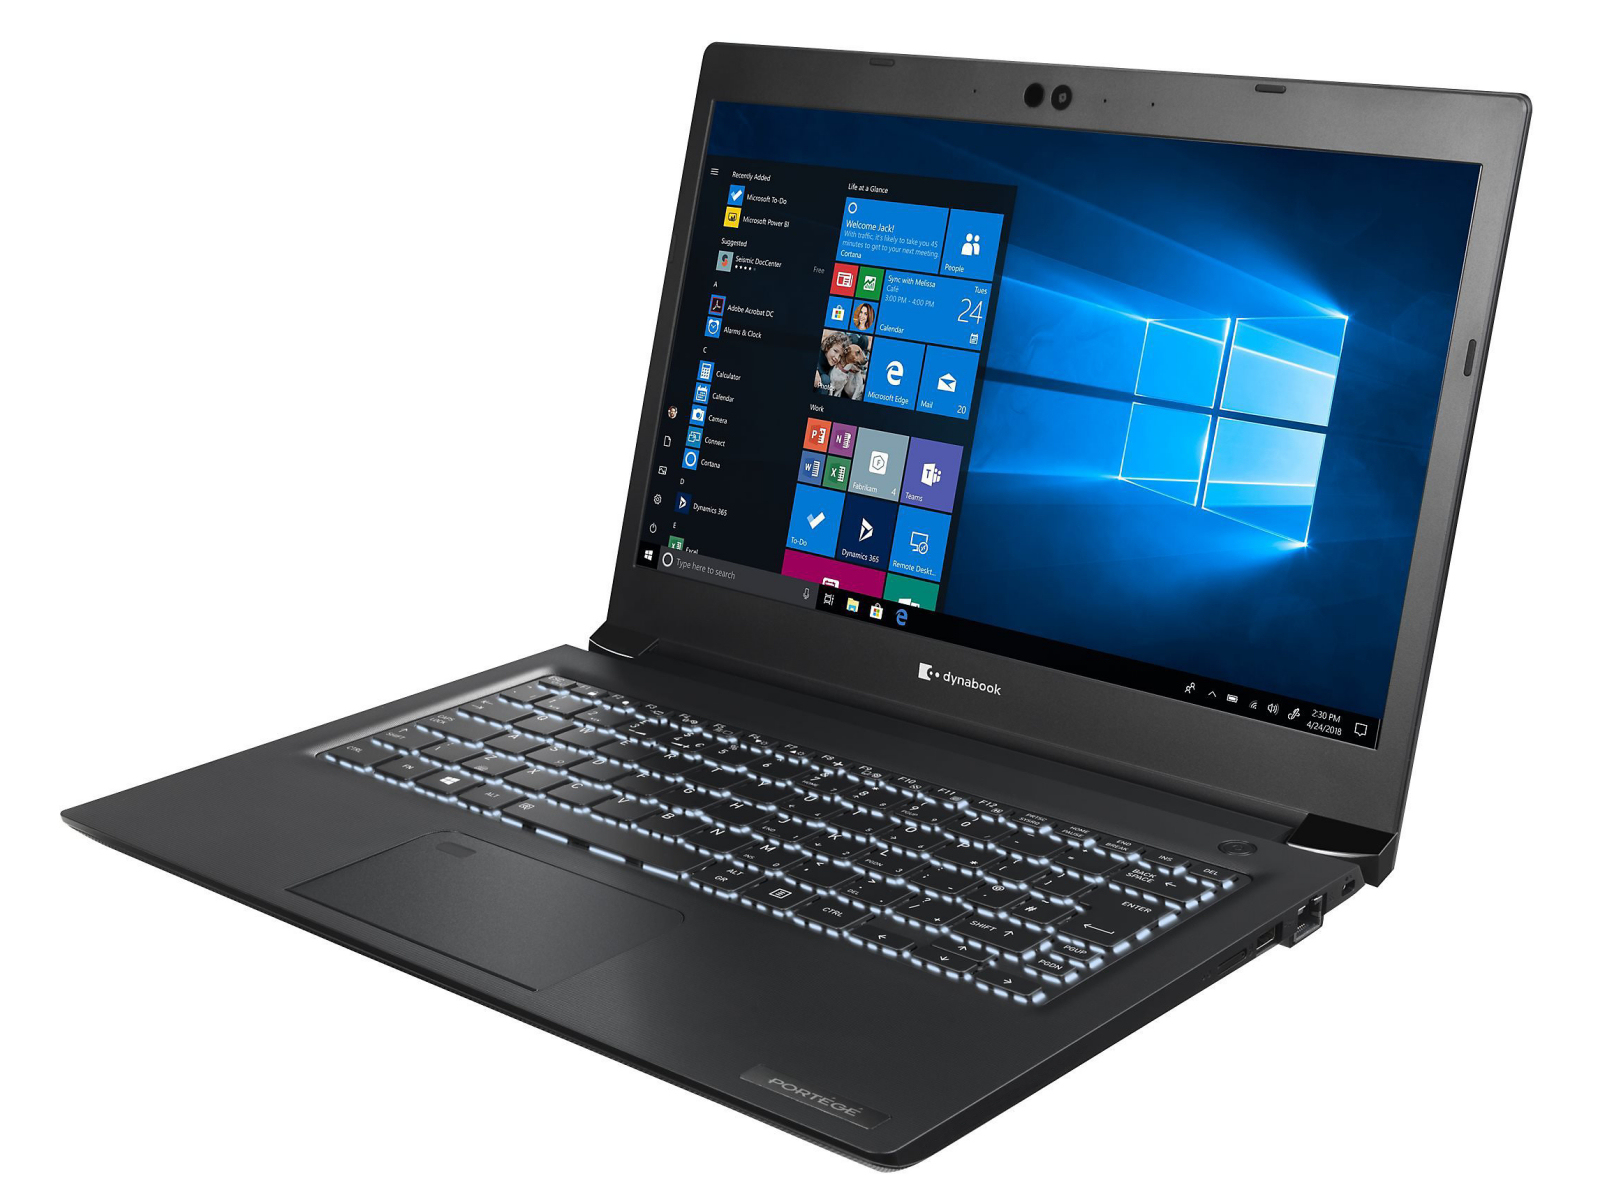
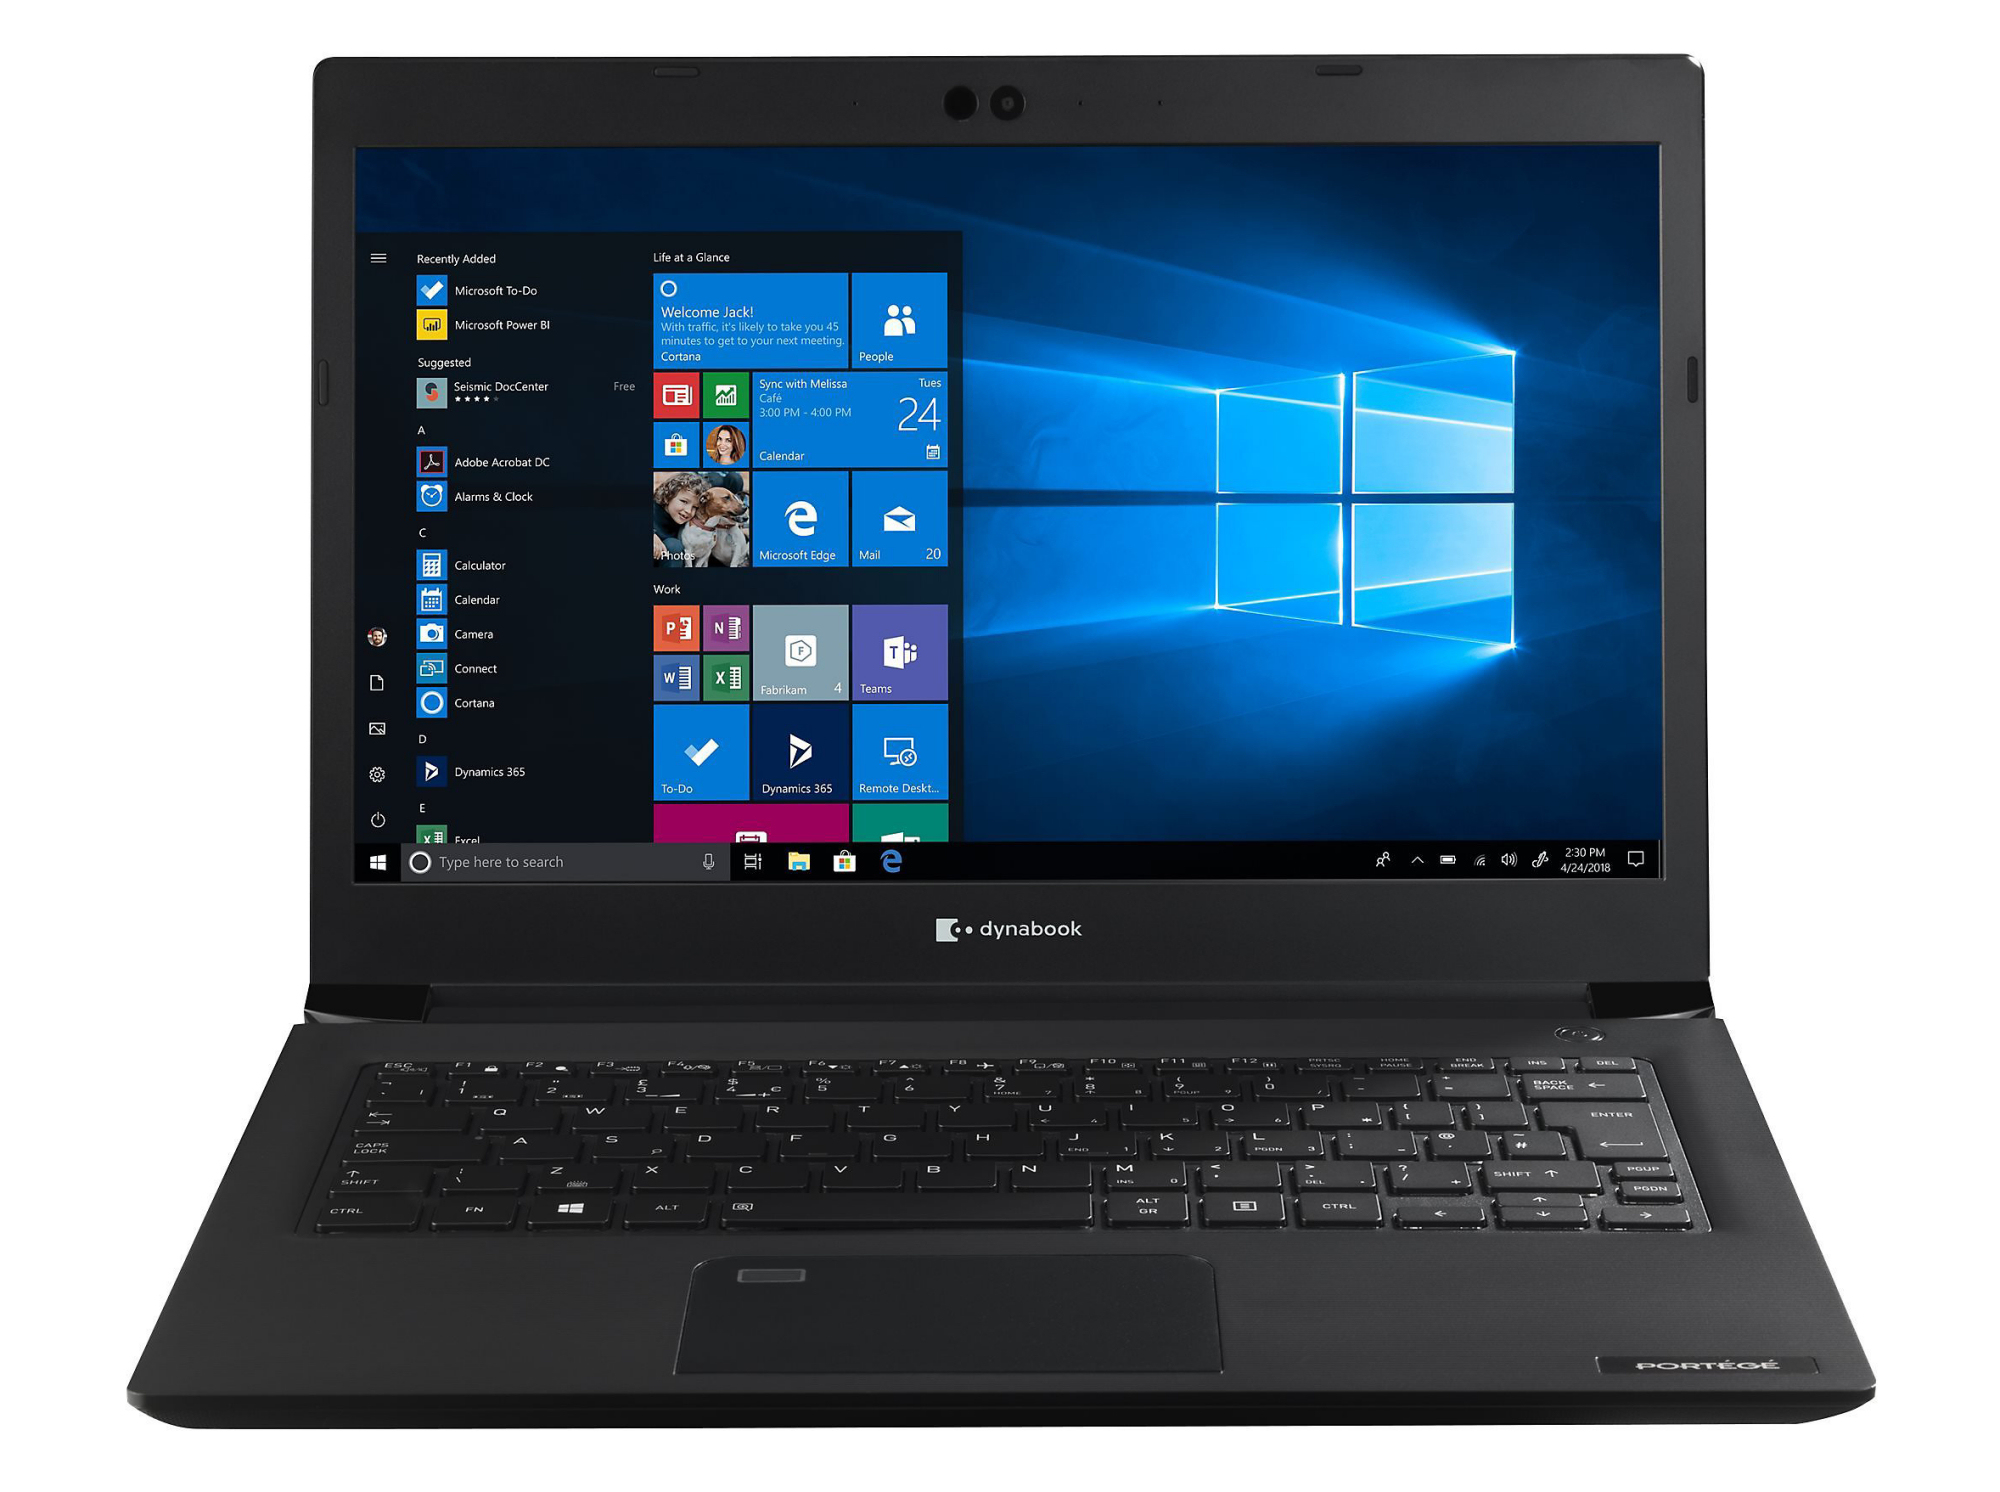
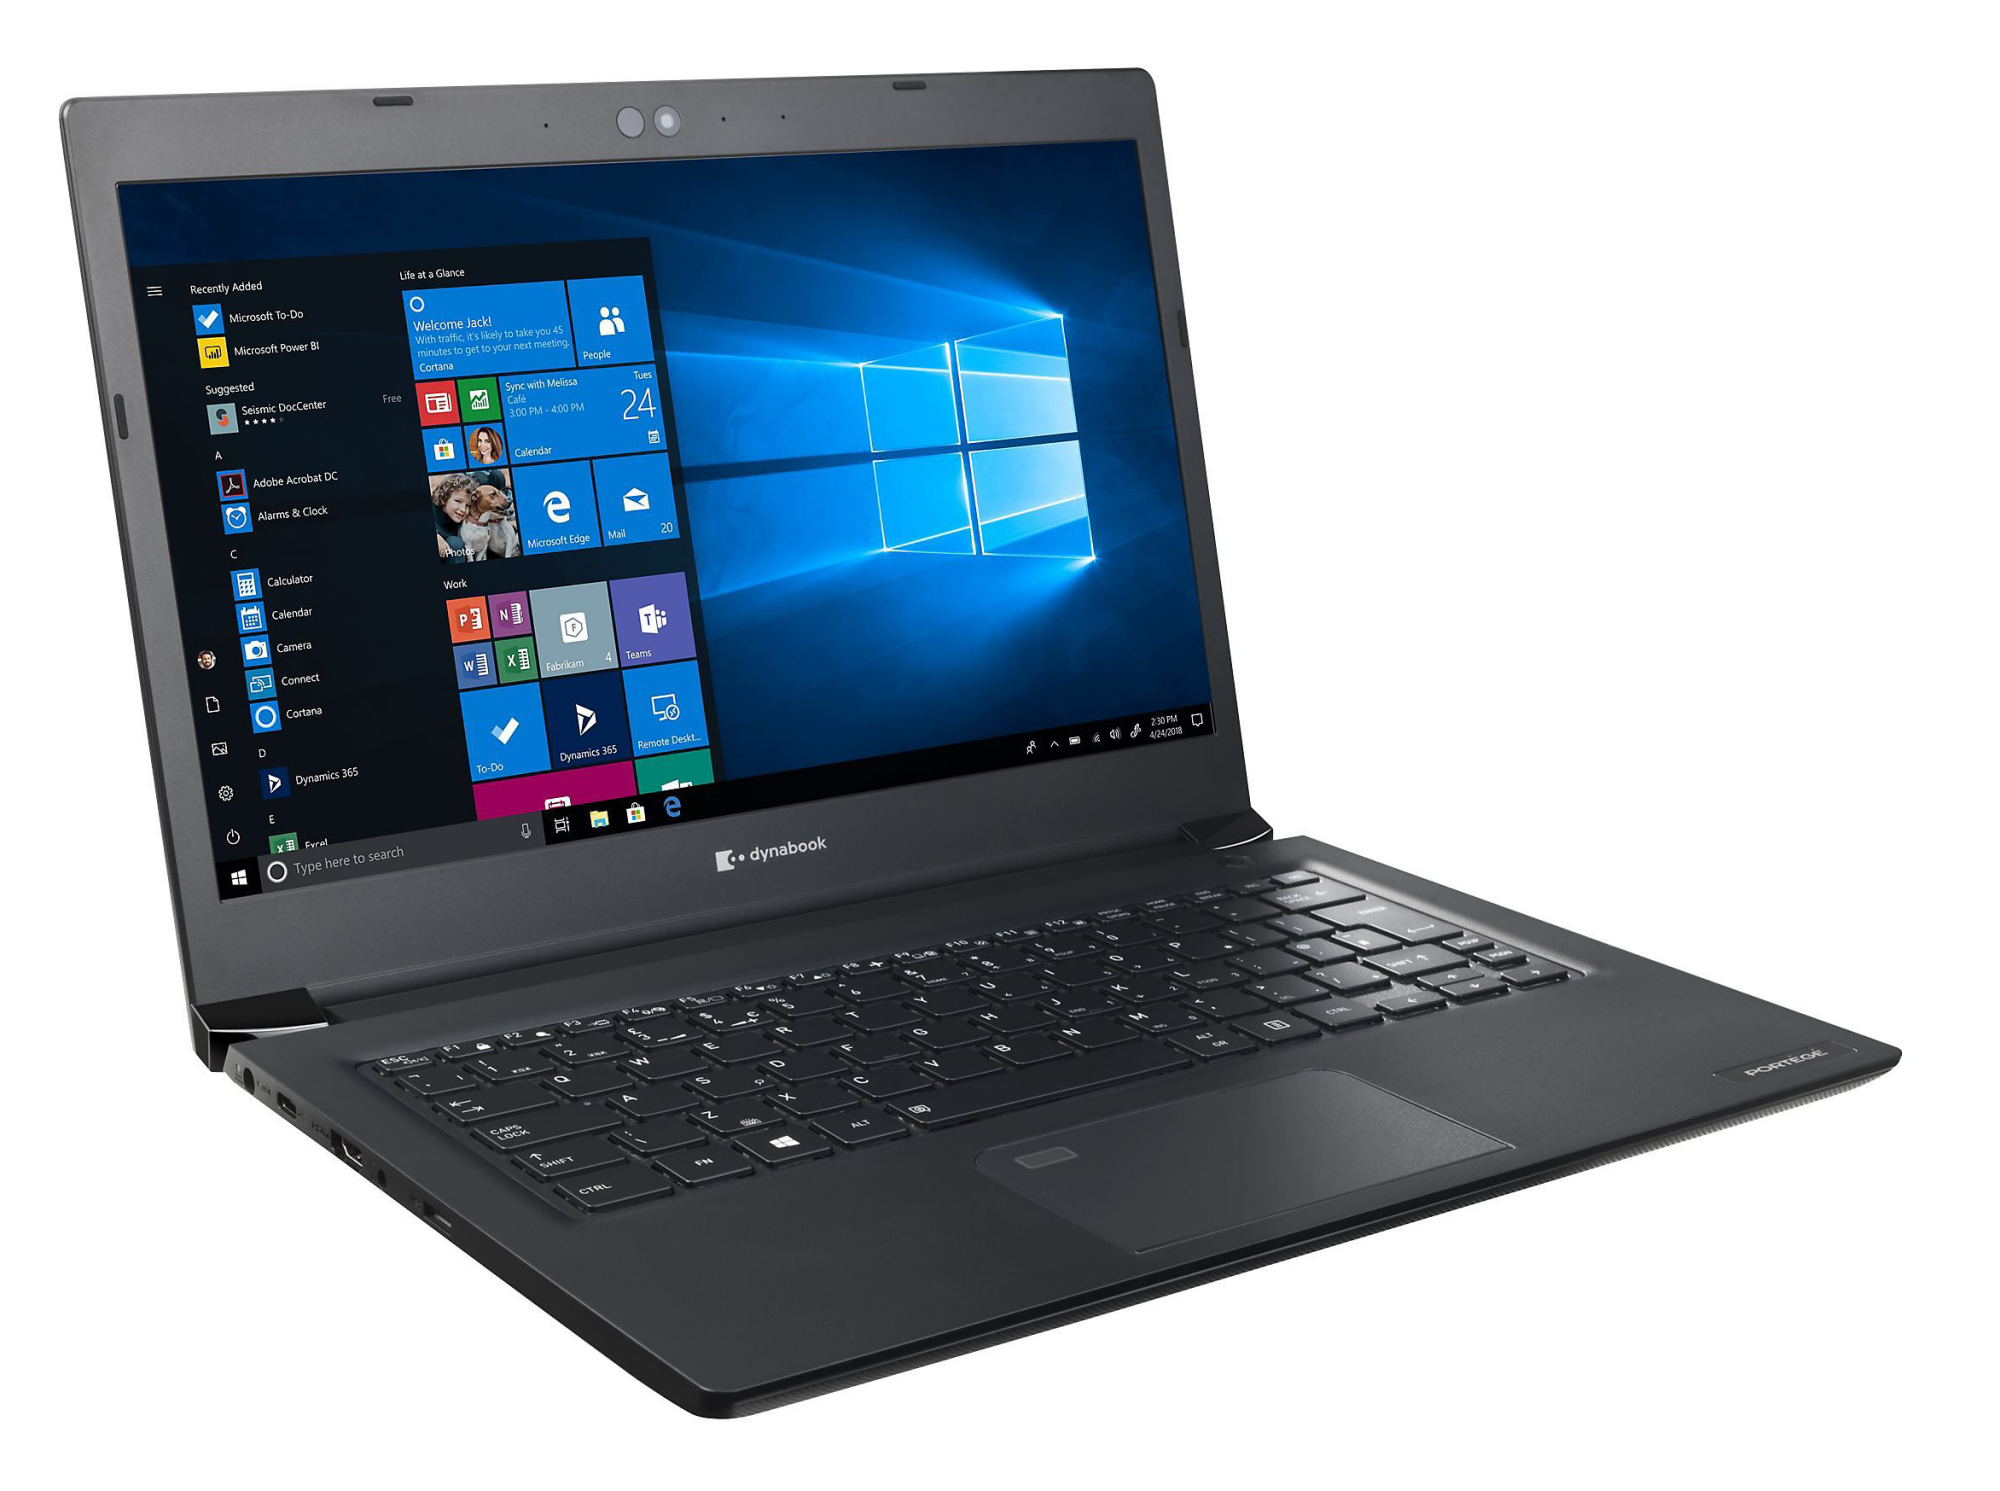
Test du Dynabook Portégé A30-E (i7-8550U, UHD 620, FHD) : excellent écran, châssis fragile
Note | Date | Modèle | Poids | Épaisseur | Taille | Résolution | Prix |
|---|---|---|---|---|---|---|---|
| 84.9 % v7 (old) | 11/19 | Dynabook Portege A30-E-174 i5-8550U, UHD Graphics 620 | 1.2 kg | 19.9 mm | 13.30" | 1920x1080 | |
| 86.7 % v6 (old) | 10/17 | Toshiba Portege A30-D-139 i3-7100U, HD Graphics 620 | 1.5 kg | 18 mm | 13.30" | 1920x1080 | |
| 84.9 % v7 (old) | 09/19 | Dell Latitude 5300 i5-8365U, UHD Graphics 620 | 1.4 kg | 19 mm | 13.30" | 1920x1080 | |
| 88.4 % v6 (old) | 02/19 | Lenovo ThinkPad L390-20NR0013GE i5-8265U, UHD Graphics 620 | 1.5 kg | 18.8 mm | 13.30" | 1920x1080 | |
| 83.8 % v7 (old) | 03/19 | HP ProBook 430 G6-5TJ89EA i5-8265U, UHD Graphics 620 | 1.4 kg | 18 mm | 13.30" | 1920x1080 |
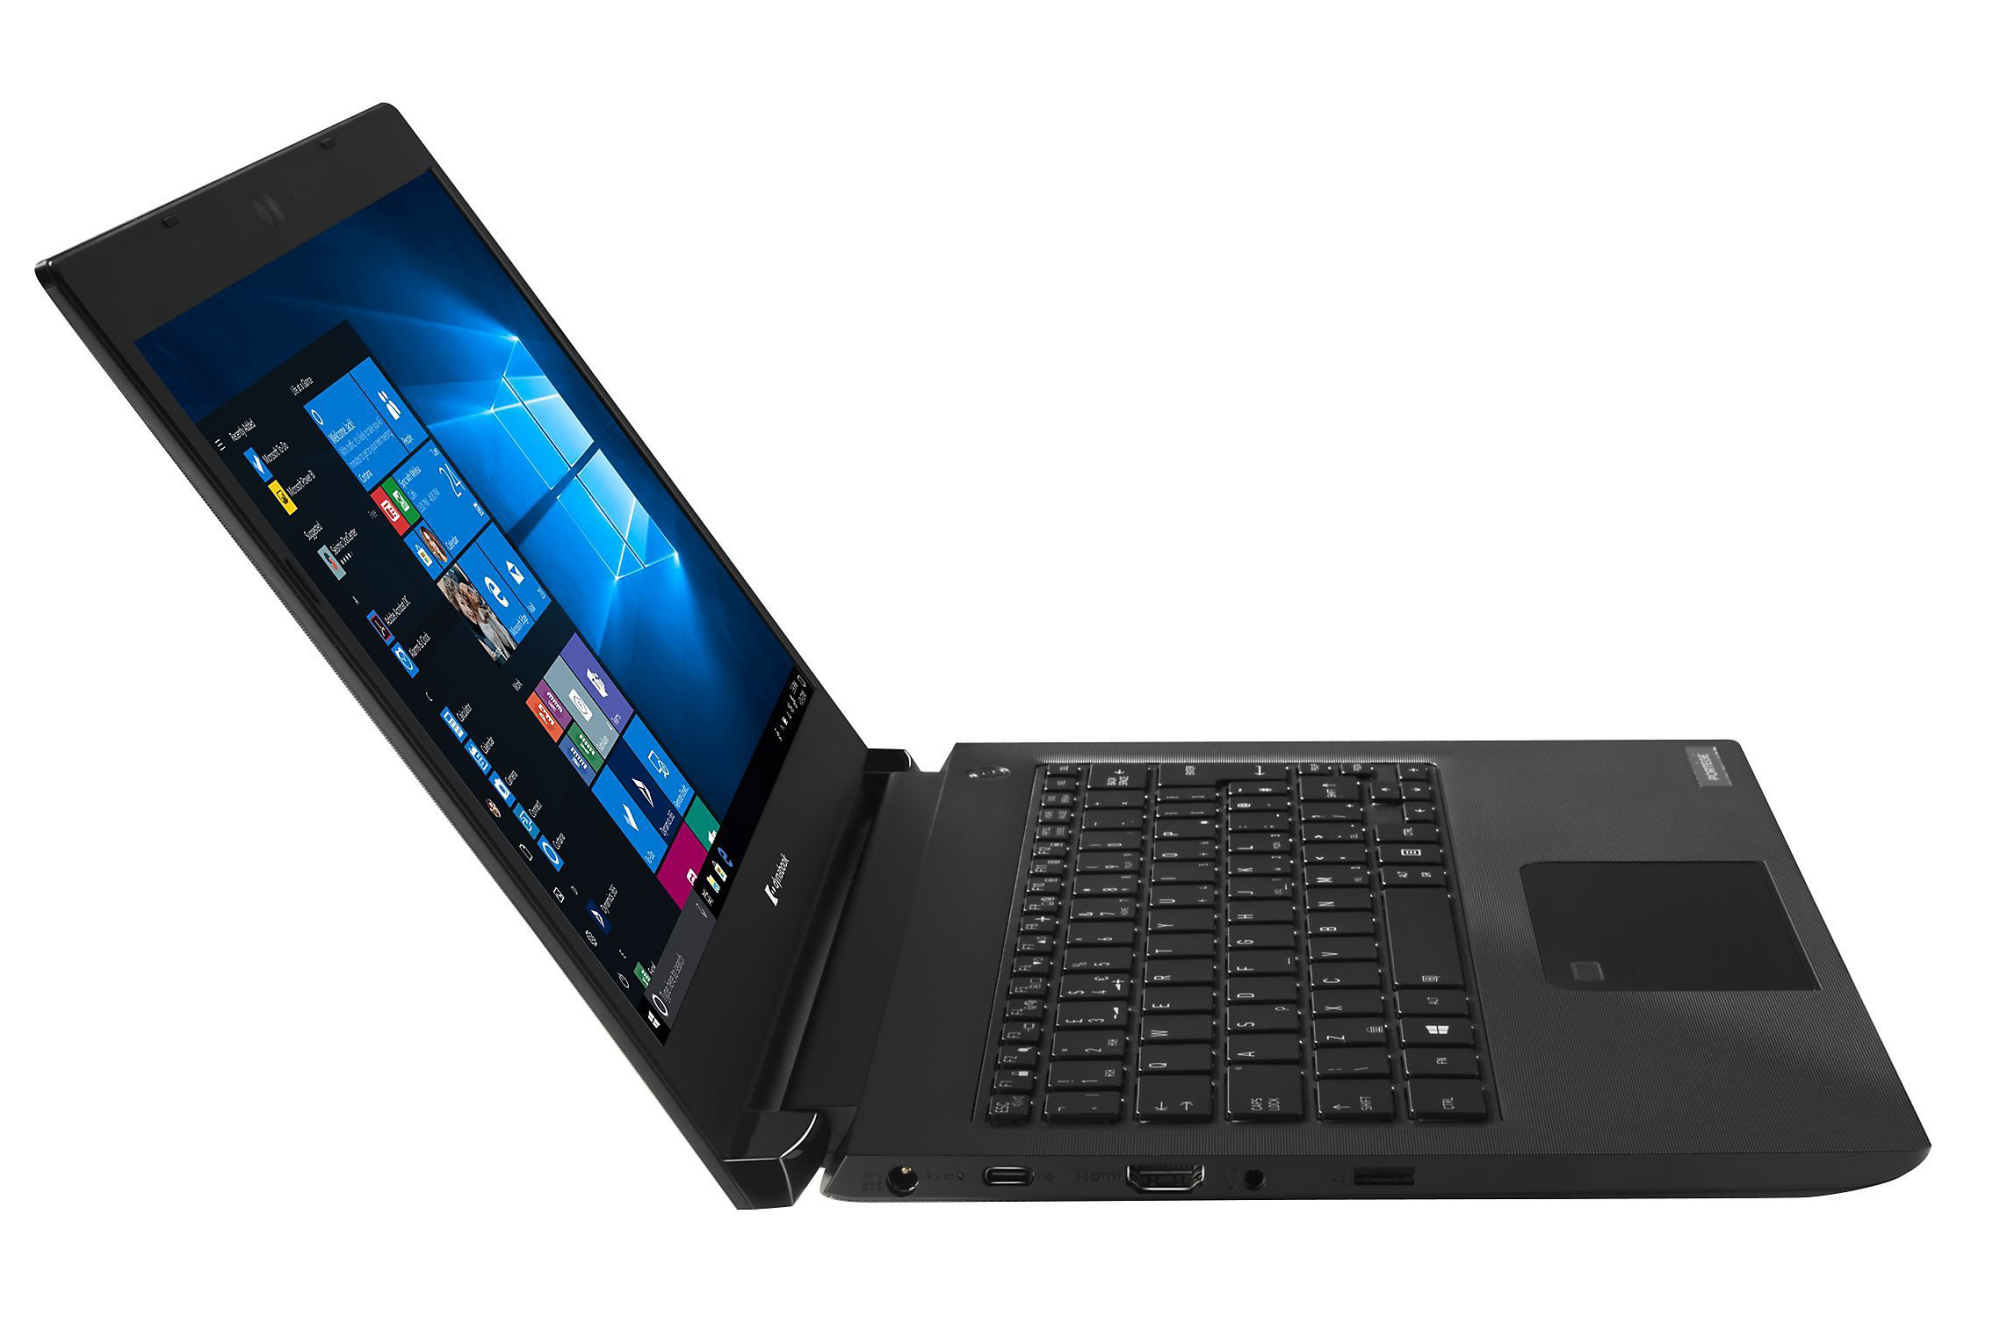
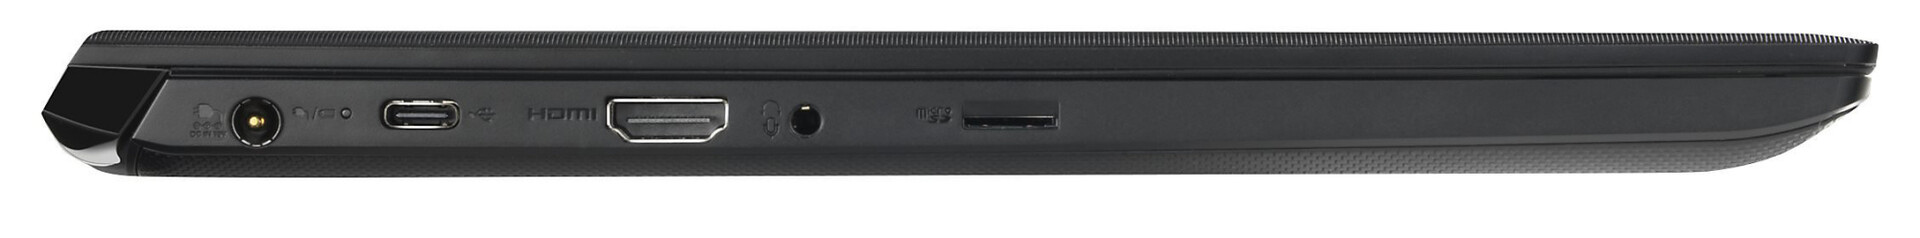
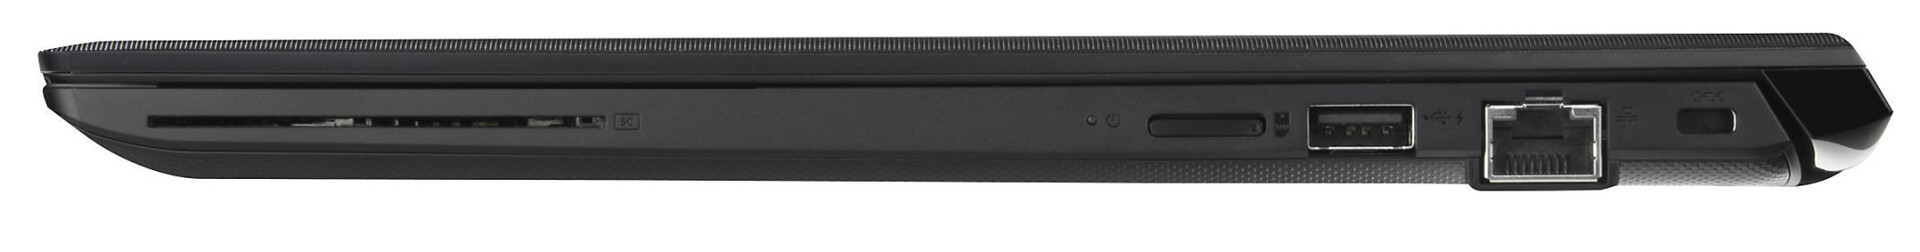
Port configuration
| SD Card Reader | |
| average JPG Copy Test (av. of 3 runs) | |
| Dell Latitude 5300 (Toshiba Exceria Pro M501 64 GB UHS-II) | |
| Moyenne de la classe Subnotebook (23.7 - 188, n=9, 2 dernières années) | |
| Lenovo ThinkPad L390-20NR0013GE (Toshiba Exceria Pro M501 UHS-II) | |
| HP ProBook 430 G6-5TJ89EA (Toshiba Exceria Pro SDXC 64 GB UHS-II) | |
| Toshiba Portege A30-D-139 (Toshiba Exceria Pro SDXC 64 GB UHS-II) | |
| Dynabook Portege A30-E-174 (Toshiba Exceria Pro M501 microSDXC 64GB) | |
| maximum AS SSD Seq Read Test (1GB) | |
| Dell Latitude 5300 (Toshiba Exceria Pro M501 64 GB UHS-II) | |
| Moyenne de la classe Subnotebook (24.9 - 195, n=8, 2 dernières années) | |
| Toshiba Portege A30-D-139 (Toshiba Exceria Pro SDXC 64 GB UHS-II) | |
| Lenovo ThinkPad L390-20NR0013GE (Toshiba Exceria Pro M501 UHS-II) | |
| Dynabook Portege A30-E-174 (Toshiba Exceria Pro M501 microSDXC 64GB) | |
| HP ProBook 430 G6-5TJ89EA (Toshiba Exceria Pro SDXC 64 GB UHS-II) | |
| |||||||||||||||||||||||||
Homogénéité de la luminosité: 82 %
Valeur mesurée au centre, sur batterie: 469 cd/m²
Contraste: 1538:1 (Valeurs des noirs: 0.305 cd/m²)
ΔE ColorChecker Calman: 1.6 | ∀{0.5-29.43 Ø4.73}
ΔE Greyscale Calman: 2.1 | ∀{0.09-98 Ø4.97}
96% sRGB (Argyll 1.6.3 3D)
60% AdobeRGB 1998 (Argyll 1.6.3 3D)
66.2% AdobeRGB 1998 (Argyll 3D)
96.5% sRGB (Argyll 3D)
65.2% Display P3 (Argyll 3D)
Gamma: 2.13
CCT: 6656 K
| Dynabook Portege A30-E-174 IPS, 1920x1080, 13.3" | Toshiba Portege A30-D-139 IPS, 1920x1080, 13.3" | Dell Latitude 5300 IPS, 1920x1080, 13.3" | Lenovo ThinkPad L390-20NR0013GE IPS LED, 1920x1080, 13.3" | HP ProBook 430 G6-5TJ89EA IPS LED, 1920x1080, 13.3" | |
|---|---|---|---|---|---|
| Display | 4% | 2% | -37% | -35% | |
| Display P3 Coverage (%) | 65.2 | 68 4% | 68.2 5% | 40.42 -38% | 41.87 -36% |
| sRGB Coverage (%) | 96.5 | 98.1 2% | 94.4 -2% | 60.4 -37% | 62.6 -35% |
| AdobeRGB 1998 Coverage (%) | 66.2 | 70 6% | 68.7 4% | 41.8 -37% | 43.3 -35% |
| Response Times | 24% | 29% | 21% | 22% | |
| Response Time Grey 50% / Grey 80% * (ms) | 57 ? | 40 ? 30% | 38 ? 33% | 42.8 ? 25% | 40.8 ? 28% |
| Response Time Black / White * (ms) | 36 ? | 30 ? 17% | 27.2 ? 24% | 30 ? 17% | 30.4 ? 16% |
| PWM Frequency (Hz) | 250 ? | 208 ? | 30490 ? | 26040 ? | |
| Screen | -58% | -37% | -145% | -106% | |
| Brightness middle (cd/m²) | 469 | 319 -32% | 326 -30% | 298 -36% | 255 -46% |
| Brightness (cd/m²) | 422 | 296 -30% | 313 -26% | 278 -34% | 238 -44% |
| Brightness Distribution (%) | 82 | 88 7% | 87 6% | 81 -1% | 88 7% |
| Black Level * (cd/m²) | 0.305 | 0.28 8% | 0.27 11% | 0.33 -8% | 0.18 41% |
| Contrast (:1) | 1538 | 1139 -26% | 1207 -22% | 903 -41% | 1417 -8% |
| Colorchecker dE 2000 * | 1.6 | 4.04 -153% | 3.2 -100% | 6.5 -306% | 5.4 -238% |
| Colorchecker dE 2000 max. * | 2.7 | 8.09 -200% | 6.3 -133% | 23.9 -785% | 19.5 -622% |
| Greyscale dE 2000 * | 2.1 | 5.5 -162% | 3.8 -81% | 5.6 -167% | 3.8 -81% |
| Gamma | 2.13 103% | 2.4 92% | 2.14 103% | 2.08 106% | 2.41 91% |
| CCT | 6656 98% | 7198 90% | 6900 94% | 6669 97% | 7100 92% |
| Color Space (Percent of AdobeRGB 1998) (%) | 60 | 64 7% | 63.8 6% | 38.4 -36% | 39.4 -34% |
| Color Space (Percent of sRGB) (%) | 96 | 98 2% | 94.8 -1% | 60.1 -37% | 62.5 -35% |
| Colorchecker dE 2000 calibrated * | 1.6 | 4.9 | 4.1 | ||
| Moyenne finale (programmes/paramètres) | -10% /
-35% | -2% /
-20% | -54% /
-101% | -40% /
-75% |
* ... Moindre est la valeur, meilleures sont les performances
Temps de réponse de l'écran
| ↔ Temps de réponse noir à blanc | ||
|---|---|---|
| 36 ms ... hausse ↗ et chute ↘ combinées | ↗ 18 ms hausse | 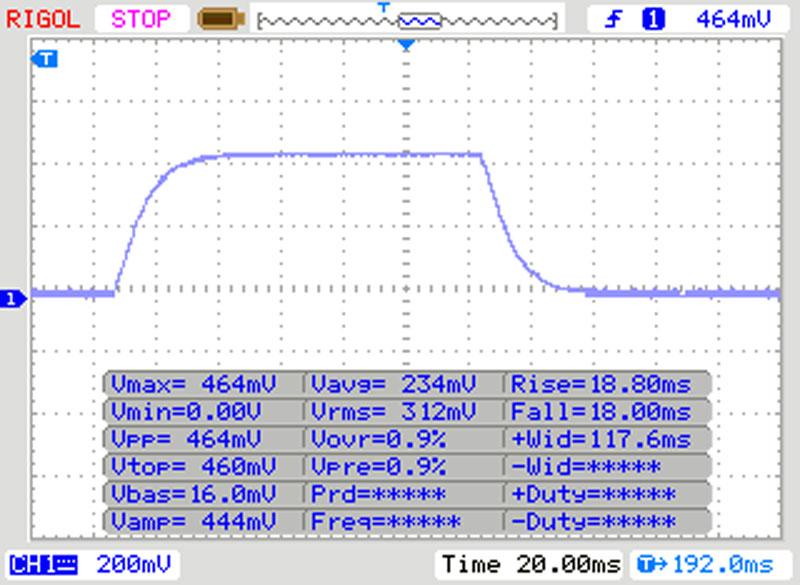 |
| ↘ 18 ms chute | ||
| L'écran souffre de latences très élevées, à éviter pour le jeu. En comparaison, tous les appareils testés affichent entre 0.1 (minimum) et 240 (maximum) ms. » 94 % des appareils testés affichent de meilleures performances. Cela signifie que les latences relevées sont moins bonnes que la moyenne (19.9 ms) de tous les appareils testés. | ||
| ↔ Temps de réponse gris 50% à gris 80% | ||
| 57 ms ... hausse ↗ et chute ↘ combinées | ↗ 27 ms hausse | 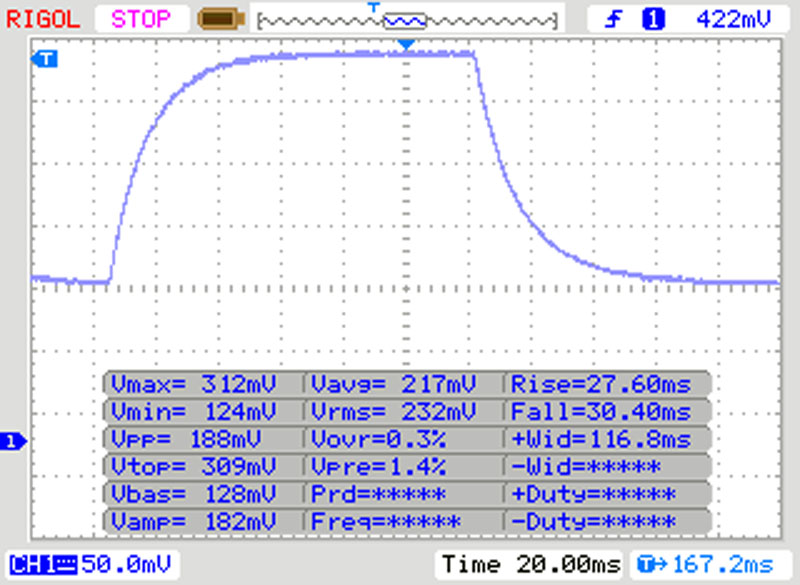 |
| ↘ 30 ms chute | ||
| L'écran souffre de latences très élevées, à éviter pour le jeu. En comparaison, tous les appareils testés affichent entre 0.165 (minimum) et 636 (maximum) ms. » 94 % des appareils testés affichent de meilleures performances. Cela signifie que les latences relevées sont moins bonnes que la moyenne (31.1 ms) de tous les appareils testés. | ||
Scintillement / MLI (Modulation de largeur d'impulsion)
| Scintillement / MLI (Modulation de largeur d'impulsion) décelé | 250 Hz | ≤ 20 Niveau de luminosité | 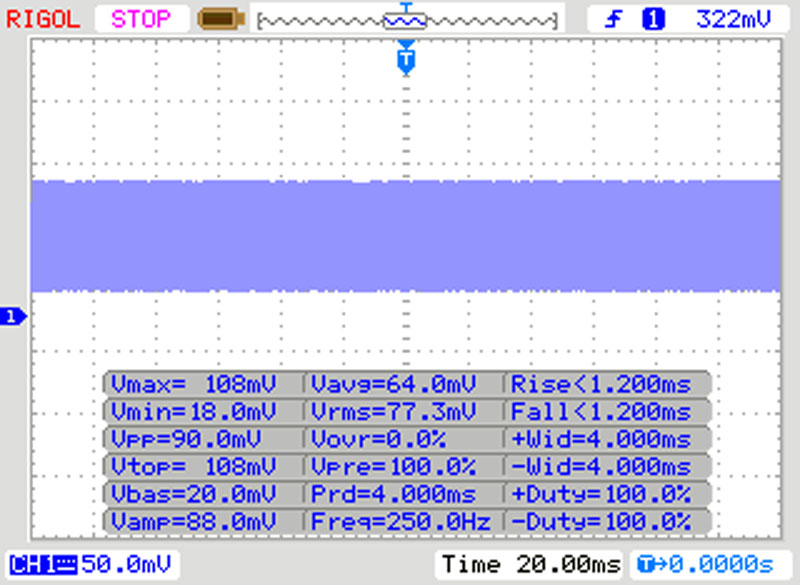 |
Le rétroéclairage de l'écran scintille à la fréquence de 250 Hz (certainement du fait de l'utilisation d'une MDI - Modulation de largeur d'impulsion) à un niveau de luminosité inférieur ou égal à 20 % . Aucun scintillement ne devrait être perceptible au-dessus de cette valeur. La fréquence de rafraîchissement de 250 Hz est relativement faible, les personnes les plus sensibles devraient percevoir un scintillement et être sujettes à une fatigue oculaire accrue (avec le niveau de luminosité indiqué) En comparaison, 52 % des appareils testés n'emploient pas MDI pour assombrir leur écran. Nous avons relevé une moyenne à 7798 (minimum : 5 - maximum : 343500) Hz dans le cas où une MDI était active. | |||
| Cinebench R10 | |
| Rendering Single 32Bit | |
| Moyenne de la classe Subnotebook (2299 - 10697, n=13, 2 dernières années) | |
| Moyenne Intel Core i7-8550U (4202 - 8211, n=31) | |
| Dynabook Portege A30-E-174 | |
| Rendering Multiple CPUs 32Bit | |
| Moyenne de la classe Subnotebook (14395 - 51868, n=13, 2 dernières années) | |
| Moyenne Intel Core i7-8550U (11694 - 24180, n=31) | |
| Dynabook Portege A30-E-174 | |
| Geekbench 3 | |
| 32 Bit Multi-Core Score | |
| Moyenne de la classe Subnotebook (n=12 dernières années) | |
| Moyenne Intel Core i7-8550U (8918 - 14144, n=12) | |
| Dynabook Portege A30-E-174 | |
| 32 Bit Single-Core Score | |
| Moyenne de la classe Subnotebook (n=12 dernières années) | |
| Dynabook Portege A30-E-174 | |
| Moyenne Intel Core i7-8550U (2471 - 4020, n=12) | |
| Mozilla Kraken 1.1 - Total | |
| Lenovo ThinkPad L390-20NR0013GE (Edge) | |
| HP ProBook 430 G6-5TJ89EA (Edge) | |
| Dynabook Portege A30-E-174 (Edge 44) | |
| Moyenne Intel Core i7-8550U (877 - 2114, n=45) | |
| Moyenne de la classe Subnotebook (234 - 1104, n=62, 2 dernières années) | |
| Octane V2 - Total Score | |
| Moyenne de la classe Subnotebook (35801 - 142020, n=29, 2 dernières années) | |
| Moyenne Intel Core i7-8550U (17296 - 42043, n=39) | |
| HP ProBook 430 G6-5TJ89EA (Edge) | |
| Lenovo ThinkPad L390-20NR0013GE (Edge) | |
| Dynabook Portege A30-E-174 (Edge 44) | |
| JetStream 1.1 - 1.1 Total | |
| Moyenne de la classe Subnotebook (215 - 476, n=2, 2 dernières années) | |
| HP ProBook 430 G6-5TJ89EA (Edge) | |
| Moyenne Intel Core i7-8550U (141.9 - 288, n=61) | |
| Lenovo ThinkPad L390-20NR0013GE (Edge) | |
| Dynabook Portege A30-E-174 (Edge 44) | |
* ... Moindre est la valeur, meilleures sont les performances
| PCMark 8 Home Score Accelerated v2 | 3495 points | |
| PCMark 8 Creative Score Accelerated v2 | 3481 points | |
| PCMark 8 Work Score Accelerated v2 | 4848 points | |
| PCMark 10 Score | 3407 points | |
Aide | ||

| Dynabook Portege A30-E-174 Toshiba KBG40ZNV512G | Toshiba Portege A30-D-139 Toshiba SG5 THNSNK128GVN8 | Dell Latitude 5300 SK Hynix PC401 512GB M.2 (HFS512GD9TNG) | Lenovo ThinkPad L390-20NR0013GE Samsung SSD PM981 MZVLB256HAHQ | HP ProBook 430 G6-5TJ89EA WDC PC SN520 SDAPNUW-256G | Moyenne Toshiba KBG40ZNV512G | Moyenne de la classe Subnotebook | |
|---|---|---|---|---|---|---|---|
| CrystalDiskMark 5.2 / 6 | -64% | 5% | 11% | -8% | 14% | 95% | |
| Write 4K (MB/s) | 120.8 | 79.9 -34% | 119.2 -1% | 99.6 -18% | 101.8 -16% | 142.5 ? 18% | 153.9 ? 27% |
| Read 4K (MB/s) | 51.3 | 22.68 -56% | 41.43 -19% | 37.22 -27% | 41.35 -19% | 51.5 ? 0% | 64.1 ? 25% |
| Write Seq (MB/s) | 1254 | 139.4 -89% | 1240 -1% | 1432 14% | 929 -26% | 1425 ? 14% | 2840 ? 126% |
| Read Seq (MB/s) | 1337 | 472.7 -65% | 1668 25% | 2072 55% | 1388 4% | 1511 ? 13% | 3267 ? 144% |
| Write 4K Q32T1 (MB/s) | 289.5 | 122.6 -58% | 381.7 32% | 439.7 52% | 453.5 57% | 349 ? 21% | 428 ? 48% |
| Read 4K Q32T1 (MB/s) | 392.9 | 234.6 -40% | 371.5 -5% | 264.8 -33% | 286.2 -27% | 563 ? 43% | 497 ? 26% |
| Write Seq Q32T1 (MB/s) | 1490 | 139.3 -91% | 1369 -8% | 1549 4% | 1302 -13% | 1508 ? 1% | 4598 ? 209% |
| Read Seq Q32T1 (MB/s) | 2301 | 549 -76% | 2652 15% | 3318 44% | 1751 -24% | 2311 ? 0% | 5765 ? 151% |
| 3DMark 11 Performance | 1971 points | |
| 3DMark Cloud Gate Standard Score | 8060 points | |
| 3DMark Fire Strike Score | 1128 points | |
| 3DMark Time Spy Score | 436 points | |
Aide | ||
| Bas | Moyen | Élevé | Ultra | |
|---|---|---|---|---|
| BioShock Infinite (2013) | 68.7 | 37 | 31.4 | 10.4 |
Degré de la nuisance sonore
| Au repos |
| 30.4 / 30.4 / 30.4 dB(A) |
| Fortement sollicité |
| 34.7 / 38.8 dB(A) |
 | ||
30 dB silencieux 40 dB(A) audible 50 dB(A) bruyant |
||
min: | ||
(+) La température maximale du côté supérieur est de 36.3 °C / 97 F, par rapport à la moyenne de 35.9 °C / 97 F, allant de 21.4 à 59 °C pour la classe Subnotebook.
(±) Le fond chauffe jusqu'à un maximum de 40.8 °C / 105 F, contre une moyenne de 39.2 °C / 103 F
(+) En utilisation inactive, la température moyenne du côté supérieur est de 25.3 °C / 78 F, par rapport à la moyenne du dispositif de 30.8 °C / 87 F.
(+) Les repose-poignets et le pavé tactile sont plus froids que la température de la peau avec un maximum de 24.3 °C / 75.7 F et sont donc froids au toucher.
(+) La température moyenne de la zone de l'appui-paume de dispositifs similaires était de 28.2 °C / 82.8 F (+3.9 °C / #7.1 F).
Dynabook Portege A30-E-174 analyse audio
(±) | le niveau sonore du haut-parleur est moyen mais bon (75.2# dB)
Basses 100 - 315 Hz
(-) | presque aucune basse - en moyenne 27.8% plus bas que la médiane
(±) | la linéarité des basses est moyenne (7.6% delta à la fréquence précédente)
Médiums 400 - 2000 Hz
(±) | médiane supérieure - en moyenne 10.3% supérieure à la médiane
(±) | la linéarité des médiums est moyenne (10.8% delta à la fréquence précédente)
Aiguës 2 - 16 kHz
(±) | sommets plus élevés - en moyenne 11.5% plus élevés que la médiane
(±) | la linéarité des aigus est moyenne (7.5% delta à la fréquence précédente)
Globalement 100 - 16 000 Hz
(-) | le son global n'est pas linéaire (36.1% de différence à la médiane)
Par rapport à la même classe
» 97% de tous les appareils testés de cette catégorie étaient meilleurs, 1% similaires, 2% pires
» Le meilleur avait un delta de 5%, la moyenne était de 18%, le pire était de 53%.
Par rapport à tous les appareils testés
» 94% de tous les appareils testés étaient meilleurs, 1% similaires, 5% pires
» Le meilleur avait un delta de 4%, la moyenne était de 24%, le pire était de 134%.
| Éteint/en veille | |
| Au repos | |
| Fortement sollicité |
|
Légende:
min: | |
Points positifs
Points négatifs
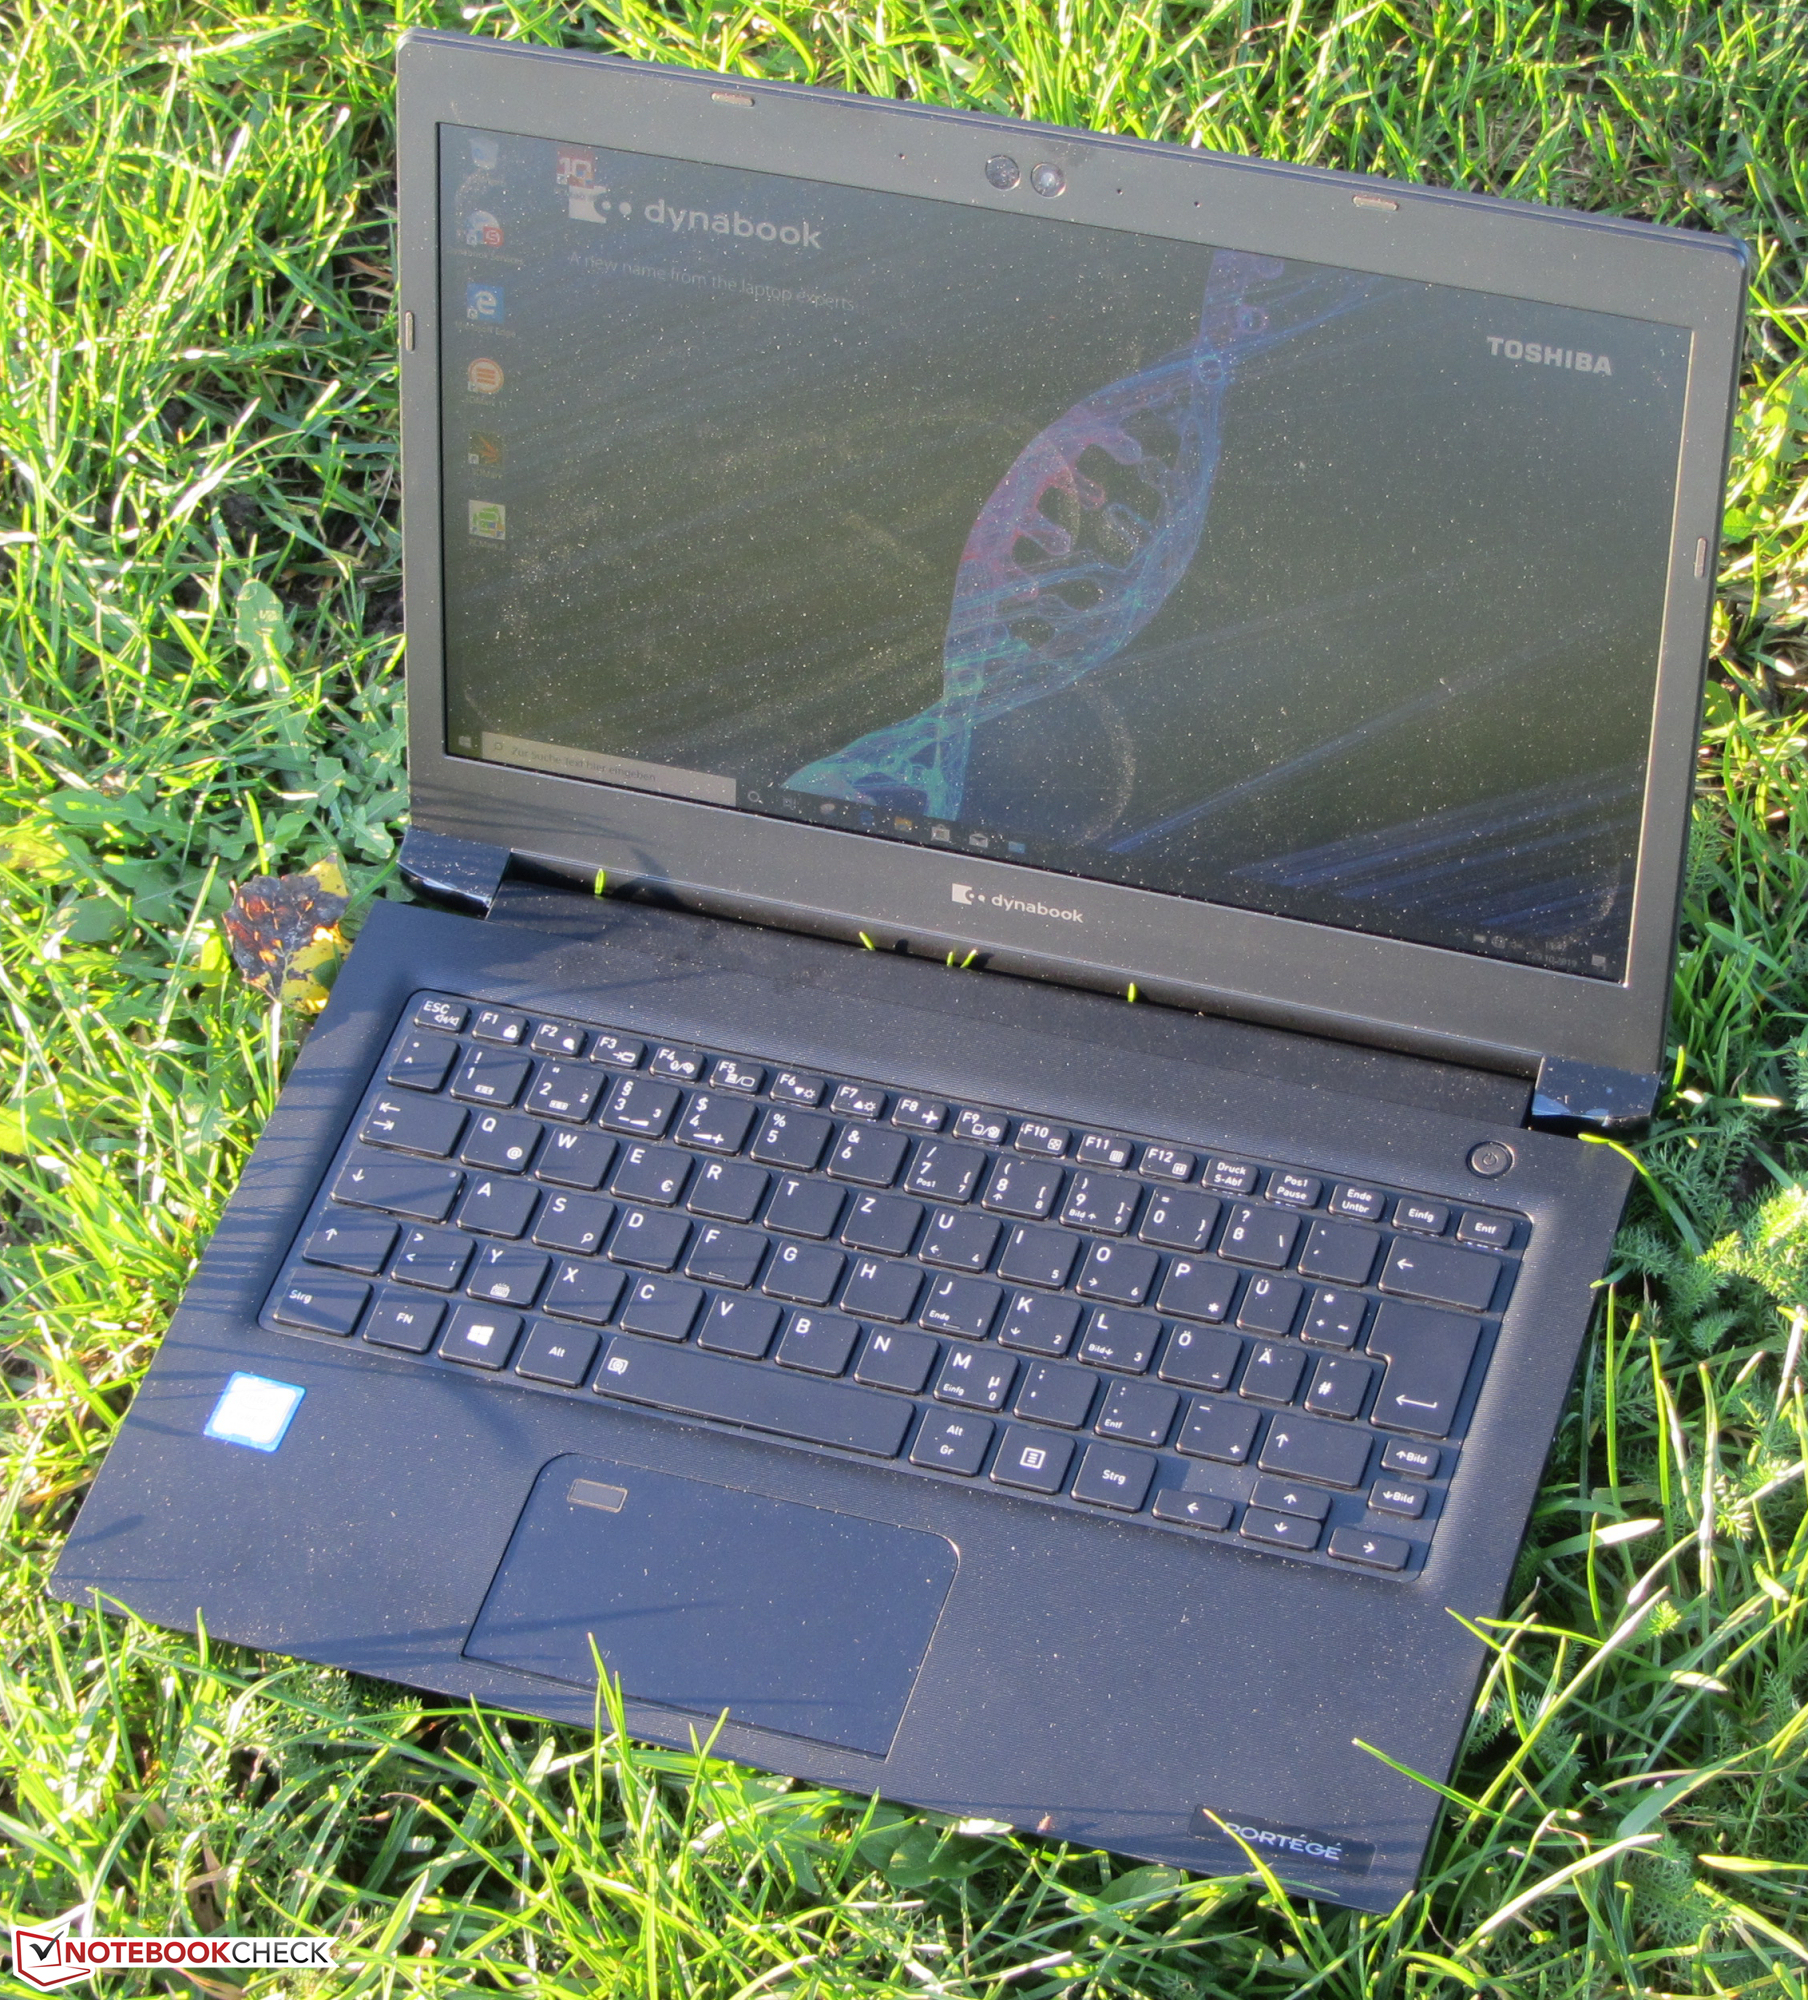
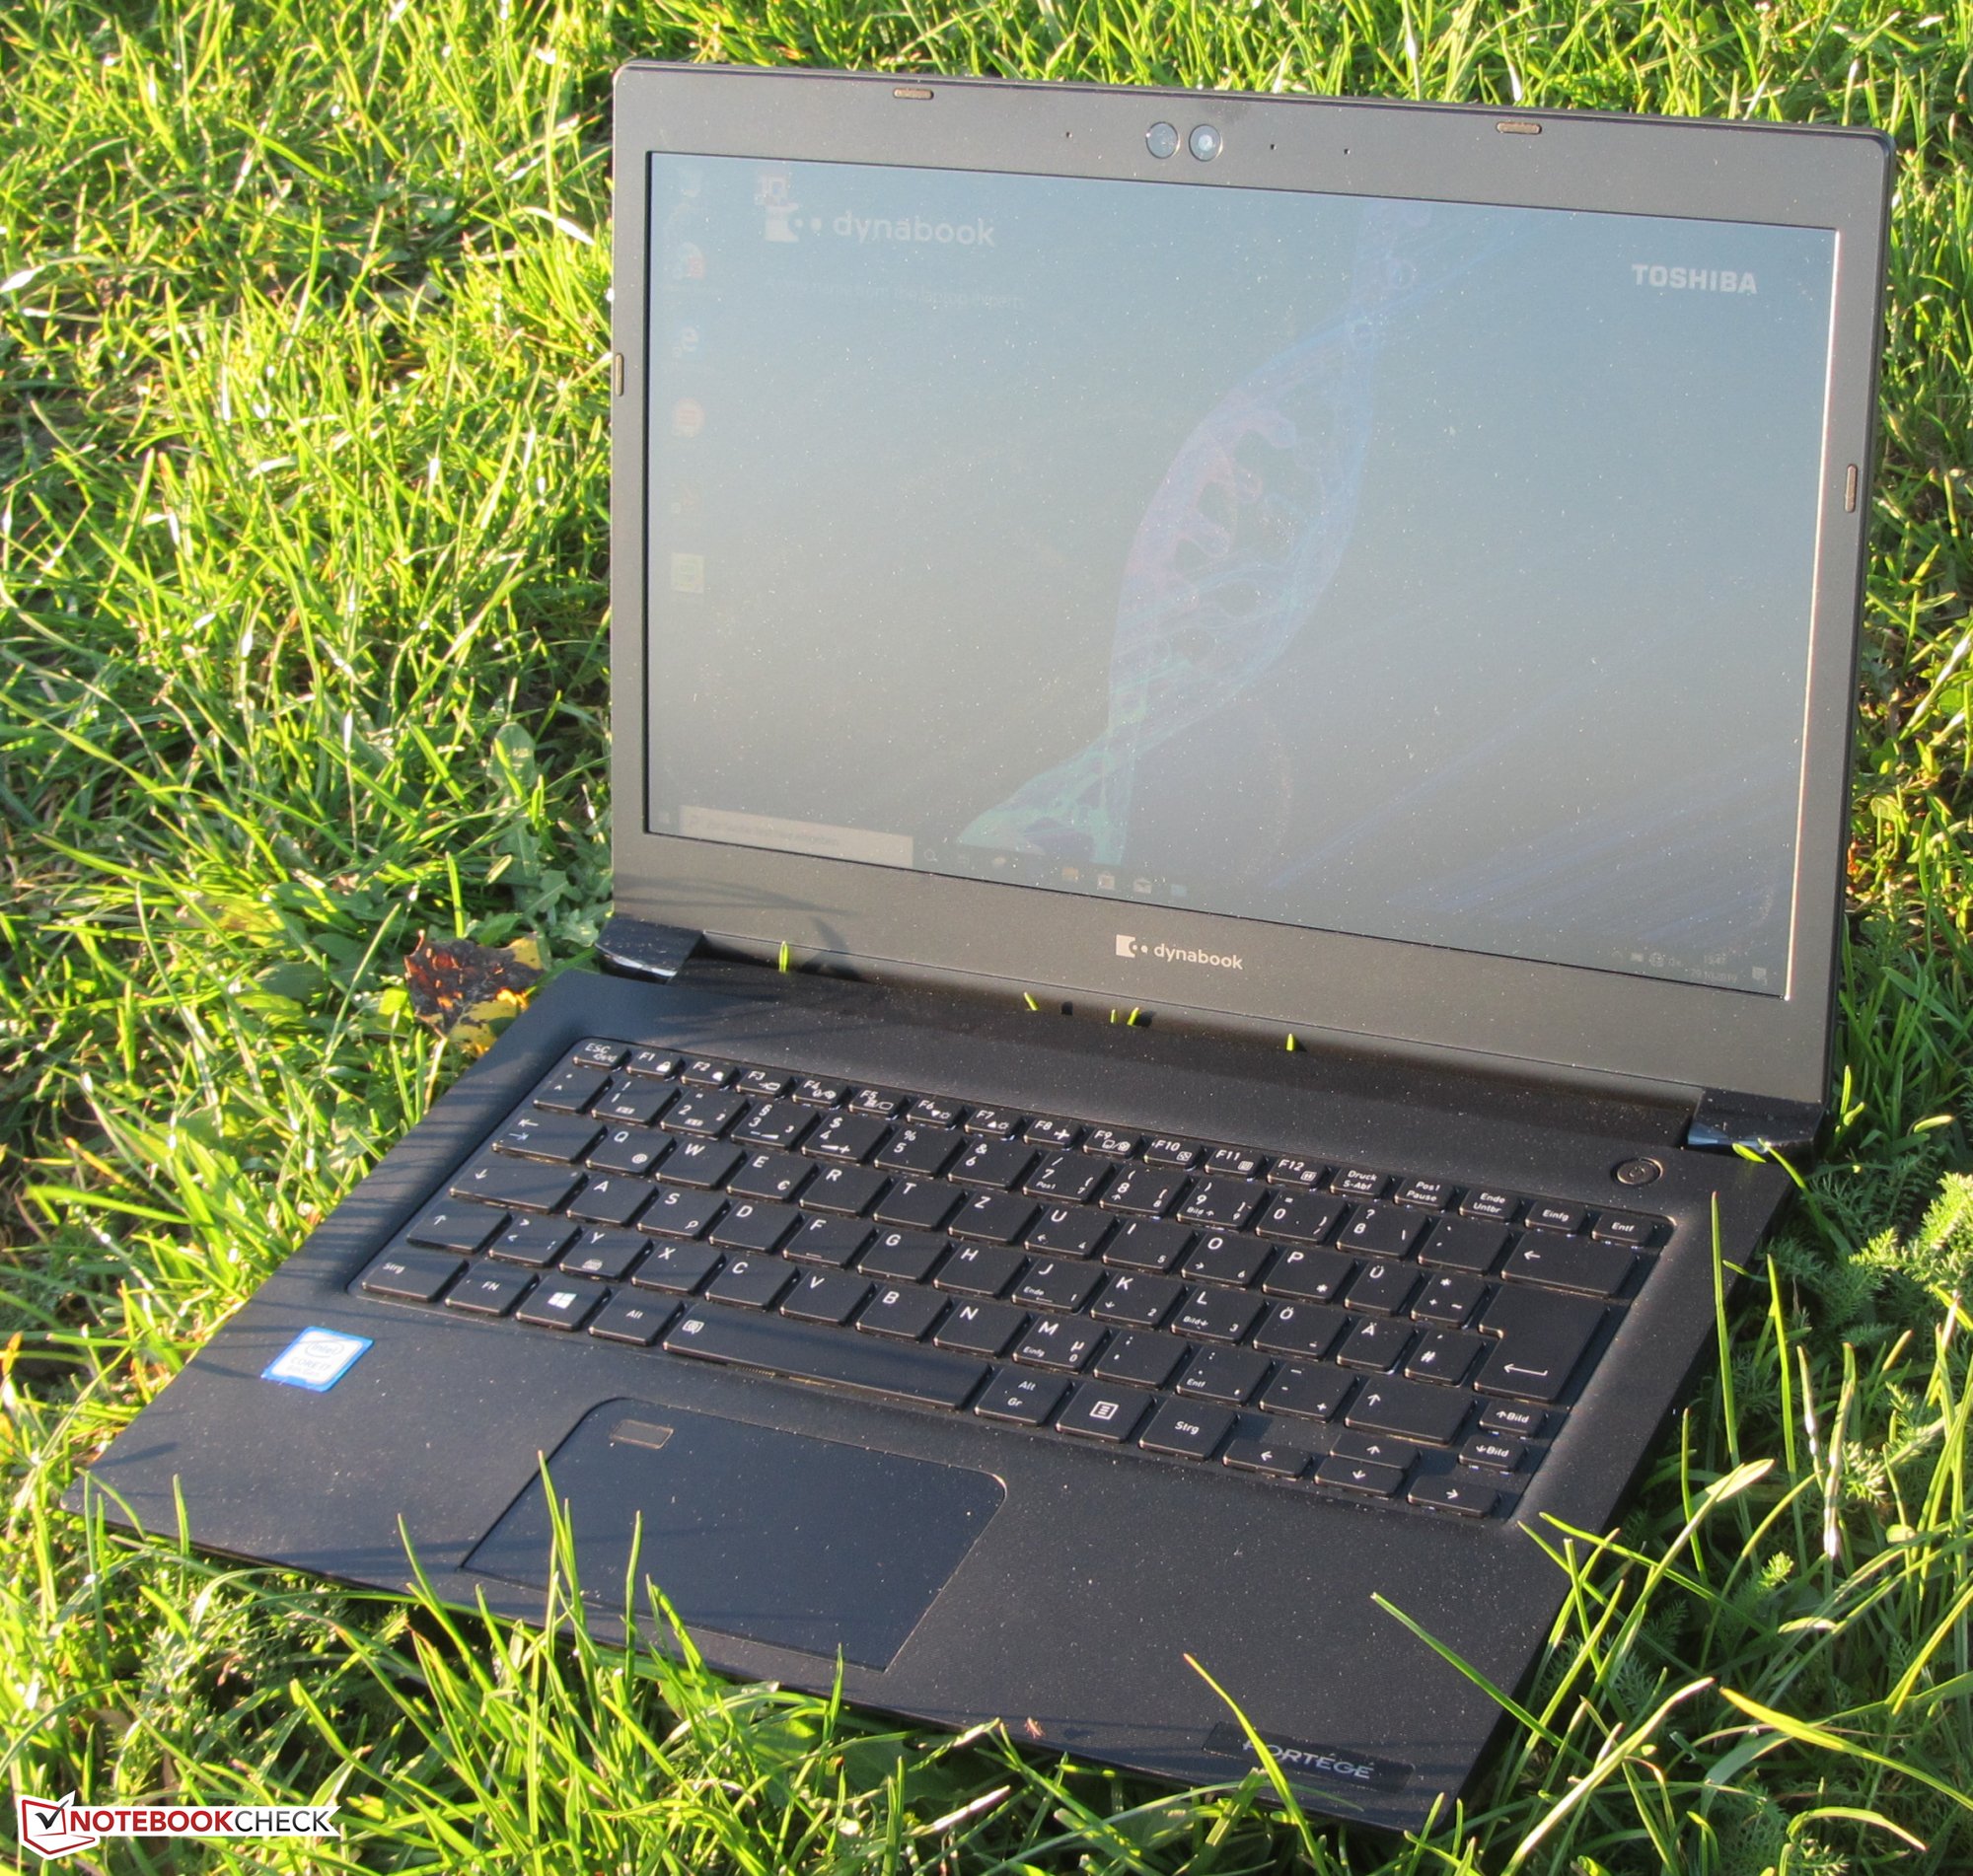
Le gros point fort du Portégé A30-E est son écran. C’est un écran IPS lumineux, contrasté, aux angles de vision stables, et qui possède des couleurs fidèles. La couverture de l’espace sRVB monte à 96 %.
Le Portégé A30-E laisse une impression mitigée.
La coque en plastique mat noir est ainsi bien incapable de convaincre, étant peu rigide. Le clavier rétroéclairé pourra faire l’affaire, mais pas pour ceux qui rédigent beaucoup. À l’inverse, l’autonomie est digne de louanges.
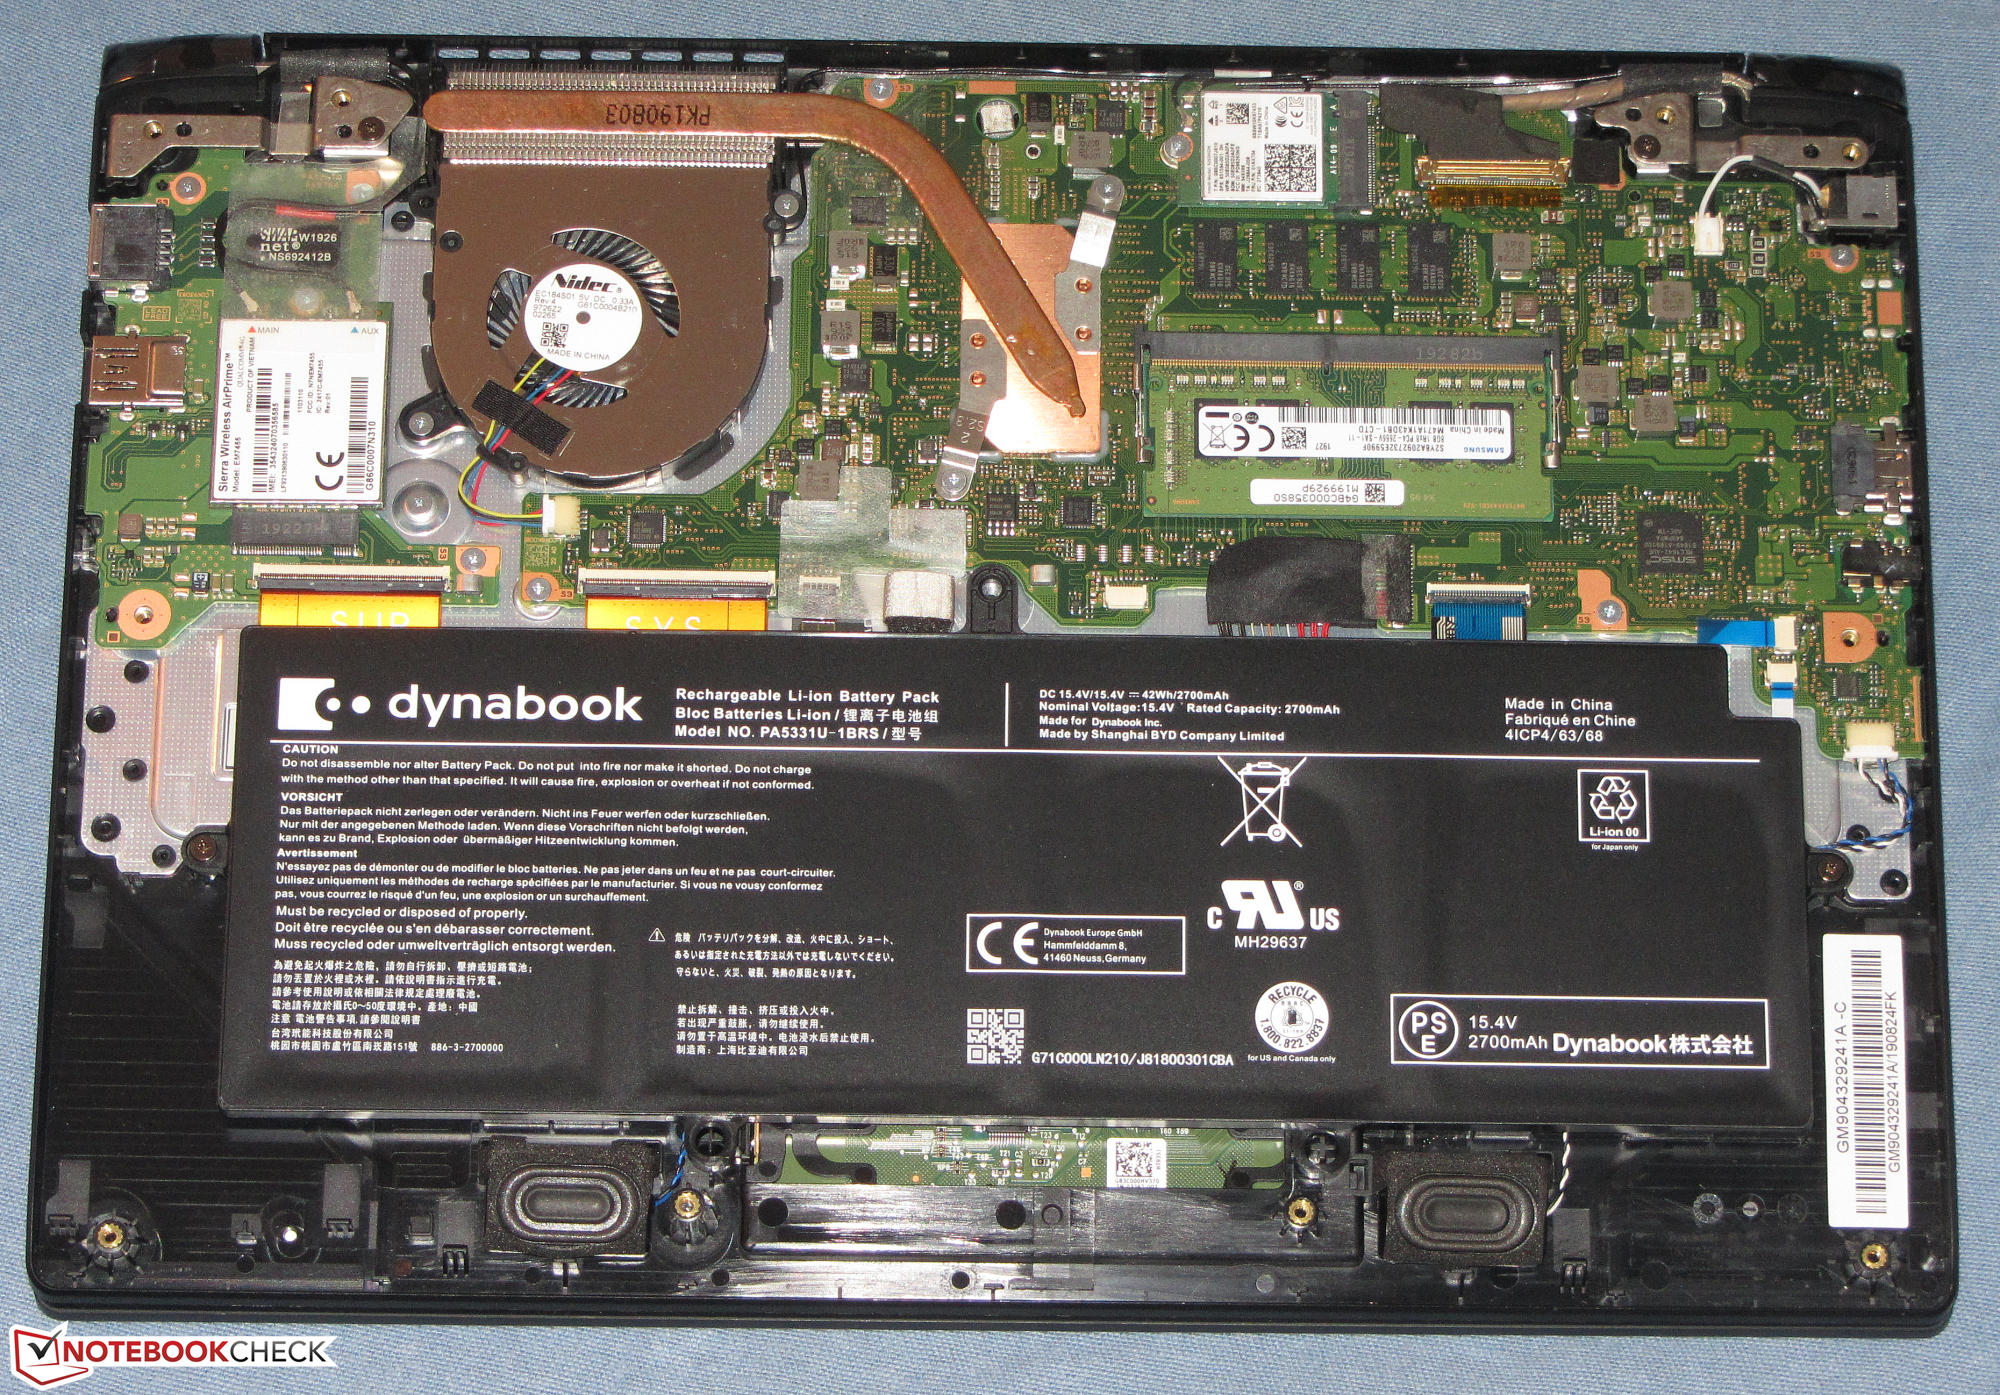
Le SSD NVMe permet au système d’être réactif. Son remplacement est possible, mais non sans efforts : la carte-mère doit être enlevée.
Le processeur Kaby Lake quadricoeur embarqué est assez puissant pour une utilisation bureautique et web. Mais il ne peut pas vraiment utiliser son Turbo Boost en cas de sollicitations multithread prolongées. Sur batterie, le turbo du CPU est peu, voire pas du tout, utilisé.
Un modem LTE permet de connecter l’appareil à Internet. Le port USB C intégré (USB 3.2 Gen. 2) intègre à la fois le DisplayPort et le Power Delivery 3.0 - qui permet d’alimenter le portable via son port USB C.
L’intégralité de cette critique est disponible en anglais en suivant ce lien.
Dynabook Portege A30-E-174
- 11/04/2019 v7 (old)
Sascha Mölck