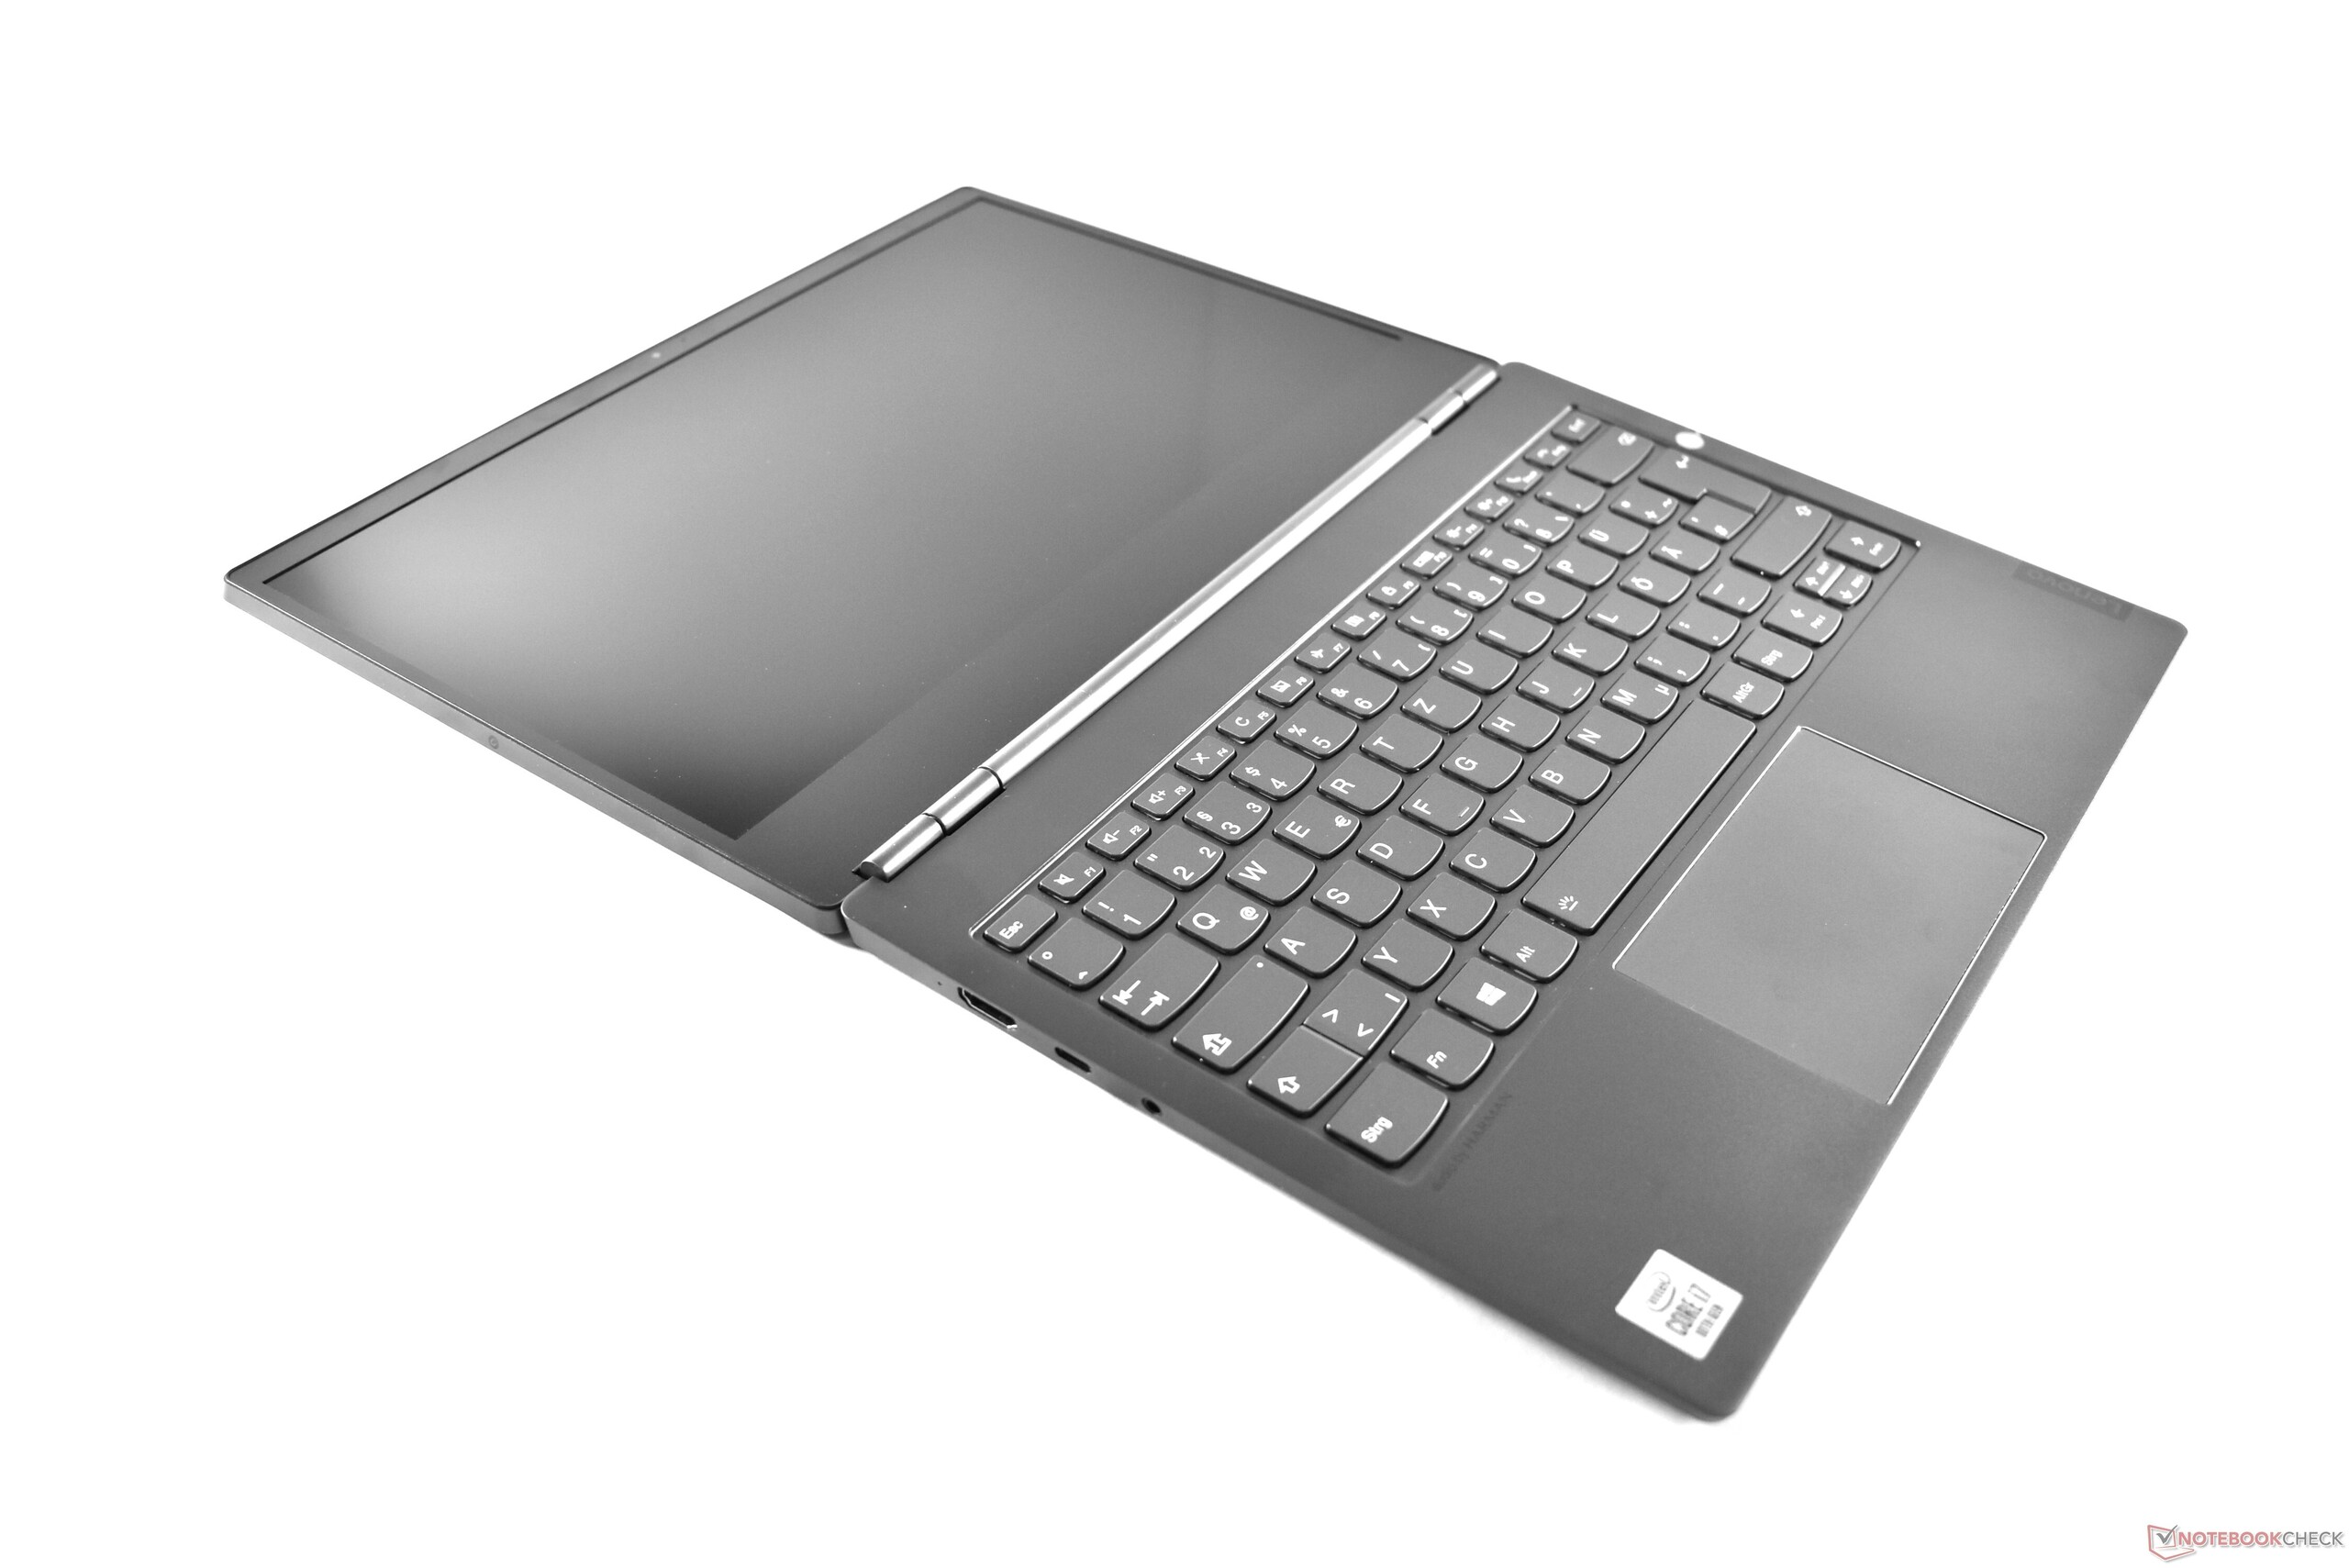
Test du Lenovo ThinkBook Plus (i7-10510U, UHD 620, FHD) : l'écran E-Ink unique avec des composants moyens
Note | Date | Modèle | Poids | Épaisseur | Taille | Résolution | Prix |
|---|---|---|---|---|---|---|---|
| 86.9 % v7 (old) | 10/20 | Lenovo ThinkBook Plus 13 i7 i7-10510U, UHD Graphics 620 | 1.4 kg | 17.4 mm | 13.30" | 1920x1080 | |
| 85.1 % v7 (old) | 06/20 | Dynabook Portege X30L-G1331 i5-10210U, UHD Graphics 620 | 859 g | 17.9 mm | 13.30" | 1920x1080 | |
| 83.7 % v7 (old) | Fujitsu Lifebook U939 i5 i5-8265U, UHD Graphics 620 | 900 g | 15 mm | 13.30" | 1920x1080 | ||
| 89.5 % v7 (old) | 09/20 | Lenovo ThinkPad X13-20UGS00800 R7 PRO 4750U, Vega 7 | 1.3 kg | 16.9 mm | 13.30" | 1920x1080 |
| Networking | |
| iperf3 transmit AX12 | |
| Dynabook Portege X30L-G1331 | |
| Moyenne Intel Wi-Fi 6 AX201 (49.8 - 1775, n=324) | |
| Lenovo ThinkPad X13-20UGS00800 | |
| Lenovo ThinkBook Plus 13 i7 | |
| Fujitsu Lifebook U939 i5 | |
| iperf3 receive AX12 | |
| Lenovo ThinkPad X13-20UGS00800 | |
| Moyenne Intel Wi-Fi 6 AX201 (136 - 1743, n=324) | |
| Dynabook Portege X30L-G1331 | |
| Fujitsu Lifebook U939 i5 | |
| Lenovo ThinkBook Plus 13 i7 | |


| |||||||||||||||||||||||||
Homogénéité de la luminosité: 89 %
Valeur mesurée au centre, sur batterie: 328 cd/m²
Contraste: 1562:1 (Valeurs des noirs: 0.21 cd/m²)
ΔE ColorChecker Calman: 6.4 | ∀{0.5-29.43 Ø4.71}
calibrated: 1.2
ΔE Greyscale Calman: 6.5 | ∀{0.09-98 Ø4.96}
95.9% sRGB (Argyll 1.6.3 3D)
61.6% AdobeRGB 1998 (Argyll 1.6.3 3D)
67% AdobeRGB 1998 (Argyll 3D)
96.1% sRGB (Argyll 3D)
66% Display P3 (Argyll 3D)
Gamma: 2.87
CCT: 6428 K
| Lenovo ThinkBook Plus 13 i7 LP133WF7-SPB1, IPS LED, 1920x1080, 13.3" | Dynabook Portege X30L-G1331 Toshiba TOS508F, IPS, 1920x1080, 13.3" | Fujitsu Lifebook U939 i5 Sharp SHP14BD, IPS, 1920x1080, 13.3" | Lenovo ThinkPad X13-20UGS00800 B133HAK01.1, IPS LED, 1920x1080, 13.3" | |
|---|---|---|---|---|
| Display | 1% | -1% | -2% | |
| Display P3 Coverage (%) | 66 | 66.9 1% | 65.3 -1% | 64.8 -2% |
| sRGB Coverage (%) | 96.1 | 97.6 2% | 95 -1% | 95.6 -1% |
| AdobeRGB 1998 Coverage (%) | 67 | 67.8 1% | 66 -1% | 65.7 -2% |
| Response Times | -7% | 2% | 0% | |
| Response Time Grey 50% / Grey 80% * (ms) | 53.6 ? | 54.8 ? -2% | 55.2 ? -3% | 56.8 ? -6% |
| Response Time Black / White * (ms) | 32 ? | 35.6 ? -11% | 29.6 ? 7% | 30 ? 6% |
| PWM Frequency (Hz) | 23810 ? | 211.9 ? | ||
| Screen | 17% | -2% | 1% | |
| Brightness middle (cd/m²) | 328 | 482 47% | 384 17% | 331 1% |
| Brightness (cd/m²) | 329 | 452 37% | 362 10% | 315 -4% |
| Brightness Distribution (%) | 89 | 91 2% | 90 1% | 90 1% |
| Black Level * (cd/m²) | 0.21 | 0.4 -90% | 0.31 -48% | 0.21 -0% |
| Contrast (:1) | 1562 | 1205 -23% | 1239 -21% | 1576 1% |
| Colorchecker dE 2000 * | 6.4 | 1.85 71% | 4.8 25% | 6.1 5% |
| Colorchecker dE 2000 max. * | 11.2 | 3.08 72% | 9.4 16% | 10 11% |
| Colorchecker dE 2000 calibrated * | 1.2 | 1.2 -0% | 1.4 -17% | 1.2 -0% |
| Greyscale dE 2000 * | 6.5 | 2 69% | 6.6 -2% | 6.3 3% |
| Gamma | 2.87 77% | 2.1 105% | 2.2 100% | 2.77 79% |
| CCT | 6428 101% | 6822 95% | 7999 81% | 6938 94% |
| Color Space (Percent of AdobeRGB 1998) (%) | 61.6 | 62.5 1% | 61.2 -1% | 60.7 -1% |
| Color Space (Percent of sRGB) (%) | 95.9 | 97.7 2% | 95 -1% | 95.4 -1% |
| Moyenne finale (programmes/paramètres) | 4% /
11% | -0% /
-1% | -0% /
1% |
* ... Moindre est la valeur, meilleures sont les performances
Temps de réponse de l'écran
| ↔ Temps de réponse noir à blanc | ||
|---|---|---|
| 32 ms ... hausse ↗ et chute ↘ combinées | ↗ 18 ms hausse | 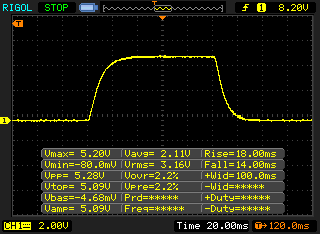 |
| ↘ 14 ms chute | ||
| L'écran souffre de latences très élevées, à éviter pour le jeu. En comparaison, tous les appareils testés affichent entre 0.1 (minimum) et 240 (maximum) ms. » 86 % des appareils testés affichent de meilleures performances. Cela signifie que les latences relevées sont moins bonnes que la moyenne (19.8 ms) de tous les appareils testés. | ||
| ↔ Temps de réponse gris 50% à gris 80% | ||
| 53.6 ms ... hausse ↗ et chute ↘ combinées | ↗ 26 ms hausse | 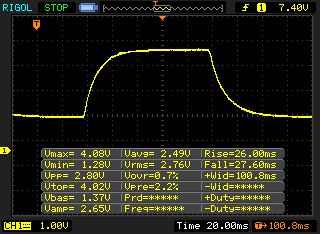 |
| ↘ 27.6 ms chute | ||
| L'écran souffre de latences très élevées, à éviter pour le jeu. En comparaison, tous les appareils testés affichent entre 0.165 (minimum) et 636 (maximum) ms. » 90 % des appareils testés affichent de meilleures performances. Cela signifie que les latences relevées sont moins bonnes que la moyenne (30.9 ms) de tous les appareils testés. | ||
Scintillement / MLI (Modulation de largeur d'impulsion)
| Scintillement / MLI (Modulation de largeur d'impulsion) non décelé | 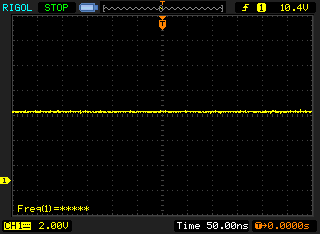 | ||
En comparaison, 52 % des appareils testés n'emploient pas MDI pour assombrir leur écran. Nous avons relevé une moyenne à 7748 (minimum : 5 - maximum : 343500) Hz dans le cas où une MDI était active. | |||
Cinebench R15: CPU Multi 64Bit | CPU Single 64Bit
Blender: v2.79 BMW27 CPU
7-Zip 18.03: 7z b 4 -mmt1 | 7z b 4
Geekbench 5.5: Single-Core | Multi-Core
HWBOT x265 Benchmark v2.2: 4k Preset
LibreOffice : 20 Documents To PDF
R Benchmark 2.5: Overall mean
| Cinebench R20 / CPU (Multi Core) | |
| Moyenne de la classe Subnotebook (579 - 8541, n=57, 2 dernières années) | |
| Lenovo ThinkPad X13-20UGS00800 | |
| Acer SF514-55T | |
| Lenovo ThinkBook Plus 13 i7 | |
| Lenovo ThinkBook Plus 13 i7 | |
| Moyenne Intel Core i7-10510U (1015 - 1897, n=38) | |
| Asus ZenBook 13 UX325JA | |
| Fujitsu Lifebook U939 i5 | |
| Dynabook Portege X30L-G1331 | |
| Cinebench R20 / CPU (Single Core) | |
| Moyenne de la classe Subnotebook (128 - 832, n=57, 2 dernières années) | |
| Acer SF514-55T | |
| Lenovo ThinkPad X13-20UGS00800 | |
| Asus ZenBook 13 UX325JA | |
| Moyenne Intel Core i7-10510U (362 - 497, n=37) | |
| Dynabook Portege X30L-G1331 | |
| Lenovo ThinkBook Plus 13 i7 | |
| Fujitsu Lifebook U939 i5 | |
| Cinebench R15 / CPU Multi 64Bit | |
| Moyenne de la classe Subnotebook (327 - 3345, n=57, 2 dernières années) | |
| Lenovo ThinkPad X13-20UGS00800 | |
| Acer SF514-55T | |
| Asus ZenBook 13 UX325JA | |
| Lenovo ThinkBook Plus 13 i7 | |
| Lenovo ThinkBook Plus 13 i7 | |
| Moyenne Intel Core i7-10510U (482 - 856, n=45) | |
| Fujitsu Lifebook U939 i5 | |
| Dynabook Portege X30L-G1331 | |
| Cinebench R15 / CPU Single 64Bit | |
| Moyenne de la classe Subnotebook (72.4 - 322, n=57, 2 dernières années) | |
| Acer SF514-55T | |
| Lenovo ThinkPad X13-20UGS00800 | |
| Asus ZenBook 13 UX325JA | |
| Moyenne Intel Core i7-10510U (113 - 202, n=42) | |
| Dynabook Portege X30L-G1331 | |
| Fujitsu Lifebook U939 i5 | |
| Lenovo ThinkBook Plus 13 i7 | |
| Blender / v2.79 BMW27 CPU | |
| Fujitsu Lifebook U939 i5 | |
| Asus ZenBook 13 UX325JA | |
| Lenovo ThinkBook Plus 13 i7 | |
| Dynabook Portege X30L-G1331 | |
| Moyenne Intel Core i7-10510U (628 - 1051, n=31) | |
| Acer SF514-55T | |
| Lenovo ThinkPad X13-20UGS00800 | |
| Moyenne de la classe Subnotebook (159 - 2271, n=58, 2 dernières années) | |
| 7-Zip 18.03 / 7z b 4 -mmt1 | |
| Moyenne de la classe Subnotebook (2643 - 6699, n=59, 2 dernières années) | |
| Acer SF514-55T | |
| Moyenne Intel Core i7-10510U (3747 - 4981, n=31) | |
| Lenovo ThinkPad X13-20UGS00800 | |
| Dynabook Portege X30L-G1331 | |
| Lenovo ThinkBook Plus 13 i7 | |
| Asus ZenBook 13 UX325JA | |
| Fujitsu Lifebook U939 i5 | |
| 7-Zip 18.03 / 7z b 4 | |
| Moyenne de la classe Subnotebook (11668 - 77867, n=57, 2 dernières années) | |
| Lenovo ThinkPad X13-20UGS00800 | |
| Acer SF514-55T | |
| Moyenne Intel Core i7-10510U (12196 - 21298, n=31) | |
| Dynabook Portege X30L-G1331 | |
| Lenovo ThinkBook Plus 13 i7 | |
| Fujitsu Lifebook U939 i5 | |
| Asus ZenBook 13 UX325JA | |
| Geekbench 5.5 / Single-Core | |
| Moyenne de la classe Subnotebook (726 - 2224, n=49, 2 dernières années) | |
| Acer SF514-55T | |
| Asus ZenBook 13 UX325JA | |
| Moyenne Intel Core i7-10510U (977 - 1287, n=31) | |
| Lenovo ThinkPad X13-20UGS00800 | |
| Lenovo ThinkBook Plus 13 i7 | |
| Dynabook Portege X30L-G1331 | |
| Fujitsu Lifebook U939 i5 | |
| Geekbench 5.5 / Multi-Core | |
| Moyenne de la classe Subnotebook (2557 - 17218, n=49, 2 dernières années) | |
| Acer SF514-55T | |
| Lenovo ThinkPad X13-20UGS00800 | |
| Asus ZenBook 13 UX325JA | |
| Moyenne Intel Core i7-10510U (2474 - 4484, n=31) | |
| Dynabook Portege X30L-G1331 | |
| Fujitsu Lifebook U939 i5 | |
| Lenovo ThinkBook Plus 13 i7 | |
| HWBOT x265 Benchmark v2.2 / 4k Preset | |
| Moyenne de la classe Subnotebook (0.97 - 25.1, n=57, 2 dernières années) | |
| Lenovo ThinkPad X13-20UGS00800 | |
| Acer SF514-55T | |
| Moyenne Intel Core i7-10510U (3.41 - 6.04, n=31) | |
| Asus ZenBook 13 UX325JA | |
| Dynabook Portege X30L-G1331 | |
| Fujitsu Lifebook U939 i5 | |
| Lenovo ThinkBook Plus 13 i7 | |
| LibreOffice / 20 Documents To PDF | |
| Lenovo ThinkBook Plus 13 i7 | |
| Fujitsu Lifebook U939 i5 | |
| Dynabook Portege X30L-G1331 | |
| Moyenne Intel Core i7-10510U (50.7 - 77.8, n=27) | |
| Lenovo ThinkPad X13-20UGS00800 | |
| Moyenne de la classe Subnotebook (39.9 - 220, n=56, 2 dernières années) | |
| Asus ZenBook 13 UX325JA | |
| Acer SF514-55T | |
| R Benchmark 2.5 / Overall mean | |
| Fujitsu Lifebook U939 i5 | |
| Dynabook Portege X30L-G1331 | |
| Lenovo ThinkBook Plus 13 i7 | |
| Asus ZenBook 13 UX325JA | |
| Moyenne Intel Core i7-10510U (0.637 - 0.81, n=28) | |
| Lenovo ThinkPad X13-20UGS00800 | |
| Acer SF514-55T | |
| Moyenne de la classe Subnotebook (0.4024 - 1.456, n=58, 2 dernières années) | |
* ... Moindre est la valeur, meilleures sont les performances
| PCMark 8 Home Score Accelerated v2 | 3454 points | |
| PCMark 8 Work Score Accelerated v2 | 3734 points | |
| PCMark 10 Score | 4052 points | |
Aide | ||
| DPC Latencies / LatencyMon - interrupt to process latency (max), Web, Youtube, Prime95 | |
| Lenovo ThinkBook Plus 13 i7 | |
* ... Moindre est la valeur, meilleures sont les performances
| Lenovo ThinkBook Plus 13 i7 WDC PC SN730 SDBPNTY-512G | Dynabook Portege X30L-G1331 Samsung SSD PM981a MZVLB512HBJQ | Fujitsu Lifebook U939 i5 Samsung SSD PM981 MZVLB512HAJQ | Lenovo ThinkPad X13-20UGS00800 Samsung SSD PM981a MZVLB512HBJQ | Moyenne WDC PC SN730 SDBPNTY-512G | |
|---|---|---|---|---|---|
| CrystalDiskMark 5.2 / 6 | 7% | -4% | 2% | 10% | |
| Write 4K (MB/s) | 135.4 | 164.1 21% | 159 17% | 95.7 -29% | 164.3 ? 21% |
| Read 4K (MB/s) | 48.83 | 49.34 1% | 48.12 -1% | 37.47 -23% | 48.2 ? -1% |
| Write Seq (MB/s) | 2036 | 1777 -13% | 1657 -19% | 2032 0% | 2096 ? 3% |
| Read Seq (MB/s) | 2127 | 1752 -18% | 1522 -28% | 2207 4% | 2123 ? 0% |
| Write 4K Q32T1 (MB/s) | 394.1 | 401.1 2% | 349.2 -11% | 517 31% | 451 ? 14% |
| Read 4K Q32T1 (MB/s) | 345.2 | 498.7 44% | 452.2 31% | 387 12% | 509 ? 47% |
| Write Seq Q32T1 (MB/s) | 2700 | 2988 11% | 1941 -28% | 2977 10% | 2551 ? -6% |
| Read Seq Q32T1 (MB/s) | 3331 | 3544 6% | 3510 5% | 3556 7% | 3330 ? 0% |

Sustained Read Performance: DiskSpd Read Loop, Queue Depth 8
| 3DMark 11 - 1280x720 Performance GPU | |
| Moyenne de la classe Subnotebook (995 - 18489, n=55, 2 dernières années) | |
| Lenovo ThinkPad X13-20UGS00800 | |
| Dynabook Portege X30L-G1331 | |
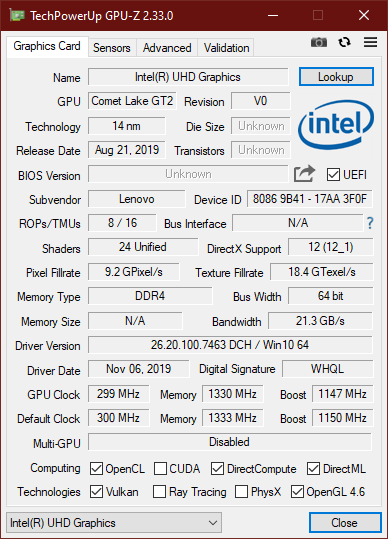
| Moyenne Intel UHD Graphics 620 (1144 - 3432, n=244) | |
| Fujitsu Lifebook U939 i5 | |
| Lenovo ThinkBook Plus 13 i7 | |
| 3DMark 11 Performance | 1909 points | |
| 3DMark Cloud Gate Standard Score | 7366 points | |
| 3DMark Fire Strike Score | 988 points | |
| 3DMark Time Spy Score | 395 points | |
Aide | ||
| Bas | Moyen | Élevé | Ultra | |
|---|---|---|---|---|
| The Witcher 3 (2015) | 15.9 | |||
| Dota 2 Reborn (2015) | 65.6 | 39.4 | 18.5 | 16.5 |
| X-Plane 11.11 (2018) | 11.5 | 10.3 | 9.58 | |
| Shadow of the Tomb Raider (2018) | 16.3 | |||
| Total War: Three Kingdoms (2019) | 18.2 |
Degré de la nuisance sonore
| Au repos |
| 29.3 / 29.3 / 30.1 dB(A) |
| Fortement sollicité |
| 30.9 / 32.5 dB(A) |
 | ||
30 dB silencieux 40 dB(A) audible 50 dB(A) bruyant |
||
min: | ||
(+) La température maximale du côté supérieur est de 33 °C / 91 F, par rapport à la moyenne de 35.9 °C / 97 F, allant de 21.4 à 59 °C pour la classe Subnotebook.
(+) Le fond chauffe jusqu'à un maximum de 38.8 °C / 102 F, contre une moyenne de 39.2 °C / 103 F
(+) En utilisation inactive, la température moyenne du côté supérieur est de 25.1 °C / 77 F, par rapport à la moyenne du dispositif de 30.8 °C / 87 F.
(+) Les repose-poignets et le pavé tactile sont plus froids que la température de la peau avec un maximum de 24.6 °C / 76.3 F et sont donc froids au toucher.
(+) La température moyenne de la zone de l'appui-paume de dispositifs similaires était de 28.2 °C / 82.8 F (+3.6 °C / #6.5 F).
Lenovo ThinkBook Plus 13 i7 analyse audio
(-) | haut-parleurs pas très forts (71.7 dB)
Basses 100 - 315 Hz
(-) | presque aucune basse - en moyenne 15% plus bas que la médiane
(-) | les basses ne sont pas linéaires (16.1% delta à la fréquence précédente)
Médiums 400 - 2000 Hz
(±) | médiane supérieure - en moyenne 5.9% supérieure à la médiane
(+) | les médiums sont linéaires (5.6% delta à la fréquence précédente)
Aiguës 2 - 16 kHz
(+) | des sommets équilibrés - à seulement 3.6% de la médiane
(±) | la linéarité des aigus est moyenne (9% delta à la fréquence précédente)
Globalement 100 - 16 000 Hz
(±) | la linéarité du son global est moyenne (23.9% de différence avec la médiane)
Par rapport à la même classe
» 81% de tous les appareils testés de cette catégorie étaient meilleurs, 4% similaires, 15% pires
» Le meilleur avait un delta de 5%, la moyenne était de 18%, le pire était de 53%.
Par rapport à tous les appareils testés
» 72% de tous les appareils testés étaient meilleurs, 6% similaires, 22% pires
» Le meilleur avait un delta de 4%, la moyenne était de 23%, le pire était de 134%.
Apple MacBook 12 (Early 2016) 1.1 GHz analyse audio
(+) | les haut-parleurs peuvent jouer relativement fort (83.6# dB)
Basses 100 - 315 Hz
(±) | basse réduite - en moyenne 11.3% inférieure à la médiane
(±) | la linéarité des basses est moyenne (14.2% delta à la fréquence précédente)
Médiums 400 - 2000 Hz
(+) | médiane équilibrée - seulement 2.4% de la médiane
(+) | les médiums sont linéaires (5.5% delta à la fréquence précédente)
Aiguës 2 - 16 kHz
(+) | des sommets équilibrés - à seulement 2% de la médiane
(+) | les aigus sont linéaires (4.5% delta à la fréquence précédente)
Globalement 100 - 16 000 Hz
(+) | le son global est linéaire (10.2% différence à la médiane)
Par rapport à la même classe
» 7% de tous les appareils testés de cette catégorie étaient meilleurs, 2% similaires, 90% pires
» Le meilleur avait un delta de 5%, la moyenne était de 18%, le pire était de 53%.
Par rapport à tous les appareils testés
» 5% de tous les appareils testés étaient meilleurs, 1% similaires, 94% pires
» Le meilleur avait un delta de 4%, la moyenne était de 23%, le pire était de 134%.
| Éteint/en veille | |
| Au repos | |
| Fortement sollicité |
|
Légende:
min: | |
| Lenovo ThinkBook Plus 13 i7 i7-10510U, UHD Graphics 620, WDC PC SN730 SDBPNTY-512G, IPS LED, 1920x1080, 13.3" | Dynabook Portege X30L-G1331 i5-10210U, UHD Graphics 620, Samsung SSD PM981a MZVLB512HBJQ, IPS, 1920x1080, 13.3" | Fujitsu Lifebook U939 i5 i5-8265U, UHD Graphics 620, Samsung SSD PM981 MZVLB512HAJQ, IPS, 1920x1080, 13.3" | Lenovo ThinkPad X13-20UGS00800 R7 PRO 4750U, Vega 7, Samsung SSD PM981a MZVLB512HBJQ, IPS LED, 1920x1080, 13.3" | Moyenne Intel UHD Graphics 620 | Moyenne de la classe Subnotebook | |
|---|---|---|---|---|---|---|
| Power Consumption | -1% | -10% | -27% | -12% | -23% | |
| Idle Minimum * (Watt) | 4.5 | 2.8 38% | 3.1 31% | 6 -33% | 3.81 ? 15% | 3.71 ? 18% |
| Idle Average * (Watt) | 6.9 | 4.9 29% | 5.9 14% | 8.9 -29% | 6.94 ? -1% | 6.54 ? 5% |
| Idle Maximum * (Watt) | 7.92 | 9 -14% | 9.2 -16% | 11.3 -43% | 8.75 ? -10% | 7.89 ? -0% |
| Load Average * (Watt) | 30 | 31.2 -4% | 35.8 -19% | 34.2 -14% | 35 ? -17% | 42.1 ? -40% |
| Load Maximum * (Watt) | 32.6 | 49.4 -52% | 51.9 -59% | 37.2 -14% | 47.5 ? -46% | 65.1 ? -100% |
* ... Moindre est la valeur, meilleures sont les performances
| Lenovo ThinkBook Plus 13 i7 i7-10510U, UHD Graphics 620, 45 Wh | Dynabook Portege X30L-G1331 i5-10210U, UHD Graphics 620, 42 Wh | Fujitsu Lifebook U939 i5 i5-8265U, UHD Graphics 620, 50 Wh | Lenovo ThinkPad X13-20UGS00800 R7 PRO 4750U, Vega 7, 48 Wh | Moyenne de la classe Subnotebook | |
|---|---|---|---|---|---|
| Autonomie de la batterie | 0% | -1% | -7% | 50% | |
| H.264 (h) | 9.1 | 8.3 -9% | 15.3 ? 68% | ||
| WiFi v1.3 (h) | 8.3 | 8.3 0% | 8.2 -1% | 8.7 5% | 14.1 ? 70% |
| Load (h) | 1.8 | 1.5 -17% | 1.998 ? 11% |
Points positifs
Points négatifs

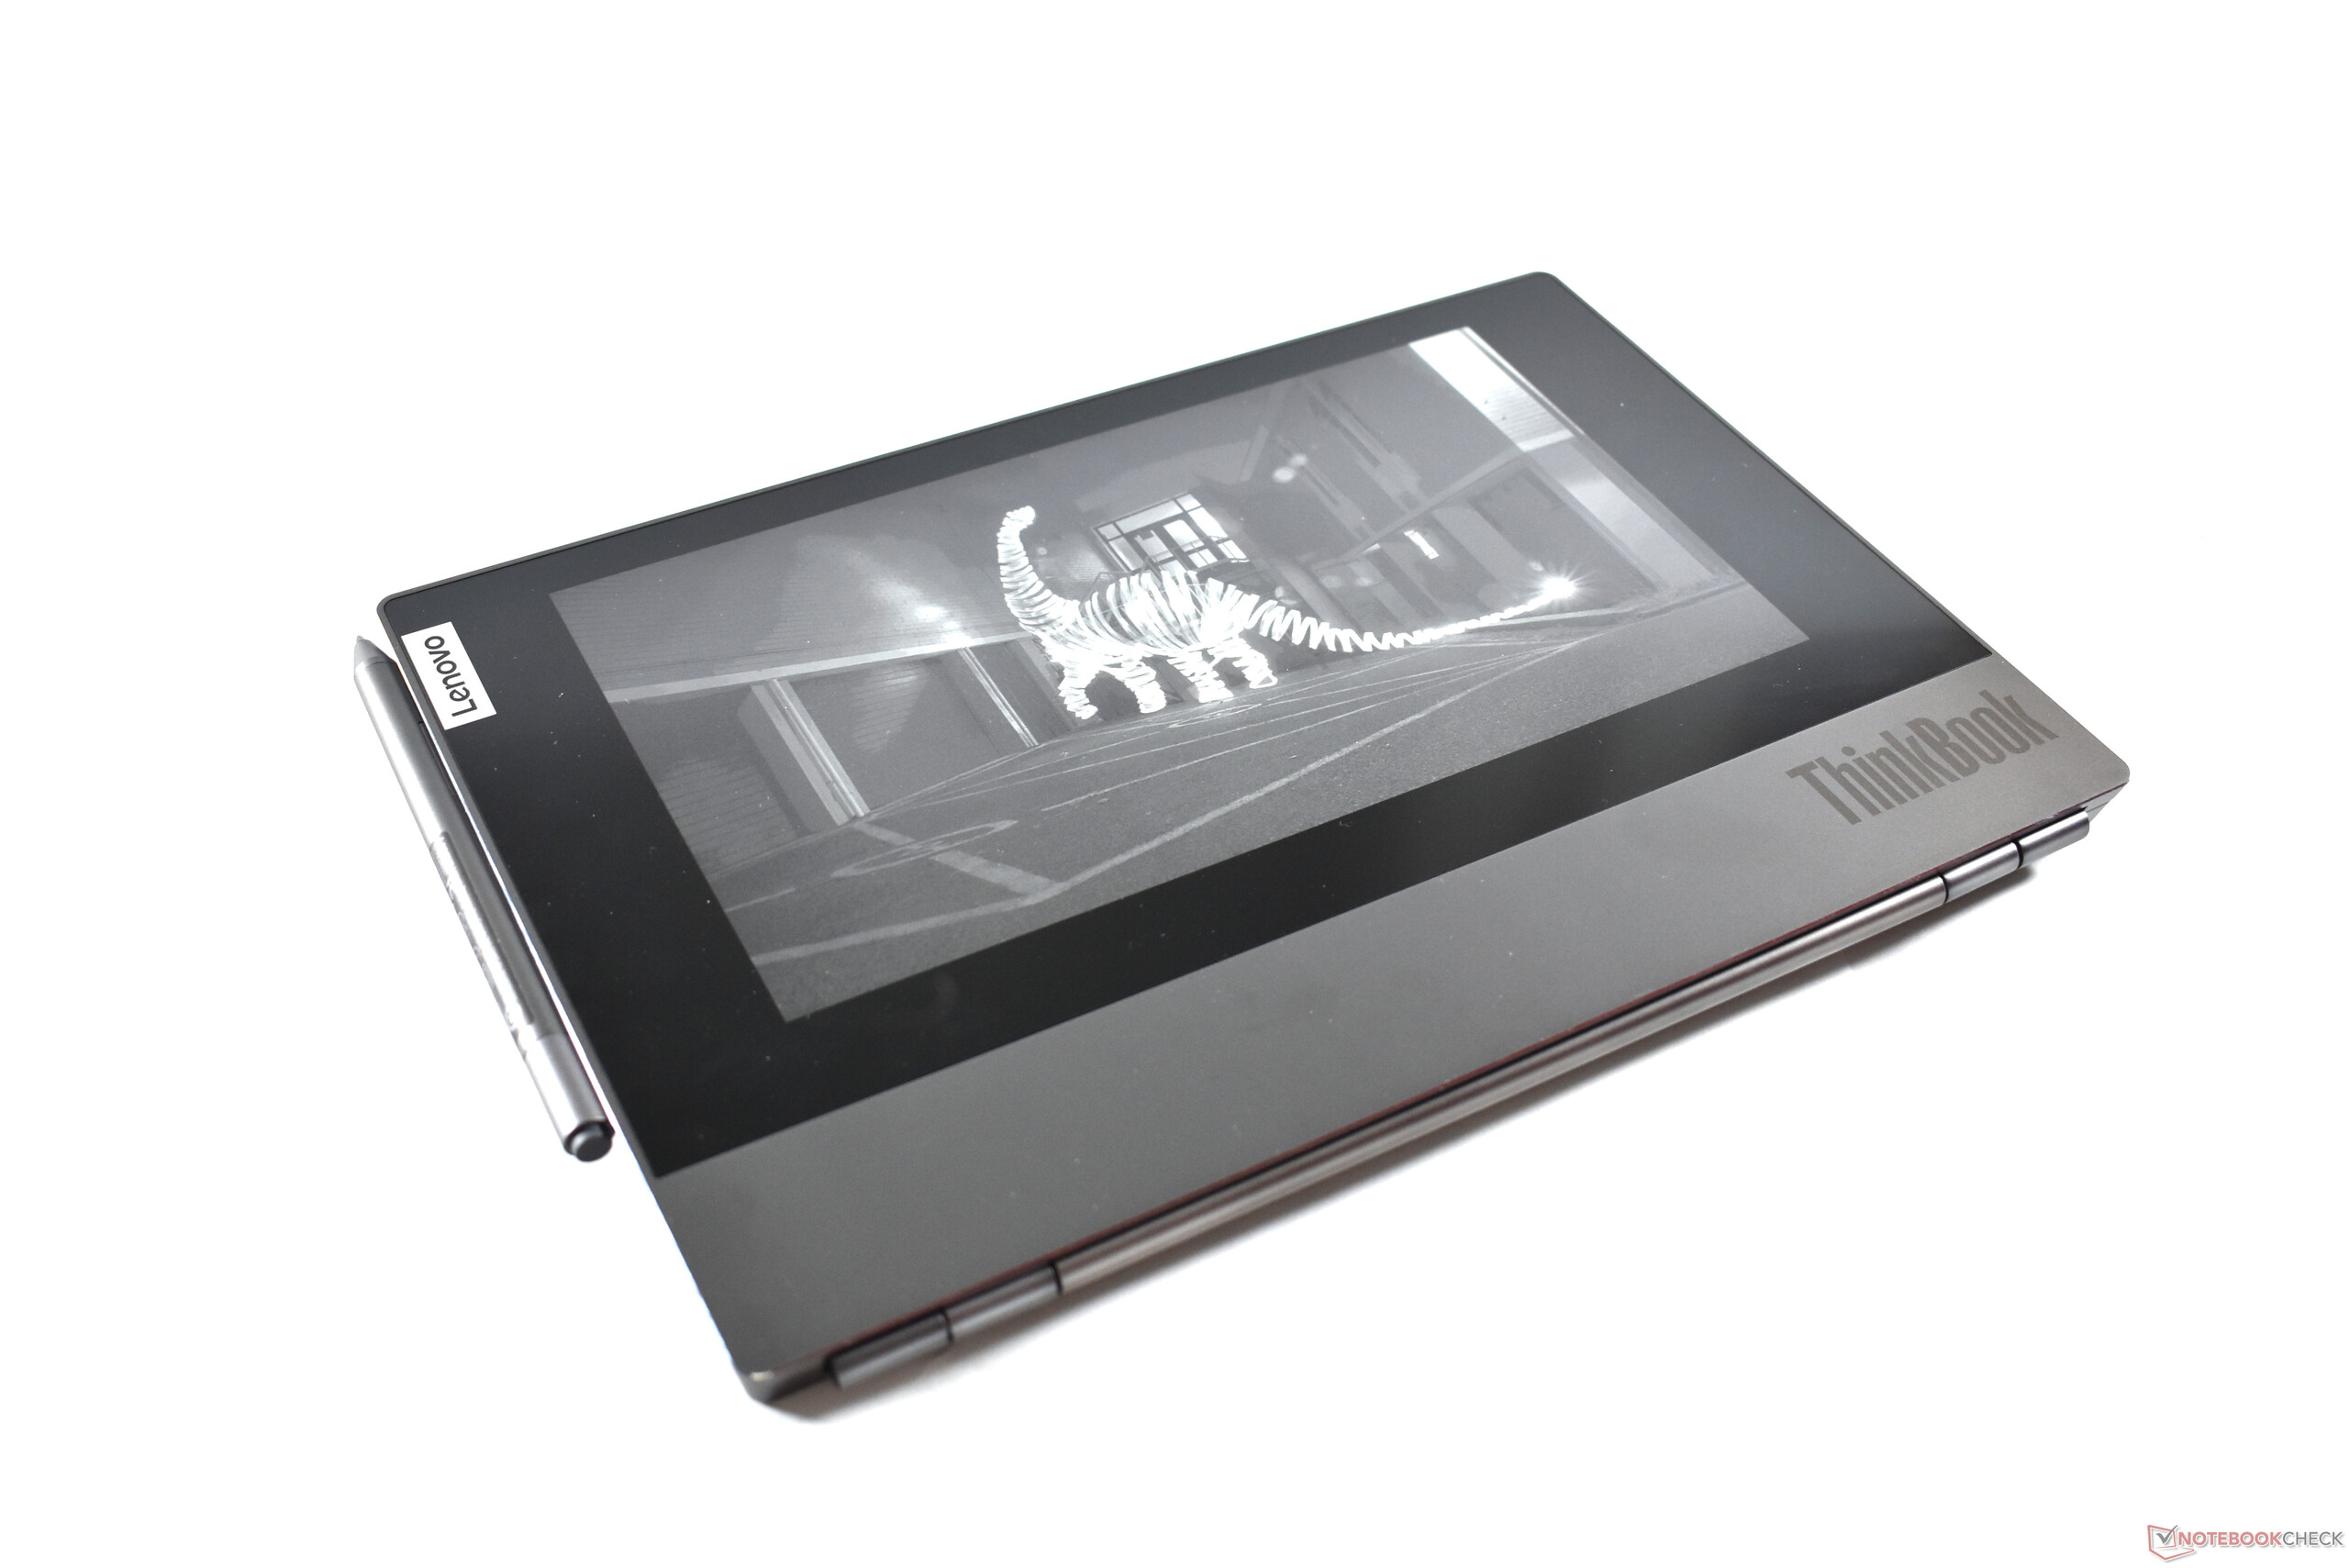
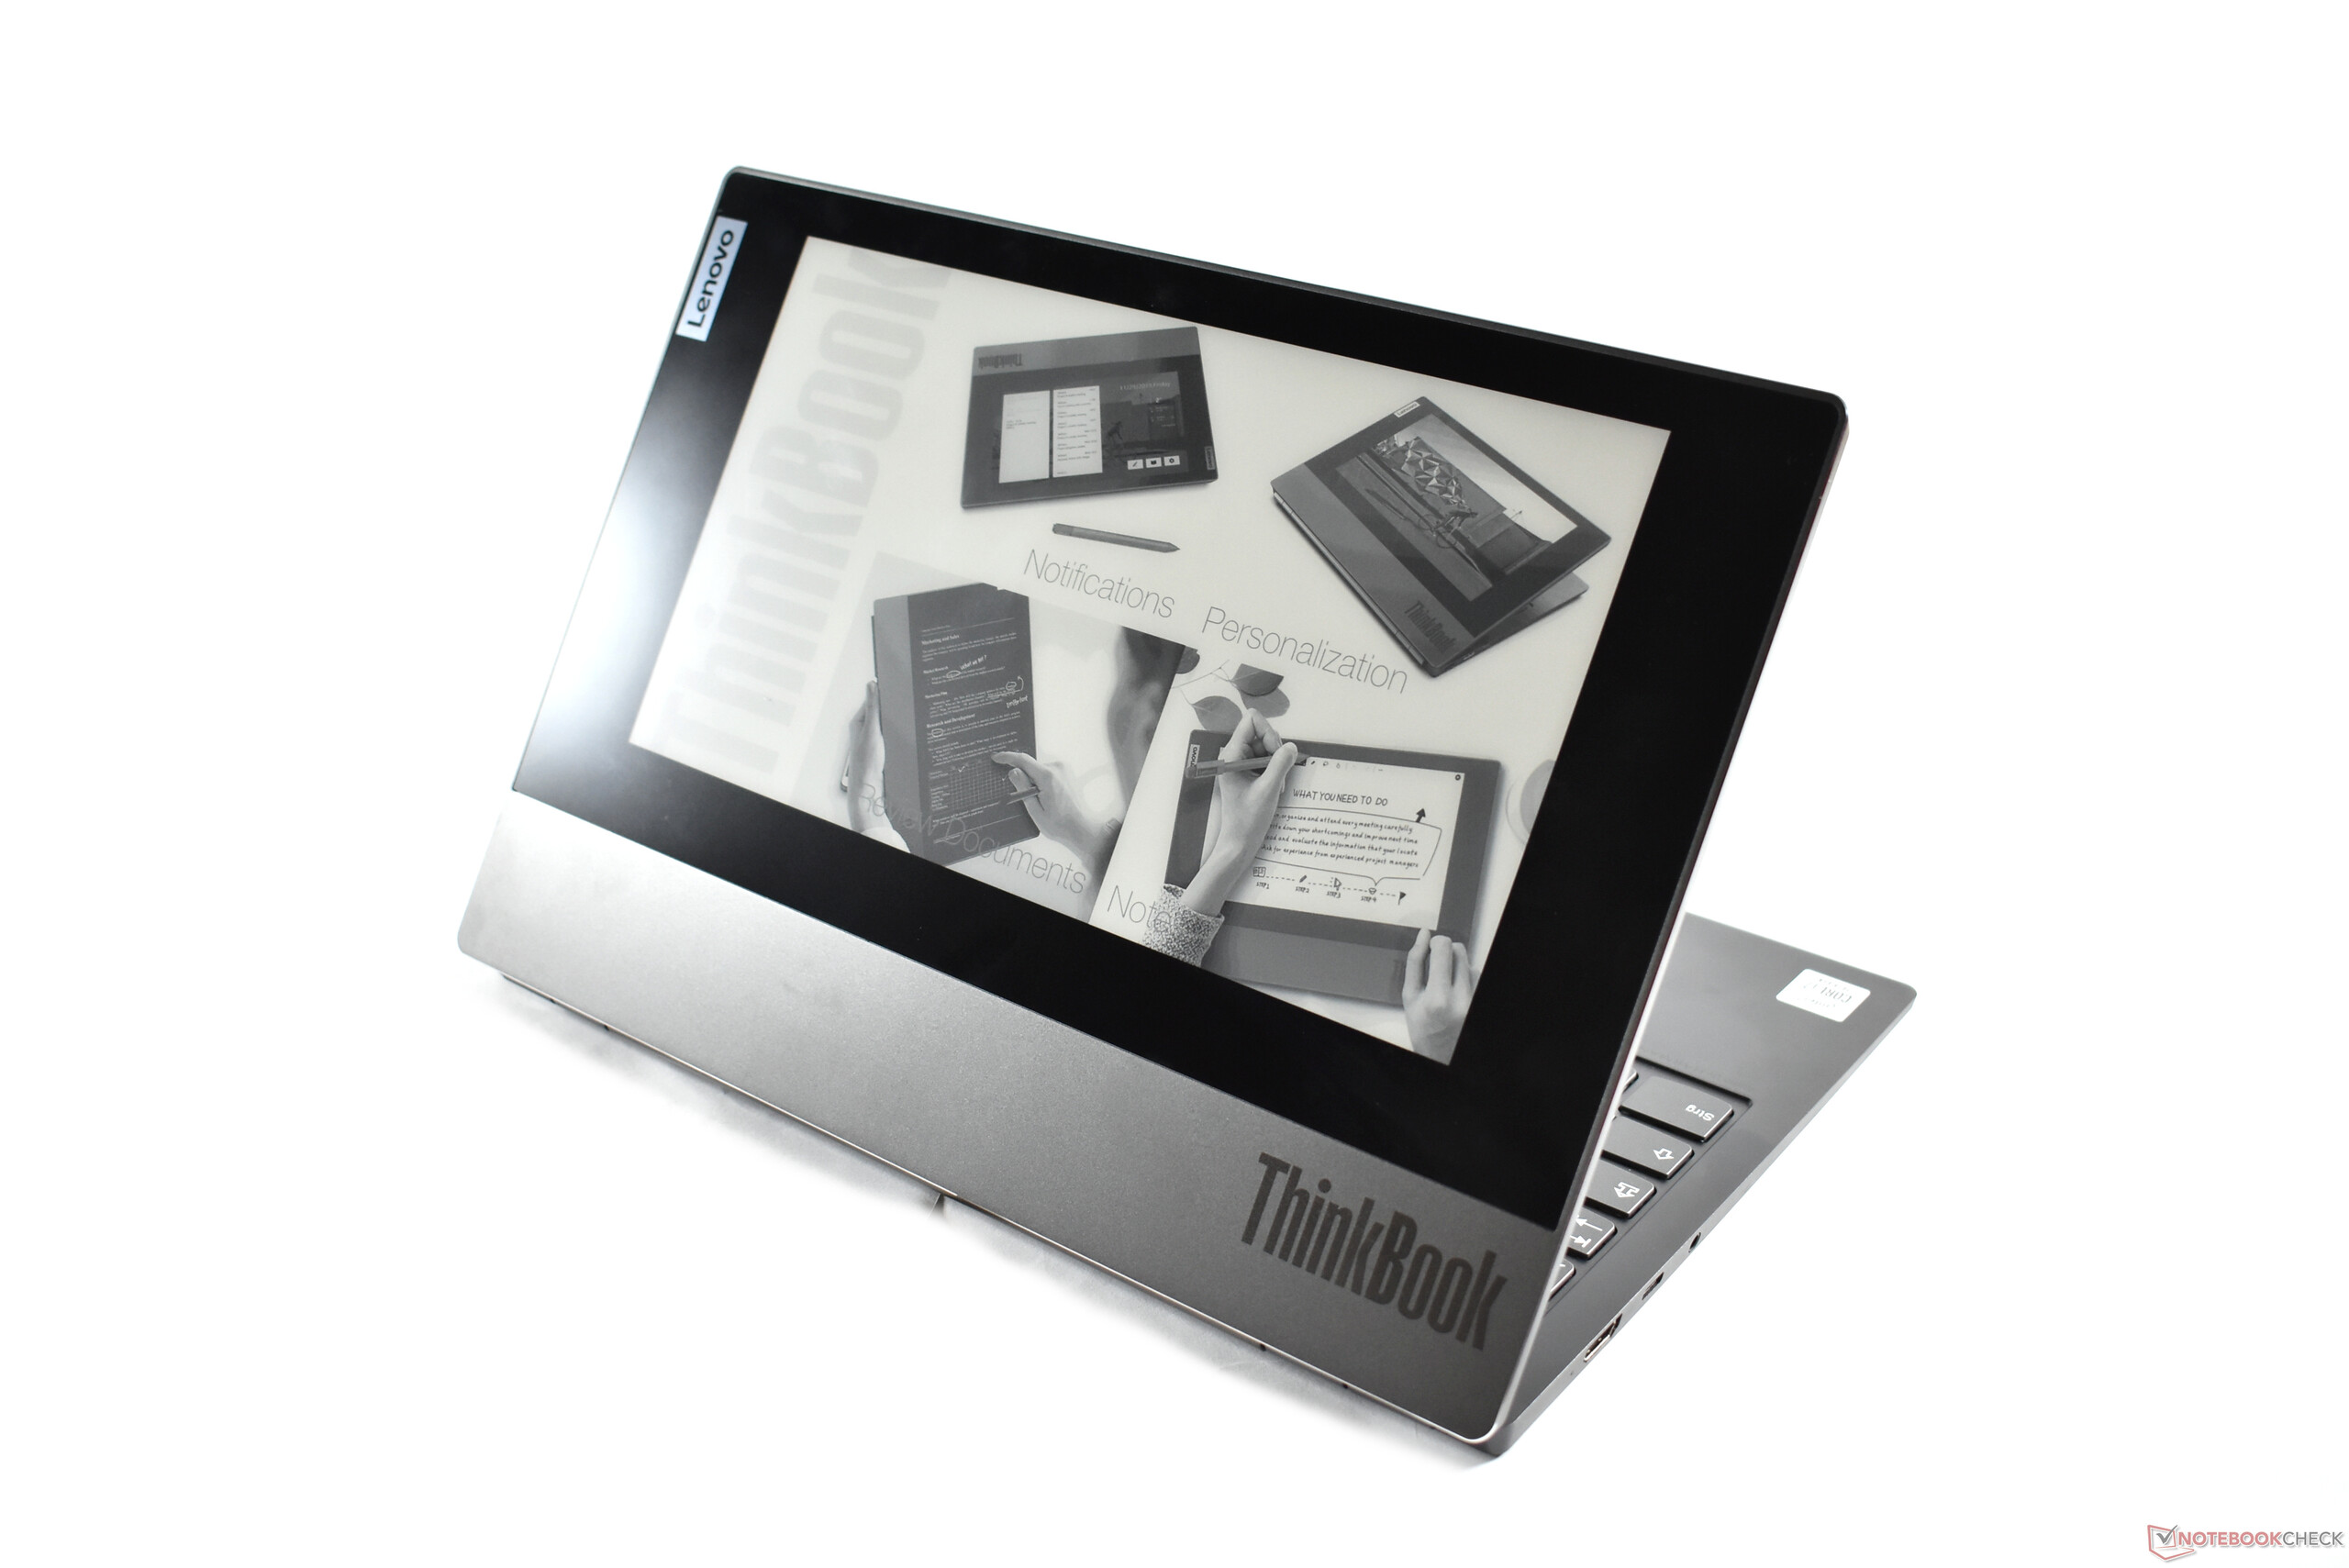
E-ink ou non ? C'est évidemment la première question à se poser si l'on est intéressé par le ThinkBook Plus. Ceux qui veulent vraiment utiliser l'écran e-ink au dos de l'écran principal ont déjà la réponse à leur question, et la décision d'achat est sans doute déjà prise...
Au-delà de cette fonctionnalité unique, on ne retrouve pas grand-chose d'intéressant. Le clavier, le châssis et l'écran LCD sont corrects, mais en rien meilleurs que la moyenne de ce type de gamme, tout comme la batterie. Le ThinkBook Plus a l'avantage d'avoir des températures maîtrisées et un stylet pour l'écran e-ink intégré. Qui est donc vraiment son seul avantage et argument de vente...
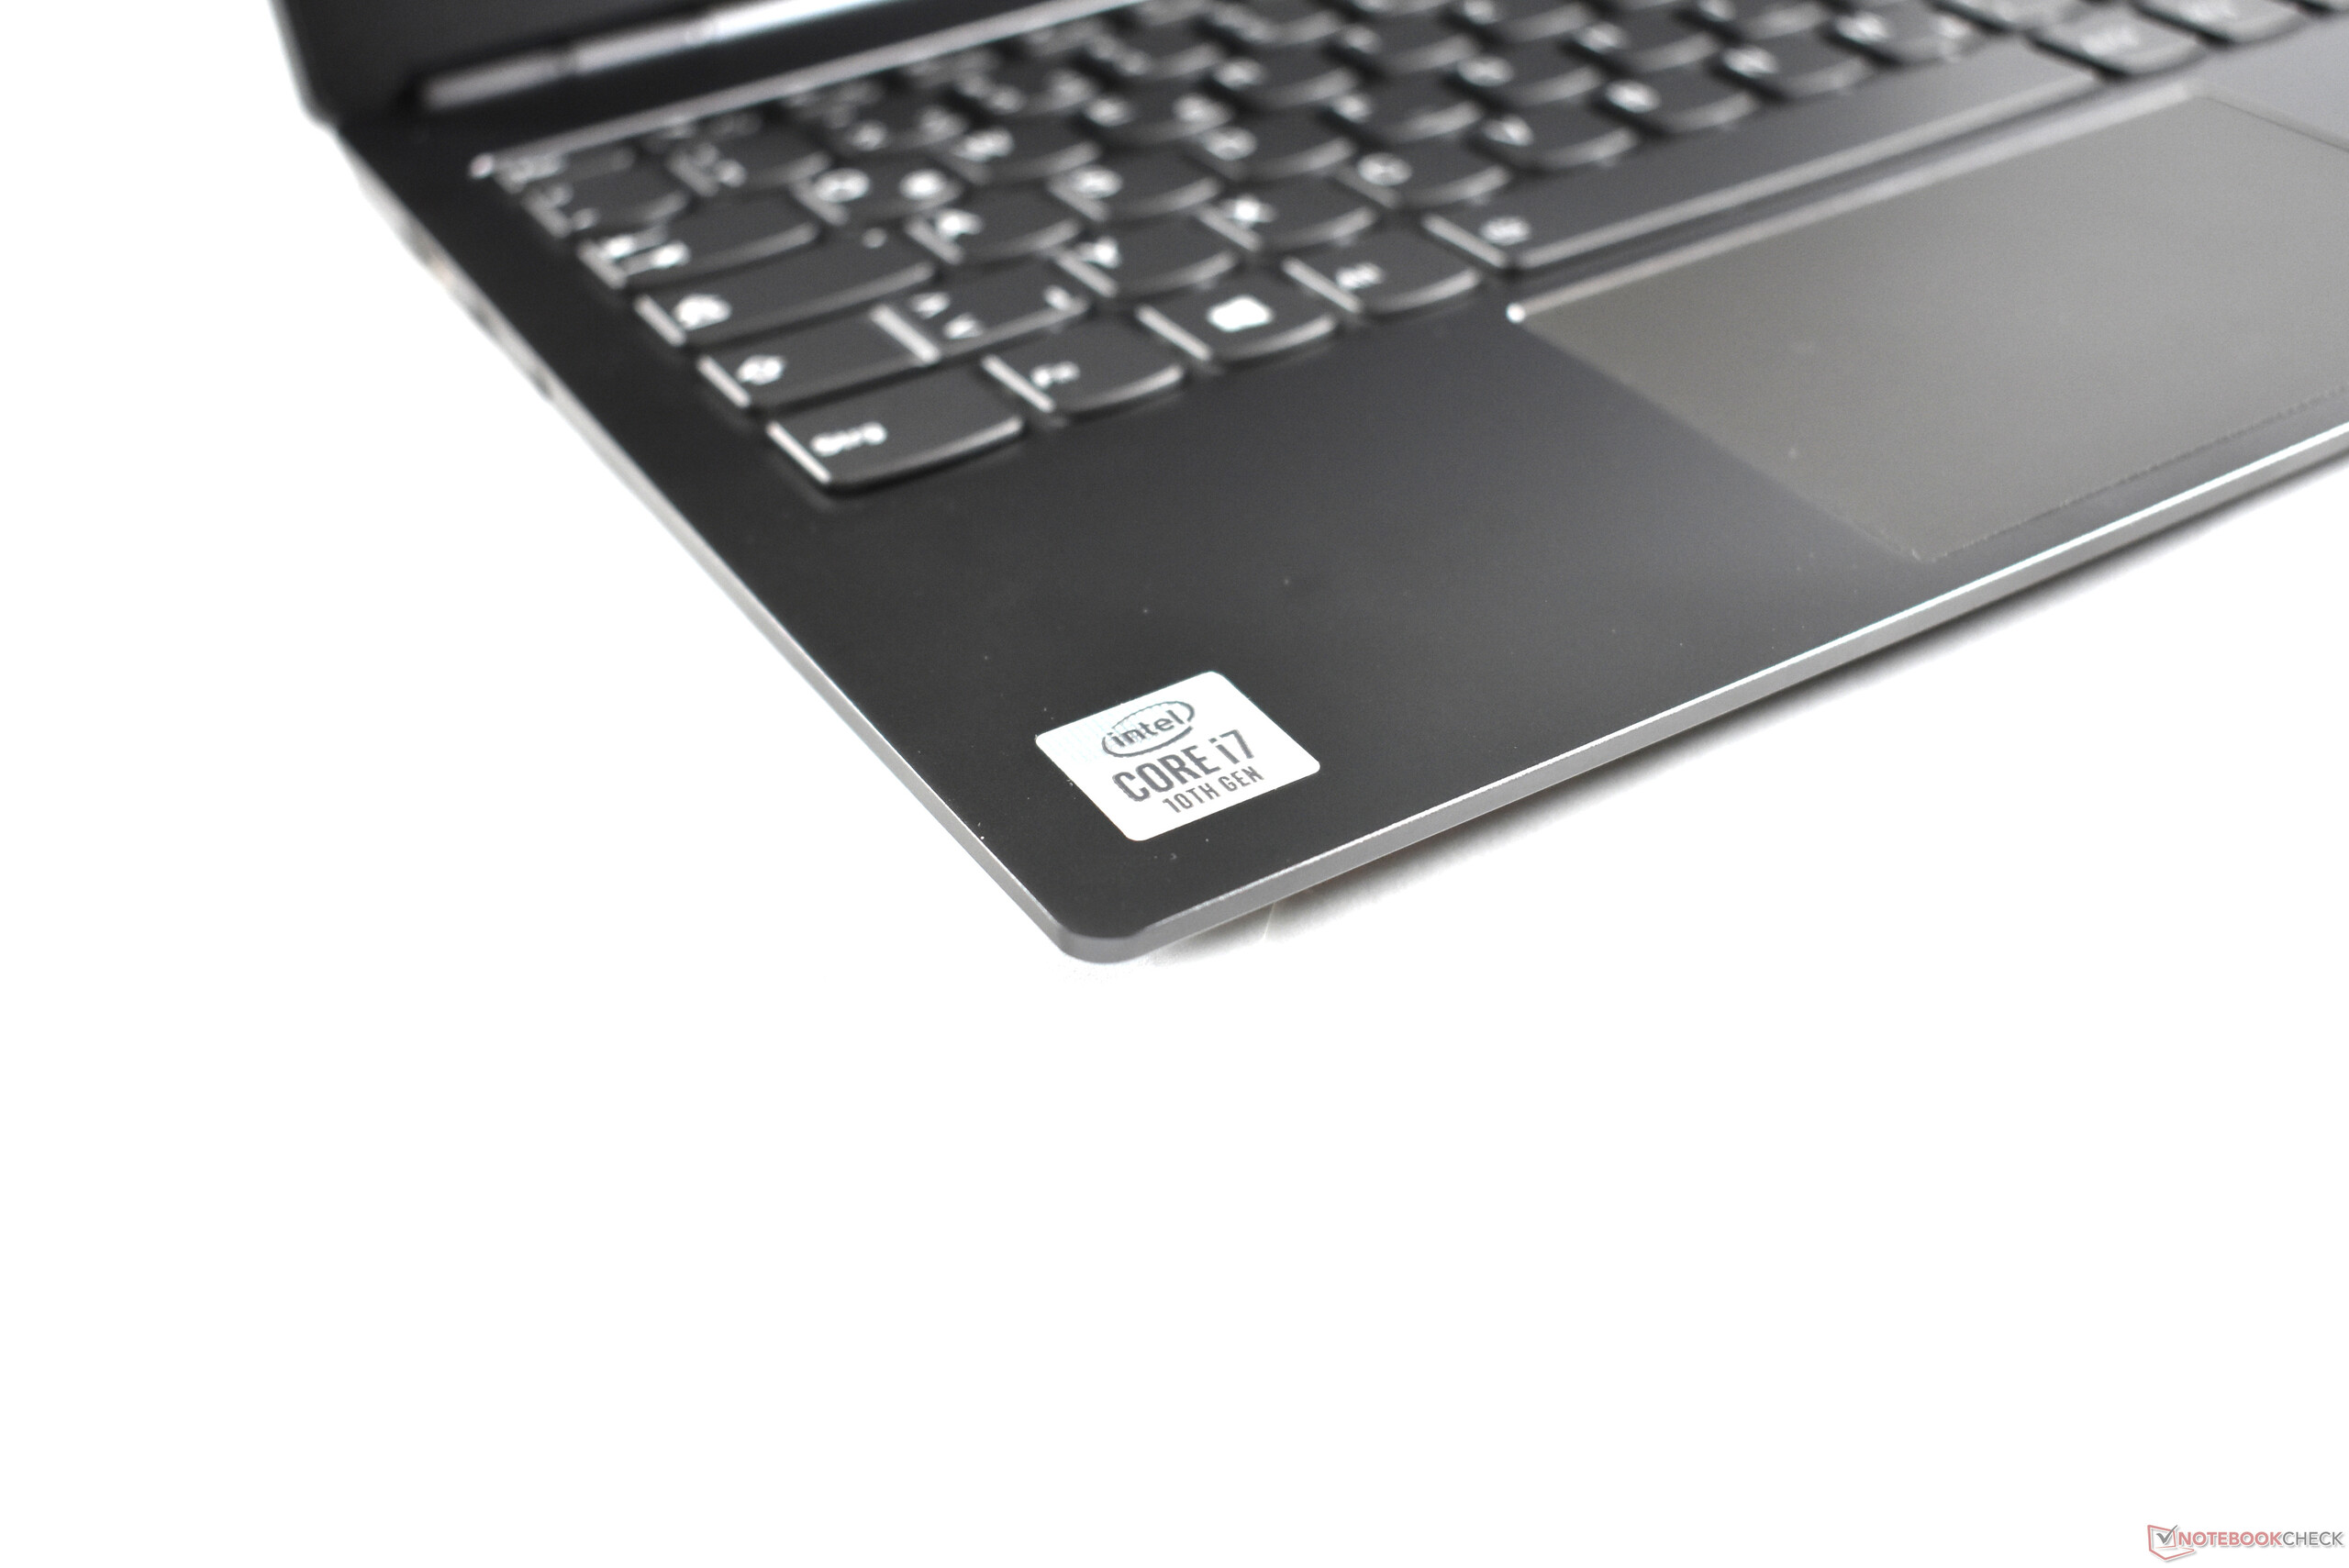
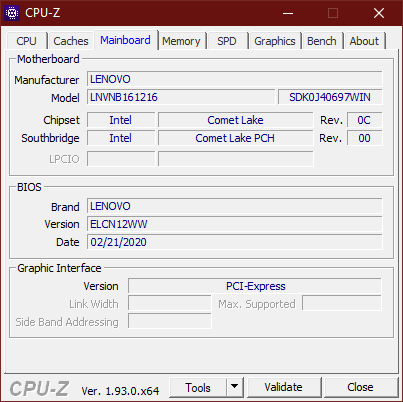
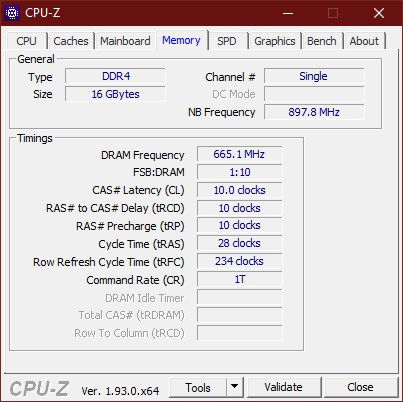
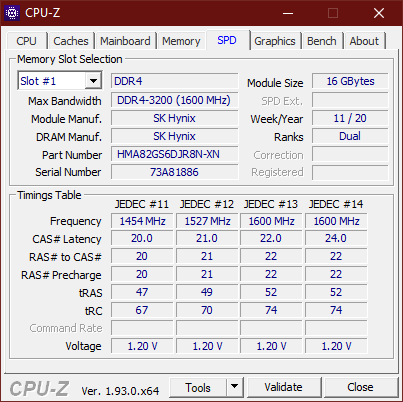
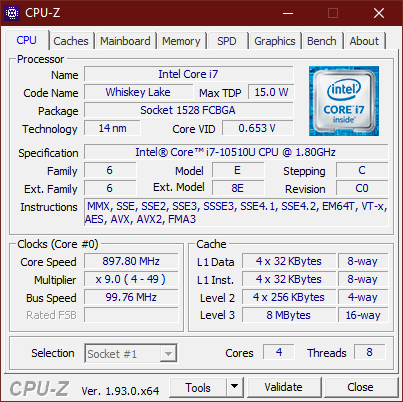
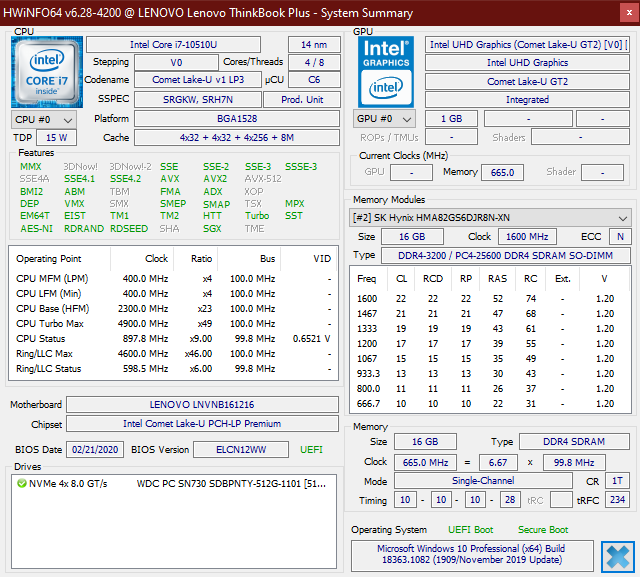
La machine est en effet équipée des processeurs Intel Comet Lake datés, ce qui est inexplicable vu qu'à la différence des vrais portables pros de Lenovo, le vPro n'est pas pris en charge. Ainsi, l'on manque de performances, ce qui est aggravé par le fait que la RAM du ThinkBook Plus est en mode mono-canal, à cause de l'unique emplacement de RAM mono-canal. La connectivité (absence de Thunderbolt et de carte micro SD) comme la sécurité sont comparativement pauvres, et la garantie par défaut de 12 mois est presque une injure pour un PC à ce niveau de prix.
L'écran e-ink est le seul et unique avantage du ThinkBook Plus. S'il ne vous intéresse pas, passez votre chemin.
Il y a beaucoup de PC portable de 13,3 pouces meilleurs que le Lenovo ThinkBook Plus. Il ne vaut le coup que si l'on veut absolument l'écran e-ink.
Note : comme nous n'avions pas de moyen d'intégrer l'écran e-ink dans notre notation, nous avons augmenté le score total du ThinkBook Plus d'un point.
L’intégralité de cette critique est disponible en anglais en suivant ce lien.
Lenovo ThinkBook Plus 13 i7
- 09/28/2020 v7 (old)
Benjamin Herzig
Price comparison
